Overview of the EU 2016 submissions under UNFCCC Giacomo Grassi, Raul Abad Vinas, Tibor Priwitzer, Simone Rossi Sandro Federici European Commission, Joint Research Centre, Institute for Environment and Sustainability, Forest resources and Climate Unit Ispra (Italy) JRC LULUCF workshop, Stresa 2‐3 May 2016

Welcome message from author
This document is posted to help you gain knowledge. Please leave a comment to let me know what you think about it! Share it to your friends and learn new things together.
Transcript
Overview of the EU 2016 submissions under UNFCCC
Giacomo Grassi, Raul Abad Vinas, Tibor Priwitzer, Simone RossiSandro Federici
European Commission, Joint Research Centre, Institute for Environment and Sustainability,
Forest resources and Climate UnitIspra (Italy)
JRC LULUCF workshop, Stresa 2‐3 May 2016
OUTLINE
Status of reporting
Overview of reporting under UNFCCC
Next steps
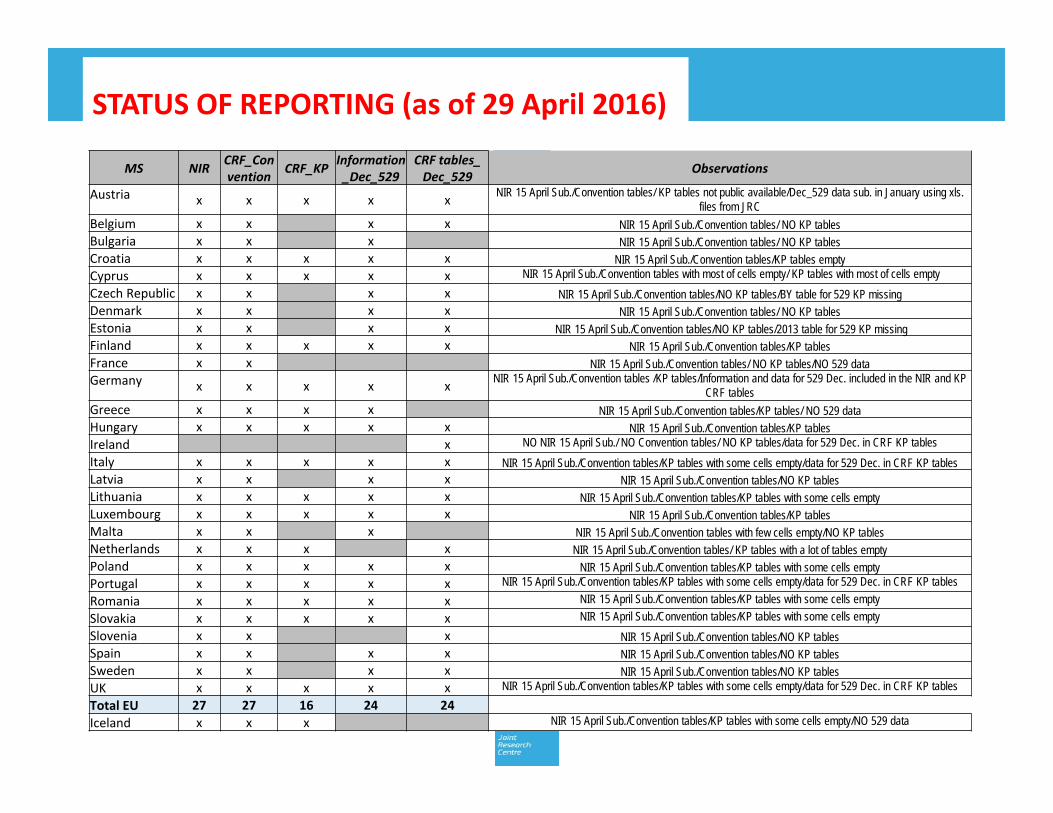
STATUS OF REPORTING (as of 29 April 2016)
MS NIR CRF_Convention CRF_KP Information
_Dec_529CRF tables_ Dec_529 Observations
Austria x x x x x NIR 15 April Sub./Convention tables/ KP tables not public available/Dec_529 data sub. in January using xls. files from JRC
Belgium x x x x NIR 15 April Sub./Convention tables/ NO KP tables Bulgaria x x x NIR 15 April Sub./Convention tables/ NO KP tablesCroatia x x x x x NIR 15 April Sub./Convention tables/KP tables emptyCyprus x x x x x NIR 15 April Sub./Convention tables with most of cells empty/ KP tables with most of cells emptyCzech Republic x x x x NIR 15 April Sub./Convention tables/NO KP tables/BY table for 529 KP missing Denmark x x x x NIR 15 April Sub./Convention tables/ NO KP tables Estonia x x x x NIR 15 April Sub./Convention tables/NO KP tables/2013 table for 529 KP missing Finland x x x x x NIR 15 April Sub./Convention tables/KP tablesFrance x x NIR 15 April Sub./Convention tables/ NO KP tables/NO 529 dataGermany x x x x x NIR 15 April Sub./Convention tables /KP tables/Information and data for 529 Dec. included in the NIR and KP
CRF tablesGreece x x x x NIR 15 April Sub./Convention tables/KP tables/ NO 529 data Hungary x x x x x NIR 15 April Sub./Convention tables/KP tablesIreland x NO NIR 15 April Sub./ NO Convention tables/ NO KP tables/data for 529 Dec. in CRF KP tablesItaly x x x x x NIR 15 April Sub./Convention tables/KP tables with some cells empty/data for 529 Dec. in CRF KP tablesLatvia x x x x NIR 15 April Sub./Convention tables/NO KP tablesLithuania x x x x x NIR 15 April Sub./Convention tables/KP tables with some cells emptyLuxembourg x x x x x NIR 15 April Sub./Convention tables/KP tables Malta x x x NIR 15 April Sub./Convention tables with few cells empty/NO KP tables Netherlands x x x x NIR 15 April Sub./Convention tables/ KP tables with a lot of tables empty Poland x x x x x NIR 15 April Sub./Convention tables/KP tables with some cells empty Portugal x x x x x NIR 15 April Sub./Convention tables/KP tables with some cells empty/data for 529 Dec. in CRF KP tablesRomania x x x x x NIR 15 April Sub./Convention tables/KP tables with some cells emptySlovakia x x x x x NIR 15 April Sub./Convention tables/KP tables with some cells emptySlovenia x x x NIR 15 April Sub./Convention tables/NO KP tablesSpain x x x x NIR 15 April Sub./Convention tables/NO KP tablesSweden x x x x NIR 15 April Sub./Convention tables/NO KP tablesUK x x x x x NIR 15 April Sub./Convention tables/KP tables with some cells empty/data for 529 Dec. in CRF KP tablesTotal EU 27 27 16 24 24Iceland x x x NIR 15 April Sub./Convention tables/KP tables with some cells empty/NO 529 data
4
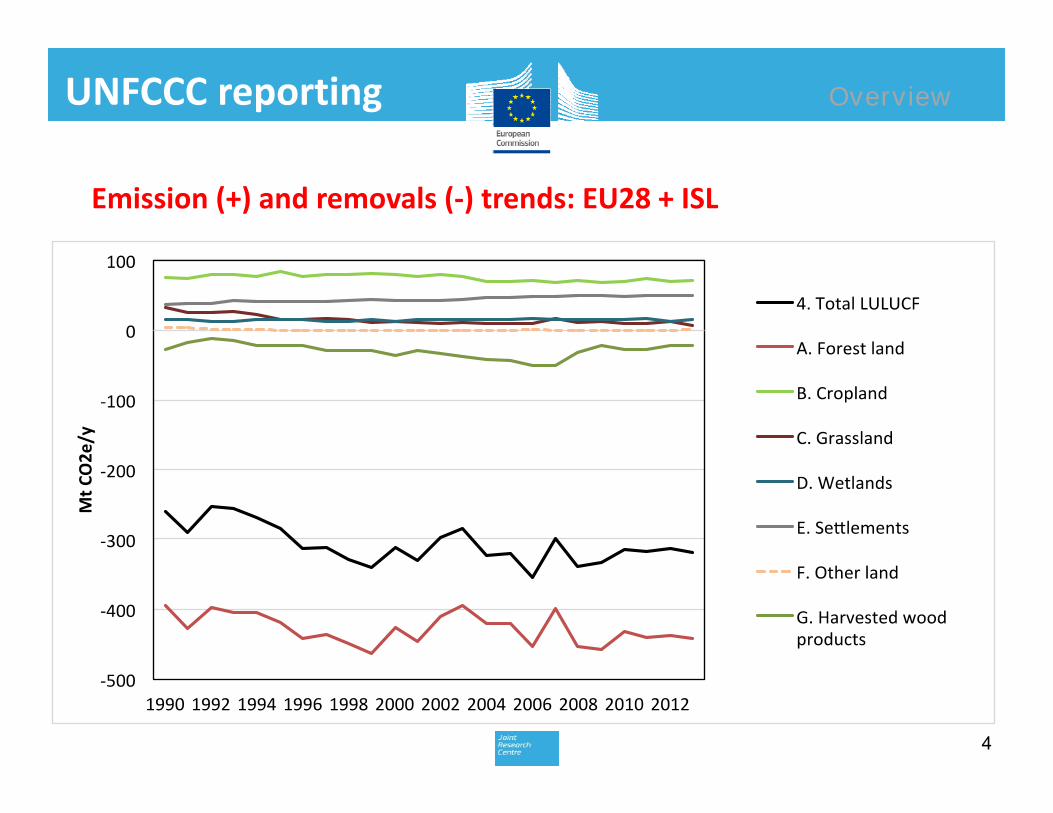
Emission (+) and removals (‐) trends: EU28 + ISL
OverviewUNFCCC reporting

Area trends: EU28 + ISL

‐60
‐50
‐40
‐30
‐20
‐10
0
10
20
Austria
Be
lgium
Bu
lgaria
Croa
a Cy
prus
Cz
ech Re
public
De
nmark
Estonia
Finlan
d Fran
ce
German
y Greec
e Hu
ngary
Ireland
Ita
ly
Latvia
Lithua
nia
Luxe
mbo
urg
Malta
Nethe
rland
s Po
land
Po
rtug
al
Roman
ia
Slov
akia
Slov
enia
Sp
ain
Swed
en
United King
dom
Icelan
d
Mt C
O2 e /yr
Emissions/removals from LULUCF in EU MS (year 2014)
% contribution of LULUCF to total GHG emissions (without LULUCF)
In EU28, LULUCF offsets 7% of total GHGs (Forest offsets 10%)
-7 -3 -20 -24 -8 -6 3 -3 -35 -11 -2 -3 -8 9 -6 37 -43 -4 0 3 -7 -16 -17 -15 -42 -10 -72 -2 258

Land use changes represent 9% of EU area but account for > 20% of absolute emissions/removals of respective subcategoriesThe sink from conversions to FL (‐54 MtCO2yr) and GL (‐26 MtCO2/yr) compensated by emissions from conversions to CL (45 MtCO2/yr) and SL (47 MtCO2/yr).
Area of organic soils (19 Mha: 13 in FL, 2 in CL, 4 in GL) represents about 5% of the total area of FL + CL + GL in the EU, but their emissions (97 MtCO2/y: 20 in FL, 31 in CL and 46 in GL) account for 30% of net total LULUCF removals.
Biomass burning: about 6‐7 MtCO2/yr (3‐30, depending on the year)
The LULUCF “hotspots”
Overview

Trends of emissions/removals (EU28)
Forest land
‐80 ‐70 ‐60 ‐50 ‐40 ‐30 ‐20 ‐10 0
10
Austria
Belgium
Bulgaria
Croa
a Cyprus
Czech Repub
Denm
ark
Estonia
Finland
France
Germany
Greece
Hungary
Ireland
Italy
Latvia
Lithuania
Luxembourg
Malta
Netherlands
Poland
Portugal
Romania
Slovakia
Slovenia
Spain
Sweden
United Kingd
Mt CO2e/y
L‐FL
FL‐FL
MS emissions/removals (EU28 2014)
‐450 ‐400 ‐350 ‐300 ‐250 ‐200 ‐150 ‐100 ‐50 0
1990
1992
1994
1996
1998
2000
2002
2004
2006
2008
2010
2012
2014
Mt C
O2e
/y
FL‐FL
L‐FL

MS trends of emissions/removals in FL‐FL
Absolute levels and long‐term trend affected by harvest, increments, age structure. Levels partially affected also by methods/definitionsInterannual variability affected by natural disturbances (fires, storms) and harvestShort‐term trend also affected by the method (i.e. stock‐change vs. gain‐loss)

Trends of emissions/removals (EU28)
Cropland
‐5
0
5
10
15
20
25
Austria
Be
lgium
Bu
lgaria
Croa
a Cy
prus
Czech Re
pub
Denm
ark
Estonia
Finlan
d Fran
ce
German
y Greece
Hun
gary
Ire
land
Ita
ly
Latvia
Lithua
nia
Luxembo
urg
Malta
Nethe
rland
s Po
land
Po
rtug
al
Roman
ia
Slov
akia
Slov
enia
Sp
ain
Swed
en
United King
d
Mt C
O2e
/y
L‐CL
CL‐CL
MS emissions/removals (EU28 2014)
0
10
20
30
40
50
60
70
1990
1992
1994
1996
1998
2000
2002
2004
2006
2008
2010
2012
2014
Mt C
O2e
/y CL‐CL
L‐CL

Grassland
Trends of emissions/removals (EU28)
‐15 ‐10 ‐5 0 5
10 15 20 25
Austria
Be
lgium
Bu
lgaria
Croa
a Cy
prus
Czech Re
pub
Denm
ark
Estonia
Finlan
d Fran
ce
German
y Greece
Hung
ary
Ireland
Ita
ly
Latvia
Lithua
nia
Luxembo
urg
Malta
Nethe
rland
s Po
land
Po
rtug
al
Roman
ia
Slov
akia
Slov
enia
Sp
ain
Swed
en
United King
d
Mt C
O2e
/y
L‐GL
GL‐GL
MS emissions/removals (EU28 2014)
‐40 ‐30 ‐20 ‐10 0
10 20 30 40 50
1990
1992
1994
1996
1998
2000
2002
2004
2006
2008
2010
2012
2014
Mt C
O2e
/y GL‐GL
L‐GL

Completeness of reporting of land uses (UNFCCC)
Completeness: FL > CL > GL > WLCompleteness of land use conversions > land use remaining the same
= estimate not mandatory under tier 1
Are LULUCF estimates complete?
Land Use SubcategoryCarbon pool
Living biomass Dead organic matter SOC mineral
Forest Land FL‐FL 100% 52% 31%L‐FL 93% 66% 79%
CroplandCL‐CL 83% 10% 69%L‐CL 83% 66% 90%
GrasslandGL‐GL 38% 17% 41%L‐GL 90% 69% 90%
WetlandsWL‐WL 17% 3% 38%L‐WL 83% 62% 86%

Improvement in completenessCoverage of reporting of lands by C pool, from 2009 GHGI to 2016 GHGI
Num
ber o
f MS repo
rting
0
4
8
12
16
20
24
28
Biom DOM Soil min Soil org
Cropland remaining Cropland
Year 2007
Year 2014
0
4
8
12
16
20
24
28
Biom DOM Soil min Soil org
Land converted to Cropland
Year 2007
Year 2014
0
4
8
12
16
20
24
28
Biom DOM Soil min Soil org
Grassland remaining Grassland
Year 2007
Year 2014
0
4
8
12
16
20
24
28
Biom DOM Soil min Soil org
Land converted to Grassland
Year 2007
Year 2014
0
4
8
12
16
20
24
28
Biom DOM Soil min Soil org
Forest land remaining Forest land
Year 2007
Year 2014
0
4
8
12
16
20
24
28
Biom DOM Soil min Soil org
Land converted Forest land
Year 2007
Year 2014

Are LULUCF estimates accurate?
‐450
‐400
‐350
‐300
‐250
‐200
‐150
‐100
‐50
0
1990
1991
1992
1993
1994
1995
1996
1997
1998
1999
2000
2001
2002
2003
2004
2005
2006
2007
2008
2009
2010
2011
2012
2013
2014
Mt C
O2 eq
2016
2015
2014
2013
2012
2011
Recalculations ‐ total LULUCF

Verification of GHG estimatesIPCC: verification of national GHG inventories useful to improve scientific understanding and build confidence on estimates and trends, e.g. ‐ Comparison with partially independent information (scientific studies, international datasets, forest Carbon Budget Model applied by JRC, etc.)‐ Applying different methods (Lower tiers, higher tiers, direct measurement of GHG emissions and removals, etc.)Comparing different data/methods does not mean expecting full match. However, in principle trends could be expected to be the same.
Uncertainties at MS levelForest land: 10‐70% for biomass (EU28 average ≈ 35%), 20‐100% for dead organic matter (≈60%), 15‐70% for mineral soils (≈60%) and 35‐150% for organic soils (≈90%). FM: ≈35%, Forest conversions (AR/D) ≈ 50‐60%Cropland & Grassland: high uncertainties (50‐100%), especially for mineral/organic soilsLargest uncertainties shown in land conversions.

16
WAY FORWARD FOR 2016 SUBMISSIONS (outcomes of WG‐I meeting 17th March 2016)
• 3rd May: release of the software – to be tested if it can allow the submissions under KP by 15th June
• 16th May: Cut‐off day for submission to the EU
• 15th June: inventory submissions under KP (assumes in principle that the CRF is functional)
• Initial reports to be submitted by 15th June, together with KP submission

Decision 2/CMP.8
• Each Party with a GHG target in CP2 shall submit [by 15 April 2015], a report to facilitate the calculation of its assigned amount and to demonstrate its capacity to account for its emissions.
• This report shall include the following LULUCF‐related information:• Forest definition and threshold parameters, in accordance with 16/CMP.1 and 2/CMP.7. If the Party selected its forest definition for CP1, the definition for CP2 shall be the same.
• The identification of its election of activities under Article 3.4 of the KP, together with information on how its national system will identify the associated land areas
• Whether it intends to account annually or for the entire commitment period; • The FMRL inscribed in decision 2/CMP.7 and technical corrections for the 1st year of CP2*• Information on how emissions from HWP originating from forests prior to the start of the CP2 have been calculated in the FMRL in accordance with decision 2/CMP6;
• Whether it intends to exclude emissions from Natural Disturbances, including information on background level and the margin (if any);
• Parties shall include the FMRL submission and the corresponding technical assessment report as annexes to the report. Any technical corrections resulting from recommendations in the technical assessment report shall be reported in the inventory submission for the first year of the CP2.
INITIAL REPORTS

Decision 2/CMP.8 (continued)
• Additionally, the report shall include the following information for Art. 3.3 (ARD), FM, elected Art. 3.4 activities (CM, GM, RV, WDR):1) Estimates of anthropogenic GHG emissions / removals2) General information including:‐ Information already included in past NIR under KP, i.e. information showing how estimates
follow relevant IPCC guidelines; Information showing that lands are identifiable and traceable; The spatial assessment unit used for ARD; Demonstration that the unaccounted C pools were not a net source of emissions; Factoring out removals from elevated CO2, indirect N deposition, effects of age structure; Information on how harvesting or forest disturbance that is followed by the re‐establishment of a forest is distinguished from deforestation; Information showing that ARD activities and are directly human‐induced.
‐ NEW information: Emissions from the conversion of natural forests to planted forests; Information showing methodological consistency between the FMRL and reporting for FM + any technical corrections to FMRL; Information on how emissions and removals in Harvested Wood Products (HWP) are accounted in accordance with decision 2/CMP.7; When a Party applies the provisions for Natural Disturbances (ND), information demonstrating accordance with decision 2/CMP.7;

Thank you !
Related Documents