Overview of the Dvorak Technique • Visible and Infrared Technique • Simplified Visible Technique given here (See Technical Report for full details) • Uses patterns and measurements as seen on satellite imagery to assign a number (T number) representative of the cyclone’s strength. • The T number scale runs from 0 to 8 in increments of 0.5.

Welcome message from author
This document is posted to help you gain knowledge. Please leave a comment to let me know what you think about it! Share it to your friends and learn new things together.
Transcript

Overview of the Dvorak Technique
• Visible and Infrared Technique• Simplified Visible Technique given here (See
Technical Report for full details)• Uses patterns and measurements as seen on
satellite imagery to assign a number (T number) representative of the cyclone’s strength.
• The T number scale runs from 0 to 8 in increments of 0.5.
Overview of the Dvorak Technique Cont’d
• In the following examples, only the Data T Number (DT) will be calculated, the final (official) T number assigned to a tropical cyclone includes further considerations.
• DT computations familiarize one to various tropical cyclone patterns.

Four Basic Patterns
• Curved Band Pattern
• Shear Pattern
• Central Dense Overcast (CDO) Pattern
• Eye Pattern
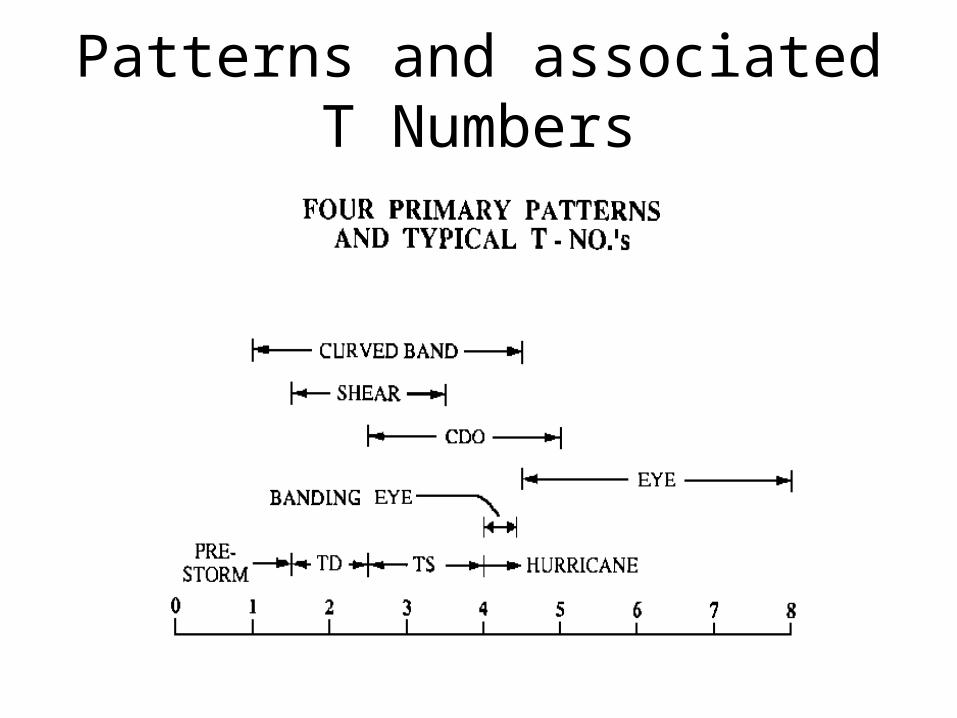
Patterns and associated T Numbers
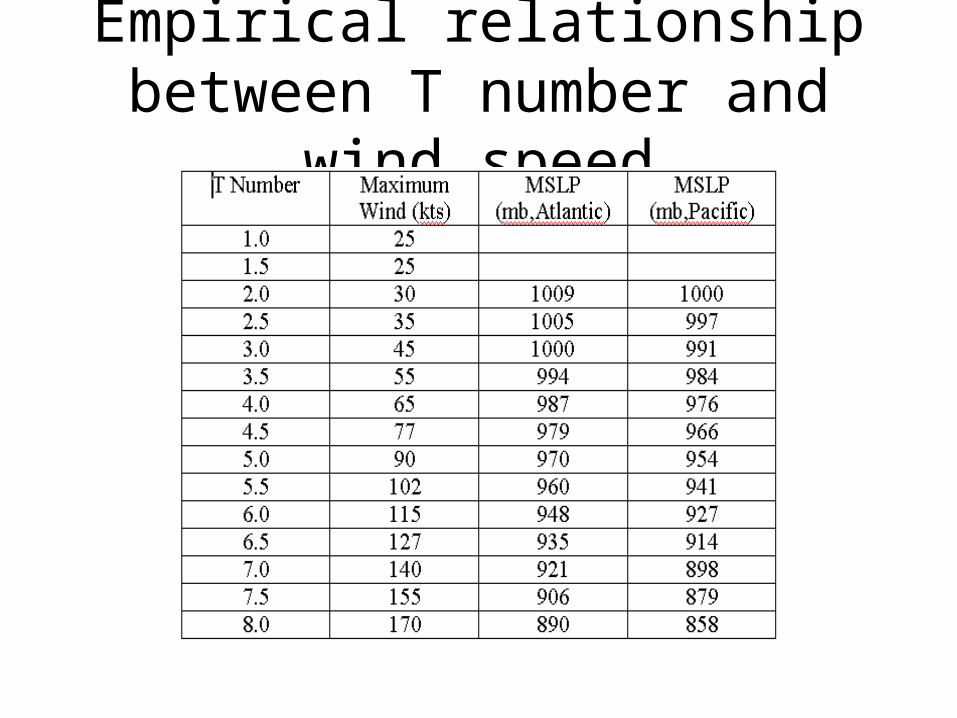
Empirical relationship between T number and wind speed

Finding the Cloud System Center (CSC)
• First step in the Dvorak technique• From Dvorak (1985): “The cloud system center is defined as the
focal point of all the curved lines or bands of the cloud system. It can also be thought of as the point toward which the curved lines merge or spiral.”
• Several situations

Curved Band Pattern
Curved Band Pattern
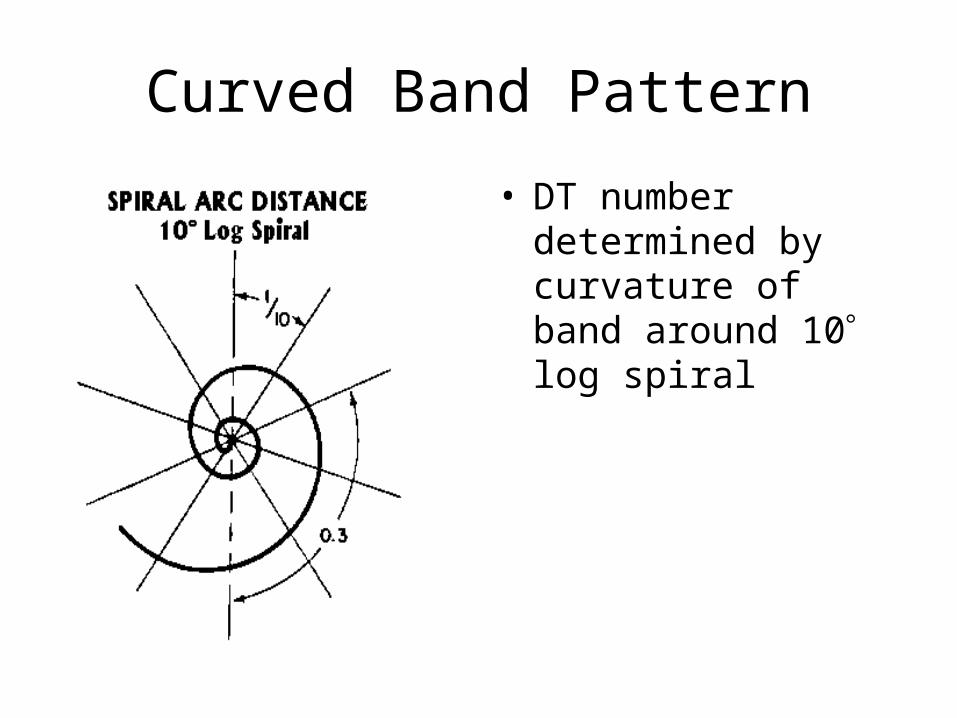
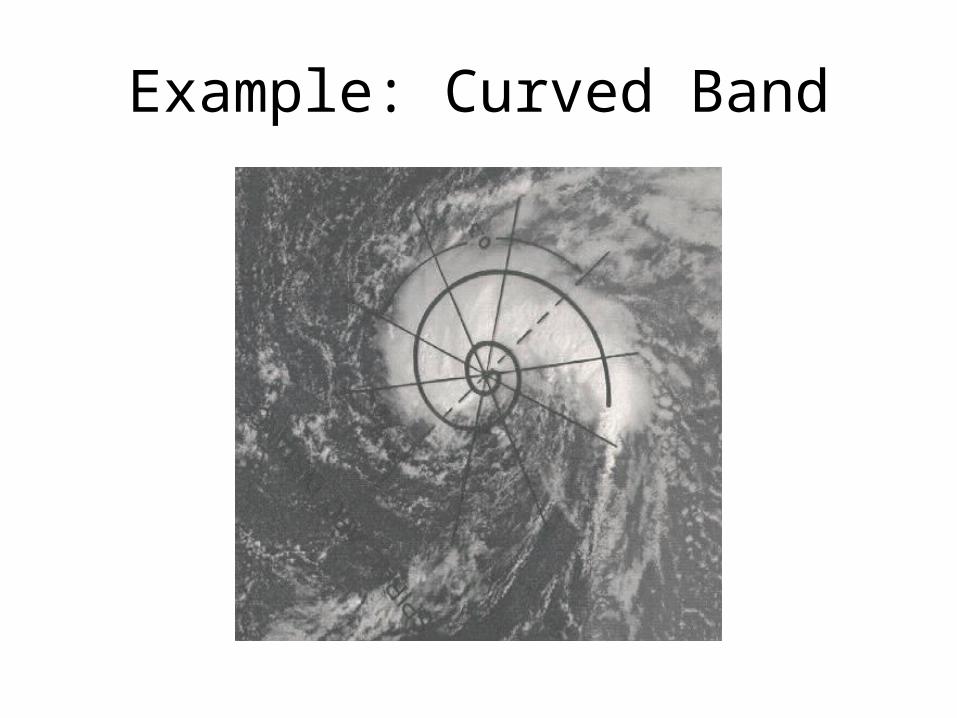
• DT number determined by curvature of band around 10 log spiral

Curved Band Pattern Cont’d
1.0 to 2.0 2.5 3.0 3.5 4.0 4.5
DT Number
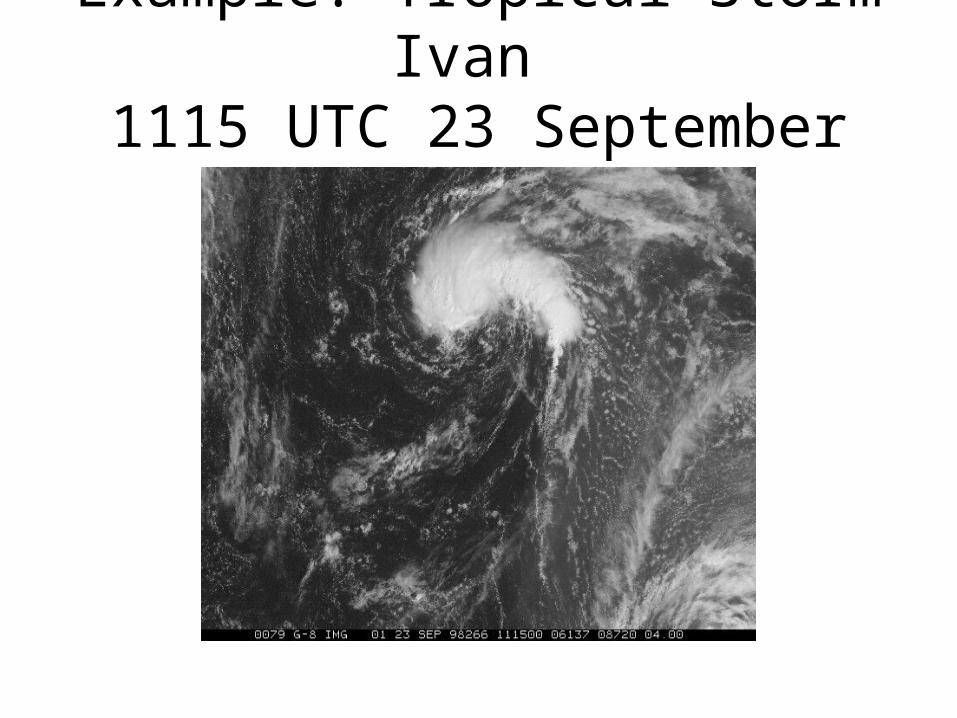
Example: Tropical Storm Ivan 1115 UTC 23 September 1998
Example: Curved Band

Curved Band Pattern
• Tropical Storm Ivan curves 0.7 around log 10 spiral. This corresponds to DT=3

Shear Pattern

Shear Pattern DT Numbers
1° latitude = 60 nautical miles (nmi) = 111 km

Central Dense Overcast (CDO)

CDO
• No eye
• DT number determined by CF+BF=DT– CF=CENTRAL FEATURE– BF=BANDING FEATURE– DT=DATA T NUMBER

Example: Hurricane Georges 1545 UTC 21 September 1998

Example: CDO Central Feature (CF)
• Measure Diameter of CDO in degrees latitude• For a well defined CDO
– 3/4 ° CF=2– 1 1/4 ° CF=3– 1 3/4 ° CF=4– >2 1/4 ° CF=5
• For an irregular CDO– 1° to 1 1/2 ° CF=2– >1 1/2 ° CF=3

Eye Pattern
Eye Pattern
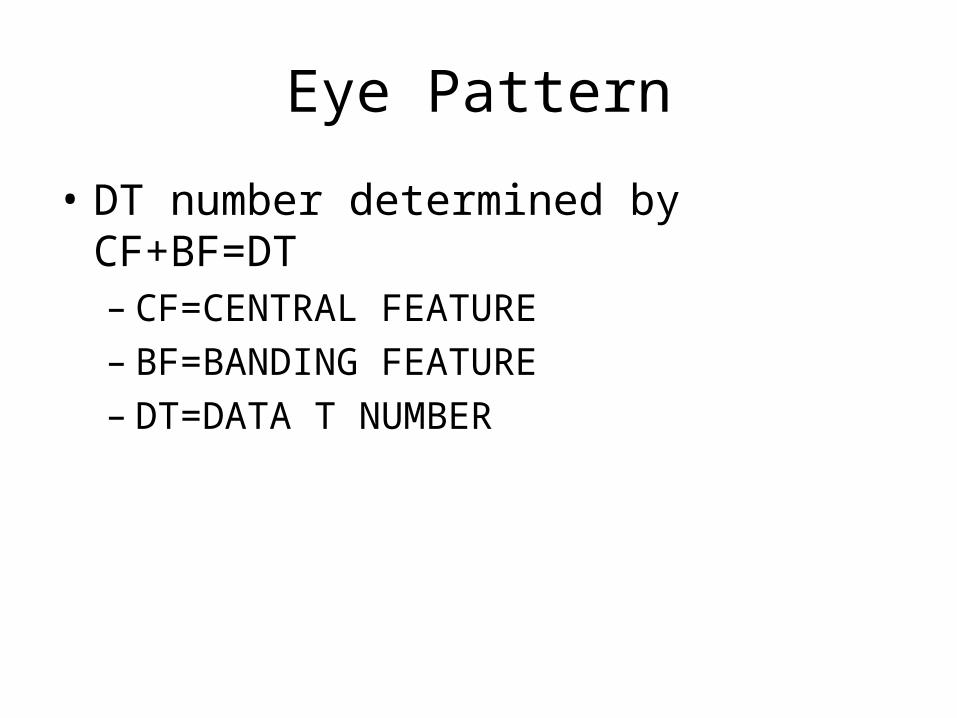
• DT number determined by CF+BF=DT– CF=CENTRAL FEATURE– BF=BANDING FEATURE– DT=DATA T NUMBER

Example: Hurricane Georges 1945 UTC 18 September 1998
Example: Eye - Central Feature (CF)
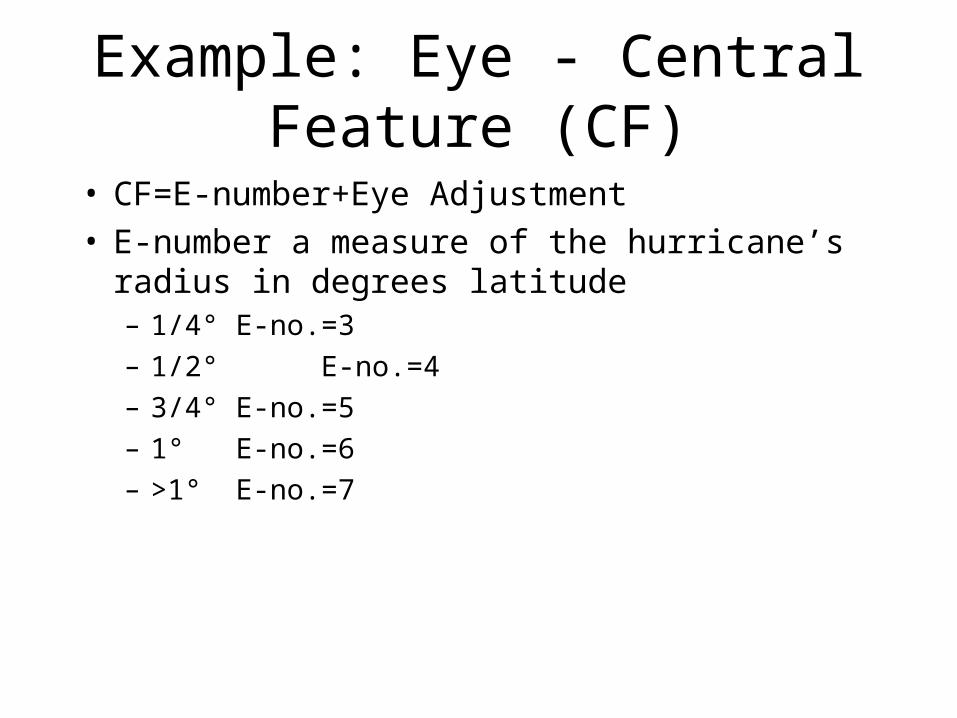
• CF=E-number+Eye Adjustment• E-number a measure of the hurricane’s
radius in degrees latitude– 1/4° E-no.=3– 1/2° E-no.=4– 3/4° E-no.=5– 1° E-no.=6– >1° E-no.=7

Eye Number
Eye - Central Feature Cont’d
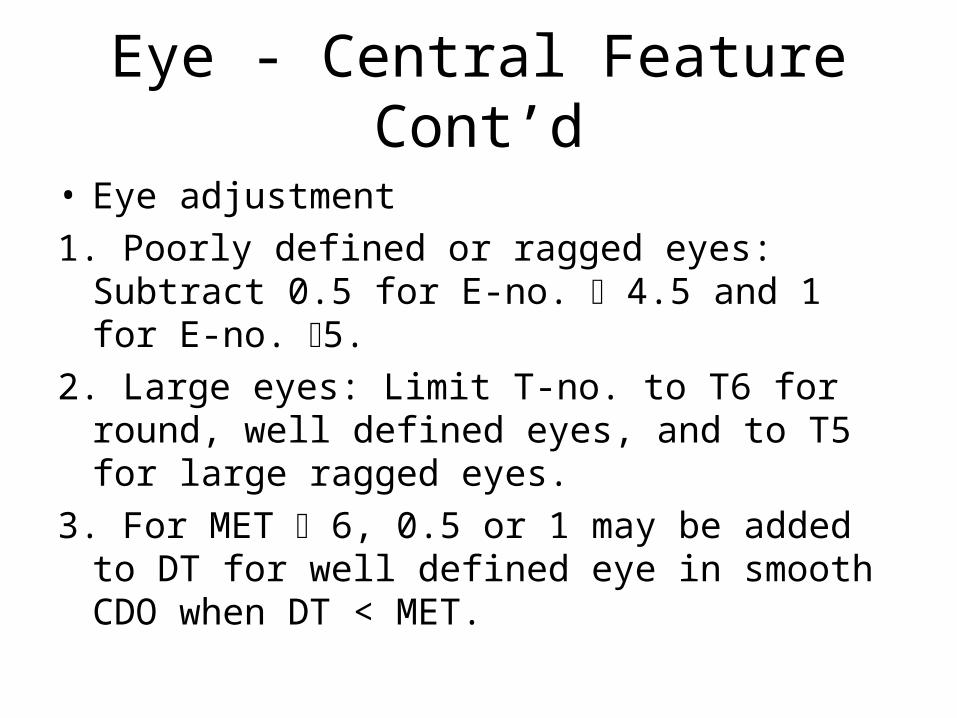
• Eye adjustment
1. Poorly defined or ragged eyes: Subtract 0.5 for E-no. 4.5 and 1 for E-no. 5.
2. Large eyes: Limit T-no. to T6 for round, well defined eyes, and to T5 for large ragged eyes.
3. For MET 6, 0.5 or 1 may be added to DT for well defined eye in smooth CDO when DT < MET.

Eye Adjustment
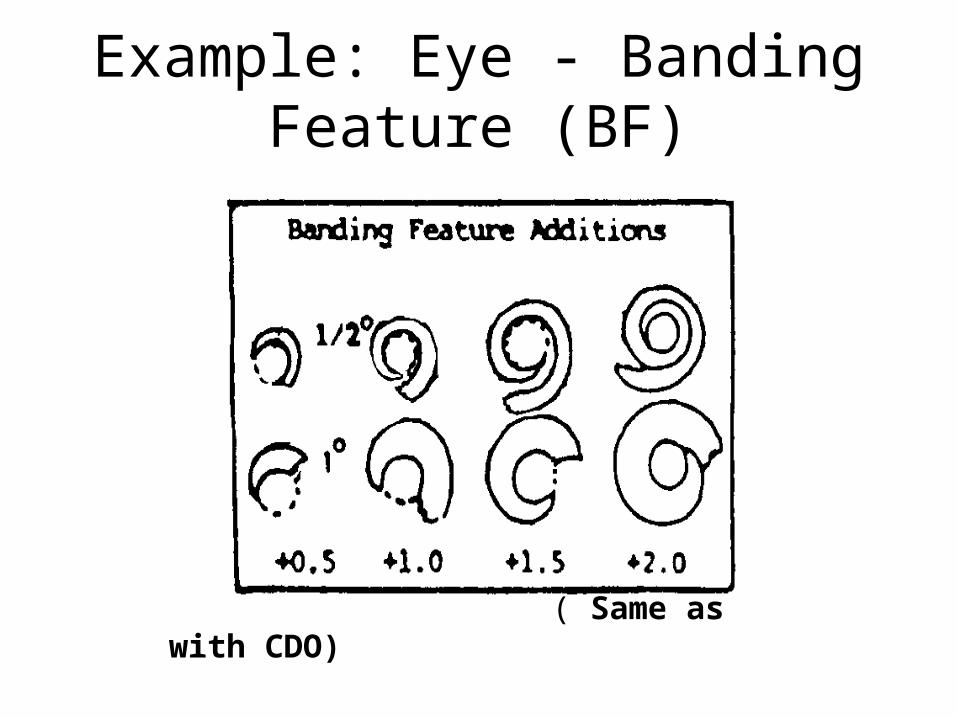
Example: Eye - Banding Feature (BF)
( Same as with CDO)
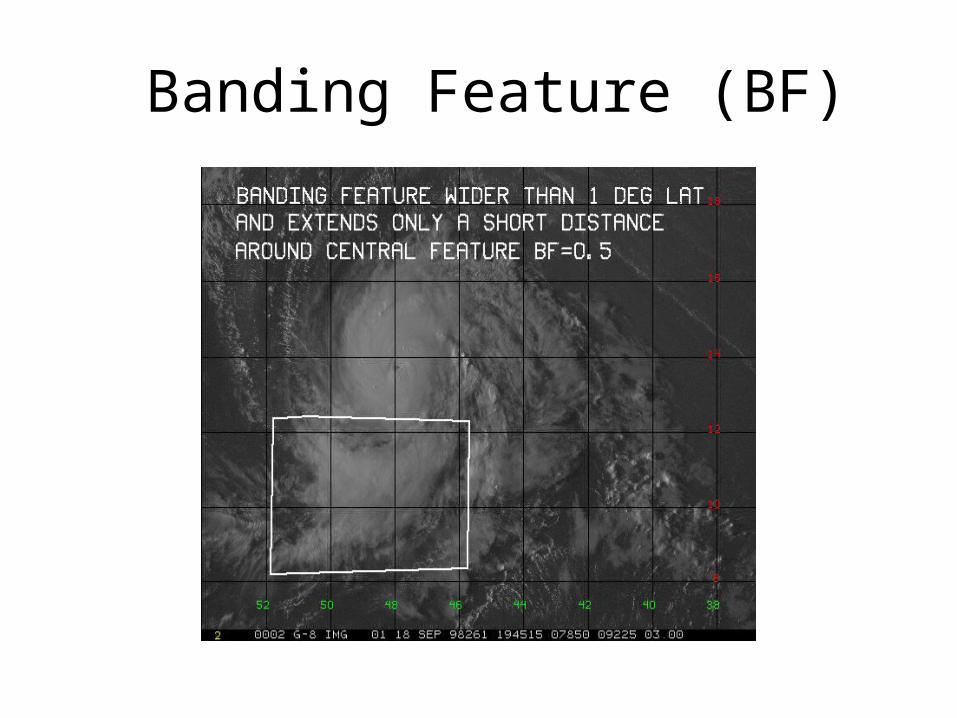
Banding Feature (BF)

Data T Number
CF + BF = DT
CF = 6 - 1 = 5
BF = 0.5
DT = 5.5

Infrared (IR) Technique
• Can be used during night as well as during day
• At times more objective than visible technique

Example Digital IR: Hurricane Erika 1515 UTC 8 September
1997• Warmest eye pixel 16
°C• Warmest pixel 30 nmi
(55 km) from center -71 °C
• Nomogram gives Eye no. =7
Summary
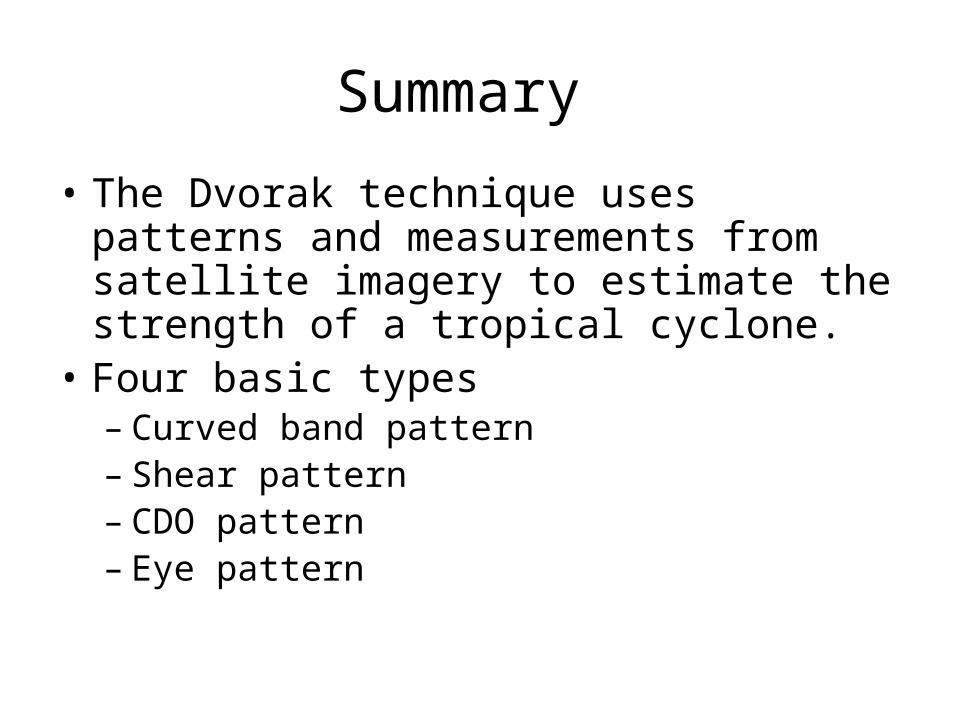
• The Dvorak technique uses patterns and measurements from satellite imagery to estimate the strength of a tropical cyclone.
• Four basic types– Curved band pattern– Shear pattern– CDO pattern– Eye pattern

ODT-Objective Dvorak Technique
• Original version – Dvorak (1984) – “analysis using digital IR data”
• Velden, Olander, Zehr (1998) – ODT
• Computation used for hurricane intensities remains essentially unchanged
• What is it? – Two IR temperature measurements, given a center location
Two IR temperature measurements
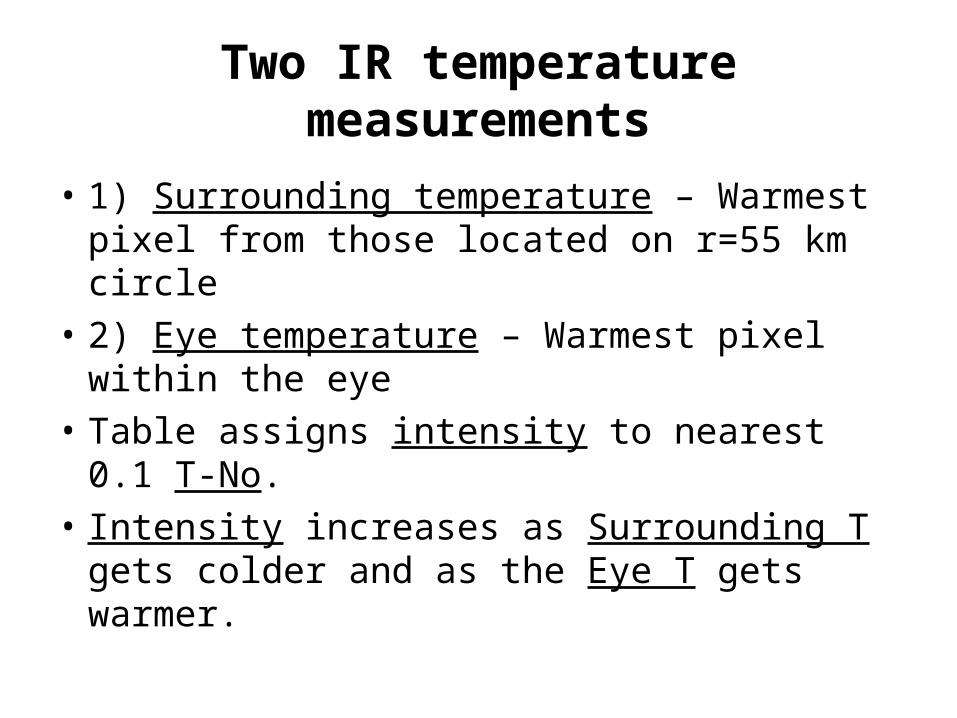
• 1) Surrounding temperature – Warmest pixel from those located on r=55 km circle
• 2) Eye temperature – Warmest pixel within the eye
• Table assigns intensity to nearest 0.1 T-No.
• Intensity increases as Surrounding T gets colder and as the Eye T gets warmer.
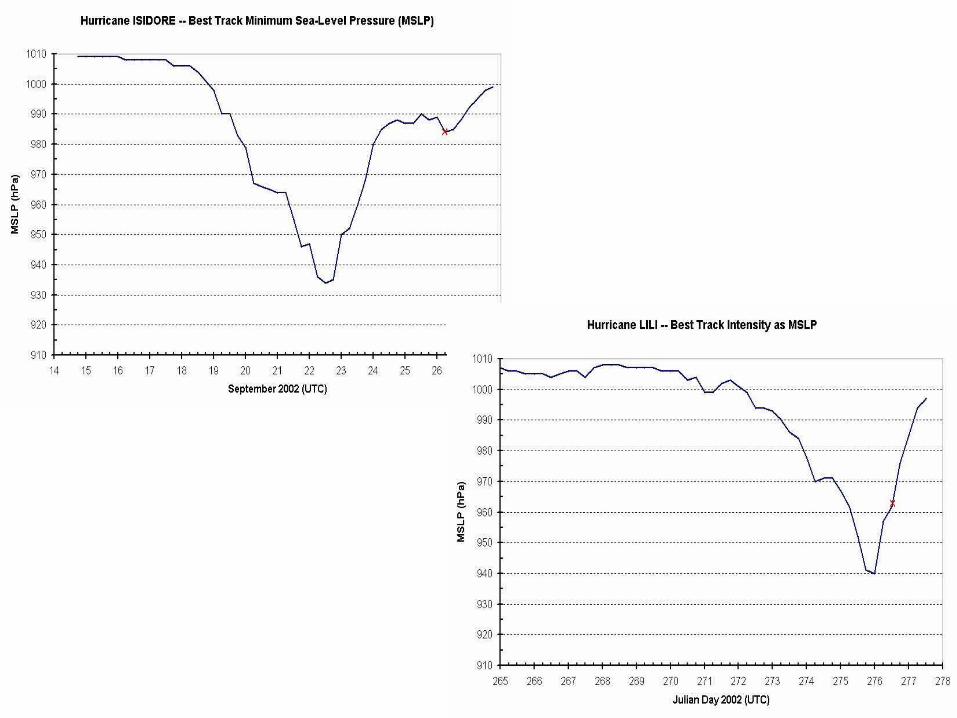

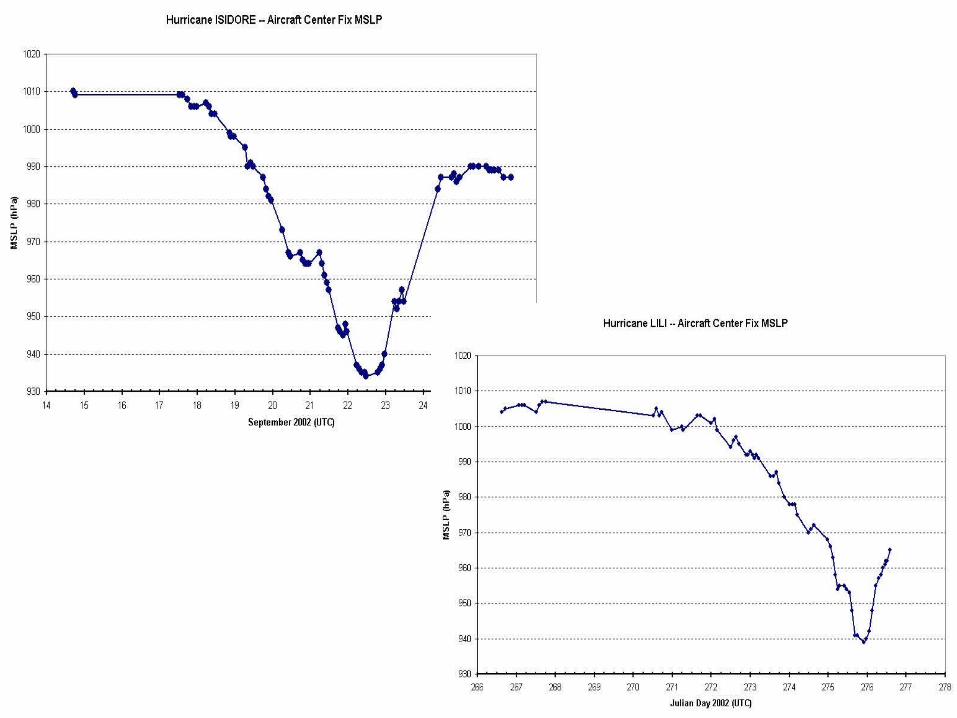
Isidore’02 vs Lili’02
• Lowest MSLP – Isidore’02 934 hPa– Lili’02 938 hPa
• Maximum Surface Wind Speed – Lili’02 125 kt– Isidore’02 110 kt


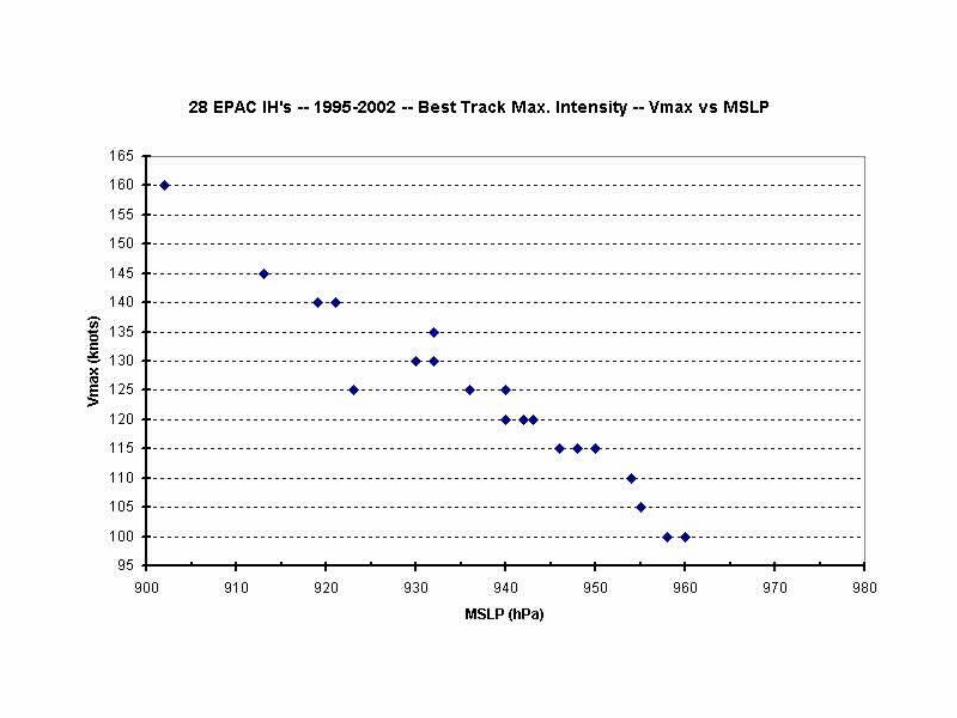
Tropical Cyclone Pressure Wind Relationship
• Pressure : Wind = MSLP : Vmax
– MSLP = minimum sea-level pressure– Vmax = maximum surface wind (10-m, 1-min wind)

P-Wind-Deviation (MSLP Vmax)
• Definition: Difference between observed MSLP and observed maximum wind speed converted to MSLP with a Pressure-Wind Relationship….
• P-Wind Dev. = MSLPmin – MSLPDvorak, f (Vmaxmax)

95-F
95-O
98-G
01-E
01-M
02-I
02-L
95-M 96-F
99-B 99-L
01-I

Lili’02
Isidore’02


Lili’02
Isidore’02
Erin’01
Opal

Lili’02
Isidore’02
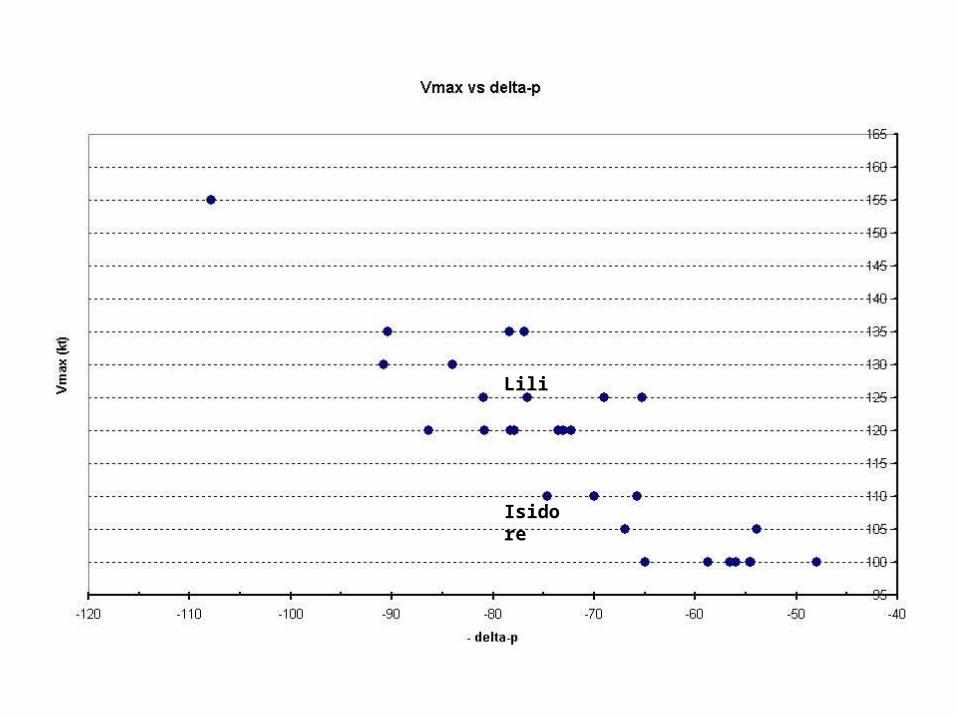
Isidore
Lili
Tropical Cyclone Surface Wind Analysis
-- based entirely on satellite data (along with center location and storm motion)
--with sufficient resolution to depict intensity (maximum wind and its location)
-- with sufficient coverage to depict size (area with winds exceeding gale force).
-- frequent time intervals

Independent Surface Wind Analyses from Four
Components
• IR -Inner core, time continuity, rapid changes
• AMSU -Inner and outer winds
• Scatterometer -Outer winds, weak TCs
• Satellite Winds -Outer winds, weak TCs
“Satellite only” Tropical Cyclone Surface Wind
Analysis• COMBINATION OF FOUR ANALYSES• IR -Inner core, time continuity, rapid changes• AMSU -Inner and outer winds• Scatterometer -Outer winds, weak TCs• Satellite Winds -Outer winds, weak TCs
– Global coverage– Time continuity– Consistent analysis
Validation and developmental data sets
• Aircraft winds
• Dropsonde winds
• Conventional obs (surface, ship, buoy)
• HRD Wind Analyses
• Numerical Model Analyses

CONCLUSION:
• In order for a Combined Satellite Tropical Cyclone Surface Wind Analysis to be successful and reliable – i.e… capture the rapid changes and have consistency among analyses.
• …. it MUST incorporate the Objective Dvorak Technique (ODT)


32 Intense Hurricanes (Cat 3+) in Atlantic during 10-years, 1994-2003
• Characteristics at time of max. intensity
• R-34 kt, n. mi. (azimuthal average):– Ave. 142 Max. 231 Min. 69
• R-50 kt, n. mi. (azimuthal average):– Ave. 82 Max. 150 Min. 23
• RMW (Radius of Maximum Wind Speed), n. mi.:– Ave. 20 Max. 30 Min. 5
• MSLP (Minimum Sea-level Pressure), hPa:– Ave. 941 Min. 905 Max. 968

Size differences – Atlantic Intense Hurricanes 1994-2003
• Cindy, ’99 – Average R-34 kt : 231 n.mi.– R-50 kt : 144 n.mi.– Intensity: 120 kt, 942 hPa
Iris, ’01 – Average R-34 kt: 69 n.mi.
R-50 kt: 23 n.mi.
-- Intensity: 125 kt, 948 hPa

Hurricane CINDY – 0715 UTC 28 Aug 99
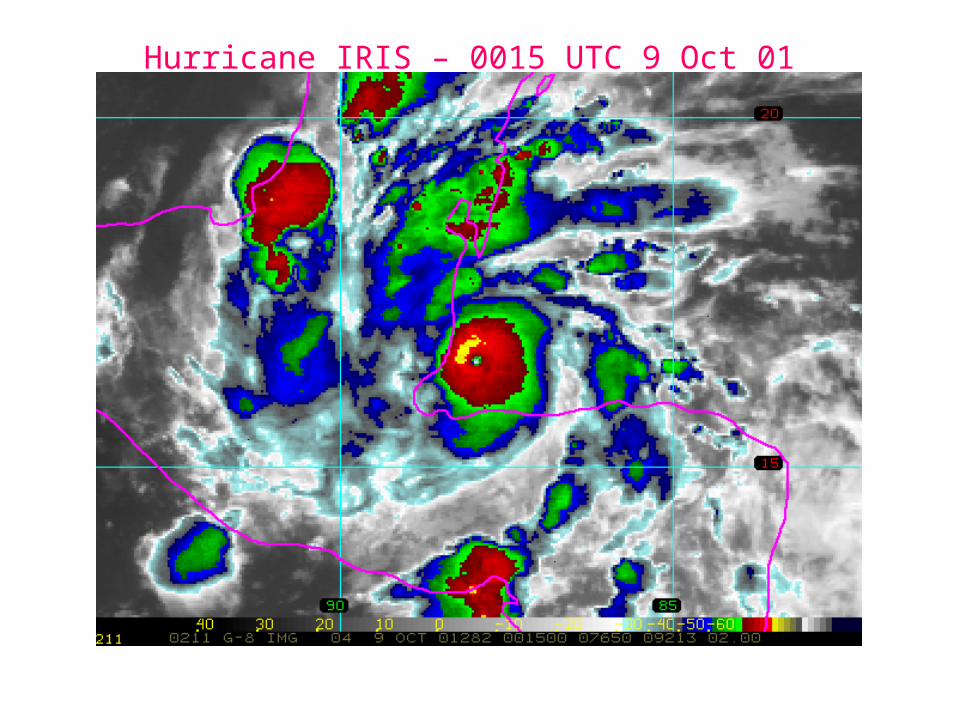
Hurricane IRIS – 0015 UTC 9 Oct 01

IR Cloud Area vs TC Size
• Hurricane Bret and Hurricane Floyd, at 125-kt intensity
• Bret’s Average R-34 kt • is 68 n. mi.• Floyd’s Average R-34 kt
is 183 n. mi.


20 Atlantic Intense Hurricanes ’95-’99
• LOWEST MINIMUM SEA-LEVEL PRESSURE• • 1. Mitch 905 hPa• 2. Opal 916• 3. Floyd 921• 4. Felix 929• 5. Gert 930• 6. Edouard 933• 7. Lenny 933• 8. Luis 935• 9. Hortense 935• 10. Georges 937• 11. Cindy 942• 12. Bret 944• 13. Fran 946• 14. Erik 946• 15. Marilyn 949• 16. Bonnie 954• 17. Roxanne956• 18. Bertha 960• 19. Lili 960• 20. Isidore 960
• MAXIMUM SURFACE WIND SPEED • • 1. Mitch 155 knots• 2. Floyd 135• 3. Lenny 135• 4. Georges 135• 5. Opal 130• 6. Gert 130• 7. Edouard 125• 8. Bret 125• 9. Felix 120• 10. Luis 120• 11. Hortense 120• 12. Cindy 120• 13. Erika 110• 14. Fran 105• 15. Marilyn 100• 16. Bonnie 100• 17. Roxanne100• 18. Bertha 100• 19. Lili 100• 20. Isidore 100

Intensification Rate• -- from “Best Track” data,
greatest MSLP decrease in 24 hr (- hPa / day)
• • 1. Mitch 54• 2. Opal 49• 3. Edouard 47• 4. Felix 40• 5. Floyd 38• 6. Bret 35• 7. Luis 34• 8. Lenny 34• 9. Hortense 32• 10. Georges 31
• – from Aircraft Center Fix MSLP, greatest decrease in 12 hr (- hPa / day) – limited to Cat 4 or greater hurricanes with aircraft observations
• • 1. Opal 80• 2. Mitch 54• 3. Felix 50• 4. Floyd 44• 5. Hortense 44• 6. Lenny 42• 7. Bret 42• • NOTE: The following Cat 4’s did
not have aircraft observations during initial intensification: Edouard, Luis, Georges, Cindy, Gert

Onset of Rapid Intensification
• Onset = Beginning of maximum intensification rate period
• Average Intensity at Onset (8 Atlantic cases) = 87 kt, 970 hPa
• What are IR image characteristics at Onset vs– Non – Intensifying Cat 2 at 85-90 kt
– Pre – Cat 3 at 85-90 kt ?


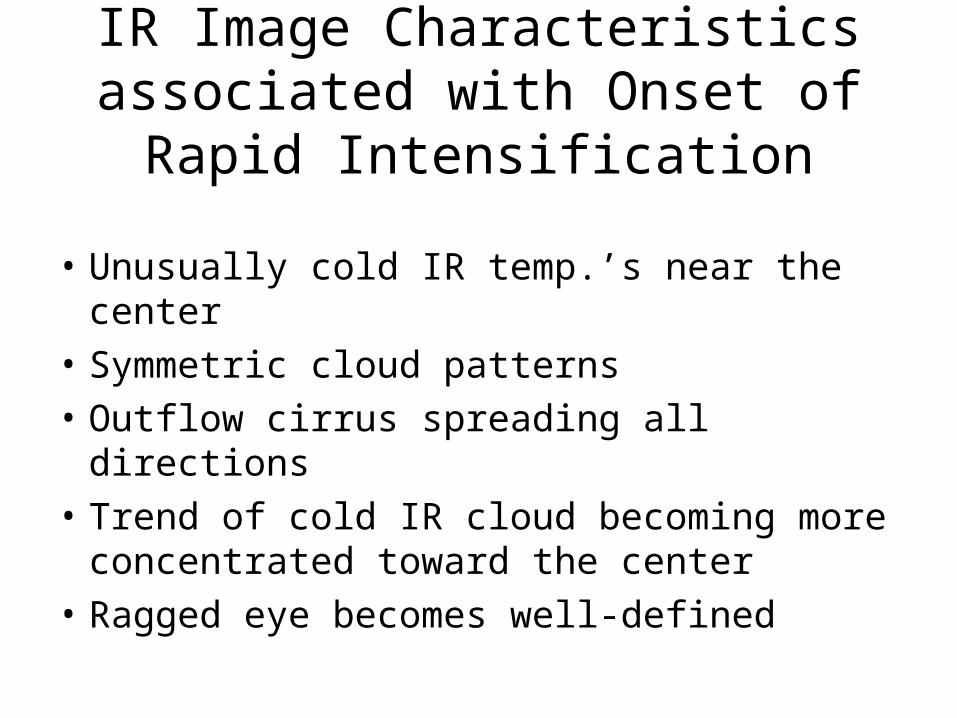
IR Image Characteristics associated with Onset of Rapid
Intensification
• Unusually cold IR temp.’s near the center
• Symmetric cloud patterns
• Outflow cirrus spreading all directions
• Trend of cold IR cloud becoming more concentrated toward the center
• Ragged eye becomes well-defined

Rapid vs Non-Rapid
• “Rapid” cases prior to onset have at least two and usually 5 of the characteristics
• “Non-Rapid” typically have one or less of the characteristics
• How can this be quantified and developed into an objective technique?
IR cloud asymmetries
• Measurements of IR temperature defined area centroid locations and their distance and bearing from surface center
• Related to :– Environmental vertical wind shear profile– TC motion– TC intensity and structure


OBTAINING WIND SPEED AND DIRECTION FROM THE OCEAN SURFACE USE
SCATTEROMETRY(Theory)
• The scatterometer sensor is an active microwave imager that sends and receives microwave energy off the ocean surface
• Microwave energy is sensitive to the “roughness” of the ocean surface that is generated by the surface wind field. This roughness is manifested in small capillary size waves (or ripples) known as Brag Waves
• Due to the assymetric nature of these Brag Waves in relationship to the wind speed and direction, it is possible to derive a wind field from an inversion technique by viewing the same area of ocean from several angles

SCATTEROMERDAILY COVERAGE
ERS-2
QUIKSCAT (ASCN)
QUIKSCAT (DSCN)
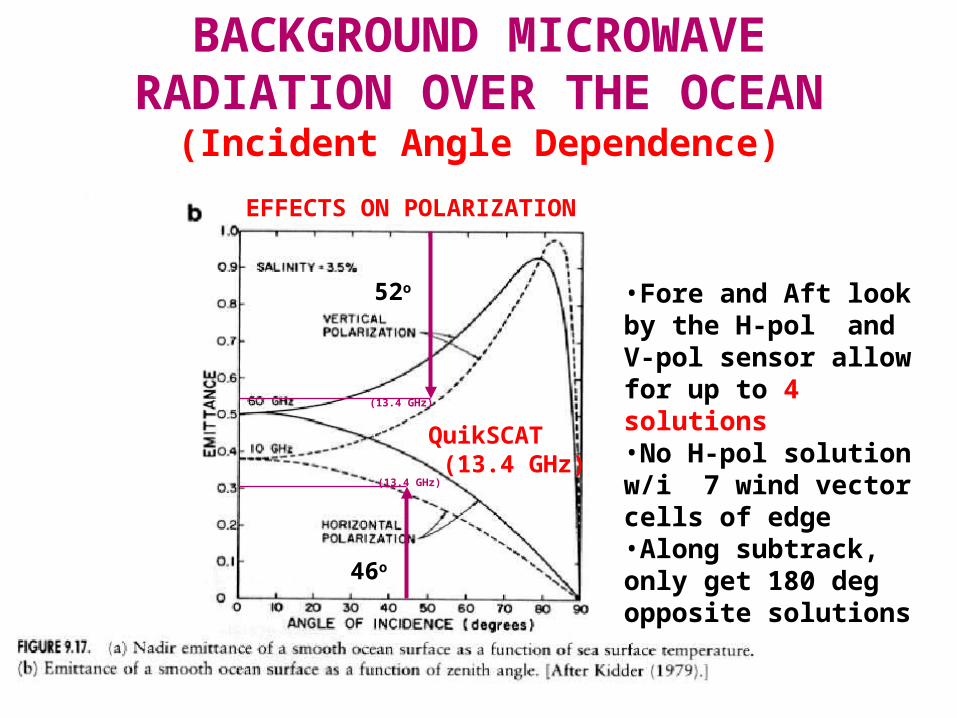
BACKGROUND MICROWAVE RADIATION OVER THE OCEAN
(Incident Angle Dependence)
•Fore and Aft look by the H-pol and V-pol sensor allow for up to 4 solutions•No H-pol solution w/i 7 wind vector cells of edge•Along subtrack, only get 180 deg opposite solutions
EFFECTS ON POLARIZATION
QuikSCAT (13.4 GHz)
52o
46o
(13.4 GHz)
(13.4 GHz)

WIND RETRIEVAL and
AMBIGUITY SOLUTIONS • ERS-2 uses CMOD4 wind retrieval method to estimate wind
speeds from Normalized Radar Cross-Section (Sigma-0) of backscatter microwave radiation over the oceans– 3 Antenna at 3 different angles (can not see at nadir)– ECMWF used as initialization in ambiguity (direction) process
• QuikSCAT uses NSCAT2 (QuikSCAT1) wind retrieval method – Circular Scan at 2 zenith angles (46o H-pol and 52o V-pol)– Fore and Aft views allow up to 4 solutions– Solutions are “Ranked” based on Most Likelihood Estimator (MLE)– AVN used as initialization in ambiguity (direction) process– A multi-process “Buddy System” using a medium filter evaluates
neighboring Wind Vector Cells (WVC) to make the final “Selection”– Each WVC is assigned a Rain Flag based on a likelihood determination
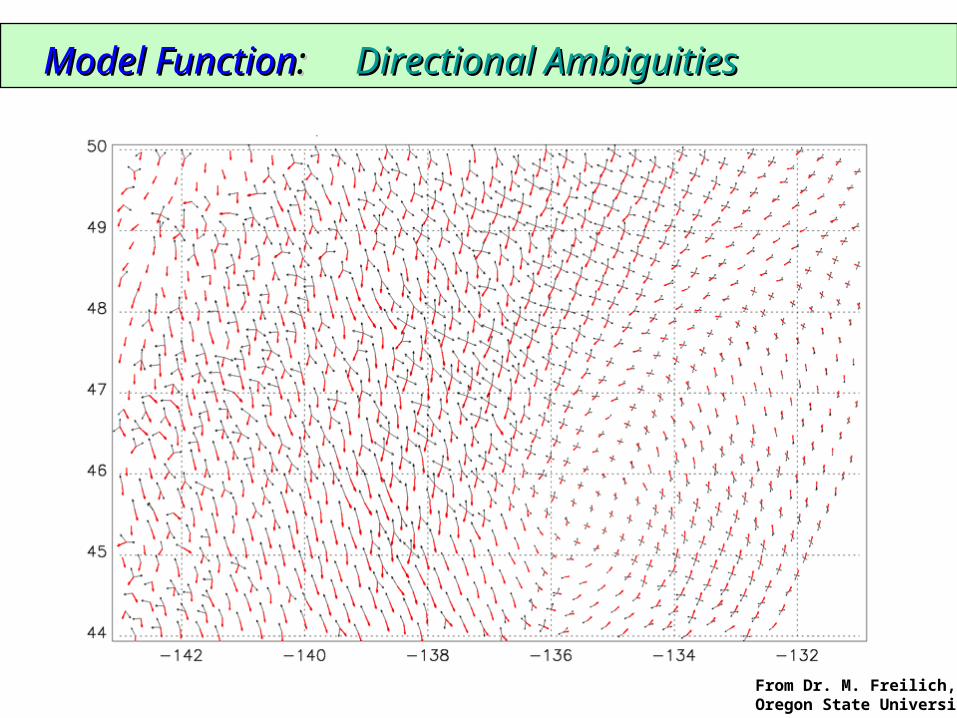
Model FunctionModel Function: : Directional AmbiguitiesDirectional Ambiguities
From Dr. M. Freilich, Oregon State University

QUIKSCATPROBLEM AREAS
( Usually in Low Skill Areas)
• Edge of Swath (~ 7 wvc) and Along Sub-Track(3-4 wvc)• Sensitivity to Heavy Rain
– Surface Roughness (Especially in Low Wind areas!)– Rain Scattering
• Sensitivity to Errors in NWP Model in Low Skill Locations• “Practical” Wind Regime between 05 AND 45 m/s
– Problems in both LIGHT winds and very HEAVY winds
• Resolution (25 km) of Footprint will Limit Wind Retrieval in Tight Gradient Regions• Ambiguity Selection Process and How Rain Flags are
Treated (no direct measurement of rain on QuikSCAT) can Affect the Final Solution– Watch out for Rain Blocks caused by ‘rain contagion’

EDGE PROBLEMS
Along the whole edge… OR small portion…
FNMOC DISPLAY

PROBLEMS WITH
RAIN
CONTAMINATION
and
AMBIGUITY SELECTION PROCESS
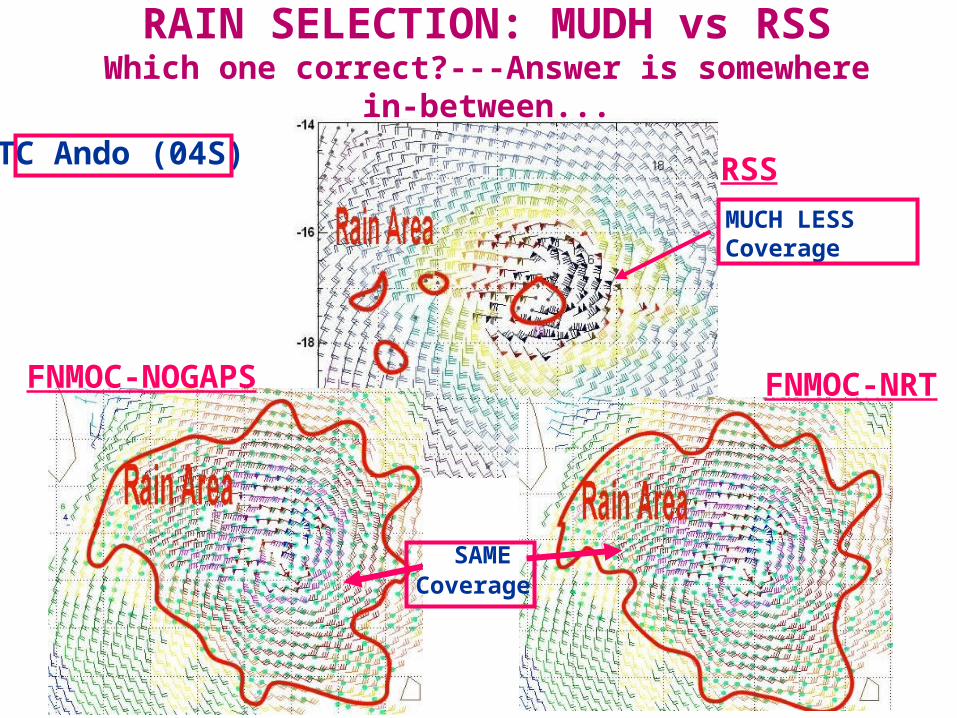
RAIN SELECTION: MUDH vs RSSWhich one correct?---Answer is somewhere in-
between...
TC Ando (04S) RSS
FNMOC-NOGAPS FNMOC-NRT
SAMECoverage
MUCH LESSCoverage
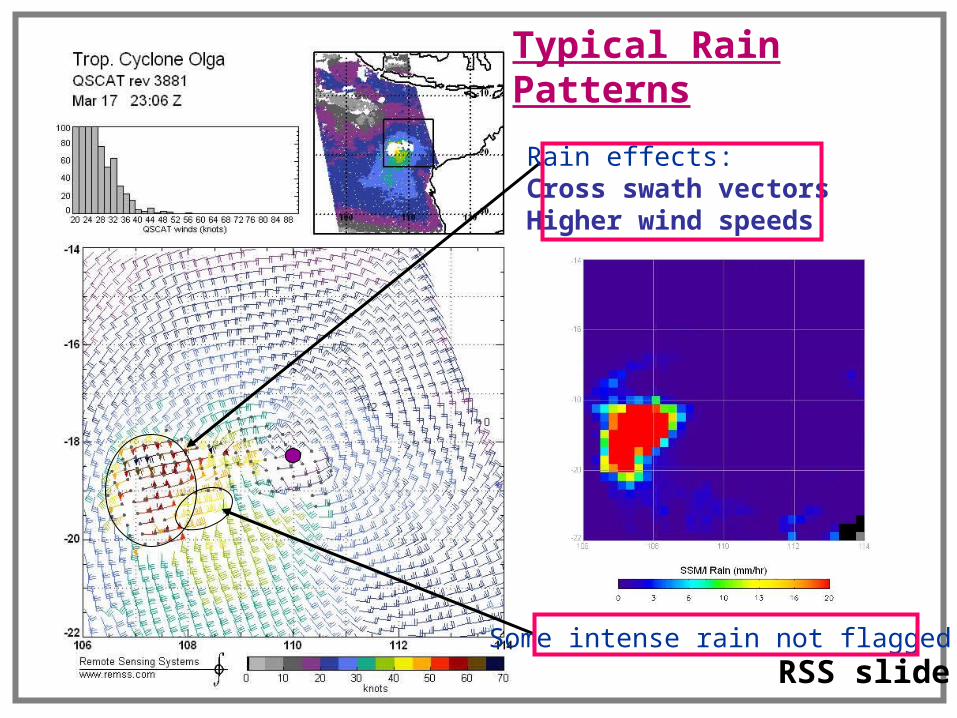
Typical Rain Patterns
Rain effects:Cross swath vectorsHigher wind speeds
Some intense rain not flaggedRSS slide

TYPES OFRAIN PATTERNS
andAMBIGUITY SELECTION ISSUES
AND HOW TO SOLVE

RAIN EFFECTS(Rain Blocks--Perpendicular to Swath)In a ‘rain block’, one or two winds solutions may be bad due to excessive scattering of the signal. The ‘default’ direction appears to be perpendicular to the swath direction. Problem exists because of the buddy system approach to neighboring wind vector cells causing a ‘rain contagion’ effect.
Rain Block Region
Bad directions. Do not use! Speed may be ok.

RAIN EFFECTS(Solution: A fix position is possible. Use the good
winds, outside of the rain-block)
TY Jelawat, 05Aug 0942Z, TS Chanchu, 28 Jul 0624Z(90kt)

AMBIGUITY SELECTION (With Rain effects--TS 28W)
FNMOC-NOGAPSFNMOC-NRTCompare the models and look for non-flagged winds
This version treatsnon-flagged dataseparately fromthe ‘rain block’
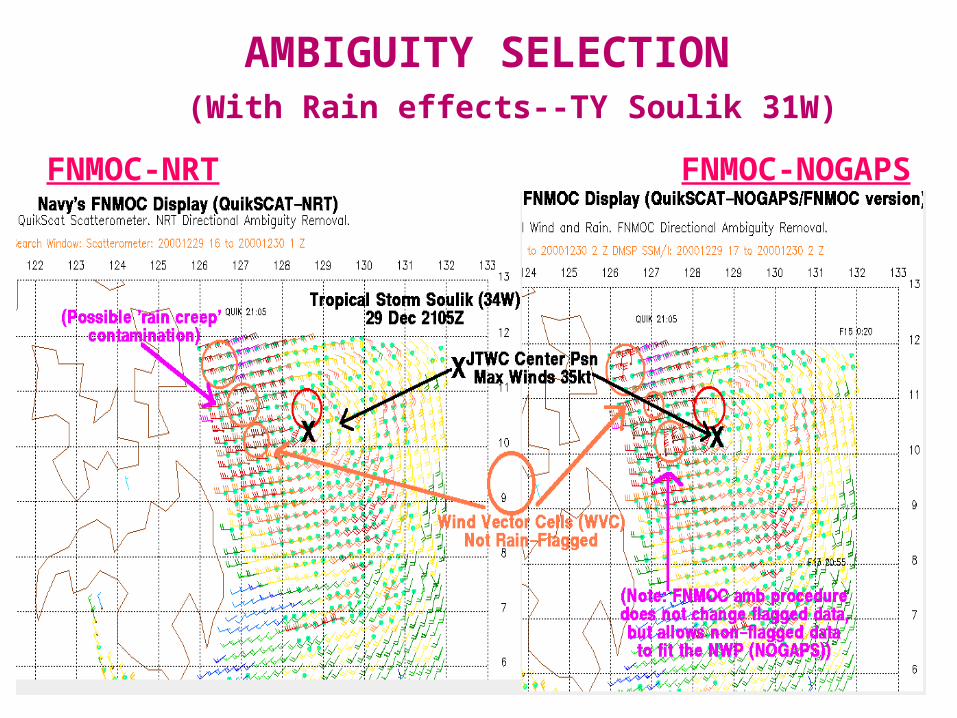
AMBIGUITY SELECTION (With Rain effects--TY Soulik 31W)
FNMOC-NOGAPSFNMOC-NRT
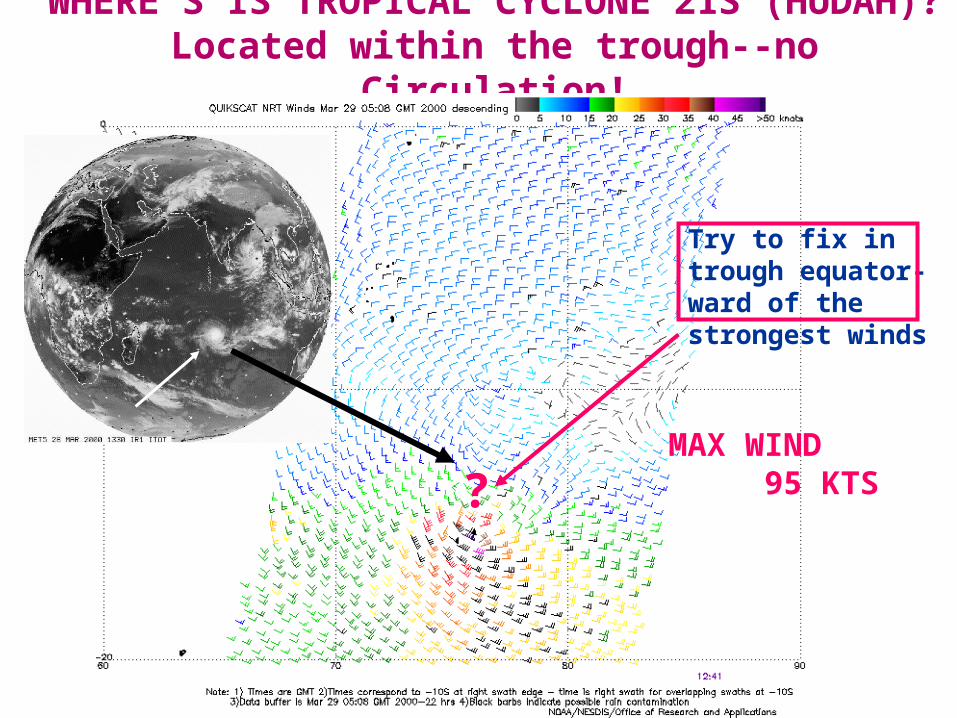
WHERE’S IS TROPICAL CYCLONE 21S (HUDAH)?Located within the trough--no Circulation!
?MAX WIND 95 KTS
Try to fix in trough equator-ward of the strongest winds

QUIKSCAT-- MODEL INITIALIZATION TC 24S (Paul), 20 April
?
? cc
MAX WIND 55 KTS
(Light winds?) -----Low Skill
AVN 19/12Z tau 24 20/2356Z
10S10S
20S
20S
In this case, poor model initialization combined with a lower skill nadir position, picks proper wind speed, but NO circulation center


SEA SURFACE TEMPERATURESEA SURFACE TEMPERATURE FROM 12-18 AUGUST 2001 FROM 12-18 AUGUST 2001

OCEANIC HEAT CONTENTOCEANIC HEAT CONTENT CLIMATOLOGY FOR AUGUSTCLIMATOLOGY FOR AUGUST

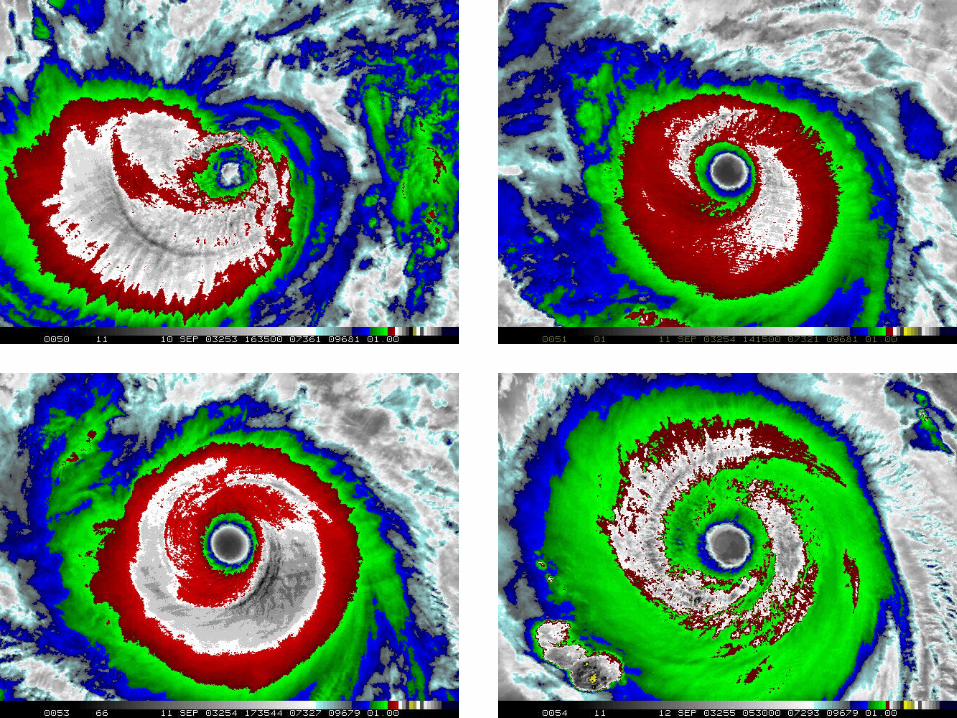
Microwave Images
DMSP SSMI – 85H Ghz
NOAA AMSU-B – 89 GhZ


MODIS (Moderate Resolution Imaging Spectroradiometer)
NASA Aqua and Terra
38-channel Imager, with Truecolor 250-m resolution
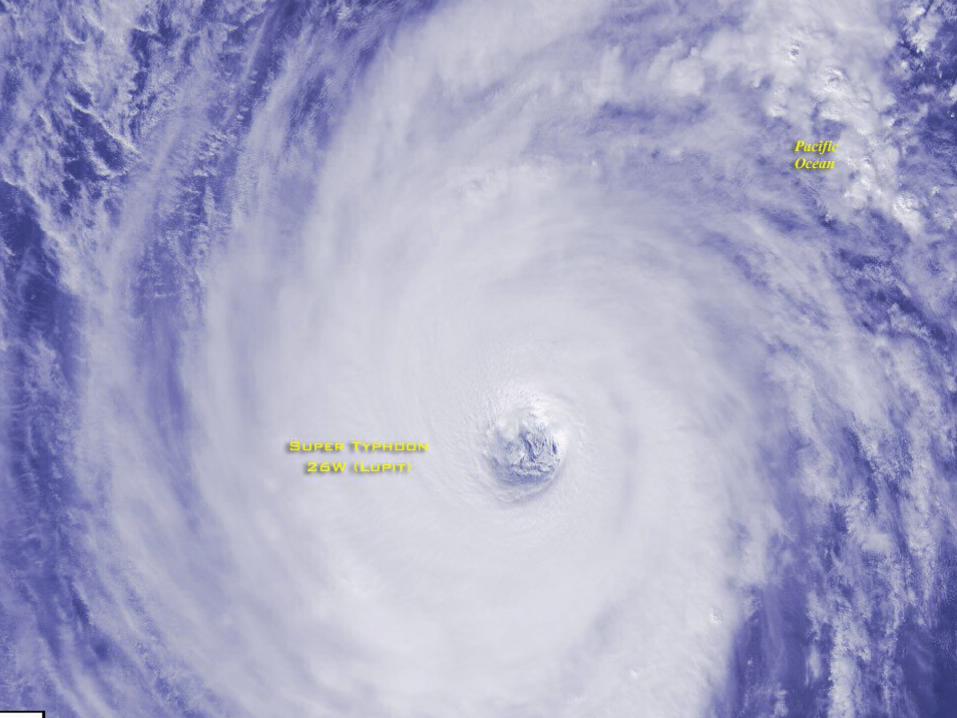
MODIS (Moderate Resolution Imaging Spectroradiometer)
-- NASA EOS Terra and Aqua
38-channel imager– Truecolor images at 250-m resolution


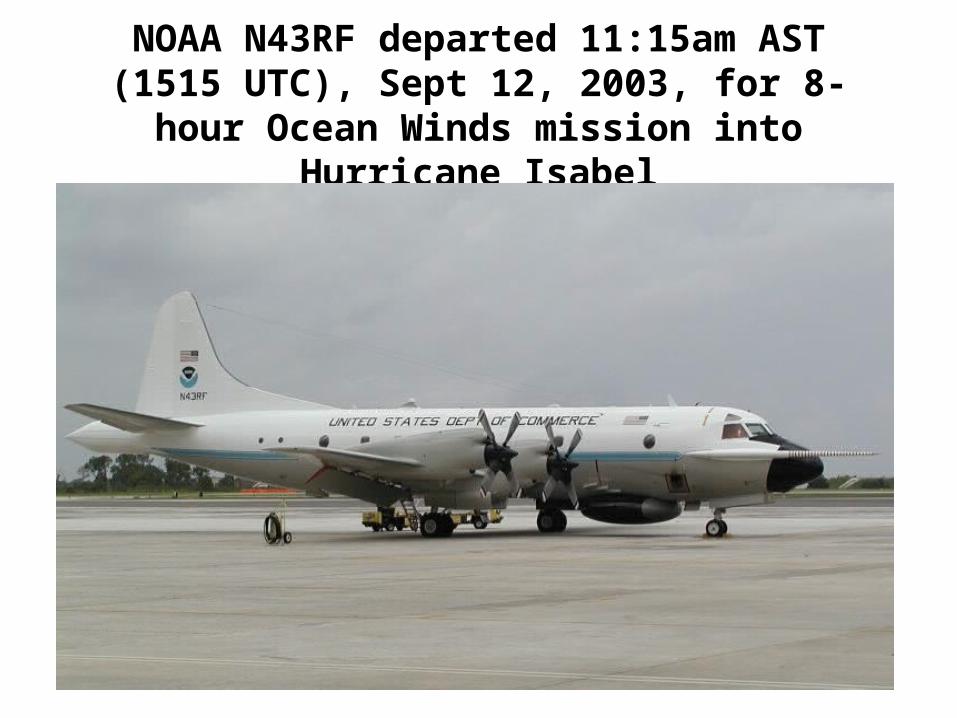
NOAA N43RF departed 11:15am AST (1515 UTC), Sept 12, 2003, for 8-hour Ocean Winds
mission into Hurricane Isabel
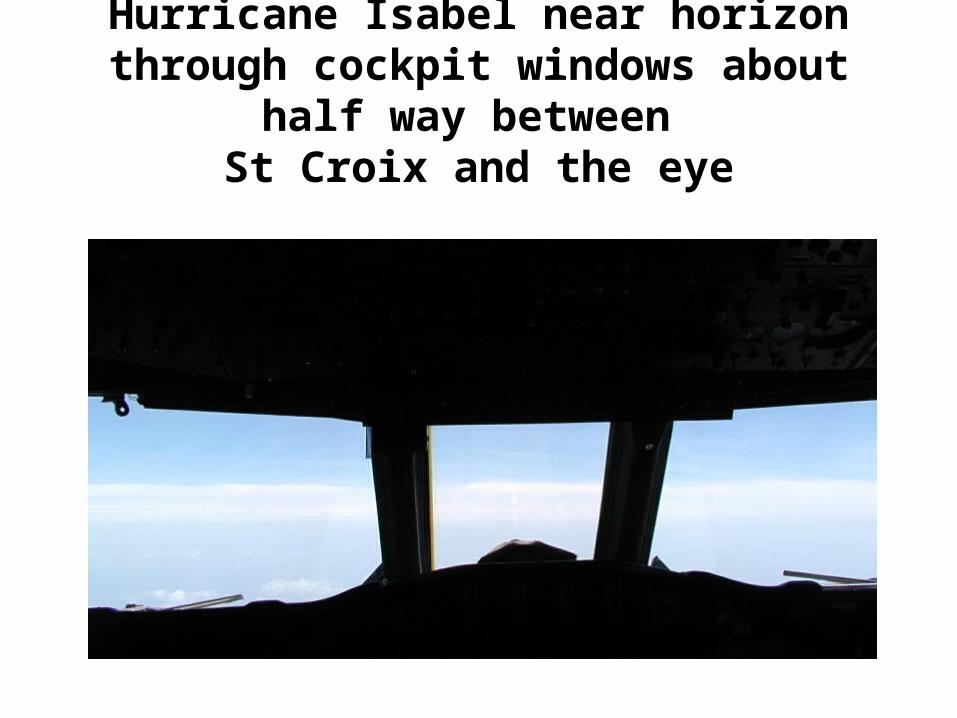
Hurricane Isabel near horizon through cockpit windows about half way between
St Croix and the eye

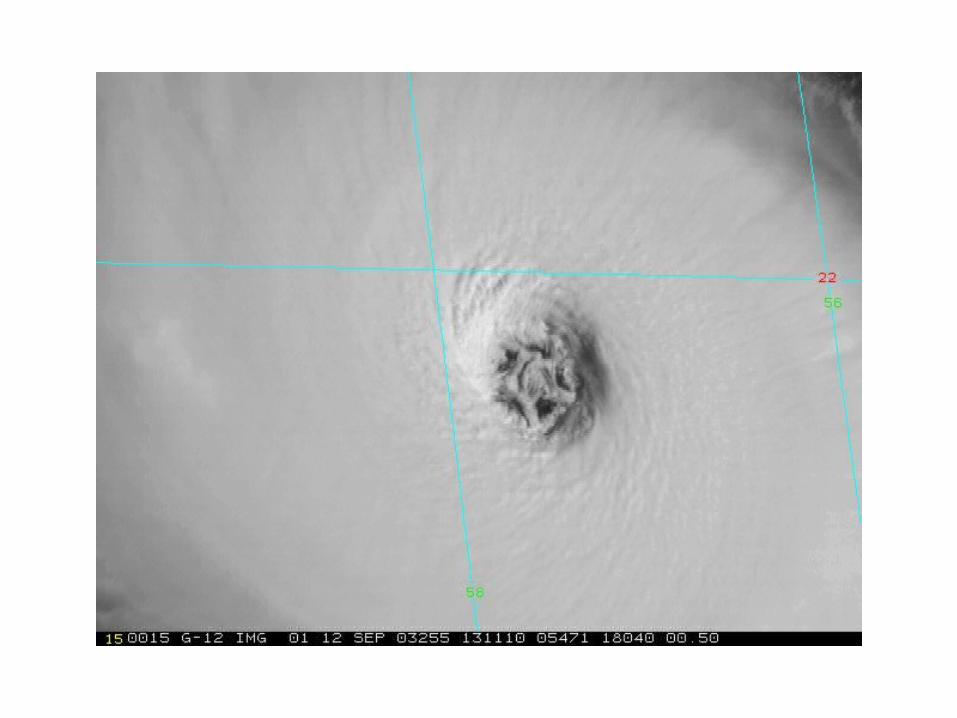
Hurricane ISABEL’s Eye – 12 Sep 03
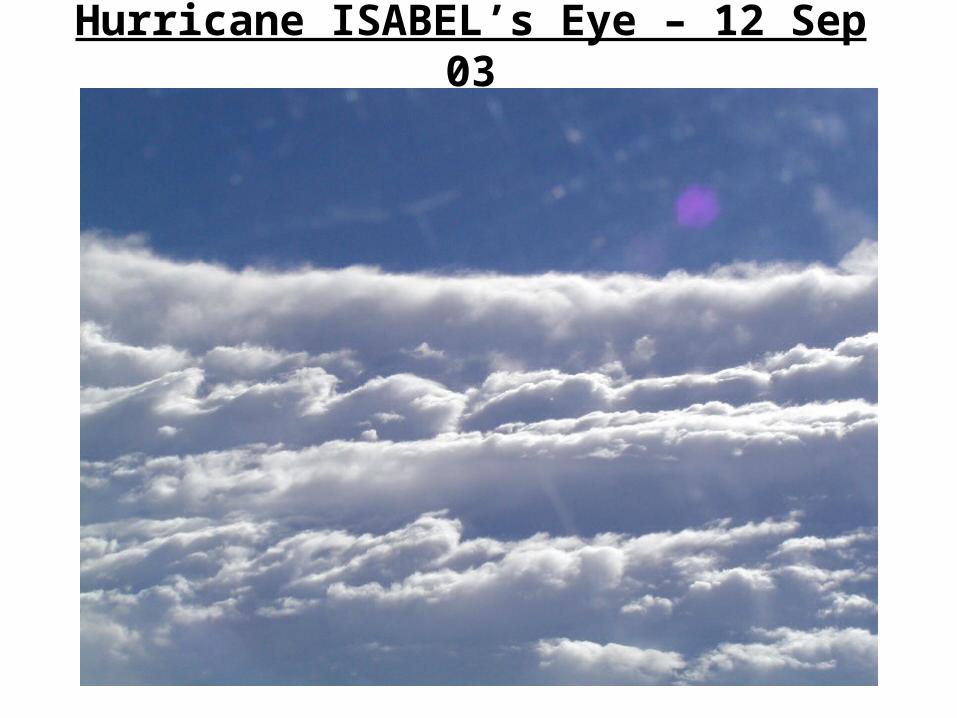
Hurricane ISABEL’s Eye – 12 Sep 03

INTRODUCTION
• Definition -- SUBTROPICAL CYCLONE• manifestation of “cut-off low” at the surface
– definition -- cut-off low -- cold low displaced equatorward of westerly flow
– occur in cool season – also called subtropical lows (Kona storms)– located in N. Pacific (15N to 35N -- 140W to 175E)
and N. Atlantic (15N to 35N -- 30W to 60W) – primarily during November to March

Vertical Profile of Temperature
• Tropical Cyclone -- warm core through the troposphere, except in the lowest 1-2 km– warm core is strongest in the upper
troposphere (~250 hPa), and over a broad area but very warm within the eye
• Easterly Waves and Monsoon Trough -- warm core in the upper troposphere, but cold core at lower levels (below ~600 hPa)
Vertical Temperature Profiles
• Subtropical Cyclone -- strong cold core in the upper/middle troposphere (~250-400 hPa) and weak cold core at lower levels– warm core above the strong cold core
• in the upper troposphere (~150-200 hPa), with a double tropopause structure ---------- OR ----------
• in the stratosphere, with a tropopause lowering

Vertical Temperature Profiles
• Tropical Upper Troposphere Trough -- TUTT -- is comprised of upper level cyclones (TUTT cells) -- same as subtropical cyclones, except that the temperature anomalies are much weaker– shallow cyclones, confined to upper levels– lower troposphere winds and pressures are
typically not influenced by TUTT cells above

Tangential Wind Profiles
• Tropical Cyclone -- strong, deep --maximum cyclonic wind at low-levels (1-2 km)
• Easterly Waves and Monsoon Trough -- weak, deep -- maximum cyclonic wind at mid-levels (~ 600 hPa)
Tangential Wind Profiles
• Subtropical Cyclone -- strong, deep -- maximum cyclonic wind at upper levels (~250 hPa)
• Tropical Upper Troposphere Trough -- weak, shallow -- maximum cyclonic wind at upper levels (~250 hPa)

Transition from Subtropical
• A few Tropical Cyclones originate from subtropical cyclones
• A few Subtropical Cyclones maintain subtropical characteristics but intensify to produce Storm Force winds (> 34 kt) (Subtropical Storm)
• During transition, a “hybrid” tropical storm has characteristics of both types

Terminology Clarifications
• The term “hybrid” is used to refer to a tropical cyclone that has originated not solely from “latent heat release” with a typical pre-existing tropical disturbance. This may involve baroclinic processes, as with extratropical cyclones, subtropical lows, etc.
• Other terms have been used for “hybrid” cyclone-- – half breed cyclone– neutercane– semitropical cyclone– intermediate cyclone

Terminology Clarifications
• Other tropical weather systems have been identified which may at times resemble or evolve into a “hybrid” cyclone– Monsoon Depressions– West African Cyclones– Arabian Sea Cyclones
– Tropical Cyclones in Extratropical Transition

Extratropical Transition
• Extratropical: • A term used in advisories and tropical summaries to
indicate that a cyclone has lost its "tropical" characteristics. The term implies both poleward displacement of the cyclone and the conversion of the cyclone's primary energy source from the release of latent heat of condensation to baroclinic (the temperature contrast between warm and cold air masses) processes. It is important to note that cyclones can become extratropical and still retain wind of hurricane or tropical storm force.

The Hebert-Poteat Subtropical Cyclone
Technique
The Hebert-Poteat Subtropical Cyclone
Technique
NATIONAL HURRICANE CENTER
NATIONAL HURRICANE CENTER
JACK BEVENJACK BEVEN
WHERE AMERICA’S CLIMATE AND WEATHER SERVICES BEGINWHERE AMERICA’S CLIMATE AND WEATHER SERVICES BEGIN

What is the Hebert-Poteat Technique?
• A pattern-matching method of estimating the intensity of subtropical cyclones
• A compliment to the Dvorak technique

Similarities Between Hebert-Poteat and Dvorak
• Both techniques use convective overcast• Both techniques use the distance of the
Cloud System Center (CSC) from the overcast• ST cloud features are selected so that ST-
Numbers correspond to T-Numbers if the cyclone becomes tropical
• Both techniques assume modeled development of the cyclone, with the T or ST numbers normally changing by 1.0 per day
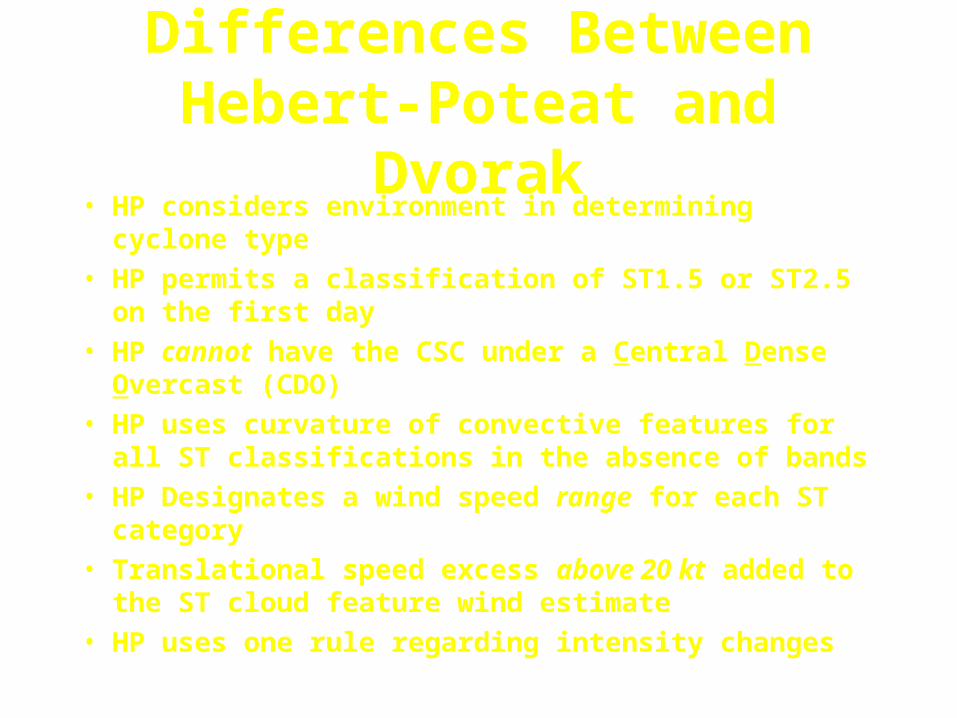
Differences Between Hebert-Poteat and Dvorak
• HP considers environment in determining cyclone type
• HP permits a classification of ST1.5 or ST2.5 on the first day
• HP cannot have the CSC under a Central Dense Overcast (CDO)
• HP uses curvature of convective features for all ST classifications in the absence of bands
• HP Designates a wind speed range for each ST category
• Translational speed excess above 20 kt added to the ST cloud feature wind estimate
• HP uses one rule regarding intensity changes
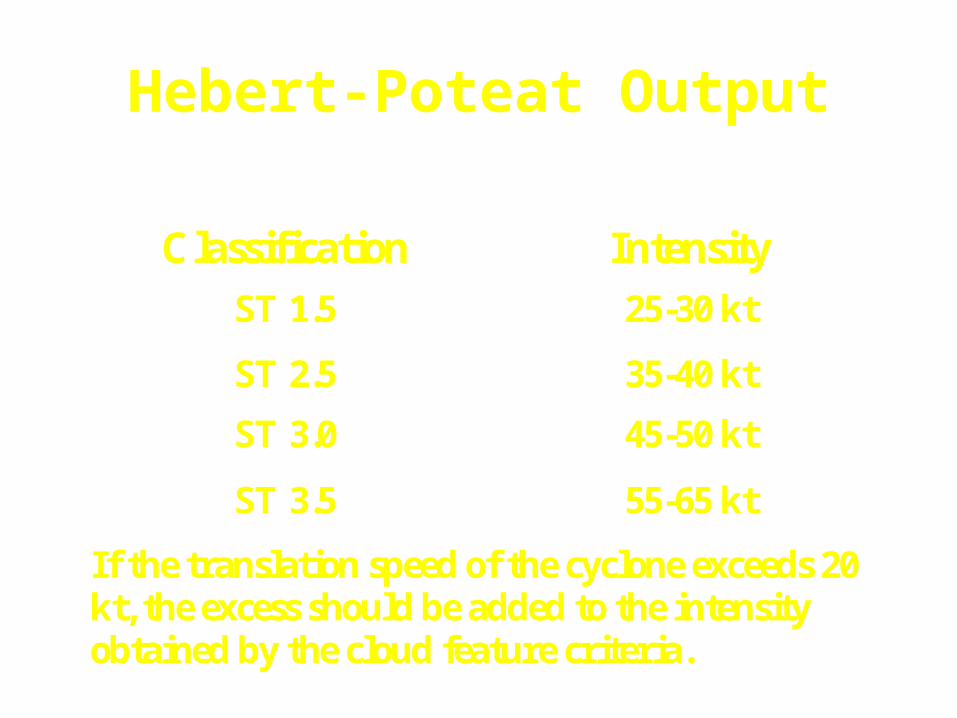
Hebert-Poteat Output
Classification Intensity
ST 1.5 25-30 kt
ST 2.5 35-40 kt
ST 3.0 45-50 kt
ST 3.5 55-65 kt
If the translation speed of the cyclone exceeds 20kt, the excess should be added to the intensityobtained by the cloud feature criteria.
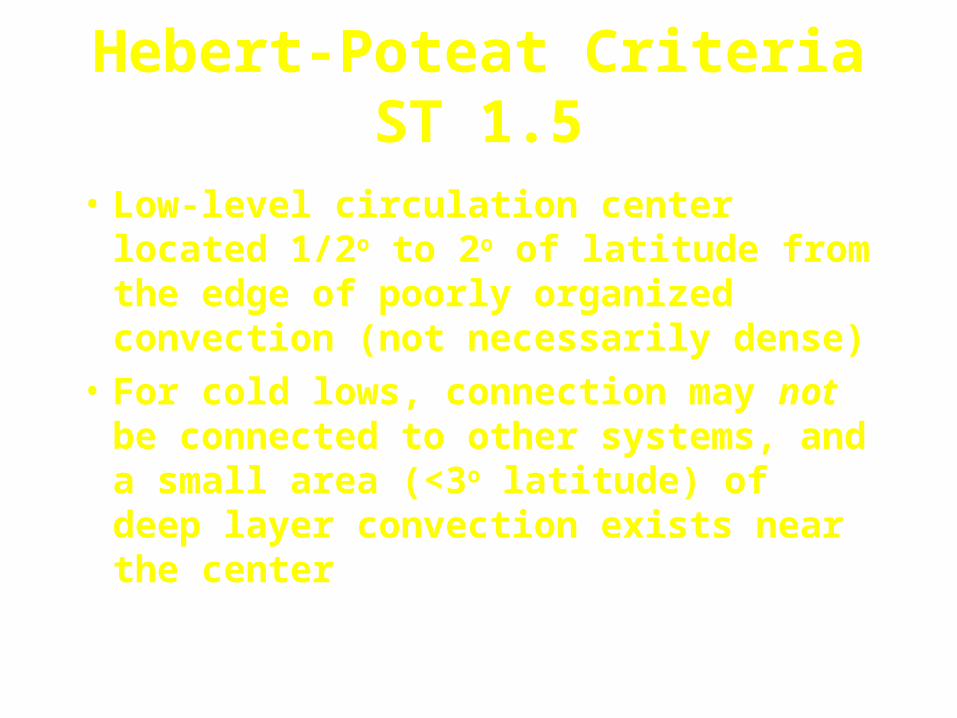
Hebert-Poteat CriteriaST 1.5
• Low-level circulation center located 1/2o to 2o of latitude from the edge of poorly organized convection (not necessarily dense)
• For cold lows, connection may not be connected to other systems, and a small area (<3o latitude) of deep layer convection exists near the center

Hebert-Poteat CriteriaST 2.5
• Low-level circulation center located 1/2o to 2o from increased deep-layer convection (not necessarily dense) with greater curvature of broad cloud lines or bands than on the previous day
• Outer convective band 5o-10o east of the center, and possibly another convective band 2o-4o west-north of the center
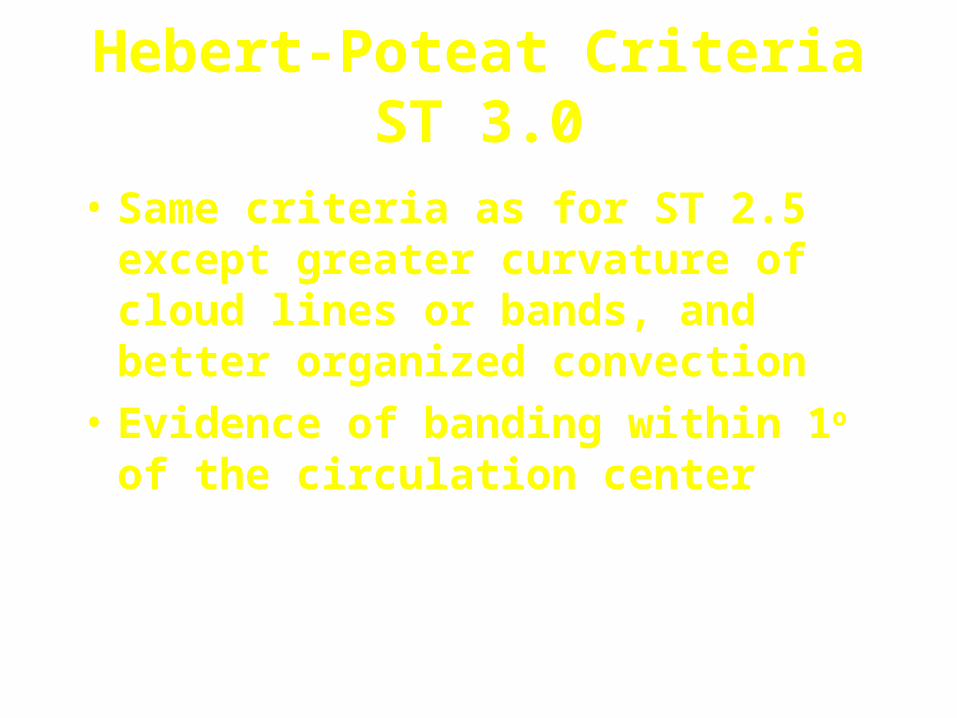
Hebert-Poteat CriteriaST 3.0
• Same criteria as for ST 2.5 except greater curvature of cloud lines or bands, and better organized convection
• Evidence of banding within 1o of the circulation center

Hebert-Poteat CriteriaST 3.5
• Deep-layer convection (frequently dense overcast) in band(s) 1o-3o from the center (no CDO)
• Outer convective band 5o-10o to the east weaker than for ST 3.0, but new band may form 5o-10o west of the center
• For systems moving rapidly eastward, there may be only a dense overcast ( 3o latitude) about 2o-4o east of the center
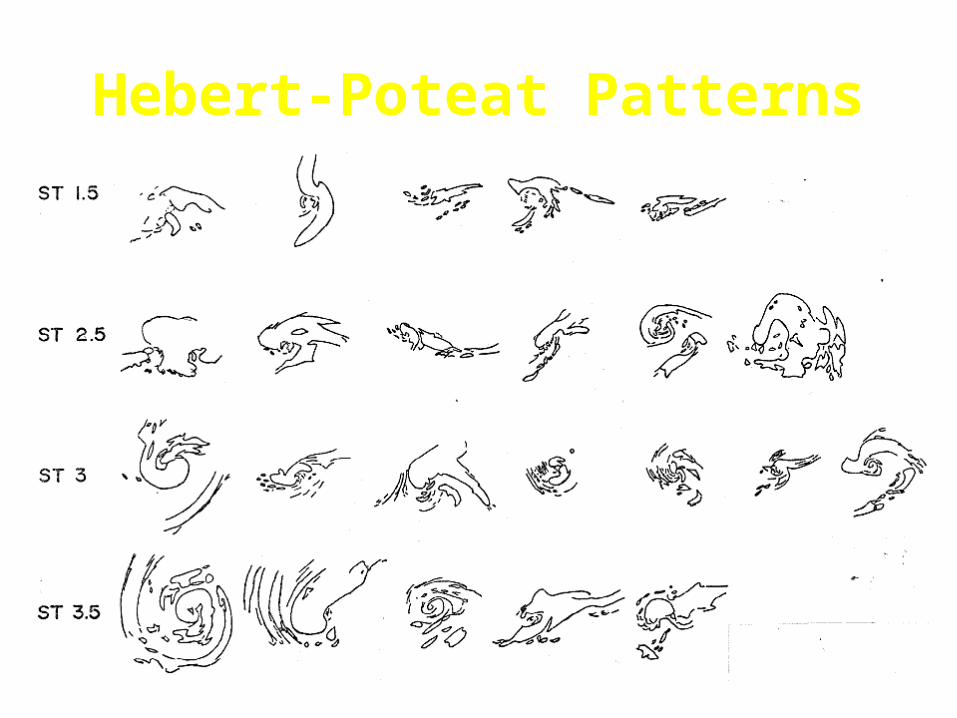
Hebert-Poteat Patterns
Related Documents