Overview of Statistics and Error Analysis Prof. Carol Tanner September 17, 2013 1 Tuesday, September 17, 2013

Welcome message from author
This document is posted to help you gain knowledge. Please leave a comment to let me know what you think about it! Share it to your friends and learn new things together.
Transcript

Overview of Statistics and Error Analysis
Prof. Carol TannerSeptember 17, 2013
1Tuesday, September 17, 2013
When do we use a statistical approach to
data analysis?When we have taken lots of data.
Typically when we have measured something lots of times(more than once).
2Tuesday, September 17, 2013

Some Useful Books
• “Data Reduction and Error Analysis for the Physical Sciences,” third Ed. P. R. Bevington and D. K. Robinson, McGraw-Hill Higher Ed.
• “Data Analysis with Excel an Introduction for Physical Scientists,” L. Kirkup, Cambridge University Press.
• “An Introduction to Error Analysis,” J.R. Taylor, Oxford University Press.
3Tuesday, September 17, 2013

Statistics:Basic Definitions
Typical parameters used to statistically quantify data.
4Tuesday, September 17, 2013

Sample Parameters✴Sample - multiple measurements of
the same thing assumed to be a random subset of the parent population.
• Sample Mean (Average)
• Deviation of ith value
• Sample Variance
• Standard Deviation
X1,…,Xn{ }
X = 1n
Xii=1
n
∑
sX2 = 1
n −1Xi − X( )2
i=1
n
∑
n = number of measurements
sX = sX2
di = Xi − X d = 1n
(Xi − X)i=1
n
∑ = 0
Data
5Tuesday, September 17, 2013
What value do we give as our final answer?How do we quantify the spread in values?Note that the sum of deviations equals zero.Note that the mean of deviations is zero.The variance contains the sum of squares of the deviations and is a good measure of the spread of the measurements.Standard deviation is the square root of the variance and has the same units as the mean.

How do we visualize data?
25
50
75
100
Value (Unit)
Histogram of Values
Cou
nt
trial Value (Unit)1 X1
2 X2
3 X3
4 X4
5 X5
. .
. .
. .n Xn
Graph (Chart)Measured Values
Table
X − sX X X + sX
6Tuesday, September 17, 2013
Tables and plots are typical ways of visualizing the data.Titles, labeled columns and axes with units.A histogram is always help full for more than a few data points.Both when possible. When the sample is large it is not always practical to include all of the data in a table.If the table is longer that a page put it in an appendix.If the table is longer that a few pages it is not practical to list all of the data in a table, but an example of a few pages would be acceptable.

Why are these parameters so important?
• The mean is the best estimate of the “true value.”
• The standard deviation of the data is the best estimate of the “uncertainty in a single measurement.”
• The standard deviation of the data is the best estimate of the “the parent standard deviation.”
7Tuesday, September 17, 2013

Parent Population Parameters
✴Parent Population - hypothetical infinite set of ideal measurements of the same thing.
• Parent Mean
• Parent Variance
• Parent Standard Deviation
limn→∞
X1,…,Xn{ }
µX = limn→∞
1n
Xii=1
n
∑
σ X2 = lim
n→∞
1n
Xi − µX( )2i=1
n
∑σ X = σ X
2
Sometimes these parameters are called the “true values” that would be obtained if we could make an infinite number of ideal measurements.
8Tuesday, September 17, 2013

Parent Distribution✴Probability Distribution-
probability density function describing the parent population from which it is assumed the data are chosen.
• Normalization
• Expectation Value of f(x)
• Mean (True Value)
• Variance
• Parent Standard Deviation
µ = xP(x)dx∫σ 2 = (x − µ)2P(x)dx∫
σ = σ 2
P(x) has units of probability per unit x.
P(x)dx∫ = 1
f (x) = f (x)P(x)dx∫
9Tuesday, September 17, 2013
X1,…,Xn{ } X = 1n
Xii=1
n
∑
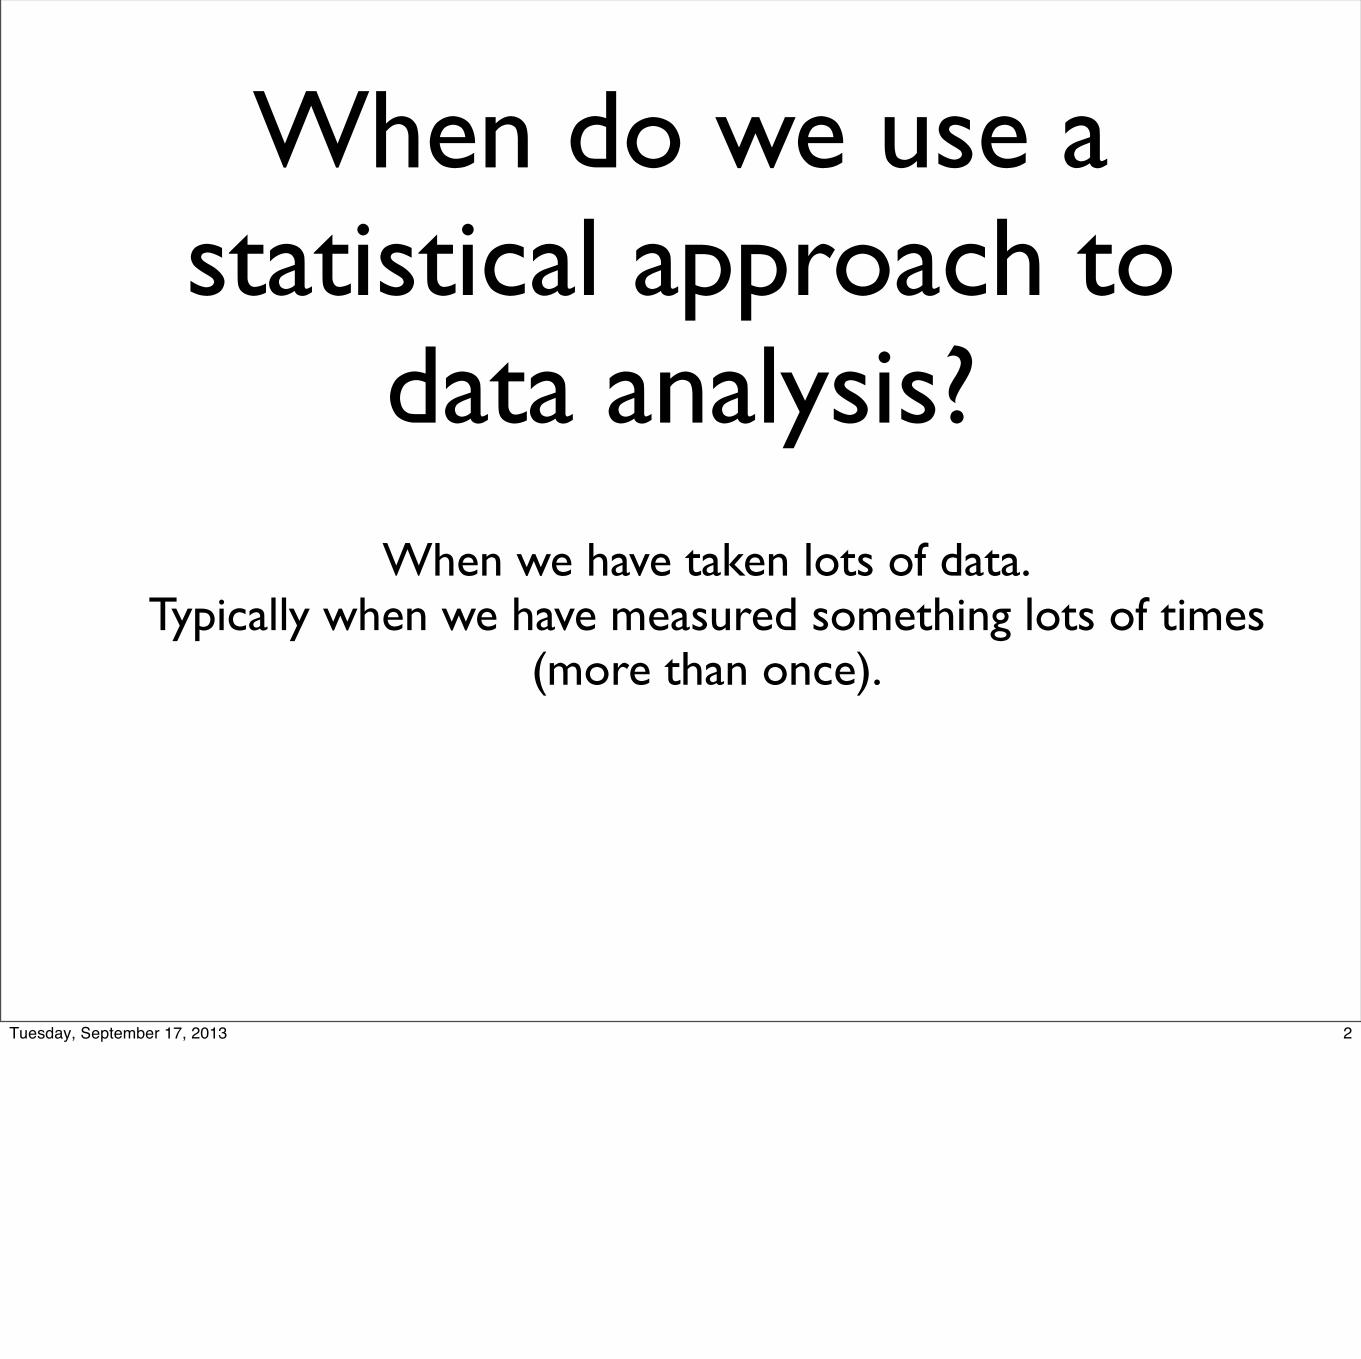
P(x)50% 50%
Max MedianMean
How can we characterize symmetry from the data?
µ = xP(x)dx∫
Skewness =
1n
Xi − X( )3i=1
n
∑1n
Xi − X( )2i=1
n
∑⎛⎝⎜
⎞⎠⎟
3/2Kurtosis =
1n
Xi − X( )4i=1
n
∑1n
Xi − X( )2i=1
n
∑⎛⎝⎜
⎞⎠⎟
4/2 − 3
Sample Variance = 1n −1
Xi − X( )2
i=1
n
∑
In general probability distributions can have just about any shape and are not necessarily symmetric “bell-shaped” curves.
x
10Tuesday, September 17, 2013
The probability of obtaining a particular value of x is described by a function, P(x), call the probability distribution function with units of probability per unit x.It does not have to be symmetric.
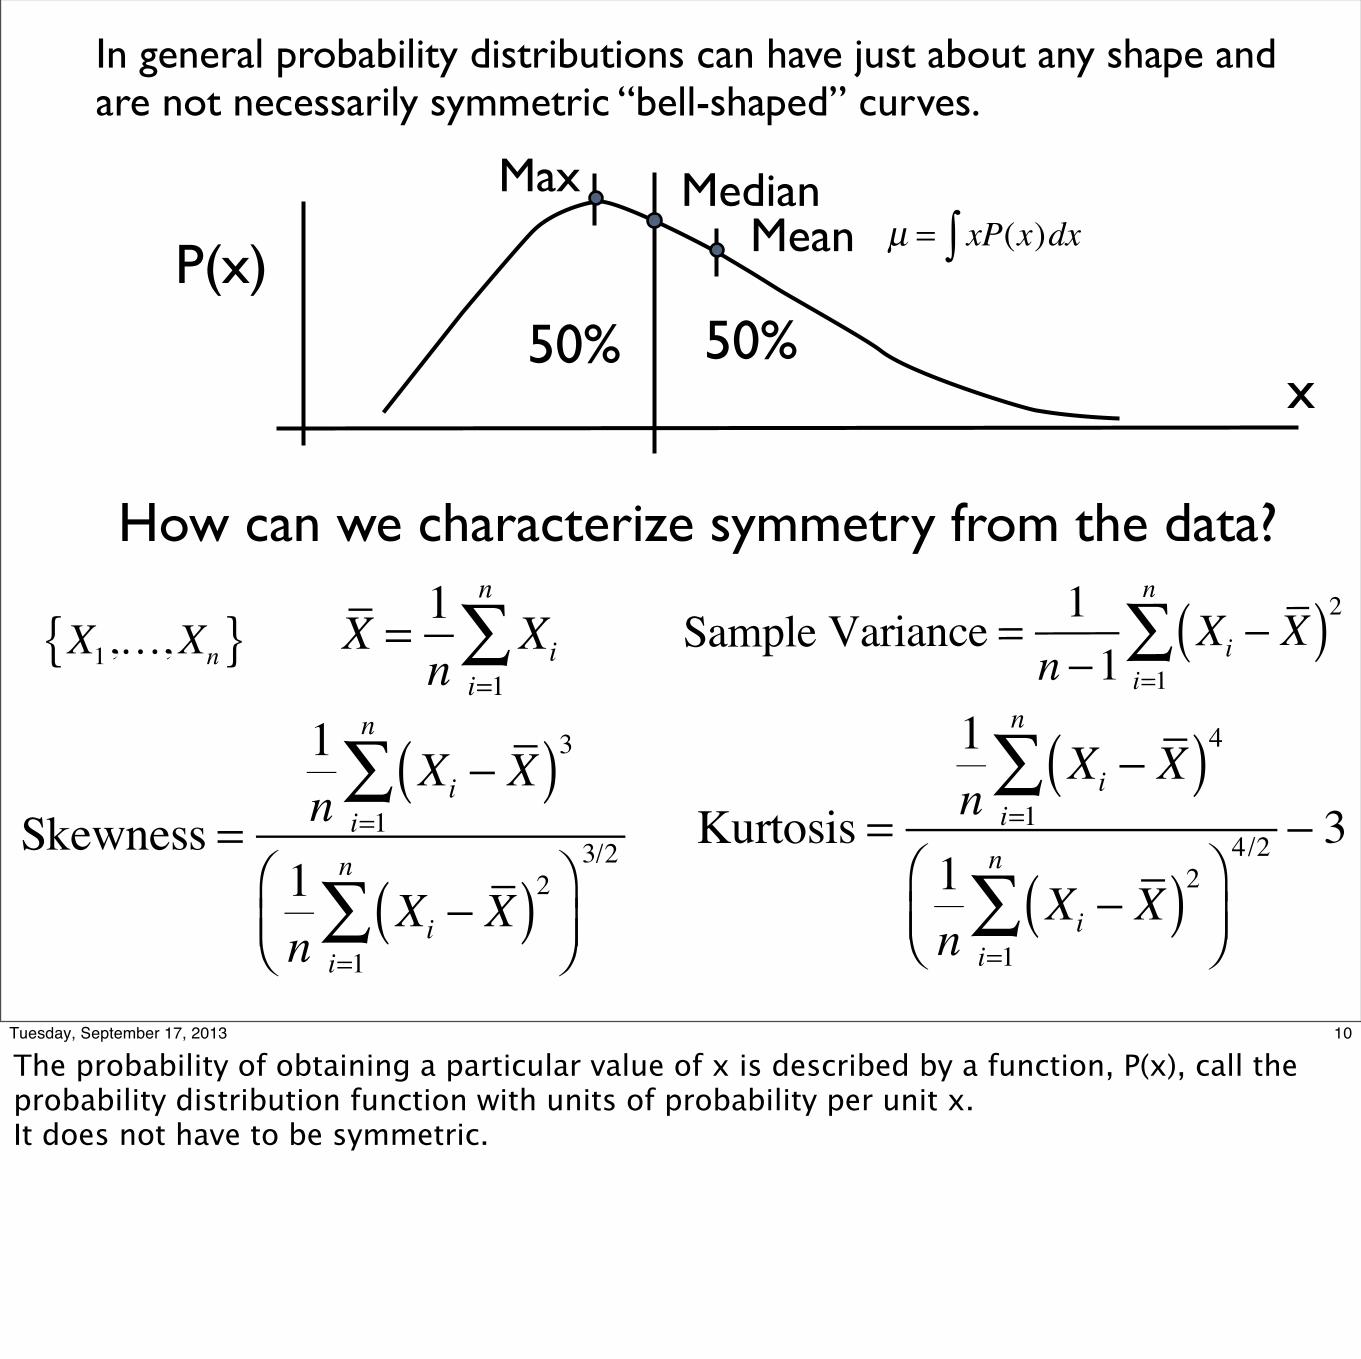
Common Distributions
• Binomial Distribution
• Poisson Distribution
• Normal Distribution (Gaussian)
• Log-normal Distribution
• Lorentz Distribution
• Exponential Distribution
P(x) = 1σ 2π
e−12
x−µσ
⎛⎝⎜
⎞⎠⎟2
P(t) = 1τe− tτ
Gaussian Distribution-Random Fluctuationsabout an “true value”
Exponential-Radioactive Lifetime
11Tuesday, September 17, 2013

Normal Distribution“...if a measurement is subject to many small sources of random error and negligible systematic error then the measured values will be distributed on a bell-shaped curve, and ... this curve will be centered on the ‘true value’....” p. 109 J.R. Taylor, “An Introduction to Error Analysis,” Oxford Univ. Press 1982
P(x) = 1σ 2π
e−12
x−µσ
⎛⎝⎜
⎞⎠⎟2
�2 2 4 6
0.1
0.2
0.3
0.4
µ = 2σ = 1
P(x)dx−∞
+∞
∫ = 1
P(x)dxµ−σ
µ+σ
∫ = 0.682689
P(x)dx−∞
µ−σ
∫ = 0.158655
P(x)dxµ+σ
+∞
∫ = 0.158655
µ +σµ −σ µ
µ ±σ
68% Confidence Level
12Tuesday, September 17, 2013
68% confidence level
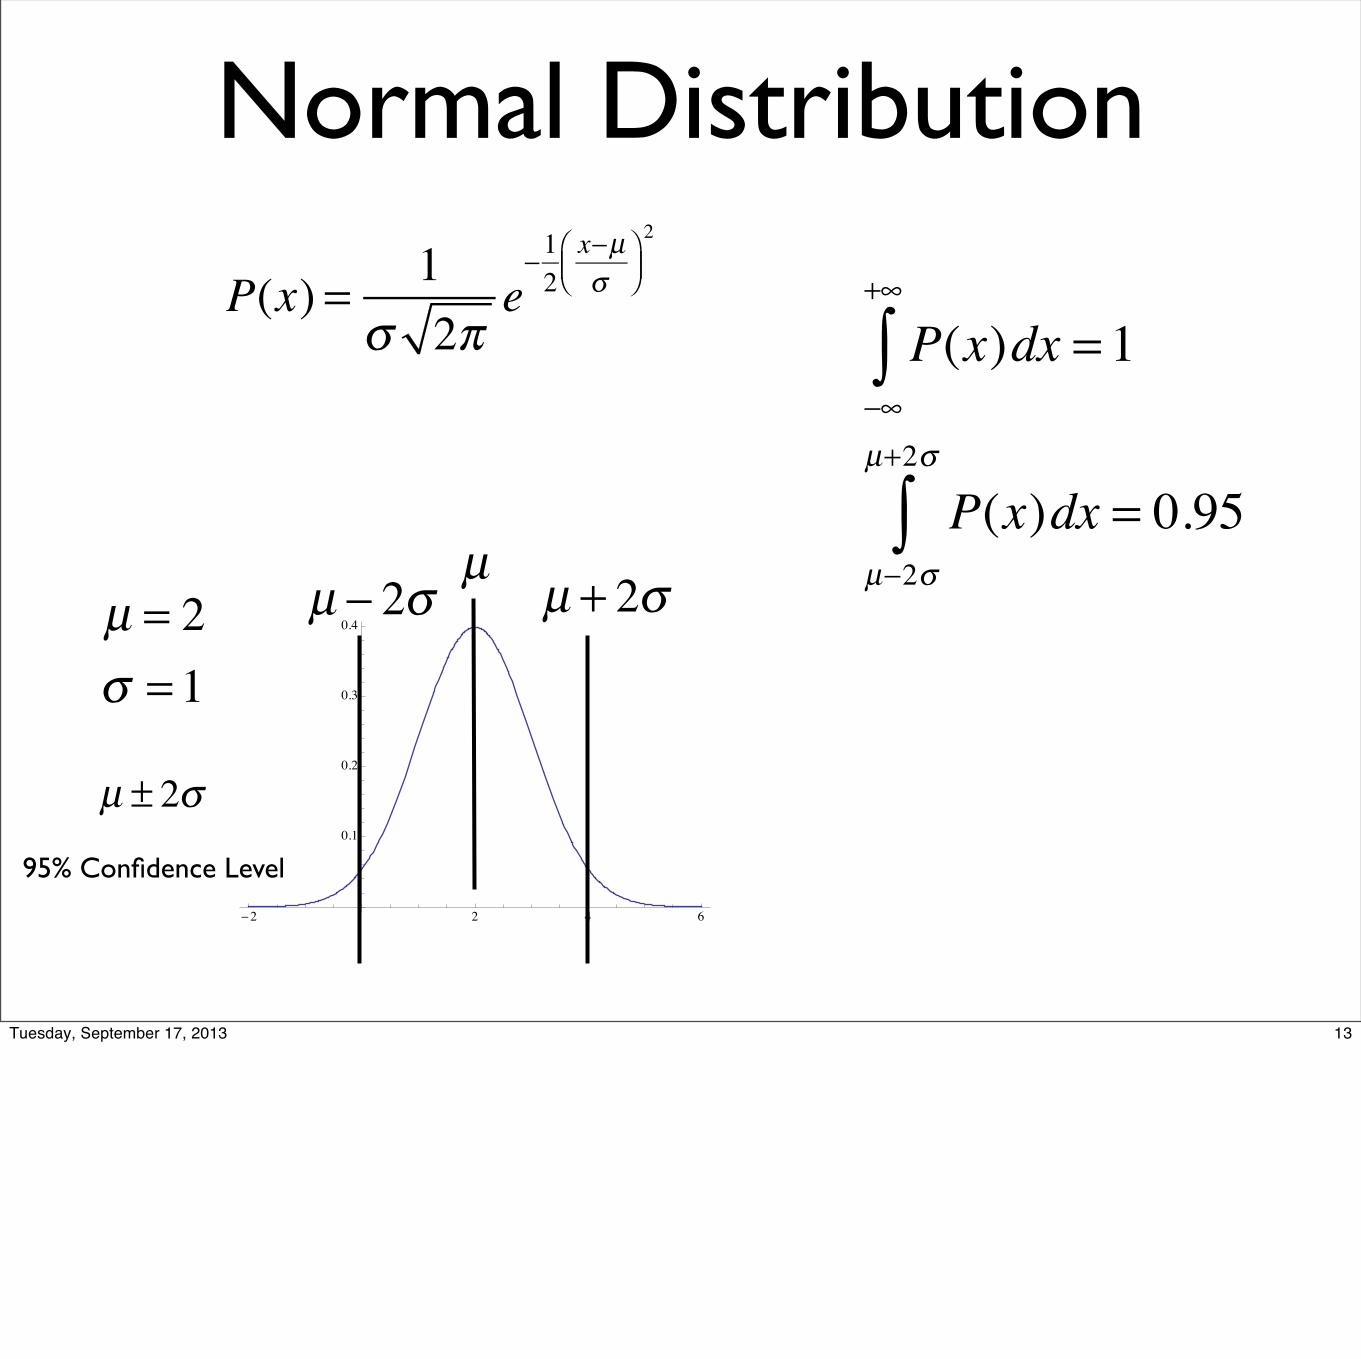
Normal Distribution
P(x) = 1σ 2π
e−12
x−µσ
⎛⎝⎜
⎞⎠⎟2
�2 2 4 6
0.1
0.2
0.3
0.4µ = 2σ = 1
P(x)dx−∞
+∞
∫ = 1
P(x)dxµ−2σ
µ+2σ
∫ = 0.95µ + 2σµ − 2σ
µ
µ ± 2σ
95% Confidence Level
13Tuesday, September 17, 2013
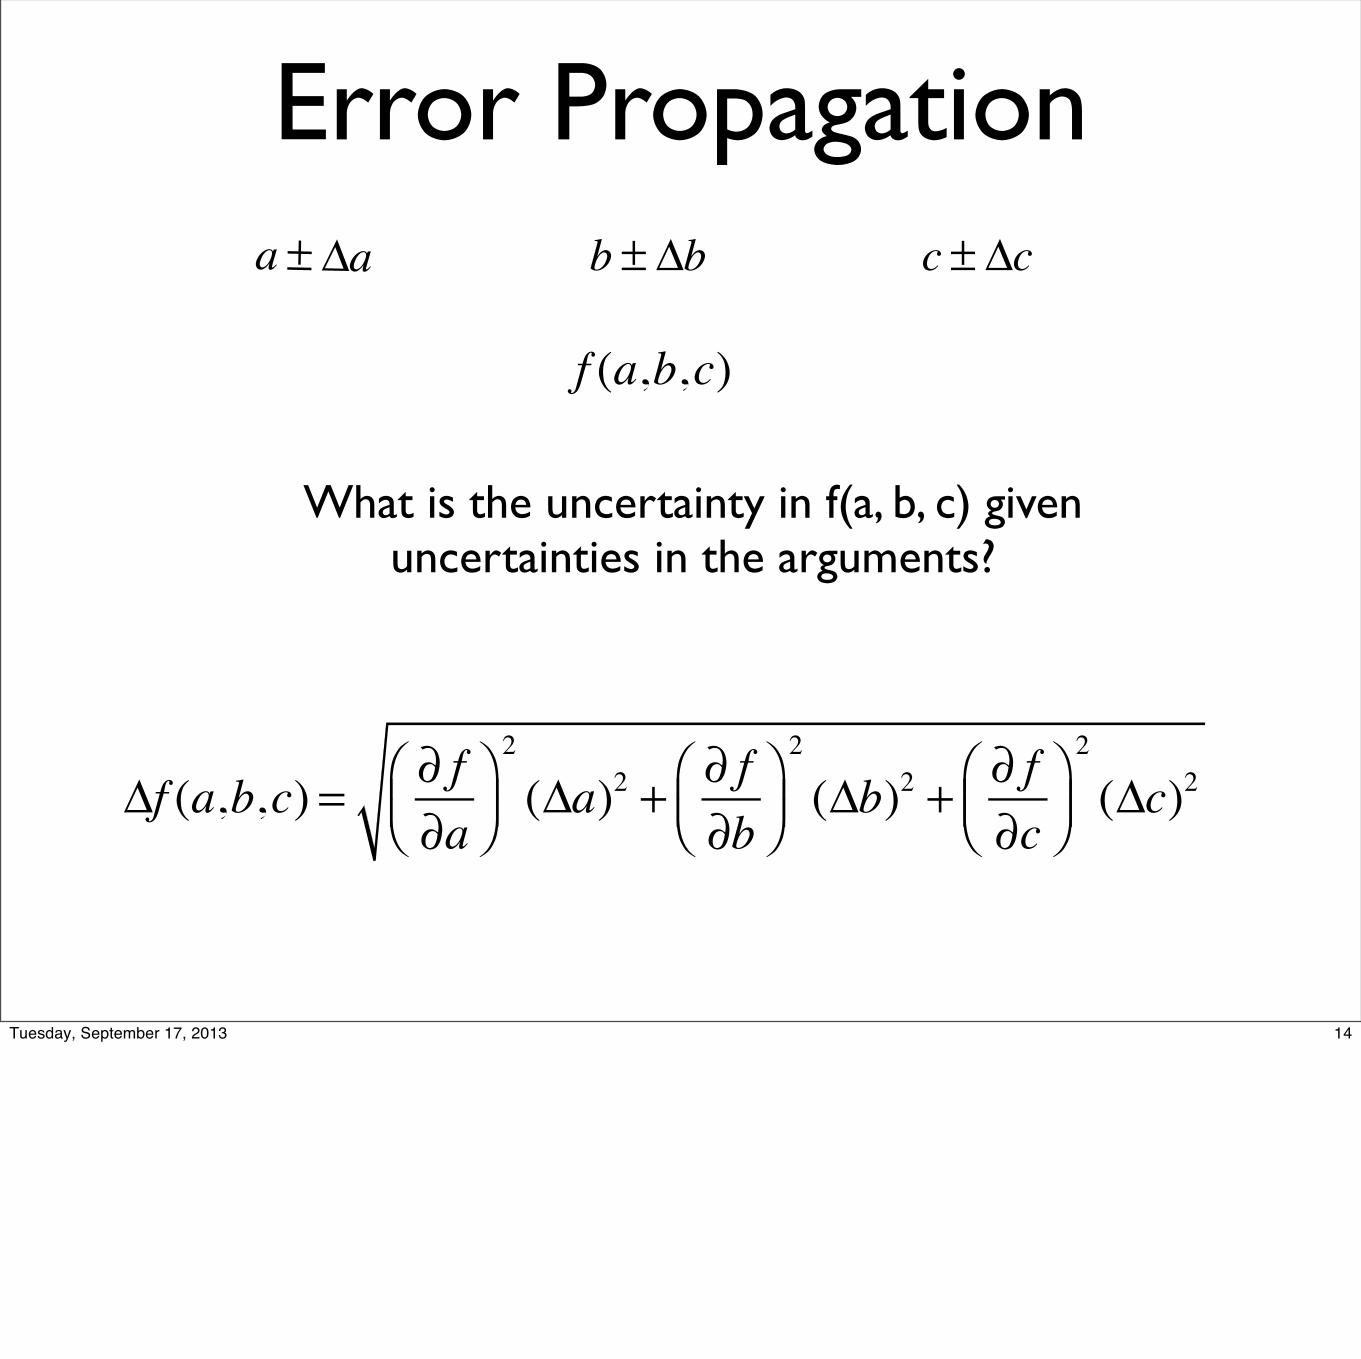
Error Propagationa ± Δa b ± Δb c ± Δc
Δf (a,b,c) = ∂ f∂a
⎛⎝⎜
⎞⎠⎟2
(Δa)2 + ∂ f∂b
⎛⎝⎜
⎞⎠⎟2
(Δb)2 + ∂ f∂c
⎛⎝⎜
⎞⎠⎟2
(Δc)2
f (a,b,c)
What is the uncertainty in f(a, b, c) given uncertainties in the arguments?
14Tuesday, September 17, 2013

You derive what you need.
ab
a + b a + b + c
a + bc
ab
ab+ c
...etc.
15Tuesday, September 17, 2013

What is the uncertainty in the mean?
X1,…,Xn{ } X = 1n
Xii=1
n
∑ sX2 = 1
n −1Xi − X( )2
i=1
n
∑ sX = sX2
Xi ± si
X = f (X1,X2 ,X3,…) =
1n
Xii=1
n
∑ ΔX = ?
Single measurement
∂X∂X1
= 1n
, ∂X∂X2
= 1n
, ∂X∂Xi
= 1n
ΔX = 1
n⎛⎝⎜
⎞⎠⎟2
s1( )2 + 1n
⎛⎝⎜
⎞⎠⎟2
s2( )2 +…1n
⎛⎝⎜
⎞⎠⎟2
sn( )2 = 1n
⎛⎝⎜
⎞⎠⎟2
sX( )2 n
si = sX
ΔX = sXn
“Uncertainty in the mean” or“Standard error in the mean”
16Tuesday, September 17, 2013
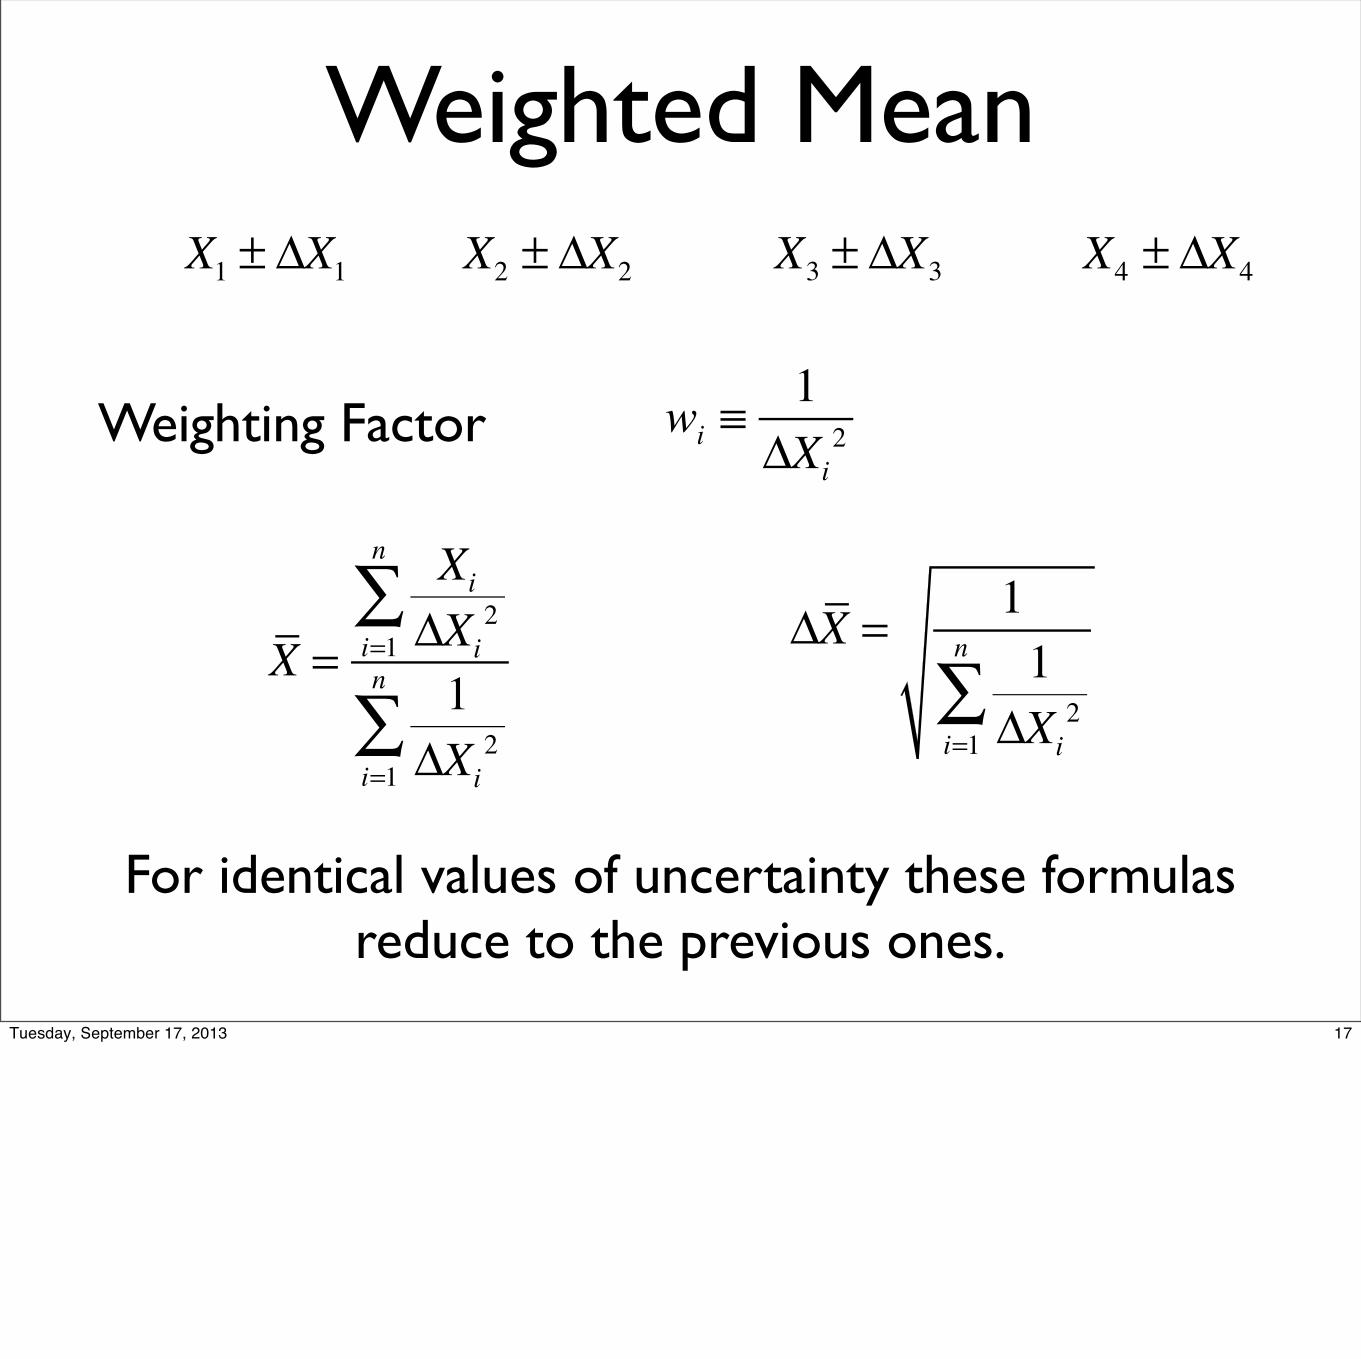
Weighted MeanX1 ± ΔX1 X2 ± ΔX2 X3 ± ΔX3 X4 ± ΔX4
wi ≡1
ΔXi2
X =
Xi
ΔXi2
i=1
n
∑1
ΔXi2
i=1
n
∑ΔX = 1
1ΔXi
2i=1
n
∑
Weighting Factor
For identical values of uncertainty these formulas reduce to the previous ones.
17Tuesday, September 17, 2013

Stay tuned for a Mathematica Demo.
Next time:The principle of maximum likely hood.
18Tuesday, September 17, 2013
Related Documents