19 Overview of Real-Time PCR Principles Morteza Seifi 1,* , Asghar Ghasemi 1 , Siamak Heidarzadeh 2 , Mahmood Khosravi 3 , Atefeh Namipashaki 4 , Vahid Mehri Soofiany 5 , Ali Alizadeh Khosroshahi 6 and Nasim Danaei 7 1 Laboratory of Genetics, Legal Medicine Organization of Tabriz, Tabriz, 2 Division of Microbiology, School of Public Health, Tehran University of Medical Sciences, Tehran, 3 Hematology Department of Medicine Faculty, Guilan University of Medical Sciences, Rasht, 4 Department of Biotechnology, School of Allied Medical Sciences, Tehran University of Medical Sciences, Tehran, 5 Faculty of Medicine, Shahid Behesti University of Medical Sciences, Tehran, 6 Jarrah Pasha Medicine Faculty of Istanbul, Istanbul, 7 Department of Health and Nutrition, Tabriz University of Medical Sciences, Tabriz 1,2,3,4,5,7 Iran 6 Turkey 1. Introduction Real-time PCR is based on the revolutionary method of PCR, developed by Kary Mullis in the 1980s, which allows researchers to amplify specific pieces of DNA more than a billion- fold (Saiki, Scharf et al. 1985; Mullis and Faloona 1987; Mullis 1990). PCR-based strategies have propelled molecular biology forward by enabling researchers to manipulate DNA more easily, thereby facilitating both common procedures, such as cloning, and huge endeavors such as the Human Genome Project (Olson, Hood et al. 1989; Ausubel, Brent et al. 2005). Real-time PCR represents yet another technological leap forward that has opened up new and powerful applications for researchers throughout the world. This is in part because the enormous sensitivity of PCR has been coupled to the precision afforded by “real-time” monitoring of PCR products as they are generated (Valasek and Repa 2005). Higuchi and co-workers (Higuchi, Dollinger et al. 1992; Higuchi, Fockler et al. 1993) at Roche Molecular Systems and Chiron accomplished the first demonstration of real-time PCR. By including a common fluorescent dye called ethidium bromide (EtBr) in the PCR and running the reaction under ultraviolet light, which causes EtBr to fluoresce, they could visualize and record the accumulation of DNA with a video camera. It has been known since 1966 that EtBr increases its fluorescence upon binding of nucleic acids (Le Pecq and Paoletti 1966), but only by combining this fluorescent chemistry with PCR and real-time videography could real-time PCR be born as it was in the early 1990s. Subsequently, this * Corresponding Author www.intechopen.com

Welcome message from author
This document is posted to help you gain knowledge. Please leave a comment to let me know what you think about it! Share it to your friends and learn new things together.
Transcript

19
Overview of Real-Time PCR Principles
Morteza Seifi1,*, Asghar Ghasemi1, Siamak Heidarzadeh2, Mahmood Khosravi3, Atefeh Namipashaki4, Vahid Mehri Soofiany5,
Ali Alizadeh Khosroshahi6 and Nasim Danaei7 1Laboratory of Genetics, Legal Medicine Organization of Tabriz, Tabriz,
2Division of Microbiology, School of Public Health, Tehran University of Medical Sciences, Tehran,
3Hematology Department of Medicine Faculty, Guilan University of Medical Sciences, Rasht, 4Department of Biotechnology, School of Allied Medical Sciences,
Tehran University of Medical Sciences, Tehran, 5Faculty of Medicine, Shahid Behesti University of Medical Sciences, Tehran,
6Jarrah Pasha Medicine Faculty of Istanbul, Istanbul, 7Department of Health and Nutrition, Tabriz University of Medical Sciences, Tabriz
1,2,3,4,5,7Iran 6Turkey
1. Introduction
Real-time PCR is based on the revolutionary method of PCR, developed by Kary Mullis in
the 1980s, which allows researchers to amplify specific pieces of DNA more than a billion-
fold (Saiki, Scharf et al. 1985; Mullis and Faloona 1987; Mullis 1990). PCR-based strategies
have propelled molecular biology forward by enabling researchers to manipulate DNA
more easily, thereby facilitating both common procedures, such as cloning, and huge
endeavors such as the Human Genome Project (Olson, Hood et al. 1989; Ausubel, Brent et al.
2005). Real-time PCR represents yet another technological leap forward that has opened up
new and powerful applications for researchers throughout the world. This is in part because
the enormous sensitivity of PCR has been coupled to the precision afforded by “real-time”
monitoring of PCR products as they are generated (Valasek and Repa 2005).
Higuchi and co-workers (Higuchi, Dollinger et al. 1992; Higuchi, Fockler et al. 1993) at
Roche Molecular Systems and Chiron accomplished the first demonstration of real-time
PCR. By including a common fluorescent dye called ethidium bromide (EtBr) in the PCR
and running the reaction under ultraviolet light, which causes EtBr to fluoresce, they could
visualize and record the accumulation of DNA with a video camera. It has been known
since 1966 that EtBr increases its fluorescence upon binding of nucleic acids (Le Pecq and
Paoletti 1966), but only by combining this fluorescent chemistry with PCR and real-time
videography could real-time PCR be born as it was in the early 1990s. Subsequently, this
* Corresponding Author
www.intechopen.com

Polymerase Chain Reaction
406
technology quickly matured into a competitive market, becoming commercially widespread
and scientifically influential (Valasek and Repa 2005).
Real-time PCR instrumentation was first made commercially available by Applied Biosystems in 1996, after which several other companies added new machines to the market. Presently, Applied Biosystems, BioGene, Bioneer, Bio-Rad, Cepheid, Corbett Research, Idaho Technology, MJ Research, Roche Applied Science, and Stratagene all offer instrumentation lines for real-time PCR (BioInformatics 2003).
Widespread use has also resulted in a multiplicity of names for the technology, each with a different shade of meaning. Real-time PCR simply refers to amplification of DNA (by PCR) that ismonitored while the amplification is occurring. The benefit of this real-time capability is that it allows the researcher to better determine the amount of starting DNA in the sample before the amplification by PCR. Present day real-time methods generally involve fluorogenic probes that “light up” to show the amount of DNA present at each cycle of PCR. “Kinetic PCR” refers to this process as well. “Quantitative PCR” refers to the ability to quantify the starting amount of a specific sequence of DNA. This term predates real-time PCR because it can refer to any PCR procedure, including earlier gel-based end-point assays, that attempts to quantify the starting amount of nucleic acid. Rarely, one might see the term “quantitative fluorescent PCR” to designate that the quantification was accomplished via measuring output from a fluorogenic probe, although this is redundant because all of the present chemistries for real-time PCR are fluorescent. In addition, if reverse transcriptase enzymes are used before PCR amplification in any of the above situations, then “RT-PCR” replaces “PCR” in the term. Today, the two most common terms, real-time and quantitative, are often used interchangeably or in combination, because real-time PCR is quickly becoming the method of choice to quantify nucleic acids (Valasek and Repa 2005).
The basic goal of real-time PCR is to precisely distinguish and measure specific nucleic acid sequences in a sample even if there is only a very small quantity. Real-time PCR amplifies a specific target sequence ina sample then monitors theamplification progress using fluorescent technology. During amplification, how quickly the fluorescent signal reaches a threshold level correlates with the amount of original target sequence, thereby enabling quantification. In addition, the final product can be further characterized by subjecting it to increasing temperatures to determine when the double-stranded product “melts.” This melting point is a unique property dependent on product length and nucleotide composition. To accomplish these tasks, conventional PCR has been coupled to state-of-the-art fluorescent chemistries and instrumentation to becomereal-time PCR (Valasek and Repa 2005).
2. The chemistries of real-time PCR
Today fluorescence is exclusively used as the detection method in real-time PCR. Both sequence specific probes and non-specific labels are available as reporters. In his initial work Higuchi used the common nucleic acid stain ethidium bromide, which becomes fluorescent upon intercalating into DNA (Higuchi, Dollinger et al. 1992). Classical intercalators, however, interfere with the polymerase reaction, and asymmetric cyanine dyes such as SYBR Green I and BEBO have become more popular (Bengtsson, Karlsson et al. 2003; Zipper, Brunner et al. 2004). Asymmetric cyanines have two aromatic systems containing nitrogen, one of which is positively charged, connected by amethine bridge. These dyes have virtually no fluorescence when they are free in solution due to vibrations engaging
www.intechopen.com

Overview of Real-Time PCR Principles
407
both aromatic systems, which convert electronic excitation energy into heat that dissipates to the surrounding solvent. On the other hand the dyes become brightly fluorescent when they bind to DNA, presumably to the minor groove, and rotation around the methine bond is restricted (Nygren, Svanvik et al. 1998). In PCR the fluorescence of these dyes increases with the amount of double stranded product formed, though not strictly in proportion because the dye fluorescence depends on the dye: base binding ratio, which decreases during the course of the reaction. The dye fluorescence depends also to some degree on the DNA sequence. But a certain amount of a particular double-stranded DNA target, in the absence of significant amounts of other double-stranded DNAs, gives rise to the same fluorescence every time. Hence, the dyes are excellent for quantitative real-time PCR when samples are compared at the same level of fluorescence in absence of interfering DNA. Although minor groove binding dyes show preference for runs of AT base-pairs (Jansen, Norde´n et al. 1993), asymmetric cyanines are considered sequence non-specific reporters in real-time PCR. They give rise to fluorescence signal in the presence of any double stranded DNA including undesired primer–dimer products. Primer–dimer formation interferes with the formation of specific products because of competition of the two reactions for reagents and may lead to erroneous readouts. It is therefore good practice to control for primer–dimer formation. This can be done by melting curve analysis after completing the PCR. The temperature is then gradually increased and the fluorescence is measured as function of temperature. The fluorescence decreases gradually with increasing temperature because of increased thermal motion which allows for more internal rotation in the bound dye (Nygren, Svanvik et al. 1998). However, when the temperature is reached at which the double stranded DNA strand separates the dye comes off and the fluorescence drops abruptly (Ririe, Rasmussen et al. 1997). This temperature, referred to as the melting temperature, Tm, is easiest determined as the maximum of the negative first derivative of the melting curve. Since primer–dimer products typically are shorter than the targeted product, they melt at a lower temperature and their presence is easily recognized by melting curve analysis (Kubista, Andrade et al. 2006).
Labeled primers and probes are based on nucleic acids or some of their synthetic analogues such as the peptide nucleic acids (PNA) (Egholm, Buchardt et al. 1992) and the locked nucleic acids (LNA) (Costa, Ernault et al. 2004). The dye labels are of two kinds: (i) fluorophores with intrinsically strong fluorescence, such as fluorescein and rhodamine derivatives (Sjöback, Nygren et al. 1995), which through structural design are brought into contact with a quencher molecule, and (ii) fluorophores that change their fluorescence properties upon binding nucleic acids. Examples of probes with two dyes are the hydrolysis probes, popularly called Taqman probes (Holland, Abramson et al. 1991), which can be based either on regular oligonucleotides or on LNA (Braasch and Corey 2001), Molecular Beacons (Tyagi and Kramer 1996; Tyagi, Bratu et al. 1998), Hybridization probes (Caplin, Rasmussen et al. 1999), and the Lion probes (http://www.biotools.net). The dyes form a donor–acceptor pair, where the donor dye is excited and transfers its energy to the acceptor molecule if it is in proximity. Originally the acceptor molecule was also a dye, but today quencher molecules are more popular (Wilson and Johansson 2003). Energy transfer and quenching are distance dependent and structural rearrangement of the probe, or, in the case of hydrolysis probes, degradation, change the distance between the donor and acceptor and, hence, the fluorescence of the system (Kubista, Andrade et al. 2006).
Probes based on a single dye, whose fluorescence changes upon binding target DNA include the LightUp probes (Svanvik, Westman et al. 2000), AllGlo probes
www.intechopen.com

Polymerase Chain Reaction
408
(http://www.allelogic.com), Displacement probes (Li, Qingge et al. 2002), and the Simple probes (http://www.idahotech.com/itbiochem/simpleprobes.html).
Chemical modifications and alterations of the oligonucleotide backbone are employed in some probes to improve the binding properties to the target template. This makes it possible to use shorter probes, which is advantageous for the detection of targets with short conserved regions such as retroviruses. LightUp probes have a neutral peptide nucleic acid (PNA) backbone that binds to DNA with greater affinity than normal oligonucleotides (Kubista, Andrade et al. 2006).
The LightUp probes are 10–12 bases, which is short compared to normal oligonucleotide
probes that are usually at least 25 bases (http://www.lightup.se). LNA-probes make use of
modified nucleotides to enhance binding affinity. MGBprobes are hydrolysis probes with a
minor groove binding molecule attached to the end of the probe to increase affinity for
DNA, which makes it possible to use shorter probes (Kutyavin, Afonina et al. 2000).
Examples of modified primers include: Scorpion primers (Whitcombe, Theaker et al. 1999),
LUX primers (Nazarenko, Lowe et al. 2002), Ampliflour primers (Uehara, Nardone et al.
1999), and the QZyme system (BD QZymeTM Assays for Quantitative PCR, 2003). As long
as a single target is detected per sample there is not much of a difference in using a dye or a
probe. Assay specificity is in both cases determined by the primers. Probes do not detect
primer–dimer products, but using non-optimized probe assays is hiding the problem under
the rug. If primer–dimers form they cause problems whether they are seen or not. In probe
based assays, particularly when high CT values are obtained, one should verify the absence
of competing primer–dimer products (Kubista, Andrade et al. 2006). The traditional way is
by gel electrophoresis. Recently, an alternative approach was proposed based on the
BOXTO dye. BOXTO is a sequence non-specific doublestranded DNA binding dye that has
distinct spectral characteristics to fluorescein and can be used in combination with FAM
based probes. The BOXTO and the probe signals are detected in different channels of the
real-time PCR instrument. While the probe reflects formation of the targeted product as
usual, the BOXTO dye also reports the presence of any competing primer–dimer products,
which can be identified by melting curve analysis (Lind, Stahlberg et al. 2006). The great
advantage of probes is for multiplexing, where several products are amplified in the same
tube and detected in parallel (Wittwer, Herrmann et al. 2001). Today multiplexing is mainly
used to relate expression of reporter genes to that of an exogenous control gene in diagnostic
applications (Mackya 2004), and for single nucleotide polymorphism (SNP) and mutation
detection studies (Mhlanga and Malmberg 2001; Mattarucchi, Marsoni et al. 2005). Multiplex
assays are more difficult to design because when products accumulate the parallel PCR
reactions compete for reagents. To minimize competition limiting amounts of primers must
be used. Also, primer design is harder, because complementarity must be avoided between
all the primers. Multiplex assays can be based either on probes or on labeled primers, where
labeled primers usually give rise to signal from primer–dimer products, while probes do
not. The different probing technologies have their advantages and limitations. Dyes are
cheaper than probes but they do not distinguish between products. Hairpin forming probes
have the highest specificity, because the formation of the hairpin competes with the binding
to mismatched targets. This makes them most suitable for SNP and multi-site variation
(MSV) analysis (Bonnet, Tyagi et al. 1999). Hydrolysis probes require two-step PCR to
function properly, which is not optimal for the polymerase reaction, and short amplicons are
www.intechopen.com

Overview of Real-Time PCR Principles
409
necessary to obtain reasonable amplification efficiencies. But they are easier to design than
hairpin forming probes and an 80% success rate was recently reported (Kubista 2004).
In summary, a ‘good’probe, independent of chemistry, should have low background fluorescence, high fluorescence upon target formation (high signal to noise ratio), and high target specificity. The dyes’excitation and emission spectra are important parameters to consider when designing multiplex reactions. Spectral overlap in excitation and emission should be minimized to keep cross-talk to a minimum (Kubista, Andrade et al. 2006).
2.1 SYBR green I
SYBR green I binds to the minor groove of dsDNA, emitting 1,000-fold greater fluorescence than when it is free in solution (Wittwer, Herrmann et al. 1997). Therefore, the greater the amount of dsDNA present in the reaction tube, the greater the amount of DNA binding and fluorescent signal from SYBR green I. Thus any amplification of DNA in the reaction tube is measured (Valasek and Repa 2005).
2.2 BEBO
The minor groove binding asymmetric cyanine dye BEBO is tested as sequence nonspecific label in real-time PCR. The Fluorescence intensity of BEBO increases upon binding to double-stranded DNA allowing emission to be measured at the end of the elongation phase in the PCR cycle. BEBO concentrations between 0.1 and 0.4 mM generated sufficient Fluorescence signal without inhibiting the PCR. A comparison with the commonly used reporter dye SYBR Green I shows that the two dyes behave similarly in all important aspects. The dye has absorbance and emission wavelengths that can be detected on the FAM channel on most common real-time PCR platforms, and shows a strong fluorescence increase when bound to dsDNA. BEBO can be used as an unspecific dye for real-time PCR applications or other applications where staining of dsDNA is wanted (Bengtsson, Karlsson et al. 2003).
2.3 BOXTO
The unsymmetrical cyanine dyes BOXTO and its positive divalent derivative BOXTO-PRO were studied as real-time PCR reporting fluorescent dyes and compared to SYBR GREEN I (SG). Unmodified BOXTO showed no inhibitory effects on real-time PCR, while BOXTO-PRO showed complete inhibition, sufficient fluorescent signal was acquired when 0.5–1.0 µM BOXTO was used with RotorGene and iCycler platforms. Statistical analysis showed that there is no significant difference between the efficiency and dynamic range of BOXTO and SG (Ahmad 2007).
2.4 5' nuclease (TaqMan) probes
Hydrolysis probes (also called 5/-nuclease probes because the 5/-exonuclease activity of DNA polymerase cleaves the probe) offer an alternative approach to the problem of specificity. These are likely the most widely used fluorogenic probe format (Mackay 2004) and are exemplified by TaqMan probes. In terms of structure, hydrolysis probes are sequence- specific dually fluorophore-labeled DNA oligonucleotides (Valasek and Repa 2005). One fluorophore is termed the quencher and the other is the reporter. When the quencher and reporter are in close proximity, that is, they are both attached to the same
www.intechopen.com

Polymerase Chain Reaction
410
short oligonucleotide; the quencher absorbs the signal from the reporter (Valasek and Repa 2005). This is an example of fluorescence resonance energy transfer (also called Forster transfer) in which energy is transferred from a “donor” (the reporter) to an “acceptor” (the quencher) fluorophore. During amplification, the oligonucleotide is broken apart by the action of DNA polymerase (5/-nuclease activity) and the reporter and quencher separate, allowing the reporter’s energy and fluorescent signal to be liberated. Thus destruction or hydrolysis of the oligonucleotide results in an increase of reporter signal and corresponds with the specific amplification of DNA (Valasek and Repa 2005). Examples of common quencher fluorophores include TAMRA, DABCYL, and BHQ, whereas reporters are more numerous (e.g., FAM, VIC, NED, etc). Hydrolysis probes afford similar precision as SYBR green I (Wilhelm, Pingoud et al. 2003), but they give greater insurance regarding the specificity because only sequence-specific amplification is measured. In addition, hydrolysis probes allow for simple identification of point mutations within the amplicon using melting curve analysis (Valasek and Repa 2005).
2.5 Molecular beacons
Molecular beacons are similar to TaqMan probes but are not designed to be cleaved by the 5' nuclease activity of Taq polymerase. These probes have a fluorescent dye on the 5' end and a quencher dye on the 3' end of the oligonucleotide probe. A region at each end of the molecular beacon probe is designed to be complementary to itself, so at low temperatures, the ends anneal, creating a hairpin structure. This integral annealing property positions the two dyes in close proximity, quenching the fluorescence from the reporter dye (Espy, Uhl et al. 2006). The central region of the probe is designed to be complementary to a region of the PCR amplification product. At high temperatures, both the PCR amplification product and probe are single stranded. As the temperature of the PCR is lowered, the central region of the molecular beacon probe binds to the PCR product and forces the separation of the fluorescent reporter dye from the quenching dye. The effects of the quencher dye are obviated and a light signal from the reporter dye can be detected. If no PCR amplification product is available for binding, the probe reanneals to itself, forcing the reporter dye and quencher dye together, preventing fluorescent signal (Espy, Uhl et al. 2006). Typically, a single molecular beacon is used for detection of a PCR amplification product and multiple beacon probes with different reporter dyes are used for single nucleotide polymorphism detection. By selection of appropriate PCR temperatures and/or extension of the probe length, molecular beacons will bind to the target PCR product when an unknown nucleotide polymorphism is present but at a slight cost of reduced specificity. There is not a specific temperature thermocycling requirement for molecular beacons, so temperature optimization of the PCR is simplified (Espy, Uhl et al. 2006).
2.6 FRET hybridization probes
FRET hybridization probes, also referred to as LightCyclerprobes; represent a third type of probe detection format commonly used with real-time PCR testing platforms. FRET hybridization probes are two DNA probes designed to anneal next to each other in a head-to-tail configuration on the PCR product. The upstream probe has a fluorescent dye on the 3' end and the downstream probe has an acceptor dye on the 5' end. If both probes anneal to the target PCR product, fluorescence from the 3' dye is absorbed by the adjacent acceptor dye on the 5' end of the second probe. The second dye is excited and emits light at a third
www.intechopen.com

Overview of Real-Time PCR Principles
411
wavelength and this third wavelength is detected. If the two dyes do not align together because there is no specific DNA for them to bind, then FRET does not occur between the two dyes because the distances between the dyes are too great. A design detail of FRET hybridization probes is the 3' end of the second (downstream) probe is phosphorylated to prevent it from being used as a primer by Taq during PCR amplification. The two probes encompass a region of 40 to 50 DNA base pairs, providing exquisite specificity (Espy, Uhl et al. 2006). FRET hybridization probe technology permits melting curve analysis of the amplification product. If the temperature is slowly raised, eventually the probes will no longer be able to anneal to the target PCR product and the FRET signal will be lost. The temperature at which half the FRET signal is lost is referred to as the melting temperature of the probe system (Espy, Uhl et al. 2006). The Tm depends on the guanine plus cytosine content and oligonucleotide length. In contrast to TaqMan probes, a single nucleotide polymorphism in the target DNA under a hybridization FRET probe will still generate a signal, but the melting curve will display a lower Tm. The lowered Tm can be characteristic for a specific polymorphism underneath the probes; however, a lowered Tm can also be the result of any sequence difference under the probes. The target PCR product is detected and the altered Tm informs the user there is a difference in the sequence being detected. Generally, more than three base pair differences under a FRET hybridization probe prevent hybridization at typical annealing temperatures and are not detected (Espy, Uhl et al. 2006). This trait of FRET hybridization probes is advantageous in cases where the genome of the organism is known to mutate at a high frequency, such as with viruses. When a single or limited number (<3) of known polymorphisms occur between two similar targets, FRET hybridization probes can also be used for discriminating strains of organisms (Espy, Uhl et al. 2006). Like molecular beacons, there is not a specific thermocycling temperature requirement for FRET hybridization probes. Molecular beacons and FRET hybridization probes, unlike TaqMan probes, are both recycled (conserved) in each round of PCR temperature cycle. Also, for Molecular beacons and FRET hybridization probes, unlike TaqMan probes, fluorescent signal does not accumulate as PCR product accumulates after each PCR cycle (Espy, Uhl et al. 2006).
2.7 Scorpions
Scorpions combine the detection probe with the upstream PCR primer (Whitcombe, Theaker et al. 1999) and consist of a fluorophore on the 5′ end, followed by a complementary stem-loop structure (also containing the specific probe sequence), quencher dye, DNA polymerase blocker (a nonamplifiable monomer that prevents DNA polymerase extension), and finally a PCR primer on the 3′ end. The probe sequence contained within the hairpin allows the scorpion to anneal to the template strand, which separates the quencher for the fluorophore and results in increased fluorescence. Because sequence-specific priming and probing is a unimolecular event, scorpions perform better than bimolecular methods under conditions of rapid cycling such as the LightCycler (Thelwell, Millington et al. 2000). Cycling is performed at a temperature optimal for DNA polymerase activity instead of the reduced temperature necessary for the 5′ nuclease assay. Scorpions are specific enough for allele discrimination and may be multiplexed easily (Thelwell, Millington et al. 2000). The scorpion chemistry has been improved with the creation of duplex scorpions in which the reporter dye/probe and quencher fragment are on separate, complementary molecules (Solinas, Brown et al. 2001). The duplex scorpions still bind in a unimolecular event, but because the reporter and quenchers are on separate molecules, they yield greater signal
www.intechopen.com
Polymerase Chain Reaction
412
intensity because the reporter and quencher can separate completely (Wong and Medrano 2005).
2.8 Sunrise™ primers
Created by Oncor (Gaithersburg, MD, USA), Sunrise primers are similar to scorpions in that they combine both the PCR primer and detection mechanism in the same molecule (Nazarenko, Bhatnagar et al. 1997). These probes consist of a dual-labeled (reporter and quencher fluorophores) hairpin loop on the 5′ end, with the 3′ end acting as the PCR primer. When unbound, the hairpin is intact, causing reporter quenching via FRET. Upon integration into the newly formed PCR product, the reporter and quencher are held far enough apart to allow reporter emission (Wong and Medrano 2005).
2.9 LUX™ fluorogenic primers
Light upon extension (LUX) primers (Invitrogen, Carlsbad, CA, USA) are self-quenched single-fluorophore labeled primers almost identical to Sunrise primers. However, rather than using a quencher fluorophore, the secondary structure of the 3′ end reduces initial fluorescence to a minimal amount (Nazarenko, Lowe et al. 2002). Because this chemistry does not require a quencher dye, it is much less expensive than dual-labeled probes. While this system relies on only two oligonucleotides for specificity, unlike the SYBR Green I platform in which a dissociation curve is used to detect erroneous amplification, no such convenient detection exists for the LUX platform. Agarose gels must be run to ensure the presence of a single PCR product, a step that is extremely important not only for the LUX primers but also for the Sunrise primers and scorpions because PCR priming and probe binding are not independent in these chemistries (Wong and Medrano 2005).
2.10 Light-up probes
Light-up probes are peptide nucleic acids (PNAs) that use thiazole orange as the fluorophor. Upon hybridisation with DNA, duplex or triplex structures are formed with increased fluorescence intensity of the fluorophor. A quencher is not required. This technique is limited by unspecific fluorescence, which increases during PCR and therefore restricts the achievable sensitivity (Isacsson, Cao et al. 2000; Svanvik, Stahlberg et al. 2000;Svanvik, Westman et al. 2000). Some other formats use the increasing quench as indicator for product accumulation (Crockett and Wittwer 2001; Kurata, Kanagawa et al. 2001). In this case, the fluorescence is quenched by a guanine residue of the PCR product. These probes are comparatively inexpensive and easy to construct; however, measurement of the decrease of a signal is problematic, especially during the early exponential phase in which only very few probes are quenched (Wilhelm and Pingoud 2003).
2.11 Eclipse probe
qPCR assays using an Eclipse probe employ two primers and a sequence-specific oligonucleotide probe. The probe is complementary to a sequence within the amplicon and contains a fluorescent reporter at the 3' end, a quencher at the 5' end, and a minor groove binder (Bio-Rad Laboratories 2006). The unhybridized probe adopts a conformation that brings the reporter and quencher together, quenching the reporter. During the annealing
www.intechopen.com

Overview of Real-Time PCR Principles
413
step of PCR, the probe hybridizes to the target with the help of the minor groove binder. The probe thus becomes linearized, separating the reporter and quencher and allowing the reporter to fluoresce. The resulting fluorescent signal is proportional to the amount of amplified product in the sample (Bio-Rad Laboratories 2006).
2.12 Amplifluor primer
qPCR assays using Amplifluor chemistry employ two target-specific primers and one universal primer called the UniPrimer. The first target-specific primer contains a 5' extension sequence called the Z-sequence that is also found at the 3' end of the UniPrimer. The UniPrimer forms a hairpin structure (Bio-Rad Laboratories 2006). A fluorescent reporter and a quencher are attached at the 5' and the 3' ends of the stem structure, respectively. In the hairpin conformation, the reporter fluorescence is quenched due to its proximity to the quencher. During the first amplification cycle, the first target-specific primer (with the Z-sequence) hybridizes to the template and is extended. During the second amplification cycle, the second target-specific primer is used to synthesize a new target template that contains a sequence complementary to the Z-sequence. The product from the second amplification cycle can then serve as the template for the UniPrimer. In the third amplification cycle, the extended UniPrimer serves as a template for the next amplification cycle (Bio-Rad Laboratories 2006). In the fourth cycle, extension of the template through the hairpin region of the UniPrimer causes the UniPrimer to open up and adopt a linear configuration, which allows the reporter to fluoresce. Exponential amplification using the second target-specific primer and the UniPrimer occurs in subsequent amplification cycles. The resulting fluorescent signal is proportional to the amount of amplified product in the sample (Bio-Rad Laboratories 2006).
2.13 BD QZyme primer
qPCR assays using BD QZyme primers employ a target-specific zymogene primer, a target-specific reverse primer, and a universal oligonucleotide substrate. The oligonucleotide contains a fluorescent reporter on the 5' end and a quencher on the 3' end. When oligonucleotide substrate is intact, the fluorescence of the reporter is quenched by the quencher due to their proximity (Bio-Rad Laboratories 2006). The zymogene primer contains a sequence that encodes a catalytic DNA. During the first amplification cycle, the zymogene primer is extended. In the second cycle, the product of the first cycle is used as the template by the target-specific reverse primer, which is extended to create a new target sequence containing a catalytic DNA region. In the subsequent annealing step, the fluorescently labeled oligonucleotide substrate hybridizes to the catalytic DNA sequence and is cleaved. This cleavage separates the reporter from the quencher, resulting in a fluorescent signal that is proportional to the amount of amplified product in the sample (Bio-Rad Laboratories 2006).
3. Design and optimization of SYBR Green I reactions
A SYBR Green I assay uses a pair of PCR primers that amplifies a specific region within the target sequence of interest and includes SYBR Green 1 for detecting the amplified product. The steps for developing a SYBR Green I assay are:
1. Primer design and amplicon design
www.intechopen.com
Polymerase Chain Reaction
414
2. Assay validation and optimization
A) Primer and Amplicon Design:
A successful real-time PCR reaction requires efficient and specific amplification of the product. Both primers and target sequence can affect this efficiency. Therefore, care must be taken when choosing a target sequence and designing primers. A number of free and commercially available software programs are available for this purpose. One popular web-based program for primer design is Primer3 (http://frodo.wi.mit.edu/cgi-bin/primer3/primer3_www.cgi). A commercially available program such as Beacon Designer software performs both primer design and amplicon selection (Bio-Rad Laboratories 2006).
B) Guidelines of amplicon design:
1. Design amplicon to be 75–200 bp.Shorteramplicons are typically amplified with higher efficiency. An amplicon should be at least 75 bp to easily distinguish it from any primer-dimers that might form
2. Avoid secondary structure if possible. Use programs such as mfold http://www.bioinfo.rpi.edu/applications/mfold/) to predict whether an amplicon will form any secondary structure at annealing temperature. See Real-Time PCR: General Considerations (Bio-Rad bulletin 2593) for more details
3. Avoid templates with long (>4) repeats of single bases 4. Maintain a GC content of 50–60%
C) Parameters of primer design:
1. Design primers with a GC content of 50–60% 2. Maintain a melting temperature (Tm) between 50ºC and 65ºC. We calculate Tm values
using the nearest-neighbor method with values of 50 mM for salt concentration and 300 nM for oligonucleotide concentration
3. Avoid secondary structure; adjust primer locations outside of the target sequence secondary structure if required
4. Avoid repeats of Gs or Cs longer than three bases 5. Place Gs and Cs on ends of primers 6. Check sequence of forward and reverse primers to ensure no 3' complementarity (avoid
primer-dimer formation) 7. Verify specificity using tools such as the Basic Local Alignment Search Tool
(http://www.ncbi.nlm.nih.gov/blast/)
D) Assay Validation and Optimization:
Components a SYBR Green I qPCR reaction:
1. PCR master mix with SYBR Green I 2. Template 3. Primers
Preformulated real-time PCR master mixes containing buffer, DNA polymerase, dNTPs, and SYBR Green I dye are available from several vendors.
Optimized SYBR Green I qPCR reactions should be sensitive and specific and should exhibit good amplification efficiency over a broad dynamic range (Bio-Rad Laboratories 2006).
www.intechopen.com

Overview of Real-Time PCR Principles
415
Steps of to determine the performance of your SYBR Green I qPCR assay:
a. Identify the optimal annealing temperature for your assay b. Construct a standard curve to evaluate assay performance
E) Annealing Temperature Optimization:
The optimal annealing temperature can easily be assessed on qPCR instruments that have a
temperature gradient feature, such as the MiniOpticon™, MyiQ™, DNA Engine Opticon®,
Opticon™ 2, iCycleriQ®, Chromo4™, and iQ™5 systems.
A gradient feature allows you to test a range of annealing temperatures simultaneously, so
optimization reactions can be performed in a single experiment.
To find the optimal annealing temperature for reaction, recommend testing a range of
annealing temperatures above and below the calculated Tm of the primers.
Because SYBR Green I binds to all dsDNA, it is necessary to check the specificity of your
qPCR assay by analyzing the reaction product(s). To do this, use the melt-curve function on
your real-time instrument and also run products on an agarose gel. An optimized SYBR
Green I qPCR reaction should have a single peak in the melt curve, corresponding to the
single band on the agarose gel.
Nonspecific products that may have been co-amplified with the specific product can be
identified by melt-curve analysis. In this example, the specific product is the peak with a Tm
of 89°C and corresponds to the upper band on the gel. The nonspecific product is the peak
with a Tm of 78°C and corresponds to the lower band in the gel. By comparing the gel image
with the melt curve, you can identify peaks in the melt curve that correspond to specific
product, additional nonspecific bands, and primer-dimers. If nonspecific products such as
primer-dimers are detected by melt-curve analysis, recommend that redesign primers (Bio-
Rad Laboratories 2006).
F) Assay Performance Evaluation Using Standard Curves:
The efficiency, reproducibility, and dynamic range of a SYBR Green I assay can be
determined by constructing a standard curve using serial dilutions of a known template.
The efficiency of the assay should be 90–105%, the R2 of the standard curve should be >0.980
or r > |–0.990|, and the CT values of the replicates should be similar.
It is important to note that the range of template concentrations used for the standard curve
must encompass the entire range of template concentration of the test samples to show that
results from the test samples are within the linear dynamic range of the assay. If the test
samples give results outside of the range of the standard curves, one of the following must
be performed:
1. Construct a wider standard curve covering the test sample concentrations and perform analysis to ensure that the assay is linear in that new range
2. If the test samples give a lower CT than the highest concentration of standards used in the standard curve, repeat the assay using diluted test samples
3. If the test samples give a higher CT than the lowest concentration of standards used in the standard curve, repeat the assay using larger amounts of the test samples
www.intechopen.com
Polymerase Chain Reaction
416
4. Design and optimization of TaqManProbe reactions
A TaqMan assay uses a pair of PCR primers and a dual-labeled target-specific fluorescent probe. The steps for developing a TaqMan assay are:
a. Primer and probe design b. Assay validation and optimization
A. Primer and Probe Design:
As with any qPCR reaction, TaqMan-based assays require efficient and specific amplification of the product. Typically, the primers are designed to have an annealing temperature between 55 and 60oC. We recommend using software such as Beacon Designer for designing your TaqMan primers and TaqMan probe.. Because the dual-labeled probe is the most costly component of a TaqMan assay, suggested that order the two primers and validate their performance using SYBR Green I before ordering the dual-labeled probe.
The TaqMan probe should have a Tm 5–10°C higher than that of the primers. In most cases, the probe should be <30 nucleotides and must not contain a G at its 5' end because this could quench the fluorescent signal even after hydrolysis. Choose a sequence within the target that has a GC content of 30–80%, and design the probe to anneal to the strand that has more Gs than Cs (so the probe contains more Cs than Gs).
An important aspect of designing a TaqMan probe is reporter and quencher selection. We recommend using FAM-labeled probes when designing singleplex reactions, because they are inexpensive and readily available, perform well, and can be detected by all instruments currently on the market.
Another important consideration for obtaining accurate real-time qPCR data is probe quality. Even a perfectly designed probe can fail if the probe is improperly synthesized or purified. Improper removal of uncoupled fluorescent label, inefficient coupling, and/or poor quenching can produce high fluorescent background or noise. A low signal-to-noise ratio results in decreased sensitivity and a smaller linear dynamic range. Two probes with identical sequences and identical fluorophore labels can be measurably different when synthesized by different suppliers or even at different times by the same supplier.
B. Assay Validation and Optimization:
A TaqMan probe-based qPCR reaction contains the following components:
1. PCR master mix 2. Template 3. Primers 4. Probe(s)
Preformulated PCR master mixes containing buffer, DNA polymerase, and dNTPs are commercially available from several vendors. For TaqMan assays, we recommend using iQ™ supermix with 300 nM of each of the two primers and 200 nM of probe(s). TaqMan assays require careful attention to temperature conditions. A typical TaqMan protocol contains a denaturation step followed by a combined annealing and extension step at 55–60°C, instead of the traditional three-step PCR cycle of denaturation, annealing, and extension. This is to ensure that the probe remains bound to its target during primer
www.intechopen.com

Overview of Real-Time PCR Principles
417
extension. Typical TaqMan probes for nucleic acid quantification are designed to have a Tm of 60–70°C. An optimized TaqMan assay should be sensitive and specific, and should exhibit good amplification efficiency over a broad dynamic range.
In short, construct a standard curve using dilutions of a known template and use this curve to determine the efficiency of the assay along with R2 or r of the regression line. The efficiency of the reaction should be between 90 and 105%, the R2 should be >0.980 or r > |–0.990|, and the replicates should give similar CT values. If the assay performs within these specifications, you are ready to start your experiment. If the assay performs outside these specifications, we suggest that you redesign your primers and TaqMan probe. It is important to note that the range of template concentrations used for the standard curve must encompass the entire range of template concentrations of the test samples to demonstrate that results from the test samples are within the dynamic range of the assay (Bio-Rad Laboratories 2006). If test samples give results outside the range of the standard curve, one of the three following steps must be performed:
1. Construct a wider standard curve covering the test sample concentrations and perform analysis to ensure that the assay is linear in that new range
2. If the test samples give a lower CT than the highest concentration of standards used in the standard curve, repeat the assay using diluted test samples
3. If the test samples give a higher CT than the lowest concentration of standards used in the standard curve, repeat the assay using larger amounts of the test samples
5. The instrumentation of real-time PCR
A critical requirement for real-time PCR technology is the ability to detect the fluorescent
signal and record the progress of the PCR. Because fluorescent chemistries require both a
specific input of energy for excitation and a detection of a particular emission wavelength,
the instrumentation must be able to do both simultaneously and at the desired wavelengths.
Thus the chemistries and instrumentation are intimately linked (Valasek and Repa 2005).
At present, there are three basic ways in which real-time instrumentation can supply the excitation energy for fluorophores: by lamp, light-emitting diode (LED), or laser. Lamps are classified as broad-spectrum emission devices, whereas LEDs and lasers are narrow spectrum. Instruments that utilize lamps (tungsten halogen or quartz tungsten halogen) may also include filters to restrict the emitted light to specific excitation wavelengths. Instruments using lamps include Applied Biosystem’s ABI Prism 7000, Stratagene’s Mx4000 and Mx3000P, and Bio-Rad’s iCycleriQ. LED systems include Roche’s LightCycler, Cepheid’s SmartCycler, Corbett’s Rotor-Gene, and MJ Research’s DNA Engine Opticon 2. The ABI Prism 7900HT is the sole machine to use a laser for excitation (Valasek and Repa 2005). To collect data, the emission energies must also be detected at the appropriate wavelengths. Detectors include charge-coupled device cameras, photomultiplier tubes, or other types of photodetectors. Narrow wavelength filters or channels are generally employed to allow only the desired wavelength(s) to pass to the photodetector to be measured. Usually, multiple discrete wavelengths can be measured at once, which allows for multiplexing, i.e., running multiple assays in a single reaction tube (Valasek and Repa 2005). Another portion of the instrumentation consists of a thermocycler to carry out PCR. Of particular importance for real-time PCR is the ability of the thermocycler to maintain a
www.intechopen.com

Polymerase Chain Reaction
418
consistent temperature among all sample wells, as any differences in temperature could lead to different PCR amplification efficiencies. This is accomplished by using a heating block (Peltier based or resistive), heated air, or a combination of the two. As one might expect, heating blocks generally change temperature more slowly than heated air, resulting in longer thermocycling times. For example, Roche’s LightCycler models utilizing heated air can perform 40 cycles in 30 min, whereas Applied Biosystem’s ABI Prism 7900HT utilizing a Peltier-based heating block take s 1 h 45 min (Valasek and Repa 2005). Real-time instrumentation certainly would not be complete without appropriate computer hardware and data-acquisition and analysis software. Software platforms try to simplify analysis of real-time PCR data by offering graphical output of assay results including amplification and dissociation (melting point) curves. The amplification curve gives data regarding the kinetics of amplification of the target sequence, whereas the dissociation curve reveals the characteristics of the final amplified product (Valasek and Repa 2005).
5.1 Comparison of the different systems
Essentially, each real time PCR instrument consists of a computer-controlled thermocycler
integrated with fluorescent detection system and dedicated software to analyze the result.
Some systems can detect four different wave lengths (I-cycler, Mx4000 [stratagene] and
Smart Cycler®, Version 2.0 Light Cycler®) whereas others can detect two different
wavelengths (Light Cycler®). The Light Cycler® and Smart Cycler® are capable of
performing rapid-cycle real time PCR because the reaction is set-up in capillaries or
especially designated tubes. Both have optimized heating- cooling characteristic. A complete
amplification protocol can be performed in 30-45 minutes (Myi ; Giulietti, Overbergh et al.
2001; Soheili and Samiei 2005). The Smart Cycler® is a combination of 16 individual, one
tube real time PCR units. It is capable of performing a different PCR program on each of 16
reaction tubes. This is very useful for a rapid optimization of the assay as many variables
can be tested at the same time. The Bio-Rad I-cycler IQ® instrument can perform real time
amplification with a temperature gradient for specific PCR steps, allowing the optimization
of real time PCR assay. The spectrofluorometers in the thermal cycler have a number of
differences. Laser-based systems are tuned to excite each fluorophore at a specific
wavelength and provide maximum efficiency. Lamp-based systems provide a broad
excitation range that can be filtered to work with a number of fluorophores. The laser source
not only gives brighter illumination to the fluorophore signal, but also produces less
background noise(Myi ; Giulietti, Overbergh et al. 2001; Soheili and Samiei 2005).
In conclusion, real time PCR is a powerful advancement of the basic PCR technique. The important steps in deciding which particular assay format to use are related to the type of data required. The requirement for a research laboratory is quite distinct from those of a diagnostic laboratory. For the latter, probe confirmation of the PCR product is an essential part of the assay, whereas SYBR green detection may be sufficient for many other applications such as quantifying expression of a gene. All of the real-time PCR machines analyzed are capable of detecting PCR product in real time and a specific assay can be made optionally on every system. However, there are some decisions to be made when selecting among different formats. The choice of system is dependent on individual laboratory needs (Myi ; Giulietti, Overbergh et al. 2001; Soheili and Samiei 2005). Considering diagnostic applications, the Light Cycler® or Smart Cycler® may obtain faster results for urgent assays.
www.intechopen.com
Overview of Real-Time PCR Principles
419
This could reduce the time of analysis to result from 3-4 hours to 1.5 hours. On the other hand, if sensitivity is the most important issue, these machines, with their smaller reaction volume and consequently lower sensitivity, wouldn't be the first choice. The ABI 7700 and Bio-Rad -I-Cycler IQ® have a 96 well format, enabling higher throughput than other systems. The 384-well plates, as designed by ABI for use in the 7900 HT system, can further enhance through put. For diagnostic application, internal control of nucleic acid isolation and PCR inhibition, it is essential to obtain valid results. This can be achieved using the system that enables multi-color detection, such as the I-Cycler IQ® and the Smart Cycler®. Recently, a multi-color format of the Light Cycler® is also present in market. Multiplex real-time PCRs can be developed for three different targets and an internal control by using the four detection wavelengths possible in multicolor detection. As a matter of fact, the choice of which real time system to use depends on the range of application required. To achieve meaningful results, each assay must be validated and optimized for the particular system chosen (Myi ; Giulietti, Overbergh et al. 2001; Soheili and Samiei 2005).
6. Advantages of real-time PCR quantitation
There are many methods in molecular biology for measuring quantities of target nucleic acid sequences. However, most of these methods exhibit one or more of the following shortcomings: they are time consuming, labor intensive, insufficiently sensitive, non-quantitative, require the use of radioactivity, or have a substantial probability of cross contamination (Reischl, Wittwer et al. 2002). These methods include but are not limited to Northern and Southern hybridizations, HPLC, scintillation proximity assay, PCR-ELISA, RNase protection assay, in situ hybridization, and various gel electrophoresis PCR end-point systems (Valasek and Repa 2005). Real-time PCR has distinct advantages over these earlier methods for several reasons. Perhaps the most important is its ability to quantify nucleic acids over an extraordinarily wide dynamic range (at least 5 log units). This is coupled to extreme sensitivity, allowing the detection of less than five copies (perhaps only one copy in some cases) of a target sequence, making it possible to analyze small samples like clinical biopsies or miniscule lysates from laser capture microdissection. With appropriate internal standards and calculations, mean variation coefficients are 1–2%, allowing reproducible analysis of subtle gene expression changes even at low levels of expression (Klein 2002; Luu-The, Paquet et al. 2005). In addition, all real-time platforms are relatively quick, with some affording high-throughput automation. Finally, real-time PCR is performed in a closed reaction vessel that requires no post-PCR manipulations, thereby minimizing the chances for cross contamination in the laboratory (Valasek and Repa 2005).
7. Limitations of real-time PCR quantitation
There are several limitations to real-time PCR methods. The majority of these are present in all PCR or RT-PCR-based techniques. Real-time PCR is susceptible to PCR inhibition bycompounds present in certain biological samples. For example, clinical and forensic uses for real-timePCR may be affected by inhibitors found in certain body fluidssuch as hemoglobin or urea (Wilson 1997). Food microbiological applications may encounter organic and phenolic inhibitors (Wilson 1997). To circumvent this problem, alternative DNA polymerases (e.g., Tfl, Pwo, Tth, etc.) that are resistant to particular inhibitors can be used. Other limitations primarily concern real-time PCR- based analysis of gene expression
www.intechopen.com

Polymerase Chain Reaction
420
(Bustin 2000; Bustin 2002;Bustin and Nolan 2004). Because of the necessary use of RNA in an extra enzymatic step, more problems have the opportunity to occur. RNA itself is extremely labile compared with DNA, and therefore isolation must be carefully performed to ensure both the integrity of the RNA itself and the removal of contaminating nucleases, genomic DNA, and RT or PCR inhibitors. This can be a problem with any sample source, but clinical samples are of special concern because inconsistencies in sample size, collection, storage, and transport can lead to a variable quality of RNA templates. Conversion of RNA to cDNA during the RT reaction is also subject to variability because multiple reverse transcriptase enzymes with different characteristics exist, and different classes of oligonucleotides (e.g., random, poly-dT, or gene specific primers) can be used to prime RT (Valasek and Repa 2005). Probably the largest present limitation of real-time PCR, however, is not inherent in the technology but rather resides in human error: improper assay development, incorrect data analysis, or unwarranted conclusions. In our experience using real-time PCR for gene expression analysis, real-time PCR primer sets must be designed and validated by stringent criteria to ensure specificity and accuracy of the results. For microbiology, false positives or negatives must be considered when designing an assay to detect pathogens. Amplification and melting curves must be visually inspected while independent calculations based on these curves should be double-checked for accuracy. Real-time PCR gene expression analysis measures mRNA levels and, therefore, only suggests possible changes in protein levels or function rather than demonstrating them. And although there is a tight connection between gene expression and gene product function (Brown and Botstein 1999)(8), this is certainly not always the case, and formal demonstration may be needed for a given research project. Of course, conclusions based on data derived from real-time PCR are best utilized when the biological context is well understood (Bustin 2002).
8. Types of real-time quantification
1. Absolute Quantitation
Absolute quantitation uses serially diluted standards of known concentrations to generate a standard curve. The standard curve produces a linear relationship between Ct and initial amounts of total RNA or cDNA, allowing the determination of the concentration of unknowns based on their Ct values (Heid, Stevens et al. 1996). This method assumes all standards and samples have approximately equal amplification efficiencies (Souaze, Ntodou-Thome et al. 1996). In addition, the concentration of serial dilutions should encompass the levels in the experimental samples and stay within the range of accurately quantifiable and detectable levels specific for both the real-time PCR machine and assay.The PCR standard is a fragment of double-stranded DNA (dsDNA), single-stranded DNA (ssDNA), or cRNA bearing the target sequence (Wong and Medrano 2005). A simple protocol for constructing a cRNA standard for one-step PCR can be found in Fronhoffs et al. (Fronhoffs, Totzke et al. 2002), while a DNA standard for two-step real-time PCR can be synthesized by cloning the target sequence into a plasmid (Gerard, Olsson et al. 1998), purifying a conventional PCR product (Liss 2002), or directly synthesizing the target nucleic acid. The standard used must be a pure species. DNA standards have been shown to have a larger quantification range and greater sensitivity, reproducibility, and stability than RNA standards (Pfaffl, Tichopad et al. 2004). However, a DNA standard cannot be used for a one-step real-time RT-PCR due to the absence of a control for the reverse transcription efficiency (Giulietti, Overbergh et al. 2001).
www.intechopen.com

Overview of Real-Time PCR Principles
421
2. Relative quantitation
During relative quantitation, changes in sample gene expression are measured based on either an external standard or a reference sample, also known as a calibrator (Livak and Schmittgen 2001). When using a calibrator, the results are expressed as a target/reference ratio. There are numerous mathematical models available to calculate the mean normalized gene expression from relative quantitationassays. Depending onthe method employed, these can yield different results and thus discrepant measures of standard error (Liu and Saint 2002; Muller, Janovjak et al. 2002). Table 1 shows a comparison of the different methods, with an explanation of each method to follow (Wong and Medrano 2005).
9. Quantitative analyses
For quantitative analysis, the amplification curves are evaluated. The amplification process is monitored either through the fluorescence of dsDNA-specific dyes (like SYBR Green I) or ofsequence-specific probes. Each curve consists of at least three distinct phases: 1) an initial lag phase in which no product accumulation can be measured, 2) an exponential phase, and 3) a plateau phase (Wilhelm and Pingoud 2003). The exponential phase in principle could be extrapolated to the start of the reaction (Cycle 0) to calculate the template copy number, but the error would be too high. The template copy number can be estimated with greater precision from the number of cycles needed for the signal to reach an arbitrary threshold. The threshold must intersect the signal curve in its exponential phase, in which the signal increase correlates with product accumulation. The intersection point is the so-called threshold value (CT) or crossing point (CP). This point may be between two successive cycles (i.e. it may be a fractional number). For exact quantifications, the efficiency of the amplification reaction must be known. It is crucial that the amplification efficiencies of standards and unknowns are identical (Wilhelm and Pingoud 2003). The efficiency can be estimated from the CT values of samples with known template concentrations ('standards') as described below (Wilhelm and Pingoud 2003).
During the exponential phase, the signal Scan be described by Equation 1:
S= pN0ɛc (1)
wherepis a proportionality factor to relate PCR product concentration and signal intensity, N0is the amount of template, ɛis the amplification efficiency (1 ≤ ɛ ≤ 2; ɛ= 2 means 100% efficiency) and cis the cycle number.
Solving for c results in Equation 2:
c=- (logɛ)-1(logN0 + logp- logS) (2)
With m= - (logɛ)-1 and b = - (logɛ)-1(logp-logS), Equation 2 simplifies to Equation 3:
c=mlogN0+ b (3)
This equation describes the linear relationship between the CTvalues determined and the log of the template concentration (N0). The parameters mand bcan be determined by a regression analysis of the CT values of the standards. When solved for N0, this equation serves as a calibration curve for the calculation of the unknowns according to Equation 4:
N0 = 10(CT-b)/m (4)
www.intechopen.com

Polymerase Chain Reaction
422
Table 1. Characteristics of Relative Quantitation Methods
Table 2. Characteristics of Detection Chemistries
www.intechopen.com

Overview of Real-Time PCR Principles
423
Fig. 1. Real-time PCR detection chemistries. Probe sequences are shown in blue while target DNA sequences are shown in black. Primers are indicated by horizontal arrowheads. Not all unlabeled PCR primers are shown. Oligo, oligonucleotide.
The efficiency can be calculated from the parameter m by using Equation 5:
ɛ = 10-1/m (5)
By inserting ɛ back into Equation 4, one obtains Equation 6:
N0 = ɛ (b-CT) (6)
The maximum value for ɛ is 2.0 (i.e. the amount of product is doubled in each cycle). The experimental value for ɛ usually varies between 1.5 and 1.9. Lower efficiencies limit the sensitivity of the assay but allow quantifications with higher precisions. Therefore, reactions
www.intechopen.com

Polymerase Chain Reaction
424
should be optimized for high efficiency. The effect of the efficiency on the precision, however, is not pronounced.
With more than six orders of magnitude, the dynamic range of this procedure is extraordinarily high (Marcucci, Livak et al. 1998; Verhagen, Willemse et al. 2000;Sails, Fox et al. 2003). The accuracy of this technique is limited by the precision of the determination of the CT values. The error of the CT values results from the signal noise and the CT calculation method. In highly optimized assays, standard errors of less than ± 0.2 cycles can be achieved. By assuming an amplification efficiency of 2 (i.e. 100 %), this implies that the minimum relative error for the quantification is about 10- 20%. The effects of different analysis and calculation methods and the effects of amplification-independent signal trends on the accuracy and precision of quantifications by realtime PCR are described in detail in papers by Lui et al. and Wilhelm et al (Liu and Saint 2002; Wilhelm, Pingoud et al. 2003).
Quantification is relative to the standard used. Only when the absolute concentration of the template molecules in the standard sample is known can the results be absolute. However, in most cases, determination of absolute concentrations is not required. That real-time PCR allows absolute quantification is demonstrated in principle by the reported determination of genome sizes (Wilhelm, Pingoud et al. 2003).
All quantifications by PCR are relative, either to a standard or to a reference gene. Interestingly, Equation 6 nicely illustrates the relative character of the quantifications using a dilution series of a standard; the meaning of the parameter b is the expected CT value of a sample with 'one' copy (or any other unit as defined by the operator). The difference of this value minus the CT value determined for the unknown sample (∆CT = b - CT) is a direct measure for the relative difference in template concentrations of the unknown and standard (Wilhelm and Pingoud 2003).
To analyse relative changes in transcript levels, the chosen standard is usually a reference transcript, for example from a housekeeping gene, itself with unknown template concentration. The calculation of ∆CT values between reference and sample transcript in a reference and a test sample then provides a simple tool to estimate relative changes. The derivation, assumptions and applications of the so-called 2∆∆CT method are described elsewhere by Livak et al (Livak and Schmittgen 2001). The results of this method are only semiquantitative because the efficiency ɛ is assumed to be 2.0 in all experiments and for all templates, which is at best an optimistic estimate. More precise results are obtained with a procedure introduced by Pfaffl et al., which includes a measured value for ɛ (Pfaffl 2001; Wilhelm and Pingoud 2003).
In general, care must also be taken for accurate quantifications with external standardization, especially with respect to polymerase inhibitors, which may be present in differentconcentrations in the unknowns and standards. This problem is circumvented by internal standardization. Here, an analytically distinguishable standard template ('competitor') is added to the sample and co-amplified in the same reaction (Gilliland, Perrin et al. 1990; Goerke, Bayer et al. 2001). The direct and simultaneous quantitative analysis of both products in realtime PCR also poses problems. These difficulties are mostly due to the fact that different fluorophors have to be used to distinguish the sequences of competitor and sample. As a result of different FRET and quantum efficiencies, the CT values obtained for competitor and sample are not directly comparable.
www.intechopen.com

Overview of Real-Time PCR Principles
425
The problem of where to set the threshold makes relativequantifications difficult if not
impossible. However, a simple trickcan be used to combine the advantages of both methods:
thereaction mixtures are prepared in duplicate (Gibson, Heid et al. 1996). To one of
thesemixtures, the probe specific for the competitor sequence isadded, whereas the probe
specific for the sample sequence isadded to the other mixture. This process is carried out for
a seriesof reactions with different amounts of competitor added. Withthis procedure, two
calibration lines are obtained and theintersection of the two lines is the equivalence point
(Wilhelm and Pingoud 2003).
10. Melting curve analyses
Melting curves represent the temperature dependence of the fluorescence. They are
recorded subsequent to the amplification of the target sequence by PCR. The detection can
be performed either with dsDNA-specific dyes like SYBR Green I or with sequence-specific
probes such as the molecular beacons and the hybridisation probes (scorpion and sunrise
primers cannot be used for melting curve analysis because they are integrated into the PCR
products; TaqMan probes cannot be used for melting curve analyses either, since their signal
generation depends on the hydrolysis of the probe). Melting curves of sequence-specific
probes are used for genotyping, resolving single base mismatches between target sequence
and probe (Lay and Wittwer 1997; Whitcombe, Brownie et al. 1998), whereas SYBR Green I
is used most frequently for product characterization (Ririe, Rasmussen et al. 1997). It has
been reported that melting curves measured with SYBR Green I can also be utilized for
genotyping of insertion/deletion polymorphisms and of single nucleotide polymorphisms
(SNPs) (Akey, Sosnoski et al. 2001; Lin, Tseng et al. 2001).
In melting curves, the signal decreases gradually as a result of a temperature-dependent
quench and more abruptly at a certain temperature because of the melting of the products
(dsDNA or ssDNA/probe hybrid). The melting temperature (Tm) of a product is defined as
the temperature at which the steepest decrease of signal occurs. This can be identified
conveniently as the peak value(s) (global or local maxima) in the negative derivative of the
melting curve. Additionally, the area under the curve (AUC) of the peaks is proportional to
the amount of product. Therefore, melting curve analysis may be used for quantifications
with internal standardization when the Tm values of sample and competitor products are
significantly different (Al-Robaiy, Rupf et al. 2001). However, well-performed normalization
is required to reduce the systematic error due to the temperature dependent quench. This
quench also limits the sensitivity of melting curve analyses. At present, there is only one
software package available that can remove the quench effects from the data (Wilhelm,
Pingoud et al. 2003).
With SYBR Green I, the amplification of the correct target sequence can be confirmed. In
most cases, nonspecific products have different lengths and therefore deviating melting
temperatures (Ririe, Rasmussen et al. 1997).Hybridisation probes, molecular beacons and
TaqMan probes are used for mutation detection (Lay and Wittwer 1997; Bernard, Ajioka et
al. 1998; Bernard and Wittwer 2000), genotyping (Whitcombe, Brownie et al. 1998; Ulvik and
Ueland 2001; Grant, Steinlicht et al. 2002; Randen, Sørensen et al. 2003) and SNP screening
(Sasvari‐Szekely, Gerstner et al. 2000; Mhlanga and Malmberg 2001).
www.intechopen.com

Polymerase Chain Reaction
426
11. Applications
Real-time PCR is used for absolute and relative quantifications of DNA and RNA template molecules and for genotyping in a variety of applications (Wilhelm and Pingoud 2003).
Quantitative real-time PCR is used to determine viral loads (Mackay, Arden et al. 2002),gene expression (Bustin 2000; Goerke, Bayer et al. 2001), titers of germs and contaminations (infood, blood, other body fluids and tissues) (Locatelli, Urso et al. 2000; Hernandez, Rio et al. 2001; Norton 2002), allele imbalances (Ruiz-Ponte, Loidi et al. 2000) and the degrees of amplification and deletion ofgenes (Chiang, Wei et al. 1999; Nigro, Takahashi et al. 2001).
Real-time PCR is also becoming increasingly important in thediagnosis of tumors, such as for the detection and monitoringof minimal residual diseases (Marcucci, Livak et al. 1998; Elmaagacli, Beelen et al. 2000; Amabile, Giannini et al. 2001; Krauter, Heil et al. 2001; Krauter, Hoellge et al. 2001), the identification of micrometastases in colorectal cancer (Bustin, Gyselman et al. 1999), neuroblastoma (Cheung and Cheung 2001) and prostate cancer (Gelmini, Tricarico et al. 2001). It has been used to quantify amplifications of oncogenes (Bieche, Laurendeau et al. 1999; Lehmann, Glöckner et al. 2000; Lyon, Millson et al. 2001; Konigshoff, Wilhelm et al. 2003) as well as deletions of tumor suppressor genes in tumor samples (Wilhelm and Pingoud 2003). Also, the response of human cancer to drugs has been studied (Au, Chim et al. 2002; Miyoshi, Ando et al. 2002;Reimer, Koczan et al. 2002). Other clinically relevant applications are cytokine mRNA profiling in immune response (Hempel, Smith et al. 2002; Stordeur, Poulin et al. 2002) and tissue-specific gene expression analysis (Bustin 2002; Poola 2003; Prieto-Alamo, Cabrera-Luque et al. 2003).
Also, the results of DNA chip experiments are validated by real-time PCR quantifications (Miyazato, Ueno et al. 2001; Rickman, Bobek et al. 2001;Crnogorac-Jurcevic, Efthimiou et al. 2002).
Chimerism analysis is possible when sequence-specific probes are utilized to differentiate and quantify alleles. High dynamic ranges can be achieved with allele-specific real-time PCR (Shively, Chang et al. 2003). Robust chimerism analyses with extremely large dynamic ranges based on insertion/deletion polymorphisms and on SNPs are also possible (Wilhelm, Reuter et al. 2002; Maas, Schaap et al. 2003). Genetic chimerisms have been monitored by Y-chromosome-specific real-time PCR for sex-mismatched transplantations (Fehse, Chukhlovin et al. 2001; Byrne, Huang et al. 2002; Elmaagacli 2002) and by allele-specific real-time PCR (Maas, Schaap et al. 2003; Shively, Chang et al. 2003). This combination of allele-specific amplification with real-time PCR has been shown to reveal detection limits of down to 0.01% for SNPs (Maas, Schaap et al. 2003). Real-time PCR is increasingly used in forensic analyses (Andreasson, Gyllensten et al. 2002; von Wurmb-Schwark, Higuchi et al. 2002; Ye, Parra et al. 2002), but also to monitor disease- or age-related accumulation of deletions in the mitochondrial genome (Mehmet, Ahmed et al. 2001; He, Chinnery et al. 2002).
Melting curve analyses are used for real-time competitive PCR (Al-Robaiy, Rupf et al. 2001; Lyon, Millson et al. 2001), gene dosage tests (Ruiz-Ponte, Loidi et al. 2000) and genotyping and SNP detection (Bullock, Bruns et al. 2002; Burian, Grosch et al. 2002; Randen, Sørensen et al. 2003). These applications will have a particularly strong impact on pharmacogenetics (Palladino, Kay et al. 2003). Profiling of DNA methylation is also possible by melting curve
www.intechopen.com

Overview of Real-Time PCR Principles
427
analysis (Worm, Aggerholm et al. 2001; Akey, Akey et al. 2002), which simplifies the analysis of epigenetic variations of the genome and developmental processes.
In brief, the advantages of real-time PCR are exploited in clinical diagnosis and the monitoring of infectious diseases and tumors. The technique is applied for the analysis of age dependent diseases, cytokine and tissue-specific expression, forensic samples, epigenetic factors like DNA methylation and for food monitoring. The field of applications is still growing rapidly, which suggests that real-time PCR will become one of the most important techniques in molecular life sciences and medicine (Wilhelm and Pingoud 2003).
12. Normalization
Gene expression analysis at the messenger RNA (mRNA) level has become increasingly important in biological research. Generally we detect RNAs to determine if differences protein expression could be explained at the transcriptional level. In particular, measurement of mRNA is needed in situations where quantification of the protein is difficult or cumbersome. Most recently, mRNA expression analysis is being used to provide insight into complex regulatory networks and to identify genes relevant to new biological processes or implicated in diseases (Hendriks-Balk, Michel et al. 2007).Common methods for RNA detection include: Northern blotting, in situ hybridization, qualitative RTPCR, RNase protection assay, competitive RT-PCR, microarray analysis, and quantitative real-time PCR. The specificity, wide dynamic range , ease-of-use , requiring a minimal amount of RNA, no post-PCR handling and avoiding the use of radioactivity, has made the real-time quantitative reverse transcription polymerase chain reaction (qRT-PCR) the method of choice for quantitating RNA levels (Radonic, Thulke et al. 2004). The technique has two main steps: CDNA synthesis by reverse transcription of mRNA and subsequent quantification of specific CDNAs by real-time PCR. It is in many cases the only method for measuring mRNA levels of vivo low copy number targets of interest for which alternative assays either do not exist or lack the required sensitivity so these specification has led to made it the "gold standard" for mRNA quantification (Huggett, Dheda et al. 2005). Most gene expression assays are based on the comparison of two or more samples and require uniform sampling conditions for this comparison to be valid. Unfortunately, many factors can contribute to variability in the analysis of samples, making the results difficult to reproduce between experiments. During the preparation of CDNA for real-time PCR analysis there is significant potential for small errors to accumulate. For example, differences in sample size, RNA extraction efficiency, pippetting accuracy and reverse transcription efficiency will all add variability to your samples (Huggett, Dheda et al. 2005). Not only can the quantity and quality of RNA extracted from multiple samples vary, but even replicates can vary dramatically due to factors such as sample degradation, extraction efficiency, and contamination. On the other hand, since many biological samples contain inhibitors of the RT and/or the PCR step, it is crucial to assess the presence of any inhibitors of polymerase activity in RT and PCR. so it is clear that we need to incorporate some normalization method to control for errors. The identification of a valid reference for data normalisation remains the most stubborn of problems and none of the solutions proposed are ideal. Normalization methods range from ensuring that a similar sample size is chosen to using an internal housekeeping or reference gene (Table 3) (Huggett, Dheda et al. 2005).
www.intechopen.com

Polymerase Chain Reaction
428
(Huggett, Dheda et al. 2005)
Table 3. Comparison of the actual amount of RNA used in different reverse transcription reactions with the respective amount of HuPO Comparison of the actual amount of RNA used in different reverse transcription reactions with the respective amount of HuPO cDNA measured by real-time RT-PCR
12.1 Methods of normalization
1. Standardizing Sample size
The most basic method of normalization ensures that an experiment compares similar
sample sizes and this is achieved by measuring tissue weight, volume or cell number. This
method can reduce the experimental error of first stage of qRT-PCR. It seems to be
straightforward, but we can’t ensure that equal volume of different samples contain the
same cellular material. Real-time RT-PCR experiments that rely on the extraction of RNA
from complex tissue samples are averaging the data from numerous, variable
subpopulations of cells of different lineage at different stages of differentiation (Bustin,
Benes et al. 2005). This can be misleading, as is illustrated when sampling a similar volume
of blood from HIV +ve patients. Patients with HIV that have less advanced
immunosupression (CD4 counts X200 cells/ml) will yield a higher amount RNA than
patients with CD4 counts p200 cells/ml. This is simply because there are fewer cells per
www.intechopen.com

Overview of Real-Time PCR Principles
429
milliliter of blood in the latter group. Even cellular subpopulations of the same pathological
origin can be highly heterogeneous. Tumor biopsies, in particular, are made up not just of
normal and cancer epithelial cells, but there may be several subclones of epithelial cancer
cells together with stromal, immune and vascular components (Vandesompele, De Preter et
al. 2002; Bustin, Benes et al. 2005). This variability can give us misleading or meaningless
result to solve this we can use laser capture microdissection to normalize against the
dissected area which can report the target mRNA levels conveniently as copies per area or
cell dissected. In in vitro cell culture, due to different morphologies or clumping up of cells,
it’s hard to determine sample size (cell number) .we can treat them with buffers and/or
enzymes till they could be counted, however these treatments surely could affect gene
expression. This approach could not be applied for solid tumors for which the amount of
cells cannot be determined accurately. To work around this problem, it was suggested to
standardize the RT-qPCR data between samples using the amount of genomic DNA as an
indicator reflecting the number of cells in each sample. However, these approaches do not
account for the degradation of RNA or the efficiency of RT and PCR. So, while ensuring a
similar sample size is important it clearly is not sufficient on its own (Huggett, Dheda et al.
2005).
2. Normalization with genomic DNA
Another method for normalization is measuring the amount of genomic DNA (gDNA). This
appears to be an ideal method as it does not require reverse transcription for detection by
real-time PCR (Bustin 2002). However, this approach do not account for the degradation of
RNA or the efficiency of RT and PCR. .Moreover, in the case of normalization with genomic
DNA, the fact of working with tumor cells can present additional problems because they
tend to have abnormal karyotype. Therefore, the ratio between the amount of DNA and cell
number is variable (Huggett, Dheda et al. 2005). Another major problem with using this
strategy is that RNA extraction procedures are usually not designed to purify DNA, so the
extraction rate may vary between different samples, with DNA yields often being low. In
conclude Normalization against genomic DNA is rarely used since it is difficult to coextract
with RNA and it may vary in copy number per cell (Huggett, Dheda et al. 2005).
3. Normalization with total RNA
The normalization of RT-qPCR results can be compared to the amount of total RNA used in the reverse transcription step. Not only does this facilitates normalization but circumvents problems associated with the linearity of the reverse transcriptase step. There are several methods for quantifying RNA; the most common is to measure the absorbance at 260 nm (A 260) with a UV spectrophotometer. The major advantage of this spectrometer, whose sensitivity is estimated at 5 ng/uL, is that it requires only 1 microL of sample, placed in direct contact with the optical system (Huggett, Dheda et al. 2005; Hendriks-Balk, Michel et al. 2007). However, contaminants absorbing at 260 nm, such as proteins, phenol or genomic DNA, can lead to overestimated results. Another optical system is flourimetry in which intercalating fluorescent nucleic acid is used, the kit RiboGreen ® Molecular Probes based on this principle. This is a more sensitive technique but does not discriminate RNA from DNA, and contaminants such as phenol can produce variable results (Huggett, Dheda et al. 2005). Since it is generally assumed that OD260 analysis is less accurate than the RiboGreen assay, we have compared RNA quantification data obtained using the RiboGreen assay with
www.intechopen.com
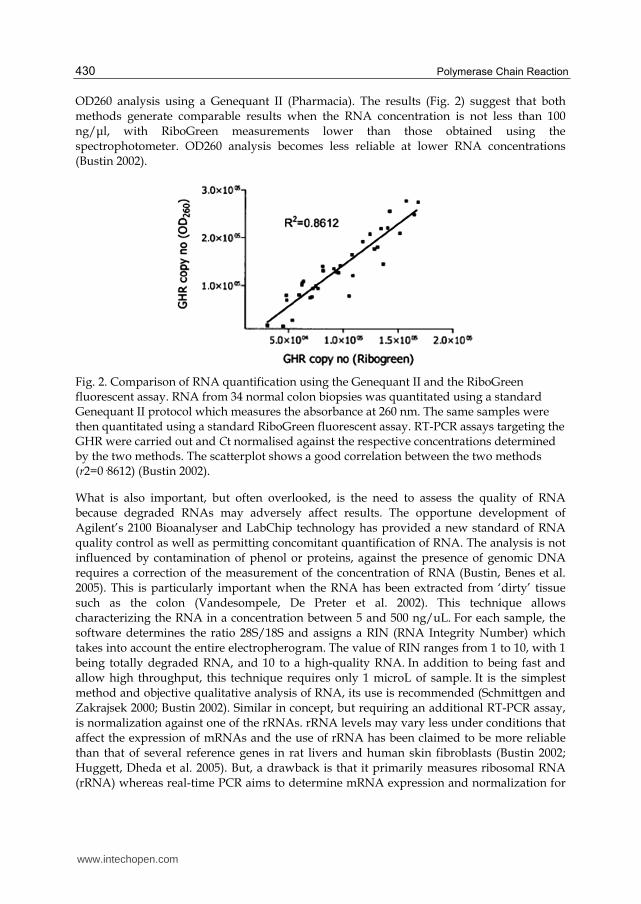
Polymerase Chain Reaction
430
OD260 analysis using a Genequant II (Pharmacia). The results (Fig. 2) suggest that both methods generate comparable results when the RNA concentration is not less than 100 ng/μl, with RiboGreen measurements lower than those obtained using the spectrophotometer. OD260 analysis becomes less reliable at lower RNA concentrations (Bustin 2002).
Fig. 2. Comparison of RNA quantification using the Genequant II and the RiboGreen fluorescent assay. RNA from 34 normal colon biopsies was quantitated using a standard Genequant II protocol which measures the absorbance at 260 nm. The same samples were then quantitated using a standard RiboGreen fluorescent assay. RT-PCR assays targeting the GHR were carried out and Ct normalised against the respective concentrations determined by the two methods. The scatterplot shows a good correlation between the two methods (r2=0·8612) (Bustin 2002).
What is also important, but often overlooked, is the need to assess the quality of RNA because degraded RNAs may adversely affect results. The opportune development of Agilent’s 2100 Bioanalyser and LabChip technology has provided a new standard of RNA quality control as well as permitting concomitant quantification of RNA. The analysis is not influenced by contamination of phenol or proteins, against the presence of genomic DNA requires a correction of the measurement of the concentration of RNA (Bustin, Benes et al. 2005). This is particularly important when the RNA has been extracted from ‘dirty’ tissue such as the colon (Vandesompele, De Preter et al. 2002). This technique allows characterizing the RNA in a concentration between 5 and 500 ng/uL. For each sample, the software determines the ratio 28S/18S and assigns a RIN (RNA Integrity Number) which takes into account the entire electropherogram. The value of RIN ranges from 1 to 10, with 1 being totally degraded RNA, and 10 to a high-quality RNA. In addition to being fast and allow high throughput, this technique requires only 1 microL of sample. It is the simplest method and objective qualitative analysis of RNA, its use is recommended (Schmittgen and Zakrajsek 2000; Bustin 2002). Similar in concept, but requiring an additional RT-PCR assay, is normalization against one of the rRNAs. rRNA levels may vary less under conditions that affect the expression of mRNAs and the use of rRNA has been claimed to be more reliable than that of several reference genes in rat livers and human skin fibroblasts (Bustin 2002; Huggett, Dheda et al. 2005). But, a drawback is that it primarily measures ribosomal RNA (rRNA) whereas real-time PCR aims to determine mRNA expression and normalization for
www.intechopen.com
Overview of Real-Time PCR Principles
431
total RNA assumes that the rRNA:mRNA ratio is the same in all groups, which might not always be the case. Moreover, rRNA is not present in purified mRNA and the high abundance of rRNA compared to mRNA makes it difficult to subtract the baseline value in realtime PCR analysis. Thus, markers of rRNA such as 18S or 28S rRNA might also be suboptimal as normalization factors in many settings (Hendriks-Balk, Michel et al. 2007). Also, it has been reported that rRNA transcription is affected by biological factors and drugs. An important parameter to consider when normalized relative to the RNA is the quality of it. Differences in the quality of the samples strongly depend on the extraction step and are the source of the most common variations in RT-qPCR. It is therefore important to use the same method of extraction for all samples analyzed (Vandesompele, De Preter et al. 2002). The quality of RNA is defined by both its purity (no contamination) and integrity (non-degraded RNA). Its purity was determined by measuring the absorbance at 230 (organic contaminants) and 280 nm (specific proteins), RNA is considered pure ratios A 260/ A 230 and A 260 / A 280 > 1.8. With regard to the integrity, the traditional method was to visualize the bands of 28S and 18S ribosomal RNA on a gel electrophoresis. Indeed, it is difficult to analyze directly the mRNA; they represent only 1% to 3% of total RNA. We must therefore consider that the degradation of ribosomal RNA, the majority, reflecting the degradation of mRNA. Thus, the 18S/28S ratio assesses the integrity of RNA; a ratio close to 2 is considered an indicator of RNA with little or no gradient. However, this method requires a large amount of RNA (0.5-2 mg), and is not sensitive enough to detect slight damage. Normalizing a sample against total RNA has the drawback of not controlling for variation inherent in the reverse transcription or PCR reactions and it ignores the efficiency of converting RNA into CDNA. Also rRNA cannot be used for normalization when quantifying targets from polyA-enriched samples (Huggett, Dheda et al. 2005). A final drawback when using total RNA for normalization is the lack of internal control for RT or PCR inhibitors. All quantitative methods assume that the RNA targets are reverse transcribed and subsequently amplified with similar efficiency but the reaction is extremely sensitive to the presence of inhibitors, which can be reagents used in the extraction step (salts, alcohols, phenols), or components copurification organic (urea, heme, heparin, immunoglobulin G). These compounds can also inhibit the PCR reaction. Thus, two reactions with an equal amount of RNA, but the efficiencies of RT and / or PCR are different, will yield results that cannot be compared. Different methods exist to assess the presence of inhibitors in biological samples. First, it is possible to compare the efficacy of PCR for different dilutions (1/20 and 1/80 for example) of a sample. An alternative is to add a defined amount of a synthetic single-stranded amplicon CDNA samples, and comparing its amplification compared to a control without CDNA. However, these methods are limited to verify the absence of PCR inhibitors, and do not evaluate the effectiveness of the reverse transcription step (Bustin 2002).
4. Normalization with an artificial molecule (spike)
An interesting solution to control the two enzymatic reactions (RT and PCR) is added to
RNA extracted an exogenous RNA, which will compare the amplification between the
different samples. This sequence control should show no similarity to the target RNA, we
will use such a specific mRNA from a plant when studying gene expression in humans. The
main criticism of using spikes is that, while they can be introduced prior to extraction,
unlike the cellular RNAs they are not extracted from within the tissue. Consequently, there
www.intechopen.com

Polymerase Chain Reaction
432
may be situations (e.g. if the samples differ histologically) when the spike may not be a good
control for the extraction procedure. The stages required to generate the alien molecule may
also not be feasible for small laboratories wanting to perform limited amounts of real-time
RTPCR (Schmittgen and Zakrajsek 2000; Argyropoulos, Psallida et al. 2006).
5. Normalization with reference genes
Reference genes represent the by far most common method for normalizing qRT-PCR data. Reference genes are often referred to as housekeeping genes assuming that those genes are expressed at a constant level in various tissues at all stages of development and are unaffected by the experimental treatment (Hendriks-Balk, Michel et al. 2007; Balogh, Paragh et al. 2008). Use of this endogenous control theory allows controlling all stages of the experimental protocol; its expression reflects not only the quantity and quality of RNA used, but the efficiencies of the RT and PCR. An advantage of reference genes as compared to total or rRNA is that the reference gene is subject to the same conditions as the mRNA of interest (Hendriks-Balk, Michel et al. 2007). The most commonly used reference genes include β-actin (ACTB), (GAPDH), (HPRT) and 18S rRNA. The other commonly used reference genes would be PGK1, B2M, GAPD, HMBS, HPRT1, RPL13A, SDHA, TBP, UBC and YWHAZ (Vandesompele, De Preter et al. 2002). The initial concentration of a target is usually derived from the CT (cycle threshold), which is the number of amplification cycles where the amplification curve crosses the threshold line. This line is placed at the exponential phase, so as to be clearly distinguishable from background noise. For each sample, the CT obtained for the genes of interest and reference must be converted to normalized expression ratio. For this, various options are available, they are integrated in the software provided with the various qPCR instruments or described in the literature. The relative standard curve method requires the construction, for the target gene and reference gene, a range made from a series of dilutions of a reference sample. These ranges to obtain standard curves, obtained by expressing the CT as a function of log of the initial concentration of cDNA. Concentration values for each point of the range can be set arbitrarily in accordance with the dilution factors. Therefore, the relative amount of a target is determined by the CT by interpolation with the standard curve. The standard expression of a gene of interest is determined by the following formula:
R= 馴賑如尼禰日寧賑 尼尿任祢韮禰 任肉 禰廿賑 虹賑韮賑 任肉 日韮禰認賑濡禰眺勅鎮銚痛沈塚勅 銚陳墜通津痛 墜捗 痛朕勅 追勅捗追勅津頂勅 直勅津勅
In addition, a calibrator is typically used. This is a sample used as a basis for comparing results. The normalized ratio of each sample is divided by the normalized ratio of the calibrator. Thus, the calibrator becomes the reference 1x, and all other samples are expressed as a ratio relative to the calibrator. The method of ΔΔC T uses a mathematical formule to calculate the ratio of expression of a target gene between two samples, normalized with reference gene. First, the differences ΔC T between the values of CT target gene and reference gene were determined for the test sample and control.
ΔCT (sample) = CT (target sample) - CT (reference sample)
ΔCt (control) = CT (target control) - CT (reference control)
www.intechopen.com

Overview of Real-Time PCR Principles
433
Next, the ΔΔCT between control and the sample is calculated:
ΔΔCT ΔCT (control) - ΔCT (sample)
Finally, the normalized ratio of expression of a target gene is determined by the formula: 2 -ΔΔCT.
Unlike the relative standard curve method, where the amplification efficiency (E) target genes and reference is directly taken into account when building ranges, the method of ΔΔCT is assumed that the efficiencies of the two genes are equal to 100% (E = 2, with each cycle of the exponential phase, the concentration of PCR products is doubled). However, a difference in PCR efficiency of 3% (ΔE = 0.03) between the two genes results in an error of 47% for the ratio of expression if E target <E ref and 209% if E target > E ref after 25 cycles. In addition, the error increases exponentially with larger variations of efficiency and a greater number of cycles. New models have been developed taking into account the efficiency of PCR target gene and reference gene. The most common is the model of Pfaffl, where the relative expression ratio (R) of a target gene between a sample and control is determined by the following formula:
R = 岫帳盗倒梼塔刀盗 岻Δ電 砥盗倒梼塔刀盗岫冬搭投盗梼搭嶋 貼棟倒悼東嶋刀 岻岫帳梼刀唐刀梼刀投冬刀 岻Δ電 砥梼刀唐刀梼刀投冬刀岫冬搭投盗梼搭嶋 貼棟倒悼東嶋刀 岻
In this model of Pfaffl, the efficiency of PCR for a given gene is calculated from the construction of a calibration curve using the following formula: E = 10 [-1/ gradient]. This method gives a good estimate of effectiveness, although it is possible that it is overestimated. However, this approach assumes that the amplification efficiencies between the diluted samples are identical, creating a linear relationship between C T and amount of CDNA in the beginning. Therefore, some authors such as Liu and Saint have developed models that take into account standards of efficiency for each sample, the latter being determined by the kinetics of the amplification curve. However, with this kind of approach, the slightest error in the measurement of effectiveness is amplified and passed exponentially on the expression ratio calculated. The different models of normalization with reference genes therefore have all the advantages and disadvantages. At present, there is no time-honored method for the treatment of the results of RT-qPCR. Normalization to a reference gene is a simple method and frequently used because it can control many variables. An advantage of reference genes as compared to total or rRNA is that the reference gene is subject to the same conditions as the mRNA of interest (Bustin, Benes et al. 2005; Hendriks-Balk, Michel et al. 2007). What has become apparent over recent years is that there is no single reference gene for all experimental systems. Quantified errors related to the use of a single reference gene as more than three-fold in 25% and more than six-fold in 10% of samples. Today it is clear that reference genes must be carefully validated for each experimental situation and those new experimental conditions or different tissue samples require re-validation of the chosen reference genes (Balogh, Paragh et al. 2008). If inappropriate reference genes are used for normalization, the experimental results obtained can differ greatly from those using a validated reference gene. Validation of a reference gene requires removal of any non-specific variation in expression. This can be done using a
www.intechopen.com

Polymerase Chain Reaction
434
recently introduced program called geNorm (freely available at http://medgen.ugent.be/~jvdesomp/genorm/) that mathematically identifies the most suitable reference gene for a given experimental condition. Because of the inherent variation in the expression of reference genes the use of multiple reference genes rather than one reference gene is recommended to ensure reliable normalization of real-time PCR. Several statistical programs can help to determine the most appropriate reference gene or set of genes (Hendriks-Balk, Michel et al. 2007; Borges, Ferreira et al. 2010).
13. Abbreviation
ACTB: Beta actin B2M: Beta-2-microglobulin CT: Threshold Cycle FRET: Fluorescence Resonance Energy Transfer GAPD: Glyceraldehyde-3- phosphate dehydrogenase HMBS: Hydroxymethyl-bilane synthase HPRT: hypoxanthine ribosyltransferase HPRT1: Hypoxanthine phosphoribosyl-transferase 1 HRM: High Resolution Melting KPCR: Kinetic Polymerase Chain Reaction LNA: Locked Nucleic Acid LUX: Light Upon Extension PCR: Polymerase Chain Reaction PGK1: phosphoglycerokinase 1 PNA: Peptide Nucleic Acid Q-PCR (QRT-PCR): Quantitative Real-Time Polymerase Chain Reaction RPL13A: Ribosomal protein L13a RT PCR: Reverse transcription PCR SDHA: Succinate dehydrogenase complex, subunit A TBP: TATA box binding protein Tm: Melting Point UBC: Ubiquitin C YWHAZ: Tyrosine 3-monooxygenase/ tryptophan 5-monooxygenase activation protein, zeta polypeptide
14. References
Ahmad, A. I. (2007). "BOXTO as a real-time thermal cycling reporter dye." Journal of Biosciences32(2): 229-239.
Akey, D. T., J. M. Akey, et al. (2002). "Assaying DNA methylation based on high-throughput melting curve approaches." Genomics80(4): 376-384.
Akey, J., D. Sosnoski, et al. (2001). "Research Report Melting Curve Analysis of SNPs (McSNP®): A Gel-Free and Inexpensive Approach for SNP Genotyping." Biotechniques30(2): 358-367.
Al-Robaiy, S., S. Rupf, et al. (2001). "Research Report Rapid Competitive PCR Using Melting Curve Analysis for DNA Quantification." Biotechniques31(6): 1382-1388.
www.intechopen.com
Overview of Real-Time PCR Principles
435
Amabile, M., B. Giannini, et al. (2001). "Real-time quantification of different types of bcr-abl transcript in chronic myeloid leukemia." Haematologica86(3): 252-259.
Andreasson, H., U. Gyllensten, et al. (2002). "Real-time DNA quantification of nuclear and mitochondrial DNA in forensic analysis." Biotechniques33(2): 402-411.
Au, W. Y., C. S. Chim, et al. (2002). "Real-time quantification of multidrug resistance-1 gene expression in relapsed acute promyelocytic leukemia treated with arsenic trioxide." Haematologica87(10): 1109-1111.
Ausubel, F. M., R. Brent, et al. (2005). "Current Protocols in Molecular Biology." Hoboken, NJ: Wiley.
Bengtsson, M., H. J. Karlsson, et al. (2003). "A new minor groove binding asymmetric cyanine reporter dye for real-time PCR." Nucleic Acids Res31(8): e45.
Bernard, P. S., R. S. Ajioka, et al. (1998). "Homogeneous multiplex genotyping of hemochromatosis mutations with fluorescent hybridization probes." The American journal of pathology153(4): 1055-1061.
Bernard, P. S. and C. T. Wittwer (2000). "Homogeneous amplification and variant detection by fluorescent hybridization probes." Clinical chemistry46(2): 147-148.
Bieche, I., I. Laurendeau, et al. (1999). "Quantitation of MYC gene expression in sporadic breast tumors with a real-time reverse transcription-PCR assay." Cancer Res59(12): 2759-2765.
Bio-Rad Laboratories, I. n. c. (2006). "Real-Time PCR Applications Guide." BioInformatics (2003). "The Market for Real-Time PCR Reagents & Instrumentation."
Arlington VA: BioInformatics. Bonnet, G., S. Tyagi, et al. (1999). "Thermodynamic basis of the enhanced specificity of
structured DNA probes." Proc Natl Acad SciUSA 96(5): 6171-6176. Braasch, D. A. and D. R. Corey (2001). "Locked nucleic acid (LNA): fine-tuning the
recognition of DNA and RNA." Chem Biol8(1): 1-7. Brown, P. O. and D. Botstein (1999). "Exploring the new world of the genome with DNA
microarrays." Nat Genet21: 33-37. Bullock, G. C., D. E. Bruns, et al. (2002). "Hepatitis C genotype determination by melting
curve analysis with a single set of fluorescence resonance energy transfer probes." Clinical chemistry48(12): 2147-2154.
Burian, M., S. Grosch, et al. (2002). "Validation of a new fluorogenic real-time PCR assay for detection of CYP2C9 allelic variants and CYP2C9 allelic distribution in a German population." Br J Clin Pharmacol54(5): 518-521.
Bustin, S., V. Gyselman, et al. (1999). "Detection of cytokeratins 19/20 and guanylyl cyclase C in peripheral blood of colorectal cancer patients." British Journal of Cancer79(11/12): 1813-1820.
Bustin, S. A. (2000). "Absolute quantification of mRNA using real-time reverse transcription polymerase chain reaction assays." J Mol Endocrinol 25: 169-193.
Bustin, S. A. (2002). "Quantification of mRNA using real-time reverse transcription PCR (RT-PCR): trends and problems." J Mol Endocrinol29(1): 23-39.
Bustin, S. A. and T. Nolan (2004). "Pitfalls of quantitative real-time reverse-trasncription polymerase chain reaction." J Biomol Tech15: 155-166.
Byrne, P., W. Huang, et al. (2002). "Chimerism analysis in sex-mismatched murine transplantation using quantitative real-time PCR." Biotechniques32(2): 279-286.
Caplin, B. E., R. P. Rasmussen, et al. (1999). "LightCyclerTM hybridization probes- the most direct way to monitor PCR amplification and mutation detection." Biochemica1: 5-8.
www.intechopen.com
Polymerase Chain Reaction
436
Cheung, I. Y. and N. K. Cheung (2001). "Quantitation of marrow disease in neuroblastoma by real-time reverse transcription-PCR." Clin Cancer Res7(6): 1698-1705.
Chiang, P. W., W. L. Wei, et al. (1999). "A fluorescent quantitative PCR approach to map gene deletions in the Drosophila genome." Genetics153(3): 1313-1316.
Costa, J. M., P. Ernault, et al. (2004). "Chimeric LNA/DNA probes as a detection system for real-time PCR." Clin Biochem37(10): 930-932.
Crnogorac-Jurcevic, T., E. Efthimiou, et al. (2002). "Expression profiling of microdissected pancreatic adenocarcinomas." Oncogene21(29): 4587-4594.
Crockett, A. O. and C. T. Wittwer (2001). "Fluorescein-labeled oligonucleotides for real-time pcr: using the inherent quenching of deoxyguanosine nucleotides." Anal Biochem290(1): 89-97.
Egholm, M., O. Buchardt, et al. (1992). "Peptide nucleic acids (PNA). Oligonucleotide analogs with an achiral peptide backbone." J Am Chem Soc114: 1895-1897.
Elmaagacli, A., D. Beelen, et al. (2000). "The amount of BCR-ABL fusion transcripts detected by the real-time quantitative polymerase chain reaction method in patients with Philadelphia chromosome positive chronic myeloid leukemia correlates with the disease stage." Annals of hematology79(8): 424-431.
Elmaagacli, A. H. (2002). "Real-time PCR for monitoring minimal residual disease and chimerism in patients after allogeneic transplantation." Int J Hematol76 Suppl 2: 204-205.
Espy, M. J., J. R. Uhl, et al. (2006). "Real-time PCR in clinical microbiology: applications for routine laboratory testing." Clin Microbiol Rev19(1): 165-256.
Fehse, B., A. Chukhlovin, et al. (2001). "Real-time quantitative Y chromosome-specific PCR (QYCS-PCR) for monitoring hematopoietic chimerism after sex-mismatched allogeneic stem cell transplantation." J Hematother Stem Cell Res10(3): 419-425.
Fronhoffs, S., G. Totzke, et al. (2002). "A method for the rapid construction of cRNA standard curves in quantitative real-time reverse transcription polymerase chain reaction." Molecular and cellular probes16(2): 99-110.
Gelmini, S., C. Tricarico, et al. (2001). "Real-Time quantitative reverse transcriptase-polymerase chain reaction (RT-PCR) for the measurement of prostate-specific antigen mRNA in the peripheral blood of patients with prostate carcinoma using the taqman detection system." Clin Chem Lab Med39(5): 385-391.
Gerard, C. J., K. Olsson, et al. (1998). "Improved quantitation of minimal residual disease in multiple myeloma using real-time polymerase chain reaction and plasmid-DNA complementarity determining region III standards." Cancer research58(17): 3957-3964.
Gibson, U. E., C. A. Heid, et al. (1996). "A novel method for real time quantitative RT-PCR." Genome Res6(10): 995-1001.
Gilliland, G., S. Perrin, et al. (1990). "Analysis of cytokine mRNA and DNA: detection and quantitation by competitive polymerase chain reaction." Proceedings of the National Academy of Sciences87(7): 2725-2729.
Giulietti, A., L. Overbergh, et al. (2001). "An overview of real-time quantitative PCR: applications to quantify cytokine gene expression." Methods25(4): 386-401.
Goerke, C., M. G. Bayer, et al. (2001). "Quantification of bacterial transcripts during infection using competitive reverse transcription-PCR (RT-PCR) and LightCycler RT-PCR." Clinical and Vaccine Immunology8(2): 279-282.
www.intechopen.com

Overview of Real-Time PCR Principles
437
Grant, S. F. A., S. Steinlicht, et al. (2002). "SNP genotyping on a genome‐wide amplified DOP‐PCR template." Nucleic Acids Research30(22): e125-e125.
He, L., P. F. Chinnery, et al. (2002). "Detection and quantification of mitochondrial DNA deletions in individual cells by real-time PCR." Nucleic Acids Res30(14): e68.
Heid, C. A., J. Stevens, et al. (1996). "Real time quantitative PCR." Genome Res6(10): 986-994. Hempel, D. M., K. A. Smith, et al. (2002). "Analysis of cellular immune responses in the
peripheral blood of mice using real-time RT-PCR." J Immunol Methods259(1-2): 129-138.
Hernandez, M., A. Rio, et al. (2001). "A rapeseed-specific gene, acetyl-CoA carboxylase, can be used as a reference for qualitative and real-time quantitative PCR detection of transgenes from mixed food samples." J Agric Food Chem49(8): 3622-3627.
Higuchi, R., G. Dollinger, et al. (1992). "Simultaneous amplification and detection of specific DNA sequences." Biotechnology10: 413-417.
Higuchi, R., C. Fockler, et al. (1993). "Kinetic PCR analysis: real-time monitoring of DNA amplification reactions." Biotechnology (N Y)11(9): 1026-1030.
Holland, P. M., R. D. Abramson, et al. (1991). "Detection of specific polymerase chain reaction product by utilizing the 5´ → 3´ exonuclease activity of Thermus aquaticus DNA polymerase." Proc Natl Acad SciUSA 88(16): 7276-7280.
Isacsson, J., H. Cao, et al. (2000). "Rapid and specific detection of PCR products using light-up probes." Molecular and cellular probes14(5): 321-328.
Jansen, K., B. Norde´n, et al. (1993). "Sequence dependence of 40,6-diamidino-2-phenylindole (DAPI)-DNA interactions." J Am Chem Soc115: 10527-10530.
Klein, D. (2002). "Quantification using real-time PCR technology: applications and limitations." Trends Mol Med8(6): 257-260.
Konigshoff, M., J. Wilhelm, et al. (2003). "HER-2/neu gene copy number quantified by real-time PCR: comparison of gene amplification, heterozygosity, and immunohistochemical status in breast cancer tissue." Clin Chem49(2): 219-229.
Krauter, J., G. Heil, et al. (2001). "The AML1/MTG8 Fusion Transcript in t (8; 21) Positive AML and its Implication for the Detection of Minimal Residual Disease; Malignancy." Hematology (Amsterdam, Netherlands)5(5): 369-381.
Krauter, J., W. Hoellge, et al. (2001). "Detection and quantification of CBFB/MYH11 fusion transcripts in patients with inv(16)-positive acute myeloblastic leukemia by real-time RT-PCR." Genes Chromosomes Cancer30(4): 342-348.
Kubista, M. (2004). "Nucleic acid-based technologies: application amplified." Pharmacogenomics5(6): 767-773.
Kubista, M., J. M. Andrade, et al. (2006). "The real-time polymerase chain reaction." Molecular Aspects of Medicine27 95-125.
Kurata, S., T. Kanagawa, et al. (2001). "Fluorescent quenching-based quantitative detection of specific DNA/RNA using a BODIPY® FL-labeled probe or primer." Nucleic Acids Research29(6): e34.
Kutyavin, I. V., I. A. Afonina, et al. (2000). "3´-Minor groove binder-DNA probes increase sequence specificity at PCR extension temperatures." Nucleic Acids Res28(2): 655-661.
Lay, M. J. and C. T. Wittwer (1997). "Real-time fluorescence genotyping of factor V Leiden during rapid-cycle PCR." Clin Chem43(12): 2262-2267.
www.intechopen.com
Polymerase Chain Reaction
438
Le Pecq, J. B. and C. Paoletti (1966). "A new fluorometric method for RNA and DNA determination." Anal Biochem17: 100-107.
Lehmann, U., S. Glöckner, et al. (2000). "Detection of gene amplification in archival breast cancer specimens by laser-assisted microdissection and quantitative real-time polymerase chain reaction." Am J Pathol156(6): 1855-1864.
Li, Qingge, et al. (2002). "A new class of homogeneous nucleic acid probes based on specific displacement hybridization." Nucleic Acids Res30: e5.
Lin, M. H., C. H. Tseng, et al. (2001). "Real-time PCR for rapid genotyping of angiotensin-converting enzyme insertion/deletion polymorphism1." Clinical biochemistry34(8): 661-666.
Lind, K., A. Stahlberg, et al. (2006). "Combining sequence-specific probes and DNA binding dyes in real-time PCR for specific nucleic acid quantification and melting curve analysis." Biotechniques40(3): 315-319.
Liss, B. (2002). "Improved quantitative real-time RT-PCR for expression profiling of individual cells." Nucleic Acids Res30(17): e89.
Liu, W. and D. A. Saint (2002). "A new quantitative method of real time reverse transcription polymerase chain reaction assay based on simulation of polymerase chain reaction kinetics." Analytical Biochemistry302(1): 52-59.
Liu, W. and D. A. Saint (2002). "Validation of a quantitative method for real time PCR kinetics." Biochem Biophys Res Commun294(2): 347-353.
Livak, K. J. and T. D. Schmittgen (2001). "Analysis of relative gene expression data using real-time quantitative PCR and the 2(-Delta Delta C(T)) Method." Methods25(4): 402-408.
Locatelli, G., V. Urso, et al. (2000). "Quantitative analysis of GMO food contaminations using real time PCR." Ital J Biochem49(3-4): 61-63.
Luu-The, V., N. Paquet, et al. (2005). "Improved real-time RT-PCR method for high-throughput measurements using second derivative calculation and double correction." Biotechniques38(2): 287-293.
Lyon, E., A. Millson, et al. (2001). "Quantification of HER2/neu gene amplification by competitive PCR using fluorescent melting curve analysis." Clinical chemistry47(5): 844-851.
Maas, F., N. Schaap, et al. (2003). "Quantification of donor and recipient hemopoietic cells by real-time PCR of single nucleotide polymorphisms." Leukemia17(3): 621-629.
Mackay, I. M. (2004). "Real-time PCR in the microbiology laboratory." Clin Microbiol Infect10(3): 190-212.
Mackay, I. M., K. E. Arden, et al. (2002). "Real-time PCR in virology." Nucleic Acids Res30(6): 1292-1305.
Mackya, I. M. (2004). "Real-time PCR in the microbiology laboratory." Clin Microbiol Infect10: 190-212.
Marcucci, G., K. Livak, et al. (1998). "Detection of minimal residual disease in patients with AML1/ETO-associated acute myeloid leukemia using a novel quantitative reverse transcription polymerase chain reaction assay." Leukemia: official journal of the Leukemia Society of America, Leukemia Research Fund, UK12(9): 1482-1489.
Mattarucchi, E., M. Marsoni, et al. (2005). "Different real time PCR approaches for the fine quantification of SNP's alleles in DNA pools: assays development, characterization and pre-validation." J Biochem Mol Biol38(5): 555-562.
www.intechopen.com
Overview of Real-Time PCR Principles
439
Mehmet, D., F. Ahmed, et al. (2001). "Quantification of the common deletion in human testicular mitochondrial DNA by competitive PCR assay using a chimaeric competitor." Molecular human reproduction7(3): 301-306.
Mhlanga, M. M. and L. Malmberg (2001). "Using molecular beacons to detect single-nucleotide polymorphisms with real-time PCR." Methods25(4): 463-471.
Miyazato, A., S. Ueno, et al. (2001). "Identification of myelodysplastic syndrome–specific genes by DNA microarray analysis with purified hematopoietic stem cell fraction." Blood98(2): 422-427.
Miyoshi, Y., A. Ando, et al. (2002). "Prediction of response to docetaxel by CYP3A4 mRNA expression in breast cancer tissues." International Journal of Cancer97(1): 129-132.
Muller, P. Y., H. Janovjak, et al. (2002). "Processing of gene expression data generated by quantitative real-time RT-PCR." Biotechniques32(6): 1372-1379.
Mullis, K. B. (1990). "The unusual origin of the polymerase chain reaction." Sci Am262: 56-61. Mullis, K. B. and F. A. Faloona (1987). "Specific synthesis of DNA in vitro via a polymerase-
catalyzed chain reaction." Methods Enzymol155: 335-350. Myi, Q. "single-color real-time PCR instruction manual Biorad Company." Nazarenko, I., B. Lowe, et al. (2002). "Multiplex quantitative PCR using self-quenched
primers labelled with a single fluorophore." Nucleic Acids Res30(9): e37. Nazarenko, I. A., S. Bhatnagar, et al. (1997). "A closed tube format for amplification and
detection of DNA based on energy transfer." Nucleic Acids Research25(12): 2516-2521.
Nigro, J. M., M. A. Takahashi, et al. (2001). "Detection of 1p and 19q loss in oligodendroglioma by quantitative microsatellite analysis, a real-time quantitative polymerase chain reaction assay." The American journal of pathology158(4): 1253-1262.
Norton, D. M. (2002). "Polymerase chain reaction-based methods for detection of Listeria monocytogenes: toward real-time screening for food and environmental samples." Journal of AOAC International85(2): 505-515.
Nygren, J., N. Svanvik, et al. (1998). "The interaction between the fluorescent dye thiazole orange and DNA." Biopolymers46: 39-51.
Olson, M., L. Hood, et al. (1989). "A common language for physical mapping of the human genome." Science245: 1434-1435.
Palladino, S., I. D. Kay, et al. (2003). "Real-time PCR for the rapid detection of vanA and vanB genes." Diagn Microbiol Infect Dis45(1): 81-84.
Pfaffl, M. W. (2001). "A new mathematical model for relative quantification in real-time RT-PCR." Nucleic Acids Res29(9): e45.
Pfaffl, M. W., A. Tichopad, et al. (2004). "Determination of stable housekeeping genes, differentially regulated target genes and sample integrity: BestKeeper–Excel-based tool using pair-wise correlations." Biotechnology letters26(6): 509-515.
Poola, I. (2003). "Molecular assay to generate expression profile of eight estrogen receptor alpha isoform mRNA copy numbers in picogram amounts of total RNA from breast cancer tissues." Analytical Biochemistry314(2): 217-226.
Prieto-Alamo, M. J., J. M. Cabrera-Luque, et al. (2003). "Absolute quantitation of normal and ROS-induced patterns of gene expression: an in vivo real-time PCR study in mice." Gene Expr11(1): 23-34.
www.intechopen.com

Polymerase Chain Reaction
440
Randen, I., K. Sørensen, et al. (2003). "Rapid and reliable genotyping of human platelet antigen (HPA)‐1,‐2,‐3,‐4, and‐5 a/b and Gov a/b by melting curve analysis." Transfusion43(4): 445-450.
Reimer, T., D. Koczan, et al. (2002). "Tumour Fas ligand: Fas ratio greater than 1 is an independent marker of relative resistance to tamoxifen therapy in hormone receptor positive breast cancer." Breast Cancer Research4(5): R9.
Reischl, U., C. T. Wittwer, et al. (2002). "Rapid Cycle Real-time PCR: Methods and Applications; Microbiology and Food Analysis." New York: Springer-Verlag.
Rickman, D. S., M. P. Bobek, et al. (2001). "Distinctive molecular profiles of high-grade and low-grade gliomas based on oligonucleotide microarray analysis." Cancer research61(18): 6885-6891.
Ririe, K. M., R. P. Rasmussen, et al. (1997). "Product differentiation by analysis of DNA melting curves during the polymerase chain reaction." Anal Biochem245(2): 154-160.
Ruiz-Ponte, C., L. Loidi, et al. (2000). "Rapid real-time fluorescent PCR gene dosage test for the diagnosis of DNA duplications and deletions." Clin Chem46(10): 1574-1582.
Saiki, R. K., S. Scharf, et al. (1985). "Enzymatic amplification of beta-globin genomic sequences and restriction site analysis for diagnosis of sickle cell anemia." Science230: 1350-1354.
Sails, A. D., A. J. Fox, et al. (2003). "A real-time PCR assay for the detection of Campylobacter jejuni in foods after enrichment culture." Appl Environ Microbiol69(3): 1383-1390.
Sasvari‐Szekely, M., A. Gerstner, et al. (2000). "Rapid genotyping of factor V Leiden mutation using single‐tube bidirectional allele‐specific amplification and automated ultrathin‐layer agarose gel electrophoresis." Electrophoresis21(4): 816-821.
Shively, L., L. Chang, et al. (2003). "Real-time PCR assay for quantitative mismatch detection." Biotechniques34(3): 498-502, 504.
Sjöback, R., J. Nygren, et al. (1995). "Absorption and fluorescence properties of fluorescein Spetrochim." Acta PartA 51: L7-L21.
Soheili, Z. and S. Samiei (2005). "Real Time PCR: Principles and Application." Hepatitis5(3): 83-87.
Solinas, A., L. J. Brown, et al. (2001). "Duplex Scorpion primers in SNP analysis and FRET applications." Nucleic Acids Research29(20): e96-e96.
Souaze, F., A. Ntodou-Thome, et al. (1996). "Quantitative RT-PCR: limits and accuracy." Biotechniques21(2): 280-285.
Stordeur, P., L. F. Poulin, et al. (2002). "Cytokine mRNA quantification by real-time PCR." J Immunol Methods259(1-2): 55-64.
Svanvik, N., A. Stahlberg, et al. (2000). "Detection of PCR products in real time using light-up probes." Anal Biochem287(1): 179-182.
Svanvik, N., G. Westman, et al. (2000). "Light-up probes: thiazole orange-conjugated peptide nucleic acid for detection of target nucleic acid in homogenous solution." Anal Biochem281: 26-35.
Thelwell, N., S. Millington, et al. (2000). "Mode of action and application of Scorpion primers to mutation detection." Nucleic Acids Research28(19): 3752-3761.
www.intechopen.com

Overview of Real-Time PCR Principles
441
Tyagi, S., D. P. Bratu, et al. (1998). "Multicolor molecular beacons for allele discrimination." Nat Biotechnol16(1): 49-53.
Tyagi, S. and F. R. Kramer (1996). "Molecular Beacons: probes that fluorescence upon hybridization." Nat Biotechnol14(3): 303-308.
Uehara, H., G. Nardone, et al. (1999). "Detection of telomerase activity utilizing energy transfer primers: comparison with gel- and ELISA-based detection." Biotechniques26(3): 552-558.
Ulvik, A. and P. M. Ueland (2001). "Single nucleotide polymorphism (SNP) genotyping in unprocessed whole blood and serum by real-time PCR: application to SNPs affecting homocysteine and folate metabolism." Clin Chem47(11): 2050-2053.
Valasek, M. A. and J. J. Repa (2005). "The power of real-time PCR." Adv Physiol Educ29(3): 151-159.
Verhagen, O. J., M. J. Willemse, et al. (2000). "Application of germline IGH probes in real-time quantitative PCR for the detection of minimal residual disease in acute lymphoblastic leukemia." Leukemia14(8): 1426-1435.
von Wurmb-Schwark, N., R. Higuchi, et al. (2002). "Quantification of human mitochondrial DNA in a real time PCR." Forensic Sci Int126(1): 34-39.
Whitcombe, D., J. Brownie, et al. (1998). "A homogeneous fluorescence assay for PCR amplicons: its application to real-time, single-tube genotyping." Clin Chem44(5): 918-923.
Whitcombe, D., J. Theaker, et al. (1999). "Detection of PCR products using self-probing amplicons and fluorescence." Nat Biotechnol17(8): 804-807.
Wilhelm, J. and A. Pingoud (2003). "Real‐time polymerase chain reaction." Chembiochem4(11): 1120-1128.
Wilhelm, J., A. Pingoud, et al. (2003). "Real-time PCR-based method for the estimation of genome sizes." Nucleic Acids Res31(10): e56.
Wilhelm, J., A. Pingoud, et al. (2003). "SoFAR: software for fully automatic evaluation of real-time PCR data." Biotechniques34(2): 324-332.
Wilhelm, J., H. Reuter, et al. (2002). "Detection and quantification of insertion/deletion variations by allele-specific real-time PCR: application for genotyping and chimerism analysis." Biol Chem383(9): 1423-1433.
Wilson, I. G. (1997). "Inhibition and facilitation of nucleic acid amplification." Appl Environ Microbiol63: 3741-3751.
Wilson, R. and M. K. Johansson (2003). "Photoluminescence and electrochemiluminescence of a Ru(II) (bpy)3- quencher dual-labeled oligonucleotide probe." Chem Commun21: 2710-2711.
Wittwer, C. T., M. G. Herrmann, et al. (2001). "Real-time multiplex PCR assays." Methods25(4): 430-442.
Wittwer, C. T., M. G. Herrmann, et al. (1997). "Continuous fluorescence monitoring of rapid cycle DNA amplification." Biotechniques22: 130-138.
Wong, M. L. and J. F. Medrano (2005). "Real-time PCR for mRNA quantitation." Biotechniques39(1): 75-85.
Worm, J., A. Aggerholm, et al. (2001). "In-tube DNA methylation profiling by fluorescence melting curve analysis." Clinical chemistry47(7): 1183 -1189.
Ye, J., E. J. Parra, et al. (2002). "Melting Curve SNP (McSNP) Genotying: a Useful Approach for Diallelic Genotyping in Forensic Science." Journal of forensic sciences47(3): 593-600.
www.intechopen.com

Polymerase Chain Reaction
442
Zipper, H., H. Brunner, et al. (2004). "Investigations on DNA intercalation and surface binding by SYBR Green I, its structure determination and methodological implications." Nucleic Acids Res32(12): e103.
www.intechopen.com

Polymerase Chain ReactionEdited by Dr Patricia Hernandez-Rodriguez
ISBN 978-953-51-0612-8Hard cover, 566 pagesPublisher InTechPublished online 30, May, 2012Published in print edition May, 2012
InTech EuropeUniversity Campus STeP Ri Slavka Krautzeka 83/A 51000 Rijeka, Croatia Phone: +385 (51) 770 447 Fax: +385 (51) 686 166www.intechopen.com
InTech ChinaUnit 405, Office Block, Hotel Equatorial Shanghai No.65, Yan An Road (West), Shanghai, 200040, China
Phone: +86-21-62489820 Fax: +86-21-62489821
This book is intended to present current concepts in molecular biology with the emphasis on the application toanimal, plant and human pathology, in various aspects such as etiology, diagnosis, prognosis, treatment andprevention of diseases as well as the use of these methodologies in understanding the pathophysiology ofvarious diseases that affect living beings.
How to referenceIn order to correctly reference this scholarly work, feel free to copy and paste the following:
Morteza Seifi, Asghar Ghasemi, Siamak Heidarzadeh, Mahmood Khosravi, Atefeh Namipashaki, Vahid MehriSoofiany, Ali Alizadeh Khosroshahi and Nasim Danaei (2012). Overview of Real-Time PCR Principles,Polymerase Chain Reaction, Dr Patricia Hernandez-Rodriguez (Ed.), ISBN: 978-953-51-0612-8, InTech,Available from: http://www.intechopen.com/books/polymerase-chain-reaction/overview-of-real-time-pcr-principles

© 2012 The Author(s). Licensee IntechOpen. This is an open access articledistributed under the terms of the Creative Commons Attribution 3.0License, which permits unrestricted use, distribution, and reproduction inany medium, provided the original work is properly cited.
Related Documents