Overview of key trends in the global LPG markets CIS and Eastern Europe highlights Saint Petersburg 2012

Welcome message from author
This document is posted to help you gain knowledge. Please leave a comment to let me know what you think about it! Share it to your friends and learn new things together.
Transcript
Overview of key trends in the global LPG markets
CIS and Eastern Europe highlights
Saint Petersburg 2012
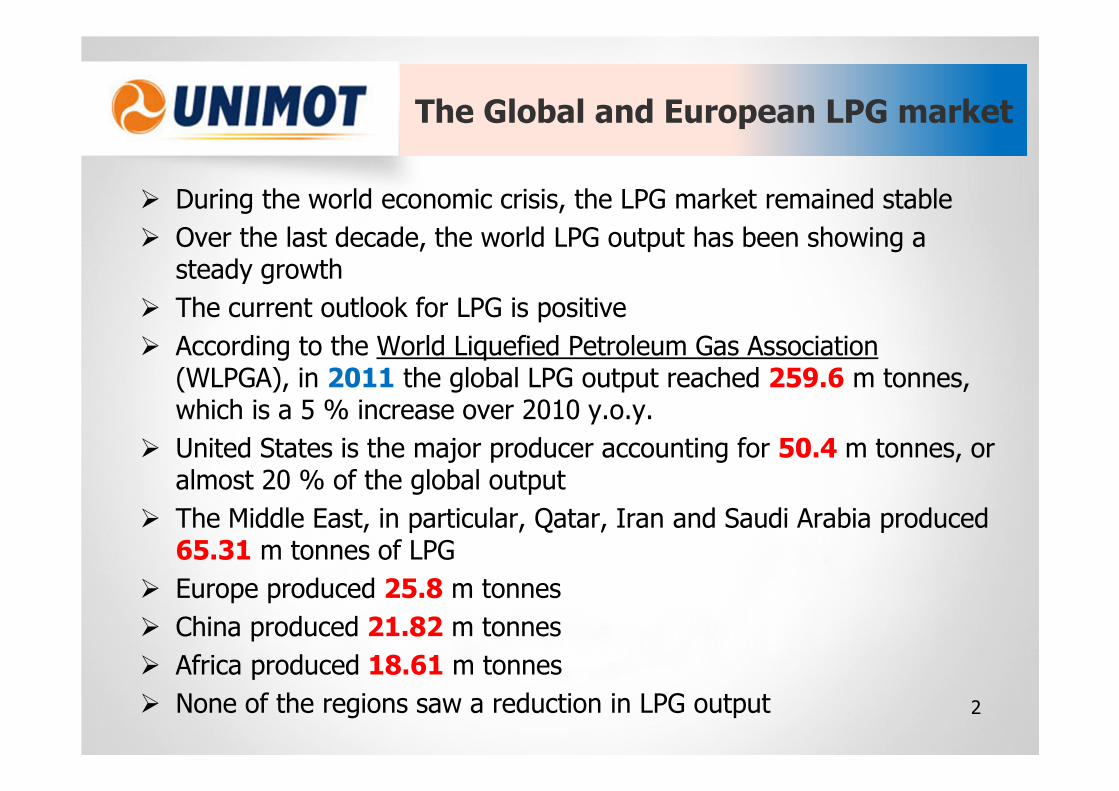
The Global and European LPG market
� During the world economic crisis, the LPG market remained stable
� Over the last decade, the world LPG output has been showing a steady growth
� The current outlook for LPG is positive
� According to the World Liquefied Petroleum Gas Association(WLPGA), in 2011 the global LPG output reached 259.6 m tonnes, which is a 5 % increase over 2010 y.o.y.
� United States is the major producer accounting for 50.4 m tonnes, oralmost 20 % of the global output
� The Middle East, in particular, Qatar, Iran and Saudi Arabia produced 65.31 m tonnes of LPG
� Europe produced 25.8 m tonnes
� China produced 21.82 m tonnes
� Africa produced 18.61 m tonnes
� None of the regions saw a reduction in LPG output 2
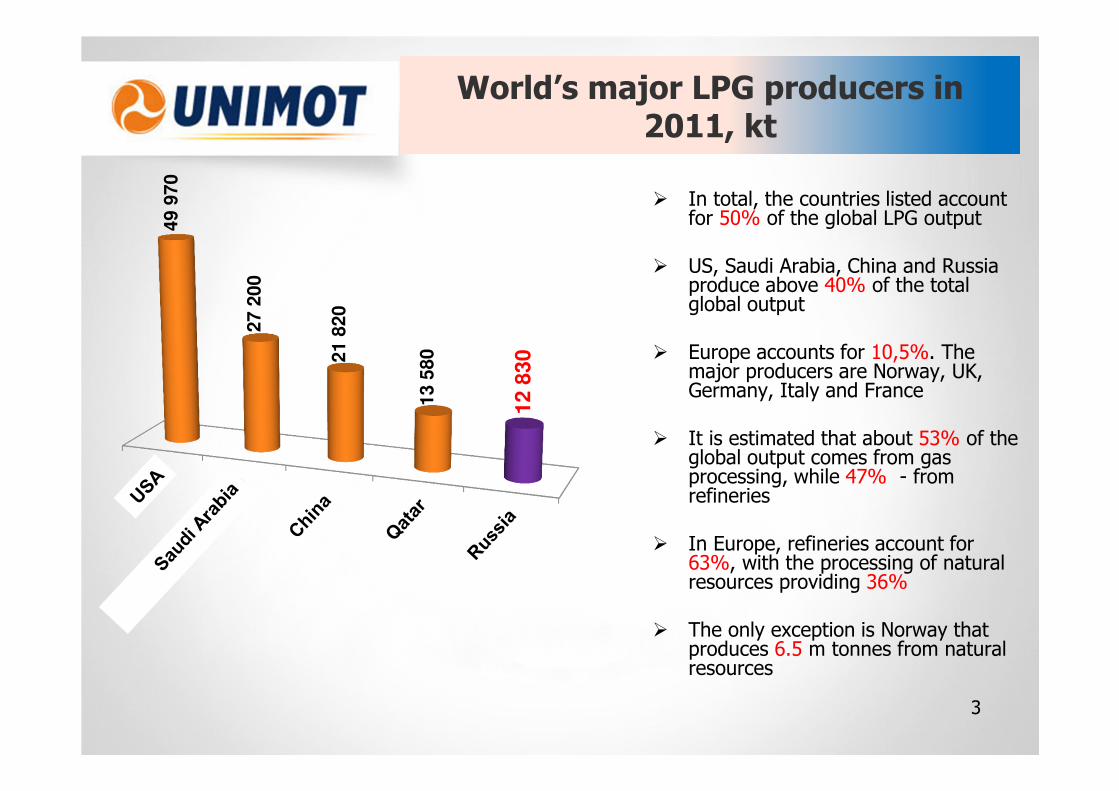
World’s major LPG producers in 2011, kt
3
49 9
70
27 2
00
21 8
20
13 5
80
12
83
0
� In total, the countries listed account for 50% of the global LPG output
� US, Saudi Arabia, China and Russia produce above 40% of the total global output
� Europe accounts for 10,5%. The major producers are Norway, UK, Germany, Italy and France
� It is estimated that about 53% of the global output comes from gas processing, while 47% - from refineries
� In Europe, refineries account for63%, with the processing of natural resources providing 36%
� The only exception is Norway that produces 6.5 m tonnes from natural resources
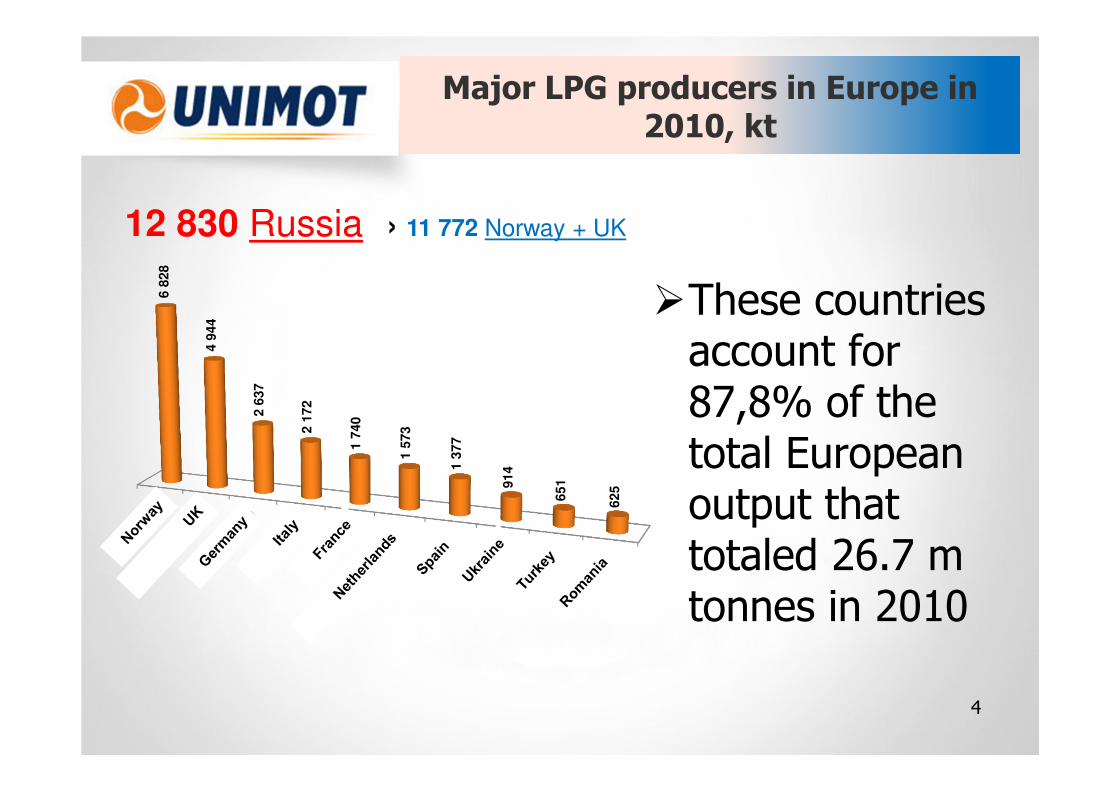
Major LPG producers in Europe in 2010, kt
4
6 8
28
4 9
44
2 6
37
2 1
72
1 7
40
1 5
73
1 3
77
914
651
625
�These countries account for87,8% of the total European output that totaled 26.7 m tonnes in 2010
12 830 Russia › 11 772 Norway + UK
Global LPG consumption
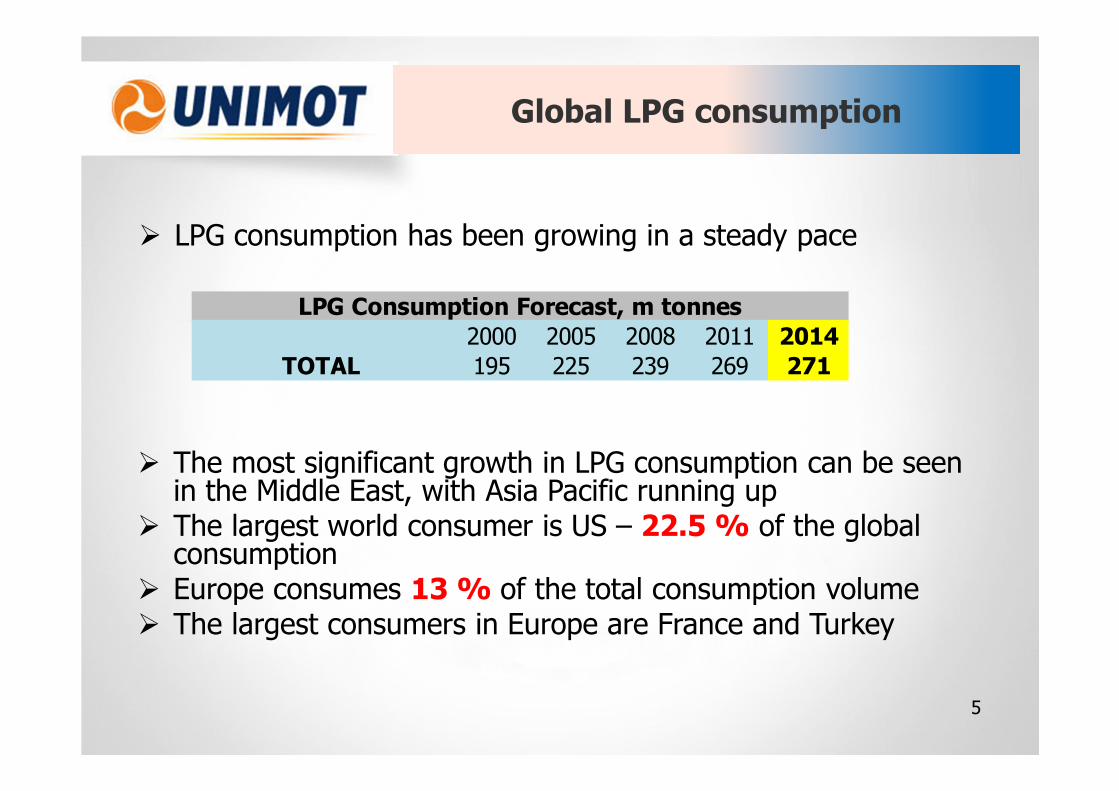
� LPG consumption has been growing in a steady pace
5
� The most significant growth in LPG consumption can be seen in the Middle East, with Asia Pacific running up
� The largest world consumer is US – 22.5 % of the global consumption
� Europe consumes 13 % of the total consumption volume� The largest consumers in Europe are France and Turkey
2000 2005 2008 2011 2014
TOTAL 195 225 239 269 271
LPG Consumption Forecast, m tonnes
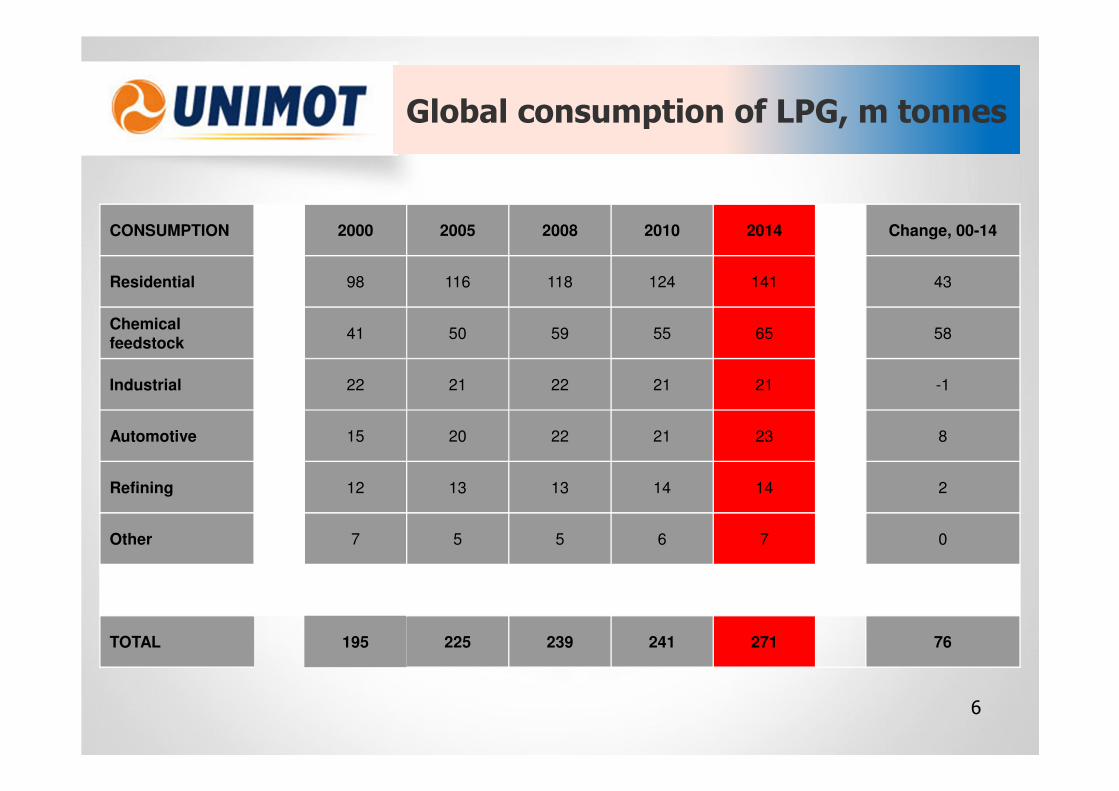
CONSUMPTION 2000 2005 2008 2010 2014 Change, 00-14
Residential 98 116 118 124 141 43
Chemical feedstock
41 50 59 55 65 58
Industrial 22 21 22 21 21 -1
Automotive 15 20 22 21 23 8
Refining 12 13 13 14 14 2
Other 7 5 5 6 7 0
TOTAL 195 225 239 241 271 76
Global consumption of LPG, m tonnes
6
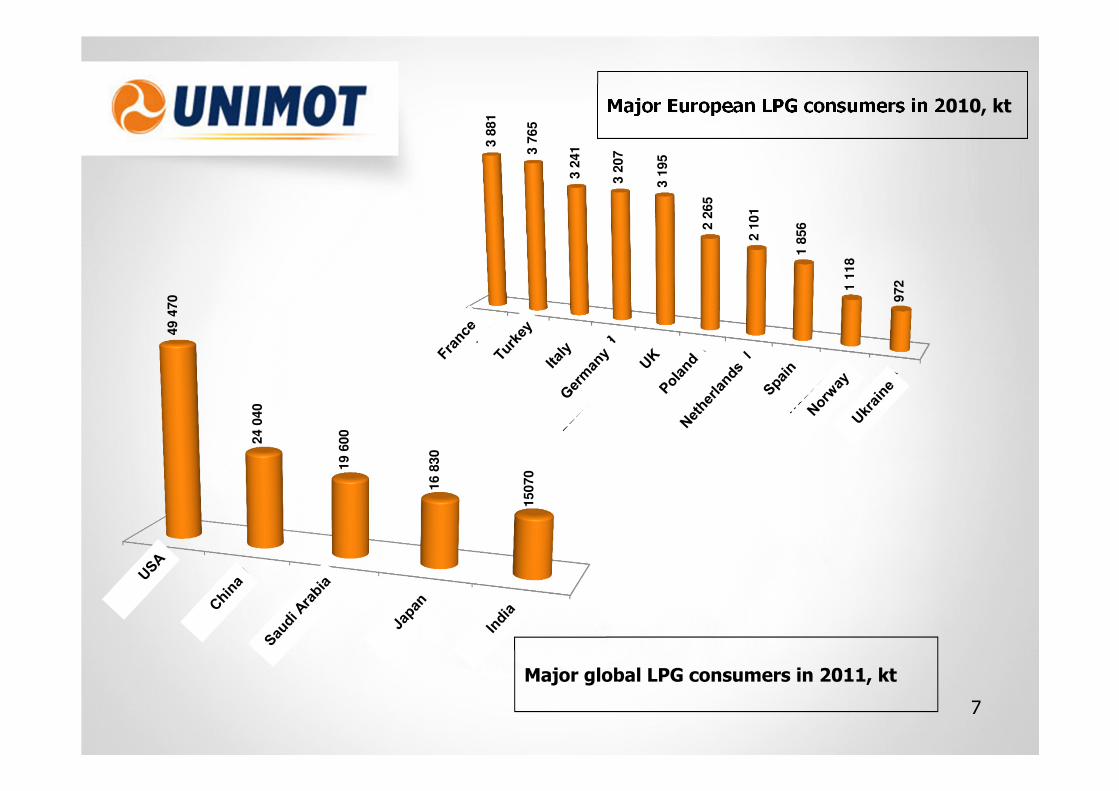
Major global LPG consumers in 2011, kt
49 4
70
24 0
40
19 6
00
16 8
30
15070
Major European LPG consumers in 2010, kt
3 8
81
3 7
65
3 2
41
3 2
07
3 1
95
2 2
65
2 1
01
1 8
56
1 1
18
972
7
LPG in Russia
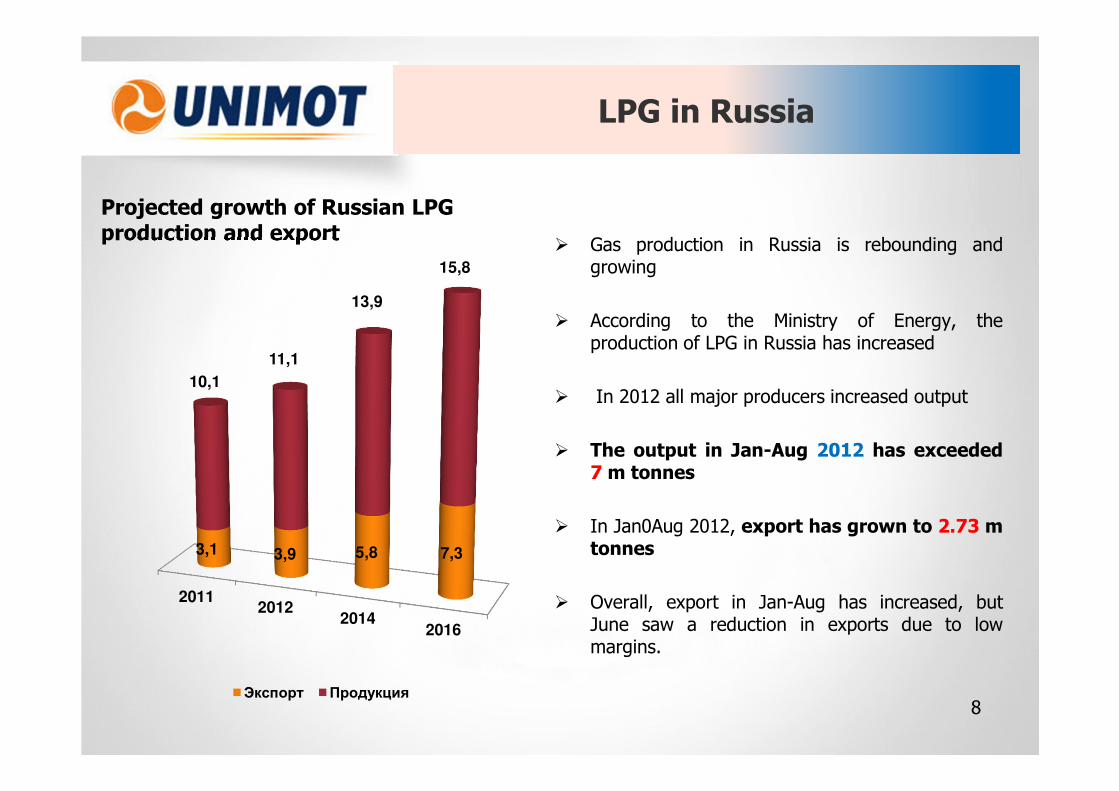
� Gas production in Russia is rebounding andgrowing
� According to the Ministry of Energy, theproduction of LPG in Russia has increased
� In 2012 all major producers increased output
� The output in Jan-Aug 2012 has exceeded7 m tonnes
� In Jan0Aug 2012, export has grown to 2.73 mtonnes
� Overall, export in Jan-Aug has increased, butJune saw a reduction in exports due to lowmargins.
Projected growth of Russian LPG production and export
20112012
20142016
3,1 3,9 5,8 7,3
10,1
11,1
13,9
15,8
Экспорт Продукция8
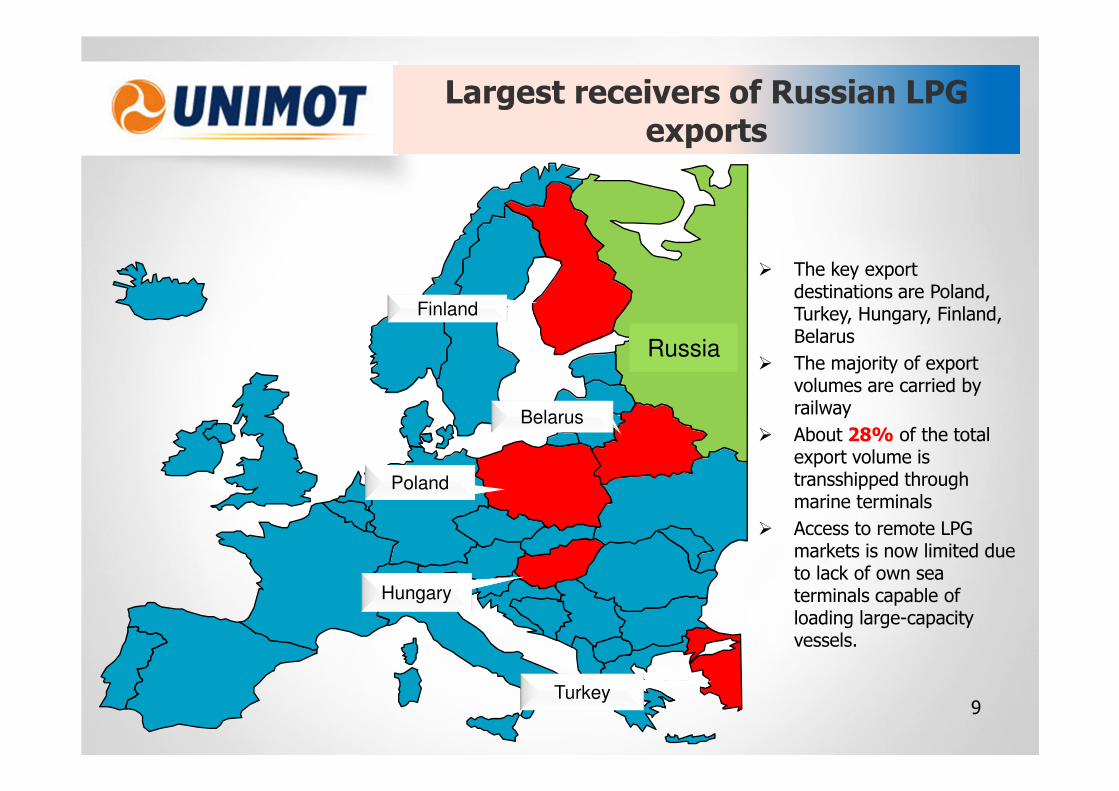
Largest receivers of Russian LPG exports
9
� The key export destinations are Poland, Turkey, Hungary, Finland, Belarus
� The majority of export volumes are carried by railway
� About 28% of the total export volume is transshipped through marine terminals
� Access to remote LPG markets is now limited due to lack of own sea terminals capable of loading large-capacity vessels.
Russia
Hungary
Turkey
Finland
Belarus
Poland
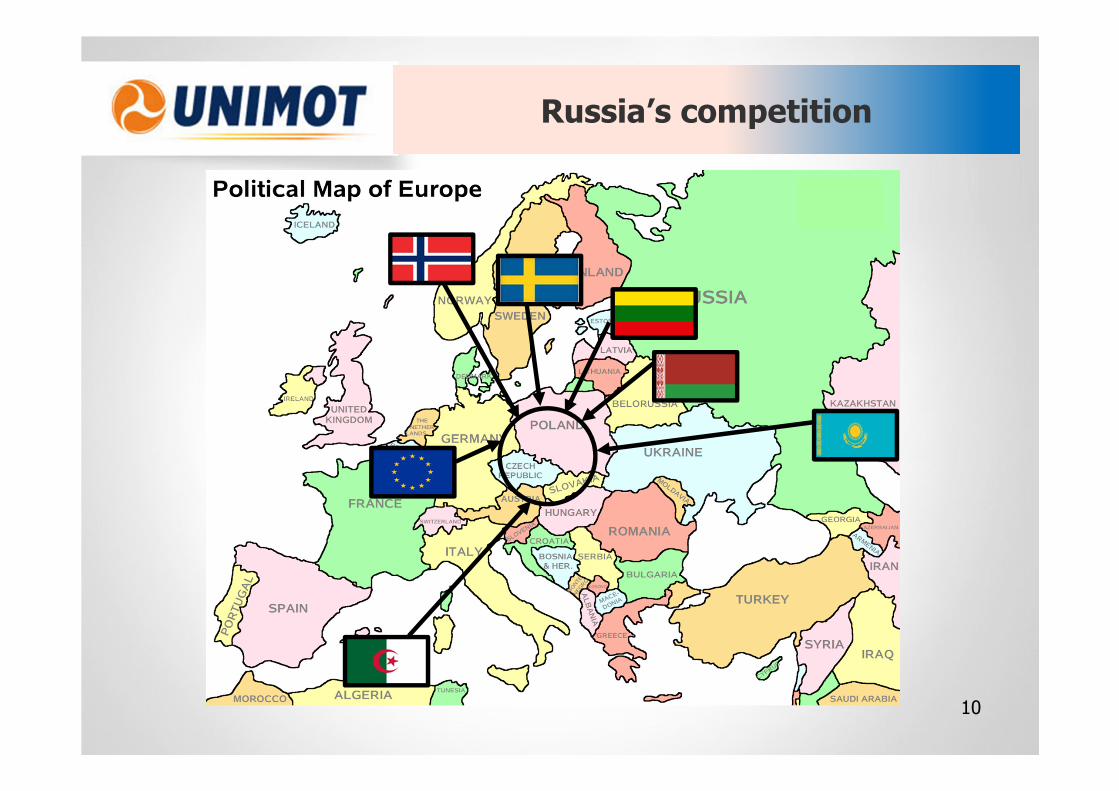
Russia’s competition
10
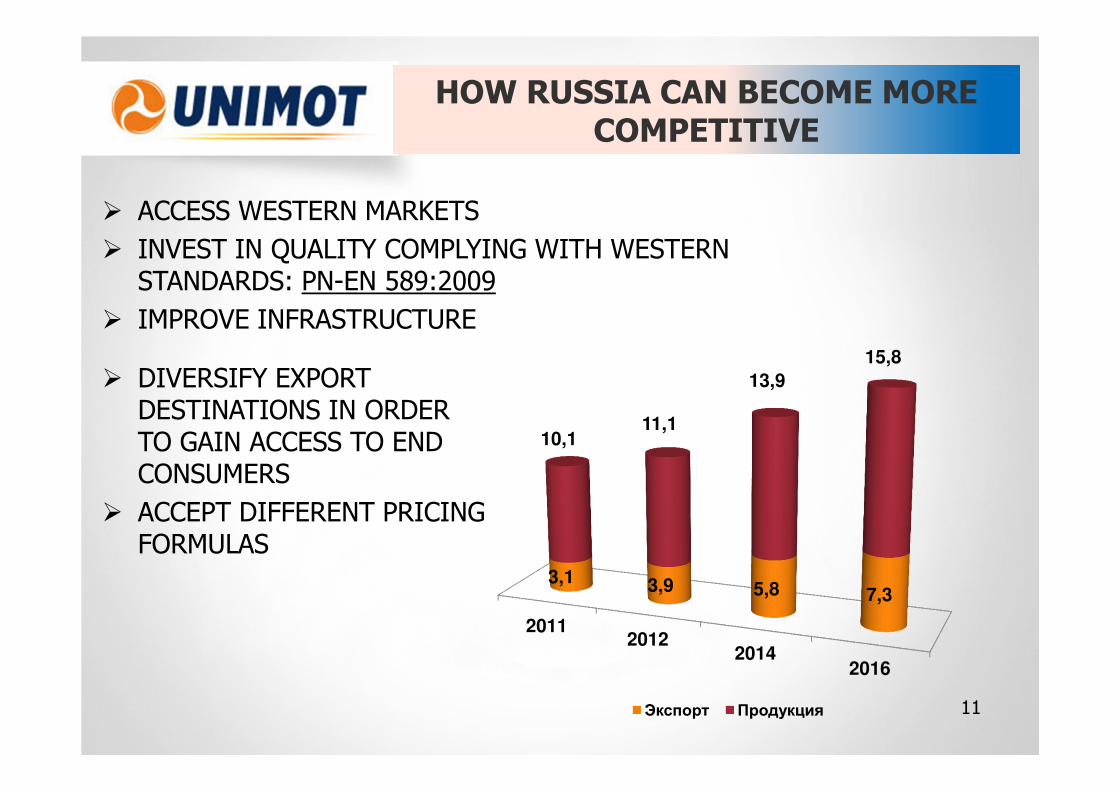
HOW RUSSIA CAN BECOME MORE COMPETITIVE
� ACCESS WESTERN MARKETS
� INVEST IN QUALITY COMPLYING WITH WESTERN STANDARDS: PN-EN 589:2009
� IMPROVE INFRASTRUCTURE
11
20112012
20142016
3,1 3,9 5,8 7,3
10,111,1
13,9
15,8
Экспорт Продукция
� DIVERSIFY EXPORT DESTINATIONS IN ORDER TO GAIN ACCESS TO END CONSUMERS
� ACCEPT DIFFERENT PRICING FORMULAS
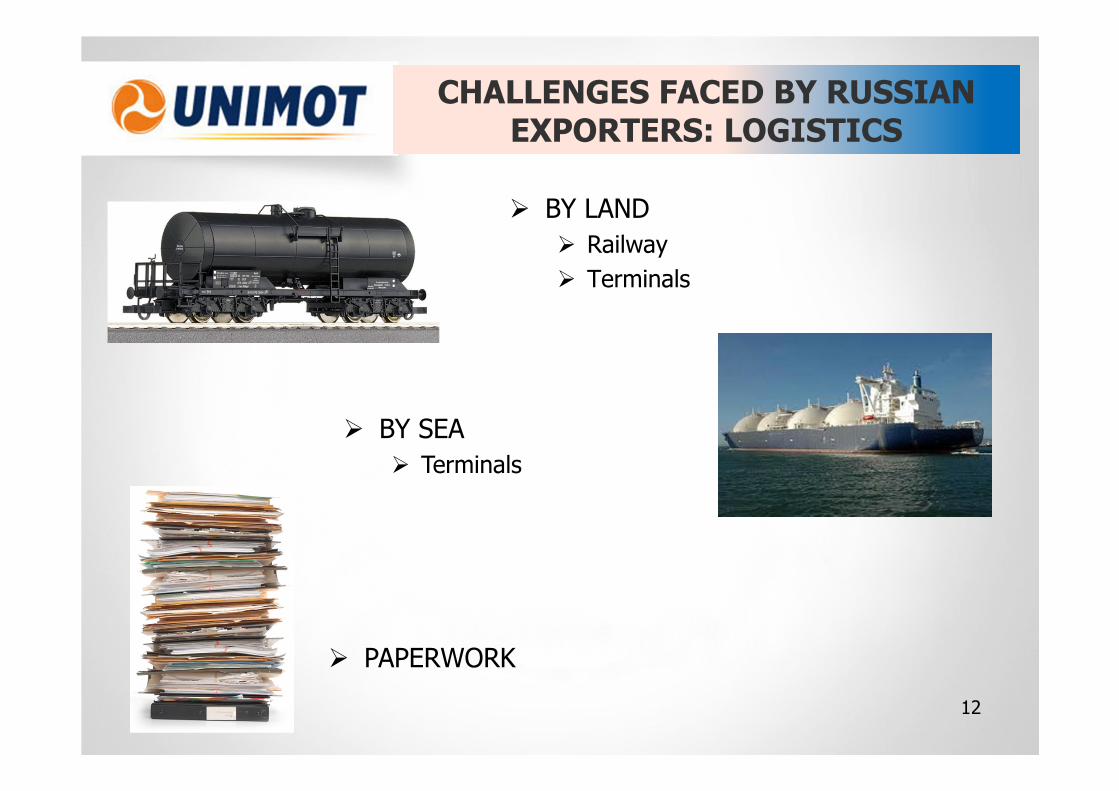
CHALLENGES FACED BY RUSSIAN EXPORTERS: LOGISTICS
� BY LAND
� Railway
� Terminals
12
� BY SEA
� Terminals
� PAPERWORK
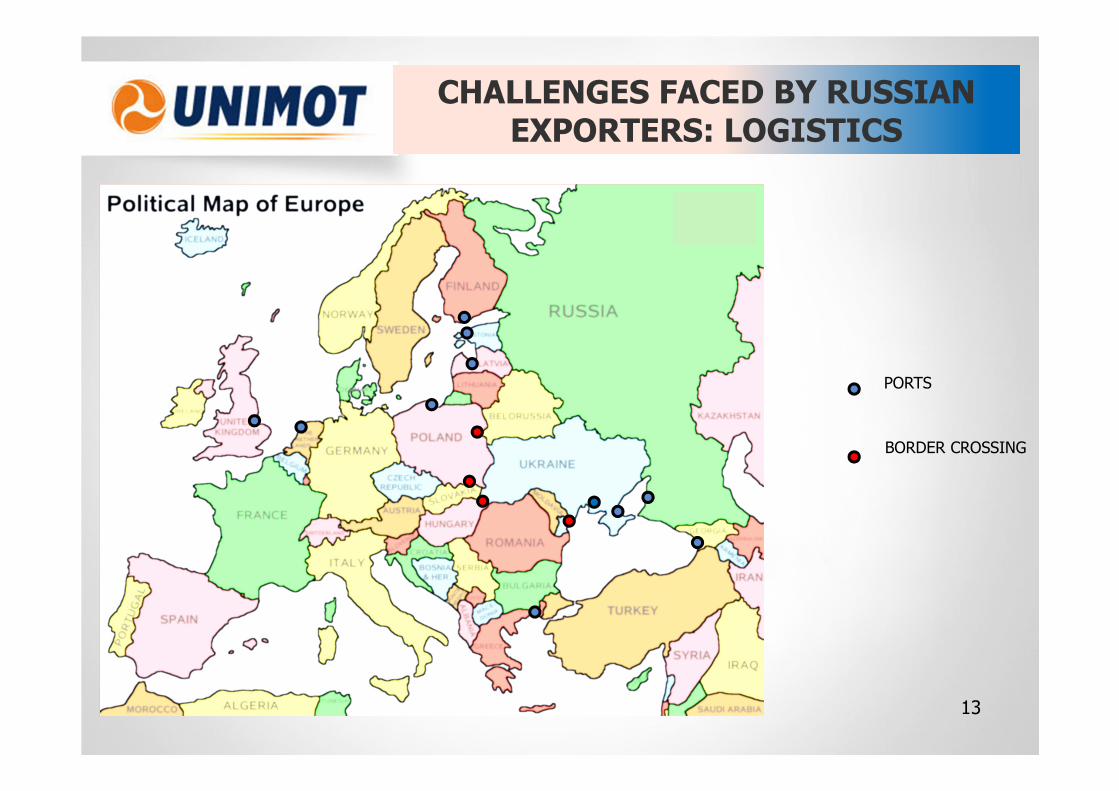
CHALLENGES FACED BY RUSSIAN EXPORTERS: LOGISTICS
13
PORTS
BORDER CROSSING
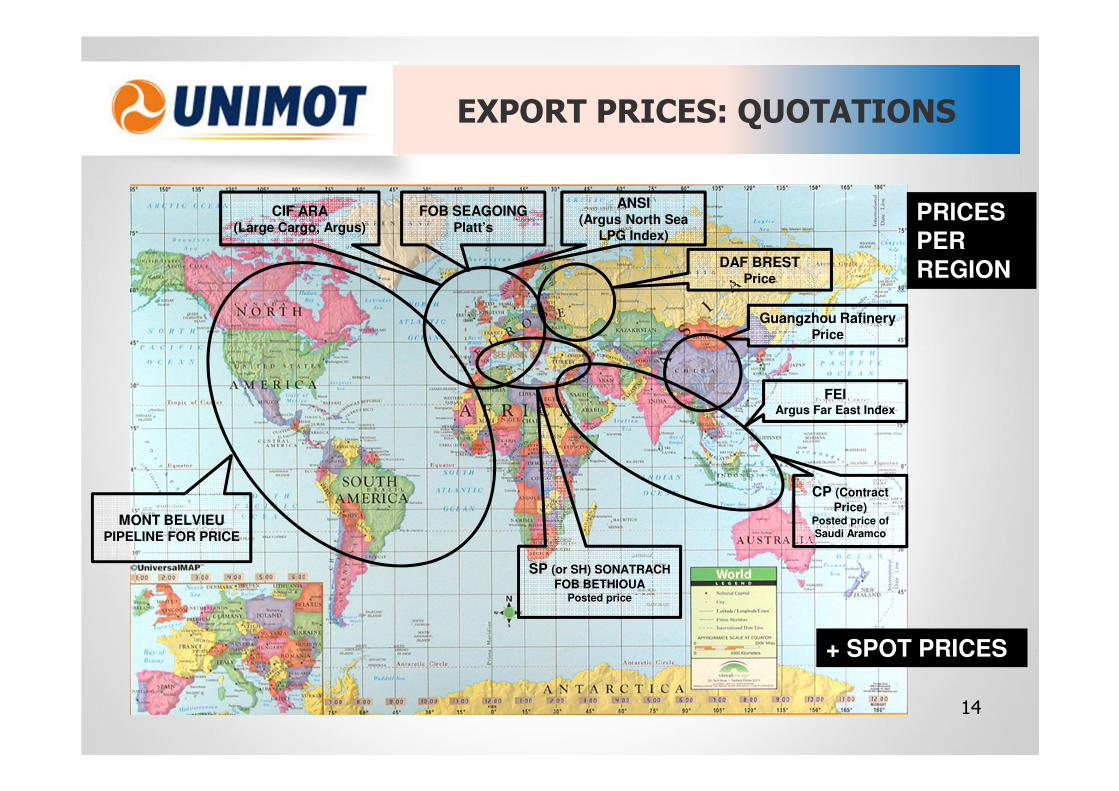
EXPORT PRICES: QUOTATIONS
14
MONT BELVIEU PIPELINE FOR PRICE
CIF ARA(Large Cargo, Argus)
FOB SEAGOINGPlatt’s
ANSI(Argus North Sea
LPG Index)
DAF BRESTPrice
Guangzhou RafineryPrice
FEIArgus Far East Index
CP (Contract
Price)Posted price of Saudi Aramco
SP (or SH) SONATRACH
FOB BETHIOUAPosted price
PRICES
PER REGION
+ SPOT PRICES
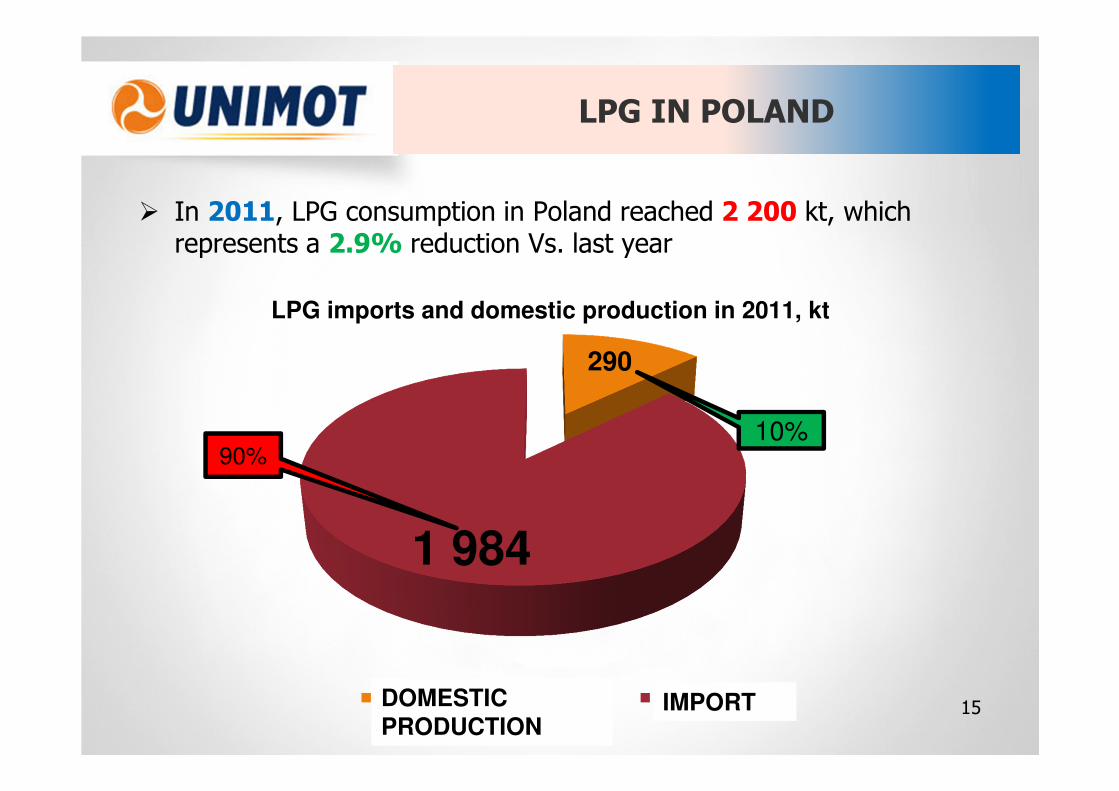
LPG IN POLAND
� In 2011, LPG consumption in Poland reached 2 200 kt, which represents a 2.9% reduction Vs. last year
15
290
1 984
ВНУТРЕНЯЯ ПРОДУКЦИЯ ИМПОРТ
LPG imports and domestic production in 2011, kt
90%10%
IMPORTDOMESTIC PRODUCTION

KEY SOURCES OF IMPORTSin 11 months of 2011
РОССИЯ50%
КАЗАХСТАН23%
БЕЛОРУССИЯ10%
ЛИТВА7%
ГЕРМАНИЯ2%
ЧЕХИЯ2%
ШВЕЦИЯ2%
ВЕЛИКОБРИТАНИЯ1%
ДРУГИЕ3%
UK
Lithuania
Belarus
Kazakhstan
Russia
16
Check Republic Sweden Other
Germany
QUESTIONS AND COMMENTS
ADAM SIKORSKI
Unimot Express [email protected]
+ 48 22 830 70 70
www.unimot.pl
Related Documents


![#CiveItUp LPG (LPG a) IOCL Cl / BPCL D / HPCL C] LPG àà àa … · · 2018-02-28iocl cl / bpcl d / hpcl c] lpg àà àa-r/àkft lpg àž lpg t:- lpg dgcc (poi) lpg 17 lpg id"](https://static.cupdf.com/doc/110x72/5ae5ebd07f8b9acc268cac07/civeitup-lpg-lpg-a-iocl-cl-bpcl-d-hpcl-c-lpg-a-cl-bpcl-d-hpcl-c.jpg)