Presented By: Steve Kutz, RN, MPH Public Health Nurse Supervisor, STD & Immunization Programs Washoe County Health District Overview of Gonorrhea (GC) Epidemiology and Program Prevention Efforts Developed By: Sandi Noffsinger, MPH STD Program Coordinator Nevada State Health Division

Overview of Gonorrhea (GC) Epidemiology and Program Prevention Efforts.
Dec 18, 2015
Welcome message from author
This document is posted to help you gain knowledge. Please leave a comment to let me know what you think about it! Share it to your friends and learn new things together.
Transcript

Presented By:
Steve Kutz, RN, MPHPublic Health Nurse Supervisor,STD & Immunization ProgramsWashoe County Health District
Overview of Gonorrhea (GC) Epidemiology and Program Prevention Efforts
Developed By:
Sandi Noffsinger, MPHSTD Program Coordinator
Nevada State Health Division

Reported Cases of Gonorrhea: Nevada 2000- 2008
Year
Nu
mb
er
of
Ca
ses
* Data extracted from STD*MIS
1602
20862212
2134
3080
28882789
2363
2165
0
500
1000
1500
2000
2500
3000
3500

Rate of Gonorrhea Cases per 100,000 Population: Nevada, 2000 - 2008
Rates for 2006-2008 are calculated based on interim population estimates from the Nevada State Demographer.
Year
Ra
te p
er
100
,00
0 p
op
ula
tio
n
79.4
98.1 100.593.2
128.1
115.1106.3
86.979.1
0.0
20.0
40.0
60.0
80.0
100.0
120.0
140.0

Rates of Gonorrhea Cases per 100,000 Population,by Sex: Nevada, 2000 – 2008
Year
Ra
te p
er
100
,00
0 p
op
ula
tio
n
Rates for 2006-2008 are calculated based on interim population estimates from the Nevada State Demographer.
94.3
107.6
90.998.9
135.6
120.6115.0
93.7
83.2
64.0
88.0 89.194.0
120.1
109.4
97.4
80.074.8
0.0
20.0
40.0
60.0
80.0
100.0
120.0
140.0
Male Female

Sex of Gonorrhea Cases by Age at Diagnosis:Nevada, 2008
Number of Cases
Ag
e o
f C
as
es
30
104
81
98
130
186
313
213
3
1
7
22
23
43
60
140
322
370
17
0
-400 -300 -200 -100 0 100 200 300 400
55+
45-54
40-44
35-39
30-34
25-29
20-24
15-19
10-14
<10
Females
Males

Sex of Gonorrhea Cases by Race/Ethnicity:Nevada, 2008
N=1,159
Female Gonorrhea Cases
N=1,004
Male Gonorrhea Cases
* “API” category includes Asian / Pacific Islander / Native Hawaiian groups. • “American Indian” category includes American Indian and Alaska Native groups.
White, non-Hispanic
22%
Black, non-Hispanic
30%
American Indian1%
Asian/Pacific Islander
2%
Hispanic11%
Other/Unknown34%
White18%
Black45%
American Indian0%API
1%
Hispanic11%
Other/Unknown25%

Rates and Rank of Gonorrhea Cases in Nevada by County, 2008
Rank County n Rate*1 Clark 1,918 982 Washoe 209 503 Carson City 11 194 Nye 11 245 Douglas 8 156 Lyon 5 97 Churchill 2 78 Elko 1 29 Esmeralda 0 -10 Eureka 0 -11 Humboldt 0 -12 Lander 0 -13 Lincoln 0 -14 Mineral 0 -15 Pershing 0 -16 Storey 0 -17 White Pine 0 -
Total 2,165 80*Rate per 100,000
Rank and Rate of Gonnorhea Cases in Nevada by County, 2008
Las Vegas
Reno

592.2618.8
477.0443.8
570.9
530.2 535.4
470.6436.6
0.0
100.0
200.0
300.0
400.0
500.0
600.0
700.0
White Black Hispanic Nevada Total
Rate of Gonorrhea per 100,000 Population, by Race/Ethnicity: Nevada, 2000 - 2008
Year 2010 Objective for
Blacks(425 per 100,000)
Rates for 2006-2008 are calculated based on interim population estimates from the Nevada State Demographer. Year
Ra
te p
er
100
,00
0 p
op
ula
tio
n

Target Population: Black/African Americans,Demographics
Males63%
Females37%
GC Cases Among Blacks in Nevada, by Sex: 2008
Ag
e o
f C
as
es
Number of Cases
Sex of GC Cases Among Blacks, by Age: Nevada, 2008
7
45
34
36
59
83
142
114
2
1
0
6
6
4
16
36
100
131
5
0
-150 -100 -50 0 50 100 150
55+
45-54
40-44
35-39
30-34
25-29
20-24
15-19
10-14
<10
Females
Males

Geographic Distribution of Rate of GC Among Blacks by sex, in Nevada, 2008
538
906
317
463
Rate of Male GC Cases per 100,000
Rate of Female GC Cases per 100,000
All Other Counties*: 168
All Other Counties*: 166
Las Vegas
Reno
Male Female Total
Clark 538 317 427
Washoe 906 463 700
All Other Counties* 168 166 167
Rates per 100,000 of GC Cases Among Blacks in Nevada by County, 2008
* All other Frontier and Rural (Far) Counties include: Churchill, Carson City, Douglas, Elko, Esmeralda, Eureka, Humboldt, Lander, Lincoln, Lyon, Mineral, Pershing, Storey, and White Pine.
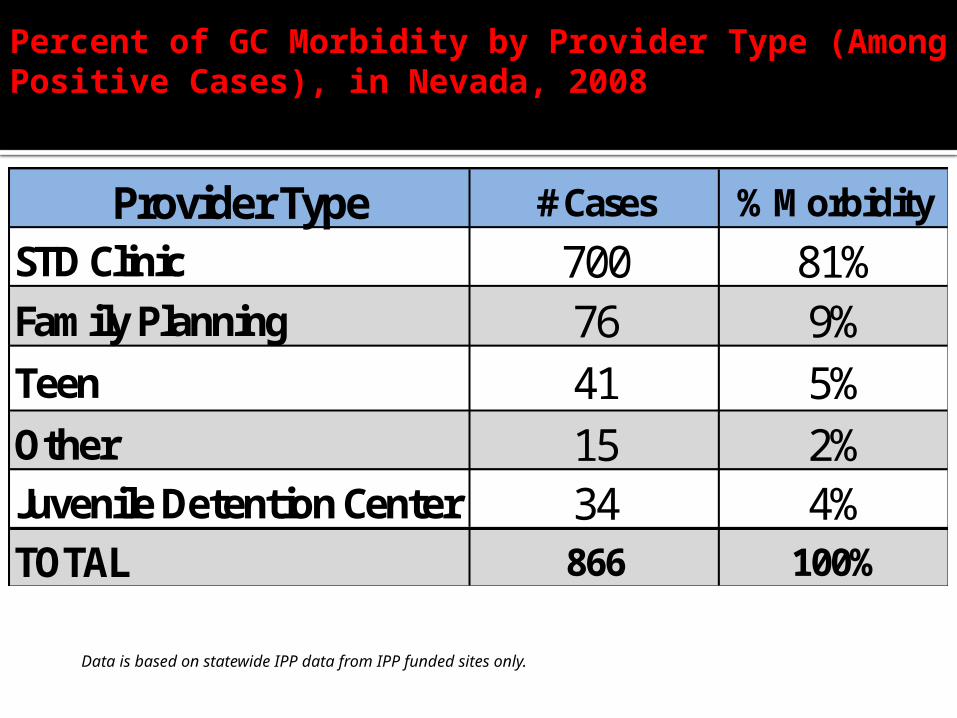
Percent of GC Morbidity by Provider Type (Among Positive Cases), in Nevada, 2008
Provider Type # Cases % Morbidity
STD Clinic 700 81%Family Planning 76 9%Teen 41 5%Other 15 2%Juvenile Detention Center 34 4%TOTAL 866 100%
Data is based on statewide IPP data from IPP funded sites only.

Nevada’s Gonorrhea Isolate Surveillance Project (GISP)
The Sentinel Site for GISP has been located at Southern Nevada Health District in Las Vegas, Nevada since 2002.
In 2009: Obtained 655 cultures from symptomatic people
at the SNHD STD Clinic 318 (49%) of the cultures collected were
positive 287 samples were sent to the regional
laboratory for evaluation of antimicrobial resistance▪ Nevada has met or exceeded the goal of 25 positive
male isolates per month in 2009 in all months except March (18 samples were sent)

Interventions for Prevention and Control
Targeted STD Screening in non-traditional settings.
Working with faith based organizations to reach minority populations
Provider education (i.e. Grand Rounds)
Individual provider educational visits/trainings
Correctional outreach
SNHD- In 2007-2009 focusing on pregnant women and teens (in corrections)

Challenges for GC Prevention and Control
Funding cuts
Reaching hidden high risk populations (internet, minority populations)
Reaching un-insured high risk populations
Challenges getting comprehensive sexual education to all youth in Nevada
Offering internal capacity for STD testing (oral and rectal

Thank you!
Related Documents