Overexpression of Specific Cysteine Peptidases Confers Pathogenicity to a Nonpathogenic Entamoeba histolytica Clone Jenny Matthiesen, Ann-Katrein Bär, Anne-Kathrin Bartels, Dennis Marien, Susann Ofori, Laura Biller, Egbert Tannich, Hannelore Lotter, Iris Bruchhaus Bernhard Nocht Institute for Tropical Medicine, Hamburg, Germany ABSTRACT Cysteine peptidases (CPs) of Entamoeba histolytica are considered to be important pathogenicity factors. Previous studies have found that under standard axenic culture conditions, only four (ehcp-a1, ehcp-a2, ehcp-a5, and ehcp-a7) out of 35 papain-like ehcp genes present in the E. histolytica genome are expressed at high levels. Little is known about the expression of CPs in E. histolytica during amoebic liver abscess (ALA) formation. In the current study, a quantitative real-time PCR assay was developed to determine the expression of the various ehcp genes during ALA formation in animal models. Increased expression of four ehcp genes (ehcp-a3, -a4, -a10, and -c13) was detected in the gerbil and mouse models. Increased expression of another three ehcp genes (ehcp-a5, -a6, and -a7) was detected in the mouse model only, and two other ehcp genes (ehcp-b8 and -b9) showed increased expression in the gerbil model only. Trophozoites of the nonpathogenic E. histolytica HM-1:IMSS clone A1, which was unable to induce ALAs, were transfected with vectors enabling overexpression of those CPs that are expressed at high levels under culture conditions or during ALA formation. Interestingly, overexpression of ehcp-b8, -b9, and -c13 restored the pathogenic phenotype of the nonpathogenic clone A1 whereas overexpression of various other peptidase genes had no effect on the pathogenicity of this clone. IMPORTANCE Entamoeba histolytica is a widespread and clinically important protozoan parasite. It normally exists in the human intestine without causing clinical symptoms but can invade the intestinal mucosa, which causes serious intestinal (amoebic coli- tis) and extraintestinal (amoebic liver abscess [ALA]) diseases. The identification of factors responsible for the invasion of the parasite and disease formation is a major topic in the field. Here, we investigate the roles of different papain-like cysteine pepti- dases (CPs) as pathogenicity factors. We show that the expression of some of the peptidases that are normally expressed at low levels increases during ALA formation. Furthermore, nonpathogenic amoebae can be transformed to pathogenic amoebae, sim- ply by specific overexpression of some of these CPs. Our findings reinforce the importance of CPs as pathogenicity factors of E. histolytica. Received 31 January 2013 Accepted 4 March 2013 Published 26 March 2013 Citation Matthiesen J, Bär A-K, Bartels A-K, Marien D, Ofori S, Biller L, Tannich E, Lotter H, Bruchhaus I. 2013. Overexpression of specific cysteine peptidases confers pathogenicity to a nonpathogenic Entamoeba histolytica clone. mBio 4(2):e00072-13. doi:10.1128/mBio.00072-13. Invited Editor Upinder Singh, Stanford University Editor John Boothroyd, Stanford University Copyright © 2013 Matthiesen et al. This is an open-access article distributed under the terms of the Creative Commons Attribution-Noncommercial-ShareAlike 3.0 Unported license, which permits unrestricted noncommercial use, distribution, and reproduction in any medium, provided the original author and source are credited. Address correspondence to Iris Bruchhaus, [email protected]. E ntamoeba histolytica is an important pathogen responsible for millions of cases of invasive amoebiasis each year (1). This protozoan parasite passes through a simple life cycle consisting of an infectious cyst that can survive outside the host and a vegetative trophozoite that proliferates in the human gut. The trophozoites of E. histolytica can persist in the gut for months or even years, causing asymptomatic luminal gut infections. However, some- times E. histolytica penetrates the intestinal mucosa and destroys host tissues. Parasite penetration leads to ulcerative colitis or in- vasion of other organs, most commonly the liver, and may result in abscess formation. Identification of factors that are responsible for the pathoge- nicity of E. histolytica has been a major topic in the field. During recent years, numerous in vitro and in vivo studies have suggested that cysteine peptidases (CPs) play an important role in the patho- genicity of E. histolytica (2–9). The most convincing are from in- fections of laboratory animals, indicating that E. histolytica tro- phozoites with reduced CP activity are much less able to induce amoebic disease (9, 10). In addition, overexpression of CPs leads to an increase in amoebic liver abscess (ALA) formation in gerbils (11). To date, only four of the 35 papain-like ehcp genes present in the E. histolytica genome (ehcp-a1, -a2, -a5, and -a7) have been shown to be highly expressed in amoeba trophozoites under stan- dard axenic culture conditions (12–14). Of these, EhCP-A5 is thought to be a major pathogenicity factor, with possible involve- ment in colon invasion, induction of host inflammatory re- sponses, and ALA formation (10, 11, 15, 16). However, little is known about the function and regulation of the majority of CPs that are expressed at low levels in axenic cul- ture or about their involvement in excystation and encystation, colon invasion, and most importantly, ALA formation. Several CPs exhibit cyst-specific expression (ehcp-a3, -a4, -a8, -b1, -b3, -b8, -b9, and -b10), with the majority showing low levels of expres- sion in the trophozoite stage in axenic culture (17, 18). In addi- RESEARCH ARTICLE March/April 2013 Volume 4 Issue 2 e00072-13 ® mbio.asm.org 1 on January 21, 2019 by guest http://mbio.asm.org/ Downloaded from

Welcome message from author
This document is posted to help you gain knowledge. Please leave a comment to let me know what you think about it! Share it to your friends and learn new things together.
Transcript

Overexpression of Specific Cysteine Peptidases Confers Pathogenicityto a Nonpathogenic Entamoeba histolytica Clone
Jenny Matthiesen, Ann-Katrein Bär, Anne-Kathrin Bartels, Dennis Marien, Susann Ofori, Laura Biller, Egbert Tannich,Hannelore Lotter, Iris Bruchhaus
Bernhard Nocht Institute for Tropical Medicine, Hamburg, Germany
ABSTRACT Cysteine peptidases (CPs) of Entamoeba histolytica are considered to be important pathogenicity factors. Previousstudies have found that under standard axenic culture conditions, only four (ehcp-a1, ehcp-a2, ehcp-a5, and ehcp-a7) out of 35papain-like ehcp genes present in the E. histolytica genome are expressed at high levels. Little is known about the expression ofCPs in E. histolytica during amoebic liver abscess (ALA) formation. In the current study, a quantitative real-time PCR assay wasdeveloped to determine the expression of the various ehcp genes during ALA formation in animal models. Increased expressionof four ehcp genes (ehcp-a3, -a4, -a10, and -c13) was detected in the gerbil and mouse models. Increased expression of anotherthree ehcp genes (ehcp-a5, -a6, and -a7) was detected in the mouse model only, and two other ehcp genes (ehcp-b8 and -b9)showed increased expression in the gerbil model only. Trophozoites of the nonpathogenic E. histolytica HM-1:IMSS clone A1,which was unable to induce ALAs, were transfected with vectors enabling overexpression of those CPs that are expressed at highlevels under culture conditions or during ALA formation. Interestingly, overexpression of ehcp-b8, -b9, and -c13 restored thepathogenic phenotype of the nonpathogenic clone A1 whereas overexpression of various other peptidase genes had no effect onthe pathogenicity of this clone.
IMPORTANCE Entamoeba histolytica is a widespread and clinically important protozoan parasite. It normally exists in the humanintestine without causing clinical symptoms but can invade the intestinal mucosa, which causes serious intestinal (amoebic coli-tis) and extraintestinal (amoebic liver abscess [ALA]) diseases. The identification of factors responsible for the invasion of theparasite and disease formation is a major topic in the field. Here, we investigate the roles of different papain-like cysteine pepti-dases (CPs) as pathogenicity factors. We show that the expression of some of the peptidases that are normally expressed at lowlevels increases during ALA formation. Furthermore, nonpathogenic amoebae can be transformed to pathogenic amoebae, sim-ply by specific overexpression of some of these CPs. Our findings reinforce the importance of CPs as pathogenicity factors ofE. histolytica.
Received 31 January 2013 Accepted 4 March 2013 Published 26 March 2013
Citation Matthiesen J, Bär A-K, Bartels A-K, Marien D, Ofori S, Biller L, Tannich E, Lotter H, Bruchhaus I. 2013. Overexpression of specific cysteine peptidases conferspathogenicity to a nonpathogenic Entamoeba histolytica clone. mBio 4(2):e00072-13. doi:10.1128/mBio.00072-13.
Invited Editor Upinder Singh, Stanford University Editor John Boothroyd, Stanford University
Copyright © 2013 Matthiesen et al. This is an open-access article distributed under the terms of the Creative Commons Attribution-Noncommercial-ShareAlike 3.0 Unportedlicense, which permits unrestricted noncommercial use, distribution, and reproduction in any medium, provided the original author and source are credited.
Address correspondence to Iris Bruchhaus, [email protected].
Entamoeba histolytica is an important pathogen responsible formillions of cases of invasive amoebiasis each year (1). This
protozoan parasite passes through a simple life cycle consisting ofan infectious cyst that can survive outside the host and a vegetativetrophozoite that proliferates in the human gut. The trophozoitesof E. histolytica can persist in the gut for months or even years,causing asymptomatic luminal gut infections. However, some-times E. histolytica penetrates the intestinal mucosa and destroyshost tissues. Parasite penetration leads to ulcerative colitis or in-vasion of other organs, most commonly the liver, and may resultin abscess formation.
Identification of factors that are responsible for the pathoge-nicity of E. histolytica has been a major topic in the field. Duringrecent years, numerous in vitro and in vivo studies have suggestedthat cysteine peptidases (CPs) play an important role in the patho-genicity of E. histolytica (2–9). The most convincing are from in-fections of laboratory animals, indicating that E. histolytica tro-
phozoites with reduced CP activity are much less able to induceamoebic disease (9, 10). In addition, overexpression of CPs leadsto an increase in amoebic liver abscess (ALA) formation in gerbils(11). To date, only four of the 35 papain-like ehcp genes present inthe E. histolytica genome (ehcp-a1, -a2, -a5, and -a7) have beenshown to be highly expressed in amoeba trophozoites under stan-dard axenic culture conditions (12–14). Of these, EhCP-A5 isthought to be a major pathogenicity factor, with possible involve-ment in colon invasion, induction of host inflammatory re-sponses, and ALA formation (10, 11, 15, 16).
However, little is known about the function and regulation ofthe majority of CPs that are expressed at low levels in axenic cul-ture or about their involvement in excystation and encystation,colon invasion, and most importantly, ALA formation. SeveralCPs exhibit cyst-specific expression (ehcp-a3, -a4, -a8, -b1, -b3,-b8, -b9, and -b10), with the majority showing low levels of expres-sion in the trophozoite stage in axenic culture (17, 18). In addi-
RESEARCH ARTICLE
March/April 2013 Volume 4 Issue 2 e00072-13 ® mbio.asm.org 1
on January 21, 2019 by guesthttp://m
bio.asm.org/
Dow
nloaded from

tion, intestinal invasion resulted in a change in the expression ofehcp genes in E. histolytica isolated from mouse ceca, with fourehcp genes (ehcp-a1, -a4, -a6, and -a8) showing increased expres-sion and one (ehcp-a7) showing decreased expression (19). In aproteomic approach analyzing the composition of E. histolyticauropods, the CPs EhCP-A1, -A2, -A4, -C4, -C5, -C6, and -C13were identified (20). Interestingly, this was the first time that pro-teins belonging to the EhCP-C family were detected in E. histo-lytica. In contrast, very little information about CP expressionduring ALA formation is available. Freitas and colleagues com-pared the expression levels of ehcp-a5 in ALA samples and axeniccultivated strains and found a higher level of ehcp-a5 mRNA inamoebae derived directly from ALAs (21). Nevertheless, informa-tion is lacking on the expression profiles of the entire set of CPsduring abscess formation.
In our laboratory, two E. histolytica cell lines (and their derivedclones), which differ substantially in their pathogenic properties,are available. Cell line B and its derived clone B2 are highly patho-genic, as evidenced by their abilities to produce considerableALAs, whereas cell line A and its derived clone A1 are unable toinduce ALAs (22) (see Fig. S1 in the supplemental material). Weused the pathogenic cell line B and clone B2 to analyze the expres-sion profiles of CPs during ALA formation. For this, we developeda quantitative real-time PCR (qRT-PCR) assay to detect ehcp tran-scripts directly in ALA material. In total, nine different CP genesshowed increased expression during abscess formation in both oreither of the two different animal models used, mouse and gerbil.Interestingly, overexpression of three of these CPs in the non-pathogenic clone A1 was sufficient to confer pathogenicity.
RESULTSExpression of E. histolytica ehcp genes directly derived fromALAs. To date, the expression of ehcp genes in E. histolytica duringALA formation has been little investigated. Therefore, E. histo-lytica trophozoites from the pathogenic cell line B and the patho-genic clone B2 were inoculated into gerbil and mice livers, respec-tively (22). To ensure that no mixture of different cell types wasused, cell line B was cloned. All further experiments were per-formed with clone B2. Using a qRT-PCR approach, ehcp mRNAlevels in axenic cultivated trophozoites were compared with thosein ALAs in mice and gerbils at different time points after infection.For mice, ehcp gene expression was determined 24, 48, and 72 hpostinfection (hpi), whereas for gerbils, ehcp expression was de-termined at one time point, seven days postinfection (dpi).
Under axenic culture conditions, the ehcp expression profileswere very similar in cell line B and clone B2. The expression of onlya few of the analyzed CPs was slightly higher in cell line B than inclone B2 (Table 1). In both, the major expressed ehcp genes wereehcp-a1, -a2, -a5, and -a7. All other ehcp genes were expressed atmoderate or low levels, with ehcp-b8 showing the lowest expres-sion levels.
During ALA formation, the expression of only a few ehcp geneswas up- or downregulated relative to their expression in axenicculture. In trophozoites derived from ALAs in gerbils, the expres-sion of six (ehcp-a3, -a4, -a10, -b8, -b9, and -c13) of the 23 ehcpgenes analyzed increased significantly by 4- to 56-fold (Table 2).Similarly, the expression of four of the same genes, ehcp-a3, -a4,-a10, and -c13, increased by 3- to 345-fold in trophozoites derivedfrom ALAs in mice. In addition, the expression of other ehcpgenes, ehcp-a5 (3- to 8-fold), ehcp-a6 (3- to 12-fold), and ehcp-a7
(4- to 86-fold), was also increased in mice. In detail, for ehcp-a3and ehcp-a7, the increase was detected at 24 hpi, the first timepoint analyzed. For ehcp-a5 and ehcp-a6, the increase was firstdetected at 48 hpi. For ehcp-a10, the increase was detected at24 hpi in one biological sample and at 48 hpi in the other biolog-ical sample (Table 2). For ehcp-c13, for which increased expressionwas detected in amoebae derived from ALAs in gerbils at sevendpi, an approximately 3-fold increase was detected in amoebaederived from ALAs in mice at 72 hpi. For eight of the 32 ehcp genesanalyzed in ALAs of mice, no qRT-PCR product was detected,presumably because there was a low proportion of amoebae rela-tive to hepatic cells within the abscess material as well as low levelsof expression of these genes.
Generation of transgenic E. histolytica overexpressing vari-ous ehcp genes. To determine if the ehcp genes that are upregu-lated during ALA formation are involved in pathogenicity, trans-fectants of the nonpathogenic E. histolytica clone A1 thatspecifically overexpressed various peptidase genes were generated.In an earlier study, it was shown that cell line B has a total CPactivity approximately ten times higher than that of cell line A (110and 15 mU/mg, respectively) (22). This correlates well with the CPactivity measured for the cell line B-derived clone B2 (123 �60 mU/mg) and the cell line A-derived clone A1 (14 � 10 mU/mg). Surprisingly, the ehcp expression profiles of the two cloneswere very similar, and strong differences in total CP activity werenot reflected at the mRNA level (Table 1). The observed discrep-ancy cannot be attributed to a differential expression of the genescoding for the CP inhibitors (ehicp1 and ehicp2) (Table 1).
Trophozoites of the nonpathogenic clone A1 were transfectedwith either an empty expression vector (pNC; control) or one of11 different expression vectors containing the open reading framefor ehcp-a1, -a2, -a3, -a4, -a5, -a6, -a7, -a10, -b8, -b9, or -c13(Fig. 1). After transfection, the trophozoites were cloned and atleast four clones per vector were analyzed for overexpression ofthe relevant ehcp gene by qRT-PCR. For each transfectant, theclone with the highest ehcp expression was used for all furtherexperiments (Table 3). After transfection of clone A1 with thecontrol vector, pNC, the CP activity dropped from approximately14 mU/mg to 0.5 mU/mg, as measured using an enzymatic CPassay with Z-Arg-Arg as a substrate (Table 3). It may be that se-lection of the transfectants with the protein synthesis inhibitorG418 was responsible for this. With two exceptions (pNC-CPA3and pNC-CPA6 transfectants), the overexpression of particularehcp genes led to a significantly increased CP activity for all trans-fectants in vitro (Table 3). Three transfectants (pNC-CPA10,-CPB9, and -CPC13) showed a 4- to 8-fold increase in activitycompared to the control, another three transfectants (pNC-CPA4,-CPA7, and -CPB8) showed a 10- to 15-fold increase, and threefurther transfectants (pNC-CPA1, -CPA2, and -CPA5) showed a50- to 140-fold increase in activity.
In addition, for none of the transfectants could activity againstany of the four additionally used chromogenic substrates (Z-Ala-Ala, Z-Phe-Ala, Z-Gly-Ala, Z-Ala-Pro) be detected.
Furthermore, the CPs of the transfectants were analyzed usingsubstrate gel electrophoresis. For the nontransfected pathogenicclone B2, the major activity bands were easily assigned to EhCP-A1, EhCP-A2, and EhCP-A5 (Fig. 2, far left lane). For the non-pathogenic clone A1, all of the activity bands were much weaker(Fig. 2, lane second from left). No activity bands were detected forthe control transfectant, pNC (Fig. 2, third lane from the left), a
Matthiesen et al.
2 ® mbio.asm.org March/April 2013 Volume 4 Issue 2 e00072-13
on January 21, 2019 by guesthttp://m
bio.asm.org/
Dow
nloaded from

finding which is in good agreement with its low CP activity (Ta-ble 3). This was also the case for the transfectants pNC-CPA3,-CPA6, -CPA10, -CPB8, -CPB9, and -CPC13, all of which hadspecific peptidolytic activities below 4 mU/mg (Fig. 2; Table 3). Incontrast, an increase in the intensity of the band representing thetransfected gene was observed for the transfectants pNC-CPA1,-CPA2, -CPA4, and -CPA7 (Fig. 2), and their specific peptidolyticactivities were between 5 and 70 mU/mg (Table 3). For pNC-CPA1 transfectants, an increase in the intensity of the band rep-resenting EhCP-A2 was also observed. As already described in aprevious study, transfection of E. histolytica with pNC-CPA5 leadsto an increase in intensity of several peptidase activity bands(EhCP-A1, -A2, -A4, -A5, and -A7) (11).
A secretion of CPs over time was able to be verified for thetransfectants pNC-CPA1, -CPA2, -CPA4, and -CPA5 (Fig. 3).These four are the transfectants with the highest CP activities (15-to 140-fold higher than that of the control). Moreover, the respec-tive overexpressed cysteine peptidases have already been de-scribed as being secreted (23–25). A peptidase release was alsodescribed for EhCP-B9 (24). Thus, it cannot be excluded that thelack of detectable secretion of some of the transfectants is due to alow total CP activity.
ALA formation in mice using transfectants of the nonpatho-genic clone A1 overexpressing different ehcp genes. It was previ-
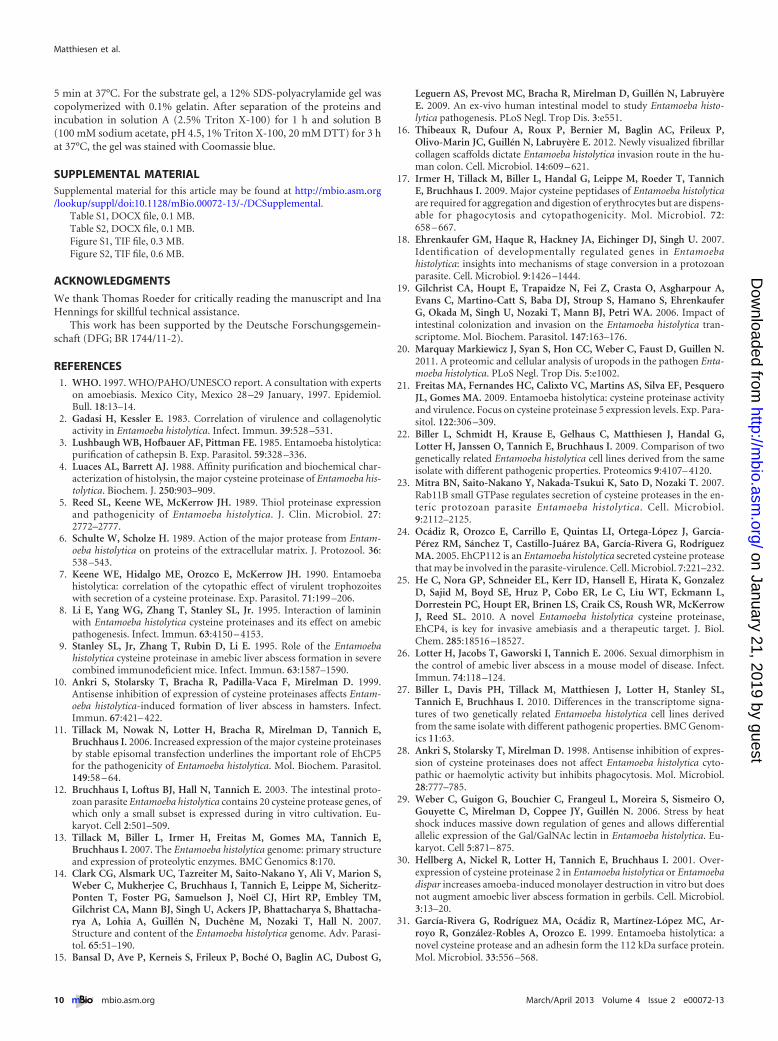
ously shown that cell line B forms abscesses in both the gerbilmodel and the immune-competent mouse model whereas cell lineA is nonpathogenic (22, 26). Similar results were obtained forclone B2 and clone A1 in the mouse model in the current study.Infections with trophozoites of clone B2 induced ALAs between 3and 4 mm in diameter (Fig. 4) (abscess score, 2.4 � 1.3), whereasno ALA formation was observed seven days postinfection usingclone A1. Transfection of clone A1 with the control vector pNCdid not induce any abscess formation (abscess score, 0.2 � 0.4).This was also true for the transfectants overexpressing ehcp-a1,-a2, -a4, -a6, -a7, and -a10 (all had abscess scores of �1). In con-trast, transfection with the plasmids pNC-CPA3, -CPA5, -CPB8,-CPB9, and -CPC13 made clone A1 pathogenic. For all thesetransfectants, ALA formation was significantly higher (abscessscores of between 1.4 and 2.1) than ALA formation in the pNCtransfectant (Fig. 4).
ehcp expression profiles of E. histolytica clone A1 transfec-tants with conferred pathogenic phenotypes. The ehcp expres-sion profiles of the clone A1 transfectants that conferred a patho-genic phenotype were analyzed in detail. For pNC-CPB8, -CPB9,and -CPC13 transfectants, the overexpression was highly specific,with a significant overexpression of the relevant ehcp gene andweak overexpression of only a few other ehcp genes (Table 4). Forexample, in pNC-CPB8 transfectants, the expression of two pep-
TABLE 1 Expression of ehcp genes in trophozoites of cell line B, clone B2, and clone A1 cultivated under axenic conditions
ehcp gene GenBank accession no.
�CTa
Cell line B Clone B2 Clone A1
ehcp-a1 XM_645064 �0.91 � 0.68 0.36 � 0.74 0.20 � 0.24ehcp-a2 XM_645550 �0.92 � 0.68 0.37 � 0.52 0.58 � 0.30ehcp-a3 XM_648162 10.73 � 1.85 12.84 � 0.45 11.25 � 0.26ehcp-a4 XM_651510 4.74 � 0.80 5.69 � 0.58 5.01 � 1.07ehcp-a5 XM_645845 2.06 � 0.46 2.29 � 0.70 1.84 � 0.39ehcp-a6 XM_652272 7.37 � 0.29 7.54 � 0.92 5.18 � 0.42ehcp-a7 XM_643904 1.75 � 0.88 2.45 � 0.81 3.36 � 0.52ehcp-a8 XM_652354 8.21 � 1.36 8.77 � 0.33 8.5 � 0.13ehcp-a9 XM_650583 ND 11.18 � 0.49 10.32 � 0.17ehcp-a10 XM_646055 8.27 � 0.15 9.51 � 0.85 8.76 � 0.22ehcp-a11 XM_646598 4.67 � 0.59 5.52 � 0.79 4.93 � 0.04ehcp-a12 XM_648731 9.66 � 0.23 9.61 � 0.65 8.97 � 0.11ehcp-a13 Not annotated 6.45 � 0.30 7.44 � 0.95 6.58 � 0.12ehcp-b1 XM_646489 14.17 � 2.44 14.38 � 0.67 11.4 � 0.46ehcp-b2 XM_001914414 ND 14.56 � 1.20 9.3 � 0.38ehcp-b3 XM_651655 10.52 � 2.10 12.53 � 0.55 11.76 � 0.4ehcp-b4 XM_643409 5.66 � 0.30 7.17 � 0.72 6.2 � 0.1ehcp-b5 XM_647579 10.13 � 0.29 10.44 � 0.89 9.46 � 0.14ehcp-b7 XM_645308 8.02 � 0.84 8.86 � 0.65 10.68 � 0.16ehcp-b8 XM_645957 18.54 � 0.52 17.65 � 0.47 18.31 � 0.53ehcp-b9 XM_647901 10.06 � 0.06 10.37 � 0.40 10.3 � 0.21ehcp-b10 XM_643214 ND 12.97 � 4.09 14.95 � 0.92ehcp-c1 XM_649361 9.93 � 0.92 9.47 � 0.61 8.3 � 0.23ehcp-c2 XM_651540 ND 9.93 � 2.36 6.91 � 0.57ehcp-c3 XM_650036 ND 7.82 � 1.05 6.62 � 0.91ehcp-c4 XM_650708 4.79 � 0.87 4.63 � 0.74 4.48 � 0.02ehcp-c5 XM_649708 4.99 � 0.47 5.98 � 1.44 5.77 � 0.28ehcp-c6 XM_646461 ND 12.94 � 3.3 7.5 � 0.02ehcp-c9 XM_649919 ND 7.40 � 0.91 5.85 � 0.02ehcp-c11 XM_642991 ND 13.94 � 3.37 9.79 � 0.66ehcp-c12 XM_645737 ND 10.14 � 1.31 8.22 � 1.1ehcp-c13 XM_651464 7.19 � 0.31 7.93 � 0.54 6.16 � 0.01ehicp1 XM_648163 ND 0.92 � 0.06 0.89 � 0.22ehicp2 XM_644271 ND 2.2 � 0.09 1.89 � 0.13a Concentration relative to ehactin, which was used as a normalizer. ND, not determined; �CT, threshold cycle. At least two biological replicates were analyzed in duplicate.
Cysteine Peptidases as Pathogenicity Factors
March/April 2013 Volume 4 Issue 2 e00072-13 ® mbio.asm.org 3
on January 21, 2019 by guesthttp://m
bio.asm.org/
Dow
nloaded from

tidase genes (ehcp-b2 and ehcp-c2) decreased and the expression ofone (ehcp-b10) slightly increased (Table 4). Despite the strongincrease in expression of the transfected peptidase gene, as dem-onstrated by the qRT-PCR assay, this was not reflected at the pro-tein level, with substrate gel electrophoresis showing no increasein intensity of the relevant protein band (Fig. 2).
In the pNC-CPA5 transfectants, a 3-fold increase in ehcp-a5expression was observed, but there was also a 5-fold increase inehcp-a2 expression (Table 4). This result was confirmed by sub-strate gel electrophoresis, which showed that bands representingEhCP-A5 and EhCP-A2 were more intense than that of the con-trol, pNC (Fig. 2). There was also an increase in the intensity of theband representing EhCP-A1 in pNC-CPA5 relative to pNC trans-fectants. Therefore, it is unclear whether the increased pathoge-nicity of the pNC-CPA5 transfectants was the result of the in-creased expression of ehcp-a5 or other ehcp genes.
Surprisingly, in pNC-CPA3 transfectants, the expression of allehcp-a genes increased significantly between 3.5- and 470-fold(Table 4). In addition, a significant increase in expression was alsoobserved for three members of the ehcp-b family and three mem-
bers of the ehcp-c family. So far, we have no explanation for thisphenomenon. Even more surprisingly, this increase in expressionwas not reflected at the protein level, as no significant increase inCP activity with respect to the control was detected (Table 3;Fig. 2).
The discrepancies between mRNA levels and CP activities maybe due to increased amounts of cysteine peptidase inhibitors in thetransfectants. However, no differences in the amounts of tran-scripts of the two inhibitors of cysteine peptidase activity, EhICP1and EhICP2, in pNC-CPA3 transfectants and the pNC controlwere detected by qRT-PCR (Table 4). This was confirmed by titra-tion experiments in which fresh crude extracts from wild-typeclone B2 cells were titrated against boiled trophozoite lysates fromeither pNC or pNC-CPA3 transfectants; similar inhibitor activi-ties were measured in all heat-inactivated extracts (data notshown).
DISCUSSION
Earlier studies have identified two cell lines derived from thepathogenic E. histolytica isolate HM-1:IMSS that differ substan-
TABLE 2 Expression of ehcp genes in trophozoites derived from ALAs of gerbils and mice analyzed by qRT-PCR
ehcp gene GenBank accession no.
��CTa
Cell line B(axenic culture)calibrator 7 dpi
Cell line Bgerbil ALA 7 dpib
Clone B2(axenic culture)calibrator 7 dpi
Clone B2 mouse ALA
24 hpi 48 hpi 72 hpi
I II I II I II
ehcp-a1 XM_645064 1 2.35 �0.91 1 1.53 0.84 1.08 0.55 1.69 2.67ehcp-a2 XM_645550 1 0.47 �0.10 1 0.90 0.64 0.55 1.12 0.32 0.31ehcp-a3 XM_648162 1 55.59 �33.42* 1 8.56 345.2 8.92 28.8 10.89 8.05ehcp-a4 XM_651510 1 16.01 � 11.94* 1 0.79 1.74 1.93 1.09 7.98 5.84ehcp-a5 XM_645845 1 1.48 � 0.99 1 2.52 1.11 3.18 5.04 4.06 8.04ehcp-a6 XM_652272 1 2.18 � 0.32 1 1.60 1.30 5.73 3.36 3.2 12.49ehcp-a7 XM_643904 1 2.15 � 0.52 1 9.78 86.23 4.11 13.51 13.39 25.0ehcp-a8 XM_652354 1 1.33 � 0.47 1 1.26 0.42 2.50 1.64 NA 0.66ehcp-a9 XM_650583 ND ND 1 1.68 1.89 2.73 2.81 2.56 1.55ehcp-a10 XM_646055 1 18.45 � 2.35* 1 2.09 20.22 5.91 12.42 NA NAehcp-a11 XM_646598 1 0.61 � 0.40 1 0.29 0.54 1.45 1.19 1.33 0.53ehcp-a12 XM_648731 1 0.83 1 0.32 NA 1.05 0.38 NA 2.16ehcp-a13 Not annotated 1 1.17 � 0.62 1 1.07 NA 1.4 0.77 NA NAehcp-b1 XM_646489 1 NA 1 NA NA NA NA NA NAehcp-b2 XM_001914414 ND ND 1 NA NA NA NA NA NAehcp-b3 XM_651655 1 2.5 � 0.33 1 1.43 1.36 NA NA NA NAehcp-b4 XM_643409 1 0.52 � 0.33 1 1.65 NA 1.12 0.61 1.52 2.06ehcp-b5 XM_647579 1 1.61 � 0.83 1 0.87 0.82 1.98 2.33 NA 2.30ehcp-b7 XM_645308 1 0.6 � 0.42 1 1.51 0.27 0.86 0.87 0.67 0.81ehcp-b8 XM_645957 1 116.6 � 77.37* 1 NA NA NA NA NA NAehcp-b9 XM_647901 1 11.08 � 4.0* 1 1.09 0.69 0.61 1.34 2.49 1.45ehcp-b10 XM_643214 ND ND 1 NA NA NA NA NA NAehcp-c1 XM_649361 1 0.8 � 0.5 1 0.63 0.8 NA NA NA 2.02ehcp-c2 XM_651540 ND ND 1 NA NA NA NA NA NAehcp-c3 XM_650036 ND ND 1 NA NA NA NA NA NAehcp-c4 XM_650708 1 2.49 � 0.95 1 1.50 1.20 3.14 2.32 1.92 2.59ehcp-c5 XM_649708 1 0.63 � 0.32 1 0.51 0.32 0.5 0.38 0.23 0.35ehcp-c6 XM_646461 ND ND 1 NA 2.76 NA NA NA NAehcp-c9 XM_649919 ND ND 1 1.27 1.14 1.28 1.33 NA 1.42ehcp-c11 XM_642991 ND ND 1 NA NA NA NA NA NAehcp-c12 XM_645737 ND ND 1 NA 1.1 NA NA 2.34 1.26ehcp-c13 XM_651464 1 4.25 � 1.88* 1 2.75 1.1 2.49 2.04 3.04 2.93a Relative differences in gene expression; ehactin was used as a normalizer. Bold indicates differentially expressed genes. NA, no amplificate in respective qRT-PCR; ALA, amoebicliver abscess; ND, not determined; I and II indicate two different animals.b The threshold for defining genes as being differentially expressed was set at 3.0. The expression of the various ehcp genes of amoebae derived from gerbil livers was analyzed at leasttwo times in duplicate. P values of differentially expressed genes are expressed as follows: *, P � 0.05.
Matthiesen et al.
4 ® mbio.asm.org March/April 2013 Volume 4 Issue 2 e00072-13
on January 21, 2019 by guesthttp://m
bio.asm.org/
Dow
nloaded from

tially in their pathogenic properties (22). Cell line B is highlypathogenic, characterized by its ability to produce considerableALAs, whereas cell line A is unable to induce ALAs (22). To ensurethat these cells were not a mixture of different cell types, both celllines were cloned. The clones A1 and B2 were very similar inpathogenicity to their parental cell lines, with clone B2 causingALAs in the mouse and gerbil models and clone A1 not causingALAs in either animal (Fig. 4; see also Fig. S1 in the supplementalmaterial). Additionally, qRT-PCR analysis of the genes known tobe differentially expressed in cell lines A and B (27) revealed sim-ilar differential expression in clones A1 and B2 (Table S1). Finally,both clones have CP activities comparable to those of their paren-tal cell lines (22), with the activity of clone B2 being approximatelyten times higher than that of clone A1. Surprisingly, the differ-ences in CP activity between clones B2 and A1 were not reflectedin the expression profiles of the whole set of ehcp genes, whichwere very similar for the two clones (Table 1). The reasons for thisdiscrepancy require further investigation.
Several studies have demonstratedthat CPs of E. histolytica play a role in ab-scess formation; therefore, low CP activ-ity may be at least partially responsible forthe nonpathogenic phenotype of cloneA1. Ankri and colleagues showed that a90% decrease in CP activity, triggered byantisense inhibition of the expression ofehcp-a5, resulted in a reduction in patho-genicity (10, 28). Nevertheless, theehcp-a5 antisense mRNA inhibited notonly ehcp-a5 expression but also the ex-pression of other CPs. Thus, the observedreduction in pathogenicity of these trans-fectants may have been due to the generalreduction in CP activity rather than tothat of a single peptidase.
Little is known about the regulation ofehcp expression during the process ofALA formation, with only a few reportsdescribing increased expression of a fewehcp genes during induction of cecal coli-tis. For example, ehcp-a4, which is ex-pressed at moderate levels in axenic cul-ture, is upregulated in cecal colitis andfollowing exposure to intestinal cells (19,25). In addition, Gilchrist and colleaguesreported increased expression of three ad-ditional peptidase genes (ehcp-a1, -a6,and -a8) in trophozoites isolated from thecolon of mice (19). If a peptidase gene isupregulated during ALA formation, thenit may play a role in this process. This hy-pothesis can be tested by determining ifoverexpressing the candidate gene innonpathogenic E. histolytica mediates apathogenic phenotype.
We analyzed and compared ehcp ex-pression during ALA formation in gerbiland mouse models. The gerbil model isroutinely used in several laboratoriesworldwide. Nevertheless, the toolbox that
allows state-of-the-art immunological investigations in this ani-mal is not available. Therefore, a mouse model was recently estab-lished (26). In both animals, the time course of abscess formationis self-limited and amoebic lesions are cleared within approxi-mately 30 days postinfection. Only a few ehcp genes were found tobe expressed at high levels during abscess formation in the currentstudy. Some of them (ehcp-a3, -a4, -a10, and -c13) were upregu-lated in both the mouse and gerbil models, whereas a few otherswere upregulated in either the gerbil (ehcp-b8 and -b9) or mouse(ehcp-a5, -a6, and -a7) model only. The expression of a few ofthese ehcp genes has been reported to be affected by heat stress,with Weber and colleagues reporting an increase in the expressionof ehcp-a4 and -a5 (29) and Tillack and colleagues reporting anincrease in the expression of ehcp-a5 and -a6 (13). Thus, the en-hanced expression of ehcp-a4, -a5, and -a6 reported in the currentstudy may simply be a response to the higher temperatures of thegerbil and mouse livers.
To investigate if the total amount of CPs or the increase in
FIG 1 Schematic of plasmid vectors used for stable episomal transfection of E. histolytica clone A1trophozoites. Neomycin phosphotransferase (neoR) flanked by the 5=- and 3=-untranslated sequence ofan E. histolytica actin gene was used as a selectable marker. Ehcp-a1, -a2, and -a5 are flanked by therespective gene-specific 3=- and 5=-untranslated regions (11). For all other plasmids, the coding se-quences of the ehcp genes are flanked by the 5=-untranslated sequence of an E. histolytica lectin gene andby a 3=-untranslated sequence of an E. histolytica actin gene. MCS, multiple cloning site.
Cysteine Peptidases as Pathogenicity Factors
March/April 2013 Volume 4 Issue 2 e00072-13 ® mbio.asm.org 5
on January 21, 2019 by guesthttp://m
bio.asm.org/
Dow
nloaded from

expression of a specific CP in response to ALA formation is relatedto pathogenicity, transfectants of the nonpathogenic clone A1overexpressing those ehcp genes that were upregulated duringALA formation in the mouse and gerbil models were generated. Ifoverexpression of a particular ehcp mediates pathogenicity in anonpathogenic amoeba, it is likely that this gene plays an impor-tant role in pathogenicity.
Our results indicate that five of the eleven transfectants ana-lyzed (pNC-CPA3, -CPA5, -CPB8, -CPB9, and -CPC13) can con-fer a pathogenic phenotype of clone A1 (Fig. 4). Each of thesetransfectants produced abscesses of a similar size as those pro-duced by the pathogenic clone B2. Detailed analysis of the ehcpexpression profiles indicated that for the pNC-CPB8, -CPB9, and-CPC13 transfectants, the relevant ehcp was specifically overex-pressed, with only a few other genes showing a slight up- or down-regulation. Therefore, it can be concluded that the specific over-expression of any one of these three CPs is sufficient to transformthe nonpathogenic phenotype of E. histolytica clone A1 into apathogenic E. histolytica phenotype. However, it can only be spec-ulated if the specific overexpression of these CPs directly influ-ences ALA formation or if a processing of additional proteins ofamoebic or host origin stimulates abscess formation. In addition,
it has to be kept in mind that the expression was analyzed only forgenes encoding CPs. Therefore, it is not known if the expression ofother non-ehcp genes is influenced.
The picture is not so clear for the other two transfectants(pNC-CPA5 and pNC-CPA3) that mediated a pathogenic pheno-type of clone A1. For the pNC-CPA5 transfectants, an approxi-mately 60-fold increase in CP activity over that of the control,pNC, was observed (Table 3). This was confirmed using substrategel electrophoresis, in which an increase in the intensity of thebands corresponding to EhCP-A1, -A2, and -A5 was detected(Fig. 2). Therefore, it is possible that the high overall CP activity orthe specific composition of CPs, rather than the overexpression ofehcp-a5 alone, was responsible for the pathogenicity observed. Inearlier studies, Tillack and colleagues used the expression vectorspNC-CPA1, pNC-CPA2, and pNC-CPA5 to transfect trophozo-ites of the pathogenic cell line HM-1:IMSS (11, 30). Overexpres-sion of ehcp-a1 and ehcp-a2 resulted in an increase of EhCP-A1and EhCP-A2, respectively, with no influence on ALA formation,a finding which is in good agreement with results of the currentstudy. Overexpression of ehcp-a5 led to an increase of EhCP-A1and -A2 as well as -A5, and the transfectants produced abscessescovering a 3-fold-greater area of tissue than the respective control
TABLE 3 Expression and CP activity of clone A1 transfectants overexpressing various ehcp genes
Clone A1 transfectant Relative expression (��CT method)a
CP activity
mU/mg Fold activity to control (P value)
pNC 1 0.49 � 0.47 1pNC-CPA1 14.1 � 13 24.3 � 1.1 49.6 (�0.0001)***pNC-CPA2 6.1 � 1.7 69.5 � 19.4 141.8 (0.0012)**pNC-CPA3 22.20 � 20.35 1.2 � 0.38 2.4 (NS)pNC-CPA4 387.5 � 94.5 7.7 � 2.9 15.7 (0.0007)***pNC-CPA5 3.16 � 2.01 30.6 � 18.3 62.4 (0.0011)**pNC-CPA6 119.2 � 21.7 0.9 � 0.6 1.8 (NS)pNC-CPA7 7 � 4.4 5.2 � 4.5 10.6 (0.0080)**pNC-CPA10 642.4 � 54.1 2.9 � 2.4 5.9(0.0043)**pNC-CPB8 9,370 � 13,028 3.6 � 2.9 7.3(0.043)*pNC-CPB9 589 � 1,097 3.8 � 3.6 7.8(0.0173)*pNC-CPC13 19.83 � 12.17 2.1 � 0.9 4.3(0.0043)**a Relative expression of the ehcp gene that should be overexpressed in the respective transfectant was analyzed. Ehactin was used as a normalizer. NS, not significant; CP, cysteinepeptidases.
FIG 2 Substrate gel electrophoresis of E. histolytica clone B2, clone A1, and transgenic clone A1 trophozoites overexpressing various ehcp genes. Trophozoitesof E. histolytica clone A1 were transfected with episomal plasmids as indicated and selected with G418. Subsequently, lysates (4 �g protein/ml) of the cells wereseparated on SDS-PAGE gels copolymerized with gelatin. To visualize the CP activity of proteins, gels were stained with Coomassie blue and the picture wasinverted. Standards are indicated in kDa on the left.
Matthiesen et al.
6 ® mbio.asm.org March/April 2013 Volume 4 Issue 2 e00072-13
on January 21, 2019 by guesthttp://m
bio.asm.org/
Dow
nloaded from

transfectants, a finding which is again in good agreement withresults from the current study.
For the EhCP-A3 transfectants in the current study, the ehcpexpression profile indicated an overexpression of all A familymembers, three B family members, and three C family members.Nevertheless, this was not confirmed at the protein level, as theEhCP-A3 transfectants had an activity of 1.2 mU/mg, which isonly slightly higher than that of the control pNC transfectants(Table 2). Further expression and activity studies indicated thatthe lower-than-expected CP activity was not the result of an in-crease in the activity of inhibitors of cysteine peptidases. There-fore, it still remains to be determined whether the restoration ofpathogenicity in the pNC-CPA3 transfectants was due to the over-expression of a particular peptidase or to some other factor.
In summary, the specific overexpression of any of the threepeptidases, ehcp-b8, -b9, and -c13, whose expression is increased
during ALA formation, is sufficient to transform a nonpathogenicphenotype into a pathogenic one. It is difficult to hypothesize onthe mechanism(s) by which these CPs mediate pathogenicity tothe nonpathogenic clone A1, as there is little mechanistic infor-mation available for these peptidases. EhCP-B9 (EhCP112) isknown to form a complex with an adherence domain protein(EhADH112), and then, as a complex, both proteins bind to targetcells and are translocated during phagocytosis from the plasmamembrane to phagocytic vacuoles (24, 31). Furthermore,EhCP-B9 has a putative transmembrane domain and contains anRGD (Arg–Gly–Asp) motif at positions 249 to 251 between theactive-site cysteine167 and histidine328 (31). This RDG motif is alsofound in EhCP-B8 at a similar position (positions 245 to 247) aswell as in the proregion of EhCP-A5 (positions 92 to 94).EhCP-A5 binds via its RGD motif to �V�3 integrin on colonic cellsand stimulates NF�B-mediated proinflammatory responses in thepathogenesis of intestinal amoebiasis (32). For EhCP-C13, anN-terminal signal anchor is postulated, and Western blot analysisindicated that the protein is present in the membrane fraction ofE. histolytica (see Fig. S2 in the supplemental material).
Nevertheless, it remains to be determined why EhCP-B8, -B9,and -C13 have such a profound effect on amoebic pathogenicity.Localization to the plasma membrane and secretion of the CPs arenot sufficient to induce ALA formation. Of the three peptidasegenes (ehcp-a1, -a2, and -a7) that are highly expressed under ax-enic culture conditions, EhCP-A2 was described to be membraneassociated and, in addition, like EhCP-A1, secreted (Fig. 3) (23,33, 34). Secretion was also described for EhCP-A4, which wasfound beside EhCP-A6 and EhCP-A10 in higher levels duringALA formation (Fig. 3) (25). Nevertheless, EhCP-A1, -A2, and A4apparently do not influence pathogenicity.
MATERIALS AND METHODSCultivation of cells. The E. histolytica cell lines A and B derived from theisolate HM-1:IMSS were cloned by limited dilution (22). Most experi-ments were performed with the nonpathogenic clone A1 or the patho-genic clone B2. E. histolytica trophozoites were cultured axenically in TYI-S-33 medium in plastic tissue culture flasks (35). For individualexperiments, 1 � 106 trophozoites were cultivated for 24 h in 75-ml cul-ture flasks. Then, after chilling on ice for 5 min, the trophozoites wereharvested by sedimentation at 430 � g at 4°C for 5 min. The resulting cellpellet was washed twice either in phosphate-buffered saline (6.7 mMNaHPO4, 3.3 mM NaH2PO4, 140 mM NaCl, pH 7.2; PBS) or in TYI-S-33medium without serum. For preparation of soluble amoeba extracts, cellswere lysed by four freeze-thaw cycles in CO2/ethanol and sedimented bycentrifugation (15,000 � g at 4°C for 15 min).
ALA formation in gerbils and mice. Animal infections were per-formed with eight-week-old male gerbils (Meriones unguiculatus) or witheight- to 10-week-old C57BL/6 male mice. All mice were maintained in aspecific-pathogen-free microenvironment and received care in compli-ance with guidelines outlined in the Guide for the Care and Use of Labo-ratory Animals. All work was conducted with the approval of the Govern-ment for Science and Health, Hamburg, Germany (TVA 23/11).
For the infection of gerbils, 1 � 106 trophozoites of cell line B weresuspended in 100 �l PBS and were then injected into the left liver lobe, aspreviously described (36). For mice infection experiments, 1.25 � 105
trophozoites of clone B2 or clone A1 transfectants were resuspended in25 �l PBS and subsequently injected into the liver as described previously(26). It is noteworthy to emphasize that neither cell line B nor any of theclones were passaged through the liver of mice or gerbils prior to theinfection experiments.
For analyzing the expression profiles of ehcp genes during ALA forma-tion, mice were sacrificed 24, 48, and 72 hpi and gerbils were sacrificed
FIG 3 To determine the secretion of CPs, 1 � 106 trophozoites were sus-pended in 500 �l TYI_secretion medium. After 0 min, 1 h, 2 h, and 3 h ofincubation, the amoebae were sedimented and the supernatant was removedto measure CP activity. To determine the total CP activity, soluble extracts of 1� 106 trophozoites/500 �l were generated. Secretion was outlined as the per-centage of total activity. Each time point was measured at least two times induplicate.
Cysteine Peptidases as Pathogenicity Factors
March/April 2013 Volume 4 Issue 2 e00072-13 ® mbio.asm.org 7
on January 21, 2019 by guesthttp://m
bio.asm.org/
Dow
nloaded from
seven days postinfection. For mouse infection experiments, two animalsof each time point were analyzed separately in duplicate. For gerbil infec-tion experiments, the expression was analyzed in samples derived fromthree animals in duplicate. The area of abscess was cut out and directlyutilized for RNA purification. For each time point, areas of tissue contain-ing abscesses from two animals were analyzed.
To analyze ALA formation using the various transfectants, mice weresacrificed seven days after infection and sizes of liver abscesses were deter-mined. The diameters of the abscessed areas within the liver were mea-sured, and the results were expressed using the following scores: 0, noabscess; 1, �1 mm (pinhead); 2, �5 mm; 3, �5 mm. For each transfec-tant, ALA formation in 5 to 18 animals was analyzed. P values were cal-culated using the Mann-Whitney test.
RNA extraction and qRT-PCR. E. histolytica trophozoites (1 � 106)were cultivated in 75-ml culture flasks for 24 h. The cells were harvestedvia chilling on ice for 5 min and sedimented at 200 � g for 5 min at 4°C.The cell pellet was washed twice with PBS. For isolation of total RNA,trophozoites were treated with Trizol reagent (Life Technologies, Darm-stadt, Germany) by following the manufacturer’s instructions. ExtractedRNA was further purified using the RNeasy minikit (Qiagen, Hilden, Ger-many) without �-mercaptoethanol, and DNA was digested with DNase(Qiagen).
For extraction of RNA from ALA material, approximately 100 mgabscess/liver tissue was homogenized in the presence of 500 �l TRIzolreagent (Life Technologies). After the addition of another 500 �l TRIzolreagent, the RNA was extracted as described above.
cDNA synthesis was accomplished with the SuperScript III reversetranscriptase system (Life Technologies). In a final volume of 20 �l, 1 �gof RNase-free and DNase-treated total RNA was mixed with 5� first-strand buffer, 1 mM deoxynucleoside triphosphates (dNTPs), 500 nMOdT-T71 (5=-GAG AGA GGA TCC AAG TAC TAA TAC GAC TCA CTATAG GGA GAT24), 2 mM dithiothreitol (DTT), 0.5 mM MgCl2, 40 URnaseOut (Life Technologies), and SuperScript III (200 U/�l). cDNA wassynthesized for 1 h at 42°C.
For qRT-PCR experiments, sense and antisense primers were designed
to amplify approximately 100 to 120 bp of the relevant gene. In total,qRT-PCR assays were able to be developed for 32 of the 35 ehcp genes (seeTable S2 in the supplemental material). Quantitative amplification wasperformed in a Rotor-Gene PCR apparatus (Corbett) using a RealMaster-Mix SYBR ROX kit (5 Prime). cDNA (1 �l) was mixed with 2.5� Real-MasterMix/20� SYBR and 5 pmol/�l of appropriate sense and antisenseprimers to a final volume of 20 �l. Amplification conditions were as fol-lows: 40 cycles at 95°C for 15 s, 58°C for 20 s, and 68°C for 20 s and anadjacent melting step (67 to 95°C). Relative differences in gene expressionbetween axenic cultivated control trophozoites (calibrator � 1) and ALA-derived trophozoites or transfectants were calculated using the 2���CT
method provided by the Rotor-Gene software (37). Depending on theexperiment, cell line B trophozoites, clone B2 trophozoites, or clone A1trophozoites transfected with a control plasmid were used as the calibra-tor and actin was chosen as the housekeeping gene for normalization.Efficiencies of the primer pairs were determined using a template dilutionseries of genomic DNA (gDNA) from clone B2 at concentrations rangingfrom 50 ng to 0.00005 ng (38). Mean efficiencies determined with thetemplate dilution series were used for correction of the relative expressiondata. The threshold for defining genes as being differentially expressed wasset at 3.0.
Expression constructs. For overexpression of ehcp-a1, -a2, and -a5,the plasmids described by Tillack and colleagues were used (pNC-CPA1,-CPA2, and -CPA5) (11). For overexpression of ehcp-a3, -a4, -a6, -a7,-a10, -b8, -b9, and -c13, the coding sequences of the ehcp genes wereflanked by 485 bp of the 5=-untranslated sequence of an E. histolytica lectingene and 600 bp of the 3=-untranslated actin gene. For all, neomycinphosphotransferase was used as a selectable marker (30).
Transfection. Transfections were performed by electroporation as de-scribed previously (39). Two days after transfection, cells were selectedwith 10 �g/ml of G-418 sulfate (PAA, Pasching, Austria) for approxi-mately two weeks. Subsequently, the cells were cloned by limited dilutionand cultivated in the presence of 20 �g/ml of G418. Successful overexpres-sion of at least four clones was checked by qRT-PCR. The clone thatshowed the highest expression was used for all further experiments. The
FIG 4 Abscess formation in mouse livers following infection with E. histolytica clone B2 or clone A1 trophozoites as well as various transgenic trophozoitesoverexpressing various ehcp genes. Data are shown in the bar graphs as means � standard errors of the means (SEM). For each transfectant, ALA formation in5 to 15 animals was analyzed (clone B2, pNC-CPA3 and -CPA10, n � 5; pNC-CPA1, n � 6; pNC-CPA2, n � 8; pNC-CPA4, -CPA6, and -CPB8, n � 9;pNC-CPC13, n � 10; clone A1, pNC-CPA7, n � 11; pNC, n � 14, pNC-CPA5, n � 15). P values were calculated using the Mann-Whitney test. Abscess score:0, no abscess; 1, �1 mm; 2, 1 to 5 mm; 3, �5 mm. Seven days postinfection.
Matthiesen et al.
8 ® mbio.asm.org March/April 2013 Volume 4 Issue 2 e00072-13
on January 21, 2019 by guesthttp://m
bio.asm.org/
Dow
nloaded from

maintenance of ehcp overexpression was confirmed regularly by qRT-PCR.
Enzymatic assays. Peptidolytic activity was measured using the syn-thetic peptides Z-Arg-Arg-pNA, Z-Phe-Arg-pNA, Z-Ala-Ala-pNA,Z-Gly-Pro-pNA, and Z-Ala-Pro-pNA (Z � Cbz � benzyloxycarbonyl;pNA � p-nitroanilide; Bachem) as substrates (40). The peptide substrateswere prepared as 10 mM stock solutions. The sample to be measured (1 to40 �l) was added to 0.1 KH2PO4/2 mM EDTA/1 mM DTT, adjusted topH 7.0 with KOH. The activity of the transfectants pNCEhCPA1, -A3,-A5, -B8, -B9, and -C13 was in addition tested at pH 4, 5, 6, and 8. Thesubstrates were added at a final concentration of 0.1 mM (total volume,200 �l). The rate of cleavage of the pNA group from the substrate wasmonitored at 405 nm in 96-well plates at 25°C during 30 min. One unit ofenzymatic activity is defined as the amount that catalyzes the reduction of1 �mol/min of p-nitroaniline. The activity was measured at least fourtimes in duplicate.
To determine the inhibitory activity, amoebic extract was heated for5 min at 95°C to release the inhibitors of cysteine peptidases from thebound EhCPs and to inhibit the activity of the peptidases, centrifuged at20,000 � g at 4°C for 15 min, and then incubated with a fresh amoebic
extract of clone B2 for 15 min. The peptidolytic activity was assessed asmentioned above using Z-Arg-Arg-pNA as the substrate.
Assay to determine secretion. To determine the secretion of CPs, 1 �106 trophozoites were suspended in 500 �l TYI_secretion medium (TYI-S-33 without serum, supplemented with 10 mM HEPES, 0.15 mM CaCl2,and 0.5 mM MgCl2). After 0 min, 1 h, 2 h, and 3 h of incubation at 35°C,the amoebae were centrifuged (430 � g at 4°C for 2 min) and the super-natant was removed to measure CP activity. To determine the total activ-ity, soluble extracts of 1 � 106 trophozoites/500 �l were generated. Thesecretion was outlined as the percentage of total activity. Each time pointwas measured at least two times in duplicate. To prove the integrity of theamoebae, the cytoplasmic alcohol dehydrogenase (EhADH) activity wasmeasured. The enzymatic activity was measured at 35°C by following thereduction of NADP� at 340 nm. The assay mixture contained 2-propanol(20 mM), NADP� (0.2 mM), and glycine (50 mM) in a total volume of200 �l. Only those supernatants with no detectable ADH activity wereused to determine CP activity.
Substrate gel electrophoresis. The substrate gel electrophoresis wasperformed as described previously (41). In brief, 4 or 20 �g of amoebicextract was incubated with Laemmli buffer containing 20 mM DTT for
TABLE 4 Expression of ehcp genes in clone A1 transfectants showing an increased ability to induce ALAs in mice
ehcp gene (target)
�CT for cloneA1_pNC (axenicculture)a
Relative expression (��CTb method) of each transfectant
Clone A1_pNC(axenic culture)calibrator pNC-CPA3 pNC-CPA5 pNC-CPB8 pNC-CPB9 pNC-CPC13
ehcp-a1 0.47 � 0.65 1 9.41 � 5.19*c 1.46 � 0.39 0.47 � 0.2 0.5 � 0.24 0.81 � 0.22ehcp-a2 0.65 � 0.92 1 10.24 � 8.07* 4.9 � 0.9* 0.62 � 0.05 0.78 � 0.18 0.8 � 0.24ehcp-a3 12.29 � 0.9 1 22.20 � 20.35** 1.71 � 1.04 1.7 � 0.33 0.82 � 0.55 1.03 � 0.35ehcp-a4 5.37 � 0.8 1 6.3 � 1.35* 2.89 � 1.48 0.71 � 0.58 0.73 � 0.2 1.14 � 0.76ehcp-a5 1.68 � 0.86 1 8.65 � 1.22* 3.16 � 2.01** 0.85 � 0.16 0.31 � 0.05* 0.68 � 0.11ehcp-a6 5.25 � 0.59 1 9.35 � 2.09* 0.48 � 0.041 1.01 � 0.76 0.44 � 0.15 0.81 � 0.14ehcp-a7 3.94 � 0.59 1 467.2 � 501.9* 2.48 � 1.09 0.83 � 0.23 13.49 � 6.3* 1.28 � 0.43ehcp-a8 8.47 � 0.42 1 13.56 � 6.54* 0.43 � 0.1 0.65 � 0.27 0.62 � 0.084 1.18 � 0.17ehcp-a9 10.94 � 0.4 1 27.30 � 21.23* 0.83 � 0.0 1.06 � 0.35 2.9 � 1.24 1.57 � 0.33ehcp-a10 8.57 � 2.19 1 3.44 � 1.75* 0.86 � 0.56 1.18 � 0.53 2.91 � 3.1 0.78 � 0.44ehcp-a11 4.72 � 0.59 1 30.29 � 24.91* 0.53 � 0.05 1.03 � 0.45 0.64 � 0.09 1.1 � 0.13ehcp-a12 9.73 � 0.54 1 6.27 � 5.06* 0.96 � 0.06 0.84 � 0.35 0.65 � 0.12 1 � 0.29ehcp-a13 7.46 � 0.69 1 6.02 � 3.03* 0.76 � 0.31 0.78 � 0.24 0.4 � 0.11 1.43 � 0.47ehcp-b1 13.17 � 0.65 1 7.1 � 5.27* 1.7 � 0.53 1.32 � 0.33 0.76 � 0.45 0.72 � 0.21ehcp-b2 10.05 � 0.49 1 0.41 � 0.01 0.08 � 0.04* 0.12 � 0.05* 0.97 � 0.33 0.37 � 0.14ehcp-b3 11.38 � 0.76 1 31.28 � 33.97* 1.86 � 1.49 1.63 � 0.51 0.87 � 0.32 0.9 � 0.23ehcp-b4 6.7 � 0.6 1 2.61 � 1.33 0.54 � 0.28 0.91 � 0.08 0.71 � 0.14 1.07 � 0.35ehcp-b5 9.94 � 0.47 1 0.79 � 0.39 0.74 � 0.46 0.74 � 0.44 0.51 � 0.28 0.81 � 0.48ehcp-b7 9.8 � 0.18 1 1.81 � 0.72 2.16 � 1.24 0.69 � 0.1 0.6 � 0.43 0.98 � 0.53ehcp-b8 15.42 � 0.41 1 NA 2.98 � 1.24 9,370 � 13,028** NA NAehcp-b9 10.49 � 0.59 1 2.03 � 0.01 1.08 � 0.42 1.76 � 1.35 589 � 1,097** 1.43 � 0.43ehcp-b10 14.48 � 0.89 1 4.57 � 1.81* 0.84 � 0.1 4.23 � 1.4* 1.35 � 1.19 2.49 � 2.8ehcp-c1 10.20 � 0.89 1 42.56 � 47.02* 0.7 � 0.23 1.27 � 0.31 0.52 � 0.09 0.74 � 0.35ehcp-c2 7.73 � 0.78 1 NA 0.42 � 0.06 0.3 � 0.03* 2.17 � 2.24 0.55 � 0.64ehcp-c3 9.15 � 2.52 1 6.67 � 0.59* 0.48 � 0.01 0.65 � 0.27 2.43 � 3.28 0.35 � 0.01ehcp-c4 4.46 � 0.35 1 6.58 � 3.23* 0.76 � 0.22 0.73 � 0.1 0.74 � 0.22 2.19 � 2.17ehcp-c5 5.39 � 0.53 1 1.54 � 0.59 0.65 � 0.07 0.71 � 0.18 1.1 � 0.76 1.1 � 0.25ehcp-c6 14.28 � 0.26 1 NA NA 0.62 � 0.33 1.77 � 1.36 1.22 � 0.75ehcp-c9 5.87 � 0.53 1 4.4 � 4.34NS 0.75 � 0.13 0.98 � 0.24 1.51 � 1.08 0.94 � 0.41ehcp-c11 11.76 � 1.13 1 3.45 � 2.14NS 0.31 � 0.21* 0.92 � 0.65 0.35 � 0.2 1.03 � 0.24ehcp-c12 8.56 � 0.71 1 2.06 � 0.68 0.73 � 0.05 0.7 � 0.16 0.8 � 0.05 0.92 � 0.4ehcp-c13 7.27 � 0.63 1 1.48 � 0.29 1.02 � 0.14 1.08 � 0.18 2.06 � 1.2 19.83 � 12.17**ehicp1 4.49 � 0.41 1 2.03 � 0.28 3.55 � 1.05 ND ND NDehicp2 5.07 � 0.46 1 1.1 � 0.18 2.75 � 0.16 ND ND NDa Concentration relative to ehactin, which was used as a normalizer.b Relative differences in gene expression.c Expression of the various ehcp genes was analyzed at least two times in duplicate. Bold indicates differentially expressed genes. The threshold for defining genes as beingdifferentially expressed was set at 3.0. P values of differentially expressed genes are expressed as follows: *, P � 0.05; **, P � 0.01; NS, not significant. ND, not determined; NA, noamplificate in respective qRT-PCR.
Cysteine Peptidases as Pathogenicity Factors
March/April 2013 Volume 4 Issue 2 e00072-13 ® mbio.asm.org 9
on January 21, 2019 by guesthttp://m
bio.asm.org/
Dow
nloaded from
5 min at 37°C. For the substrate gel, a 12% SDS-polyacrylamide gel wascopolymerized with 0.1% gelatin. After separation of the proteins andincubation in solution A (2.5% Triton X-100) for 1 h and solution B(100 mM sodium acetate, pH 4.5, 1% Triton X-100, 20 mM DTT) for 3 hat 37°C, the gel was stained with Coomassie blue.
SUPPLEMENTAL MATERIALSupplemental material for this article may be found at http://mbio.asm.org/lookup/suppl/doi:10.1128/mBio.00072-13/-/DCSupplemental.
Table S1, DOCX file, 0.1 MB.Table S2, DOCX file, 0.1 MB.Figure S1, TIF file, 0.3 MB.Figure S2, TIF file, 0.6 MB.
ACKNOWLEDGMENTS
We thank Thomas Roeder for critically reading the manuscript and InaHennings for skillful technical assistance.
This work has been supported by the Deutsche Forschungsgemein-schaft (DFG; BR 1744/11-2).
REFERENCES1. WHO. 1997. WHO/PAHO/UNESCO report. A consultation with experts
on amoebiasis. Mexico City, Mexico 28 –29 January, 1997. Epidemiol.Bull. 18:13–14.
2. Gadasi H, Kessler E. 1983. Correlation of virulence and collagenolyticactivity in Entamoeba histolytica. Infect. Immun. 39:528 –531.
3. Lushbaugh WB, Hofbauer AF, Pittman FE. 1985. Entamoeba histolytica:purification of cathepsin B. Exp. Parasitol. 59:328 –336.
4. Luaces AL, Barrett AJ. 1988. Affinity purification and biochemical char-acterization of histolysin, the major cysteine proteinase of Entamoeba his-tolytica. Biochem. J. 250:903–909.
5. Reed SL, Keene WE, McKerrow JH. 1989. Thiol proteinase expressionand pathogenicity of Entamoeba histolytica. J. Clin. Microbiol. 27:2772–2777.
6. Schulte W, Scholze H. 1989. Action of the major protease from Entam-oeba histolytica on proteins of the extracellular matrix. J. Protozool. 36:538 –543.
7. Keene WE, Hidalgo ME, Orozco E, McKerrow JH. 1990. Entamoebahistolytica: correlation of the cytopathic effect of virulent trophozoiteswith secretion of a cysteine proteinase. Exp. Parasitol. 71:199 –206.
8. Li E, Yang WG, Zhang T, Stanley SL, Jr. 1995. Interaction of lamininwith Entamoeba histolytica cysteine proteinases and its effect on amebicpathogenesis. Infect. Immun. 63:4150 – 4153.
9. Stanley SL, Jr, Zhang T, Rubin D, Li E. 1995. Role of the Entamoebahistolytica cysteine proteinase in amebic liver abscess formation in severecombined immunodeficient mice. Infect. Immun. 63:1587–1590.
10. Ankri S, Stolarsky T, Bracha R, Padilla-Vaca F, Mirelman D. 1999.Antisense inhibition of expression of cysteine proteinases affects Entam-oeba histolytica-induced formation of liver abscess in hamsters. Infect.Immun. 67:421– 422.
11. Tillack M, Nowak N, Lotter H, Bracha R, Mirelman D, Tannich E,Bruchhaus I. 2006. Increased expression of the major cysteine proteinasesby stable episomal transfection underlines the important role of EhCP5for the pathogenicity of Entamoeba histolytica. Mol. Biochem. Parasitol.149:58 – 64.
12. Bruchhaus I, Loftus BJ, Hall N, Tannich E. 2003. The intestinal proto-zoan parasite Entamoeba histolytica contains 20 cysteine protease genes, ofwhich only a small subset is expressed during in vitro cultivation. Eu-karyot. Cell 2:501–509.
13. Tillack M, Biller L, Irmer H, Freitas M, Gomes MA, Tannich E,Bruchhaus I. 2007. The Entamoeba histolytica genome: primary structureand expression of proteolytic enzymes. BMC Genomics 8:170.
14. Clark CG, Alsmark UC, Tazreiter M, Saito-Nakano Y, Ali V, Marion S,Weber C, Mukherjee C, Bruchhaus I, Tannich E, Leippe M, Sicheritz-Ponten T, Foster PG, Samuelson J, Noël CJ, Hirt RP, Embley TM,Gilchrist CA, Mann BJ, Singh U, Ackers JP, Bhattacharya S, Bhattacha-rya A, Lohia A, Guillén N, Duchêne M, Nozaki T, Hall N. 2007.Structure and content of the Entamoeba histolytica genome. Adv. Parasi-tol. 65:51–190.
15. Bansal D, Ave P, Kerneis S, Frileux P, Boché O, Baglin AC, Dubost G,
Leguern AS, Prevost MC, Bracha R, Mirelman D, Guillén N, LabruyèreE. 2009. An ex-vivo human intestinal model to study Entamoeba histo-lytica pathogenesis. PLoS Negl. Trop Dis. 3:e551.
16. Thibeaux R, Dufour A, Roux P, Bernier M, Baglin AC, Frileux P,Olivo-Marin JC, Guillén N, Labruyère E. 2012. Newly visualized fibrillarcollagen scaffolds dictate Entamoeba histolytica invasion route in the hu-man colon. Cell. Microbiol. 14:609 – 621.
17. Irmer H, Tillack M, Biller L, Handal G, Leippe M, Roeder T, TannichE, Bruchhaus I. 2009. Major cysteine peptidases of Entamoeba histolyticaare required for aggregation and digestion of erythrocytes but are dispens-able for phagocytosis and cytopathogenicity. Mol. Microbiol. 72:658 – 667.
18. Ehrenkaufer GM, Haque R, Hackney JA, Eichinger DJ, Singh U. 2007.Identification of developmentally regulated genes in Entamoebahistolytica: insights into mechanisms of stage conversion in a protozoanparasite. Cell. Microbiol. 9:1426 –1444.
19. Gilchrist CA, Houpt E, Trapaidze N, Fei Z, Crasta O, Asgharpour A,Evans C, Martino-Catt S, Baba DJ, Stroup S, Hamano S, EhrenkauferG, Okada M, Singh U, Nozaki T, Mann BJ, Petri WA. 2006. Impact ofintestinal colonization and invasion on the Entamoeba histolytica tran-scriptome. Mol. Biochem. Parasitol. 147:163–176.
20. Marquay Markiewicz J, Syan S, Hon CC, Weber C, Faust D, Guillen N.2011. A proteomic and cellular analysis of uropods in the pathogen Enta-moeba histolytica. PLoS Negl. Trop Dis. 5:e1002.
21. Freitas MA, Fernandes HC, Calixto VC, Martins AS, Silva EF, PesqueroJL, Gomes MA. 2009. Entamoeba histolytica: cysteine proteinase activityand virulence. Focus on cysteine proteinase 5 expression levels. Exp. Para-sitol. 122:306 –309.
22. Biller L, Schmidt H, Krause E, Gelhaus C, Matthiesen J, Handal G,Lotter H, Janssen O, Tannich E, Bruchhaus I. 2009. Comparison of twogenetically related Entamoeba histolytica cell lines derived from the sameisolate with different pathogenic properties. Proteomics 9:4107– 4120.
23. Mitra BN, Saito-Nakano Y, Nakada-Tsukui K, Sato D, Nozaki T. 2007.Rab11B small GTPase regulates secretion of cysteine proteases in the en-teric protozoan parasite Entamoeba histolytica. Cell. Microbiol.9:2112–2125.
24. Ocádiz R, Orozco E, Carrillo E, Quintas LI, Ortega-López J, García-Pérez RM, Sánchez T, Castillo-Juárez BA, García-Rivera G, RodríguezMA. 2005. EhCP112 is an Entamoeba histolytica secreted cysteine proteasethat may be involved in the parasite-virulence. Cell. Microbiol. 7:221–232.
25. He C, Nora GP, Schneider EL, Kerr ID, Hansell E, Hirata K, GonzalezD, Sajid M, Boyd SE, Hruz P, Cobo ER, Le C, Liu WT, Eckmann L,Dorrestein PC, Houpt ER, Brinen LS, Craik CS, Roush WR, McKerrowJ, Reed SL. 2010. A novel Entamoeba histolytica cysteine proteinase,EhCP4, is key for invasive amebiasis and a therapeutic target. J. Biol.Chem. 285:18516 –18527.
26. Lotter H, Jacobs T, Gaworski I, Tannich E. 2006. Sexual dimorphism inthe control of amebic liver abscess in a mouse model of disease. Infect.Immun. 74:118 –124.
27. Biller L, Davis PH, Tillack M, Matthiesen J, Lotter H, Stanley SL,Tannich E, Bruchhaus I. 2010. Differences in the transcriptome signa-tures of two genetically related Entamoeba histolytica cell lines derivedfrom the same isolate with different pathogenic properties. BMC Genom-ics 11:63.
28. Ankri S, Stolarsky T, Mirelman D. 1998. Antisense inhibition of expres-sion of cysteine proteinases does not affect Entamoeba histolytica cyto-pathic or haemolytic activity but inhibits phagocytosis. Mol. Microbiol.28:777–785.
29. Weber C, Guigon G, Bouchier C, Frangeul L, Moreira S, Sismeiro O,Gouyette C, Mirelman D, Coppee JY, Guillén N. 2006. Stress by heatshock induces massive down regulation of genes and allows differentialallelic expression of the Gal/GalNAc lectin in Entamoeba histolytica. Eu-karyot. Cell 5:871– 875.
30. Hellberg A, Nickel R, Lotter H, Tannich E, Bruchhaus I. 2001. Over-expression of cysteine proteinase 2 in Entamoeba histolytica or Entamoebadispar increases amoeba-induced monolayer destruction in vitro but doesnot augment amoebic liver abscess formation in gerbils. Cell. Microbiol.3:13–20.
31. García-Rivera G, Rodríguez MA, Ocádiz R, Martínez-López MC, Ar-royo R, González-Robles A, Orozco E. 1999. Entamoeba histolytica: anovel cysteine protease and an adhesin form the 112 kDa surface protein.Mol. Microbiol. 33:556 –568.
Matthiesen et al.
10 ® mbio.asm.org March/April 2013 Volume 4 Issue 2 e00072-13
on January 21, 2019 by guesthttp://m
bio.asm.org/
Dow
nloaded from

32. Hou Y, Mortimer L, Chadee K. 2010. Entamoeba histolytica cysteineproteinase 5 binds integrin on colonic cells and stimulates NFkappaB-mediated pro-inflammatory responses. J. Biol. Chem. 285:35497–35504.
33. Que X, Brinen LS, Perkins P, Herdman S, Hirata K, Torian BE, RubinH, McKerrow JH, Reed SL. 2002. Cysteine proteinases from distinctcellular compartments are recruited to phagocytic vesicles by Entamoebahistolytica. Mol. Biochem. Parasitol. 119:23–32.
34. Melendez-Lopez SG, Herdman S, Hirata K, Choi MH, Choe Y, Craik C,Caffrey CR, Hansell E, Chávez-Munguía B, Chen YT, Roush WR,McKerrow J, Eckmann L, Guo J, Stanley SL, Jr, Reed SL. 2007. Use ofrecombinant Entamoeba histolytica cysteine proteinase 1 to identify a po-tent inhibitor of amebic invasion in a human colonic model. Eukaryot.Cell 6:1130 –1136.
35. Diamond LS, Harlow DR, Cunnick CC. 1978. A new medium for theaxenic cultivation of Entamoeba histolytica and other Entamoeba. Trans.R. Soc. Trop. Med. Hyg. 72:431– 432.
36. Lotter H, Zhang T, Seydel KB, Stanley SL, Jr, Tannich E. 1997. Identi-
fication of an epitope on the Entamoeba histolytica 170-kD lectin confer-ring antibody-mediated protection against invasive amebiasis. J. Exp.Med. 185:1793–1801.
37. Livak KJ, Schmittgen TD. 2001. Analysis of relative gene expression datausing real-time quantitative PCR and the 2���CT method. Methods 25:402– 408.
38. Pfaffl MW. 2001. A new mathematical model for relative quantification inreal-time RT-PCR. Nucleic Acids Res. 29:e45.
39. Hamann L, Nickel R, Tannich E. 1995. Transfection and continuousexpression of heterologous genes in the protozoan parasite Entamoebahistolytica. Proc. Natl. Acad. Sci. U. S. A. 92:8975– 8979.
40. Leippe M, Sievertsen HJ, Tannich E, Horstmann RD. 1995. Spontane-ous release of cysteine proteinases but not of pore-forming peptides byviable Entamoeba histolytica. Parasitology 111:569 –574.
41. Hellberg A, Leippe M, Bruchhaus I. 2000. Two major “higher molecularmass proteinases” of Entamoeba histolytica are identified as cysteine pro-teinases 1 and 2. Mol. Biochem. Parasitol. 105:305–309.
Cysteine Peptidases as Pathogenicity Factors
March/April 2013 Volume 4 Issue 2 e00072-13 ® mbio.asm.org 11
on January 21, 2019 by guesthttp://m
bio.asm.org/
Dow
nloaded from
Related Documents