385 JOSHUA K. HAUSMAN University of Michigan JOHANNES F. WIELAND University of California, San Diego Overcoming the Lost Decades? Abenomics after Three Years ABSTRACT We review the recent performance of the Japanese economy under Abenomics, the set of economic policies begun by Prime Minister Shinzo – Abe in 2012. We find that in 2014, Abenomics, and in particular expansionary monetary policy, continued to weaken the yen and raise stock prices. It also continued to generate positive inflation, though neither actual nor expected inflation is yet 2 percent. The real effects of Abenomics have been modest. Performance would have been better if not for two puzzles: The response of net exports to the weak yen was small, and there is little evidence that expansionary monetary policy had large effects on consumption. S hinzo – Abe took office as prime minister of Japan in December 2012 and embarked on a set of economic policies widely dubbed “Abenomics.” Abe’s economic program consisted of three arrows: (i) expansionary mon- etary policy, (ii) expansionary fiscal policy, and (iii) structural reforms. Under Governor Haruhiko Kuroda’s leadership, the Bank of Japan has vigorously pursued expansionary policy. But fiscal policy, while initially expansionary, turned contractionary in April 2014 when the consumption tax was raised from 5 to 8 percent. And while progress has been made on some structural reforms, such as electricity deregulation, corporate gover- nance, and female labor force participation, many of Abe’s reform prom- ises remain unimplemented (IMF 2015b). We therefore focus on monetary policy, the arrow of Abenomics that is both the most novel and the most fully implemented. In April 2013, the Bank of Japan embarked on a program of “quantitative and qualitative easing,” aiming to reach 2 percent inflation in two years (Bank of Japan 2013a). To achieve this goal, between 2012Q4 and 2015Q1 it

Welcome message from author
This document is posted to help you gain knowledge. Please leave a comment to let me know what you think about it! Share it to your friends and learn new things together.
Transcript

385
JOSHUA K. HAUSMANUniversity of Michigan
JOHANNES F. WIELANDUniversity of California, San Diego
Overcoming the Lost Decades? Abenomics after Three Years
ABSTRACT We review the recent performance of the Japanese economy under Abenomics, the set of economic policies begun by Prime Minister Shinzo– Abe in 2012. We find that in 2014, Abenomics, and in particular expansionary monetary policy, continued to weaken the yen and raise stock prices. It also continued to generate positive inflation, though neither actual nor expected inflation is yet 2 percent. The real effects of Abenomics have been modest. Performance would have been better if not for two puzzles: The response of net exports to the weak yen was small, and there is little evidence that expansionary monetary policy had large effects on consumption.
Shinzo– Abe took office as prime minister of Japan in December 2012 and embarked on a set of economic policies widely dubbed “Abenomics.”
Abe’s economic program consisted of three arrows: (i) expansionary mon-etary policy, (ii) expansionary fiscal policy, and (iii) structural reforms. Under Governor Haruhiko Kuroda’s leadership, the Bank of Japan has vigorously pursued expansionary policy. But fiscal policy, while initially expansionary, turned contractionary in April 2014 when the consumption tax was raised from 5 to 8 percent. And while progress has been made on some structural reforms, such as electricity deregulation, corporate gover-nance, and female labor force participation, many of Abe’s reform prom-ises remain unimplemented (IMF 2015b). We therefore focus on monetary policy, the arrow of Abenomics that is both the most novel and the most fully implemented.
In April 2013, the Bank of Japan embarked on a program of “quantitative and qualitative easing,” aiming to reach 2 percent inflation in two years (Bank of Japan 2013a). To achieve this goal, between 2012Q4 and 2015Q1 it

386 Brookings Papers on Economic Activity, Fall 2015
increased the monetary base from 25 percent of GDP to 57 percent of GDP. In the process, it accumulated 128 trillion yen of Japanese government bonds, equal to more than 25 percent of GDP.
In section I, we review the effects of Abenomics, and these monetary actions in particular, on intermediate indicators. Building on the analysis in our previous paper (Hausman and Wieland 2014),1 we show that expan-sionary monetary policy continued to weaken the yen and raise stock prices in 2014. Yet effects on nonfinancial variables were muted. Inflation expectations from market participants and professional forecasters remain roughly one-half to one percentage point below the Bank of Japan’s 2 per-cent target. Actual headline and core inflation are also still well below 2 per-cent. We argue that this persistent low expected inflation largely reflects the imperfect credibility of the 2 percent inflation target, although we cannot rule out some role for adaptive expectation formation and backward-looking price-setting behavior.
In section II, we consider the response of output to Abenomics. Between 2012Q4 and 2015Q2, annualized GDP growth was 0.9 percent; when measured per person ages 15 to 64 (the working-age population), it was 2.4 percent.2 A comparison with the rest of the world during the same period suggests that this was a success. For example, between the end of 2012 and 2015Q2, annualized GDP growth per working-age person was 1.8 percent in the United States and 1.1 percent in Germany. Nevertheless, relative to professional forecasts, Japan’s performance has been disappointing. Output in 2015 is likely to be at least a percent lower than that forecast in October 2012, before Abenomics began.3
Performance would have been better if not for two puzzles: weak con-sumption and weak net exports. Despite a 1-percentage-point decline in the real interest rate, consumption has been flat during the Abenomics years. To better understand this, we use the Japanese Family Income and Expenditure Survey to investigate how expansionary monetary policy is affecting different types of households. The results are puzzling, with monetary policy showing no visible effects on consumption among those households expected to benefit most, namely, net debtors and the young. In
1. For other recent evaluations of Abenomics and quantitative easing in Japan, see Patrick (2014) and Ito (2014).
2. All data are as of August 28, 2015. See the online appendix for information on sources. Online appendixes for papers in this volume may be found on the Brookings Papers web page (www.brookings.edu/bpea) under “Past Editions.”
3. This assumes that actual 2015 output growth is equal to 1 percent, the Consensus Economics forecast made in April 2015.
JOSHUA K. HAUSMAN and JOHANNES F. WIELAND 387
contrast, the April 2014 consumption tax increase had large effects on the consumption of all types of households. The story of flat consumption in Japan may therefore be one in which expansionary monetary policy had relatively little positive effect while contractionary fiscal policy had large negative effects.
A further mysterious factor behind slow output growth is a large increase in real imports. Since Abenomics began, real imports have risen by more than 10 percent, despite flat consumption and a weakening yen. We discuss three popular hypotheses—a decline in the relative price of imports, an increase in energy import demand, and an increase in foreign electronics demand—but find all of them to be either unsupported by the data or too small to explain the size of the import increase. In our view, the increase in imports remains a puzzle.
In section III, we turn to the outlook for future output and consumption in Japan. Consensus forecasts are for the level of GDP over the next five years to be nearly the same as that forecast in October 2012, before Abenomics began. This is largely because the path of Japanese consumption is now forecast to be below that expected in October 2012. That in turn is consistent with a larger-than-expected negative effect of the consumption tax and the lack of progress in making structural reforms.
We concluded in our previous paper on the subject (Hausman and Wieland 2014) that the first arrow of Abenomics, expansionary monetary policy, most likely passed a cost-benefit test. This remains our conclusion. The magnitude of the benefits is uncertain, but for the reasons detailed in that paper, the costs are likely small. We end this paper with suggestions for how the Bank of Japan might provide additional stimulus to the economy.
I. Intermediate Indicators
The ultimate goal of Abenomics is to raise output, but its effects on financial markets and inflation are also of interest. The response of these inter mediate indicators sheds light on the mechanisms through which expansionary mon-etary policy is—and is not—affecting the economy.
I.A. Financial Markets
Abenomics has continued to have large effects on financial markets. Figure 1 shows updated versions of the financial market figures in our previous paper on this subject (figures 2 through 6 there; see Hausman and Wieland [2014]). Financial market developments have generally continued along their early 2014 paths. The two vertical lines in each panel correspond to November

388 Brookings Papers on Economic Activity, Fall 2015
Sources: Bloomberg, Bank for International Settlements, and Yahoo! Finance. See online data appendix for more details.
a. These figures are an update of figures 2–6 in Hausman and Wieland (2014). In all panels, the Abenomics period begins in November 2012, indicated by the first vertical line. The second vertical line denotes October 2014, when quantitative easing was expanded.
b. The UIP-PPP measure of inflation expectations is calculated using the uncovered real interest rate parity condition and U.S. TIPS. For details, see Krugman (2013) and Hausman and Wieland (2014).
c. Real bond yields are calculated as the difference between nominal bond yields and inflation swap rates.d. The nominal exchange rate is yen per dollar. The real exchange rate is the broad BIS index, indexed to equal
the nominal exchange rate in January 2007.
Yield, percent
Nominal bond yields
0.5
1.0
1.5
2.0
2009 2011
Year Year
2013 2015
2-year
10-year
30-year
Expected inflation (risk-neutral), percent
Market inflation forecasts
Yield, percent
Real bond yieldsc
Exchange rate, yen per dollar
Exchange ratesd
2009 2011 2013 2015
2009 2011
Year Year
2013 2015 2009 2011 2013 2015
−2
0
2
2-year inflation swap rate
10-year inflation swap rate
10-year UIP-PPPb
−2
0
2
2-year
10-year
Index (Jan 2007 = 100)
Stock market
2009 2011
Year
2013 2015
60
80
100 Nikkei
Topix
100
120
140Nominal exchange rate
Real exchange rate
Figure 1. Abenomics’ Financial Market Effects, 2007–15a
JOSHUA K. HAUSMAN and JOHANNES F. WIELAND 389
2012, when then candidate Shinzo– Abe made clear his economic policy intentions, and to October 2014, when the Bank of Japan expanded its quan-titative and qualitative easing program, raising the targeted annual increase in the monetary base from 60–70 trillion yen (12–14 percent of 2014 GDP) to 80 trillion yen (16 percent of GDP) (Bank of Japan 2014).
During 2014, the most dramatic financial developments occurred in the value of the yen and in Japanese stock prices. The yen weakened from 79 per dollar in October 2012 to 102 per dollar in March 2014 and then to 123 per dollar in August 2015. This nominal exchange rate movement was largely reflected in Japan’s trade-weighted real exchange rate. According to the broad Bank for International Settlements (BIS) index, the real trade-weighted yen weakened 44 percent between October 2012 and July 2015. In July 2015, the real trade-weighted yen was weaker than at any time since 1982.4 Stock prices also continued to rise rapidly. From October 2012 to March 2014, the broad Topix index rose 62 percent; between March 2014 and August 2015 it rose a further 36 percent.
Of course, the coincidence between these asset price movements and expansionary monetary policy alone is no proof that the movements were caused by monetary policy. The best evidence that the policy was a cause comes from movements in asset prices on the day of significant monetary policy announcements. We documented in the earlier paper (Hausman and Wieland 2014) that declines in nominal interest rates, declines in the value of yen, and increases in the stock market all coincided with news of expan-sionary policy. These effects are consistent with time-series evidence on the effects of quantitative easing in Japan (Ito 2014). Further evidence comes from the financial market reaction to the announcement of the expansion of quantitative and qualitative easing on October 31, 2014. On that day, 30-year bond yields fell 5 basis points, the yen weakened 2.8 percent against the dollar, and the Topix stock market index rose 4.3 percent.5
I.B. Inflation
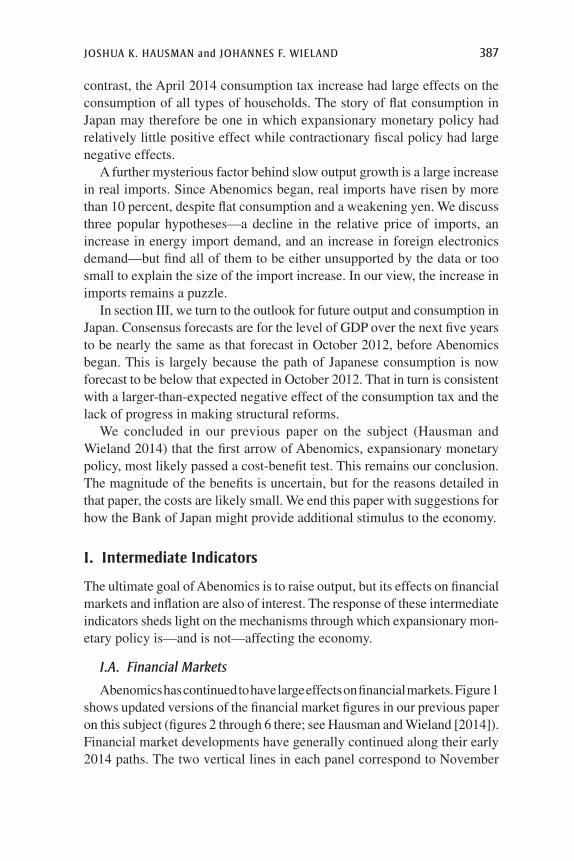
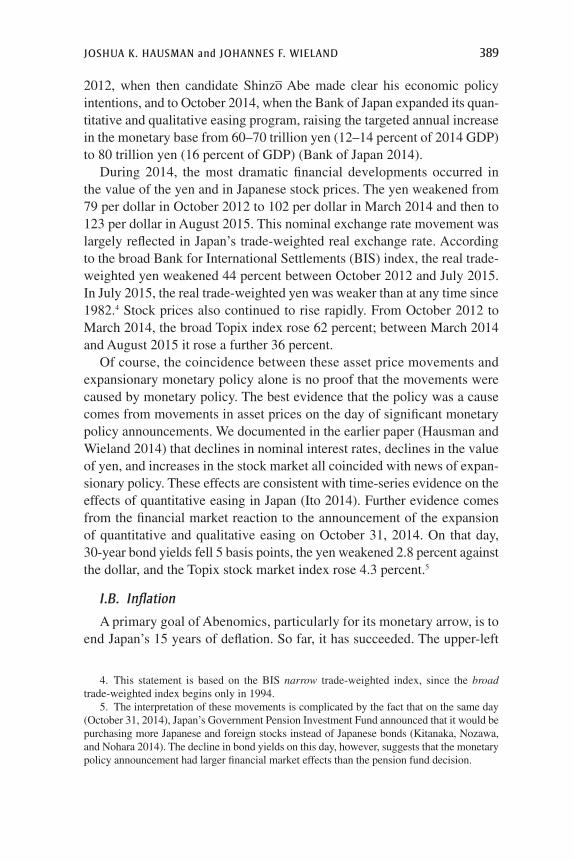
A primary goal of Abenomics, particularly for its monetary arrow, is to end Japan’s 15 years of deflation. So far, it has succeeded. The upper-left
4. This statement is based on the BIS narrow trade-weighted index, since the broad trade-weighted index begins only in 1994.
5. The interpretation of these movements is complicated by the fact that on the same day (October 31, 2014), Japan’s Government Pension Investment Fund announced that it would be purchasing more Japanese and foreign stocks instead of Japanese bonds (Kitanaka, Nozawa, and Nohara 2014). The decline in bond yields on this day, however, suggests that the monetary policy announcement had larger financial market effects than the pension fund decision.

390 Brookings Papers on Economic Activity, Fall 2015
panel of figure 2 shows three measures of prices in Japan. In each measure, the effect of the 3-percentage-point increase in the consumption tax in April 2014 is obvious. But even apart from that tax increase, prices have generally risen.
However, the Bank of Japan has not achieved its stated goal of 2 percent inflation. From July 2014 to July 2015, the overall CPI rose 0.2 percent, while the CPI excluding food and energy rose 0.6 percent. We saw in the upper-right panel of figure 1 that market inflation expectations generally remain below 2 percent, and the four other measures shown in the upper-right panel of figure 2 confirm that there was little increase in inflation expectations during 2014. Firm inflation expectations, as measured by the Bank of Japan’s Tankan survey,6 and 1- and 10-year inflation expectations from Consensus Economics forecasts all remain below 2 percent.7 Inter-estingly, there is no evidence that Japanese households expected deflation before or after Abenomics began; according to the Bank of Japan Opinion Survey, in the two years before Abenomics began (September 2010– September 2012), household inflation expectations averaged 3.7 percent. This fits with international evidence suggesting that households and small businesses are ill informed about inflation and monetary policy (Kumar and others 2015; Binder 2014).
THREE POSSIBLE MECHANISMS OF INCOMPLETE ADJUSTMENT Any or all of three possible mechanisms are likely driving the incomplete adjustment of expected inflation toward the 2 percent target: (i) backward-looking price setting, (ii) adaptive expectations (slow updating), and (iii) imperfect cred-ibility. To better understand which of these factors is quantitatively most important, we conduct the following exercise: First, we estimate a Phillips curve for Japan following Olivier Coibion and Yuriy Gorodnichenko (2015b) in order to gauge the amount of backward-looking price setting. We use inflation forecasts and output gap data8 to estimate a new Keynesian Phillips curve with a fraction b1 of backward-looking firms,
E E xt t t t t t t t1 .1 1 1 1 2( )( ) p - p = b p - p + b + e+ - +
6. The Tankan survey began to ask about inflation expectations only in March 2014.7. The hump in 1-year inflation expectations in 2013 and 2014 reflects the influence of
the April 2014 consumption tax increase.8. We use the International Monetary Fund’s data on the output gap from its April 2015
World Economic Outlook (IMF 2015a). This is not inconsistent with our argument in Haus-man and Wieland (2014) that this measure of the output gap underestimates the possible effect of monetary policy on output over the long run; for the Phillips curve, what is relevant is potential output in the short run.
JOSHUA K. HAUSMAN and JOHANNES F. WIELAND 391
Sources: Japanese Statistics Bureau, Consensus Economics, Bank of Japan, and Japanese Ministry of Health, Labour and Welfare. See online data appendix for more details.
a. In all panels, the Abenomics period begins in November 2012, indicated by the vertical line.b. Direct effects of the consumption tax are excluded from the CPI by assuming that the consumption tax
raised 12-month headline inflation by 1.9 percentage points and 12-month headline inflation excluding food and energy by 1.5 percentage points in April 2014, and by 2.1 percentage points and 1.7 percentage points, respectively, from May 2014 through March 2015. These are the figures suggested by the Bank of Japan. See http://www.stat.go.jp/english/data/cpi/report/2014np/pdf/fu8.pdf.
c. Inflation forecasts are 1-year-ahead CPI forecasts, unless otherwise noted.d. The GDP deflator is measured quarterly, and is indexed to 2007Q1 = 100.e. Real earnings are nominal earnings deflated by the CPI, excluding imputed rent, but including the consump-
tion tax.
Price index (SA, Feb 2007 = 100)d
Price indexesb
Expected CPI inflation, percent
Survey inflation forecastsc
Earnings per employee (SA, Jan 2007 = 100)
Nominal and real earningse
Hours per employee (SA, Jan 2007 = 100)
Hours per employee
95
100
Nominal
Real
96
98
100
0
2
4
6
8
Consensus Economics
ConsensusEconomics,10 years ahead
Bank of Japan Opinion Survey
TankanSurvey95
100
CPI
CPI excl. consumption tax
CPI excl. food and energy
CPI excl. food and energy, excl. consumption tax
GDP deflator
2009 2011 2013 2015 2009 2011Year Year
2013 2015
2009 2011 2013 2015 2009 2011Year Year
2013 2015
Figure 2. Japanese Actual and Expected Inflation, Wages, and Hours per Employee, 2007–15a

392 Brookings Papers on Economic Activity, Fall 2015
Note that backward-looking price setting b1 is distinct from adaptive expectations, the latter of which are contained in Etpt+1. By measuring inflation expectations directly, we capture the adaptiveness of forecasts. This allows us to take the expectations formation process as given and to then isolate the amount of backward-looking price setting necessary to explain the observed persistence of inflation.
We estimate this equation by ordinary least squares (OLS) and instru-mental variables on annual data from 1989 to 2015, where the instruments are a lag of the output gap xt-1 and lagged forecasts pt-1 - Et-1pt+1. We use the instrumental variable approach, standard in this literature (Coibion and Gorodnichenko 2015b), to avoid the bias that would result when contem-poraneous supply shocks move the output gap and expected inflation in opposite directions. The structure imposes a vertical long-run Phillips curve, a restriction not rejected by the data. Table 1 shows results; they suggest that backward-looking price setting is small, with b1 below 0.25.
Second, given equation 1, we solve for the expected path of inflation using output gap forecasts and a terminal condition that inflation reach a target µ (in this case 2 percent) in 2030.9 This corresponds to the (credible)
Table 1. Phillips Curve Estimatesa
Independent variables(1)
OLS(2) IV b
pt-1 - Etpt+1 0.22 0.11(0.15) (0.18)
Output gap xt 0.14*** 0.13(0.053) (0.091)
p valuec 0.38 0.59F statistic 9.32R2 0.18 0.12No. of observations 27 24
a. Each column is a regression estimation of equation 1; the dependent variable is inflation minus expected inflation. Column 1 is the ordinary least squares approach, and column 2 is the instrumental variables approach. Newey-West standard errors in parentheses. Statistical significance indicated at the ***1 percent, **5 percent, and *10 percent levels.
b. Instruments are a lag of the output gap xt-1, and lagged forecasts pt-1 - Et-1pt+1.c. Testing for a vertical Phillips curve, which is the t test on b3 in the equation pt - Etpt+1 = b1(pt-1 - Etpt+1)
+ b2xt + b3Etpt+1 + et.
9. We linearly extrapolate the World Economic Outlook’s 2020 output gap forecast to reach zero in 2030. Results are not sensitive to this assumption, since the projected output gap in 2020 is small. Results are also not sensitive to extending the time horizon at which the inflation target becomes credible.

JOSHUA K. HAUSMAN and JOHANNES F. WIELAND 393
expected rate of inflation in the very long run. We allow for expected infla-tion in the Phillips curve to be partially adaptive:
Et t t t2 1 ,1 1 1( )( ) π = λπ + − λ π+ − +
where l indexes adaptiveness, and pt+1 is the solution to equation 1. Rational expectations correspond to the case l = 0, and fully adaptive expectations correspond to l = 1.10 By iterating on equations 1 and 2 until convergence, we can determine what combinations of long-run actual inflation µ and what degree of adaptiveness l can rationalize both the market and professional long-run inflation forecasts. We use the OLS estimates to parameterize the Phillips curve (column 1 of table 1), but these results are very similar to the instrumental variable estimates.
In the left panel of figure 3, we show the implied 10-year inflation forecasts for combinations of long-run inflation µ and adaptiveness l. The inflation forecasts follow an inverse-S shape in l. This is because the
Percent
10-year inflation forecasta
Percent
Implied inflation in 2020b
1.4
1.6
1.8
1.4
1.8
1.6
0.2 0.4 0.6 0.8 0.2 0.4 0.6 0.8Adaptiveness in expectations λ Adaptiveness in expectations λ
µ = 2 percent
µ = 1.75 percent
µ = 1.5 percent
a. Plots implied 10-year inflation forecasts from solving the estimated Phillips curve from equation 1 and expectations formations from equation 2 for combinations of credible long-run inflation μ and adaptiveness λ. The horizontal dotted line is the 10-years-ahead inflation forecast of 1.45 percent from Consensus Economics.
b. Plots implied inflation rate in 2020 for combinations of μ and λ. See note a.
Figure 3. Phillips Curve Simulation Results
10. Sticky information corresponds to a generalization in which lt = (1 - q)t, and q is the fraction of agents updating information every year. The literature suggests that q is roughly between 0.68 and 0.94 (Mankiw and Reis 2002; Mankiw, Reis, and Wolfers 2004; Coibion and Gorodnichenko 2015a), which implies l ≈ 0 today given that the 2 percent target was announced in 2013. Thus, we view this case as being roughly captured by the l = 0 calibration.

394 Brookings Papers on Economic Activity, Fall 2015
importance of l for the forecast increases exponentially until it completely dominates the forecast. Intuitively, more adaptive expectations directly keep inflation low by increasing the weight on low past inflation. But since rational price setters correctly forecast this influence, they will also expect lower inflation, which further reduces price pressure today. Formally, infla-tion is a weighted average of initial inflation in 2015 and terminal inflation in 2030 (abstracting from the output gap), pt = gtp2015 + (1 - gt)µ, where gt is given by a recursion.11 The recursion implies that the weight on past infla-tion increases rapidly for intermediate values of l. For l = 0, the weight on past inflation in 2020 is g2020 = 0.0005, but it rises to g2020 = 0.279 for l = 0.3, and increases steeply to g2020 = 0.976 for l = 0.5. Consequently, we observe a sharp drop in inflation forecasts in the range l ∈ [0.3, 0.5]. As this parameter increases further, the weight on past inflation becomes so large that future inflation is almost irrelevant, and the paths converge for different levels of long-run inflation µ.
Our simulation suggests that rationalizing the long-run 1.45 percent inflation forecast from Consensus Economics requires either a large degree of adaptiveness in expectations (l ≈ 0.45 to 0.55) or that forecasters believe long-run inflation µ will be only 1.5 percent, or some combination of those two possibilities. These high values for l imply that, 5 years from now, the weight on the initial inflation target g2020 will range from 0.921 to 0.994. The higher inflation target is therefore almost irrelevant for price setting, even in 2020. Consequently, our simulations imply that inflation in 2020 will still be less than 1.6 percent if the entire deviation of current expected inflation from the 2 percent target is explained by adaptive expec-tations (see the right-hand panel of figure 3). This exercise suggests to us that a lack of credibility, that is, a belief that long-run inflation will fail to reach 2 percent, likely plays an important role, since full credibility implies such an extreme degree of sluggishness in inflation adjustment.
NOMINAL WAGE GROWTH Along with inflation expectations, we argued pre-viously (Hausman and Wieland 2014) that nominal wage growth would be a critical indicator of Abenomics’ success. This is because nominal wage growth is both a cause and an effect of inflation expectations, and also because real wages are likely to be an important determinant of consumption. Here the data continue to be disappointing. The lower-left panel of figure 2
11. Specifically, the weight on initial inflation is gt = P ti=2016 fi, where fi is determined by
the recursion f2029 = b1, and ff
ii
1
1 1 11
1 1
1
( )( )( )
=b + - b l
- - b - l- for i = 2017, . . . , 2028.

JOSHUA K. HAUSMAN and JOHANNES F. WIELAND 395
shows nominal earnings per person in the Japanese economy since 2007, and reveals no obvious increase in those earnings after Abenomics begins. Consequently, the recent increase in prices (upper-left panel of figure 2) has meant a steady decline in real earnings. From 2014Q2 to 2015Q2, real CPI-deflated12 earnings per employee fell 1.4 percent; earnings per hour fell 0.9 percent. Cumulatively, over the three years from 2012Q2 to 2015Q2, real earnings per employee fell 5.0 percent; per hour, they fell 3.7 percent.13
There are likely three principal reasons why Abenomics has yet to translate into higher nominal wages, let alone higher real wages. First, the decline in real wages reflects in part a compositional effect due to a ris-ing share of lower-paid part-time employment (Aoyagi and Ganelli 2015; Sommer 2009). But even among both full-time and part-time workers, real wages fell during Abenomics. Between 2012Q2 and 2015Q2, the real hourly earnings of full-time workers fell 3.5 percent, and those of part-time workers fell 0.8 percent. A shift in the composition of employment toward part-time work does not alone explain the decline in real wages.
A second reason Abenomics has failed to bring wage growth is the small change in inflation expectations, in particular expectations among firms regarding prices for their own products. In addition to asking firms about their CPI forecasts, the Tankan survey asks firms what they expect to happen to prices for their own output. In the June 2015 survey, firms expected to raise their own output price by an average of 0.9 percent over the next year. It is perhaps unsurprising, then, that firms are reluctant to pay higher nominal wages. An exception to this reluctance is large exporters, which have benefited from the weak yen, making it easier for them to grant wage increases. At Toyota, for instance, workers received a 3.2 per-cent increase in monthly pay during the spring 2015 Shunto– (annual spring wage negotiations).14 However, the aggregate data show that this example is not representative.
12. Following the convention of the Monthly Labour Survey from the Japanese Ministry of Health, Labour, and Welfare, we report real wages as nominal earnings deflated by the CPI excluding imputed rent.
13. These data are from the Monthly Labour Survey, Japan’s establishment employment survey. The figures from this survey include only “regular” employees; these are employees working more than one month or who were employed for the majority of the previous two months, including part-time employees. The sample covers private, nonagricultural industries. For more details, see http://www.mhlw.go.jp/english/database/db-slms/dl/slms-01.pdf and http://dsbb.imf.org/pages/sdds/DQAFBase.aspx?ctycode=JPN&catcode=WOE00.
14. On Toyota’s profits, see Kubota (2015b). The wage figure excludes bonuses (Nakamichi and Kubota 2015).

396 Brookings Papers on Economic Activity, Fall 2015
A third reason for Abenomics’ failure to lift wages is that the labor market may still be weak. For those age 15 to 64, the employment-to-population ratio steadily rose to nearly 73 percent in 201415 and, in absolute terms, Japanese unemployment is low: 3.3 percent in July 2015. Relative to the average unemployment rate in the 1980s of 2.5 percent, however, current unemployment in Japan is high. Moreover, the rise in participation and decline in unemployment have not been accompanied by an increase in monthly hours (see the lower-right panel of figure 2): Between 2012Q2 and 2015Q2, average monthly hours worked per full-time employee were unchanged, while average hours for all employees fell 1.4 percent.
The disappointing response of wages to Abenomics has led to political pressure and tax incentives for firms to increase wages. Both Prime Min-ister Abe and Governor Kuroda have pressured firms to raise wages.16 In addition to this moral suasion, in 2013 the Abe administration intro-duced a tax credit for firms indexed to their wage bill.17 Whatever the economic merit of such policies, however, they have not yet led to real wage growth.
II. Output
Macroeconomic theory suggests that the monetary arrow will contribute to higher output by lowering real interest rates and weakening the yen, thus raising consumption, investment, and net exports.18 We first discuss overall growth before turning to the behavior of consumption and net exports in more detail.
15. Most of this increase came from a rise in the female employment-to-population ratio from 61 percent in 2012 to 64 percent in 2014. For more on this trend, see Posen (2014).
16. See Nakamichi and Fujikawa (2015) and Aoyagi and Ganelli (2015). A historical analogy to the efforts of the Abe administration to persuade firms to raise wages may be found in the efforts of U.S. presidents Herbert Hoover and Franklin Roosevelt to persuade firms to raise wages during the Great Depression (Rose 2010; Cole and Ohanian 2004). These policies remain controversial, with the benefits of higher inflation and inflation expectations (Eggertsson 2012) needing to be weighed against the costs of labor market dis tortions (Cole and Ohanian 2004; Friedman and Schwartz 1963; Cohen-Setton, Hausman, and Wieland 2015).
17. See Aoyagi and Ganelli (2015) and the October 4, 2013, issue of KPMG’s Japan Tax Newsletter (https://www.kpmg.com/Jp/en/knowledge/article/japan-tax-newsletter/Documents/ stimulate-business-investment-20131004E.pdf).
18. For monetary policy to have real effects, there have to be slack resources in the economy. In Hausman and Wieland (2014), we argue that this is the case and that official estimates of the output gap underestimate the scope for demand-based policies.

JOSHUA K. HAUSMAN and JOHANNES F. WIELAND 397
II.A. Overall Growth
Unfortunately, the overall growth effects of Abenomics so far appear to be small. Table 2 reproduces table 1 in our earlier paper (Hausman and Wieland 2014) and adds two lines showing the performance of the Japanese economy in 2013 and 2014. The table shows that relative to Japan’s expe-rience during its two lost decades of the 1990s and 2000s, performance in 2013 was excellent while that in 2014 was mediocre. Real GDP grew 2.3 percent between 2012Q4 and 2013Q4 (upper panel), which translated to 3.7 percent growth per working-age person (lower panel). This growth was more rapid than that in Japan during the boom decades of the 1970s and 1980s. Unfortunately, growth turned negative in 2014. Real GDP in Japan in 2015Q2 was 2.2 percent above its 2012Q4 level. Real gross domestic income was 2.8 percent above its 2012Q4 level.
The upper panel of figure 4 provides a more fine-grained perspective; it shows quarterly GDP growth at an annual rate in Japan since 2007. One
Table 2. Macro Summary Statistics, Japan and the United States, 1974–2014a
PeriodReal GDP growth (percent change)
Unemployment rate
CPI inflation
Money market interest rate
1974–92 average 4.0 2.3 4.8 6.81993–2007 average 1.1 4.1 0.1 0.62008–12 average -0.2 4.6 -0.2 0.22013 2.3 4.0 1.4 0.12014 -0.8 3.6 0.4b 0.1
Real GDP growth per
person (ages 15–64)
Multifactor productivity
(percent change)
Employment-to-population ratio
(ages 15–64)
Period Japan U.S. Japan U.S. Japan U.S.
1974–92 average 3.1 1.5 — — 67.4 68.11993–2007 average 1.4 1.9 0.7 1.1 69.3 72.52008–12 average 0.5 0.1 0.3 0.7 70.8 67.82013 3.7 2.1 1.5 0.4 71.7 67.42014 0.8 2.0 — — 72.7 68.1
Sources: Japanese Cabinet Office, International Monetary Fund, Organization for Economic Cooperation and Development, Japanese Statistics Bureau, and Federal Reserve Bank of St. Louis, FRED database. See data appendix for more details.
a. This table is a reproduction of table 1 from Hausman and Wieland (2014) with updated data. All figures are percentages except where indicated otherwise. Growth rates are year-over-year except for 2013 and 2014, which are Q4-over-Q4 for GDP and inflation.
b. This excludes the direct effect of the April 2014 increase in the consumption tax from 5 to 8 percent. Including the consumption tax, CPI inflation was 2.5 percent. See http://www.stat.go.jp/english/data/cpi/report/2014np/pdf/fu8.pdf.

398 Brookings Papers on Economic Activity, Fall 2015
Sources: Japanese Cabinet Office; Organization for Economic Cooperation and Development. See online data appendix for more details.
a. Shows annualized quarter-over-quarter real GDP growth since 2007. Quarters since Abenomics began are marked in red.
b. Provides a comparison of annualized contributions to real GDP by component during Abenomics (2012Q4–2015Q2), the lost decade excluding the Great Recession (1994Q4–2007Q4), and the Great Recession (2007Q4–2012Q4), as well as annualized working-age adjusted GDP growth. Contributions are calculated as in Japan’s national accounts. See http://www.esri.cao.go.jp/en/sna/data/sokuhou/files/2011/qe114_2/pdf/kiyoe2.pdf
Real GDP growth (percent, annualized)
Average real growth rate (percentage points, annualized)
Quarterly growth since 2007a
Contributions to growth, by component, in three periodsb
−15
−10
−5
0
5
10
2007Q1 2009Q1 2011Q1 2013Q1 2015Q1Date
0
1
2
GDP Consumption Investment Governmentspending
Exports Imports GDP perworking-age
person
1995Q4−2007Q42008Q4−2012Q4Abenomics (2013Q4−2015Q2)
Figure 4. Japanese GDP Growth, 2007–15

JOSHUA K. HAUSMAN and JOHANNES F. WIELAND 399
sees a clear reversal of progress after the consumption tax was raised in April 2014 from 5 to 8 percent. This panel also highlights the high volatil-ity of measured Japanese GDP growth,19 which makes it difficult to draw strong conclusions from one or even two or three quarters of growth. We therefore provide in the lower panel of figure 4 an alternative way of assess-ing recent performance that aggregates across several quarters. It shows contributions to growth under Abenomics compared with contributions to growth during Japan’s lost decade (1995–2007) and the Great Recession (2008–12).
The differences between the left-most set and right-most set of bars in this lower panel (as well as in the results in table 2) indicate that any com-parison of current Japanese economic performance to performance in the past or in other countries ought to make an adjustment for Japan’s unusual demographics. Over the Abenomics period (2012Q4–2015Q2), the total Japanese population fell 0.5 percent and the working-age population (ages 15–64) fell 3.8 percent. Consequently, while overall GDP rose 2.2 per-cent between 2012Q4 and 2015Q2, GDP per capita rose 2.7 percent and GDP per working-age person rose 6.2 percent. By comparison, over this period, U.S. GDP per capita rose 3.9 percent and GDP per working-age person rose 4.5 percent. However, this comparison may exaggerate Japan’s performance, for two reasons. First, some of growth early in Abenomics was likely bounce-back from a late 2012 recession (Hausman and Wieland 2014). Second, the working-age population adjustment ignores rising labor force participation among those of working age (see table 2) as well as a growing population between ages 65 and 74,20 many of whom work (Kawata and Naganuma 2010). Still, the demographically adjusted figures show that Japan’s performance under Abenomics has been far from dismal.
What is disappointing is the poor performance of consumption and net exports, as well as the shortfall of growth relative to what was fore-cast before and after Abenomics began. In 2015Q2, consumption was 0.6 percent below its level in 2012Q4. And during Abenomics, most of the positive contribution to growth from exports has been canceled out by a negative contribution from imports. We turn next to an analysis of this puz-zling behavior of consumption and net exports.
19. Over the 20-year period from 1995 through 2015Q2, the standard deviation of quarterly (nonannualized) GDP growth in Japan was 1.1 percent, while that in the U.S. was 0.6 percent.
20. See National Institute of Population tables at http://www.ipss.go.jp/p-info/e/psj2012/PSJ2012-02.xls.

400 Brookings Papers on Economic Activity, Fall 2015
II.B. Evidence from the Cross-Section of Consumption Expenditures
We now examine cross-sectional household expenditure data to learn more about the behavior of Japanese consumption under Abenomics. Like the aggregate time series, the cross-sectional data suggest that expan-sionary monetary policy has had little effect on consumption. We use the Japanese Family Income and Expenditure Survey, a survey of approxi-mately 9,000 Japanese households. The Japanese Statistics Bureau pub-lishes a breakdown of survey household consumption by home ownership status, age bins, and income quintiles.21 We deflate these series by the CPI and seasonally adjust each series using an X-12 ARIMA(1,1) model with 12 monthly dummies.
The monetary policy arrow of Abenomics should have differential effects on these groups. First, higher expected (and actual) inflation constitutes a transfer from which mortgagors ought to benefit relative to renters and homeowners (Eggertsson and Krugman 2012; Cloyne, Ferreira, and Surico 2015). We also expect older households to be less willing to intertemporally substitute given finite horizons (Del Negro, Giannoni, and Patterson 2015), to be more likely to be creditors, and to be less likely to benefit from any labor market improvements under Abenomics. Thus, we would expect their responses to be muted relative to the responses of younger households. The breakdown by income is more ambiguous: higher-income households may have a greater ability to intertemporally substitute (McKay, Nakamura, and Steinsson 2015; Werning 2015), but poorer households may increase con-sumption more when income or credit supply grows.
Figure 5 plots real total consumption expenditures and domestic non-durable consumption expenditures along these dimensions relative to their 2011 log levels. We do not observe strong trends that would confirm the cross-sectional predictions raised in the previous paragraph. The trend of consumption by mortgagors looks quite similar to the trends among renters and owners; the consumption trend among the elderly is similar to that among the young; and the consumption trends of the rich and the poor likewise are similar. In part, this inference is a product of the noise in the consumption series. The repeated cross-sectional nature of the data does not allow us to filter any noise. A detailed study of the microdata might be better able to reveal differential effects of monetary policy, but with the data at hand we fail to see much evidence for large effects. This may
21. These data are only accessible from the Japanese version of the website at http://www.e-stat.go.jp/SG1/estat/eStatTopPortal.do. We are grateful to Hiroshi Matsushima for help with translation.

JOSHUA K. HAUSMAN and JOHANNES F. WIELAND 401
Source: Family Income and Expenditure Survey, Japanese Statistics Bureau.a. Plots real total consumption expenditure and domestic nondurable consumption expenditures relative to
their 2011 log levels. Before plotting, data are deflated by the CPI and seasonally adjusted using an X-12 ARIMA(1,1) model with 12 monthly dummies. The Abenomics period begins in November 2012, indicated by the vertical line.The full sample includes all households with at least two members; a “worker household” is one with at least two members whose head is employed as a wage earner in a public or private enterprise (excluding executives).
b. Owners include mortgagors.
Percent deviation
Consumption expenditures by ownership
Year
Percent deviation
Domestic nondurables by ownership
Percent deviation
Consumption expenditures by agePercent deviation
Domestic nondurables by age
2012 2013 2014 2015
Year
2012 2013 2014 2015
0
20
40
Percent deviation
Domestic nondurables by income
2012 2013
Year
2014 2015
0
20
40
0
20
40
–5
0
5
10
2012 2013
Year
2014 2015
2012 2013
Year
2014 2015
0
10
Percent deviation
Consumption expenditures by income
2012 2013
Year
2014 2015
–5
0
5
10
Low-income, all householdsHigh-income, all households
Head age ≤ 59,all households
Head age > 59, all households
Head age ≤ 54, worker households
Owners, all householdsb
Renters, workerhouseholds Renters, all
households
Mortgagers, worker households
Owners, worker householdsb
Low-income, worker households
High-income, worker households
Head age > 54, worker households
Figure 5. Household Consumption by Home Ownership, Age, and Income, 2011–15a

402 Brookings Papers on Economic Activity, Fall 2015
be particularly surprising, since the cleaning up of Japanese firms’ balance sheets over the last decade should have increased the traction of monetary policy (Kuttner and Posen 2001; Koo 2003; Wieland and Yang 2015).
In contrast to the absence of evidence for effects of monetary policy on consumption, the effects of the 3-percentage-point increase in the con-sumption tax in April 2014 are clear. In advance of the consumption tax, consumption boomed. It then plummeted. That the consumption tax had large intertemporal effects whereas monetary policy did not may be surpris-ing, but this response is in fact consistent with standard models. In online appendix B, we consider a problem of consumption choice over storable and nonstorable nondurable consumption goods as in the work by Robert Barsky, Christopher House, and Miles Kimball (2007).22 In this model, an anticipated consumption tax raises current consumption by lowering the real interest rate (the intertemporal price of consumption). Given the dis-crete nature of the consumption tax, the decrease in the real interest rate just before the tax hike is large relative to storage costs. This gives rise to a discrete increase in consumption expenditures. By contrast, if monetary policy causes only a smooth change in prices and the real interest rate, then it may not be optimal for consumers to discretely adjust their expenditures.
Likely adding to the effects of the April 2014 consumption tax increase was the fact that at that same time consumers were expecting the con-sumption tax to rise by a further 2 percentage points in October 2015.23 (In fact, after the poor performance of the Japanese economy in the second and third quarters of 2014, the Abe administration postponed the October 2015 consumption tax increase to April 2017.) This added to the incentive to buy storable goods in advance of the April 2014 tax increase.
II.C. The Puzzling Behavior of Net Exports
The performance of net exports under Abenomics has also been dis-appointing. Between 2012Q4 and 2015Q2, real exports grew 15 percent and real imports grew 12 percent.24 While one might have hoped for (even) stronger export growth, the larger mystery is why real import volumes have grown so rapidly despite a weaker yen and slow real output growth. Had
22. For another model of the effects of the consumption tax, see Cashin and Unayama (forthcoming).
23. We are grateful to Takashi Unayama for making this point to us.24. There is a break in the Japanese balance of payments data due to item reclassifica-
tions at the start of 2014, with some effect on the real export and import data (Bank of Japan 2013b). In online appendix A.1, we provide further details and argue that adjusting for reclassification does not change the broad story of rising real export and import volumes.

JOSHUA K. HAUSMAN and JOHANNES F. WIELAND 403
import volumes remained flat, Japanese real GDP would have grown by as much as 3.8 percent rather than 2.2 percent since the end of 2012. This upper bound assumes a complete substitution of imports with domestic goods, but even for intermediate rates of substitution growth would have been noticeably faster.
We do not have a fully convincing explanation for the recent rise in import volumes. But we can rule out three hypotheses. First, one might wonder if Japan’s import prices have in fact increased following the 56 per-cent depreciation of the yen against the dollar between October 2012 and August 2015. Perhaps the combination of falling commodity prices and pricing-to-market for other imports meant the yen depreciation was not associated with higher import prices. However, the data suggest otherwise. Measured by the import price deflator, between 2012Q4 and 2015Q2 import prices rose 7.0 percent. To be sure, this is far less than the yen depreciated, but it is nonetheless substantial.
Second, one might be tempted to ascribe the increase in import volumes to the substitution of fossil fuels for nuclear power in the aftermath of the 2011 Fukushima disaster. Fossil fuel imports did increase after Japan shut down its nuclear reactors, but this increase occurred before Abenomics began in late 2012. Between the first half of 2012 and the first half of 2015, the quantity of petroleum and liquid natural gas imports actually fell, while imports of coal rose by less than 4 percent. A further problem for this hypothesis is that it cannot explain why import volumes of services rose even more rapidly than those of goods during Abenomics; between 2012Q4 and 2015Q2, real imports of goods rose 9.7 percent while real services imports rose 22.9 percent.
Third, the International Monetary Fund (2014) suggests that the increase in real imports reflects growing Japanese demand for foreign electronics. Like the energy hypothesis above, this cannot explain the rise of service imports. But aside from this, the limited data available suggest it is an incomplete explanation. The yen value of Japanese imports of computers and phones (broadly defined25) rose by 1.2 trillion between the first half of 2012 and the first half of 2015. Had this rise not occurred, overall nominal Japanese imports would have risen 17.9 percent rather than 19.5 percent. Therefore, even with falling import prices for electronics and rising import prices for other goods and services, it is difficult to see how this story could account for very much of the increase in real Japanese import volumes.
25. We include computers and parts, semiconductors, audio and visual equipment, and telephony and telegraphy in this calculation.

404 Brookings Papers on Economic Activity, Fall 2015
III. Medium- to Long-Run Outlook
Japan’s lackluster economic performance over the past 2 years is a reminder of the difficulty of macroeconomic forecasting. Both professional and model-based forecasts have been, to varying degrees, too optimistic. Thus we are now more pessimistic than we were 18 months ago about the long-run output effects of Abenomics.
Figure 6 updates figure 11 from our previous paper (Hausman and Wieland 2014), showing long-run professional forecasts from Consensus Economics for the level of real Japanese output and consumption. In our previous paper, we compared the forecast made in October 2013 to that made in October 2012, with the increase in the level suggesting real gains from Abenomics. Unfortunately, as the solid line shows, actual output and consumption have been below the level forecast in October 2013. Perhaps more troubling, long-run forecasts have reverted to their pre-Abenomics level in the case of output, and are below their pre-Abenomics level in the case of consumption. Importantly, there has been little change to Japanese demographic forecasts since 2006, so the change in output and consumption forecasts shown in figure 6 cannot be directly explained by demographic surprises.26 This is worrisome both because the forecast may be correct and because it is an indicator of lackluster growth expectations.
When the Abenomics policies were first announced, there were at least two reasons to be more optimistic. First, given that the policies reduced real interest rates by roughly one percentage point, conventional new Keynes-ian models suggested output gains in the 5 to 10 percent range (Hausman and Wieland 2014). Second, a natural historical analogy for Abenomics is to the regime change engineered by Franklin Roosevelt in spring 1933 (Kuroda 2013; Romer 2014). In the four years after 1933, U.S. real GDP growth averaged 9.4 percent.
26. In 2006, the Japanese National Institute of Population and Social Security research forecast that the total Japanese population in 2015 would be 126.3 million and the working-age population (ages 15–64) would be 77.3 million. The latest projections (from 2012) are for these figures to be 126.6 million and 76.8 million (see note 20 for link to online tables). Of course, despite the accuracy of these demographic forecasts, it is possible that they were not fully incorporated into macro forecasts. The 2007 GDP forecast shown in the upper panel of figure 6 provides possible, but unclear, evidence for this. Using the 2006 population forecasts, it implies annualized per capita GDP growth from 2007 to 2015 of 1.9 percent and per working-age person growth of 2.8 percent. Using actual data on the size of the Japanese labor force, the 2007 GDP forecast implies annual growth of 2.0 percent per member of the labor force. These are optimistic forecasts but not obviously extreme. For example, U.S. GDP per capita grew on average at 2.0 percent per year between 1870 and 2014 (Jones 2015).

JOSHUA K. HAUSMAN and JOHANNES F. WIELAND 405
Sources: Japanese Cabinet Office and Consensus Economics. a. These figures are an update of figure 11 in Hausman and Wieland (2014). The Abenomics period begins in
2012, indicated by the vertical line.
GDP
Consumption
95
100
105
110
115
100
105
110
115
2010 2015Year
2020
2010 2015Year
2020
Data (2007 = 100)
Forecast Oct 2012
Forecast Oct 2013
Forecast Apr 2015
Forecast Oct 2007
Data (2007 = 100)
Forecast Oct 2012
Forecast Oct 2013
Forecast Apr 2015
Forecast Oct 2007
Figure 6. Actual and Forecast Output and Consumption, 2005–25a
406 Brookings Papers on Economic Activity, Fall 2015
There are three reasons why these model- and history-based predic-tions may thus far have been wrong. First, slow growth might be due primarily to the consumption tax increase. Unfortunately, quantifying the negative effects of the consumption tax on output is difficult since esti-mates of the tax multiplier in Japan vary widely (Kuttner and Posen 2001; Keen and others 2011). However, the observed large negative effects of the consumption tax in 2014 provide evidence supporting the high multipliers reported by Kenneth Kuttner and Adam Posen (2001). If the tax multiplier is large, fiscal consolidation will continue to depress Japanese output in the medium run.27
Second, Abenomics might be affecting the economy only with a long lag. Estimates for conventional monetary policy suggest that the peak effect on output is reached after 18 to 24 months (Christiano, Eichenbaum, and Evans 1999; Romer and Romer 2004). Regardless of whether one views Abenomics as having started with Abe’s political campaign in November 2012 or with the announcement of qualitative and quantitative easing in April 2013, an 18- to 24-month lag suggests the peak effects ought to have already occurred. For Abenomics, however, the net export response may be unusually slow. For example, in July 2015—more than two years after the yen significantly weakened—Honda and Nissan announced that they would make a substantial shift toward producing cars in Japan for export.28 This suggests that credibility of continued expansionary policy may be an important determinant of the net export response under unconventional monetary policy.
A third and final possibility is that the new Keynesian model and the 1933 analogy might be poor guides to the current Japanese macro-economy. Recent events in Japan align with a growing literature suggest-ing that the new Keynesian model may exaggerate the output effects of forward guidance (Del Negro, Giannoni, and Patterson 2015; McKay, Nakamura, and Steinsson 2015). In our previous paper (Hausman and Wieland 2014), we documented that the change in the real interest rate in Japan since 2012 has been much smaller than that which occurred in the United States after 1933. Furthermore, lower real interest rates in the United States occurred along with other policy changes, such as financial reform,
27. In its April 2015 World Economic Outlook, the International Monetary Fund (2015a) predicts that Japan’s structural budget deficit as a percent of potential GDP will decline by slightly more than one percentage point in both 2015 and 2016 and by roughly half a percent-age point in 2017 and 2018.
28. See Kubota (2015a).

JOSHUA K. HAUSMAN and JOHANNES F. WIELAND 407
public works programs, and new regulations for businesses.29 Moreover, the regime change in 1933 occurred after a precipitous fall in output and prices.
These three possible factors suggest that Abenomics, as is, is unlikely to substantially raise long-run output in Japan. However, the “as is” qualifier is important, since neither the monetary arrow nor the structural arrow appears to (yet) be fully credible policies.
IV. Credibility and Alternative Policies
We documented in sections I.A and I.B that most indicators of inflation expectations in Japan remain well below 2 percent, and we argued that this likely reflected imperfect credibility. One possible explanation for this lack of credibility, discussed in our previous paper (Hausman and Wieland 2014), is that observers doubt that there is political will to continue large-scale quantitative easing. Another possibility is that observers doubt the effectiveness of quantitative easing.
Insofar as there are doubts about the political will to achieve 2 percent inflation, it was unfortunate that the Bank of Japan’s expansion of quantita-tive easing in October 2014 passed with only a 5-4 vote. By contrast, the decisive victory of Abe’s Liberal Democratic Party in the December 2014 parliamentary elections may have increased confidence that monetary eas-ing will continue. And in spring 2015, two members of the Bank of Japan’s policy board (Ryuzo Miyao and Yoshihisa Morimoto) stepped down and were replaced by Yutaka Harada and Yukitoshi Funo in a transition that likely increased support for further easing.30 The appointment of these new members did not lead to large changes in inflation expectations, however, suggesting that there are other sources of the credibility problem.
Given that quantitative easing has not (yet) produced actual or expected 2 percent inflation, the Bank of Japan could consider following the examples of Denmark, Switzerland, and the eurozone in paying negative nominal interest rates on reserves. Willem Buiter (2009) and Miles Kimball (2013) provide a discussion of the potential benefits of this policy. In the United
29. For more on policies and outcomes in the United States after 1933, see Romer (1992), Temin and Wigmore (1990), and Fishback (2008), among many others.
30. See Nakamichi and Ito (2015) and Ito and Nakamichi (2015). Harada is an economist who wrote a book entitled Reflationalist Economics That Saved Japan [in Japanese] (Harada 2014). Funo is a former Toyota executive; since his appointment, he has spoken publicly in favor of the 2 percent inflation target (Fujioka and Hidaka 2015). Harada replaced Ryuzo Miyao, who voted in favor of the October 2014 expansion of quantitative easing, while Funo replaced Yoshihisa Morimoto, who voted against this further easing (Bank of Japan 2014).

408 Brookings Papers on Economic Activity, Fall 2015
States, there is a concern that negative nominal interest rates could cause a run on systemically important money market funds by forcing them to “break the buck.” In Japan, however, the importance of money market funds is negligible, less even than in Europe. As of 2014, money market shares amounted to $2.5 trillion in the United States, €427 billion ($467 billion) in the eurozone, and ¥14 trillion ($113 billion) in Japan. As a share of broad money this amounts to 18.3 percent in the United States, 4.1 percent in the eurozone, and 1.1 percent in Japan. This suggests that paying a negative interest rate on reserves might be a practical policy in Japan.
Negative nominal rates are only one of many alternative policies avail-able to the Bank of Japan. For instance, as discussed by Lars Svensson (2003), the central bank could deliberately weaken the yen and peg the yen at a weak value. While net exports have not responded strongly to the recent yen depreciation, it is plausible that a peg could increase these effects by persuading firms of the weak yen’s permanence. Such a peg might also improve the credibility of the 2 percent inflation target. A practical dif-ficulty is that exchange rate policy falls within the scope of the Ministry of Finance rather than the Bank of Japan, so more explicit cooperation between them would be required.
We are hesitant to comment on more nonstandard proposals, such as money-financed government expenditures or money-financed fiscal trans-fers. Our analysis above suggests uncertainty about what macroeconomic model applies to Japan. This in turn implies uncertainty about how alter-native policies would affect inflation and output.
V. Conclusion
In this paper we reviewed recent developments in Japan. Our analysis of Abenomics, and its monetary policy in particular, suggests that its real effects have so far been small despite intermediate indicators, such as the real interest rate and the real exchange rate, moving in an expansionary direction.
We focused less on the third arrow, structural reforms, in part because many reforms remain unimplemented and in part because professional forecasts suggest few further reforms will occur. Since late 2013, growth forecasts have declined (see figure 6) while inflation expectations have slightly risen (see the upper-right panel of figure 2). This is the opposite of the pattern one would expect if structural reforms were viewed as becoming more likely. In many standard macroeconomic models, structural reforms would raise growth expectations while lowering inflation expectations.

JOSHUA K. HAUSMAN and JOHANNES F. WIELAND 409
Thus, one could interpret stable inflation expectations and declining growth expectations as evidence of a declining probability that there will be further structural reforms.
That is the bad news. Good news may come in the form of the Trans-Pacific Partnership. This trade agreement would mean the liberalization of Japan’s highly protected agricultural sector with a resulting large decline in food prices (Posen 2014). Furthermore, there is no lack of positive struc-tural reforms available to Japan. For instance, the International Monetary Fund (2015b) estimates that reforms to increase the labor force participation of women and older persons could raise potential GDP growth by 0.25 per-centage point per year. And Jamal Haidar and Takeo Hoshi (2015) provide many examples of high-return, low-cost reforms to regulations on new and existing businesses. While such reforms would undoubtedly be politically difficult, without making them Abenomics might have little impact on long-run growth.
ACKNOWLEDGMENTS We are grateful for insightful suggestions from the editors, David Romer and Justin Wolfers, and from our discussant, Adam Posen. We also thank Andrea De Michelis, Sohei Kaihatsu, Mitsuru Katagiri, Takushi Kurozumi, John Leahy, Kohei Shintani, Sayuri Shirai, Takashi Unayama, Kenichirou Watanabe, and seminar participants at the Bank of Japan and the Ministry of Finance for helpful comments. This work also benefited from the comments of our discussants, Michael Hutchison and Takatoshi Ito, on our prior paper (Hausman and Wieland 2014) at the 2014 Stanford Summer Juku. Hiroshi Matsushima provided superb research assistance.
410 Brookings Papers on Economic Activity, Fall 2015
References
Aoyagi, Chie, and Giovanni Ganelli. 2015. “Labor Market Reform: Vital to the Success of Abenomics.” In Can Abenomics Succeed? Overcoming the Legacy of Japan’s Lost Decades, edited by Dennis P. J. Botman, Stephan Danninger, and Jerald Alan Schiff. Washington: International Monetary Fund.
Bank of Japan. 2013a. “Introduction of the ‘Quantitative and Qualitative Monetary Easing.’” Announcement by the Policy Board of the Bank of Japan. https://www.boj.or.jp/en/announcements/release_2013/k130404a.pdf
———. 2013b. “Revision of Balance of Payments–Related Statistics in Japan.” BOJ Reports & Research Papers. https://www.boj.or.jp/en/research/brp/ron_ 2013/data/ron131008a.pdf
———. 2014. “Expansion of the Quantitative and Qualitative Monetary Easing.” Announcement by the Policy Board of the Bank of Japan. http://www.boj.or.jp/en/announcements/release_2014/k141031a.pdf
Barsky, Robert B., Christopher L. House, and Miles S. Kimball. 2007. “Sticky-Price Models and Durable Goods.” American Economic Review 97, no. 3: 984–98.
Binder, Carola. 2014. “Fed Speak on Main Street.” Working Paper. https://sites.google.com/site/carolabindereconomics/research
Buiter, Willem H. 2009. “Negative Nominal Interest Rates: Three Ways to Overcome the Zero Lower Bound.” North American Journal of Economics and Finance 20, no. 3: 213–38.
Cashin, David, and Takashi Unayama. Forthcoming. “Measuring Intertemporal Substitution in Consumption: Evidence from a VAT Increase in Japan.” Review of Economics and Statistics.
Christiano, Lawrence J., Martin Eichenbaum, and Charles L. Evans. 1999. “Monetary Policy Shocks: What Have We Learned and to What End?” In Hand-book of Macroeconomics 1A, edited by John B. Taylor and Michael Woodford. Amsterdam: North-Holland.
Cloyne, James, Clodomiro Ferreira, and Paolo Surico. 2015. “Monetary Policy When Households Have Debt: New Evidence on the Transmission Mechanism.” Paper prepared for the Summer Institute 2015 Monetary Economics Workshop. Cambridge, Mass.: National Bureau of Economic Research.
Cohen-Setton, Jérémie, Joshua K. Hausman, and Johannes F. Wieland. 2015. “Supply-Side Policies in the Depression: Evidence from France.” Working Paper no. W2015-08. Berkeley: University of California, Berkeley Economic History Laboratory.
Coibion, Olivier, and Yuriy Gorodnichenko. 2015a. “Information Rigidity and the Expectations Formation Process: A Simple Framework and New Facts.” American Economic Review 105, no. 8: 2644–78.
———. 2015b. “Is the Phillips Curve Alive and Well After All? Inflation Expec-tations and the Missing Disinflation.” American Economic Journal: Macro-economics 7, no. 1: 197–232.

JOSHUA K. HAUSMAN and JOHANNES F. WIELAND 411
Cole, Harold L., and Lee E. Ohanian. 2004. “New Deal Policies and the Persistence of the Great Depression: A General Equilibrium Analysis.” Journal of Political Economy 112, no. 4: 779–816.
Del Negro, Marco, Marc Giannoni, and Christina Patterson. 2015. “The Forward Guidance Puzzle.” Staff Report no. 574. Federal Reserve Bank of New York.
Eggertsson, Gauti B. 2012. “Was the New Deal Contractionary?” American Eco-nomic Review 102, no. 1: 524–55.
Eggertsson, Gauti B., and Paul Krugman. 2012. “Debt, Deleveraging, and the Liquidity Trap: A Fisher-Minsky-Koo Approach.” Quarterly Journal of Eco-nomics 127, no. 3: 1469–513.
Fishback, Price V. 2008. “New Deal.” In The New Palgrave Dictionary of Econom-ics, 2nd edition, edited by Steven N. Durlauf and Lawrence E. Blume. London: Palgrave Macmillan.
Friedman, Milton, and Anna Jacobson Schwartz. 1963. A Monetary History of the United States, 1867–1960. Princeton University Press.
Fujioka, Toru, and Masahiro Hidaka. 2015. “BOJ Must Achieve 2% Price Target, New Board Member Funo Says.” Bloomberg Business, July 1.
Haidar, Jamal Ibrahim, and Takeo Hoshi. 2015. “Implementing Structural Reforms in Abenomics: How to Reduce the Cost of Doing Business in Japan.” Working Paper no. 21507. Cambridge, Mass.: National Bureau of Economic Research.
Harada, Yutaka. 2014. Reflationalist Economics That Saved Japan [in Japanese]. Tokyo: Nikkei.
Hausman, Joshua K., and Johannes F. Wieland. 2014. “Abenomics: Preliminary Analysis and Outlook.” Brookings Papers on Economic Activity, Spring: 1–63.
IMF (International Monetary Fund). 2014. “2014 Article IV Consultation—Staff Report; and Press Release.” Country Report no. 14/236. Washington.
———. 2015a. World Economic Outlook: Uneven Growth—Short- and Long-Term Factors, April. Washington.
———. 2015b. “2015 Article IV Consultation—Press Release; Staff Report; and Statement by the Executive Director for Japan.” Country Report no. 15/197. Washington.
Ito, Takatoshi. 2014. “We Are All QE-sians Now.” Discussion Paper no. 2014-E-5. Bank of Japan, Institute for Monetary and Economic Studies.
Ito, Tatsuo, and Takashi Nakamichi. 2015. “Ex-Toyota Executive Tapped as New Bank of Japan Board Member.” Wall Street Journal, April 21.
Jones, Charles I. 2015. “The Facts of Economic Growth.” Working Paper no. 21142. Cambridge, Mass.: National Bureau of Economic Research.
Kawata, Hiroshi, and Saori Naganuma. 2010. “Labor Force Participation Rate in Japan.” Review no. 2010-E-7. Bank of Japan.
Keen, Michael, Mahmood Pradhan, Kenneth Kang, and Ruud de Mooij. 2011. “Raising the Consumption Tax in Japan: Why, When, How?” Staff Discussion Note no. 11/13. Washington: International Monetary Fund.

412 Brookings Papers on Economic Activity, Fall 2015
Kimball, Miles. 2013. “Breaking Through the Zero Lower Bound.” Paper prepared for Cognitive Economics Lecture Series. Coventry: University of Warwick. http://www2.warwick.ac.uk/fac/soc/economics/events/seminars-workshops-conferences/conferences/cognitiveeconomics/breaking_through_the_zero_lower_ bound.pdf (updated 2015 version with Ruchir Agarwal available as IMF Working Paper no. 15/224)
Kitanaka, Anna, Shigeki Nozawa, and Yoshiaki Nohara. 2014. “Japan’s Pension Fund Cutting Local Bonds to Buy Equities.” Bloomberg Business, October 31.
Koo, Richard C. 2003. Balance Sheet Recession: Japan’s Struggle with Uncharted Economics and Its Global Implications. Hoboken, N.J.: Wiley.
Krugman, Paul. 2013. “PPP and Japanese Inflation Expectations (Extremely Wonkish).” The Conscience of a Liberal (blog post). New York Times, October 27.
Kubota, Yoko. 2015a. “Nissan, Honda to Ship More Cars from Home.” Wall Street Journal, July 10.
———. 2015b. “Toyota Posts Record Profit, Fueled by Weak Yen.” Wall Street Journal, August 4.
Kumar, Saten, Hassan Afrouzi, Olivier Coibion, and Yuriy Gorodnichenko. 2015. “Inflation Targeting Does Not Anchor Inflation Expectations: Evidence from Firms in New Zealand.” In present volume of Brookings Papers on Economic Activity.
Kuroda, Haruhiko. 2013. “Overcoming Deflation and After.” Speech at the Meet-ing of Councilors of Nippon Keidanren (Japan Business Federation), Tokyo, December 25.
Kuttner, Kenneth N., and Adam S. Posen. 2001. “The Great Recession: Lessons for Macroeconomic Policy from Japan.” Brookings Papers on Economic Activity, no. 2: 93–185.
Mankiw, N. Gregory, and Ricardo Reis. 2002. “Sticky Information versus Sticky Prices: A Proposal to Replace the New Keynesian Phillips Curve.” Quarterly Journal of Economics 117, no. 4: 1295–328.
Mankiw, N. Gregory, Ricardo Reis, and Justin Wolfers. 2004. “Disagreement about Inflation Expectations.” NBER Macroeconomics Annual 18: 209–48.
McKay, Alisdair, Emi Nakamura, and Jón Steinsson. 2015. “The Power of Forward Guidance Revisited.” Working Paper no. 20882. Cambridge, Mass.: National Bureau of Economic Research.
Nakamichi, Takashi, and Tatsuo Ito. 2015. “Abe Aims to Tip Balance on BOJ Board.” Wall Street Journal, February 25.
Nakamichi, Takashi, and Megumi Fujikawa. 2015. “Japan Government Presses Companies to Raise Wages.” Wall Street Journal, January 21.
Nakamichi, Takashi, and Yoko Kubota. 2015. “Japanese Companies Grant Biggest Pay Raises in Years.” Wall Street Journal, March 18.
Patrick, Hugh. 2014. “Japan’s Abenomics: So Far So Good, But Will It Prevail?” Occasional Paper no. 67. New York: Columbia Business School, Center on Japanese Economy and Business.

JOSHUA K. HAUSMAN and JOHANNES F. WIELAND 413
Posen, Adam S. 2014. “An American’s Assessment of Abenomics at Mid-Term.” In Lessons from Decades Lost: Economic Challenges and Opportunities Facing Japan and the United States. Briefing no. 14-4. Washington: Peterson Institute for International Economics.
Romer, Christina D. 1992. “What Ended the Great Depression?” Journal of Eco-nomic History 52, no. 4: 757–84.
———. 2014. “It Takes a Regime Shift: Recent Developments in Japanese Mon-etary Policy through the Lens of the Great Depression.” NBER Macroeconomics Annual 28: 383–400.
Romer, Christina D., and David H. Romer. 2004. “A New Measure of Monetary Shocks: Derivation and Implications.” American Economic Review 94, no. 4: 1055–84.
Rose, Jonathan D. 2010. “Hoover’s Truce: Wage Rigidity in the Onset of the Great Depression.” Journal of Economic History 70, no. 4: 843–70.
Sommer, Martin. 2009. “Why Are Japanese Wages So Sluggish?” Working Paper no. 09/97. Washington: International Monetary Fund.
Svensson, Lars E. O. 2003. “Escaping from a Liquidity Trap and Deflation: The Foolproof Way and Others.” Journal of Economic Perspectives 17, no. 4: 145–66.
Temin, Peter, and Barrie A. Wigmore. 1990. “The End of One Big Deflation.” Explorations in Economic History 27, no. 4: 483–502.
Werning, Iván. 2015. “Incomplete Markets and Aggregate Demand.” Working Paper no. 21448. Cambridge, Mass.: National Bureau of Economic Research.
Wieland, Johannes F., and Mu-Jeung Yang. 2015. “Financial Dampening.” Working Paper (version 2.1). http://faculty.washington.edu/mjyang/research/findamp.pdf

414
Comments and Discussion
COMMENT BYADAM POSEN This paper by Joshua Hausman and Johannes Wieland is in a sense a direct reply to the paper Kenneth Kuttner and I wrote for Brookings Papers in 2001 (Kuttner and Posen 2001). It asks how we should understand the underperformance of Japan in recent years as opposed to during the so-called Lost Decade of roughly 1990 to 2002. Our assessment 14 years ago was that Japan’s Lost Decade was largely understandable from standard textbook, if not undergraduate, macroeconomics. Excessive fiscal tightening, insufficient monetary stimulus, and a repeated failure to recapi-talize the banking system in a timely manner all straightforwardly contrib-uted to the lengthening of the initial post-bubble recession. The interesting question raised by Hausman and Wieland in this paper, and increasingly by others around the world, is this: Has recent underperformance in Japan become a bigger puzzle? In other words, since Abenomics has basically done many of the things that we were all calling for—including aggressive monetary stimulus with a forward-looking positive inflation target—why has it not worked better?
Hausman and Wieland give us a partial answer, and in particular their work on the consumption patterns of the Japanese populace in response both to monetary stimulus and to fiscal contraction is indeed new and pro-vocative. Nonetheless, I feel that their paper misses two critical aspects. First, what was going on globally at the time? Is this mystery something idiosyncratic and specific to Japan, or a more general mystery all around the world? Second, is the mystery in some sense worse than they make it out to be, because they do not take into account the nature of the structural reforms that Abenomics has already put in place?
In essence, the standard trope about lost decades (plural), rather than one lost decade, remains exaggerated for Japan. As Hausman and Wieland,

COMMENTS and DISCUSSION 415
among others, have pointed out, per capita GDP growth in Japan since 2002 has actually been quite good, especially in comparison to the rest of the G7 nations, even leaving aside the global financial crisis. Yet the questions about fiscal sustainability and sticky deflationary expectations are troubling. Because they fit into the broader international problem, argu-ably faced in the United States and western Europe as well, I would argue that the questions raised by Abenomics in Japan today are indeed even more troubling than the impression left by Hausman and Wieland would indicate. First, their discussion of monetary credibility misses the point of just how much the expectation-based arguments have failed in Japan, even when everything was in place for them to succeed. Second, given that these macroeconomic failures have happened simultaneously worldwide, the question remains as to what can be done to raise inflation and reduce public debt, whether in Japan or in other countries essentially sharing the same problem.
ASSESSMENT OF ABENOMICS TO DATE The basic fact that has to be rec-onciled is Japan’s persistently low inflation and weak consumption since Prime Minister Shinzo– Abe took office in January 2013 and launched a comprehensive reflation program with the cooperation of the Bank of Japan. Is this, as it seems, a failure of aggressive stimulus and coordinated macroeconomic policy—as I and many others have been advocating for Japan? Hausman and Wieland advance the discussion by focusing in on a very specific seeming contradiction: Two and a half years of openly declared forward-looking monetary stimulus have raised inflation above zero, but they have not led to any sustained upward movement of inflation beyond that. Meanwhile, the consumption tax hike of 2014 had a devastat-ing and surprisingly persistent impact on household consumption. How weird is this?
If we go beyond academic theorizing about monetary stimulus through forward guidance, which I criticized at the time (Posen 2012), it is actu-ally less surprising. Numerous market participants and policy observers expected that the pass-through to inflation would be limited from yen depreciation, even though announcements from Abe were seen as moving the yen before the Bank of Japan did anything. This reflected both Japa-nese history and the more recent experience of diminished exchange rate pass-through for the major economies at the upper end of the international division of labor. The United Kingdom’s lack of sustained inflation pass-through following a 25 percent depreciation in 2008 is the most telling example—one that has now been followed by Japan, which saw an even bigger depreciation, from ¥79 to ¥120 to the dollar, without appreciable

416 Brookings Papers on Economic Activity, Fall 2015
pass-through to ongoing inflation. In a world where Japan has integrated supply chains throughout Asia and elsewhere, and given years of monetary restraint, it should not have surprised anyone that the pass-through would be limited. The recurring invocation of the “foolproof way” to inflation in Japan through depreciation (Svensson 2003) can be set aside as failed, as it would be difficult to imagine a more credible, large, and sustained depre-ciation than what has occurred.
Similarly, any surprise that a consumption tax hike would have a large short-term negative impact on consumption should not have been so great. Hausman and Wieland speak in their paper as though there was great uncertainty and debate about the size of multipliers for fiscal policy in Japan. Again, as with exchange rate pass-through, they paid too much attention to their academic colleagues and too little attention to actual observers and analysts from the official sector and the applied policy world. There was a relatively strong consensus on the size of the multipli-ers in Japan as seen through the 1990s, which held up to subsequent events and examination (Kuttner and Posen 2002; Romer 2012). These were very sizable, on the order of 1.5-plus, and likely to remain so given a relatively closed economy.
Nonetheless, the exercise that Hausman and Wieland perform, look-ing at the microdata in a cross-section of Japanese consumers, is a sig-nificant contribution. The fact that neither debtor/creditor status nor age category makes any statistically significant difference in consumers’ minor reaction to the monetary stimulus or major reaction to fiscal tightening under Abenomics is a real surprise and worth knowing. That said, given the long-standing evidence on short-term views of Japanese fiscal policy by households and the stickiness of inflation expectations by all but for-eign investors (Posen 1998; Kuttner and Posen 2001), this is not entirely shocking. It is rather the lack of variation across Japanese cohorts that is the mystery. It also is of interest to those of us watching the policy impact to see how persistent the shock from the value added tax turned out to be, lasting nearly four quarters in its visible effects. This is something that Hausman and Wieland could not address with their cross-sectional data set.
The problem with making too much out of these puzzles is that many of these aspects or tensions in the standard models are being replicated in the advanced economies around the world. This is in direct contrast to the mid- and late-1990s, when Japan was clearly on a different path and the differ-ence could be attributed to idiosyncratic factors, primarily policy mistakes. Unlike the 1990s, many of the observed phenomena in Japan today—low wage growth, low exchange rate pass-through, no stable short-run Phillips

COMMENTS and DISCUSSION 417
curve, low long-term interest rates despite fiscal weakening, low response of imports to depreciation, among others—are simultaneously global pat-terns. Few instances elsewhere are as extreme as we are seeing in Japan, however, and few have been subjected to such radical shifts in monetary regime exchange rate valuation or fiscal projections, and therefore are less clean tests. Nonetheless, all these sticky nominal variables are now being seen in the United States, in most of western Europe, and arguably even in China and South Korea. Thus, there is a more interesting and deeper puzzle here than the Japan-specific issues that Hausman and Wieland raise (one I make no pretension to answering, but hope this exchange will stimulate others to take on).
There is an issue that Hausman and Wieland should have addressed more deeply, however. This regards the significant changes in the Japanese labor market that have taken place since Abenomics began. The authors sensibly acknowledge the increase in part-time workers as a share of the total workforce, and the share of flexible hours rather than traditional full-time Japanese employment patterns. They have not done quite enough to grapple either with the scale of rapid change in Japanese labor markets or with what we have learned in recent years about the political economy of labor market reform. There is clear evidence from the experience of the European Union over the last 20 years, most notably the Hartz IV reform in Germany in 2003, that labor supply reforms are deflationary in the short run. In fact, it often seems that labor supply reforms only bear fruit when-ever the next strong recovery takes place, and not before.
In this regard, the paper also needs more discussion of Japan’s demo-graphics. While the country is aging—a fact directly picked up in their cross-sectional data set of consumption—there could be other dynamics at work as a result of demographics, including later-in-life rises in risk aversion among workers and more off-the-tax-books informal employ-ment than is currently measured. But in the end, the authors’ discussion of labor dynamics, and more broadly of Japanese performance, misses the fact that productivity performance has not been terrible. If one thinks about per capita growth as reported in the paper and realizes that all of it has to have come from productivity growth, given that there has been little capital deepening in Japan in the last decade, it has not been a bad performance.
In this regard, readers of the paper should be reminded that the record of Abenomics’s so-called third arrow, the implementation that brought struc-tural reforms, is far better than implied by this paper (though to be fair, the authors are not trying to do an overall assessment of these issues). For the

418 Brookings Papers on Economic Activity, Fall 2015
record, there have been two and a half major structural reforms undertaken by the Abe government to date:
—“Womenomics,” as the policy of incentives to bring more women into the workforce has been dubbed, has raised female labor force par-ticipation by over 2 percent in two and a half years. This means that more than 750,000 women have rejoined a workforce of 63.5 million. Many of these women have joined the workforce on a part-time or flexible basis, but we know from the Nordic experience that this is part of the way one retains women in the workforce, so it should not be discounted. This clearly has had a disinflationary if not deflationary effect on wages, not just by increasing supply but also by bringing in people who—both on seniority grounds and sexist grounds—are paid less than comparable male workers. Nonetheless, it is a major structural reform with huge long-term implications.
—Corporate governance in Japan has been improving, though of course it has not been markedly transformed. In particular, the transparency of corporate accounting and accountability for those accounts in Japan has clearly risen. The scandals at Olympus and Toshiba1 show how, at least for publicly listed companies in Japan, previously accepted behaviors are no longer acceptable. The larger inflows of foreign investment into Japanese equity baskets and directly into companies are both cause for and effect of these reforms. There is actually a positive cycle in this area: Some of the rise in equity values in Japan is arguably attributable to improved corpo-rate governance and transparency, not just to yen depreciation, unlocking values that have been hidden. Undoubtedly, the overall rise of profitability in Japanese multinational companies is largely due to export demand and to the country’s recovery from deflation, but the structural reforms have mattered. We are indeed seeing an increase in two-way flows of foreign direct investment inward and outward from Japan, which is consistent with the story.
—Agriculture is also undergoing significant reform, though so far it is only partial. This reform is likely to accelerate and to then be made per-manent with the Trans-Pacific Partnership (TPP) trade agreement. The Abe government has taken on Japan Agricultural Cooperatives (JA), which is like a hybrid of the National Rifle Association interest group in the United States and the European Union’s Common Agricultural Policy. In fact, rather than waiting for the average Japanese farmers to die out and have their farms be consolidated—which would probably be in the next 5 to
1. See Russell (2015).

COMMENTS and DISCUSSION 419
7 years—the Abe government has directly moved to increase efficient scale and competitiveness in agriculture. Price supports and tariffs are already being broken down for several major products, including previously untouchable goods such as dairy and pork. Should the TPP agreement as negotiated pass in the coming year, there will be further rapid change in Japanese agriculture, given the commitments that the government has made.
Hausman and Wieland rightly give considerable attention to whether long stretches of underperformance in GDP and productivity growth lead to self-fulfilling downward projections of potential output in Japan (an issue I raised in Posen [1998]). This set of reforms raises an intriguing possibility, namely that for at least a few years, potential growth might be raised on both labor supply and productivity grounds.
DOES ABENOMICS SUPPORT OR DISCREDIT THE MACROECONOMIC MAINSTREAM
OF TODAY? As in many other places where it was put to the test in recent years by the global financial crisis, the forward-looking expectations and credibility-based view of monetary policy comes off very poorly with respect to explaining Abenomics’s outcomes. Some warned 15 years ago that it would not be enough simply to promise irresponsible policy or future higher inflation—Japan, they argued, would need real growth (beyond closing the output gap or achieving the NAIRU2 level of unemployment) to get inflation up. Putting it differently, the combination of the visible regime change at the Bank of Japan with a forward-looking 2 percent inflation target promise, strong backing from the government (some would say even with erosion of central bank independence), and a sustained sizable devaluation in the yen should have been enough to raise inflation expectations—if indeed inflation expectations were ever to be malleable to such “credible commitments.” One can always give the excuse that this multifaceted public effort with political backing at the highest level was not sufficiently credible, but then one ends up sounding like Margaret Thatcher trying to defend monetary targeting in the 1980s despite its repeated failures. If Abenomics and the Bank of Japan program under Governor Haruhiko Kuroda were not a cred-ible precommitment to raise inflation, it is very difficult to imagine what would have constituted one.3
2. NAIRU stands for non-accelerating inflation rate of unemployment.3. Juxtaposing this with Kumar and others’ (2015) study of inflation anchoring in New
Zealand—the other paper in this BPEA volume on inflation targeting—one finds that the hypothesis that expectations are the main channel for policy transmission is failing there as well, despite an a priori credible monetary regime with clear, transparent inflation targets that track over many years.

420 Brookings Papers on Economic Activity, Fall 2015
This may be a little unfair—more to the Bank of Japan than to the theory— in that the combination of labor market changes (notably the addition of many part-time female workers) and various global disinflationary forces (such as the sustained drop in energy prices) can account for some of the shortfalls in the Bank of Japan’s progress towards its 2 percent inflation target. Based on the latest data, core-core inflation4 is trending up and is at 0.9 percent on a year-over-year basis, and the Bank of Japan board members forecast that the 2 percent target will be reached in the second half of 2017.
But the hidden surprise, unnoted in the paper, is that there are no balance sheet effects present to damp down the inflation response now, unlike in the early 1990s and the 2000s. Again, this is not dissimilar from, say, the situation in the United States and some western European countries, but it is more extreme in Japan’s case; since the mid-2000s, corporate balance sheets in Japan have been extremely strong, and household balance sheets have been in good shape as well. In addition, unlike in the United States and western Europe, and unlike in Japan in the 1990s, today the banking system in Japan is well capitalized and in demonstrably good shape, having ridden out the financial crisis with little problem. If anything, the puzzle becomes greater because these strong balance sheets, at a minimum, should have partially offset whatever downward pressure wages and energy exerted on inflation over the short run.
Fiscal policy comes closer to being what was expected in standard macro theory, or rather, standard policy and applied macro theory (not the fanciful New Keynesian models, let alone real business cycle models where fiscal policy is ineffective). As noted, the multipliers on fiscal policy in Japan are large but not unexpectedly so; it is the persistence of the value added tax shock that was a surprise, especially given the ample forewarning of its coming and its being embedded in a putative series of tax hikes. The underlying challenge is in the (rational) expectations channel. It has been decades since economists took Ricardian equivalence literally, but some notion of forward-looking markets, and even average citizens’ awareness, with respect to Japan’s well-documented and unbending rise in public debt, should have been expected. Yet we see little sign of such behavior, from household savings, which show little response to movements in fiscal policy, to long bond rates, which also remain largely unperturbed, even as deficits mount. The outcome of the authors’ interesting exercise, show-ing the uniformity of consumption impact across age and even creditor
4. Japan’s “core-core” inflation index excludes food and energy prices, and is similar to the core inflation index used in the United States.

COMMENTS and DISCUSSION 421
status, is therefore somewhat troubling. Here at least there does seem to be a meaningful difference between Japan and other countries, with cross-sectional differences of age and financial status seeming to matter more in Japan for fiscal policy response. This bears further examination.
But in a world where some still talk about fiscal theories of the price level and treatment of debt sustainability as immediate issues, the stability of Japanese savings and interest rates must be seen as a major challenge. It also is a challenge to the idea of simple distinctions between permanent and temporary tax policy impacts, since we are getting to the end of the fiscal road in Japan, and the whole point of the consumption tax increase was that it was still only one in a precommitted series. This is not to say that Japan’s even net debt (currently at 160 percent of GDP) is in any sense on a sustainable path, given demographics and health care commitments. It is to say that some measures of financial repression and monetary financing are clearly more effective at calming individual behavior than one would have been led to believe by much of the economics profession in recent years. Meanwhile, the markets are littered with the tombstones of hedge funds that dared to bet on expectations of a Japanese fiscal collapse. This will no doubt change should inflation be sustained for a long period and long bond interest rates eventually begin to rise—at that point, the interest payment dynamics will rapidly crowd out all other activities in the Japanese budget and demand a response. But for a surprisingly long meantime, forward-looking behavior on the part of Japanese households, and even Japanese government bond markets, seems to be absent.
I would like to emphasize that there are still three surprises in the underperformance of Abenomics, even though I give the policy package a more sympathetic reading on structural reform and even monetary policy impact than Hausman and Wieland do. The first surprise, as I mentioned earlier, is that clean balance sheets across the Japanese economy seem to have brought less benefit in terms of growth and investment than was expected. There is no question that the resolution of the banking crisis in 2003 undertaken by Heizo– Takenaka, then minister of financial services, which included recapitalization and consolidation of the banking sector, was a necessary condition to get Japan out of its worst Lost Decade. But it must be reckoned as an asymmetry to deal with, one similar to what we are seeing in the United States at present, that while fixing a banking crisis prevents bad outcomes, it does not seem to stimulate good outcomes.
A second surprise from Abenomics’s underperformance leads me to ask whether economists should just stop talking about credibility of macro-economic policy altogether. If forward-looking behavior matters, we
422 Brookings Papers on Economic Activity, Fall 2015
should have seen some great response to the uncertainty about the path of future consumption tax hikes induced by the Abe government’s decision not to proceed with the next scheduled one (which was to have been in spring 2015). It is hard to get away from this fact. Similarly, if credibility was key, the Bank of Japan’s inflation commitment should have been suf-ficient to raise inflation to target on trend.
The third surprise is that while there have been meaningful steps, albeit perhaps insufficient progress in both labor market reform and corporate governance reform in Japan, as reform is defined by the Organization for Economic Cooperation and Development or according to western text-books, there has been little obvious benefit to productivity or to realloca-tion of resources. These structural reforms therefore must be thought of as possibly overrated, given the lack of support beyond the equity market, and the certainly disappointing results with respect to real GDP growth. Again, one can hope that this is attributable to these kinds of structural reforms, particularly labor market reforms, being disinflationary in the short run, as is evident in southern Europe. This too bears further scrutiny.
WHAT CHALLENGES DOES ABENOMICS PRESENT TO MACROECONOMIC POLICY?
Remember, the message that came out of past research was that in Japan from 1990 to 2003, or arguably from 1985 to 2007, macroeconomic pol-icy worked as expected. When monetary policy stopped being deflation-ary and started to get ahead of the curve, many things improved. When fiscal policy was tightened or loosened, despite the overhang of private and public debt, large consumption responses were seen. The restoration of bank capital made a major difference to the behavior of the economy, although as mentioned earlier it ended the downside risk more than it raised the upside performance. Has something changed to make this less the case in Japan now, and is this something one should look at in other countries as well?
The usual catchall these days for explaining Japanese exceptionalism is demographics, to say that fundamentally as the population gets older, various perverse behaviors start to dominate, including extreme risk aver-sion and underinvestment. Yet these channels have not been well specified, and it is clear from cross-sectional growth regressions that the declining population is usually good for per capita growth, so things cannot be quite that simple. As many note, unfavorable demographics with respect to the working-age population are hardly a problem unique to Japan. Addition-ally, Japan is now a more open economy and more market-oriented, if not more subject to market discipline on any a priori observable grounds than it was in 2003 or 1993. Put simply, this should go the other way, and make

COMMENTS and DISCUSSION 423
Japan’s response to macroeconomic policy more like it is in other countries (except for fiscal leakage, which is a second-order issue), and more like what the textbooks describe. That is not what has happened, though.
Before economists get caught up in the overly cutesy and complex dis-cussions of behavioral economics, which have replaced the previous gen-eration’s technical fascination with real business cycle models, they have to look at much more simplistic (and not just simple) microfoundations. In short, the rational expectations revolution that permeated all our macro-economic models for the last 30-plus years is probably a grievous mistake if Japan is anything to go by—or if the global financial crisis counts, for that matter. Of course, it pains everyone to say that, and it would require a huge rethink with no obvious ready-made alternative.
But if there is one message from Japan’s example as a macro puzzle, it is the near total absence of forward-looking behavior, particularly in response to monetary policy, but also to fiscal problems. This is evident even among Japanese businessmen and investors, let alone being widespread among Japanese households. One must confront the idea that there is some real stickiness in expectations and even in regimes, at least once one has entered a near-deflation low-growth environment. In a Brazil or an India today, let alone in smaller open economies, one still legitimately watches for what the 1970s taught us to fear: inflation spirals, vertical Phillips curves, and fiscal dominance, which all certainly still have relevance. But those pat-terns might not be relevant for the low-inflation world in which Japan and other advanced economies now find themselves.
The policy research challenge is to further examine the global forces that lie behind the current persistently low inflation levels, and in fact lie behind the parallel changes in wage share, consumption trends, and invest-ment appetite across the advanced world. Are these outcomes the result of direct spillovers, or of common policy approaches (and mistakes), or of some underlying transnational forces at work? Both real business cycle models and their hybrid children in New Keynesian open economy mod-els have done a poor job of fitting what happened during the crisis—but more importantly, and even more confusingly, they have failed to predict or explain what has happened since the crisis. It is in this sense that the evidence presented in Hausman and Wieland for Japan’s anemic recovery despite monetary stimulus is truly troubling, because it is being echoed in the euro area and in the United States at present.
One can talk about a common downshift in productivity growth, which certainly is seen in the data, but all else equal, that should not keep market economies with well-capitalized banking systems from having a positive

424 Brookings Papers on Economic Activity, Fall 2015
response to monetary stimulus, whatever the limit on potential. Remember, it used to be considered the main policy problem that monetary policy had a proclivity to successfully and persistently stimulate economies well above potential. Moreover, as Japan illustrates, along with the United States and arguably much of western Europe, the productivity slowdown was started well before the global financial crisis. Using a productivity trend break to explain more than the immediate precrisis buildup and postcrisis bust therefore seems to be a stretch.
Japan’s experience, as pointed to by Hausman and Wieland, also raises significant issues having to do with exchange rate pass-through and the trade balance. We spend a lot of time in Washington and other capitals, as well as in central banks around the world, hoping that the exchange rate proves to be a major mode for transmitting monetary policy in the real economy—and fearing that some other country will export their unemployment. People who dispute my very negative view on the expec-tations channel of monetary policy will point to the substantial deprecia-tion of the yen since Abe won election as prime minister in December 2012 as evidence that the expectations channel was working. Yet what we have seen in country after country, and most strikingly in Japan and the United Kingdom, is a shortfall on past benchmarks of net export response to large sustained depreciations. In fact, the response seems to be even more diminished on the import side than the export side. This is troubling, because on the export side it is easier to rationalize companies taking profits in their home currency and maintaining market share, as there is good indication Japanese multinationals have done in this cycle. There is reason to think about a diminished net export effect for countries whose trade heavily involves industry and particularly, intrafirm supply chains, as is certainly the case for Japan’s network throughout Asia. None-theless, that integration of production does not seem to fully explain the limited net export improvement, especially in societies where house-hold consumption of imported goods remains high and where the manu-facturing share of the GDP is declining.
Bringing this back to the original questions from Hausman and Wieland’s focus on monetary policy, one can summarize the puzzle this way: How could such a large exchange rate depreciation, seemingly caused by a significant monetary regime shift with commitment, have had so little effect on general inflation at home? Of course, it was a matter of deep faith that inflation-targeting regimes’ “well-anchored expectations” would allow exchange rate shifts to be treated as first-round impacts and not passed through. The trouble with that is that the whole point of the Abenomics

COMMENTS and DISCUSSION 425
exercise in Japan was to explicitly reanchor deflation expectations upward, from an unclear commitment to a positive inflation target to a clear one. Why that should be less credible than keeping inflation expectations anchored is difficult to understand, especially since Japan was coming out of a deflationary period acknowledged to be harmful.
It is even more puzzling given that all the forward-looking models from Finn Kydland, Edward Prescott, Robert Barro, and David Gordon onward assume that there is always doubt about the credibility of the central banks’ commitment to stay anti-inflation. In other words, in the mainstream macro policy literature, there is a fundamental assumed asym-metry in monetary policy that makes it easier to bring inflation up than to take it down. Again, this clearly seems to be disproved by Japan’s expe-rience, as well as by recent though less stark experiences in Europe and the United States. There are some very serious questions being provoked here by Hausman and Wieland, although in their paper’s section on cen-tral bank credibility they indulge too much in trying to reconcile these anomalies with the existing literature. Economists will have to think much harder about what Japan means this time than they did 15 years ago, for the message now is much more disruptive to the standard macroeconomic understanding.
REFERENCES FOR THE POSEN COMMENT
Kumar, Saten, Hassan Afrouzi, Olivier Coibion, and Yuriy Gorodnichenko. 2015. “Inflation Targeting Does Not Anchor Inflation Expectations: Evidence from Firms in New Zealand.” In present volume of Brookings Papers on Economic Activity.
Kuttner, Kenneth N., and Adam S. Posen. 2001. “The Great Recession: Lessons for Macroeconomic Policy from Japan.” Brookings Papers on Economic Activity, no. 2: 93–185.
———. 2002. “Fiscal Policy Effectiveness in Japan.” Journal of the Japanese and International Economies 16, no. 4: 536–58.
Posen, Adam S. 1998. Restoring Japan’s Economic Growth. Washington: Institute for International Economics.
———. 2012. “Commentary: Methods of Policy Accommodation at the Interest-Rate Lower Bound.” In Economic Policy Symposium Proceedings: The Chang-ing Policy Landscape. Jackson Hole, Wyo.: Federal Reserve Bank of Kansas City.
Romer, David. 2012. “What Have We Learned about Fiscal Policy from the Crisis?” In In the Wake of the Crisis: Leading Economists Reassess Economic Policy, edited by Olivier Blanchard, David Romer, Michael Spence, and Joseph E. Stiglitz. MIT Press.

426 Brookings Papers on Economic Activity, Fall 2015
Russell, George W. 2015. “Will Toshiba’s Scandal Bring About the Change Needed in Corporate Governance?” GAA Accounting, May 10. http://www.gaaaccounting. com/toshiba-scandal-corporate-governance
Svensson, Lars E. O. 2003. “Escaping from a Liquidity Trap and Deflation: The Foolproof Way and Others.” Journal of Economic Perspectives 17, no. 4: 145–66.
GENERAL DISCUSSION Lars Svensson found the paper by Joshua Hausman and Johannes Wieland to be a very good update on their earlier research. In his own view, a bolder policy, one that did not rely mainly on just the pass-through from the exchange rates, might arguably have moved expectations in Japan more successfully than the current policy has done, thus increasing inflation expectations and reducing real interest rates. Such a policy, the “foolproof way” of escaping from a liquidity trap,1 which he had advocated for Japan in 2000 and is somewhat similar to what the Czech National Bank is doing currently, includes three elements: (i) a currency depreciation of some 10 to 15 percent, with a corresponding exchange rate floor; (ii) a price-level target some 10 to 15 percent above the current price level; and (iii) an exit strategy, according to which the currency is floated and policy is returned to normal when the price-level target has been reached.
Svensson suggested that the outcome would have been much better if Japanese Prime Minister Shinzo– Abe and Bank of Japan Governor Haruhiko Kuroda had been appointed 15 years ago and deployed their policy at that time. Instead, what has transpired in Japan is the entrench-ment of a “deflationary mind-set,” something the Bank of Japan board members have mentioned several times. Expectations among the Japanese are deeply entrenched at this point, and getting them out of that mind-set after 15 years is difficult.
Frederic Mishkin elaborated on the issues that discussant Adam Posen had raised regarding how demoralizing the outcomes from Japanese mon-etary policy have been. He had felt more strongly than Posen that expecta-tions were very important and that managing expectations is a key element in good monetary policy. He and his colleagues expected much stronger effects in Japan from the expansion of its monetary policy. Japan’s outcome
1. Lars E. O. Svensson, “The Zero Bound in an Open Economy: A Foolproof Way of Escaping from a Liquidity Trap,” Monetary and Economic Studies 19, no. S-1 (2001): 277–312.

COMMENTS and DISCUSSION 427
might demonstrate that raising inflation expectations is much more difficult than lowering them, and moreover this might be true globally.
Acknowledging that he is known to be a big proponent of inflation tar-geting, Mishkin said that when the focus is on how to keep inflation expec-tations down, it has worked well. But he and others have found it much more difficult to raise expectations, particularly during a long period of deflation.
Brad DeLong seconded Mishkin’s comment, adding that the macro-economic situation in Japan has not developed to Japan’s advantage, even though economists had strong reasons to think the expectations channel was present based on historical examples. Franklin Roosevelt’s New Deal and Neville Chamberlain’s announcement that he was going to restore Great Britain’s price level to its pre-Depression state both demonstrated the power of the expectations channel, and indeed the same happened when Japanese Finance Minister Takahashi Korekiyo announced his deci-sion to go for reflation in Japan in the 1930s. It is a great puzzle that this time around it has not been working.
Robert Gordon wanted to reiterate something Posen had stated earlier about the paper in the present volume by Saten Kumar, Hassan Afrouzi, Olivier Coibion, and Yuriy Gorodnichenko about New Zealand, which showed that analyzing what professional forecasters think is not nearly sufficient because it may have very little to do with what the average price setter thinks. The paper by Hausman and Wieland pays too much attention to how expectations are formed and to central bank credibility, in Gordon’s opinion, whereas if the New Zealand example carries over to Japan, the actors who are actually setting prices and wages might not even know what the central bank is. In sum, rather than looking at how the central bank affects expectations, he thought one should be studying how actual prices are set.
Martin Feldstein mentioned a proposal he had made several years ear-lier for increasing the expected inflation in Japan. It would be a balanced-budget tax change in which the government announces it is going to raise the value added tax by some certain amount—say 1 or 2 percent per year—and that it is going to balance that by cutting the personal income tax. This approach would avoid a Keynesian aggregate demand effect, but it would stimulate an expectation that prices were going to rise, which should increase aggregate spending. Feldstein continues to think this is a good idea.
Christopher Carroll complained about the fact that while macro-economists have been open to the idea of developing microfoundations for the impact of labor supply and responses to tax policies, it has been

428 Brookings Papers on Economic Activity, Fall 2015
nearly taboo for them to research how people actually form expectations, including inflation expectations.
David Romer wished to highlight an aspect of the paper that Hausman had no time to discuss in the presentation, namely that when examining Japan’s economy it is incredibly important to consider that the working-age population is falling. The headline output numbers may look dismal, but output per working-age population actually rose 3.2 percent in 2013 and 1.4 percent in 2014, both quite respectable numbers. This led him to wonder—though it seemed hard to believe—whether it was possible that forecasters in Japan had failed to understand that the working-age popu-lation was falling. Their 2007 forecast of GDP was for steady 2 percent growth up through today and beyond, and at least now the working-age population is falling at 1.5 percent a year, so this means that in 2007 they were actually forecasting roughly 3.5 percent growth in output per worker indefinitely. This suggests that in comparing past forecasts with actual outcomes and current forecasts, it may be important to consider the pos-sibility that the past forecasts did not properly account for demographics, and that forecasters have only gradually incorporated the falling working-age population into their forecasts.
Posen concurred with Romer on this last point, adding that he found the forecasts especially strange since the Japanese government, the Inter-national Monetary Fund (IMF), the Organization for Economic Coop eration and Development (OECD), and the banks that issue forecasts all state that potential growth in Japan is well below 1 percent, possibly as low as 0.5 percent. The fact that forecasts continue to be published that forever project 2 percent growth struck Posen as weird.
Katharine Abraham added to the comments others had made about the importance of structural reforms to the long-run success of the Japanese economy. She underlined the striking fact that between now and 2050, projections are for the Japanese population to fall by a third, with a substantially higher fraction of that smaller population consisting of older people who traditionally have not been active in the labor force. In Abra-ham’s view, structural reforms that could increase the size of the labor force should be central to the ongoing policy discussion in Japan.
She agreed with Posen’s earlier comment that Japan has made progress in drawing women into the labor force. At the same time, much more needs to be done to make it possible for women to work at jobs that make full use of their capabilities. Historically there have been many disincen-tives for second earners in Japanese households to work more than mini-mal hours at low wages. In addition, there is the challenge of enabling

COMMENTS and DISCUSSION 429
women to enter the labor force without depressing fertility even further. The tradition of men working long hours and not coming home until the small hours of the morning is incompatible with women working full-time and also having children. In short, fully integrating women into the labor force is going to require fundamental changes in the way work is organized in Japan.
Immigration is another policy area where, Abraham thought, any coun-try in Japan’s situation would be seriously engaged. In the United States, half of the net growth in population stems from immigration, but immi-gration to Japan is minimal. Her sense of the Japanese perspective on immigration, based on conversations with Japanese officials during a visit over the summer, is that they are not thinking seriously about this path-way. One Abe minister told her he was hopeful about making progress on immigration because the number of foreign tourists had risen a lot, enabling more Japanese people to meet foreigners and thereby become more open to the idea of immigrant labor. That exchange led her to conclude that Japan has a long way to go.
Justin Wolfers took exception to the pessimism about Abenomics he was hearing in the discussion, and it puzzled him because he felt an equally strong case could be made for optimism. For example, the paper itself showed that inflation expectations have risen in Japan, indicating that talking to the public about inflation does work. The lesson seemed to be that when one promises 2 percent inflation, one gets 1 percent inflation, so perhaps the rule should be that to get 2 percent inflation one should promise 4 percent. The second lesson seemed to be that when a good policy shock is followed by a bad global shock, the net effect is that the economy just muddles along, and in fact that is how things look in Japan. Perhaps more explicit counterfactual thinking is needed to separate out the effects, since the world was a different place when Abe was elected, and clearly it went on to become a worse place.
Wolfers’s third point was that the authors’ initial assessment, in their first paper on Abenomics,2 had been pessimistic, even though stocks had already risen 62 percent. The authors dismissed the stock rise as over-optimistic betting on future corporate earnings. In the year since then, stocks rose another 36 percent. Clearly, something has been raising the net present value of future corporate earnings. That demonstrated optimism in
2. Joshua K. Hausman and Johannes F. Wieland, “Abenomics: Preliminary Analysis and Outlook,” Brookings Papers on Economic Activity, Spring 2014: 1–63.

430 Brookings Papers on Economic Activity, Fall 2015
the market was more convincing to him than the modeling of professional economists. It could be due to a redistribution from labor to capital, from small firms to big, that is, from newcomers to existing firms. In any case, it would be worth knowing whether the authors thought any of the structural reforms had changed how one should interpret stock prices.
Seeking to offer a slightly different perspective on the puzzle of monetary policy, Ricardo Reis found it striking that Abenomics—which the authors describe as expanding monetary policy, expansion through fiscal policy, and structural reforms—signified an elected leader undermining the independence of the Bank of Japan. The failure to raise inflation expecta-tions could also be seen as a failure of the time-consistency view of infla-tion, which is that if one takes away the central bank’s independence one is left with a government that is pushing for inflation. One would expect higher inflation, which after all is the lesson from the work of Robert Barro, David Gordon, and Finn Kydland.
With that in mind, Reis wondered whether the authors could speak about how the Bank of Japan in the last two years reasserted its inde-pendence, or did not, and whether one could look through that prism to understand the evolution of inflation. It seemed to him that that ought to be a vital part of the agenda, and that the psychology literature offered plenty of tools to examine it with.
Wieland replied to the discussion. First, he wanted to underline that by no means did he and Hausman regard Japan’s situation as a disaster. They agreed with Romer that once one adjusts for demographic changes, GDP growth in Japan looks reasonable. It still lags behind the United States, but its productivity growth over the last 20 years has only been about half a percentage point below the U.S. rate. What is disappointing is the gap between the current level of Japanese GDP and the pre–Great Recession demographically adjusted trend.
In response to Wolfers’s comment about raising inflation expectations further, he wondered by how much they would need to be raised. Would doubling the expected rate, as Wolfers suggested, be sufficient? His own optimistic interpretation was that the policies have at least been moving things in the right direction, since inflation expectations in Japan have gone up, and there is still scope for raising expectations higher. Never-theless, he and Hausman hesitated to commit to a specific value for a higher inflation target. As Posen argued, it remains unclear what the right model for Japan is, so simply extrapolating and recommending that the govern-ment double the expected rate in order to achieve twice the effect is not justifiable.

COMMENTS and DISCUSSION 431
He added that as found in the paper on New Zealand by Kumar and others, in Japan there has been a disconnect between inflation facts and the public’s inflation perceptions, with opinion surveys by the Bank of Japan finding that consumers thought inflation had been averaging 4 percent for the previous 10 years and expected it to continue at 4 percent per year.
The increase in the labor force participation of women has been a great success for Abenomics, in Wieland’s view. Nevertheless, when he and Hausman tried to determine what policies had been enacted to cause this change, they could only find a small set of policies. They remain uncertain how to square the outsized effects with the actual policies implemented.
Commenting on Reis’s discussion of the time-inconsistency literature, he noted that some appointments to the Bank of Japan’s governing board were of people who were thought to be friendly to the Abenomics agenda, and yet those appointments led to no obvious movements in inflation expectations. While one does not know the counterfactual, one did not see outsized movements in inflation expectations stemming from political interference in the central bank, which may speak to the theory of time inconsistency.
To Feldstein’s suggestion of influencing consumer behavior through a value added tax, Wieland responded that Japanese corporations have been very resistant to continually changing prices in this way.
Related Documents