Overcoming growing water scarcity: Exploring potential improvements in water productivity in India Upali A. Amarasinghe, R.P. S. Malik and Bharat R. Sharma Abstract Improvements in water productivity (WP) are often suggested as one of the alternative strategies for overcoming growing water scarcity in India. This paper explores the potential improvements in WP of food grains at district level, which currently varies between 0.11 and 1.01 kilogram per cubic metre (kg/m 3 ), in the 403 districts that account for 98% of the total production of food grains. The paper first finds the maximum yield function conditional on consumptive water use (CWU) and then explores the potential improvements in WP by: (a) bridging the gap between actual and maximum yield while keeping CWU constant; and (b) changing the maximum yield by adjusting the CWU using supplementary or deficit irrigation. Deficit irrigation in some areas may decrease yield but can increase production if land availability is not a constraint. A large potential exists for bridging the yield gap in irrigated areas with CWU between 300 and 475 mm. Of the 222 districts that fall under this category, a 50% reduction in yield gap alone could increase production by 100 million tonnes (Mt) without increasing CWU. Supplementary irrigation can increase yield andWP in rain-fed and irrigated areas of 266 and 16 districts with CWU is below 300 mm. Deficit irrigation in irrigated areas of 185 districts with CWU above 475 mm could increase yield, WP and production. Decreasing CWU in irrigated areas with CWU between 425 and 475 mm reduces yield slightly, but if availability of land is not a constraint then the benefits due to water saving and production increases could exceed the cost.Keywords: Water productivity; yield gap; consumptive water use; deficit irrigation; supplemental irrigation. 1. Introduction Increasing water productivity (WP), meaning “more crop or value per drop of water”, is more important for India now than ever before. While the absence of a significant breakthrough in agricultural production technology and near stagnant growth in crop yields are major constraints for increasing food production from the existing croplands, increasing population, growing regional water scarcities, changing land and water use patterns, increasing competition for water from other sectors and impending climate change scenarios have put a question mark over India’s ability to provide additional water to meet its increasing food requirements. Thus, similar to the campaign for “more crop per unit of land” in the 1970s due to food scarcities, the concept of “more crop or value per drop of water” is critical for India in today’s context due to water scarcities. Yet, a comprehensive analysis of the issues relating to marginal WP in regions with widely differing rainfall intensity and irrigation water availability is absent at present. Thus, planners are often at a loss in making a more informed decision to prioritize the available financial resources among different regions, and between irrigated and rain-fed areas. Food grains are important for both their nutritional value for the population and the livelihood security of India. At present, food grains account for about 65% of the gross cropped area of the country (GOI, 2007) and contributes to about 65% of total calorie supply in daily diets (Amarasinghe et al., 2007). It has been estimated that if food grain productivity increases at the rate of 1.04% annually, India can easily meet the projected food and feed grain requirement of about 380 Mt by 2050 without any addition to the consumptive water use (CWU) (Amarasinghe et al., 2007). In other words, such growth patterns would require no additional, or perhaps less, irrigation water to continue to sustain self-sufficiency in food grain production. However, given that the food grain Upali A. Amarasinghe, R.P. S. Malik and Bharat Sharma are with the International Water Management Institute, New Delhi office, India. Natural Resources Forum 34 (2010) 188–199 © 2010 The Authors. Journal compilation © 2010 United Nations

Welcome message from author
This document is posted to help you gain knowledge. Please leave a comment to let me know what you think about it! Share it to your friends and learn new things together.
Transcript

Overcoming growing water scarcity: Exploring potentialimprovements in water productivity in India
Upali A. Amarasinghe, R.P. S. Malik and Bharat R. Sharma
Abstract
Improvements in water productivity (WP) are often suggested as one of the alternative strategies for overcoming growingwater scarcity in India. This paper explores the potential improvements in WP of food grains at district level, whichcurrently varies between 0.11 and 1.01 kilogram per cubic metre (kg/m3), in the 403 districts that account for 98% of thetotal production of food grains. The paper first finds the maximum yield function conditional on consumptive water use(CWU) and then explores the potential improvements in WP by: (a) bridging the gap between actual and maximum yieldwhile keeping CWU constant; and (b) changing the maximum yield by adjusting the CWU using supplementary or deficitirrigation. Deficit irrigation in some areas may decrease yield but can increase production if land availability is not aconstraint. A large potential exists for bridging the yield gap in irrigated areas with CWU between 300 and 475 mm. Ofthe 222 districts that fall under this category, a 50% reduction in yield gap alone could increase production by 100 milliontonnes (Mt) without increasing CWU. Supplementary irrigation can increase yield and WP in rain-fed and irrigated areasof 266 and 16 districts with CWU is below 300 mm. Deficit irrigation in irrigated areas of 185 districts with CWU above475 mm could increase yield, WP and production. Decreasing CWU in irrigated areas with CWU between 425 and475 mm reduces yield slightly, but if availability of land is not a constraint then the benefits due to water saving andproduction increases could exceed the cost.narf_1305 188..199
Keywords: Water productivity; yield gap; consumptive water use; deficit irrigation; supplemental irrigation.
1. Introduction
Increasing water productivity (WP), meaning “more crop orvalue per drop of water”, is more important for India nowthan ever before. While the absence of a significantbreakthrough in agricultural production technology and nearstagnant growth in crop yields are major constraints forincreasing food production from the existing croplands,increasing population, growing regional water scarcities,changing land and water use patterns, increasingcompetition for water from other sectors and impendingclimate change scenarios have put a question mark overIndia’s ability to provide additional water to meet itsincreasing food requirements. Thus, similar to the campaignfor “more crop per unit of land” in the 1970s due to foodscarcities, the concept of “more crop or value per drop ofwater” is critical for India in today’s context due to waterscarcities.
Yet, a comprehensive analysis of the issues relating tomarginal WP in regions with widely differing rainfallintensity and irrigation water availability is absent atpresent. Thus, planners are often at a loss in making a moreinformed decision to prioritize the available financialresources among different regions, and between irrigatedand rain-fed areas.
Food grains are important for both their nutritional valuefor the population and the livelihood security of India. Atpresent, food grains account for about 65% of the grosscropped area of the country (GOI, 2007) and contributesto about 65% of total calorie supply in daily diets(Amarasinghe et al., 2007). It has been estimated that iffood grain productivity increases at the rate of 1.04%annually, India can easily meet the projected food andfeed grain requirement of about 380 Mt by 2050 withoutany addition to the consumptive water use (CWU)(Amarasinghe et al., 2007). In other words, such growthpatterns would require no additional, or perhaps less,irrigation water to continue to sustain self-sufficiency infood grain production. However, given that the food grain
Upali A. Amarasinghe, R.P. S. Malik and Bharat Sharma are with theInternational Water Management Institute, New Delhi office, India.
Natural Resources Forum 34 (2010) 188–199
© 2010 The Authors. Journal compilation © 2010 United Nations

productivity of irrigated areas is 2 to 3 times theproductivity of non-irrigated (rain-fed) areas, localgovernments have been placing greater emphasis on bothextending irrigation to hitherto rain-fed areas andimproving the irrigation water availability in alreadyirrigated areas. These decisions relating to publicinvestments in irrigation are usually guided by amultiplicity of factors, including concerns relating topoverty reduction and interregional equity. However, in theface of scarce financial resources available for investment inthe water sector, achieving food security with the mostefficient use of water has become the most importantguiding principle for allocation of public funds for thesector.
The primary objective of this paper is to explorepathways of maximizing both WP and total food grainsproduction at the district level. This analysis can beimportant when designing water policy in India. Nearstagnation of net sown area in recent decades indicates thatmany productive regions are reaching the limits of landexpansion for crop production. When land is a limitingfactor, optimizing land productivity and value of totaloutput is important. However, many of these regions arealso facing physical water scarcity, where further waterresources development for agriculture that does notendanger the interests of other sectors and the environmentis extremely limited (Amarasinghe et al., 2008). In thiscontext, optimizing WP and value of total output is moreappropriate. However, given the importance of food grainsto nutritional, livelihood and national food security,maximizing both WP and total food grain production fromthe available water resources is a reasonable starting pointfor many districts.
This paper attempts to provide a tool for planners toenable more informed decision making, leading toimprovements in WP of food grains in India and therebyguiding irrigation investment decisions. The next sectionelaborates the concept of water productivity and themethodology and data used for the analysis in this paper.Section 3 discusses the current scenario of WP in India.Section 4 assesses methods that can be used for makingimprovements in WP. The concluding section highlightsoptions for improving WP and food grain production invarious districts.
2. Water productivity: concept, methodologyand data
2.1. Concept
In this paper, the WP of food grains1 is defined as theratio of food grain production and the crop CWU (kg/m3),
where CWU in irrigated areas implies the potentialevapotranspiration (Eta), while in rain-fed areas it is theminimum of effective rainfall and Eta.
Several variants of the concept of WP have been definedin the literature depending upon how one chooses to definecrop (numerator) or drop (denominator) (Seckler, 1996;Molden, 1997; van Koppen, 1999; Molden et al., 2003;Kijne et al., 2003). In general, the definition of WP dependson the scale and objective of the analysis. For crops, WPrelates to plant biomass per unit of transpiration (Stedutoand Albrizio, 2005 cited in Molden and Oweis, 2007). Atthe level of a field, WP is the physical production per unit ofwater allocated to different crops or the net return from thewater delivered to the entire farm. At the level of anirrigation system, WP as the value of production per unit ofwater delivered is more important (Palanisami et al., 2009).However, at the field or system scales, part of the waterdelivered is often reused within the field or system orelsewhere in the basins. To avoid these complications incapturing the reuse and benefits outside the districts, thevalue of production per unit of CWU is considered to be abetter measure of WP (Molden et al., 2003).
2.2. Increasing water productivity
This study postulates that there are essentially two avenuesfor increasing the WP of food grains in India. First, byincreasing food grain yield2 with no additional CWU. Thispostulation stems from the fact that there are a large numberof low productivity areas in India that have a high potentialfor increasing crop yields. Achieving this requirescombining better water and input management in irrigatedareas, and changing agronomic practices and technologicalinputs in rain-fed areas. Second, by increasing yield orproduction through adjustments in CWU. In rain-fed orwater-stressed irrigated areas, crop yields can be increasedby increasing CWU through supplemental irrigation. Theobjective here is to match the crop water requirementsduring critical periods of crop growth. In over-irrigatedareas, increase in crop production is possible with deficitirrigation, which amounts to water savings with little or nonegative impacts on the yield. Many of these areas have ahigh dosage of crop inputs such as fertilizers and pesticidesand high crop yields, but also have high non-beneficialevaporation with over-irrigation. Water saving throughdeficit irrigation can be used for expanding the cultivatedarea (if the area is not a limiting factor), for beneficial usesin other sectors (Kumar and van Dam, 2009) or for slowingdown the rate of decline of the water table in areas wheregroundwater is overused.
To assess the above postulates, we first estimate themaximum yield function in relation to CWU (Yieldmax =f(CWU)). This function gives the approximate yield in
1 Food grains in India are implied to include rice, wheat, maize, othercoarse cereals, and pulses.
2 Food grain yield, in this instance, refers to food grain production per unitof land (i.e., tonnes/hectare).
189Upali A. Amarasinghe, R.P. S. Malik and Bharat R. Sharma / Natural Resources Forum 34 (2010) 188–199
© 2010 The Authors. Journal compilation © 2010 United Nations
relation to maximum transpiration under the prevailingagro-climatic and soil conditions. Then, the potentialimprovements in WP can be shown in two ways: bridgingthe difference between maximum yield and actual yieldunder a given level of CWU, which shows the potentialimprovements through increased transpiration; and chang-ing the marginal yield, which shows the potentialimprovements of production in relation to adjustments inCWU, i.e., through supplemental or deficit irrigation.
In general, the maximum yield function takes a quadraticform (Molden et al., 2003). In the absence of a function formaximum yield in the literature, we estimate it using aquadratic regression function of the form:
ln ln lnmaxyield CWU CWUo( ) = + ( ) + ( )( ) +α α α ε1 22
where two to three of the highest yields in various CWUintervals of 50 mm are the observations of the dependentvariable, the mid-range of CWU intervals are the values ofthe independent variable and e is the error term.
One apparent limitation of this approach is that Etamay overestimate the actual CWU in some districts. Forexample, in areas where farmers practice warabandi3 inwater allocation, the primary objective is to practice deficitirrigation over a larger area and maximize the totalproduction. However, with the advent of tubewelltechnology, many of these areas are also now meeting fullirrigation requirements. Thus, in general, Eta is a reasonablemeasure for actual CWU in the present analysis.
Food grains in India refer to a group of food cropscomprising fine cereals (wheat, paddy), coarse cereals andpulses. The yields of different crops vary. While fullyrecognizing the differences in crop yields and CWUs ofdifferent crops within the food grain group, the approachpresented here provides opportunities for selecting foodgrain cropping patterns that could possibly increase bothWP and production under the existing soil type and agro-climatic conditions.
2.3. Data
Given the spatial variation in climate, water availability andwater use in different regions of India, the avenues forimprovement in WP are explored at the sub-national levelrather than at the macro level comprising the entire nation.The official database in India is available both at theaggregated state level as well as at the disaggregated districtlevel.4 The present study analyses potential improvementsin WP at the district level.
The study draws data from various sources. The land useand crop production data are for the year 2000 (averages of1999–2001), where three-year averages essentially smoothout the deviations due to short-term temporal climaticvariations. The extent of irrigated and rain-fed areas ofdifferent crops and the combined total production wereobtained from official sources (FAI, 2003(a–d);Government of India (GOI), 2002, 2007). Climate data(monthly potential evapotranspiration and rainfall) wereobtained from the International Water ManagementInstitute (IWMI) Climate and Water Atlas (IWMI, 2001).
The study covers 403 districts in 20 major states, namelyPunjab, Haryana, Uttar Pradesh (UP), Himachal Pradesh(HP), Uttarakhand, Jammu and Kashmir (in the north),Bihar, West Bengal (WB), Assam, Jharkhand (in thenortheast), Orissa and Andhra Pradesh (AP) (in the east),Tamil Nadu (TN), Kerala, Karnataka (in the south),Maharashtra and Gujarat (in the west), Rajasthan (in thenorthwest), Madhya Pradesh (MP) and Chhattisgarh (incentral India).
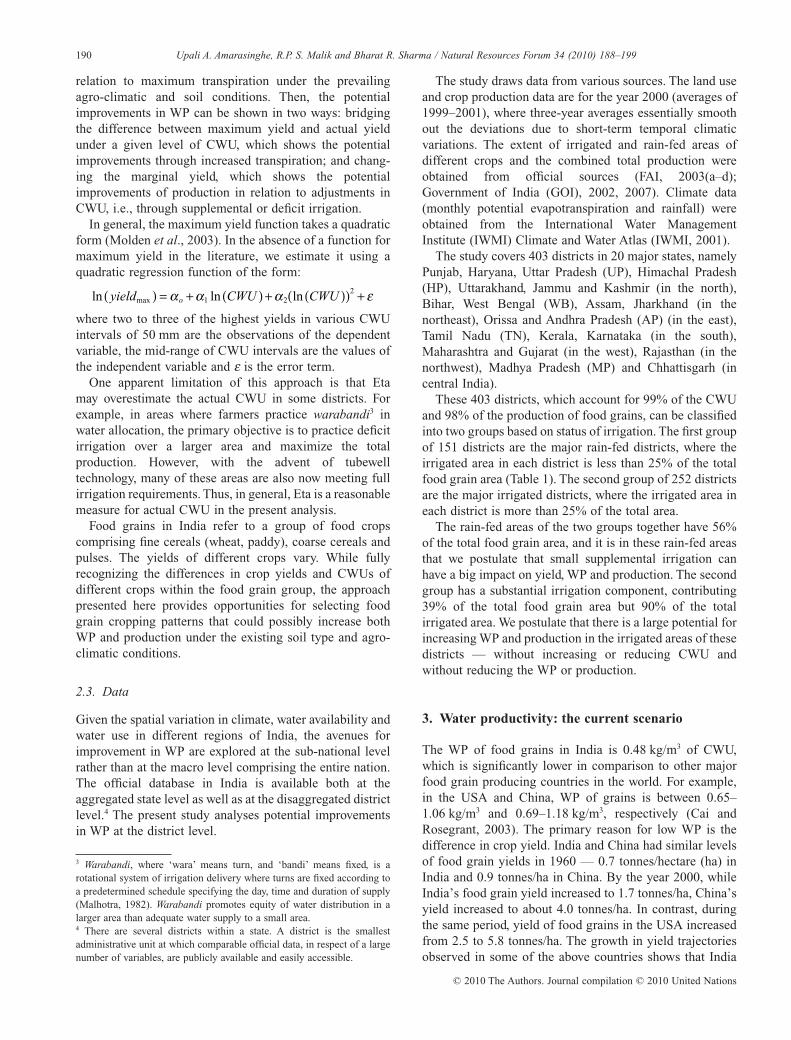
These 403 districts, which account for 99% of the CWUand 98% of the production of food grains, can be classifiedinto two groups based on status of irrigation. The first groupof 151 districts are the major rain-fed districts, where theirrigated area in each district is less than 25% of the totalfood grain area (Table 1). The second group of 252 districtsare the major irrigated districts, where the irrigated area ineach district is more than 25% of the total area.
The rain-fed areas of the two groups together have 56%of the total food grain area, and it is in these rain-fed areasthat we postulate that small supplemental irrigation canhave a big impact on yield, WP and production. The secondgroup has a substantial irrigation component, contributing39% of the total food grain area but 90% of the totalirrigated area. We postulate that there is a large potential forincreasing WP and production in the irrigated areas of thesedistricts — without increasing or reducing CWU andwithout reducing the WP or production.
3. Water productivity: the current scenario
The WP of food grains in India is 0.48 kg/m3 of CWU,which is significantly lower in comparison to other majorfood grain producing countries in the world. For example,in the USA and China, WP of grains is between 0.65–1.06 kg/m3 and 0.69–1.18 kg/m3, respectively (Cai andRosegrant, 2003). The primary reason for low WP is thedifference in crop yield. India and China had similar levelsof food grain yields in 1960 — 0.7 tonnes/hectare (ha) inIndia and 0.9 tonnes/ha in China. By the year 2000, whileIndia’s food grain yield increased to 1.7 tonnes/ha, China’syield increased to about 4.0 tonnes/ha. In contrast, duringthe same period, yield of food grains in the USA increasedfrom 2.5 to 5.8 tonnes/ha. The growth in yield trajectoriesobserved in some of the above countries shows that India
3 Warabandi, where ‘wara’ means turn, and ‘bandi’ means fixed, is arotational system of irrigation delivery where turns are fixed according toa predetermined schedule specifying the day, time and duration of supply(Malhotra, 1982). Warabandi promotes equity of water distribution in alarger area than adequate water supply to a small area.4 There are several districts within a state. A district is the smallestadministrative unit at which comparable official data, in respect of a largenumber of variables, are publicly available and easily accessible.
190 Upali A. Amarasinghe, R.P. S. Malik and Bharat R. Sharma / Natural Resources Forum 34 (2010) 188–199
© 2010 The Authors. Journal compilation © 2010 United Nations
still has significant scope for raising WP by increasing itscrop yield alone.
3.1. Variations in water productivity across districts
District-wise WP varies over a very large range — from0.11 kg/m3 to 1.25 kg/m3 (Table 2). A closer examination ofthese variations suggests that WP in districts in the first tofourth quartiles (Q1–Q4) varies from 0.11–0.34 kg/m3,0.34–0.45 kg/m3, 0.45–0.60 kg/m3 and 0.60–1.25 kg/m3.While districts in the fourth quartile of WP account for 22%of the total area under food grains and 23% of total CWU,these districts contribute to 38% of total food grainproduction of all districts selected in this study. Thisdifferential in production in the fourth quartile group isprimarily due to irrigation. The contributions fromirrigation to the food grain area, CWU and production aregiven in the last three columns. Irrigation provides watersupply to 72% of the total area under food grains in thefourth quartile, and contributes 81% of total CWU and 87%of total food grain production. In the third quartile,irrigation contributes to 54% of the area and 70% of thetotal production. In contrast, the districts in the first quartileof WP account for 30% of total area under food grains and
29% of total CWU, but they contribute to only 15% of totalcrop production. In this group, food grain production ismainly under rain-fed conditions. Irrigation contributes toonly 21% of the area in the first quartile, and the effectiverainfall, the main source of water supply in this group, isestimated to account for about 83% of the total CWU.
The results presented above show that irrigation is amajor contributor to higher yields and hence to the foodgrain production in these districts, and these in turncontribute to higher WP.
A regression of WP with yield,
ln(WP) = -5.59 + 0.65 ln(yield), R2 = 0.59
shows that every 1% increase in average yield increasesaverage WP by 0.65%. Thus, there is a large potential forincreasing WP in areas where yield is low. This is especiallytrue in many rain-fed areas, where both maximum yield andCWU are significantly low, and a small increase in CWUcan have a significant increase in marginal yield (Sharmaet al., 2010).
Another great potential for an increase in yield exists inareas where CWU is high, but a large gap exists between theactual and the maximum attainable yield. In these areas,significant potential exists for increasing yield without
Table 1. Distribution of districts with irrigated and rain-fed areas with respect to CWU
Districts with irrigatedgrain area as a percentageof total area
CWU (mm) Irrigated grain area Rain-fed grain area
Number of districts Area (Mha) Number of districts Area (Mha)
Less than 25% <225 0 0.0 60 18.8225–300 5 0.0 34 10.0300–425 39 1.3 25 6.0425–475 28 1.8 15 2.9
>475 79 2.4 17 1.9Total 151 5.5 151 39.6
More than 25% <225 0 0.0 96 9.4225–300 11 1.8 76 8.1300–425 97 22.6 66 9.4425–475 38 8.8 11 2.3
>475 106 14.4 1 0.3Total 252 47.6 2501 29.5
Note: 1Two districts have 100% irrigated grain area, so the total is 250.Source: Authors’ elaboration.
Table 2. Variations in WP across different districts in India, 2000
Quartile (numberof districts)
WP range(kg/m3)
Percentage contribution of districts in each quartile to all India Percentage contribution of irrigation water
Area underfood grains
CWU Food grainproduction
Area underfood grains
CWU Food grainproduction
Q1 (100) 0.11–0.34 30 29 15 21 31 33Q2 (101) 0.34–0.45 23 21 17 34 53 56Q3 (101) 0.45–0.60 25 27 30 54 66 70Q4 (101) 0.60–1.25 22 23 38 72 81 87All (403) 0.11–1.25 100 100 100 44 56 69
Source: Authors’ elaboration.
191Upali A. Amarasinghe, R.P. S. Malik and Bharat R. Sharma / Natural Resources Forum 34 (2010) 188–199
© 2010 The Authors. Journal compilation © 2010 United Nations

increasing CWU. A regression of average yield with thelevel and sources of water application and fertilizer inputs,given by:
Yield = 356 + 8.1Fertilizer (kg/ha) + 1.5 CWU (mm) +2.6 (per cent Groundwater irrigated area),R2 = 0.51
shows that a significant potential exists for increasing yieldwith better water and input application.
4. Avenues for increasing WP
Following from the definition of WP, an increase in WP cancome about either through an increase in numerator (i.e.,yield) or a decrease in denominator (i.e., CWU) or acombination of the two.
To explore the avenues for increasing WP through the firstroute (i.e., increase in numerator), we present in Table 3 thedata on yields and WP at different levels of food grain areairrigated.The data presented suggest significant variations inyield and WP at different levels of irrigated grain area (i.e.,0–10%, 10–20%, 20–30%, 30–40%, etc., of the total area).While the coefficient of variation (CV) of yield variesbetween 20 to 51%, that of WP varies between 23 and 50%.Further, the CV of yield generally declines with an increasein irrigated area. The smallest CV of yield is in districtswhere the percentage of irrigated area is between 60 to100%, while the largest CV of yield is in districts where thepercentage of irrigated area is between 0 to 30%. Large CVsshow that there are opportunities available for increasingthe yield, i.e., the numerator in the WP equation, and henceWP at any given level of irrigation scenario. However,potential opportunities for increasing yield through bettermanagement of irrigated or rainwater and non-water inputsare higher in districts with high CWU.
Is there a scope for increasing WP by changing thedenominator, i.e., the CWU? In fact, many canal irrigation
systems in water-scarce north-western parts of India aregood examples where this is already happening (Malhotra,1982; Perry and Narayanamurthy, 1998; Sakthivadivel et al.,1999). Due to water scarcity, water delivery in these systemsuses the warabandi principle. The farmers practice deficitirrigation in a larger area at the expense of meeting the fullrequirement of a smaller area with a view to maximizingreturns to a unit of water delivered and consumed. Deficitirrigation could be a good strategy for increasing WP wherewater is scarce but land is not (Molden et al., 2003; Kumarand van Dam, 2009). Also, as shown by Oweis and Hachum(2003), such practices can result in significant increases incrop output too. We explore two sets of options below.
4.1. Bridging the yield gap
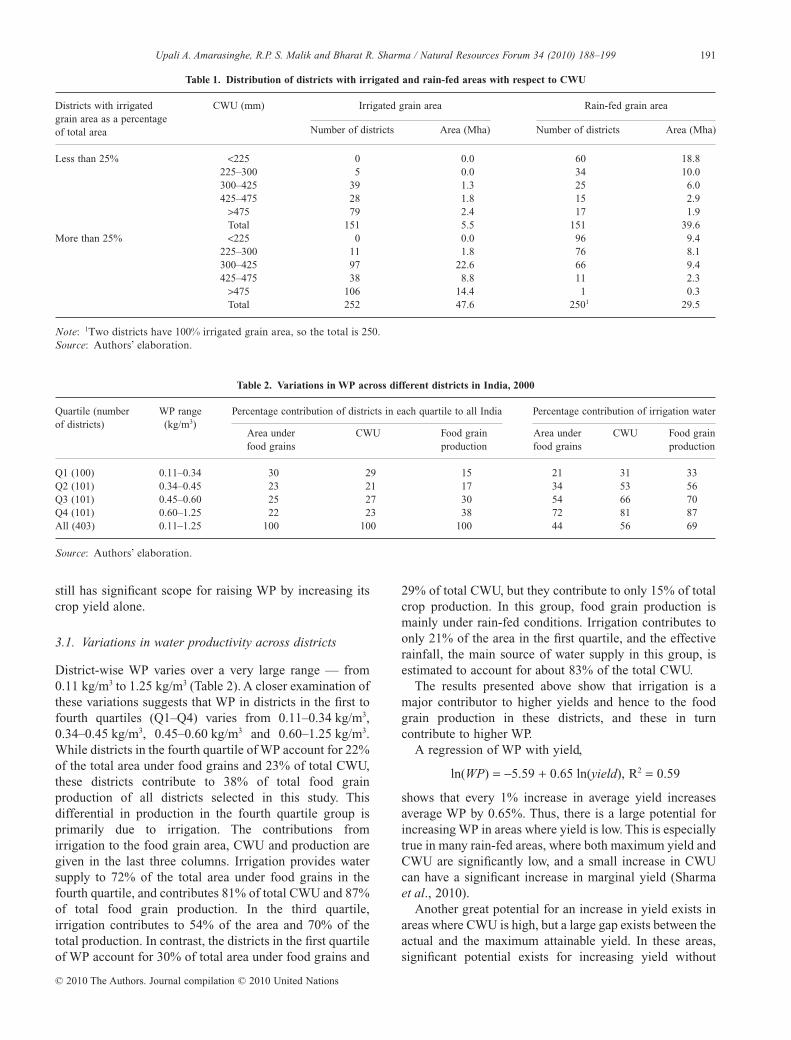
From the district-wide data, Figure 1 presents therelationship between CWU, food grain yield (1,000 kg/ha)and growth in yield (in 1,000 kg) for every additional unitof CWU. The average yield function takes the Cobb-Douglas form:
ln . . ln , . .yield CWU( ) = + ( ) =2 48 0 83 0 292R
The low R2 shows that a large part of the variation in foodgrain yield is explained by non-water related inputs. Here,however, we primarily look at water inputs per se, whichcould increase food grain yield, WP or both. For this, firstwe estimate the maximum yield function with respect toCWU.
The two to three highest values of yield in each category ofCWU (0–50, 50–100, 100–150, 150–200, mm, etc.) are usedfor estimating the maximum yield function. Figure 1 alsodepicts two marginal yield curves d(max yield)/d(CWU)for increase in CWU of 100 and 200 mm.
The results obtained thus show that:
1) Maximum yields in all CWU categories beyond 300 mmare in districts with an irrigated area of more than 80%of the total food grain area;
Table 3. Average and coefficient of variation (CV) of yield and WP at different levels of irrigation
Percent irrigatedfood grain area(percentage)
Average CWU(mm)
Food grain yield Food grain WP
Average CV Average CV
(tonnes/ha) (percentage) (kg/m3) (percentage)
0–10 351 1.27 38 0.40 5010–20 256 1.03 51 0.42 4620–30 292 1.23 40 0.45 4530–40 339 1.39 34 0.43 4040–50 363 1.64 31 0.46 3350–60 372 1.86 29 0.51 3260–70 393 2.07 20 0.54 2770–80 413 2.07 22 0.51 2480–90 415 2.58 27 0.64 3490–100 421 3.42 20 0.84 25
Source: Authors’ elaboration.
192 Upali A. Amarasinghe, R.P. S. Malik and Bharat R. Sharma / Natural Resources Forum 34 (2010) 188–199
© 2010 The Authors. Journal compilation © 2010 United Nations

2) A 1% increase in CWU increases average yields by0.83%, indicating a large potential for increasingaverage yield in the districts with low to moderateCWU;
3) A significant gap exists between maximum and actualyields in many districts, with the magnitude of the gapincreasing with increasing CWU;
4) A significant marginal gain in maximum yield can alsobe achieved with additional CWU in districts with low tomoderate CWU. These are mainly the districts with largerain-fed areas; and
5) Maximum yield function has a maximum when CWU is300. Thus little or no gain in maximum yield can beachieved by increasing CWU in districts with moderateto high CWU.
4.2. Bridging the yield gap with no additional CWU
If the gap between actual and maximum grain yield of eachdistrict can be reduced by 25%, total food grain productionin India could increase from 203 to 252 Mt. Also, if such anincrease in yield can come about without any increase inCWU, WP can increase from 0.48 to 0.60 kg/m3. A similarreduction in yield gap by 50, 75 and 100% withoutincreasing CWU could increase production to 300, 349 and397 Mt, and WP to 0.72, 0.83 and 0.97 kg/m3, respectively.The latter only requires an increase of yield a little over 1%annually, and the resultant total production is adequate formeeting the grain demand in 2050 (Amarasinghe et al.,2008). The variation of non-water inputs and other physicalfactors such as soil may seem to indicate that it is not arealistic goal to attain 1% annual yield growth over the next
50 years. However, considering the low average yield ofIndia at present and the growth of yield that other majorfood grain-producing countries attained over the last 50years, it is not an impossible goal either.
To better understand the dynamics of variations in WP,we divide the district into two groups: districts with lessthan 25% of irrigated food grain area (those are mainlyrain-fed districts) and districts with more than 25% ofirrigated food grain area (those are mainly irrigateddistricts). The CWU in rain-fed areas in the first group is79% of the total CWU, where the CWU in irrigated areas is72% of the total CWU. The distribution of districtsaccording to the percentage of yield gap, the differencebetween maximum yields and the prevailing yields of foodgrain are shown in Table 4 (see also Figures 2 and 3 forlocations). Maps on the right in Figures 2 and 3 show theabsolute gap between actual and maximum yield.
Table 4. Distribution of districts according to the percentage gapbetween maximum and prevailing yield of food grains in rain-fed
and irrigated districts
Yield gap Number of districts
First group(mainly rain-fed)
Second group(mainly irrigated)
Total
>75% 25 7 3250–75% 86 76 16225–50% 30 121 151<25% 10 48 58Total 151 252 403
Source: Authors’ elaboration.
–1.0
0.0
1.0
2.0
3.0
4.0
5.0
0 100 200 300 400 500 600 700 800
CWU (mm)
Yie
ld (
ton/
ha)
–1.0
0.0
1.0
2.0
3.0
4.0
5.0
d(m
ax y
ield
)/d(
CW
U)
Yield Max yield functionAverage yield d(max yield)/d(CWU) –100 mmd(max yield)/d(CWU) – 200 mm
ln(y) = – 0.64 ln(x)2 + 7.93ln(x) – 16.31 R2 = 0.96
Figure 1. Relationship between yield and CWU of food grains.Source: Authors’ estimates.
193Upali A. Amarasinghe, R.P. S. Malik and Bharat R. Sharma / Natural Resources Forum 34 (2010) 188–199
© 2010 The Authors. Journal compilation © 2010 United Nations

A closer examination of the yield data in irrigateddistricts shows that a large number of these districts haveyield gaps exceeding 25% of maximum yield (Figure 3).At present, the actual yield gap in most of these districtsis more than the average yield (1,660 kg/ha), and themajority of the CWU in irrigated areas of these districts isfrom irrigation water supply. These districts have a highpotential for reducing the yield gap without increasingCWU, through better in situ management of rainwater and
irrigation water. We also observe that districts with a largeirrigated area under food grains with a high CWU alsohave a relatively high level of fertilizer use. Thus, bettermanagement of non-water inputs with existing irrigationsupply could reduce most of the yield gap in thesedistricts. This group, with 252 districts (Figure 3),currently accounts for 53% of total area under food grains,80% of total irrigated grain production, and 79% of totalCWU through irrigation. Reducing the yield gap by 25,
Figure 2. Yield gap of food grains in rain-fed districts.Source: Authors’ estimates.
Figure 3. Yield gap of food grains in irrigated districts.Source: Authors’ estimates.
194 Upali A. Amarasinghe, R.P. S. Malik and Bharat R. Sharma / Natural Resources Forum 34 (2010) 188–199
© 2010 The Authors. Journal compilation © 2010 United Nations
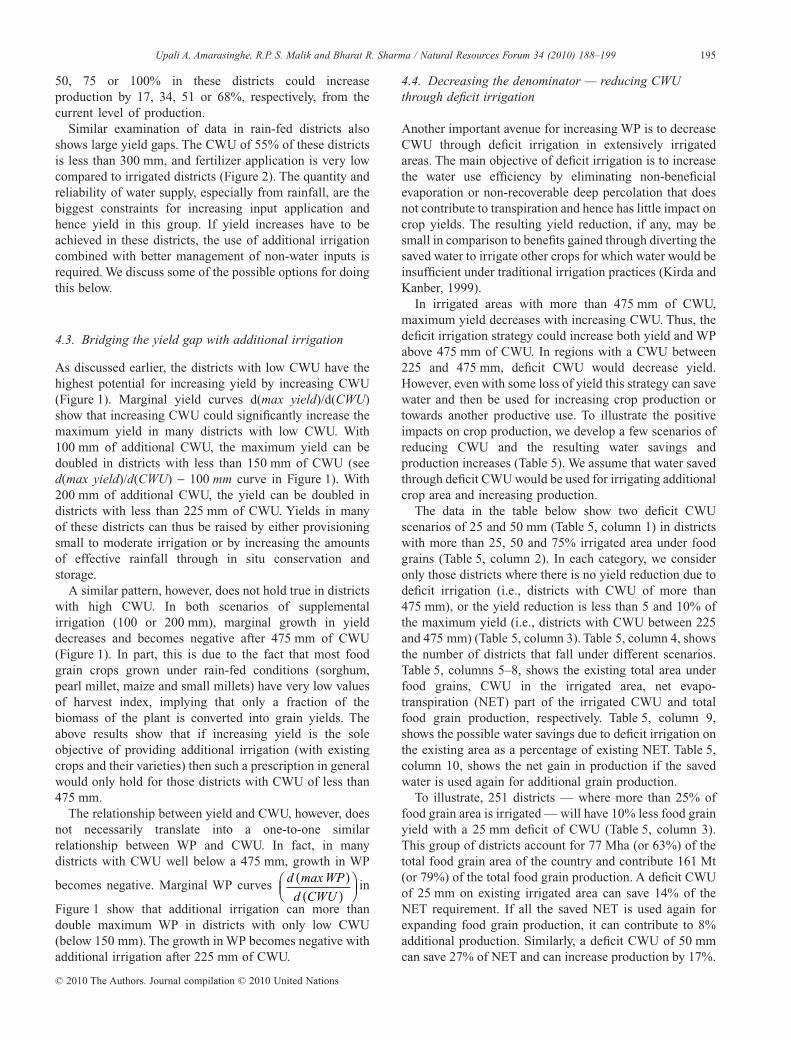
50, 75 or 100% in these districts could increaseproduction by 17, 34, 51 or 68%, respectively, from thecurrent level of production.
Similar examination of data in rain-fed districts alsoshows large yield gaps. The CWU of 55% of these districtsis less than 300 mm, and fertilizer application is very lowcompared to irrigated districts (Figure 2). The quantity andreliability of water supply, especially from rainfall, are thebiggest constraints for increasing input application andhence yield in this group. If yield increases have to beachieved in these districts, the use of additional irrigationcombined with better management of non-water inputs isrequired. We discuss some of the possible options for doingthis below.
4.3. Bridging the yield gap with additional irrigation
As discussed earlier, the districts with low CWU have thehighest potential for increasing yield by increasing CWU(Figure 1). Marginal yield curves d(max yield)/d(CWU)show that increasing CWU could significantly increase themaximum yield in many districts with low CWU. With100 mm of additional CWU, the maximum yield can bedoubled in districts with less than 150 mm of CWU (seed(max yield)/d(CWU) - 100 mm curve in Figure 1). With200 mm of additional CWU, the yield can be doubled indistricts with less than 225 mm of CWU. Yields in manyof these districts can thus be raised by either provisioningsmall to moderate irrigation or by increasing the amountsof effective rainfall through in situ conservation andstorage.
A similar pattern, however, does not hold true in districtswith high CWU. In both scenarios of supplementalirrigation (100 or 200 mm), marginal growth in yielddecreases and becomes negative after 475 mm of CWU(Figure 1). In part, this is due to the fact that most foodgrain crops grown under rain-fed conditions (sorghum,pearl millet, maize and small millets) have very low valuesof harvest index, implying that only a fraction of thebiomass of the plant is converted into grain yields. Theabove results show that if increasing yield is the soleobjective of providing additional irrigation (with existingcrops and their varieties) then such a prescription in generalwould only hold for those districts with CWU of less than475 mm.
The relationship between yield and CWU, however, doesnot necessarily translate into a one-to-one similarrelationship between WP and CWU. In fact, in manydistricts with CWU well below a 475 mm, growth in WP
becomes negative. Marginal WP curvesd WP
d CWU
max( )( )
⎛⎝⎜
⎞⎠⎟
in
Figure 1 show that additional irrigation can more thandouble maximum WP in districts with only low CWU(below 150 mm). The growth in WP becomes negative withadditional irrigation after 225 mm of CWU.
4.4. Decreasing the denominator — reducing CWUthrough deficit irrigation
Another important avenue for increasing WP is to decreaseCWU through deficit irrigation in extensively irrigatedareas. The main objective of deficit irrigation is to increasethe water use efficiency by eliminating non-beneficialevaporation or non-recoverable deep percolation that doesnot contribute to transpiration and hence has little impact oncrop yields. The resulting yield reduction, if any, may besmall in comparison to benefits gained through diverting thesaved water to irrigate other crops for which water would beinsufficient under traditional irrigation practices (Kirda andKanber, 1999).
In irrigated areas with more than 475 mm of CWU,maximum yield decreases with increasing CWU. Thus, thedeficit irrigation strategy could increase both yield and WPabove 475 mm of CWU. In regions with a CWU between225 and 475 mm, deficit CWU would decrease yield.However, even with some loss of yield this strategy can savewater and then be used for increasing crop production ortowards another productive use. To illustrate the positiveimpacts on crop production, we develop a few scenarios ofreducing CWU and the resulting water savings andproduction increases (Table 5). We assume that water savedthrough deficit CWU would be used for irrigating additionalcrop area and increasing production.
The data in the table below show two deficit CWUscenarios of 25 and 50 mm (Table 5, column 1) in districtswith more than 25, 50 and 75% irrigated area under foodgrains (Table 5, column 2). In each category, we consideronly those districts where there is no yield reduction due todeficit irrigation (i.e., districts with CWU of more than475 mm), or the yield reduction is less than 5 and 10% ofthe maximum yield (i.e., districts with CWU between 225and 475 mm) (Table 5, column 3). Table 5, column 4, showsthe number of districts that fall under different scenarios.Table 5, columns 5–8, shows the existing total area underfood grains, CWU in the irrigated area, net evapo-transpiration (NET) part of the irrigated CWU and totalfood grain production, respectively. Table 5, column 9,shows the possible water savings due to deficit irrigation onthe existing area as a percentage of existing NET. Table 5,column 10, shows the net gain in production if the savedwater is used again for additional grain production.
To illustrate, 251 districts — where more than 25% offood grain area is irrigated — will have 10% less food grainyield with a 25 mm deficit of CWU (Table 5, column 3).This group of districts account for 77 Mha (or 63%) of thetotal food grain area of the country and contribute 161 Mt(or 79%) of the total food grain production. A deficit CWUof 25 mm on existing irrigated area can save 14% of theNET requirement. If all the saved NET is used again forexpanding food grain production, it can contribute to 8%additional production. Similarly, a deficit CWU of 50 mmcan save 27% of NET and can increase production by 17%.
195Upali A. Amarasinghe, R.P. S. Malik and Bharat R. Sharma / Natural Resources Forum 34 (2010) 188–199
© 2010 The Authors. Journal compilation © 2010 United Nations
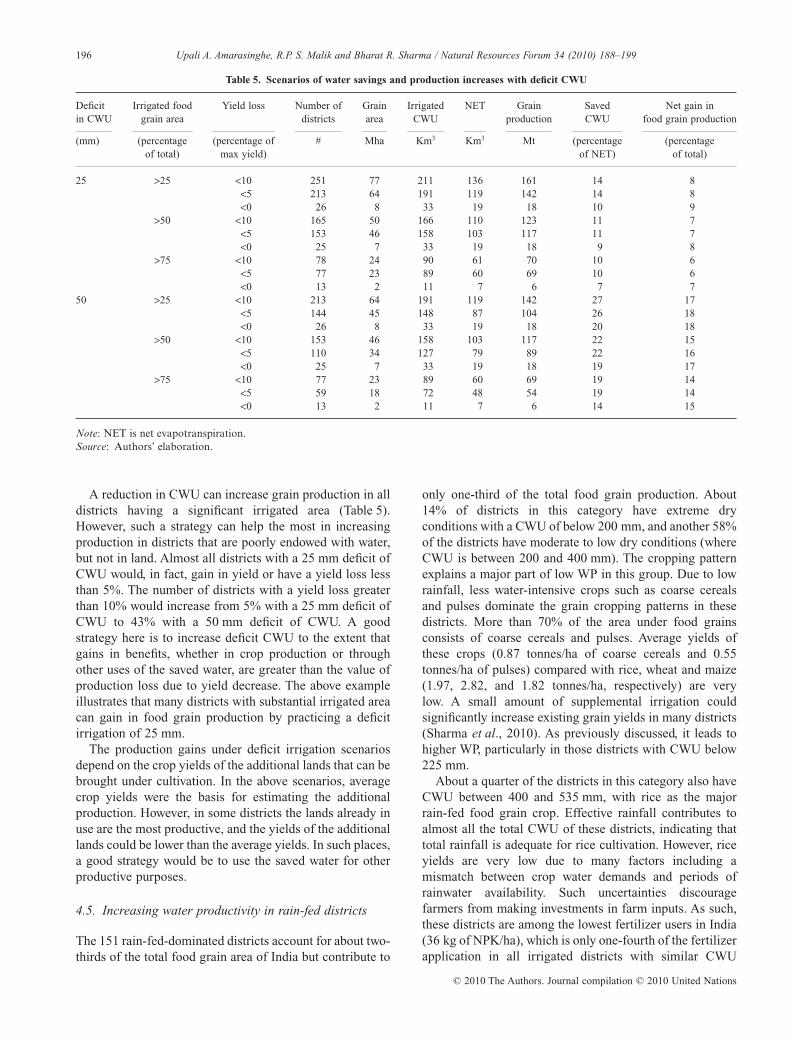
A reduction in CWU can increase grain production in alldistricts having a significant irrigated area (Table 5).However, such a strategy can help the most in increasingproduction in districts that are poorly endowed with water,but not in land. Almost all districts with a 25 mm deficit ofCWU would, in fact, gain in yield or have a yield loss lessthan 5%. The number of districts with a yield loss greaterthan 10% would increase from 5% with a 25 mm deficit ofCWU to 43% with a 50 mm deficit of CWU. A goodstrategy here is to increase deficit CWU to the extent thatgains in benefits, whether in crop production or throughother uses of the saved water, are greater than the value ofproduction loss due to yield decrease. The above exampleillustrates that many districts with substantial irrigated areacan gain in food grain production by practicing a deficitirrigation of 25 mm.
The production gains under deficit irrigation scenariosdepend on the crop yields of the additional lands that can bebrought under cultivation. In the above scenarios, averagecrop yields were the basis for estimating the additionalproduction. However, in some districts the lands already inuse are the most productive, and the yields of the additionallands could be lower than the average yields. In such places,a good strategy would be to use the saved water for otherproductive purposes.
4.5. Increasing water productivity in rain-fed districts
The 151 rain-fed-dominated districts account for about two-thirds of the total food grain area of India but contribute to
only one-third of the total food grain production. About14% of districts in this category have extreme dryconditions with a CWU of below 200 mm, and another 58%of the districts have moderate to low dry conditions (whereCWU is between 200 and 400 mm). The cropping patternexplains a major part of low WP in this group. Due to lowrainfall, less water-intensive crops such as coarse cerealsand pulses dominate the grain cropping patterns in thesedistricts. More than 70% of the area under food grainsconsists of coarse cereals and pulses. Average yields ofthese crops (0.87 tonnes/ha of coarse cereals and 0.55tonnes/ha of pulses) compared with rice, wheat and maize(1.97, 2.82, and 1.82 tonnes/ha, respectively) are verylow. A small amount of supplemental irrigation couldsignificantly increase existing grain yields in many districts(Sharma et al., 2010). As previously discussed, it leads tohigher WP, particularly in those districts with CWU below225 mm.
About a quarter of the districts in this category also haveCWU between 400 and 535 mm, with rice as the majorrain-fed food grain crop. Effective rainfall contributes toalmost all the total CWU of these districts, indicating thattotal rainfall is adequate for rice cultivation. However, riceyields are very low due to many factors including amismatch between crop water demands and periods ofrainwater availability. Such uncertainties discouragefarmers from making investments in farm inputs. As such,these districts are among the lowest fertilizer users in India(36 kg of NPK/ha), which is only one-fourth of the fertilizerapplication in all irrigated districts with similar CWU
Table 5. Scenarios of water savings and production increases with deficit CWU
Deficitin CWU
Irrigated foodgrain area
Yield loss Number ofdistricts
Grainarea
IrrigatedCWU
NET Grainproduction
SavedCWU
Net gain infood grain production
(mm) (percentageof total)
(percentage ofmax yield)
# Mha Km3 Km3 Mt (percentageof NET)
(percentageof total)
25 >25 <10 251 77 211 136 161 14 8<5 213 64 191 119 142 14 8<0 26 8 33 19 18 10 9
>50 <10 165 50 166 110 123 11 7<5 153 46 158 103 117 11 7<0 25 7 33 19 18 9 8
>75 <10 78 24 90 61 70 10 6<5 77 23 89 60 69 10 6<0 13 2 11 7 6 7 7
50 >25 <10 213 64 191 119 142 27 17<5 144 45 148 87 104 26 18<0 26 8 33 19 18 20 18
>50 <10 153 46 158 103 117 22 15<5 110 34 127 79 89 22 16<0 25 7 33 19 18 19 17
>75 <10 77 23 89 60 69 19 14<5 59 18 72 48 54 19 14<0 13 2 11 7 6 14 15
Note: NET is net evapotranspiration.Source: Authors’ elaboration.
196 Upali A. Amarasinghe, R.P. S. Malik and Bharat R. Sharma / Natural Resources Forum 34 (2010) 188–199
© 2010 The Authors. Journal compilation © 2010 United Nations

(135 kg of NPK/ha). Thus, an unreliable water supply solelyfrom rainfall seems to be a major impediment to properinput application and a contributing factor to low rice yieldin these districts.
Since it is the reliability of water and not the availabilitythat is a relatively more significant constraint in such areas,small supplemental irrigation during periods of inputapplication and during critical periods of water stress couldincrease the yield in these districts. Another option is tochange cropping patterns to best utilize the water supplyfrom rainfall. The demand for feed crops such as maize andvegetable oils is increasing rapidly and a substantial partof this demand is projected to be imported from othercountries (Amarasinghe et al., 2007). Thus, changingcropping patterns from low-yielding rice to high-yieldingmaize or oil crops, especially in the Rabi season (Novemberto April) could generate significant benefits for theseregions. In fact, soil moisture through rainfall could bemore than adequate for raising productive maize or oil cropsin these regions.
5. Discussion and conclusions
The assessment using district-level data shows thatsignificant potential exists for increasing the WP of foodgrains. This can be achieved by:
• Reducing the yield gap between the current andmaximum attainable yield in irrigated areas by keepingthe CWU constant;
• Increasing the yield by increasing CWU throughsupplemental irrigation in water-stressed rain-fed orstressed irrigated areas;
• Increasing the yield by reducing CWU through deficitirrigation in over-irrigated areas; or
• Increasing production by reducing CWU through deficitirrigation and possibly expanding the crop area.
Table 6 summarizes the interventions and outcomes inirrigated and rain-fed areas in districts with different levelsof CWU.
Supplementary irrigation can increase yield, WP or bothin areas where CWU is below 300 mm. In fact, CWU (orthe effective rainfall) of rain-fed areas in 156 districts fallsbelow the threshold of 225 mm. Supplemental irrigation inthese areas can increase both yield and WP. Irrigated areasof 16 districts and rain-fed areas of 110 more districtshave a CWU between 225 and 300 mm. Supplementalirrigation in these areas can increase yield, but mayreduce WP.
A substantial gap exists between the maximum andactual yield in districts with a CWU between 300 and475 mm. The CWU in irrigated areas of 202 districts andin rain-fed areas of 119 districts falls into this category.Major reasons for low yield in these high CWU regionsare the mismatches between application of croprequirements of water and non-water inputs. Bettermanagement of water and non-water inputs, particularly inirrigated areas, improves yield, leading to higherproduction and WP. In rain-fed areas, uncertainty ofrainfall is the major reason for less than optimalapplication of non-water inputs. If water availability is nota constraint, a small amount of supplementary irrigationcan improve input use, leading to increases in yield andproduction. Improvements in WP here depend on theextent of the increase in yield.
If supplemental irrigation in rain-fed areas with moderateCWU, i.e., between 300 and 475 mm, does not increase WP,these areas require different strategies. One option forimproving WP is to promote agricultural diversification tohigh-value crops and livestock. This should be done in areaswhere soil moisture is adequate for raising high-value non-grain crops or fodder that is required for livestock. This ismainly in areas in the upper end of the CWU levels that areclose to 475 mm.
Irrigated areas with high CWU can benefit by reducingCWU. This increases both yield and WP. The water savedfrom deficit irrigation can be used again to increase cropproduction, if land is not a limiting factor. If the latter is nottrue, the water saved can be used for productive purposes inother sectors. Irrigated areas in 185 districts, which accountfor 32% of the total irrigated food grain area, have a CWUof more than 475 mm.
Table 6. Interventions, outcomes and number of districts affected in different CWU zones
CWU range Interventions Outcome Number of districts to benefit
<225 mm • Additional irrigation
• Reduce yield gap• Increase WP and production • Rain-fed areas in 156 districts
225–300 mm • Reduce yield gap
• Small to moderate supplemental irrigation• Increase production but may decrease WP • Rain-fed areas in 110 districts
• Irrigated areas in 16 districts300–475 mm • Reduce yield gap
• Supplemental irrigation in rain-fed areas
• Deficit irrigation in irrigated areas
• Increase yield, production and WP • Rain-fed areas in 119 districts
• Irrigated areas in 202 districts
<475 mm • Reduce yield gap
• Deficit irrigation in irrigated areas• Increase yield, WP and production • Irrigated areas in 106 districts
197Upali A. Amarasinghe, R.P. S. Malik and Bharat R. Sharma / Natural Resources Forum 34 (2010) 188–199
© 2010 The Authors. Journal compilation © 2010 United Nations

Reducing crop consumption in irrigated areas, whereCWU is below 475 mm, can also increase grain WP.Although the crop yield will marginally decrease in thiscase, water saved through deficit irrigation and reduction ofCWU can be used again for expanding the cropped area.Our results show that irrigated areas in many districts withCWU between 425 and 475 mm also have the potential toincrease grain production. This, of course, will be possibleonly if additional productive cultivable land (which may becurrently fallow) is available for expansion of cropproduction. Moreover, the extent of additional productiondepends on the crop yields of these additional lands,which may be lower than the average yields of currentlycultivated lands.
We focused our attention on rain-fed areas with a highCWU. At present, the paddy crop dominates croppingpatterns in these areas and has a very low yield. This may bemainly due to cultivation of low-yielding local varieties ofrice and a mismatch between crop water demands andperiods of rainwater availability. Efforts should be made onboth of these fronts. Alternatively, these areas shoulddiversify their cropping patterns. One solution is todiversify the crops to include feed grains such as maize ornon-grain crops such as oil crops. Both these optionsrequire less CWU than rice and could also be moreproductive than the rice crop. With the increasing demandfor feed grains and vegetable oils, this could be a goodoption for these rain-fed regions.
In this paper, we have only discussed the potential forincreasing WP and production through water managementpractices. We have assumed that better water managementwould lead to better application of non-water inputs, whichin turn will increase the crop yield and WP. However, manyother factors affect the mode of water management, or cropor agricultural diversification, in different regions. Theyinclude reliability of power supply, availability of roads,access to markets, extension services, etc. To know howthese would influence the success in implementing differentwater management interventions would require more dataand further research.
Acknowledgements
The results of this paper are part of the findings from theStrategic Analysis of India’s River Linking Project, fundedby the CGIAR Challenge Program on Water and Food.
References
Amarasinghe, U.A., Shah, T., Singh, O.P., 2007. Changing ConsumptionPatterns: Implications for Food and Water Demand in India. Colombo,Sri Lanka: International Water Management Institute. (IWMI ResearchReport 119).
Amarasinghe, U.A., Shah, T., McCornick, P., 2008. Seeking calm waters:Exploring policy options for India’s water future, Natural ResourcesForum, 32(4): 305–315.
Cai, X., Rosegrant, M., 2003. World water productivity: Current situationand future options. In: Kijne, J.W., Barker, R. and Molden, D. (eds.),Water Productivity in Agriculture: Limits and Opportunities forImprovements, Comprehensive Assessment of Water Management inAgriculture Series 1. UK: CABI International.
FAI (Fertilizer Association of India), 2003a. Fertilizer and AgricultureStatistics, Northern Region 2002–2003. New Delhi, India.
FAI, 2003b. Fertilizer and Agriculture Statistics, Western Region2002–2003. New Delhi, India.
FAI, 2003c. Fertilizer and Agriculture Statistics, Eastern Region2002–2003. New Delhi, India.
FAI, 2003d. Fertilizer and Agriculture Statistics, Southern Region2002–2003. New Delhi, India.
GOI (Government of India), 2002. Consolidated Results of CropEstimation Survey on Principal Crops 2001–2002. New Delhi, India:National Sample Survey Organization, Ministry of Statistics.
GOI (Government of India), 2007. Agricultural Statistics at a Glance2007, New Delhi, India: Ministry of Agriculture.
IWMI (International Water Management Institute), 2001. IWMI Climateand Water Atlas, Colombo, Sri Lanka: International WaterManagement Institute. CD-ROM.
Kijne, J.W., Barker, R., Molden, D., 2003. Water Productivity inAgriculture: Limits and Opportunities for Improvements,Comprehensive Assessment of Water Management in AgricultureSeries 1. UK: CABI International.
Kirda, C., Kanber, R., 1999. Water, no longer a plentiful resource, shouldbe used sparingly in irrigated agriculture. In: Kirda, C., Moutonnet, P.,Hera, C., Nielsen, D.R. (eds.), Crop Yield Response to DeficitIrrigation, Dordrecht: Kluwer Academic Publishers.
Kumar, M.D., van Dam, J. (2009) Improving water productivity inagriculture in India: Beyond ‘more crop per drop’. In: Kumar, M.D.,Amarasinghe, U.A. (eds.), Improving Water Productivity in India:Potential, Prospects and Constraints. Strategic Analyses of theNational River Linking Project (NRLP) of India, Series 4, Colombo,Sri Lanka: International Water Management Institute.
Malhotra, S.P., 1982. The Warabandi and its Infrastructure. PublicationNo. 157, New Delhi, India: Central Board of Irrigation and Power.
Molden, D.J., 1997. Accounting for water use and productivity. IWMISWIM Paper 1. Colombo, Sri Lanka: International Water ManagementInstitute (IWMI).
Molden, D.J., Murray-Rust, H., Sakthivadivel, R., Makin, I., 2003. Awater-productivity framework for understanding and action. In: Kijne,J.W., Barker, R. and Molden, D. (eds.), Water Productivity inAgriculture: Limits and Opportunities for Improvements,Comprehensive Assessment of Water Management in AgricultureSeries 1. UK: CABI International.
Molden, D.J., Oweis, Y., 2007. Pathways for increasing agricultural waterproductivity. In: Molden, D. (ed.), Water for Food, Water for Life.Comprehensive Assessment of Water Management in Agriculture,London: Earthscan, and Colombo: International Water ManagementInstitute.
Oweis, Y., Hachum, A.Y., 2003. Improving water productivity in the dryareas of West Asia and North Africa. In. Water Productivity inAgriculture: Limits and Opportunities for Improvements, In: Kijne,J.W., Barker, R. and Molden, D. (eds.), Water Productivity inAgriculture: Limits and Opportunities for Improvements,Comprehensive Assessment of Water Management in AgricultureSeries 1. UK: CABI International.
Palanisami, K., Senthilvel, S., Ramesh, T., 2009.Water productivity atdifferent scales under canal, tank and well irrigation systems. In:Amarasinghe, U.A., Shah, T. and Malik, R.P.S. (eds.), India’s WaterFuture: Scenarios and issues. Strategic Analysis of National RiverLinking Project of India. Series 2. Colombo, Sri Lanka: InternationalWater Management Institute.
Perry, C.J., Narayanamurthy, S.G. 1998. Farmers response to rational anduncertain irrigation supplies, IWMI Research Report 52, Colombo, SriLanka: International Water Management Institute.
198 Upali A. Amarasinghe, R.P. S. Malik and Bharat R. Sharma / Natural Resources Forum 34 (2010) 188–199
© 2010 The Authors. Journal compilation © 2010 United Nations

Sakthivadivel, R., Thiruvengadachari, S., Amarasinghe, U.A., 1999.Modernization using the structured system design of the Bhakrareservoir project, India. An intervention analysis, IWMI ResearchReport 33, Colombo, Sri Lanka: International Water ManagementInstitute.
Seckler, D. 1996. New era of water resources management: From ‘dry’ to‘wet’ water savings, IWMI Research Report 1, Colombo, Sri Lanka:International Water Management Institute (IWMI).
Sharma, B., Rao, K.V., Vittal, K.P.R., Ramakrishna, Y.S., Amarasinghe, U.,2010. Estimating the potential of rain-fed agriculture in India:
prospects for water productivity improvements. Agricultural WaterManagement, 97(1): 23–30.
Steduto, P., Albrizio, R., 2005. Resource-use efficiency of field-grownsunflower, sorghum, wheat and chickpea. II. Water use efficiency andcomparison with radiation use efficiency. Agricultural and ForestMeteorology, 130: 269–281.
van Koppen, B., 1999. More Crops and Jobs per Drop. ManagingWater for Gendered Poverty Alleviation and Agriculture Growth.Colombo, Sri Lanka: International Water Management Institute(IWMI).
199Upali A. Amarasinghe, R.P. S. Malik and Bharat R. Sharma / Natural Resources Forum 34 (2010) 188–199
© 2010 The Authors. Journal compilation © 2010 United Nations
Related Documents