Outperforming the Benchmark: Identifying Investment Strategies for the US REIT Market using Google Trends Karim F. S. Rochdi | Marian Alexander Dietzel ERES 2014 Annual Meeting, Bucharest

Outperforming the Benchmark: Identifying Investment Strategies for the US REIT Market using Google Trends Karim F. S. Rochdi | Marian Alexander Dietzel.
Dec 23, 2015
Welcome message from author
This document is posted to help you gain knowledge. Please leave a comment to let me know what you think about it! Share it to your friends and learn new things together.
Transcript
Outperforming the Benchmark: Identifying Investment Strategies for the US REIT Market using Google TrendsKarim F. S. Rochdi | Marian Alexander Dietzel
ERES 2014 Annual Meeting, Bucharest

2
Textmasterformate durch Klicken bearbeiten
Agenda
1. Motivation and Theoretical Background
2. Data
3. Research Design and Methodology
4. Analysis and Findings
5. Conclusions
Outperforming the Benchmark: Identifying Investment Strategies for the US REIT Market using Google Trends
3
Textmasterformate durch Klicken bearbeiten
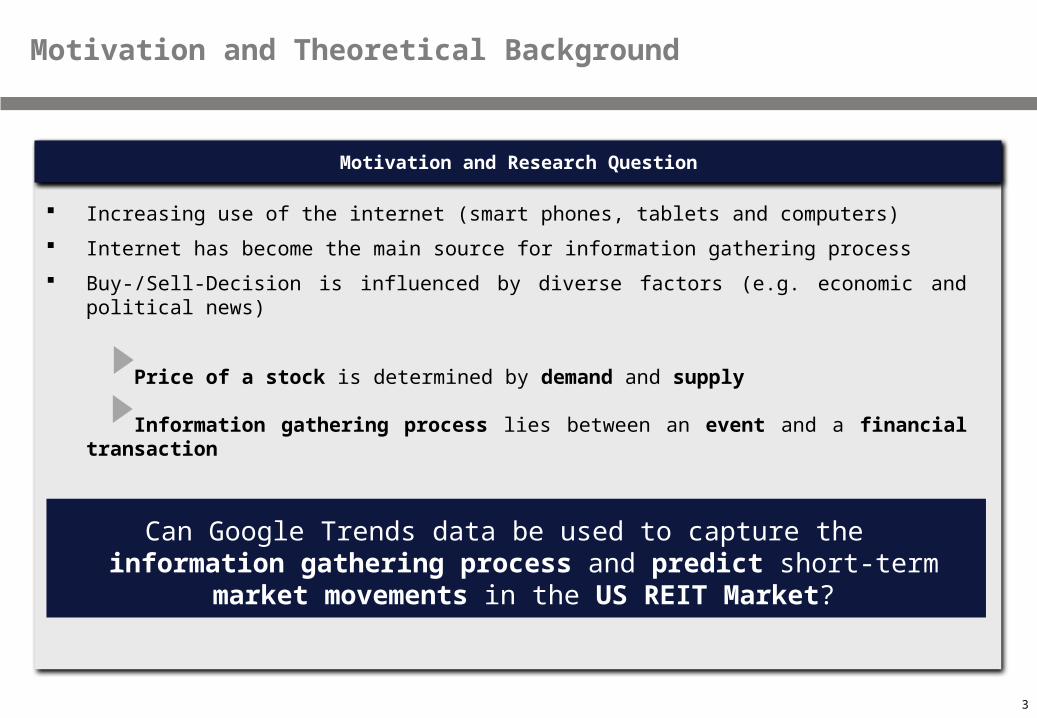
Can Google Trends data be used to capture the information gathering process and predict short-term market
movements in the US REIT Market?
Motivation and Theoretical Background
Increasing use of the internet (smart phones, tablets and computers)
Internet has become the main source for information gathering process
Buy-/Sell-Decision is influenced by diverse factors (e.g. economic and political news)
Price of a stock is determined by demand and supply
Information gathering process lies between an event and a financial transaction
Motivation and Research Question

4
Textmasterformate durch Klicken bearbeitenRelationship between Google Trends Data and Financial Markets
Motivation and Theoretical Background
Da, Z., Engelberg, J. and Gao, P. (2011), “In Search of Attention”, The Journal of Finance, Vol. 66 No. 5, pp. 1461-99.
Drake, M. S., Roulstone, D. T. and Thornock, J. R. (2012), “Investor Information Demand: Evidence from Google Searches Around Earning Announcements”, Journal of Accounting Research, Vol. 50 No. 4, pp. 1001-40.
Da, Z., Engelberg, J. and Gao, P. (2013). “The sum of all fears: investor sentiment and asset prices”. SSRN eLibrary.
Preis, T., Moat, H.S. and Stanley, E. (2013), “Quantifying Trading Behavior in Financial Markets Using Google Trends”, Nature - Scientific Reports, Vol. 3 No. 1684, pp. 1-6.
Kristoufek, L. (2013), “Can Google Trends search queries contribute to risk diversification?”, Nature - Scientific Reports, Vol. 3 No. 2713, pp. 1-5.
Main empirical findings are that Google Trends data are significantly related to trading activity, stock liquidity, volatility, earnings surprises and
market movements.

5
Textmasterformate durch Klicken bearbeitenRelationship between Google Trends Data and the Real Estate Market
Motivation and Theoretical Background
Beracha, E. and Wintoki, J. (2012), “Predicting Future Home Price Changes Using Current Google Search Data,” Journal of Real Estate Research, forthcoming.
Hohenstatt, R., Kaesbauer, M. and Schaefers, W. (2011), “’Geco’ and its Potential for Real Estate Research: Evidence from the U.S. Housing Market”, Journal of Real Estate Research, Vol. 33 No. 4., pp. 471-506.
Hohenstatt, R. and Kaesbauer, M. (2013), “GECO’s Weather Forecast’ for the U.K. Housing Market: To What Extent Can We Rely on Google ECOnometrics?”, Journal of Real Estate Research, forthcoming.
Wu, L. and Brynjolfsson, E. (2009), “The Future of Prediction: How Google Searches Foreshadow Housing Prices and Sales”, Working papers, Wharton School, University of Pennsylvania.
The studies demonstrate Google‘s predictive abilities for the real estate market on both a state and national level

6
Textmasterformate durch Klicken bearbeitenGoogle Data
Data
Search Volume Indices (SVI) derived from Google Trends (http://www.google.com/trends/)
Normalized values, scaled measured between 0 and 100
The weekly data covers search queries conducted from Sunday to Saturday.
Google Trends makes the newest weekly data available with an approximate two day delay.

7
Textmasterformate durch Klicken bearbeitenCluster Formation
Research Design and Methodology
Covering different aspects of real estate
real estate reits affordable housing properties+property real estate
management real estate broker …
Real Estate
Representing the mood, circumstances, desires
and fears of Google users
hate happy energy conflict cash health …
General Sentiment
Covering financial topics
fed bonds derivatives dividend currency investor …
Finance
8
Textmasterformate durch Klicken bearbeitenMeasuring Search Volume Change
Research Design and Methodology
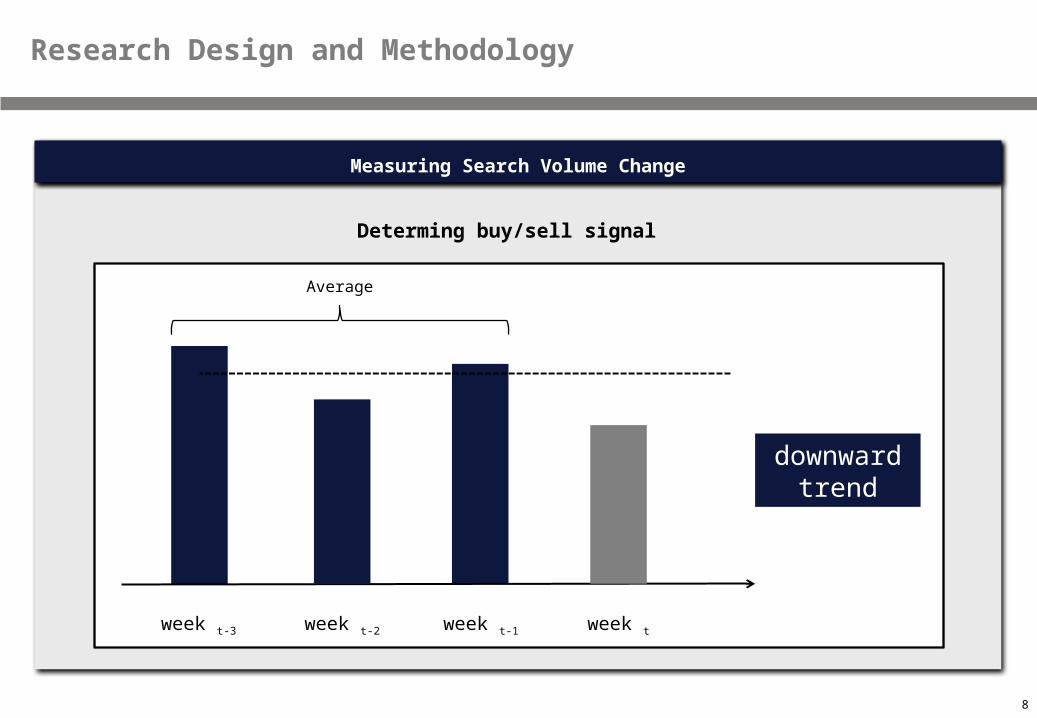
Determing buy/sell signal
Average
week t-3 week t-2 week t-1 week t
downward trend

9
Textmasterformate durch Klicken bearbeitenMeasuring Search Volume Change
Research Design and Methodology
Determing buy/sell signal
Average
week t-3 week t-2 week t-1 week t
upward trend
10
Textmasterformate durch Klicken bearbeitenDefinition of Search Volume (SV) Change
Research Design and Methodology
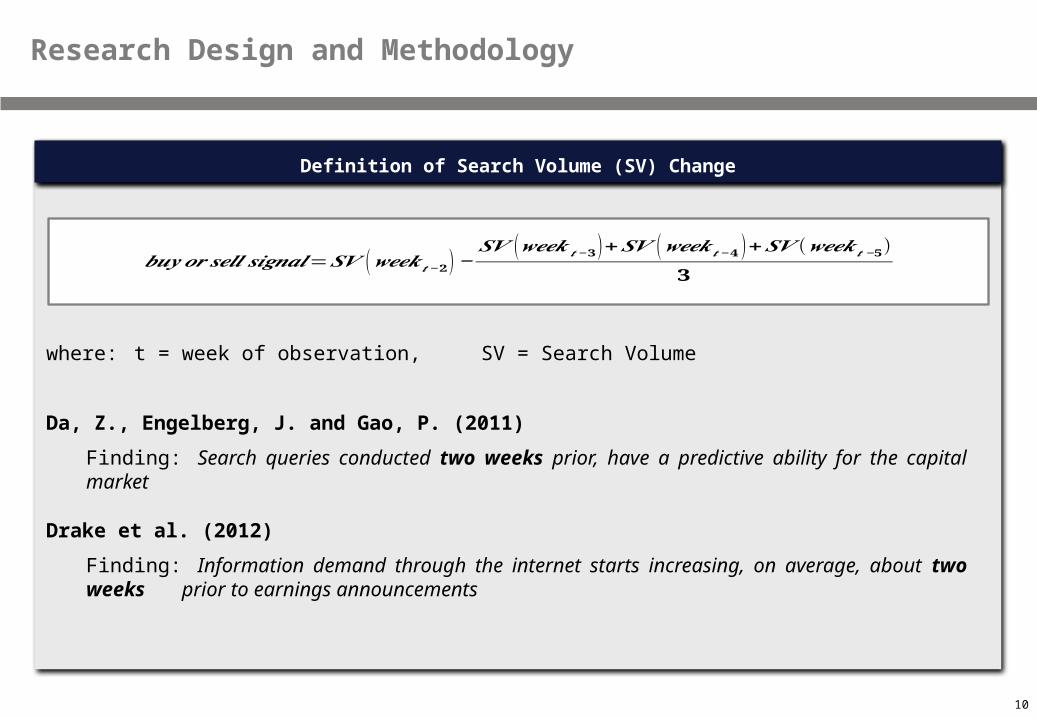
where: t = week of observation, SV = Search Volume
Da, Z., Engelberg, J. and Gao, P. (2011)
Finding: Search queries conducted two weeks prior, have a predictive ability for the capital market
Drake et al. (2012)
Finding: Information demand through the internet starts increasing, on average, about two weeks prior to earnings announcements
𝒃𝒖𝒚 𝒐𝒓 𝒔𝒆𝒍𝒍 𝒔𝒊𝒈𝒏𝒂𝒍=𝑺𝑽 (𝒘𝒆𝒆𝒌𝒕−𝟐 )−𝑺𝑽 (𝒘𝒆𝒆𝒌𝒕−𝟑 )+𝑺𝑽 (𝒘𝒆𝒆𝒌𝒕−𝟒 )+𝑺𝑽 (𝒘𝒆𝒆𝒌𝒕−𝟓)
𝟑
11
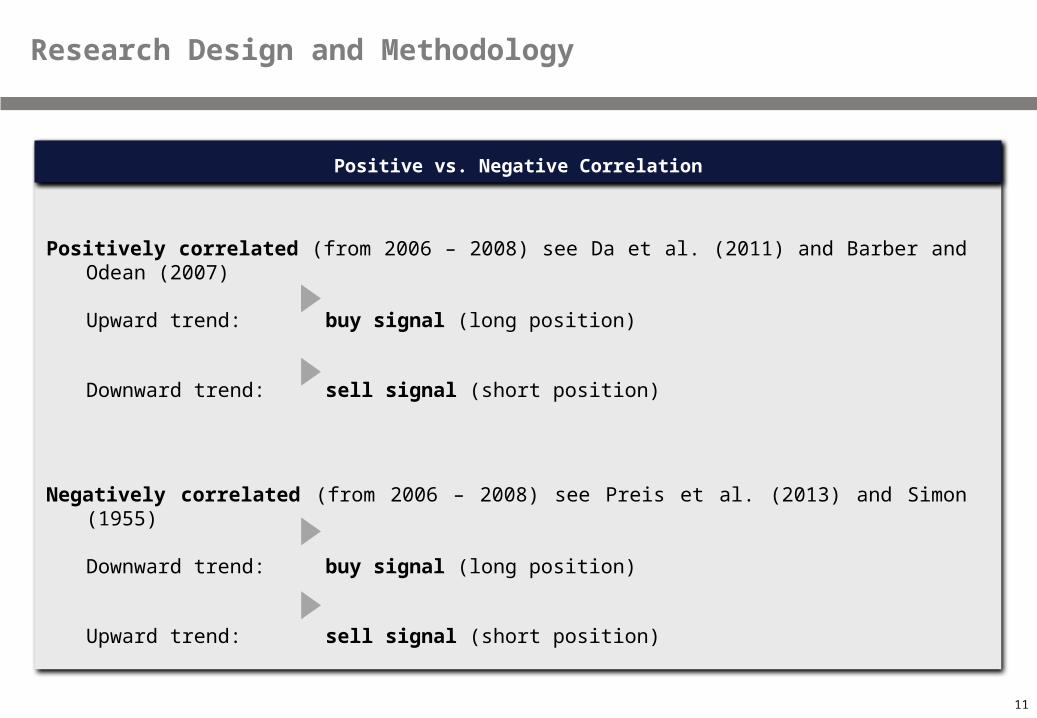
Textmasterformate durch Klicken bearbeitenPositive vs. Negative Correlation
Research Design and Methodology
Positively correlated (from 2006 – 2008) see Da et al. (2011) and Barber and Odean (2007)
Upward trend: buy signal (long position)
Downward trend: sell signal (short position)
Negatively correlated (from 2006 – 2008) see Preis et al. (2013) and Simon (1955)
Downward trend: buy signal (long position)
Upward trend: sell signal (short position)

12
Textmasterformate durch Klicken bearbeiten
Reinvestment Strategy
First Trade: Monday, February 20, 2006
Last Trade: Monday, December 30, 2013
Reinvestment assumption
Absolute Investment Performance (AIP):
Conventional Strategies
Buy-and-Hold-Strategy: 1.58 % (0.20 % p. a.)
Random Strategy (purely random signals): 72.27 % (7.04 % p. a.)
Momentum Strategy: -53.5 % (-9.13 % p. a.)
𝐴𝐼𝑃= 𝑉𝑎𝑙𝑢𝑒𝑤𝑒𝑒𝑘 411𝑉𝑎𝑙𝑢𝑒𝑤𝑒𝑒𝑘 1 − 1
Methodology
Research Design and Methodology

13
Textmasterformate durch Klicken bearbeitenPerformance Ranking (Top 15)
Empirical Results
Rank Category Search Terms AIP p.a. AIP Rolling 6-month
returnsRolling 6-month
risk of loss Hit Rate
1 real estate properties+property 47,8% 2181,6% 31,7% 27,9% 57,1%2 real estate condos 43,5% 1696,9% 37,2% 27,6% 54,9%3 real estate realty trust+realty trusts 43,1% 1656,2% 27,4% 35,8% 54,0%
4 real estateflip house+flip houses+flipping house+flipping houses
42,0% 1554,8% 29,5% 33,2% 53,2%
5 real estate Real Estate Agencies 38,6% 1262,8% 29,0% 27,6% 53,0%6 real estate realtor+realtors 35,8% 1054,7% 30,1% 34,3% 53,2%7 real estate Real Estate_cat 34,0% 940,1% 31,5% 39,4% 52,8%8 real estate apartments+apartment 32,9% 872,2% 27,7% 34,0% 52,3%9 real estate Real Estate Listings 31,1% 772,0% 32,0% 40,2% 52,5%
10 real estatereal estate agent+real estate agents+real estate agencies
30,0% 715,8% 26,9% 35,3% 53,2%
11 real estateremax+re/max+zillow+trulia+yahoo homes+redfin+frontdoor+apartmentguide+curbed+ziprealty+hotpads
29,8% 707,8% 28,3% 47,3% 52,5%
12 real estate real estate company+real estate companies 29,6% 695,1% 19,5% 32,0% 56,6%13 finance earnings 29,6% 693,8% 17,8% 26,1% 54,0%14 finance Credit & Lending 28,9% 660,4% 15,9% 24,8% 54,7%15 general politics 27,6% 601,0% 21,2% 32,0% 50,1%
58 conventional RANDOM 7,04% 72,27% 3,78% 50,00% 49,99%87 conventional BUY-AND-HOLD 0,2% 1,6% 2,8% 39,1% -128 conventional MOMENTUM -9,13% -53,5% -3,2% 56,3% 48,9%
.. .. .. ..
..
.. .. .. ..
14
Textmasterformate durch Klicken bearbeiten
-1000%
-500%
0%
500%
1000%
1500%
2000%
2500%
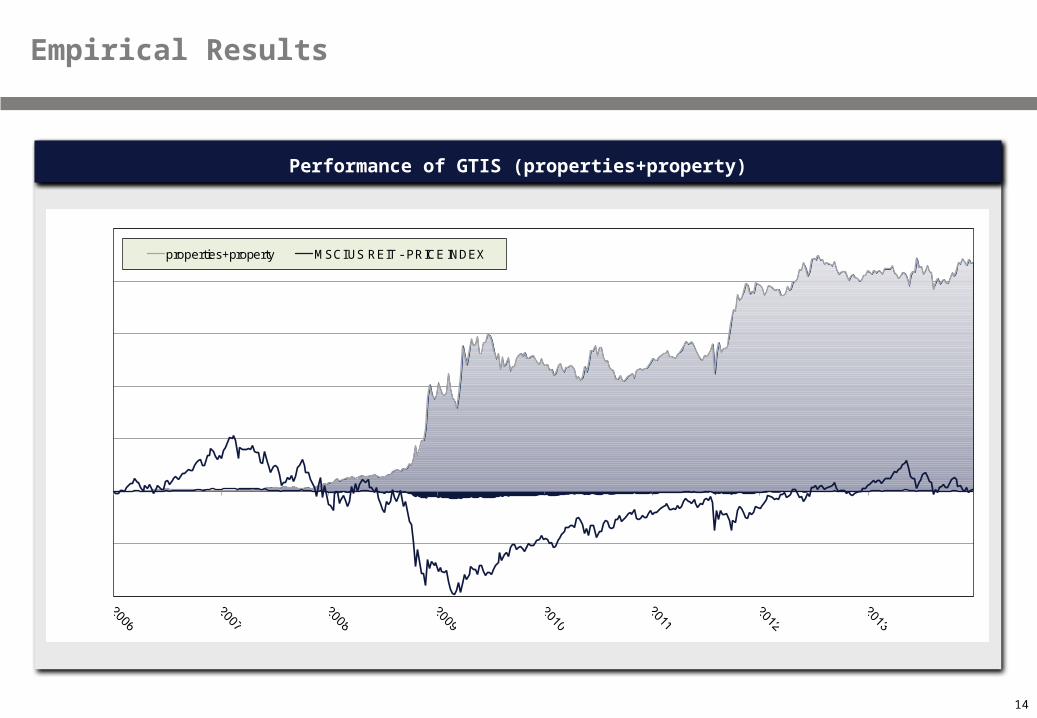
properties+property MSCI US REIT - PRICE INDEX
Performance of GTIS (properties+property)
Empirical Results

15
Textmasterformate durch Klicken bearbeitenPerformance Measures (sub periods)
Empirical Results
Rank Category Search Terms AIP p.a.Rolling 6-month
returns AIP p.a.Rolling 6-month
returns AIP p.a.Rolling 6-month
returns
1 real estate properties+property 47,8% 31,7% 84,0% 28,0% 5,2% 1,8%2 real estate condos 43,5% 37,2% 108,6% 59,1% 18,1% 8,5%3 real estate realty trust+realty trusts 43,1% 27,4% 64,4% 28,2% -7,1% -5,1%
4 real estateflip house+flip houses+flipping house+flipping houses
42,0% 29,5% 100,1% 36,3% 4,5% -0,1%
5 real estate Real Estate Agencies 38,6% 29,0% 58,3% 19,6% 28,7% 13,7%6 real estate realtor+realtors 35,8% 30,1% 86,1% 34,7% 14,0% 7,0%7 real estate Real Estate_cat 34,0% 31,5% 130,7% 65,0% 12,9% 4,3%8 real estate apartments+apartment 32,9% 27,7% 109,9% 50,8% 5,4% 0,7%9 real estate Real Estate Listings 31,1% 32,0% 94,7% 52,3% -6,0% -4,1%
10 real estatereal estate agent+real estate agents+real estate agencies
30,0% 26,9% 45,5% 20,4% 10,2% 4,8%
11 real estateremax+re/max+zillow+trulia+yahoo homes+redfin+frontdoor+apartmentguide+curbed+ziprealty+hotpads
29,8% 28,3% 102,6% 58,6% 2,4% -1,3%
12 real estate real estate company+real estate companies 29,6% 19,5% 9,0% 8,7% 8,8% 5,3%13 finance earnings 29,6% 17,8% 92,0% 45,4% 15,5% 6,2%14 finance Credit & Lending 28,9% 15,9% 53,2% 21,2% 20,9% 9,0%15 general politics 27,6% 21,2% 73,2% 25,4% 23,0% 13,3%
CRISIS (09/15/2008 - 02/21/2011) RECENT YEARS (2012-2013)OVERALL (2006 - 2013)
58 conventional RANDOM 7,0% 3,8% 15,8% 6,3% 1,0% 0,6%87 conventional BUY-AND-HOLD 0,2% 2,8% 0,1% 15,6% 6,4% 2,8%128 conventional MOMENTUM -9,1% -3,2% -1,7% -6,4% 11,9% 6,2%
.. .. .. .. .. .. .. ....
16
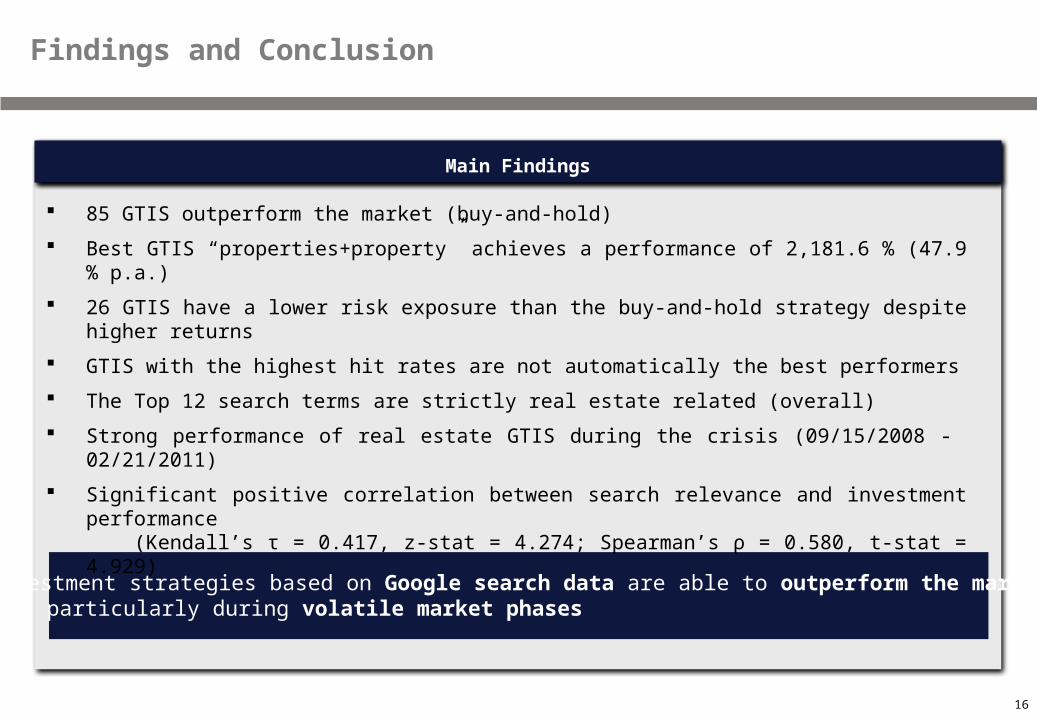
Textmasterformate durch Klicken bearbeitenMain Findings
Findings and Conclusion
85 GTIS outperform the market (buy-and-hold)
Best GTIS “properties+property” achieves a performance of 2,181.6 % (47.9 % p.a.)
26 GTIS have a lower risk exposure than the buy-and-hold strategy despite higher returns
GTIS with the highest hit rates are not automatically the best performers
The Top 12 search terms are strictly real estate related (overall)
Strong performance of real estate GTIS during the crisis (09/15/2008 - 02/21/2011)
Significant positive correlation between search relevance and investment performance(Kendall’s τ = 0.417, z-stat = 4.274; Spearman’s ρ = 0.580, t-stat = 4.929)
Investment strategies based on Google search data are able to outperform the market particularly during volatile market phases
17
Textmasterformate durch Klicken bearbeitenIdentifying Investment Strategies for the US REIT Market using Google Trends
Outperforming the Benchmark
Thanks for listening. Feel free to ask any questions
Related Documents