Outline: - Basic understandings: Relaxation Chemical exchange - Mapping interactions: -Chemical shift mapping (fast exchange) Linewidth analysis (slow exchange) -Cross saturation transfer -Transfer NOE/STD NMR -Half filter exepriments/isotope labeling NMR-lecture April 6th, 2009, FMP Berlin Christian Freund

Welcome message from author
This document is posted to help you gain knowledge. Please leave a comment to let me know what you think about it! Share it to your friends and learn new things together.
Transcript
Outline:
- Basic understandings:Relaxation
Chemical exchange
- Mapping interactions:-Chemical shift mapping (fast exchange)
Linewidth analysis (slowexchange)
-Cross saturation transfer-Transfer NOE/STD NMR-Half filter exepriments/isotope labeling
NMR-lecture April 6th, 2009, FMP Berlin
Christian Freund

Monitoring protein:protein interactions:Capitalizing on chemical shift and relaxation rate changes
In the absence of of an applied rf field, the Bloch equations are defined as:
dMx(t)dt = Ω My(t) R2Mx(t)
dMy(t)dt = Ω Mx(t) R2My(t)
dMz(t)dt = ΩMz(t) M0
Formal solution : ∆Mz(t) = e-Rt∆Mz(0)
In the case of chemical exchange it is :
dMz(t)dt = (Ω + K)∆Mz(t)
dMxy(t)dt = (Ω − R2 + K)Mxy(t)
R = ρI σIS
σIS ρS[ ]

Transitions between states in a two-spin system
σ = W2-W0
σij ~ 1/rij6 * [6J(2ω0) – J(0)]
αα
βα
ββ
αβ
WI(1)
WI(2)WS(1)
WS(2)
W2
W0

Relaxation times depend on the overall tumbling time of molecules which is proportional to molecular weight
kT
rc 3
4 3πητ =Biochemistry, Vol. 28, No. 23, 1989

Bo
z
xy
T1
Measuring T1 from inversion recovery pulse sequence
z
x
y
π
z
x
y
z
x
y
π/2
T1 relaxation

Inversion Recovery
τ
z
x
y
z
x
y
z
x
y
π/2
z
x
y
π/2
τ
z
x
y
π/2
180° 90°
90°
90°
Measuring T1 relaxation times
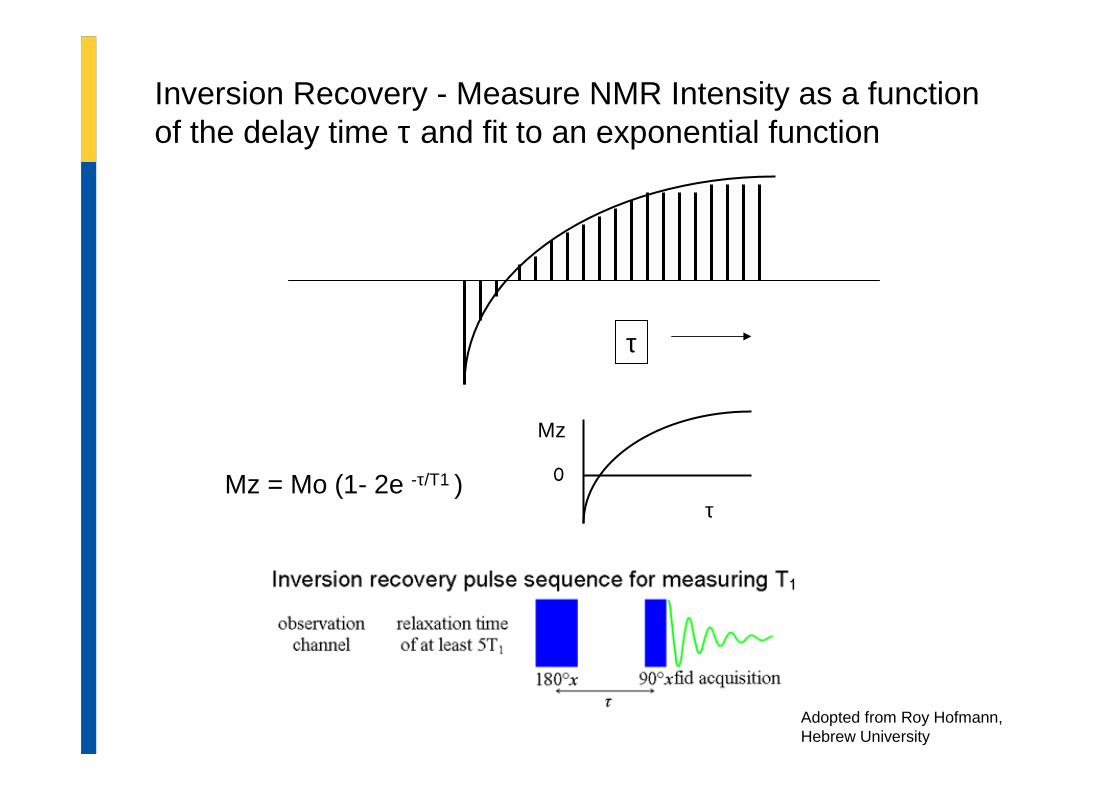
Inversion Recovery - Measure NMR Intensity as a function of the delay time τ and fit to an exponential function
τ
Mz = Mo (1- 2e -τ/T1 )
Mz
τ
0
Adopted from Roy Hofmann,Hebrew University

The inversion recovery experiment yields T1 values fordifferent signals that may have different relaxation times
residualH2O
CH3 group
Example: Ethylbenzene in CDCl3

time
Currentamplitude
frequency
time
Currentamplitude
frequency
T2 relaxation leads to line-width broadening

Spin-echo pulse sequence for measuring T2
Example: Ethylbenzene in CDCl3


Conformationalequilibrium
Chemicalequilibrium
Kex
KB
temp
Slow exchange - two distinct resonances
Fast exchange - onesharp average resonance
Intermediate exchange - onebroad resonance
Chemical exchange complicates matters

Published in: Hiroshi Matsuo; Kylie J. Walters; Kenta Teruya; TakeyukiTanaka; George T. Gassner; Stephen J. Lippard; Yoshimasa Kyogoku; Gerhard Wagner; J. Am. Chem. Soc. 1999, 121, 9903-9904.
Changing R2 of the bound state: 500,250,100,50 and 23 s-1. No chemical shiftdifference of free and bound state
500 Hz
Same parameters used as above. R2 (free)is 23 s-1 and koff = 200 s-1. The fraction of free protein is 0.5.
R2 (bound) is set to 250 s-1 and chemicalshifts are varied : 500, 250, 100, 50 and 23 Hz
Linewidth simulations for slow exchange interactions
I(ω) ~ Re W *A-1*1A = i(Ω – ωE) + K + R

Mapping protein interactions:

Reference against: 2,2-dimethyl-2-silapentane-5-sulfonic acid (DSS)
Chemical shift as a measure of chemical environment :

http://www.cs23d.ca/
Structure refinement via CSI
Predicting protein chemical shifts via CSI
Berjanskii & Wishart, Nature Protocols 1, - 683 - 688 (2006)

Wt(rot)/Y33A(grün)
G32
W8W28
F34
Y33S30
V29Y39
Chemical shift changes :a single non-disruptive mutation
GYF domain
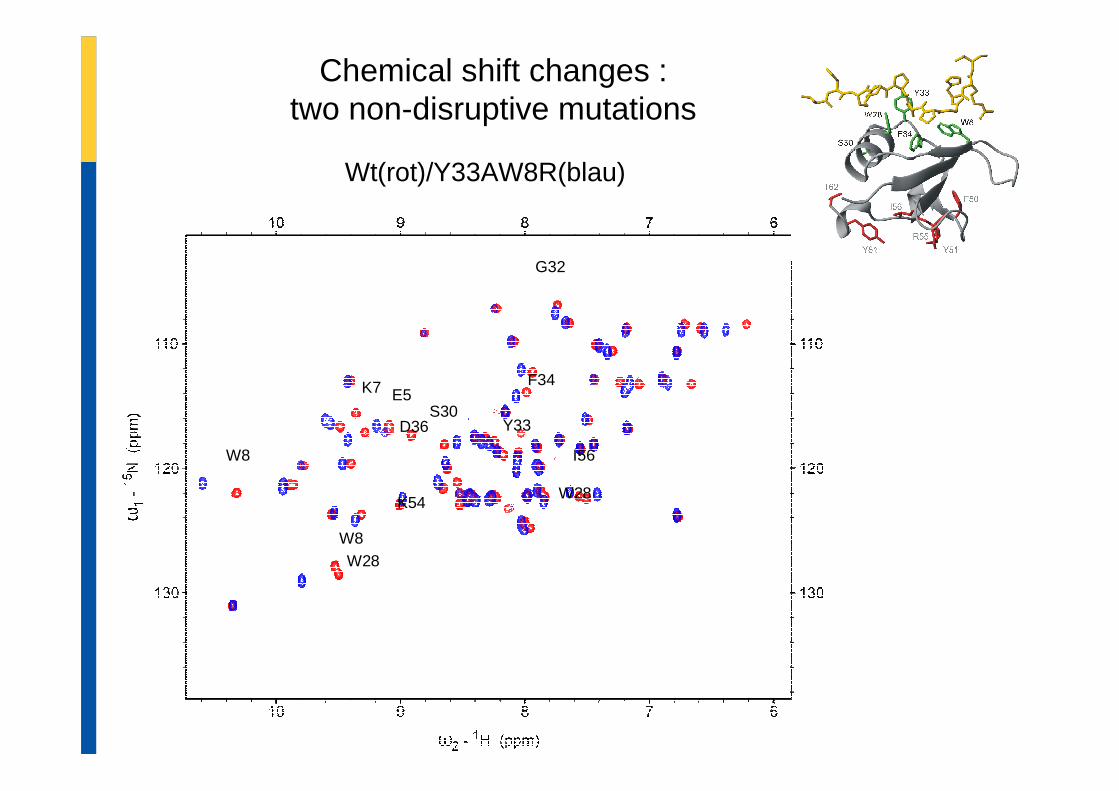
Wt(rot)/Y33AW8R(blau)
G32
W8W28
F34
Y33
W8
K7 E5
D36
W28
I56
K54
S30
Chemical shift changes :two non-disruptive mutations

Wt(rot)/Wt_SmB(grün)
G32
W8 NeW28 Ne
F34
W8
D36
W28
I56
K54
T21
S30
V29
Y33M25
F20
Chemical shift changes:Fast exchange: GYF binding to spliceosomal SmB

Y33A(rot)/Y33A_SmB(grün)
G32
W8 NeW28 Ne
F34
W8
D36
W28
I56
K54
T21
S30
V29
Y33M25
F20
Binding of the single-site mutant

Y33AW8R(rot)/Y33AW8R_SmB(grün)
(Non-)Binding of the double mutant

Slow exchange: Linewidth analysis can be used to map binding sites
koff values of 3.2 s−1 (A) or 25.6 s−1 (B) for chemical shift differencesof 0 Hz (black) and 500 Hz (red). R 1, R 2, and a are 23 Hz, 250 Hz, and 0.8, respectively
Walters et al., PNAS 1999, 96, 7877-7882


STD-NMR can be used to observe binding in complex mixtures
J. Am. Chem. Soc., 2005, 127 (3), pp 916–919

Variant: Selective protonation of an otherwise deuterated donor protein
Takahashi et al., Nat. Struct. Biol.(2000)
Cross saturation: detection of 15NH groups of a deuterated acceptor protein
Igarashi et al., JACS 2008

Selective protonation of amino acids with different efficiencies
Arginine
Asparate
Feasible for: Ala, Arg, Cys,Gly, His, Ile, Leu, Lys, Met, Phe, Pro, Trp, and Tyr
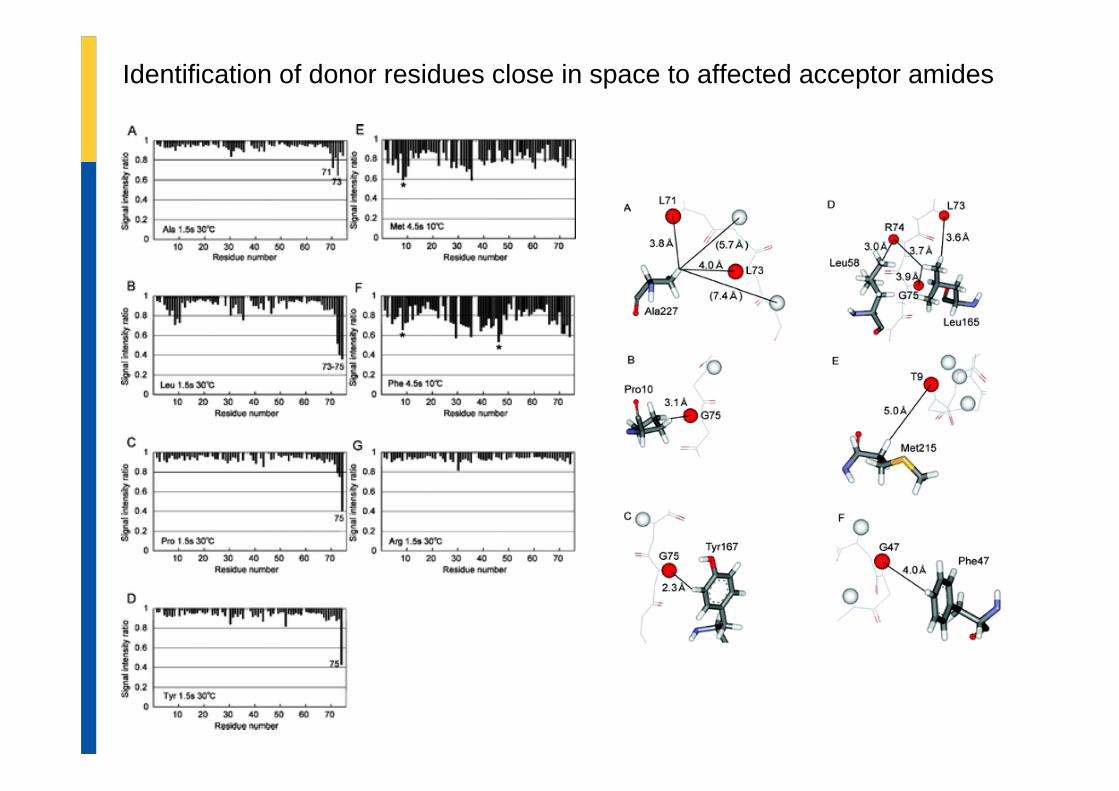
Identification of donor residues close in space to affected acceptor amides

Identification of donor and acceptor interfaces

..to be continued in later sessions

Paramagnetic relaxation enhancement
Iwahara & Clore,Nature, 2006

At higher salt concentrations, T2 relaxation data cannot beexplained by the specific complex
∑Γ2obs(i)–Γ2
calc(i)
∑ Γ2obs(i)2
Q=( )
Model system:Homeodomain of humanHOXD9 in complex with a24-base-pair DNA duplex
Incorporation of conjugateddeoxy(d)T-EDTA-Mn2+ intothe DNA
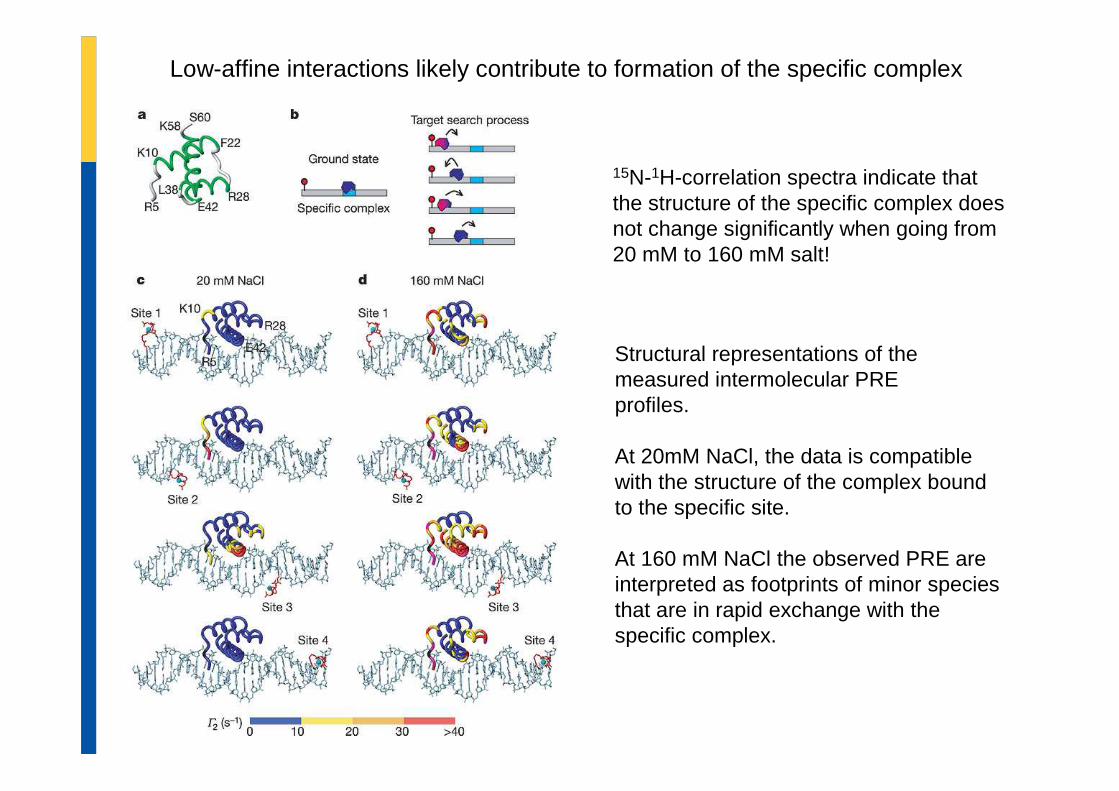
Low-affine interactions likely contribute to formation of the specific complex
Structural representations of themeasured intermolecular PRE profiles.
At 20mM NaCl, the data is compatiblewith the structure of the complex boundto the specific site.
At 160 mM NaCl the observed PRE areinterpreted as footprints of minor speciesthat are in rapid exchange with thespecific complex.
15N-1H-correlation spectra indicate thatthe structure of the specific complex doesnot change significantly when going from20 mM to 160 mM salt!
Related Documents