Outline In-Class Experiment on the Provision of Public Good Test of Free-Rider Hypothesis I: Marwell and Ames (1979) Test of Free-Rider Hypothesis II: Marwell and Ames (1980) Test of Free-Rider Hypothesis III: Issac and Walker (1988)

Outline
Jan 03, 2016
Outline. In-Class Experiment on the Provision of Public Good Test of Free-Rider Hypothesis I: Marwell and Ames (1979) Test of Free-Rider Hypothesis II: Marwell and Ames (1980) Test of Free-Rider Hypothesis III: Issac and Walker (1988). Public Good Experiments. - PowerPoint PPT Presentation
Welcome message from author
This document is posted to help you gain knowledge. Please leave a comment to let me know what you think about it! Share it to your friends and learn new things together.
Transcript
OutlineIn-Class Experiment on the Provision of Public Good
Test of Free-Rider Hypothesis I: Marwell and Ames (1979)
Test of Free-Rider Hypothesis II: Marwell and Ames (1980)
Test of Free-Rider Hypothesis III: Issac and Walker (1988)

Public Good Experiments
iii mmZ and
mmGSmZUij
jiiiii ))((
) and 1
ij
jiii mG(mSV
Z i
Individual endowment is and n individuals in a group
Invest in Private and Public exchanges:
i’s returns from Private and Public exchanges are:
Individual’s utility function:
Basic Insight
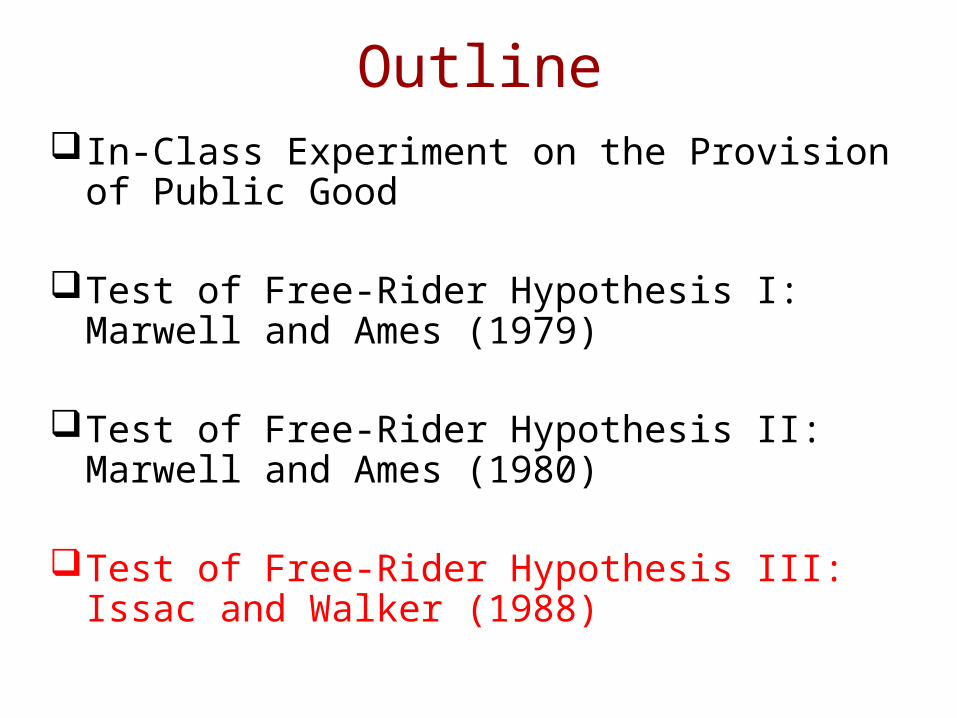
nSi
1If , then as n increases Vi = MPCR (marginal per
capital return) drops.
So it is unclear whether group size effect is due to changes in Vi = MPCR or changes in group size n.
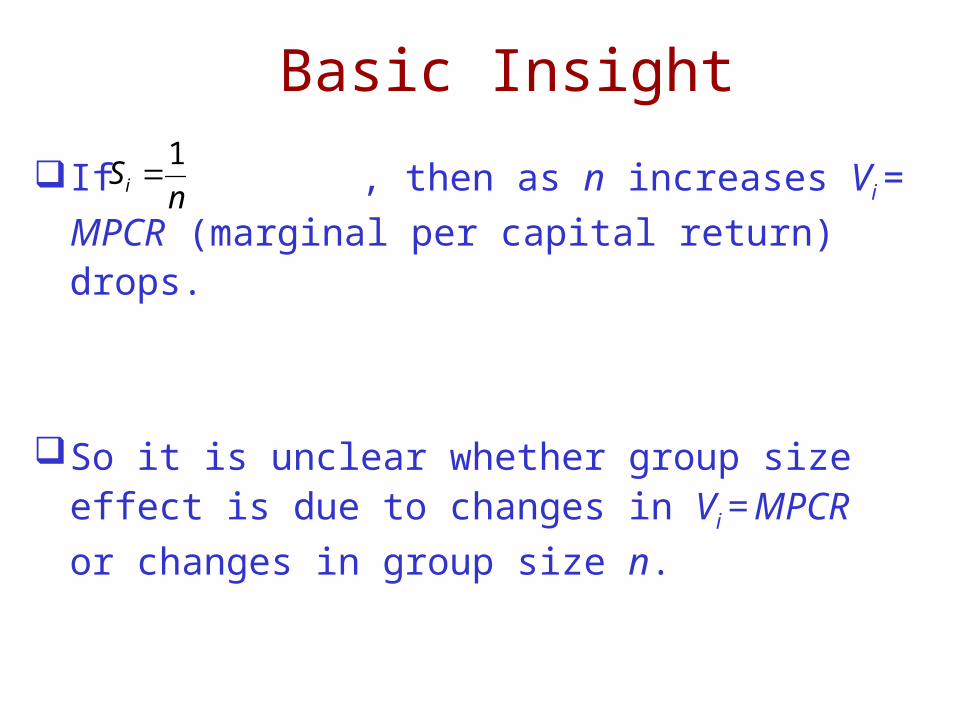
Three Possible Treatments
The effect of altering MPCR but holding n constant
The effect of altering n but adjusting G(.) function so that MPCR remains constant
The combination effect in which altering n also altering MPCR.
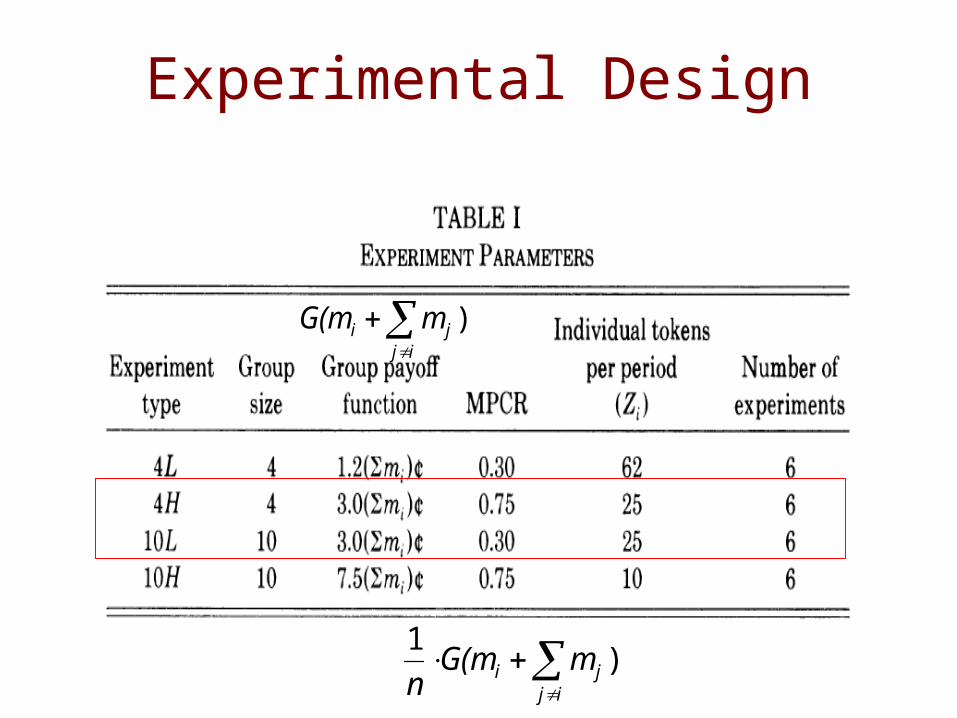
Experimental Design
)1
ij
ji mG(mn
)
ij
ji mG(m
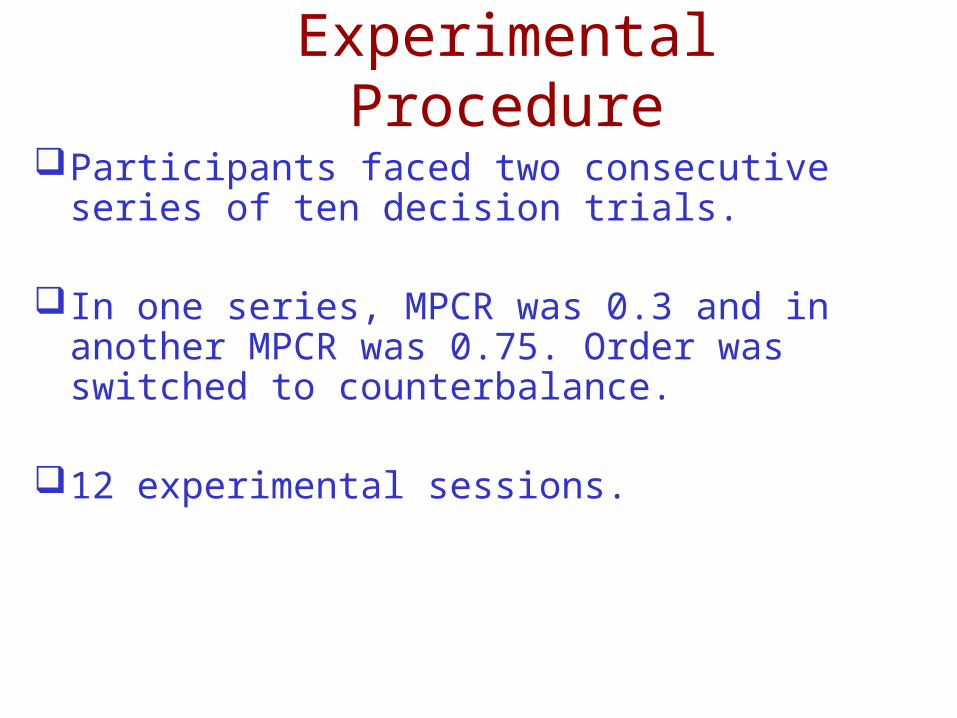
Experimental Procedure
Participants faced two consecutive series of ten decision trials.
In one series, MPCR was 0.3 and in another MPCR was 0.75. Order was switched to counterbalance.
12 experimental sessions.
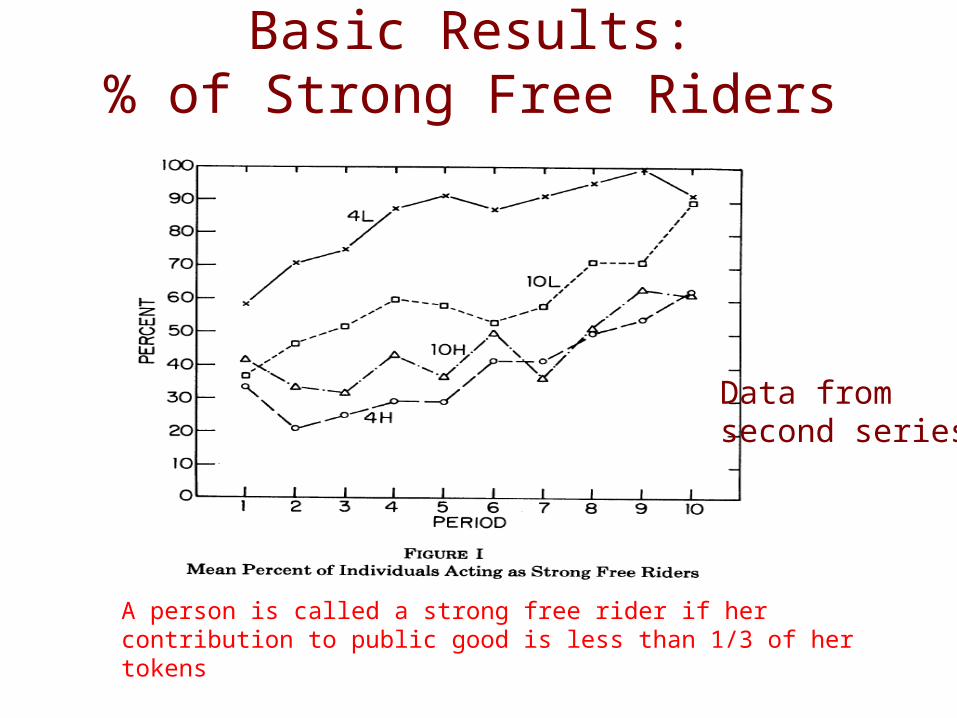
Basic Results:% of Strong Free Riders
A person is called a strong free rider if her contribution to public good is less than 1/3 of her tokens
Data fromsecond series
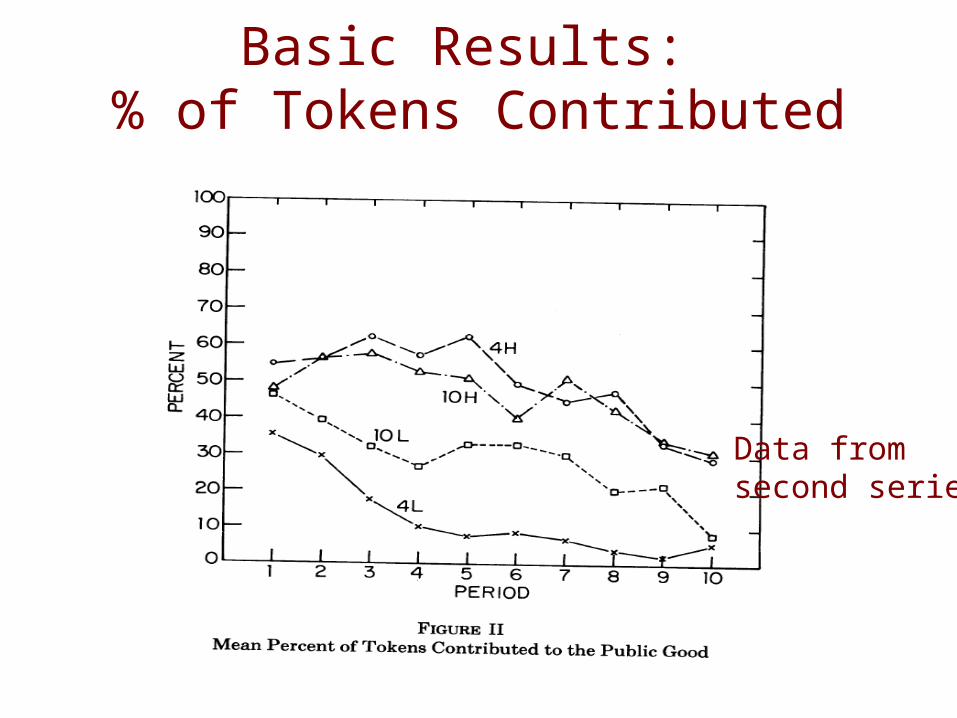
Basic Results: % of Tokens Contributed
Data fromsecond series
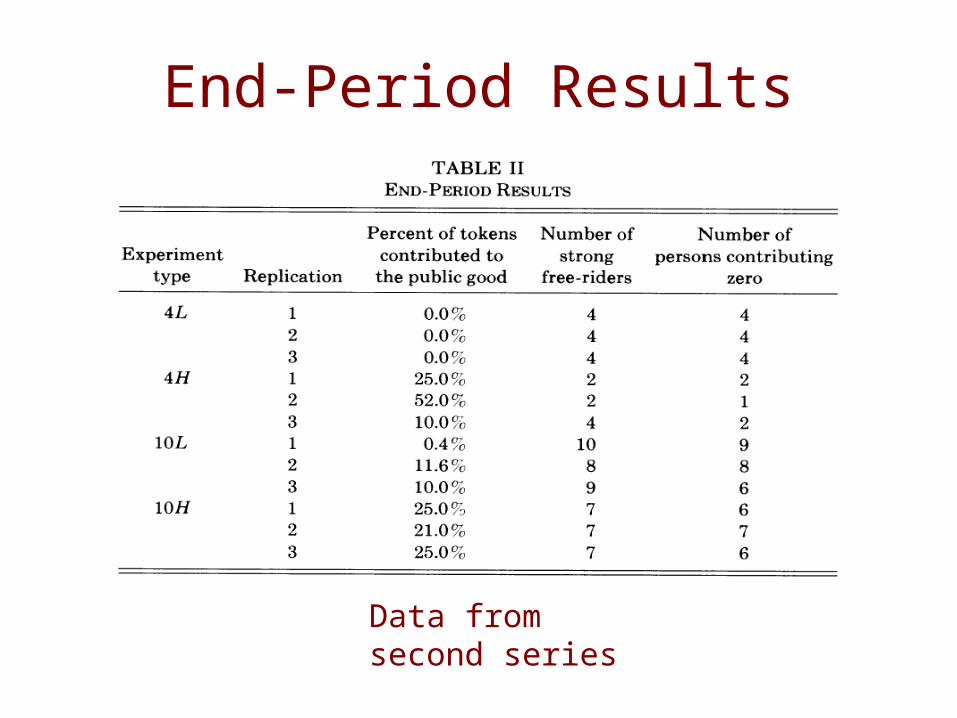
End-Period Results
Data fromsecond series
Key Observations
Observation 1: Lowering the MPCR from 0.75 to 0.3 appears to increase significantly the incidence of free-rider behavior.
Observation 2: There are weak, if any, effects of changes in group size from four to ten (holding MPCR constant)

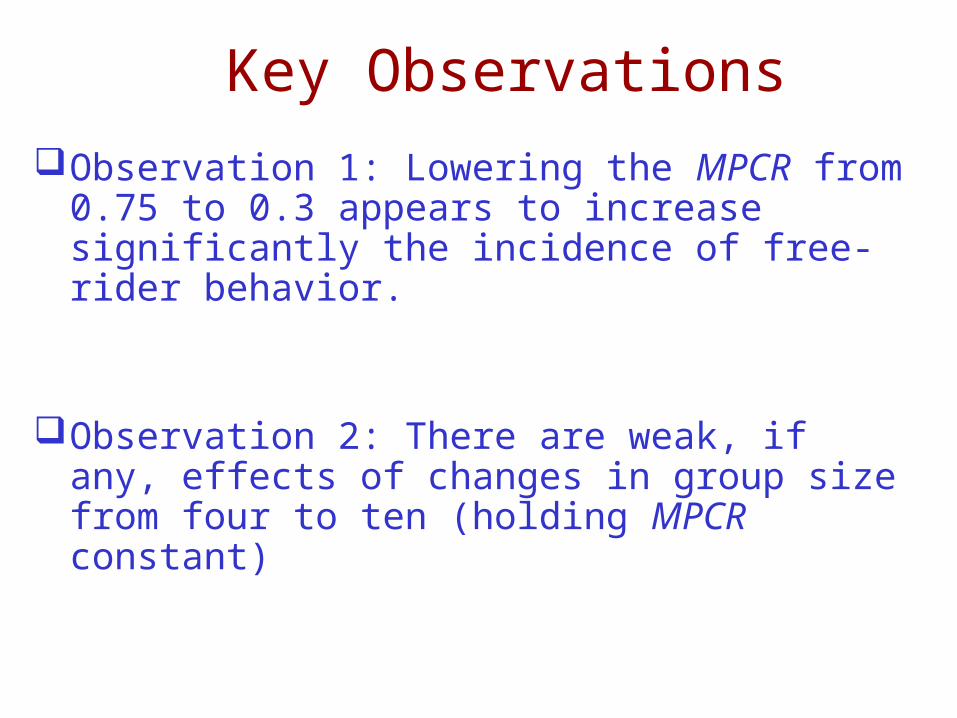
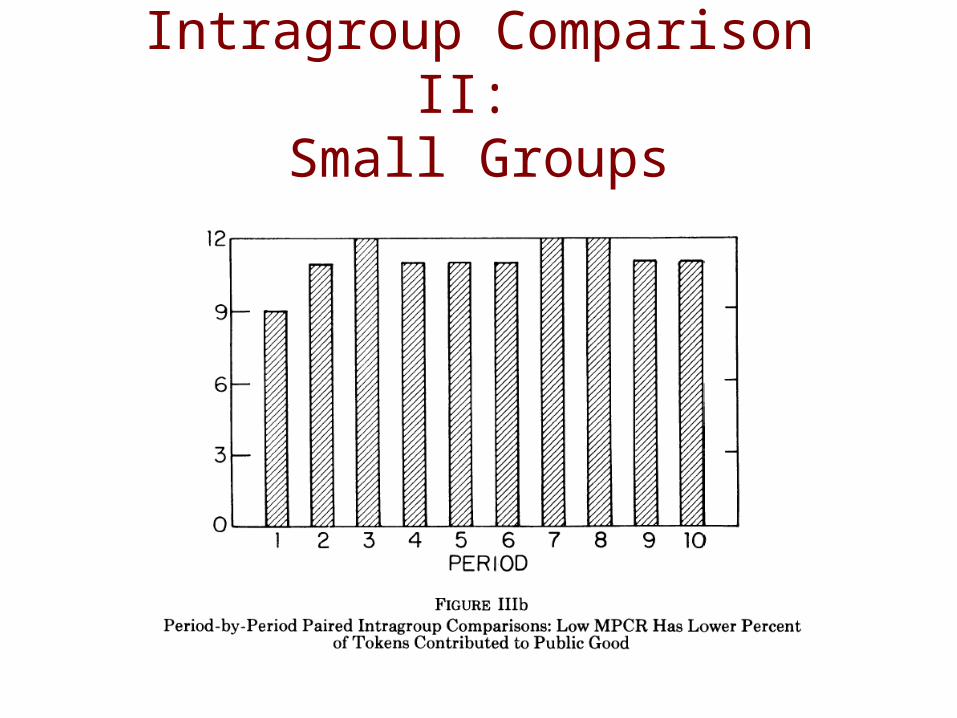
Intragroup Comparison I: Small Groups
Intragroup Comparison II: Small Groups
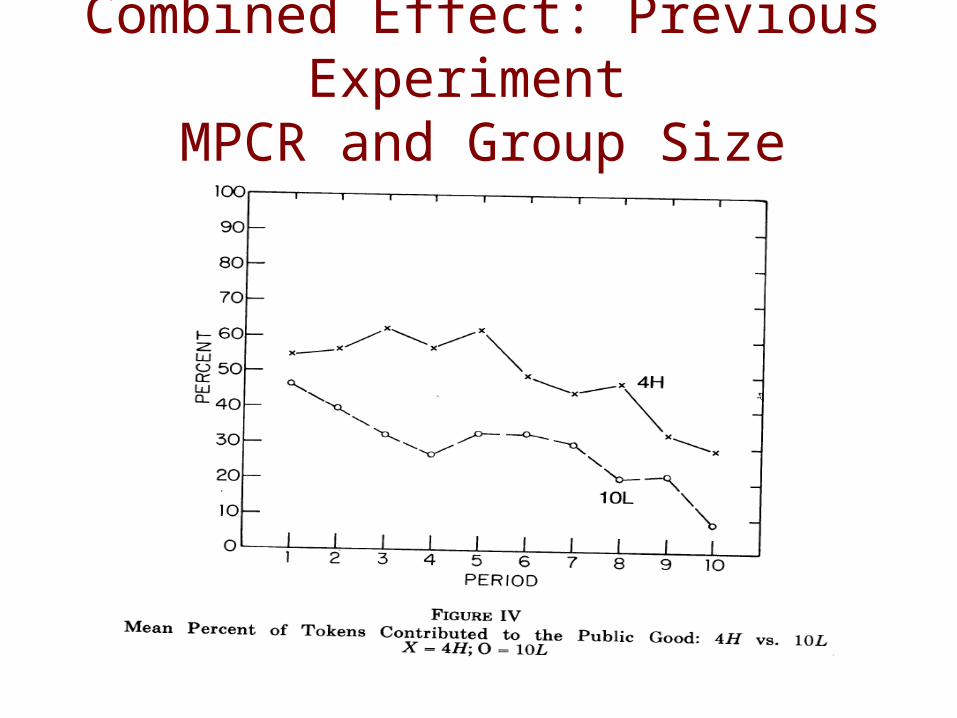
Combined Effect: Previous Experiment MPCR and Group Size

Summary
Related Documents