Outline
Jan 02, 2016
Topology based method of segmentation of gray scale images Peter Saveliev Marshall University , USA. Outline. Goal: a graph representation of the topology of a gray scale image. The graph represents the hierarchy of the lower and upper level sets of the gray level function. - PowerPoint PPT Presentation
Welcome message from author
This document is posted to help you gain knowledge. Please leave a comment to let me know what you think about it! Share it to your friends and learn new things together.
Transcript
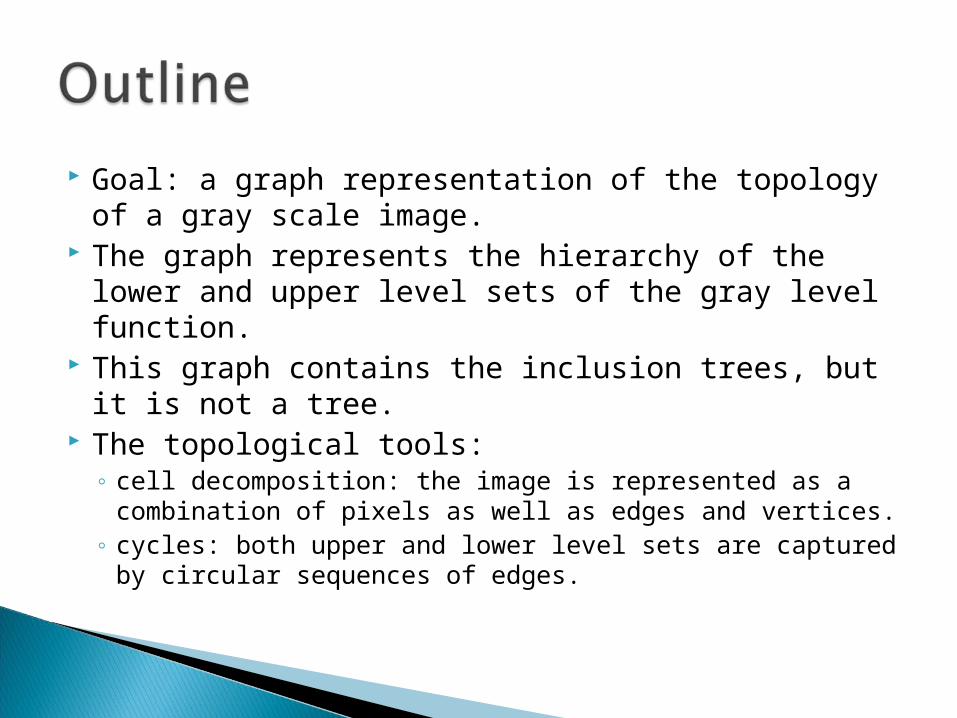
Goal: a graph representation of the topology of a gray scale image.
The graph represents the hierarchy of the lower and upper level sets of the gray level function.
This graph contains the inclusion trees, but it is not a tree.
The topological tools:◦ cell decomposition: the image is represented as a
combination of pixels as well as edges and vertices. ◦ cycles: both upper and lower level sets are captured
by circular sequences of edges.
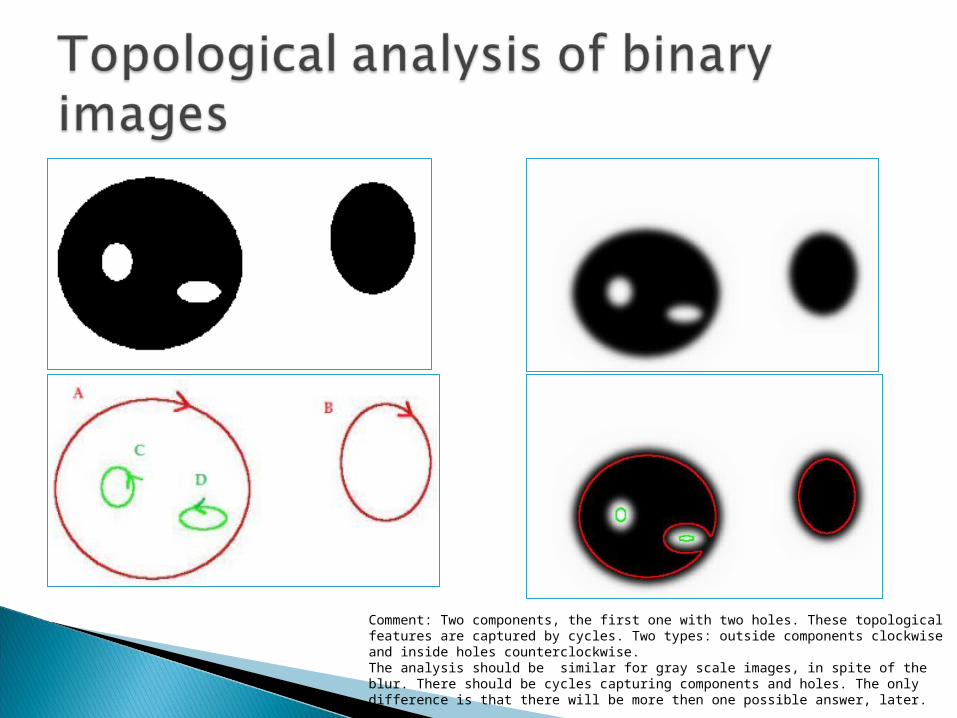
Comment: Two components, the first one with two holes. These topological features are captured by cycles. Two types: outside components clockwise and inside holes counterclockwise.The analysis should be similar for gray scale images, in spite of the blur. There should be cycles capturing components and holes. The only difference is that there will be more then one possible answer, later.
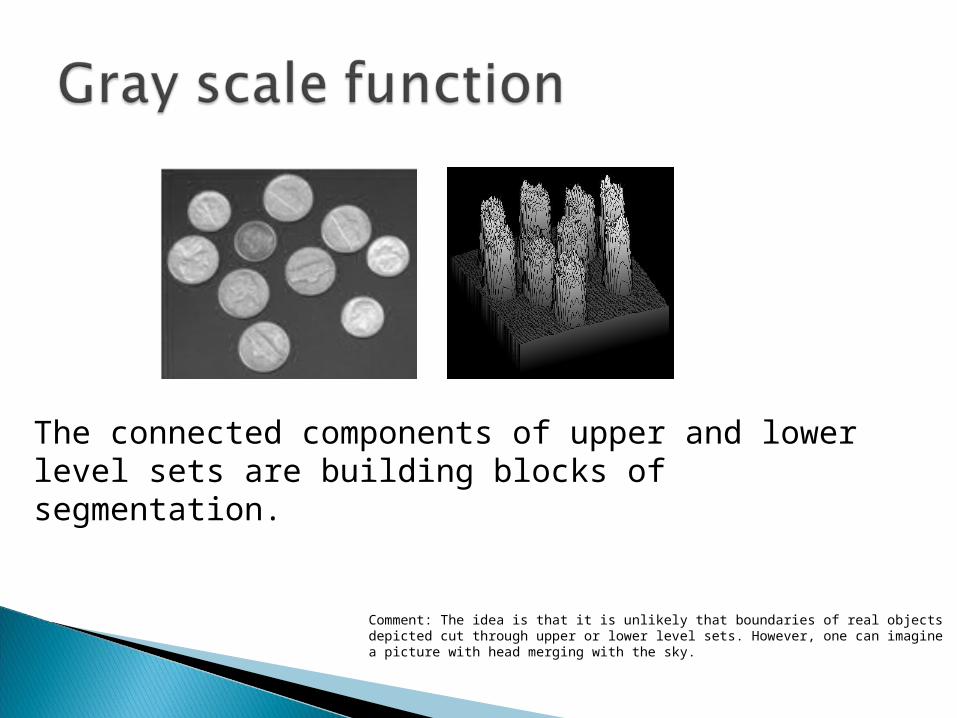
The connected components of upper and lower level sets are building blocks of segmentation.
Comment: The idea is that it is unlikely that boundaries of real objects depicted cut through upper or lower level sets. However, one can imagine a picture with head merging with the sky.
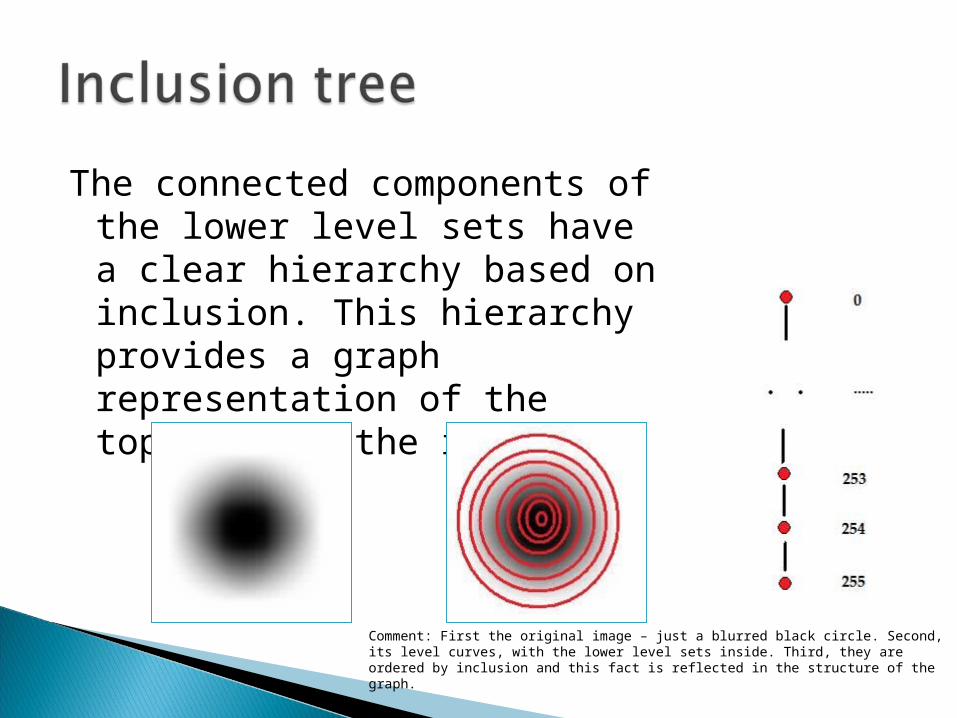
The connected components of the lower level sets have a clear hierarchy based on inclusion. This hierarchy provides a graph representation of the topology of the image.
Comment: First the original image – just a blurred black circle. Second, its level curves, with the lower level sets inside. Third, they are ordered by inclusion and this fact is reflected in the structure of the graph.
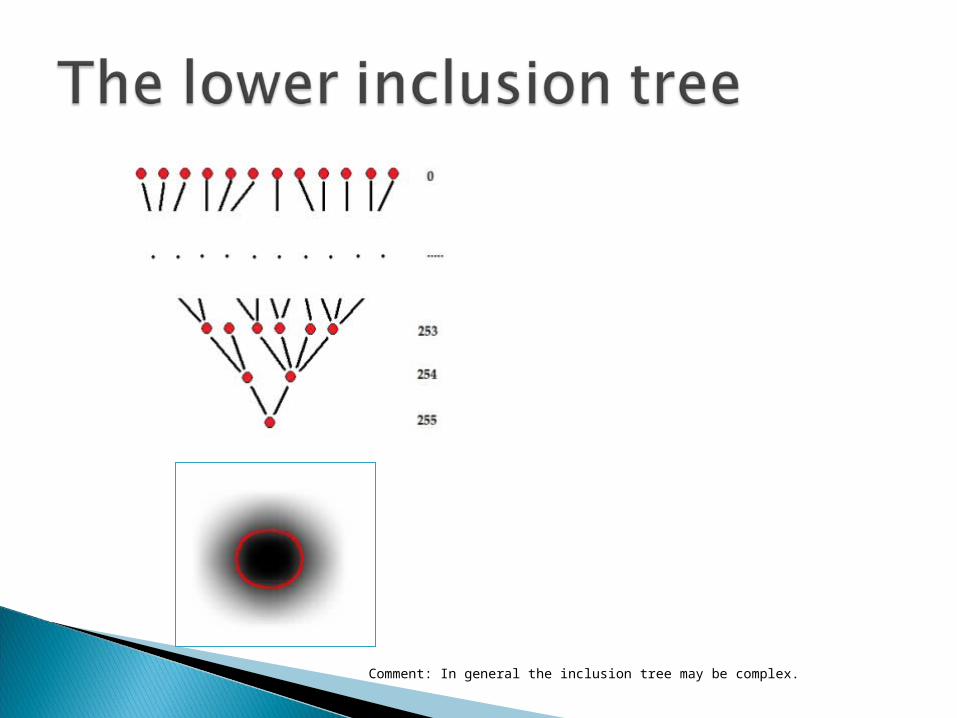
Comment: In general the inclusion tree may be complex.
.
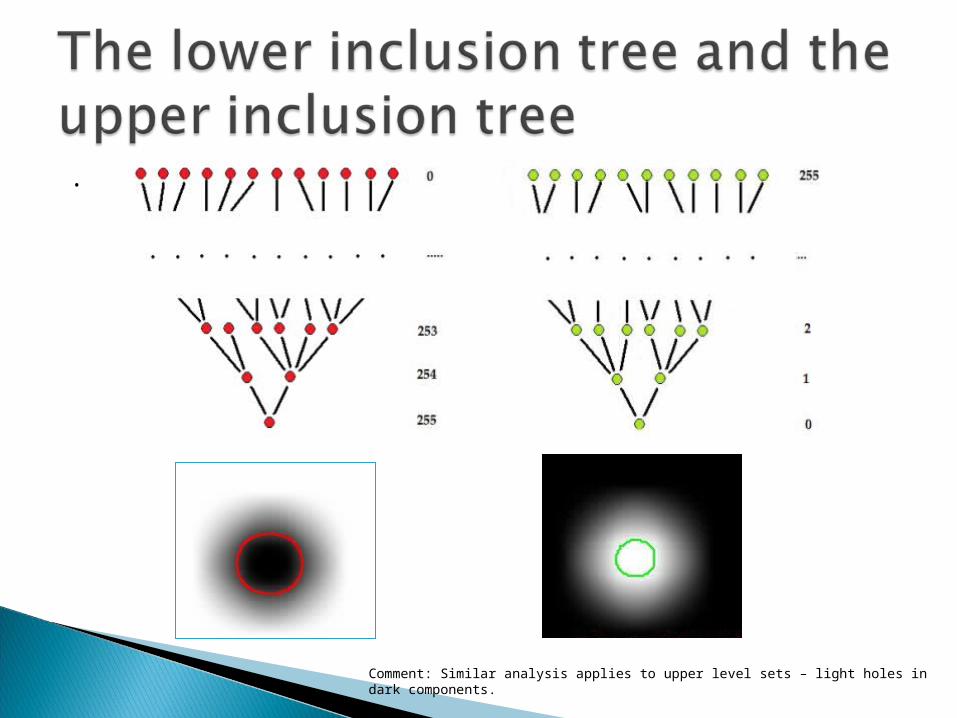
Comment: Similar analysis applies to upper level sets – light holes in dark components.
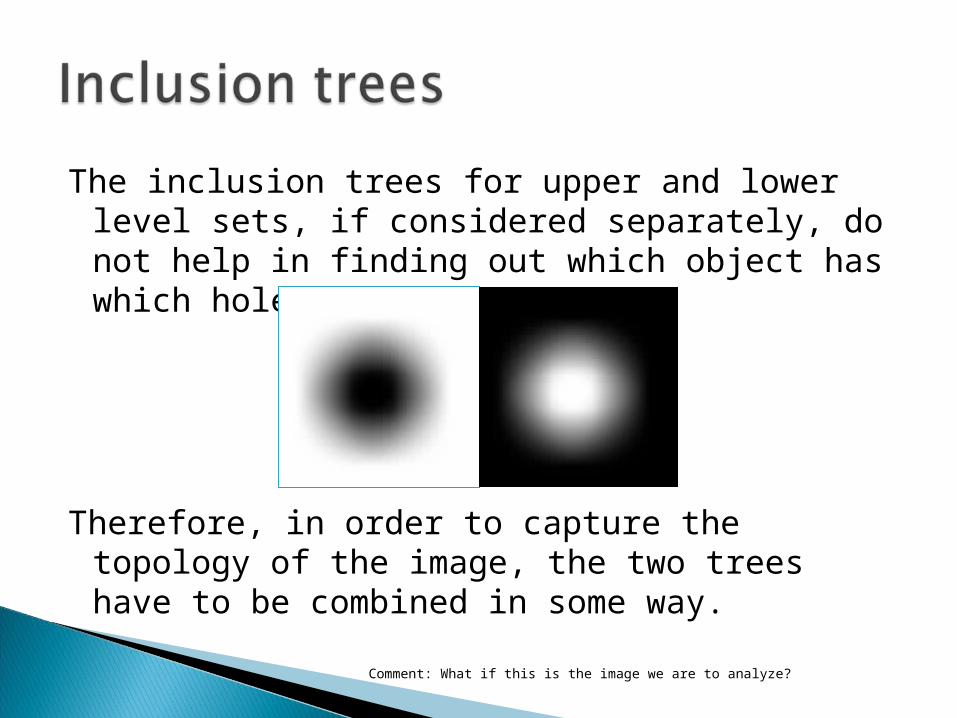
The inclusion trees for upper and lower level sets, if considered separately, do not help in finding out which object has which hole.
Therefore, in order to capture the topology of the image, the two trees have to be combined in some way.
Comment: What if this is the image we are to analyze?
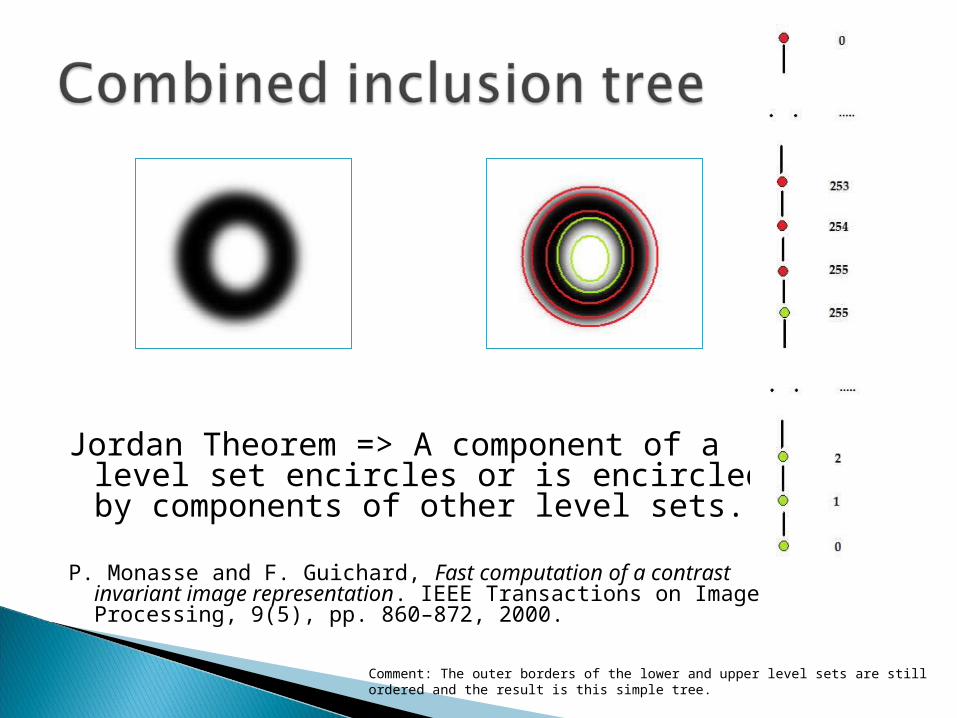
Jordan Theorem => A component of a level set encircles or is encircled by components of other level sets.
P. Monasse and F. Guichard, Fast computation of a contrast invariant image representation. IEEE Transactions on Image Processing, 9(5), pp. 860–872, 2000.
Comment: The outer borders of the lower and upper level sets are still ordered and the result is this simple tree.
+ =
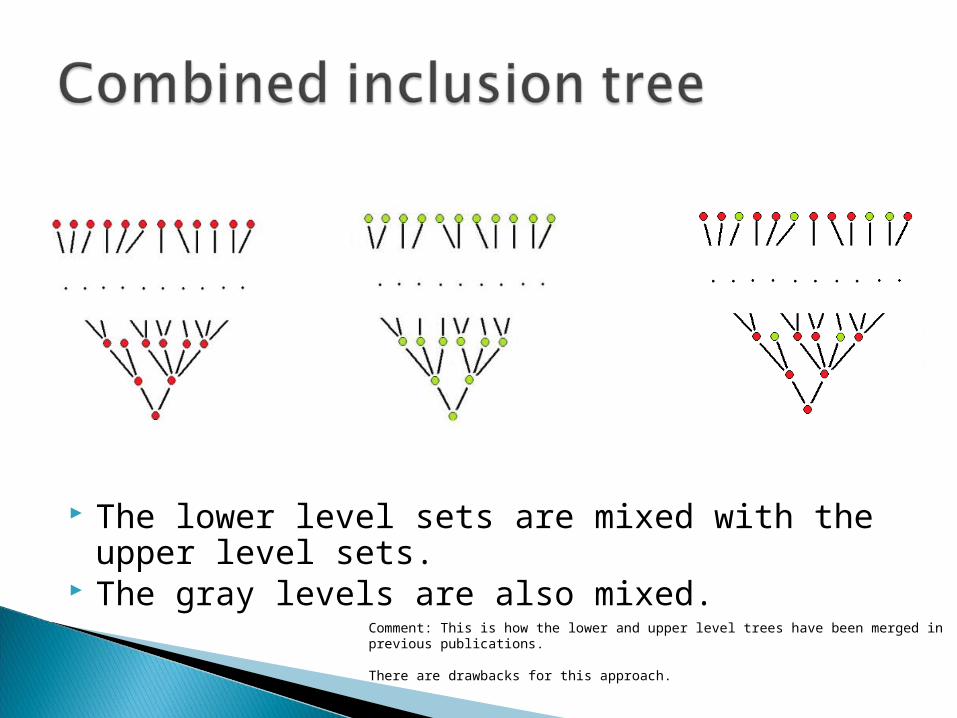
The lower level sets are mixed with the upper level sets.
The gray levels are also mixed.Comment: This is how the lower and upper level trees have been merged in previous publications.
There are drawbacks for this approach.
+ =
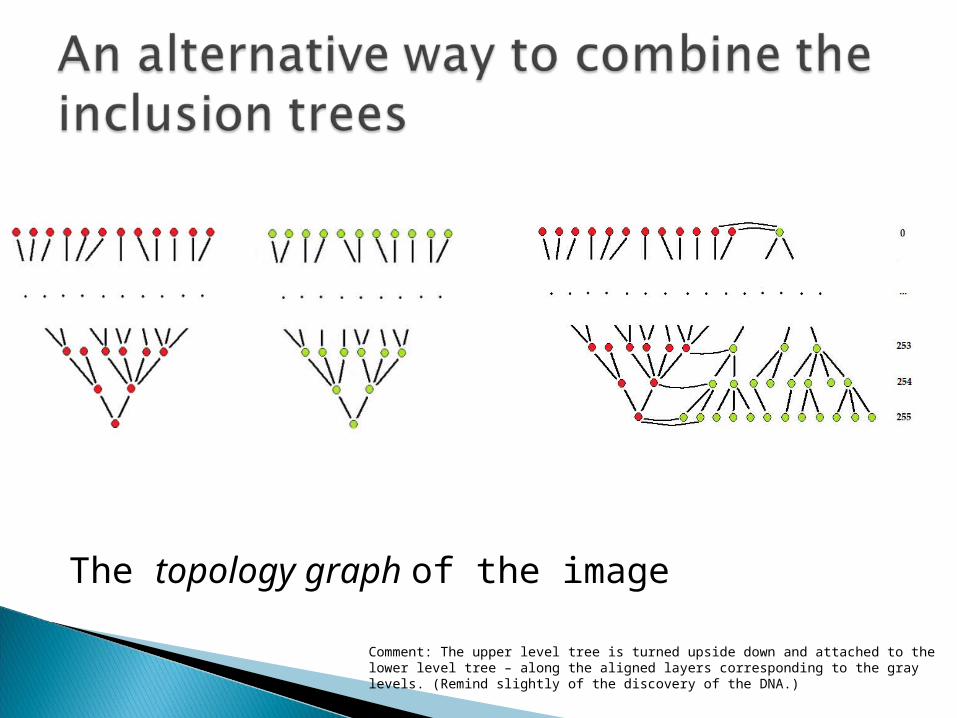
The topology graph of the image
Comment: The upper level tree is turned upside down and attached to the lower level tree – along the aligned layers corresponding to the gray levels. (Remind slightly of the discovery of the DNA.)
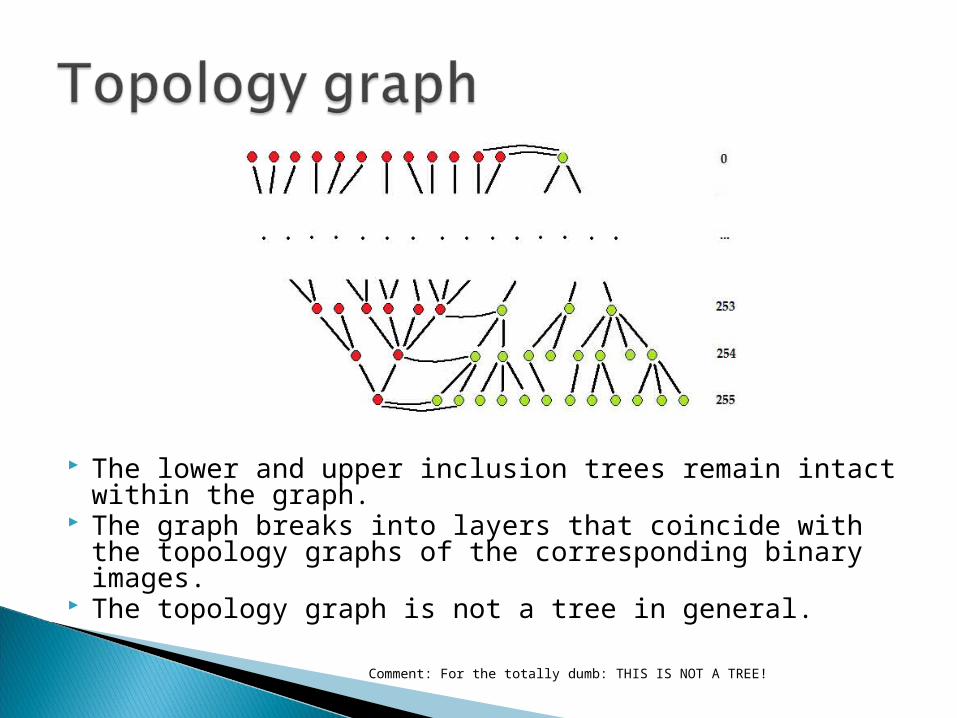
The lower and upper inclusion trees remain intact within the graph.
The graph breaks into layers that coincide with the topology graphs of the corresponding binary images.
The topology graph is not a tree in general.
Comment: For the totally dumb: THIS IS NOT A TREE!
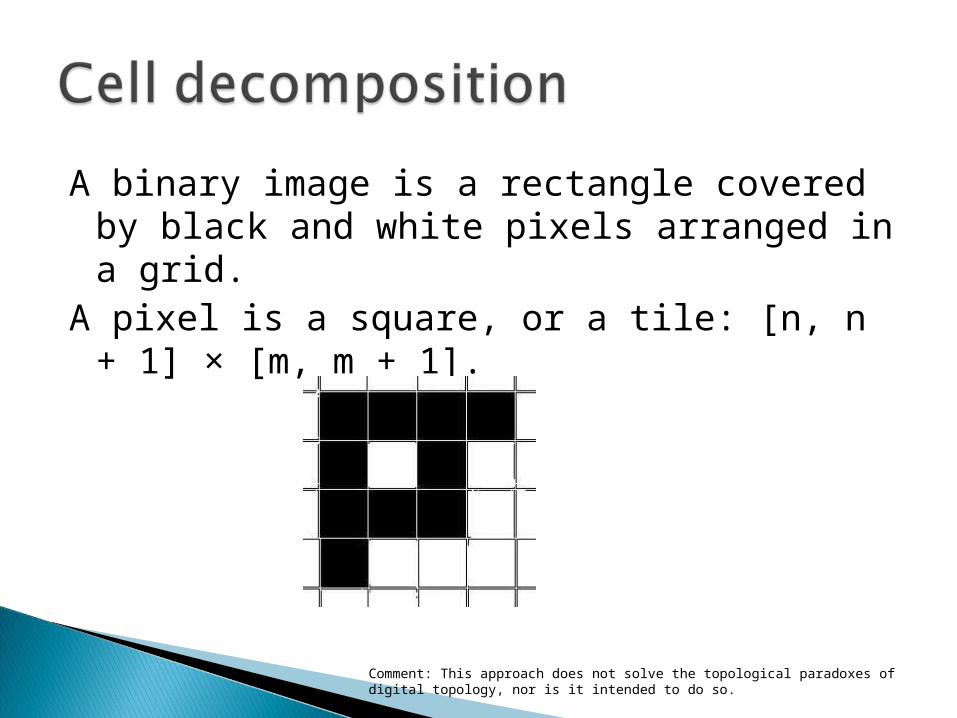
A binary image is a rectangle covered by black and white pixels arranged in a grid.
A pixel is a square, or a tile: [n, n + 1] × [m, m + 1].
Comment: This approach does not solve the topological paradoxes of digital topology, nor is it intended to do so.
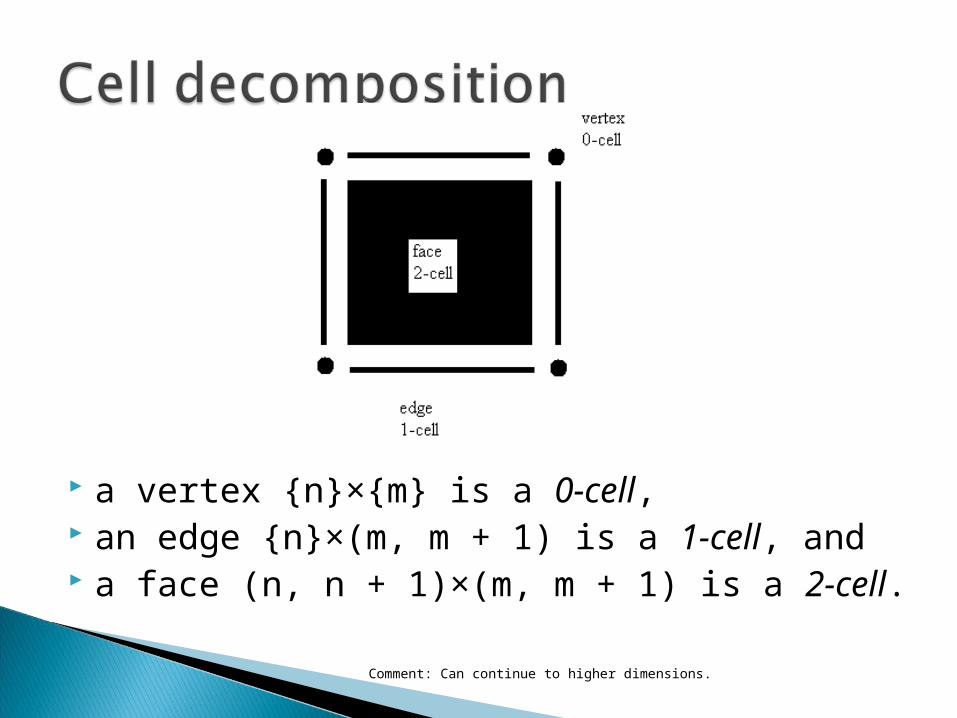
a vertex {n}×{m} is a 0-cell, an edge {n}×(m, m + 1) is a 1-cell, and a face (n, n + 1)×(m, m + 1) is a 2-cell.
Comment: Can continue to higher dimensions.
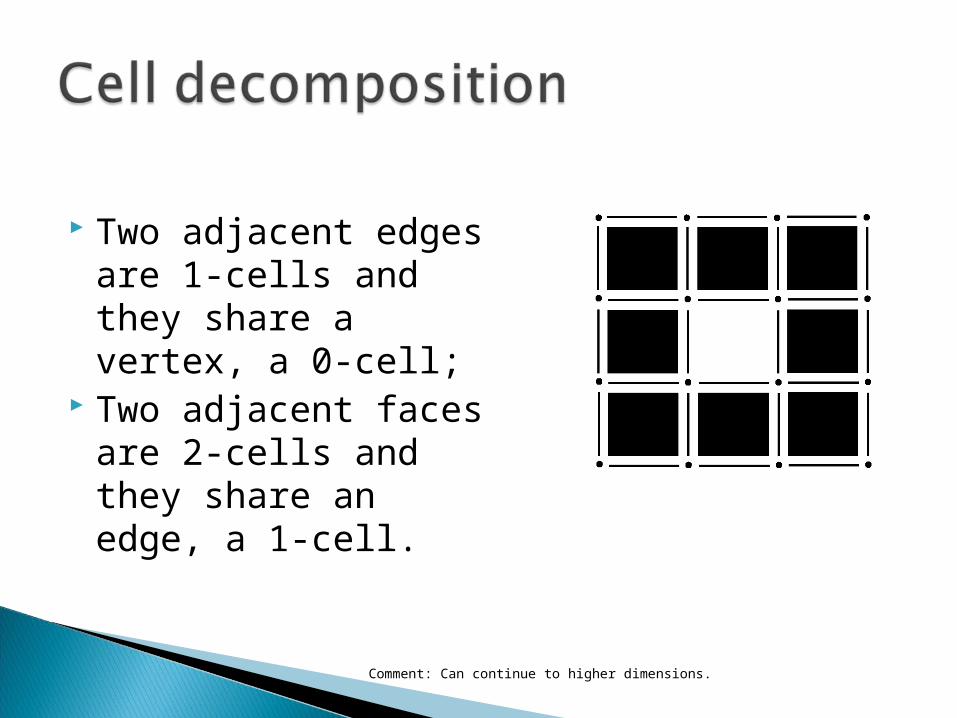
Two adjacent edges are 1-cells and they share a vertex, a 0-cell;
Two adjacent faces are 2-cells and they share an edge, a 1-cell.
Comment: Can continue to higher dimensions.
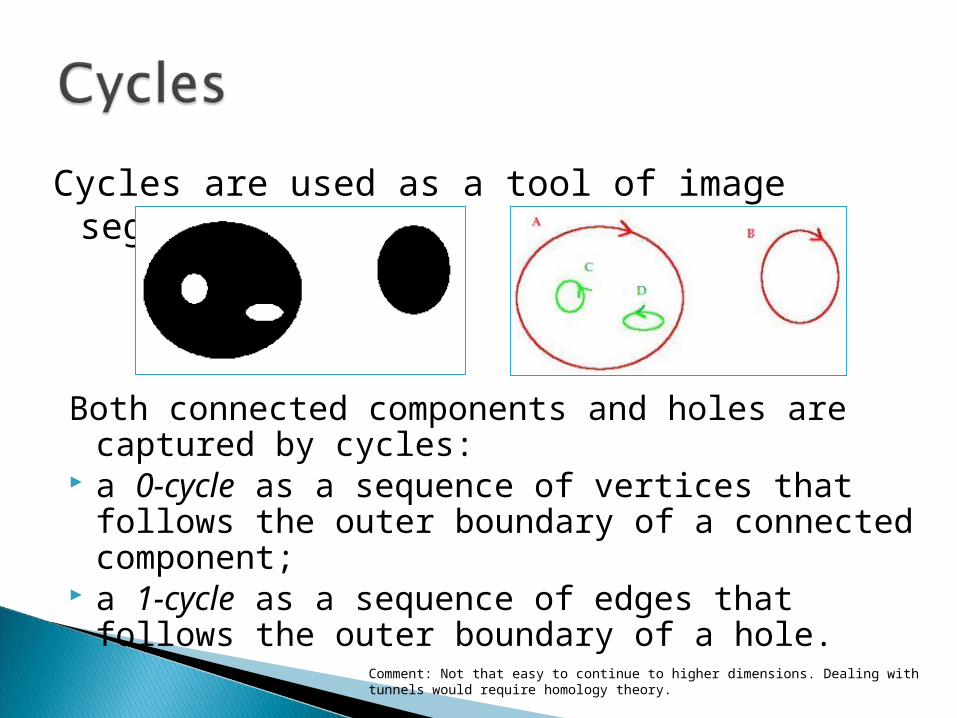
Cycles are used as a tool of image segmentation.
Both connected components and holes are captured by cycles:
a 0-cycle as a sequence of vertices that follows the outer boundary of a connected component;
a 1-cycle as a sequence of edges that follows the outer boundary of a hole.
Comment: Not that easy to continue to higher dimensions. Dealing with tunnels would require homology theory.
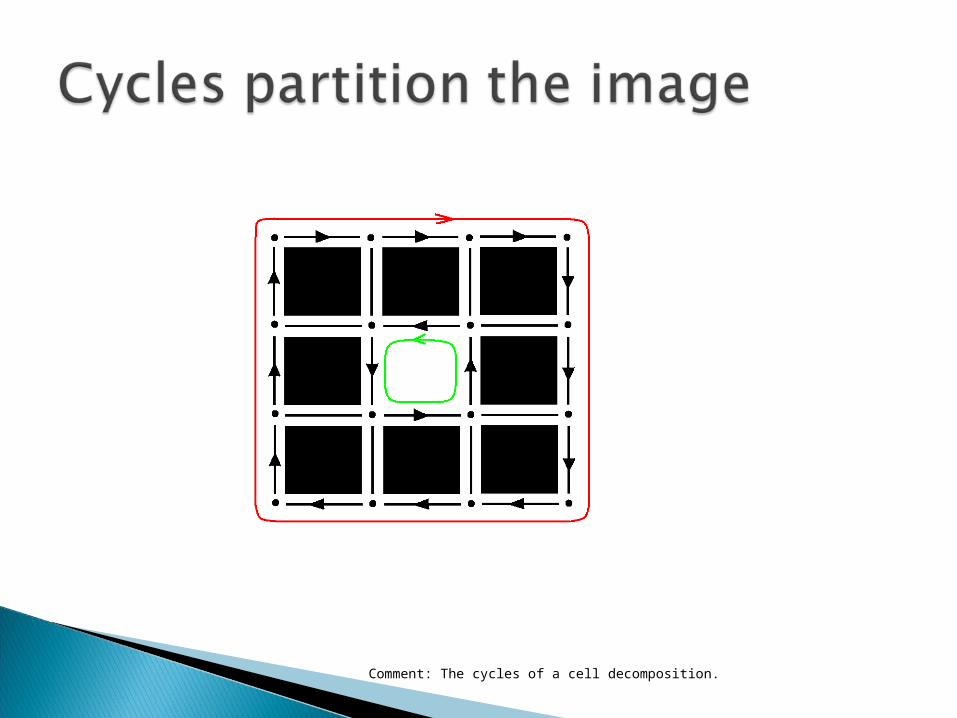
Comment: The cycles of a cell decomposition.
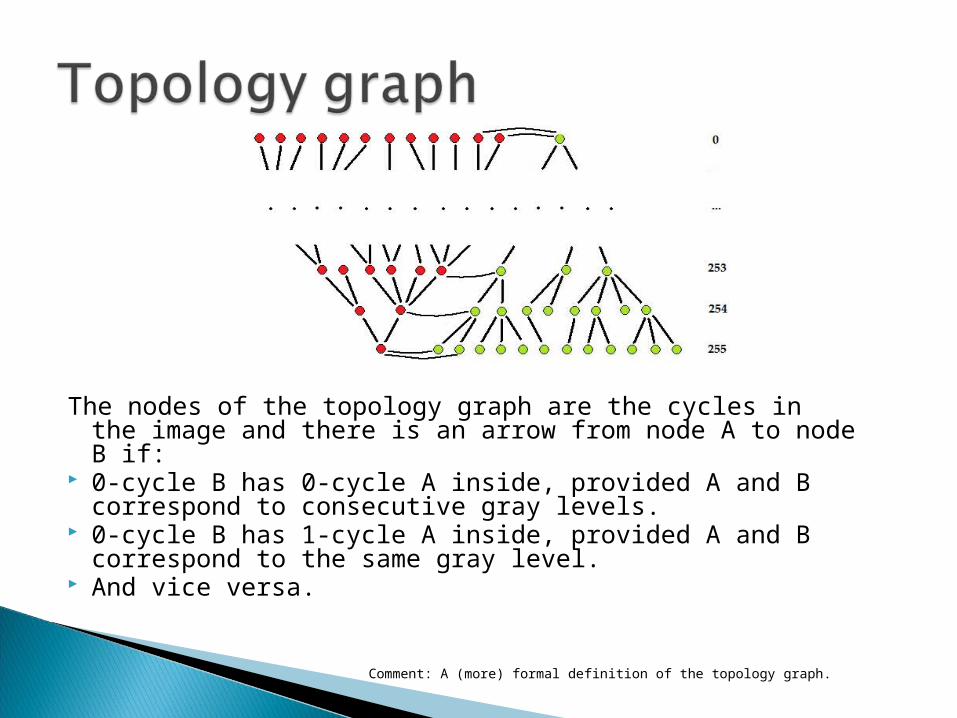
The nodes of the topology graph are the cycles in the image and there is an arrow from node A to node B if:
0-cycle B has 0-cycle A inside, provided A and B correspond to consecutive gray levels.
0-cycle B has 1-cycle A inside, provided A and B correspond to the same gray level.
And vice versa.
Comment: A (more) formal definition of the topology graph.
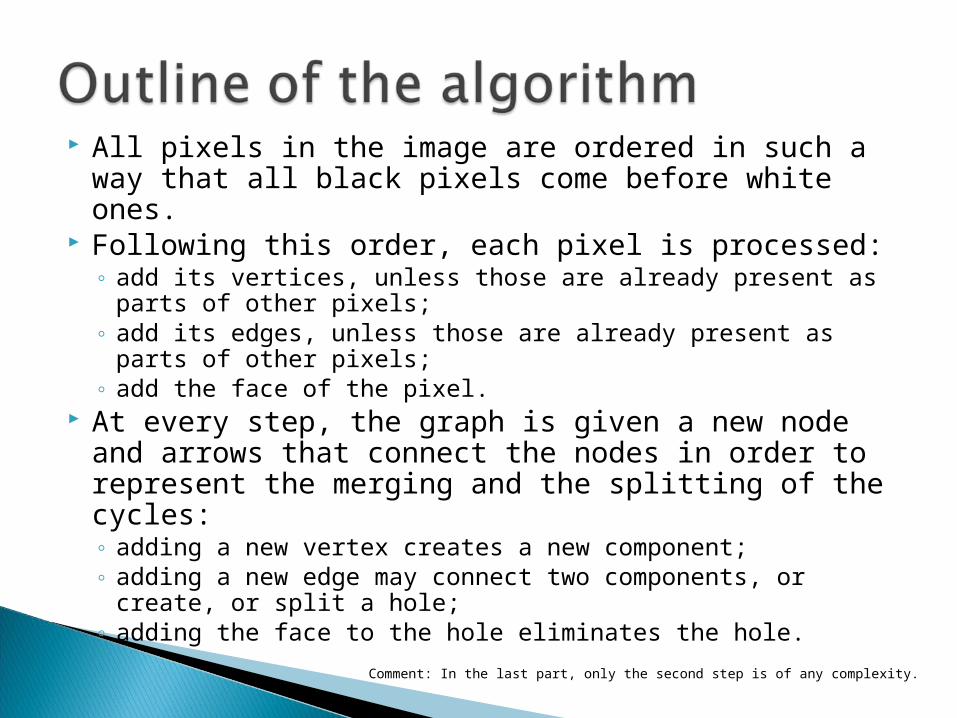
All pixels in the image are ordered in such a way that all black pixels come before white ones.
Following this order, each pixel is processed: ◦ add its vertices, unless those are already present as parts
of other pixels; ◦ add its edges, unless those are already present as parts
of other pixels;◦ add the face of the pixel.
At every step, the graph is given a new node and arrows that connect the nodes in order to represent the merging and the splitting of the cycles:◦ adding a new vertex creates a new component;◦ adding a new edge may connect two components, or
create, or split a hole;◦ adding the face to the hole eliminates the hole.
Comment: In the last part, only the second step is of any complexity.
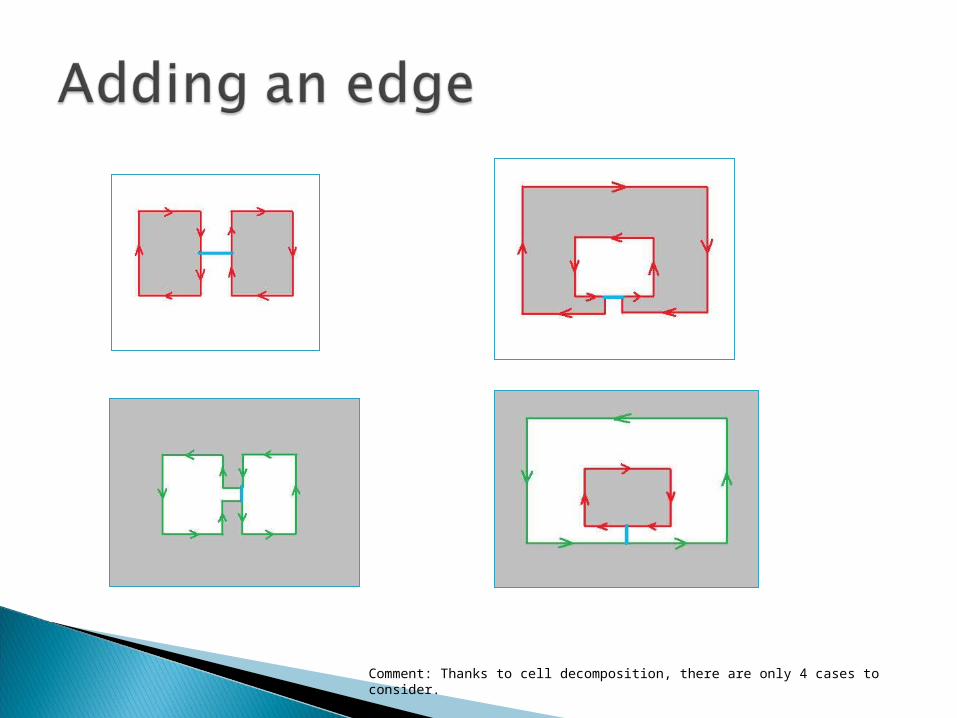
Comment: Thanks to cell decomposition, there are only 4 cases to consider.
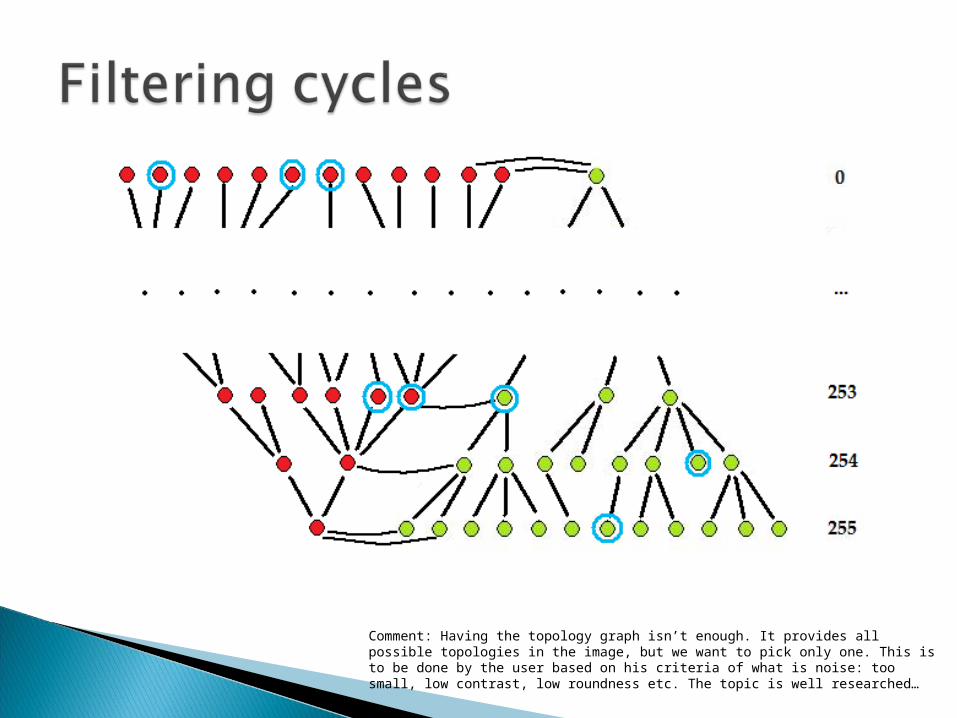
Comment: Having the topology graph isn’t enough. It provides all possible topologies in the image, but we want to pick only one. This is to be done by the user based on his criteria of what is noise: too small, low contrast, low roundness etc. The topic is well researched…
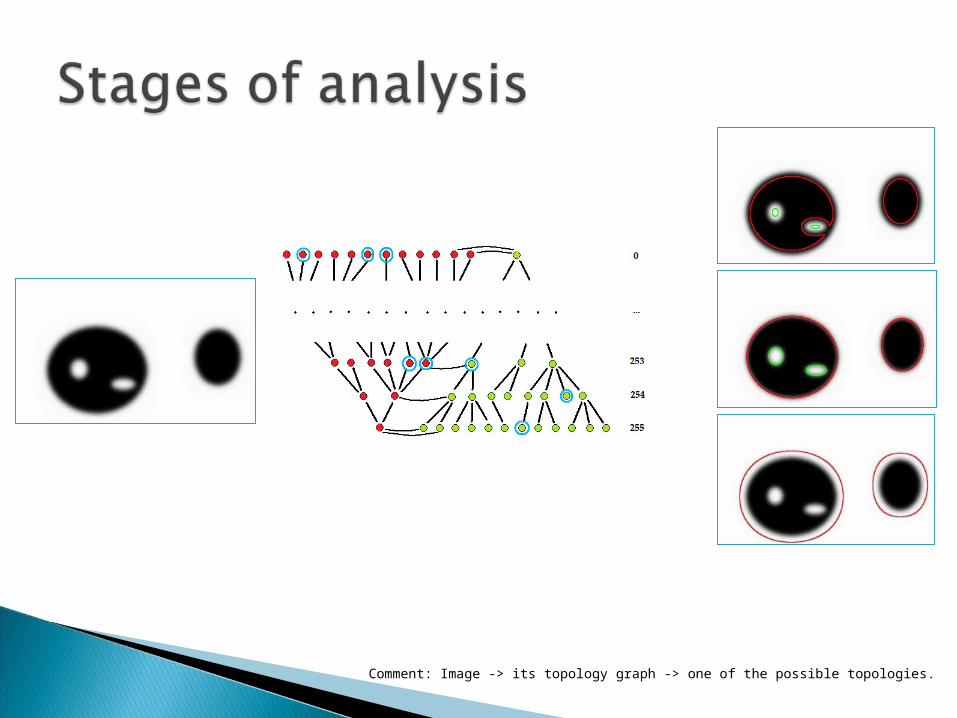
Comment: Image -> its topology graph -> one of the possible topologies.
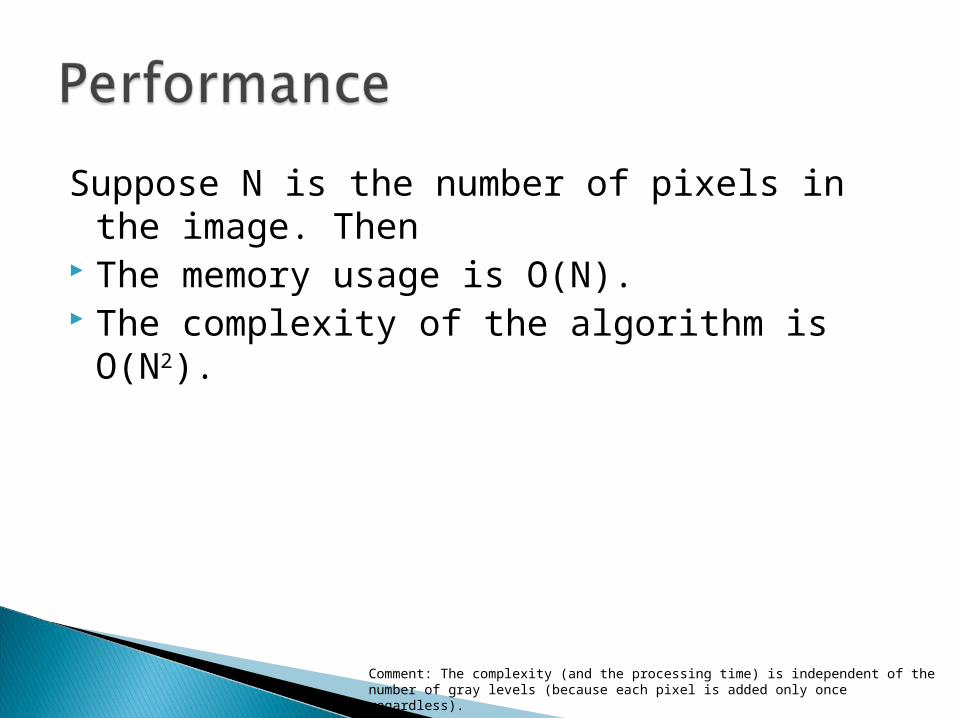
Suppose N is the number of pixels in the image. Then
The memory usage is O(N). The complexity of the algorithm is O(N2).
Comment: The complexity (and the processing time) is independent of the number of gray levels (because each pixel is added only once regardless).
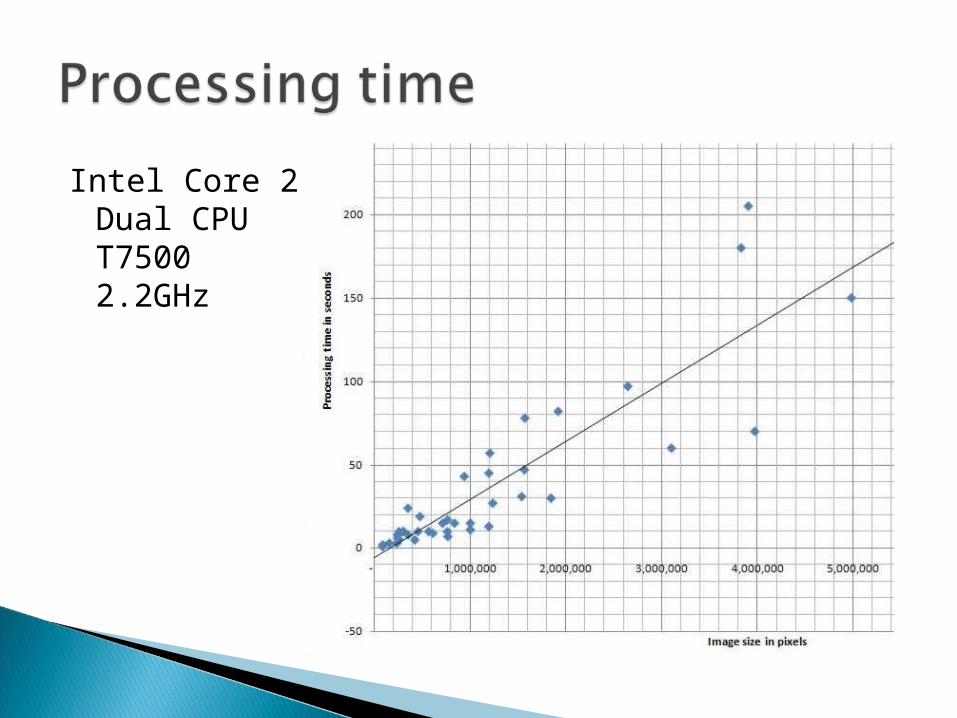
Intel Core 2 Dual CPU T7500 2.2GHz
Thank you
Related Documents


![[ Outline ]](https://static.cupdf.com/doc/110x72/56815a74550346895dc7db61/-outline--56b49f971d862.jpg)