Outcomes Focus for Learning Sample Teaching and Assessment Strategies 213-7 select and integrate information from various print and electronic sources or from several parts of the same source Students will be provided with samples of both historical and current weather information that has been reported to the public through various sources, such as newspapers, weather apps, websites, and radio clips. This can include information about temperature, precipitation, humidity, atmospheric pressure, cloud cover, wind speed and direction. Students are expected to select weather information and integrate it to answer the following questions: ● How does weather data impact our daily lives and decision making? ● What weather information is important to you? ● What information is required to describe the climate of a region? ● How does the climate affect the ecology of a region? ● How does weather affect the types of industries found in a region? ● How does weather affect human health? Students will use the historical and current weather data to develop operational definitions of weather and climate. Students should understand that weather includes the conditions of the atmosphere at a specific time and place while climate is the average weather conditions over a long period of time. Students should be able to use these terms in communicating information throughout the unit. Students will be provided with data describing the climate of various regions along with images and descriptions of living things in that region. Given this, they should be able to match the location with the correct image or description. Students may apply prior knowledge of ecosystems to describe how climate affects the ecosystem of a region. Activation Ask students to provide a description of the current weather conditions and discuss what should be included in their descriptions. Connections Several organisms have adaptations based on climate. Given various images of such organisms, students may identify the adaptation of the organisms and how it is determined by climate. Such organisms may include: ● polar bear ● camel ● coniferous trees ● deciduous trees ● snowshoe hare Students can research how climate affects the ecology and adaptations of organisms in a certain area. Consolidation Collect current and historic weather data for a local region and in groups interpret how this data can be used to describe both the climate and ecology of our area. Extension Given cross sections of tree trunks from a variety of locations with different growing seasons and ask student to identify differences in the climate of these locations. For example, using two images of the cross section of a tree trunk, one from the tropics and one from Canada, students are expected to identify the difference between

Welcome message from author
This document is posted to help you gain knowledge. Please leave a comment to let me know what you think about it! Share it to your friends and learn new things together.
Transcript
Outcomes
Focus for Learning Sample Teaching and Assessment Strategies
213-7
select and integrate
information from
various print and
electronic sources or
from several parts of
the same source
Students will be provided with samples of both historical and current weather information
that has been reported to the public through various sources, such as newspapers, weather
apps, websites, and radio clips. This can include information about temperature,
precipitation, humidity, atmospheric pressure, cloud cover, wind speed and direction.
Students are expected to select weather information and integrate it to answer the following
questions:
● How does weather data impact our daily lives and decision making?
● What weather information is important to you?
● What information is required to describe the climate of a region?
● How does the climate affect the ecology of a region?
● How does weather affect the types of industries found in a region?
● How does weather affect human health?
Students will use the historical and current weather data to develop operational definitions of
weather and climate. Students should understand that weather includes the conditions of the
atmosphere at a specific time and place while climate is the average weather conditions over
a long period of time. Students should be able to use these terms in communicating
information throughout the unit.
Students will be provided with data describing the climate of various regions along with
images and descriptions of living things in that region. Given this, they should be able to
match the location with the correct image or description. Students may apply prior
knowledge of ecosystems to describe how climate affects the ecosystem of a region.
Activation
Ask students to provide a description of the current
weather conditions and discuss what should be included
in their descriptions.
Connections
Several organisms have adaptations based on climate.
Given various images of such organisms, students may
identify the adaptation of the organisms and how it is
determined by climate. Such organisms may include: ● polar bear
● camel ● coniferous trees
● deciduous trees
● snowshoe hare
Students can research how climate affects the ecology
and adaptations of organisms in a certain area.
Consolidation
Collect current and historic weather data for a local
region and in groups interpret how this data can be used
to describe both the climate and ecology of our area.
Extension Given cross sections of tree trunks from a variety of
locations with different growing seasons and ask student
to identify differences in the climate of these locations.
For example, using two images of the cross section of a
tree trunk, one from the tropics and one from Canada,
students are expected to identify the difference between

the images and explain the reason for the difference.
They are expected to make connections between the
climate of the area and the biological characteristics of
the image.

331-1
using scientific theory,
describe and explain
heat transfers in the
water cycle
The intent of this outcome is to highlight the role of water in transferring energy.
The processes in the water cycle are addressed in the Weather Unit of Grade 5 and particle
theory of matter and heat transfer are addressed in the Heat Unit of Grade 7. Students have
also studied the movement of water through water cycle in the Water Systems Unit of Grade
8.
Students should:
Distinguish between the atmosphere, lithosphere, and hydrosphere
● Explain the methods of heat transfer (radiation, conduction, convection, advection)
● Describe how atmospheric pressure affects heat transfer
● Identify the effects of albedo on heat transfer
● Describe heat transfer within the water cycle
Students are expected to connect heat transfer to the water cycle in terms of the transfer of
thermal energy beginning with the Sun.
All energy available to Earth comes from the Sun. Students are expected to know
that the Sun’s energy reaches Earth through radiation. Upon entering the
atmosphere, radiation may be absorbed or reflected depending on the matter it comes
in contact with. Students are expected to know the factors that affect the absorption
or reflection of thermal energy (albedo). Students will rank the albedo of air, water,
land and different surfaces.
Thermal energy absorbed by the land and water is transferred to the air by
conduction (collision of particles in the ground and the air). As the particles in the air
are heated they gain kinetic energy and the air rises. Students should know how
pressure, temperature and density change with increasing altitude and how this relates
to heat transfer in the water cycle.
The intent of this outcome is not to focus on the layers of the atmosphere but rather
the atmospheric properties that affect the water cycle, and therefore weather
systems.
Activation
Teachers can ask students to explain in detail why we do
not run out of water on earth.
Students can do an interactive review game, such as
“Around the Room Review” or “Jeopardy” reviewing
terms/concepts that should already be familiar. Include: ● atmosphere
● hydrosphere
● precipitation
● evaporation
● condensation
● conduction
● convection
● radiation
● particle theory
● cloud
● fog
Connection
Students could study the relationship between
evaporation and condensation by building their own
psychrometer
● Attach a piece of wet gauze over the tip of one
thermometer ● Leave one thermometer dry with no gauze ● Compare the temperatures on both thermometers ● Students can repeat the experiment with alcohol
(ethanol) Note: teachers may relate this activity to how sweating
cools the body
Students can complete the activity `The effect of
Atmospheric Pressure` from the Science 10 textbook

Convection moves warm air from close to the ground upward and cool air from
higher in the atmosphere downward. Advection moves the air horizontally. Together
convection and advection create convection currents.
Students should make the connection that the water cycle not only transports water
but also transfers and transports energy by the processes of convection/advection and
conduction, as well as changes of state, particularly evaporation and condensation.
A large amount of energy is needed to overcome the forces of attraction between
water molecules in the atmosphere in order for water to evaporate, while a large
amount of energy is released when water molecules condense.
Sample Performance Indicator:
Construct a diagram or flow chart to show the path of a unit of solar radiation as it travels
from the Sun to Earth’s surface and back into space.
Construct a diagram to trace the path of a water molecule through the water cycle and
describe the pressure and energy changes at each stage.
Consolidation
Students can complete the activity `The Role and
Transfer of Energy in the Water Cycle` from the Science
10 textbook
Extension
Students can identify how human activities can change
the albedo of Earth’s surface and hypothesize what
would happen to the climate of Earth if there is a change
in surface albedo.

331-3
Describe how the
hydrosphere and
atmosphere act as heat
sinks in the water cycle
212-1
Identify questions to
investigate that arise
form practical
problems and issues
The intent of this outcome is for students to:
identify the effects of albedo on heat transfer describe a heat sink and specific heat capacity
Students should investigate the relationship between albedo, heat sink, and the specific heat
capacity of a substance by completing an activity such as `Albedo and Surfaces`.
It is expected that students compare water’s ability to transfer energy to other materials and
recognized that the high specific heat capacity of water is an important factor that affects
weather systems.
Sample Performance Indicator:
Use the terms specific heat capacity and heat sink to explain why the Atlantic ocean is a good
heat sink and land is not. Explain how this affects the local weather.
Activation
Students can be presented with a weather forecast for an
area inland and an area near water (e.g.- Forecast for a
location in Newfoundland and one in Alberta for the
same week) then make comparisons and discuss
questions to investigate.
“Cloud in a bottle” demonstration to show the
relationship between pressure and
evaporation/condensation.
Demonstrate condensation, causing fog like conditions,
by using a canned air gas duster upside down. Students
may hypothesize reasons for the formation of fog.
Connection
Students may complete a lab activity, which
demonstrates the relationship between heat, water and
air. Students can conduct a lab activity: heat a tray of water, with
two beakers suspended above. One beaker will be filled with
ice and water, and the other with room temperature water.
Students can measure the amount of condensation on each
beaker qualitatively or quantitatively.
Students can do a review game such as “Quiz-Quiz
trade” or “Tic-Tac-Toe What Do you Know?”, to review
terminology from the Heat Unit of Grade 7 and Water
Systems Unit of Grade 8 (temperature, heat, specific heat
capacity)
Students may complete the lab activity `Albedo and
Surfaces` from the Science 10 textbook.

Students may investigate specific heat capacity by
selecting four different materials with different heat
capacities. Place each material in a hot water bath and
record the temperature over time, then place in a cold
water bath and repeat procedure.
Students can select data of average coastal temperatures
and compare to data for inland temperatures. (E.g. St.
John’s and Badger) and discuss how heat sinks affect
these local weather patterns.
Consolidations Students can be asked to write a letter, blog, email, or
social media message to someone from the mainland
who has never visited Newfoundland. They will describe
the climate of the province and how it is affected by its
proximity to water. This should include the terms
temperature, heat sink, heat transfer, specific heat
capacity.
Extension Students can design an experiment to determine how salinity
affects the heat capacity of water
331-2, 331-4
Describe and explain
heat transfer in the
hydrosphere and
atmosphere, its effects
on air and water
currents, and on the
development, severity,
and movement of
weather systems
Students should understand how the Earth’s curvature, tilt and orbit affects weather.
Students will study air masses and will be expected to:
Describe the formation of an air mass
Describe the major air masses that affect North America
Recognize that air masses are dependent on the heat sink they are near (i.e. air will be
warmer or cooler, depending on the heat sink)
outline the differences in high pressure systems versus low pressure systems with
respect to their:
o formation
o impact on weather
Recognize that as air masses circulates around the globe they distribute energy to
other areas via convection currents. For example, a warm air mass above the equator
will move north, to a cooler region. The air cools and falls and then returns to the
equator
Refer to the movement of air from an area of high pressure to low pressure as wind
Describe Earth`s global wind systems (prevailing winds, jet streams) with respect to
their:
o Formation
o Impact of weather
Students should have prior knowledge of the Coriolis Effect and are expected to apply that
knowledge to prevailing winds. To illustrate this effect students should complete an activity
such as “Deflection of Wind Due to the Coriolis Effect”
Activation The teacher could perform a demonstration of heat
transfer within an air current by creating a convection
current using a lighter and an empty tea bag (one that
contains a string).
Procedure:
1. Remove the staple and string from the tea bag
and empty out any tea so a hollow cylinder
remains.
2. Place the bag on a piece of Al foil on the lab
bench and light the top of the bag.
3. Students will observe what happens as the tea bag
burns (they should see the lit bag rise and then
fall) and apply their prior knowledge about heat
transfer to describe what happens.
Demo:
https://www.youtube.com/watch?v=TKF30KxwM8g
Connection
Students will place a colored ice cube in a clear glass
container filled with salty warm water and observe what
happens. Relate the concept of air currents to water
currents to predict heat transfer within the atmosphere
and hydrosphere.
Deflection of Wind Due to the Coriolis Effect Activity:
Using circular pieces of paper, students can label north,
south, east and west on the top, bottom, right and left of
the paper respectively. Students will then label an area
of high pressure with H and an area of low pressure with
L, separated by at least 10 cm. Students will then
attempt to draw a line from high pressure to low pressure
as another student rotates the paper counter-clockwise.
Consolidations Using a map of the globe, identify regions that are likely
to have a cold, dry climate and a warm, damp climate.
This process of heat (energy) transfer not only occurs in the atmosphere but also in the
hydrosphere, as demonstrated in ocean currents.
Students are expected to explain:
o The causes of ocean currents:
1. Convection currents
Water at the equator absorbs the intense, direct rays of the sun and becomes heated
This warm water is less dense than cold water and moves away from the equator
towards the poles. The warm water is replaced by cold water from below
(originating from the polar regions). This creates a convection current near the
surface. This is responsible for the formation of major ocean currents such as the
Gulf Stream and the Labrador Current which affect weather systems in
Newfoundland & Labrador.
2. Prevailing winds and the Coriolis effect
Ocean currents tend to follow the prevailing winds blowing at the surface and that the
Coriolis Effect also deflects ocean currents
3. Earth’s rotation
Because of Earth’s eastward rotation currents on the west sides of oceans tend to be
narrow and fast moving and those on the east sides of oceans are wide and slow
moving
4. Shapes of the Continents
Where currents encounter a landmass they are deflected away from the path produced
by the prevailing winds. Exception: Antarctic Circumpolar Current
5. Heat Capacity of water
Oceans act as huge heat sinks so they heat up slowly and, once heated, cool down
slowly
6. Amount of salt
When seawater evaporates, the salt left behind makes the remaining water denser.
This dense seawater sinks and creates a deep water current.
Draw a diagram to illustrate the movement of air in the
atmosphere and explain the effects that air currents have
on the land.
Explain how air and water currents act as conveyer belts
of energy.
Extension
Predict what would happen if tidal action ended.
Determine areas that have differing salinities and
propose a reason for this difference. Hypothesize how
differing salinities would impact the weather of various
regions.
Incorporate Bernoulli’s Principle into the analysis of heat
transfer in the hydrosphere and atmosphere.
Research the process of upwelling and make a
connection between the nutrient rich Grand Banks
o Effects of Ocean Currents
1. Creation of rain forests
Warm currents heat the air above them which increases the air’s ability to carry
moisture
Creates rain forests on the east side of continents
Eg: Brazilian rain forest of eastern South America
2. Creation of deserts
Cool currents cool the air above them which decreases the ability of the air to hold
moisture
Creates deserts on the west side of continents
Eg: desert area in Peru of western South America
3. Moderation of temperature
A coastal area will tend to have cooler summers and milder winters than an inland
location at the same latitude due to the moderating effect of a large body of water ie.
it prevents the extremes in temperature
Eg. St. John’s is warmer in winter than Ottawa because of the warm moist air brought
northward by the Gulf Stream

115-2
Illustrate how science
attempts to explain
natural phenomena.
The purpose of science is to try to provide explanations for events in our natural world. The
intent of this outcome is for students to provide several examples of how science attempts to
explain natural weather and climate phenomena.
Students will learn how scientists explain the following natural phenomena:
● Thunderstorms ● Blizzards ● Hurricanes ● Tornadoes
Activation
Show video clips of a variety of natural weather
phenomena. In small groups students may classify these
phenomena on degree of severity and discuss their
reason for classification. Upon classifying the severity,
students may discuss the data that is used to describe
these events.
Storm tracker/chaser series on tornadoes/hurricanes from
the Weather Network may be used.
Connection
Students may compare weather features on a typical day
versus on a storm day in tornado alley and also analyze
surface maps of radar and satellite imagery to compare
what is seen when a tornado is present to a normal day.
Using cooperative jigsaw, students may research one
natural weather phenomena and present their findings to
a small group.
Consolidation Using a choice board, students may illustrate how
science explains natural weather phenomena. Options
may include poster board, PowerPoint, newspaper
article, oral presentation, song, video, brochure, blog,
cartoon strip, and social media page.
Extension
Predict why the occurrence and severity of natural
phenomena is changing throughout the world. (For
example, hurricanes in higher latitude areas)
Students could investigate other natural phenomena such
as monsoons, floods, droughts, El Nino/La Nina, heat
waves
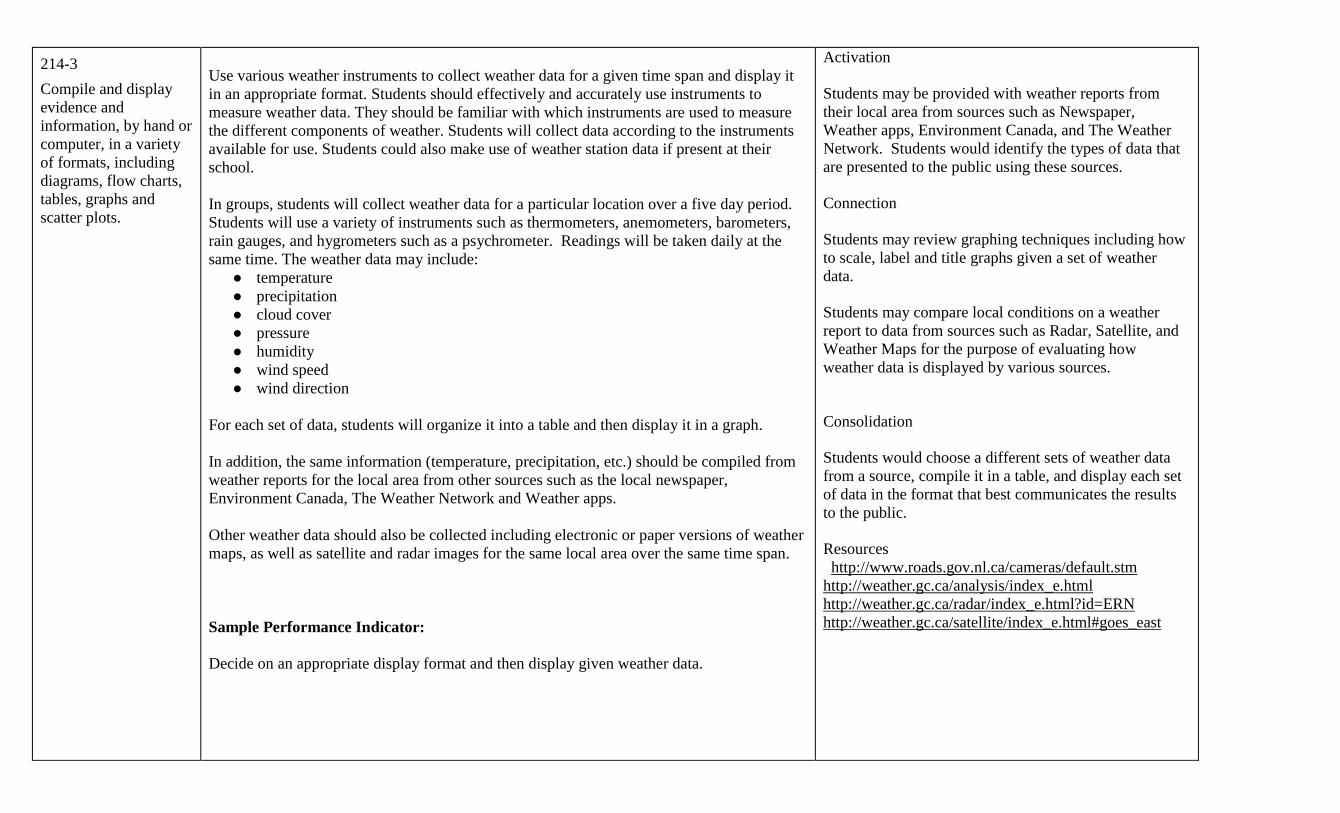
214-3
Compile and display
evidence and
information, by hand or
computer, in a variety
of formats, including
diagrams, flow charts,
tables, graphs and
scatter plots.
Use various weather instruments to collect weather data for a given time span and display it
in an appropriate format. Students should effectively and accurately use instruments to
measure weather data. They should be familiar with which instruments are used to measure
the different components of weather. Students will collect data according to the instruments
available for use. Students could also make use of weather station data if present at their
school.
In groups, students will collect weather data for a particular location over a five day period.
Students will use a variety of instruments such as thermometers, anemometers, barometers,
rain gauges, and hygrometers such as a psychrometer. Readings will be taken daily at the
same time. The weather data may include:
● temperature ● precipitation ● cloud cover ● pressure ● humidity ● wind speed ● wind direction
For each set of data, students will organize it into a table and then display it in a graph.
In addition, the same information (temperature, precipitation, etc.) should be compiled from
weather reports for the local area from other sources such as the local newspaper,
Environment Canada, The Weather Network and Weather apps.
Other weather data should also be collected including electronic or paper versions of weather
maps, as well as satellite and radar images for the same local area over the same time span.
Sample Performance Indicator:
Decide on an appropriate display format and then display given weather data.
Activation
Students may be provided with weather reports from
their local area from sources such as Newspaper,
Weather apps, Environment Canada, and The Weather
Network. Students would identify the types of data that
are presented to the public using these sources.
Connection
Students may review graphing techniques including how
to scale, label and title graphs given a set of weather
data.
Students may compare local conditions on a weather
report to data from sources such as Radar, Satellite, and
Weather Maps for the purpose of evaluating how
weather data is displayed by various sources.
Consolidation
Students would choose a different sets of weather data
from a source, compile it in a table, and display each set
of data in the format that best communicates the results
to the public.
Resources
http://www.roads.gov.nl.ca/cameras/default.stm http://weather.gc.ca/analysis/index_e.html http://weather.gc.ca/radar/index_e.html?id=ERN http://weather.gc.ca/satellite/index_e.html#goes_east
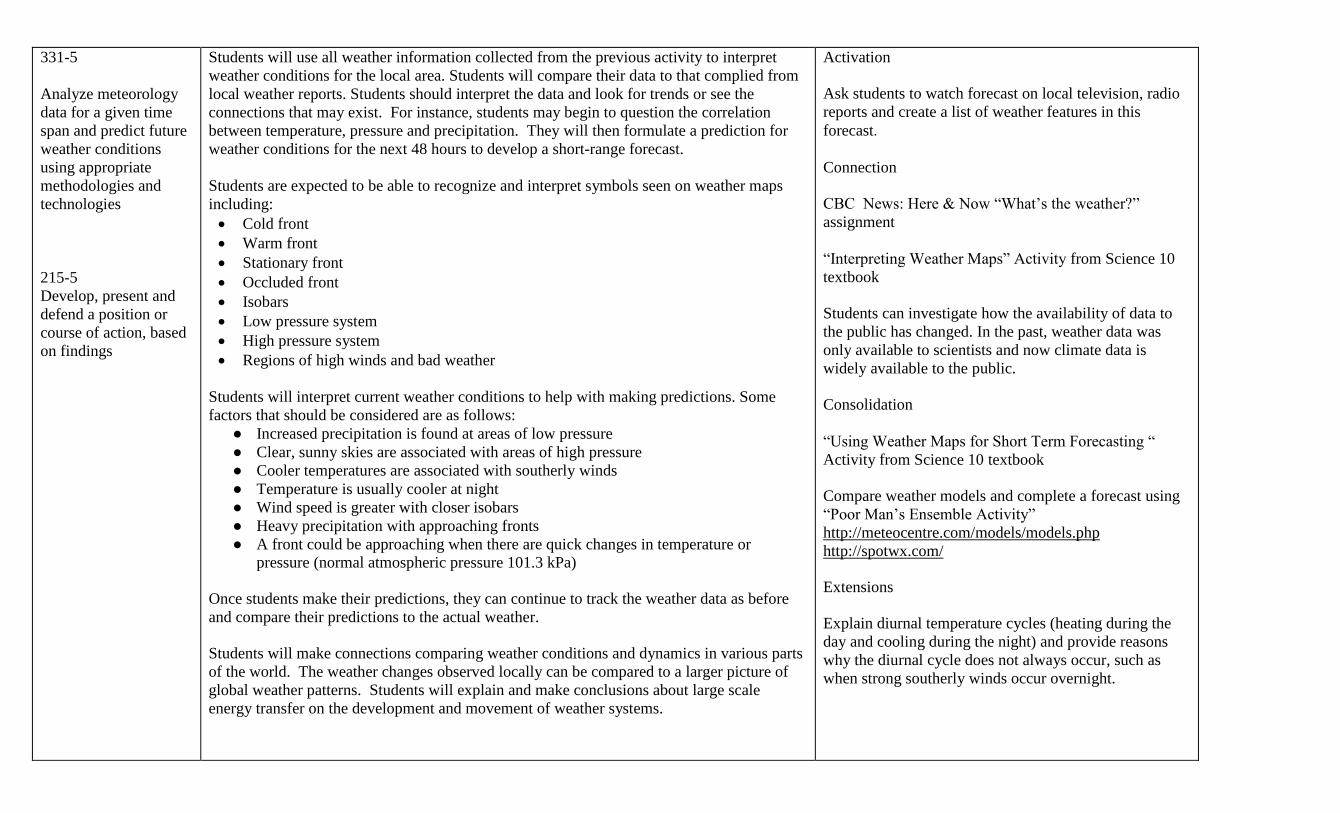
331-5
Analyze meteorology
data for a given time
span and predict future
weather conditions
using appropriate
methodologies and
technologies
215-5
Develop, present and
defend a position or
course of action, based
on findings
Students will use all weather information collected from the previous activity to interpret
weather conditions for the local area. Students will compare their data to that complied from
local weather reports. Students should interpret the data and look for trends or see the
connections that may exist. For instance, students may begin to question the correlation
between temperature, pressure and precipitation. They will then formulate a prediction for
weather conditions for the next 48 hours to develop a short-range forecast.
Students are expected to be able to recognize and interpret symbols seen on weather maps
including:
Cold front
Warm front
Stationary front
Occluded front
Isobars
Low pressure system
High pressure system
Regions of high winds and bad weather
Students will interpret current weather conditions to help with making predictions. Some
factors that should be considered are as follows:
● Increased precipitation is found at areas of low pressure ● Clear, sunny skies are associated with areas of high pressure ● Cooler temperatures are associated with southerly winds ● Temperature is usually cooler at night ● Wind speed is greater with closer isobars ● Heavy precipitation with approaching fronts ● A front could be approaching when there are quick changes in temperature or
pressure (normal atmospheric pressure 101.3 kPa)
Once students make their predictions, they can continue to track the weather data as before
and compare their predictions to the actual weather.
Students will make connections comparing weather conditions and dynamics in various parts
of the world. The weather changes observed locally can be compared to a larger picture of
global weather patterns. Students will explain and make conclusions about large scale
energy transfer on the development and movement of weather systems.
Activation
Ask students to watch forecast on local television, radio
reports and create a list of weather features in this
forecast.
Connection
CBC News: Here & Now “What’s the weather?”
assignment
“Interpreting Weather Maps” Activity from Science 10
textbook
Students can investigate how the availability of data to
the public has changed. In the past, weather data was
only available to scientists and now climate data is
widely available to the public.
Consolidation
“Using Weather Maps for Short Term Forecasting “
Activity from Science 10 textbook
Compare weather models and complete a forecast using
“Poor Man’s Ensemble Activity” http://meteocentre.com/models/models.php
http://spotwx.com/ Extensions
Explain diurnal temperature cycles (heating during the
day and cooling during the night) and provide reasons
why the diurnal cycle does not always occur, such as
when strong southerly winds occur overnight.
214-10
Identify and explain
uncertainty in
interpreting data used
to predict weather and
analyze how the
accuracy of predictions
can be enhanced.
117-6
Analyze why scientific
and technological
activities take place in
a variety of individual
and group settings
The accuracy of weather forecasting has changed due to advancements in technology, but the
degree of uncertainty in a particular forecast is not only limited by the devices used to collect
data, including which weather model(s) is/are analyzed, but also on the interpretation of that
data.
Not all weather models give the exact same information. In addition, even when the same
weather data is used, that data may be interpreted differently by different forecasters. Thus
various forecasts may result.
Students are expected to identify and explain uncertainty related to gathering weather data
and presenting conclusions based on this data. For example, the location of a low pressure
system may appear in different locations on different models, resulting in less confidence
when reporting on the area of precipitation.
By analyzing a global weather model, students are expected to be able to justify why weather
predictions take place in a variety of settings. Weather data is gathered by individual groups
using appropriate technologies and then shared among groups in order to help accurately
predict weather. If only local observations are taken into account, the accuracy of weather
predictions is limited. Thus, local meteorologists will usually analyze weather models from
different sources (Canadian, European and U.S. models) in producing a weather forecast.
Connection
Students may compare satellite, radar and the results of
various computer models to show how current weather
forecasting is evolving.
116-1
Identify examples of
where scientific
understanding was
enhanced or revised as
a result of the invention
of a technology
Before modern forecasting technology, we relied on features of cloud formations, features of
the sun and moon, behaviour of animals, to help forecast the weather.
Weather lore was an attempt to explain natural phenomena. The unwritten wisdom of early
farmers, fishers and hunters was evident in their ability to be able to read signs from mother
nature and predict weather in order to guide their actions. Before many technologies existed,
weather sayings were used to explain and predict weather.
This STSE outcome illustrates the relationship between science and technology. More
specifically, it explains how science is advanced through development of new technology.
With the invention of weather related technologies, our scientific understanding of weather
has changed. For example:
● Thermometers and anemometers have given rise to quantitative weather record-
keeping ● Barometers allowed scientists to connect lowering pressure with inclement weather ● Weather balloons informed scientists on atmospheric phenomenon ● Radar allowed us to visualize weather systems on a larger scale ● Infrared satellite imaging provided global heat maps which added to our
understanding of global warming and climate change ● Numerical weather models have allowed forecasters to predict the path of weather
systems ● Buoy data has informed scientists of wave, current, salinity and temperature data
Activation
Students can brainstorm local folklore related to weather.
Examples of weather lore:
● “In like a lamb, out like a lion” ● “Red sky at night, sailor’s delight; Red sky by
morning, sailors take warning.” ● “Wind from northeast isn’t fit for man or beast” ● Sun or moon halos indicate coming rain (or
snow) and the larger the halo, the closer the
proximity of the precipitation ● Sheila’s brush
Students may match folklore phrases with the correct
description of the natural phenomena.
Connections
Students can determine the appropriate technology used
to explain the natural phenomena.
Consolidations
Students may use research inquiry to evaluate the
accuracy of local, weather-related folklore.
(www.ngb.chebucto.org/Articles/folk-lore.shtml)
Students may illustrate how the accuracy of weather
forecasting has improved as a result of the invention of a
specific weather technology.
Extension
By tracking the accuracy of various weather models over
a period of days, infer why one weather model is more
accurate than another. Identify the parameters that
achieved increased accuracy within the model
117-10
Describe examples of
Canadian contributions
to science and
technology
Students should research and describe several Canadian contributions to meteorology and
oceanography. (Meteorology is the study of the atmosphere; oceanography is the study of
the oceans).
Examples may include but are not limited to: ● Earth’s atmospheric circulation model by Andre (needs accent) Robert
● One of the best numerical weather models in the world created by Environment
Canada
● The meteorological station, MET, made by the Canadian Space Agency and provided
to NASA for the Phoenix mission to Mars – Page 60 of NS Science 10 book ● The impact of tropical cyclones on Atlantic Canada as studied by the Canadian
Hurricane Centre ● The Canadian Ice Service provides accurate and timely information about Canada’s
navigable waters.
● Canada’s largest center for ocean research, the Bedford Institute of Oceanography,
helps makes decisions on environmental protection, health and safety, fisheries, etc.
Attitude: Value the role and contribution of science and technology in our understanding of
phenomena that are directly observable and those that are not. (436)
Connection
Using cooperative jigsaw, students may research one
Canadian contribution to meteorology or oceanography.
Consolidation
Using a choice board, students will present several
Canadian contributions to meteorology and
oceanography. Options may include PowerPoint, oral
presentation, video, cartoon strip, and social media post.
Extension Analyze current research topics to predict future weather
contributions and discoveries.
Resources
Office of Climate Change website
http://www.exec.gov.nl.ca/exec/ccee/
115-6
Explain how scientific
knowledge evolves as
new evidence comes to
light
214-17
Identify new problems
that arise from what
was learned
This outcome relates to global warming and climate change and the potential resulting
problems for the environment, society and economy now and for the future.
When scientists talk about climate change, they discuss all aspects of weather and not just
temperature; precipitation, wind and storms also relate to climate change.
Students are expected to
Trace the evolution of global warming and how it has resulted in climate change.
Identify human activities that are believed to contribute to climate change Briefly describe the impacts of climate change on ecosystems and weather systems
Students should complete an activity to study the change in global temperatures over a long
period of time. From this activity students will realize that the planet is warming and that
recent changes in global average temperatures are occurring at a faster rate than they have in
the past. This activity should lead to a discussion of why the global temperature is increasing
and the impact on ecosystems.
Activation
Show the “Six Degrees can Change the World”
documentary from National Geographic. Students may
analyze the impact that each degree of temperature
change has on global weather patterns and ecosystems.
Connections
Students can compare average global temperatures over
long periods of time to investigate the rate and types of
changes.
Students can complete an activity in which they collect
information on the types and levels of airborne pollutants
in the atmosphere in their geographic area using the
“Pollution Watch”: http://www.pollutionwatch.org
Students may complete the “Calculating Carbon
Emissions” Activity in BC Science 10 textbook.
Students may use the “Individual Carbon Calculator” to
determine their own carbon footprint.
http://www.turnbackthetide.ca
Students may participate in Let’s Talk Science Curiocity
Action Project “Energy4Travel”
Consolidation By analyzing visuals of a glacier over a period of time,
explain how the rate of glacier melt has changed our
understanding of global warming. Identify the impacts that arise from global warming.
Students may infer problems that may result from
changing global temperatures. In making predictions for
the future, students may make an art project, physical
model, written report, PowerPoint.

Extension
Explain how the increased presence of icebergs impacts
local ecosystems.
Resource
National pollutant release inventory
http://www.ec.gc.ca/inrp-npri
http://www.turnbackthetide.ca
http://www.explorecuriocity.org
213-6
use library and
electronic research
tools to collect
information on a given
topic
214-11
provide a statement
that addresses the
problem or answers the
question investigated in
light of the link
between data and the
conclusion
Students are expected to use library and electronic sources to collect information about the
effect of global warming and climate change on a certain geographical region and how
changes in weather patterns can impact, both short and long term, the environment, economy
and society for a particular area.
Examples of topics for students to research include:
● Bonavista or any other coastal community in Newfoundland ● Northwest passage ● Inland regions of Canada ● Atlantic ocean ● Prairie provinces in Canada ● Highly industrialized regions/cities
● Great Barrier Reef
● Newtok, Alaska
● The Alps
● Mumbai, India
● Island Nations
Connection
Students may watch a video on ice caps melting and set
up a classroom debate on the impact of global warming
on ecosystems.
“Disappearing Arctic Ice” (video) CBC: The National
(http://www.cbc.ca/player/Embedded-
Only/News/ID/2282025985/)
Students can list the sources of pollution for their
geographic region
Consolidation
Students may develop strategies and solutions to help
reduce the impact of pollutants locally and globally
Students may complete research on the impact of climate
change on a specific geographical location, local or
global, and present their findings to a small group.
114-6
Relate personal
activities and various
scientific and
technological
endeavours to specific
science disciplines and
interdisciplinary
studies.
Students will relate specific science disciplines to climate change and its causes and specific
science disciplines that contribute to our understanding of climate change.
Students are expected to relate climate change to the study of ecology, motion and chemical
reactions. Climatologists study weather patterns over a long period of time and changes in
these patterns as well as global temperatures.
This can be related to the chemistry and physics unit in which students can make a
connection between the work of chemists, biologists, and physicists all coming together and
being required to help understand climate change and its impacts.
Connection
Students may brainstorm what science disciplines are
involved in the study of climate change and its effects.
Related Documents


