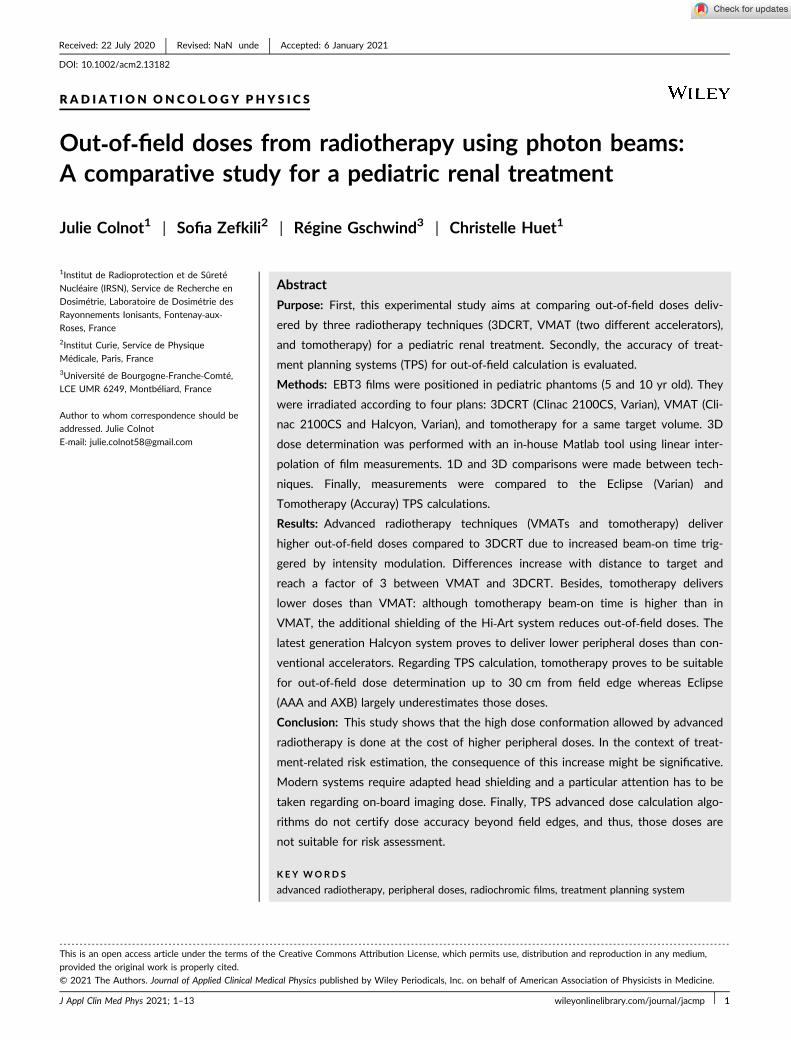
HAL Id: hal-03257648 https://hal.archives-ouvertes.fr/hal-03257648 Submitted on 4 Nov 2021 HAL is a multi-disciplinary open access archive for the deposit and dissemination of sci- entific research documents, whether they are pub- lished or not. The documents may come from teaching and research institutions in France or abroad, or from public or private research centers. L’archive ouverte pluridisciplinaire HAL, est destinée au dépôt et à la diffusion de documents scientifiques de niveau recherche, publiés ou non, émanant des établissements d’enseignement et de recherche français ou étrangers, des laboratoires publics ou privés. Out-of-field doses from radiotherapy using photon beams: A comparative study for a pediatric renal treatment Julie Colnot, Sofia Zefkili, Regine Gschwind, Christelle Huet To cite this version: Julie Colnot, Sofia Zefkili, Regine Gschwind, Christelle Huet. Out-of-field doses from radiotherapy using photon beams: A comparative study for a pediatric renal treatment. Journal of Applied Clinical Medical Physics, WILEY, 2021, 22 (3), pp.94 - 106. 10.1002/acm2.13182. hal-03257648

Welcome message from author
This document is posted to help you gain knowledge. Please leave a comment to let me know what you think about it! Share it to your friends and learn new things together.
Transcript
HAL Id: hal-03257648https://hal.archives-ouvertes.fr/hal-03257648
Submitted on 4 Nov 2021
HAL is a multi-disciplinary open accessarchive for the deposit and dissemination of sci-entific research documents, whether they are pub-lished or not. The documents may come fromteaching and research institutions in France orabroad, or from public or private research centers.
L’archive ouverte pluridisciplinaire HAL, estdestinée au dépôt et à la diffusion de documentsscientifiques de niveau recherche, publiés ou non,émanant des établissements d’enseignement et derecherche français ou étrangers, des laboratoirespublics ou privés.
Out-of-field doses from radiotherapy using photonbeams: A comparative study for a pediatric renal
treatmentJulie Colnot, Sofia Zefkili, Regine Gschwind, Christelle Huet
To cite this version:Julie Colnot, Sofia Zefkili, Regine Gschwind, Christelle Huet. Out-of-field doses from radiotherapyusing photon beams: A comparative study for a pediatric renal treatment. Journal of Applied ClinicalMedical Physics, WILEY, 2021, 22 (3), pp.94 - 106. �10.1002/acm2.13182�. �hal-03257648�
R AD I A T I ON ONCO LOG Y PH Y S I C S
Out‐of‐field doses from radiotherapy using photon beams:A comparative study for a pediatric renal treatment
Julie Colnot1 | Sofia Zefkili2 | Régine Gschwind3 | Christelle Huet1
1Institut de Radioprotection et de Sûreté
Nucléaire (IRSN), Service de Recherche en
Dosimétrie, Laboratoire de Dosimétrie des
Rayonnements Ionisants, Fontenay‐aux‐Roses, France
2Institut Curie, Service de Physique
Médicale, Paris, France
3Université de Bourgogne‐Franche‐Comté,
LCE UMR 6249, Montbéliard, France
Author to whom correspondence should be
addressed. Julie Colnot
E‐mail: [email protected]
Abstract
Purpose: First, this experimental study aims at comparing out‐of‐field doses deliv-
ered by three radiotherapy techniques (3DCRT, VMAT (two different accelerators),
and tomotherapy) for a pediatric renal treatment. Secondly, the accuracy of treat-
ment planning systems (TPS) for out‐of‐field calculation is evaluated.
Methods: EBT3 films were positioned in pediatric phantoms (5 and 10 yr old). They
were irradiated according to four plans: 3DCRT (Clinac 2100CS, Varian), VMAT (Cli-
nac 2100CS and Halcyon, Varian), and tomotherapy for a same target volume. 3D
dose determination was performed with an in‐house Matlab tool using linear inter-
polation of film measurements. 1D and 3D comparisons were made between tech-
niques. Finally, measurements were compared to the Eclipse (Varian) and
Tomotherapy (Accuray) TPS calculations.
Results: Advanced radiotherapy techniques (VMATs and tomotherapy) deliver
higher out‐of‐field doses compared to 3DCRT due to increased beam‐on time trig-
gered by intensity modulation. Differences increase with distance to target and
reach a factor of 3 between VMAT and 3DCRT. Besides, tomotherapy delivers
lower doses than VMAT: although tomotherapy beam‐on time is higher than in
VMAT, the additional shielding of the Hi‐Art system reduces out‐of‐field doses. The
latest generation Halcyon system proves to deliver lower peripheral doses than con-
ventional accelerators. Regarding TPS calculation, tomotherapy proves to be suitable
for out‐of‐field dose determination up to 30 cm from field edge whereas Eclipse
(AAA and AXB) largely underestimates those doses.
Conclusion: This study shows that the high dose conformation allowed by advanced
radiotherapy is done at the cost of higher peripheral doses. In the context of treat-
ment‐related risk estimation, the consequence of this increase might be significative.
Modern systems require adapted head shielding and a particular attention has to be
taken regarding on‐board imaging dose. Finally, TPS advanced dose calculation algo-
rithms do not certify dose accuracy beyond field edges, and thus, those doses are
not suitable for risk assessment.
K E Y WORD S
advanced radiotherapy, peripheral doses, radiochromic films, treatment planning system
- - - - - - - - - - - - - - - - - - - - - - - - - - - - - - - - - - - - - - - - - - - - - - - - - - - - - - - - - - - - - - - - - - - - - - - - - - - - - - - - - - - - - - - - - - - - - - - - - - - - - - - - - - - - - - - - - - - - - - - - - - - - - - - - - - - - - - - - - - - - - - - - - - - - - - - - - - - - - - - - - - - - - -This is an open access article under the terms of the Creative Commons Attribution License, which permits use, distribution and reproduction in any medium,
provided the original work is properly cited.
© 2021 The Authors. Journal of Applied Clinical Medical Physics published by Wiley Periodicals, Inc. on behalf of American Association of Physicists in Medicine.
Received: 22 July 2020 | Revised: NaN unde | Accepted: 6 January 2021
DOI: 10.1002/acm2.13182
J Appl Clin Med Phys 2021; 1–13 wileyonlinelibrary.com/journal/jacmp | 1
1 | INTRODUCTION
Recently, early diagnosis and improvements in treatment techniques
and therapeutic strategies have led to an increasing success of can-
cer treatments.1 Consequently, patients’ life expectancy following
cancer is increasing and more patients will survive long after treat-
ments. Among the different techniques involved, radiation therapy is
nowadays used in more than 50% of cancer treatments2,3 and its
efficacy has been largely acknowledged. The most advanced tech-
niques enable conformal dose distribution to the tumor volume
reducing adjacent organs doses. This precision in dose delivery is
carried out thanks to multiple beam incidences, beams’ intensity
modulation, and a precise patient positioning using on‐board imaging
systems. However, modern radiotherapy inevitably increases the vol-
ume of normal tissue exposed to ionizing radiation from treatment
beams themselves, from out‐of‐field radiation,4 and also from daily
imaging.5
The exposure of normal tissues may lead to adverse effects fol-
lowing treatments. Although deterministic effects only appear at high
doses, stochastic effects such as second cancers or cardiac diseases
can be related to low doses exposure and can occur years after
treatment. As life expectancy after cancer is increasing and modern
techniques are now widely used, late treatment‐related side effects
are becoming an important concern. Besides, this issue is even more
important for young patients because of their high organs radiosen-
sitivity and their long‐term survival following primary cancer.6 The
risks related to medical exposure are determined from epidemiologi-
cal studies which aim at correlating doses to observed side effects.
Thus, a precise knowledge of the dose distribution delivered to
patients and to healthy organs is needed to enhance the prediction
of adverse effects risks and their reduction. Modern treatment plan-
ning systems (TPS) enable a precise determination of the doses
delivered within the treatment beams but for locations outside the
treatment field edge, some tend to largely underestimate the doses7. In addition, the accuracy of out‐of‐field dose determination of
some recent TPS algorithms is not well known. Therefore, they can-
not be used to estimate related adverse effects risks. Furthermore,
there is few experimental data regarding out‐of‐field doses acquired
in realistic conditions (anthropomorphic phantoms), in particular for
recent radiotherapy techniques and for pediatric patients.
The Institut Curie (Paris, France) has a long experience in pedi-
atric oncology. In this institute, photon radiotherapy is particularly
involved in the treatment of pediatric abdomino‐pelvic cancers and
among them, our work focuses on renal tumors which are frequently
represented. Before the generalization of intensity modulation, the
standard radiotherapy modality used to treat those cancers was con-
ventional three‐dimensional conformal treatment (3DCRT) consisting
in two anteroposterior beams. Now, they are typically treated using
volumetric arc therapy (VMAT) using conventional linear accelerators
and sometimes using tomotherapy units.
In this context, the first aim of this experimental study is to com-
pare the peripheral doses delivered by two advanced techniques
(VMAT and tomotherapy) and by conventional 3DCRT for pediatric
abdomino‐pelvic cancers treatment. In this study, in addition to the
Clinac 2100, the latest generation accelerator Halcyon version 2.0
(Varian Medical System), newly installed at the Institut Curie was
also included to deliver VMAT plans as its use may be considered in
the future for pediatric patients. This accelerator is a single‐beam6 MV‐FFF system equipped with dual‐layer multi‐leaf collimator
(MLC) and fixed primary and secondary collimators.8,9 Clinically rele-
vant treatment plans according to commonly used planning protocols
were prepared for two anthropomorphic pediatric phantoms (5 and
10 yr old). Peripheral dose comparison was performed thanks to
EBT3 film measurements placed in these phantoms in order to over-
come the possible inaccuracy of TPS algorithms outside the treat-
ment field.7 The measured out‐of‐field doses were reconstructed in
3D by linear interpolation using original in‐house Matlab scripts.10
The second aim of the present study is to evaluate the accuracy of
two TPS for out‐of‐field dose calculation. For that purpose, TPS cal-
culated doses obtained for the two phantoms and the different tech-
niques are compared to the experimental doses obtained from the
film measurements. The TPS Eclipse™ (Varian MS) and tomotherapy
(Accuray Inc., Sunnyvale, CA, USA) were studied.
2 | MATERIALS AND METHODS
2.A | Treatment planning
The heterogeneous ATOM® dummies (CIRS, Norfolk, VA) represent-
ing children aged 5 and 10 yr old were used in this study. They were
scanned with a 3 mm slice thickness using an Aquilion LB (Toshiba)
CT scanner at the Institut Curie (Paris, France) according to a clinical
protocol. Two pediatric patients, morphologically similar to the two
phantoms and previously treated at the Institut Curie for renal
tumors, were then selected. Those patients were extracted from a
pediatric patient cohort treated for renal tumors gathered by a radio-
therapist. Different parameters were analyzed in that cohort: patient
age, patient size, patient weight, PTV volume, and PTV localization.
The two selected patients corresponded to the median case for each
age group. Using the Eclipse™ TPS (Varian Medical System), the
patients’ CT images and their outlined structures were registered on
the phantoms’ CT images using deformable registration. In order to
obtain realistic planning treatment volumes (PTV) and organs shapes
in the phantoms, the registered structures were copied on phantoms
CT images and manually processed to avoid any overlap. The PTV
including the clinical target volume (CTV) with a 5 mm margin and
the vertebrae in its immediate proximity were of 726 cc and of
382 cc for the 5‐year‐old and 10‐year‐old phantoms, respectively.
For the 10‐year‐old phantom, the PTV is central and located slightly
to the left of the lumbar rachis. For the 5‐year‐old phantom, the tar-
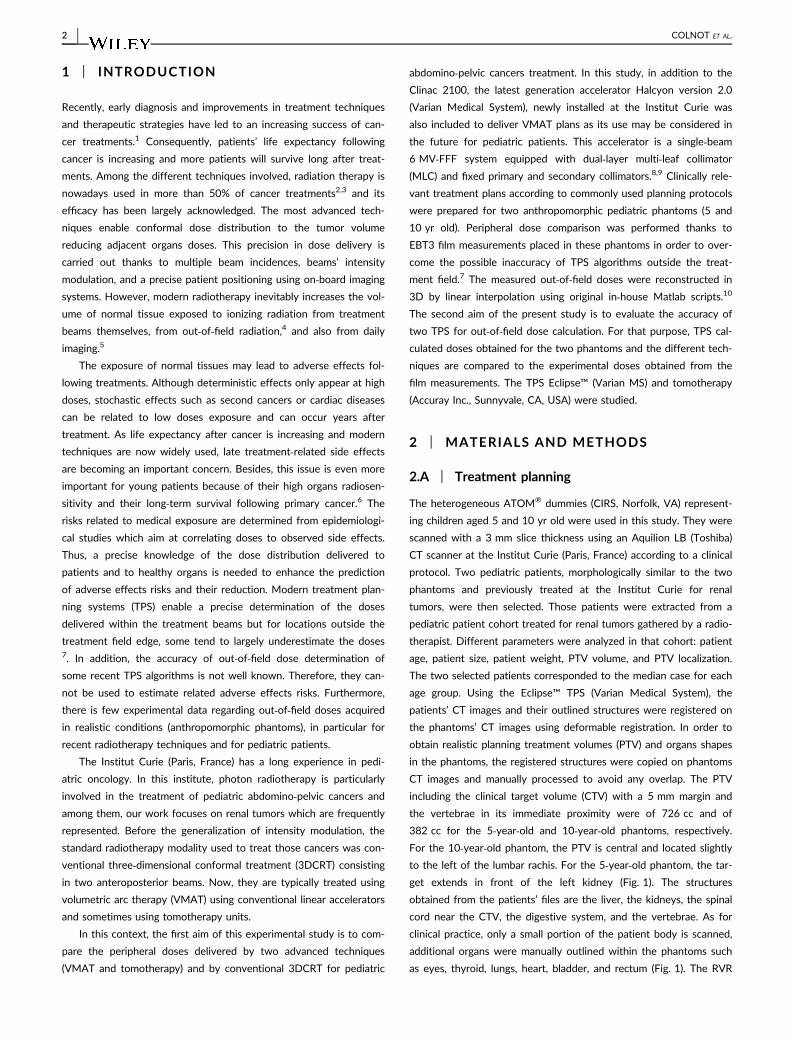
get extends in front of the left kidney (Fig. 1). The structures
obtained from the patients’ files are the liver, the kidneys, the spinal
cord near the CTV, the digestive system, and the vertebrae. As for
clinical practice, only a small portion of the patient body is scanned,
additional organs were manually outlined within the phantoms such
as eyes, thyroid, lungs, heart, bladder, and rectum (Fig. 1). The RVR
2 | COLNOT ET AL.
(remaining volume at risk), defined by the difference between the
volume of the body contour and that of the CTV and the outlined
organs, was also studied in this work.
For each phantom, four treatment plans were developed and
optimized in accordance with clinical constraints and the institute
pediatric experience. Table 1 lists the parameters of the four treat-
ment plans. The VMAT and 3DCRT plans were optimized using the
AAA algorithm (Eclipse™, Varian) and then recalculated using
Acuros® (except for the Halcyon plan) in dose to water by keeping
the same MU per beam. Tomotherapy plans were calculated with
the dedicated Tomotherapy TPS (Accuray). The dose calculation grid
includes the entire body of phantoms. To study the two jaw modes
available on the tomotherapy system (static and dynamic), the static
mode was used for the 5‐year‐old plan whereas the dynamic delivery
was used for the 10‐year‐old plan. The jaw width was set to 2.5 cm
for the two phantoms. All the plans were generated with 6 MV
beams, the tomotherapy and Halcyon units use FFF beams. 21 Gy
(14 fractions) were prescribed to the PTV and the dose was normal-
ized so that the mean PTV dose matches the prescribed dose. In the
following, the VMAT plan performed with the Clinac 2100CS accel-
erator is referred as VMAT plan whereas the one performed with
the Halcyon system is referred as Halcyon plan.
2.B | Radiochromic film dosimetry and phantomirradiation
For dose measurements on phantoms, EBT3 radiochromic films (Ash-
land) were used. EBT3 films were chosen for out‐of‐field dose mea-
surements as their response proves to have little dependence with
energy.12–16 Moreover, they allow 2D dose measurements and they
can easily be housed in anthropomorphic phantoms. Measurements
were performed according to a rigorous protocol (cutting, calibration,
readout) developed in our laboratory.11 In particular, it is based on a
pixel‐to‐pixel background subtraction method with the use of the
red channel only in order to overcome the limits of the multichannel
correction method at low doses.15 Measurements uncertainty was
assessed as described in.11 This protocol leads to dose measure-
ments with a standard deviation of 2.9% (1 sigma) in the 0.5–4.0 Gy
dose range (reaching 4.5% (1 sigma) for doses below 0.5 Gy).
Besides, this protocol was confronted to a Farmer ion chamber for
off‐axis dose measurements in a previous work17 and demonstrates
good agreement with maximum discrepancies of 20% up to 6 cGy.
The calibration was made at the Institut Curie with a Clinac
2100CS linear accelerator (Varian MS); calibration films were irradi-
ated the same day as the phantoms. The films were calibrated from
approximately 1.3 cGy (2 MU) to 24 Gy using 18 dose points
(2 films per dose) between tissue‐equivalent slabs at 10 cm in depth
with a 10 × 10 cm2field (SSD = 100 cm). Besides, two overlapping
fit curves (from 0.013 Gy to 5 Gy and from 3 Gy to 24 Gy) have
been used to make sure that low doses are perfectly represented by
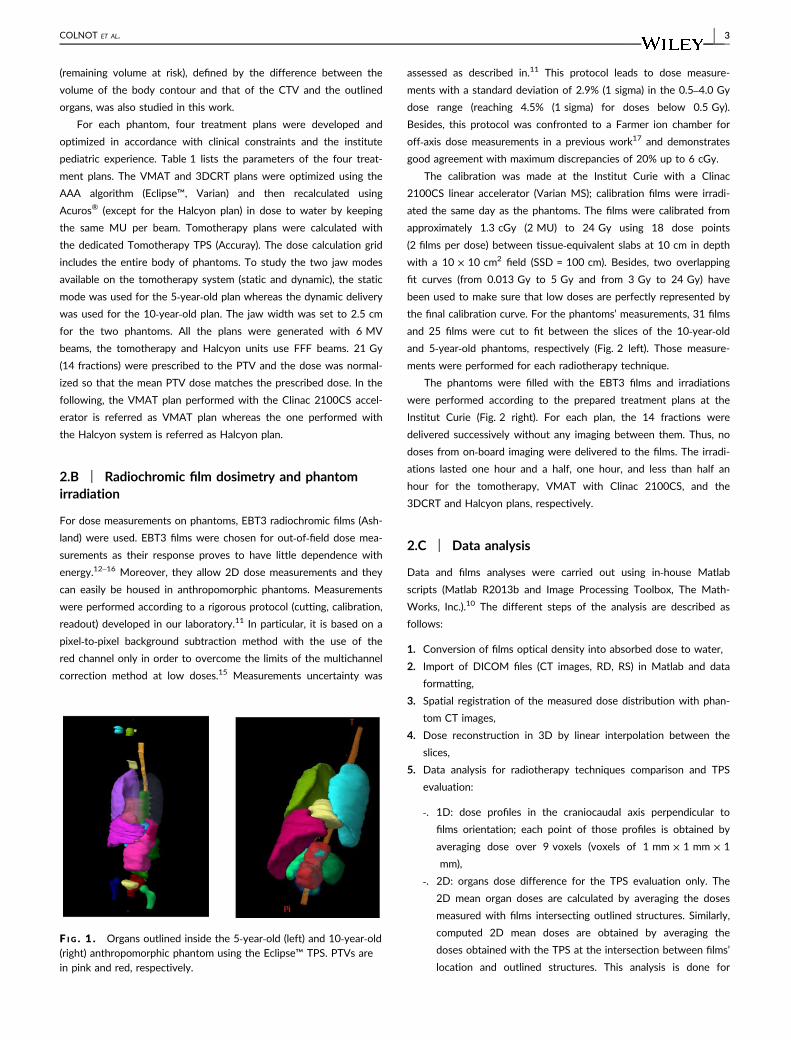
the final calibration curve. For the phantoms’ measurements, 31 films
and 25 films were cut to fit between the slices of the 10‐year‐oldand 5‐year‐old phantoms, respectively (Fig. 2 left). Those measure-
ments were performed for each radiotherapy technique.
The phantoms were filled with the EBT3 films and irradiations
were performed according to the prepared treatment plans at the
Institut Curie (Fig. 2 right). For each plan, the 14 fractions were
delivered successively without any imaging between them. Thus, no
doses from on‐board imaging were delivered to the films. The irradi-
ations lasted one hour and a half, one hour, and less than half an
hour for the tomotherapy, VMAT with Clinac 2100CS, and the
3DCRT and Halcyon plans, respectively.
2.C | Data analysis
Data and films analyses were carried out using in‐house Matlab
scripts (Matlab R2013b and Image Processing Toolbox, The Math-
Works, Inc.).10 The different steps of the analysis are described as
follows:
1. Conversion of films optical density into absorbed dose to water,
2. Import of DICOM files (CT images, RD, RS) in Matlab and data
formatting,
3. Spatial registration of the measured dose distribution with phan-
tom CT images,
4. Dose reconstruction in 3D by linear interpolation between the
slices,
5. Data analysis for radiotherapy techniques comparison and TPS
evaluation:
‐. 1D: dose profiles in the craniocaudal axis perpendicular to
films orientation; each point of those profiles is obtained by
averaging dose over 9 voxels (voxels of 1 mm × 1 mm × 1
mm),
‐. 2D: organs dose difference for the TPS evaluation only. The
2D mean organ doses are calculated by averaging the doses
measured with films intersecting outlined structures. Similarly,
computed 2D mean doses are obtained by averaging the
doses obtained with the TPS at the intersection between films’
location and outlined structures. This analysis is done for
F I G . 1 . Organs outlined inside the 5‐year‐old (left) and 10‐year‐old(right) anthropomorphic phantom using the Eclipse™ TPS. PTVs arein pink and red, respectively.
COLNOT ET AL. | 3
every contoured structure intersecting films: it includes organs
located inside treatment beams.
‐. 3D outside the treatment field border (below 5% of the pre-
scribed dose): mean organ doses and DVH obtained from
doses reconstructed in 3D and calculated doses. For organs
partially within the treatment beams, only the volume located
outside the beams was considered for this dose determination.
The comparison of out‐of‐field doses delivered by the different
radiotherapy techniques is based on the measured doses obtained from
the films. This experimental comparison enables a robust comparison as
it overcomes the potential TPS inaccuracy of dose calculation at dis-
tance from PTV. In the second part, the accuracy of TPS dose calcula-
tion is studied by comparing measured and calculated dose.
3 | RESULTS
3.A | Comparative study of out‐of‐field dosesdelivered by radiotherapy techniques
3.A.1 | Five‐year‐old phantom
1‐D comparison
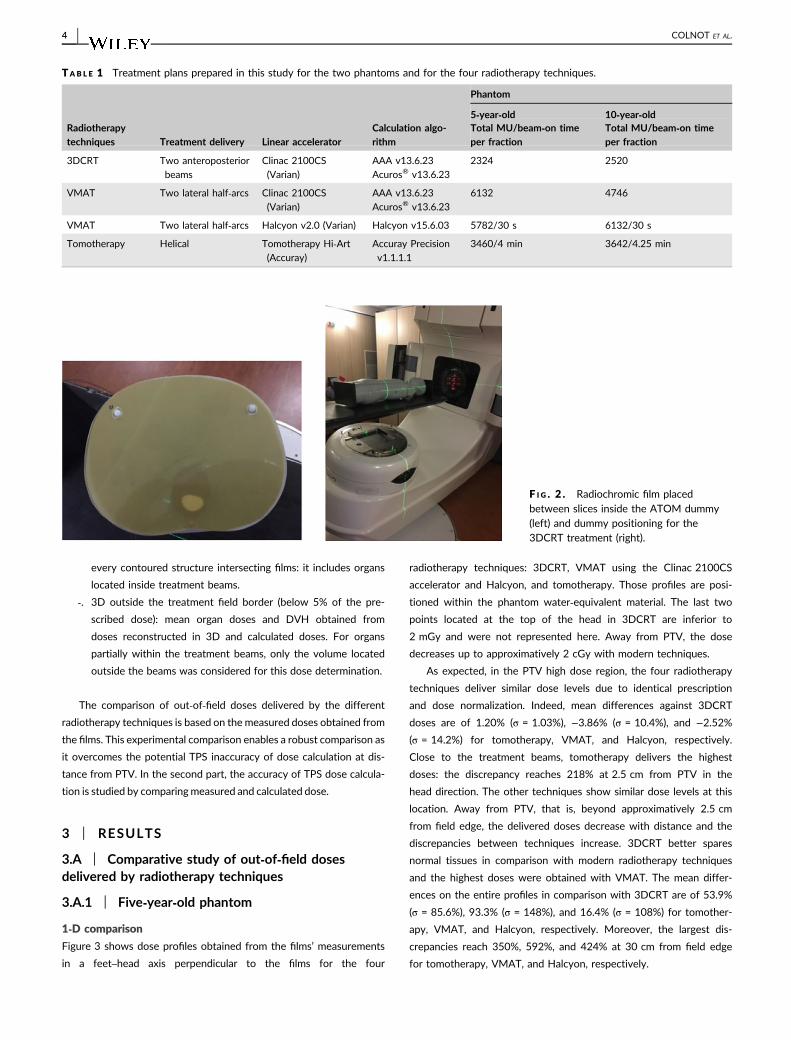
Figure 3 shows dose profiles obtained from the films’ measurements
in a feet–head axis perpendicular to the films for the four
radiotherapy techniques: 3DCRT, VMAT using the Clinac 2100CS
accelerator and Halcyon, and tomotherapy. Those profiles are posi-
tioned within the phantom water‐equivalent material. The last two
points located at the top of the head in 3DCRT are inferior to
2 mGy and were not represented here. Away from PTV, the dose
decreases up to approximatively 2 cGy with modern techniques.
As expected, in the PTV high dose region, the four radiotherapy
techniques deliver similar dose levels due to identical prescription
and dose normalization. Indeed, mean differences against 3DCRT
doses are of 1.20% (σ = 1.03%), −3.86% (σ = 10.4%), and −2.52%
(σ = 14.2%) for tomotherapy, VMAT, and Halcyon, respectively.
Close to the treatment beams, tomotherapy delivers the highest
doses: the discrepancy reaches 218% at 2.5 cm from PTV in the
head direction. The other techniques show similar dose levels at this
location. Away from PTV, that is, beyond approximatively 2.5 cm
from field edge, the delivered doses decrease with distance and the
discrepancies between techniques increase. 3DCRT better spares
normal tissues in comparison with modern radiotherapy techniques
and the highest doses were obtained with VMAT. The mean differ-
ences on the entire profiles in comparison with 3DCRT are of 53.9%
(σ = 85.6%), 93.3% (σ = 148%), and 16.4% (σ = 108%) for tomother-
apy, VMAT, and Halcyon, respectively. Moreover, the largest dis-
crepancies reach 350%, 592%, and 424% at 30 cm from field edge
for tomotherapy, VMAT, and Halcyon, respectively.
TAB L E 1 Treatment plans prepared in this study for the two phantoms and for the four radiotherapy techniques.
Radiotherapytechniques Treatment delivery Linear accelerator
Calculation algo-rithm
Phantom
5‐year‐old 10‐year‐oldTotal MU/beam‐on timeper fraction
Total MU/beam‐on timeper fraction
3DCRT Two anteroposterior
beams
Clinac 2100CS
(Varian)
AAA v13.6.23
Acuros® v13.6.23
2324 2520
VMAT Two lateral half‐arcs Clinac 2100CS
(Varian)
AAA v13.6.23
Acuros® v13.6.23
6132 4746
VMAT Two lateral half‐arcs Halcyon v2.0 (Varian) Halcyon v15.6.03 5782/30 s 6132/30 s
Tomotherapy Helical Tomotherapy Hi‐Art(Accuray)
Accuray Precision
v1.1.1.1
3460/4 min 3642/4.25 min
F I G . 2 . Radiochromic film placedbetween slices inside the ATOM dummy(left) and dummy positioning for the3DCRT treatment (right).
4 | COLNOT ET AL.
3D doses delivered outside the treatment field border
Mean doses reconstructed in 3D outside treatment beams are given
in Table 2 in percent of the prescribed dose for the different radio-
therapy techniques. They range from 0.04% of the prescribed dose
(pituitary and eye) to 2.73% of the prescribed dose (rectum). The
least exposed organs are located in the head with doses between
1 cGy (0.04% of prescribed dose) and 4 cGy (0.20% of prescribed
dose) depending on technique. The dose differences compared to
3DCRT are listed in Table 3.
Given the results presented in Tables 2 and 3, 3DCRT, and Hal-
cyon enable a better sparing of organs located outside the treatment
beams in the head direction in comparison with the other tech-
niques. This result is consistent with previous 1D results. In the head
direction, 3DCRT better spares all the organs in comparison with
VMAT and tomotherapy and dose levels are similar to Halcyon (for
the heart for instance). The most important relative discrepancies are
obtained for head and neck organs located far from the PTV
(Table 3), reaching 370% for pituitary in VMAT.
Doses delivered outside treatment beams are globally lower with
tomotherapy than with VMAT. Thus, for organs more distant from
PTV, VMAT delivers the higher dose levels: the differences with
tomotherapy reach 44.1% for the eyes and 16.3% for the out‐of‐field RVR.
The relative difference between VMAT, tomotherapy, and
3DCRT is also important for the pelvic region located closer to the
PTV (Table 3). Regarding modern techniques, the measured 3D
doses are higher with tomotherapy than with VMAT for the pelvic
organs close to the PTV (rectum, bladder) as observed in 1D. The
dose discrepancies reach 11.7% and 9.90% for rectum and bladder,
respectively. However, when the entire pelvic region is considered,
the mean dose delivered in VMAT is superior of 4.84% in compar-
ison with tomotherapy. Regarding Halcyon, the dose delivered to the
entire pelvis is similar to 3DCRT (Table 3) but this technique largely
enables to spare rectum (−11.2%) and bladder (−18.8%) compared
to 3DCRT.
3.A.2 | Ten‐year‐old phantom
1‐D comparison
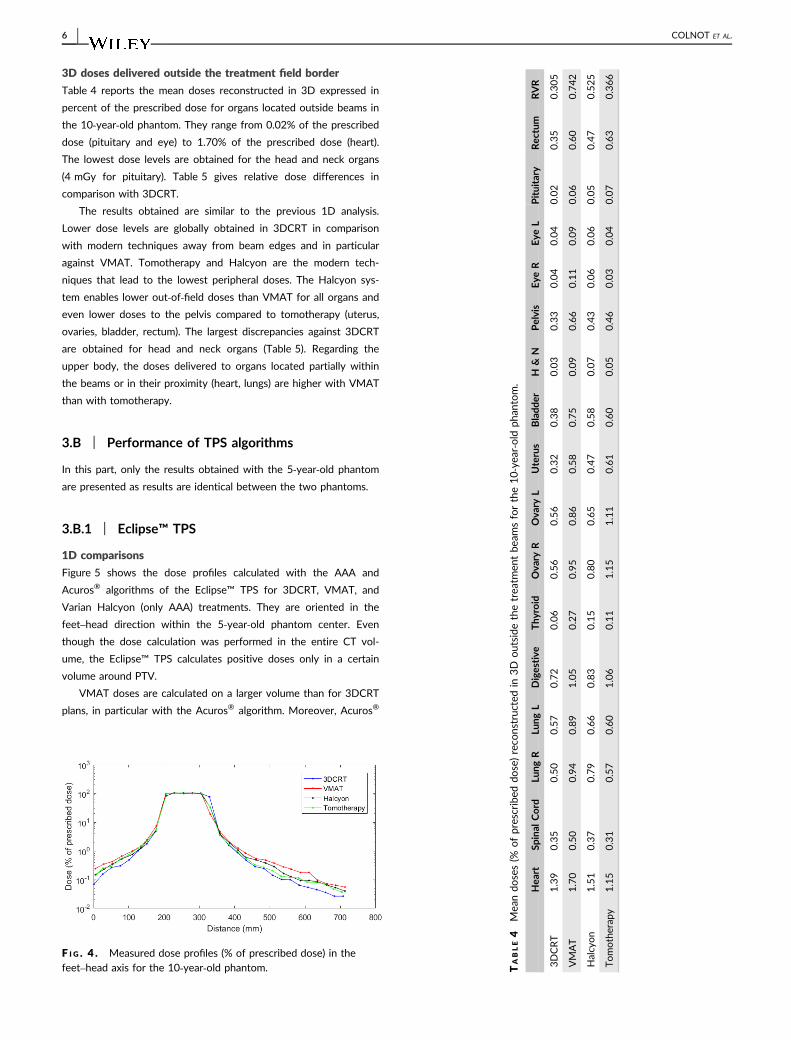
Figure 4 shows the measured dose profiles in the feet–head direc-
tion perpendicular to the films for the four radiotherapy modalities.
The results are consistent with those obtained for the 5‐year‐oldphantom. On those profiles, the lowest doses are approximatively of
4 mGy.
As expected, in the high dose region, the four techniques deliver
similar dose levels with mean differences against 3DCRT of 2.08%
(σ = 1.19%), of 1.48% (σ = 2.07%), and of −0.251% (σ = 8.95%) for
VMAT, tomotherapy, and Halcyon, respectively. Contrary to the 5‐year‐old phantom, close to the PTV in the caudal direction, the four
techniques deliver similar doses whereas in the cranial direction, the
dose levels are 75.2% higher in 3DCRT than in VMAT. Moreover, in
the cranial direction, the doses measured are similar in tomotherapy
and 3DCRT from 5 cm to 17.5 cm from field edge.
F I G . 3 . Measured dose profiles (% of prescribed dose) in the feet–head axis for the 5‐year‐old phantom.
TAB L E 2 Mean doses (% of prescribed dose) reconstructed in 3D outside the treatment beams for the 5‐year‐old phantom.
Heart Spinal cord Lung R Lung L Thyroid Rectum Bladder Eye R Eye L Pituitary H & N Pelvis RVR
3DCRT 1.51 0.50 0.78 1.11 0.19 2.15 2.54 0.04 0.06 0.04 0.07 1.07 0.54
VMAT 1.89 0.83 1.42 1.36 0.49 2.20 2.48 0.21 0.23 0.20 0.23 1.38 0.81
Halcyon 1.44 0.52 1.05 0.92 0.25 1.91 2.07 0.09 0.09 0.09 0.10 1.03 0.54
Tomotherapy 1.76 0.61 1.11 1.22 0.29 2.45 2.73 0.12 0.12 0.12 0.14 1.31 0.67
TAB L E 3 Relative 3D dose difference between VMAT,tomotherapy, Halcyon and 3DCRT for the 5‐year‐old phantom.
VMAT/3DCRT
Tomotherapy/3DCRT
Halcyon/3DCRT
Heart 25.4 16.9 −4.56
Spinal cord 66.6 22.7 3.44
Lung R 82.2 41.9 35.0
Lung L 21.9 9.99 −17.0
Thyroid 153 50.2 28.5
Rectum 1.95 13.9 −11.2
Bladder −2.44 7.22 −18.8
Eye R 365 175 101
Eye L 306 115 63.0
Pituitary 370 190 125
Head and
Neck
234 108 44.4
Pelvis 29.3 23.1 −3.50
RVR 48.3 24.1 0.29
COLNOT ET AL. | 5
3D doses delivered outside the treatment field border
Table 4 reports the mean doses reconstructed in 3D expressed in
percent of the prescribed dose for organs located outside beams in
the 10‐year‐old phantom. They range from 0.02% of the prescribed
dose (pituitary and eye) to 1.70% of the prescribed dose (heart).
The lowest dose levels are obtained for the head and neck organs
(4 mGy for pituitary). Table 5 gives relative dose differences in
comparison with 3DCRT.
The results obtained are similar to the previous 1D analysis.
Lower dose levels are globally obtained in 3DCRT in comparison
with modern techniques away from beam edges and in particular
against VMAT. Tomotherapy and Halcyon are the modern tech-
niques that lead to the lowest peripheral doses. The Halcyon sys-
tem enables lower out‐of‐field doses than VMAT for all organs and
even lower doses to the pelvis compared to tomotherapy (uterus,
ovaries, bladder, rectum). The largest discrepancies against 3DCRT
are obtained for head and neck organs (Table 5). Regarding the
upper body, the doses delivered to organs located partially within
the beams or in their proximity (heart, lungs) are higher with VMAT
than with tomotherapy.
3.B | Performance of TPS algorithms
In this part, only the results obtained with the 5‐year‐old phantom
are presented as results are identical between the two phantoms.
3.B.1 | Eclipse™ TPS
1D comparisons
Figure 5 shows the dose profiles calculated with the AAA and
Acuros® algorithms of the Eclipse™ TPS for 3DCRT, VMAT, and
Varian Halcyon (only AAA) treatments. They are oriented in the
feet–head direction within the 5‐year‐old phantom center. Even
though the dose calculation was performed in the entire CT vol-
ume, the Eclipse™ TPS calculates positive doses only in a certain
volume around PTV.
VMAT doses are calculated on a larger volume than for 3DCRT
plans, in particular with the Acuros® algorithm. Moreover, Acuros®
F I G . 4 . Measured dose profiles (% of prescribed dose) in thefeet–head axis for the 10‐year‐old phantom. T
ABLE4
Mea
ndo
ses(%
ofprescribed
dose)reco
nstructed
in3D
outside
thetrea
tmen
tbe
amsforthe10‐yea
r‐old
phan
tom.
Hea
rtSp
inal
Cord
Lung
RLu
ngL
Digestive
Thy
roid
Ova
ryR
Ova
ryL
Uterus
Bladd
erH
&N
Pelvis
Eye
REye
LPituitary
Rec
tum
RVR
3DCRT
1.39
0.35
0.50
0.57
0.72
0.06
0.56
0.56
0.32
0.38
0.03
0.33
0.04
0.04
0.02
0.35
0.305
VMAT
1.70
0.50
0.94
0.89
1.05
0.27
0.95
0.86
0.58
0.75
0.09
0.66
0.11
0.09
0.06
0.60
0.742
Halcyon
1.51
0.37
0.79
0.66
0.83
0.15
0.80
0.65
0.47
0.58
0.07
0.43
0.06
0.06
0.05
0.47
0.525
Tomotherap
y1.15
0.31
0.57
0.60
1.06
0.11
1.15
1.11
0.61
0.60
0.05
0.46
0.03
0.04
0.07
0.63
0.366
6 | COLNOT ET AL.
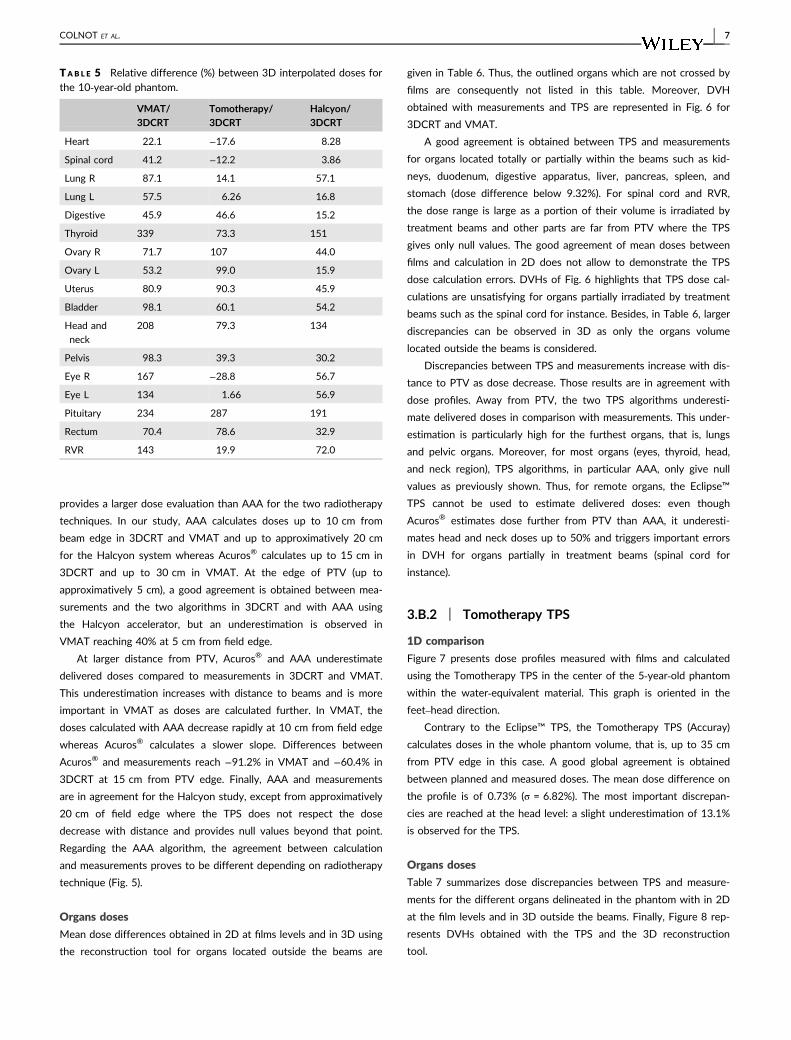
provides a larger dose evaluation than AAA for the two radiotherapy
techniques. In our study, AAA calculates doses up to 10 cm from
beam edge in 3DCRT and VMAT and up to approximatively 20 cm
for the Halcyon system whereas Acuros® calculates up to 15 cm in
3DCRT and up to 30 cm in VMAT. At the edge of PTV (up to
approximatively 5 cm), a good agreement is obtained between mea-
surements and the two algorithms in 3DCRT and with AAA using
the Halcyon accelerator, but an underestimation is observed in
VMAT reaching 40% at 5 cm from field edge.
At larger distance from PTV, Acuros® and AAA underestimate
delivered doses compared to measurements in 3DCRT and VMAT.
This underestimation increases with distance to beams and is more
important in VMAT as doses are calculated further. In VMAT, the
doses calculated with AAA decrease rapidly at 10 cm from field edge
whereas Acuros® calculates a slower slope. Differences between
Acuros® and measurements reach −91.2% in VMAT and −60.4% in
3DCRT at 15 cm from PTV edge. Finally, AAA and measurements
are in agreement for the Halcyon study, except from approximatively
20 cm of field edge where the TPS does not respect the dose
decrease with distance and provides null values beyond that point.
Regarding the AAA algorithm, the agreement between calculation
and measurements proves to be different depending on radiotherapy
technique (Fig. 5).
Organs doses
Mean dose differences obtained in 2D at films levels and in 3D using
the reconstruction tool for organs located outside the beams are
given in Table 6. Thus, the outlined organs which are not crossed by
films are consequently not listed in this table. Moreover, DVH
obtained with measurements and TPS are represented in Fig. 6 for
3DCRT and VMAT.
A good agreement is obtained between TPS and measurements
for organs located totally or partially within the beams such as kid-
neys, duodenum, digestive apparatus, liver, pancreas, spleen, and
stomach (dose difference below 9.32%). For spinal cord and RVR,
the dose range is large as a portion of their volume is irradiated by
treatment beams and other parts are far from PTV where the TPS
gives only null values. The good agreement of mean doses between
films and calculation in 2D does not allow to demonstrate the TPS
dose calculation errors. DVHs of Fig. 6 highlights that TPS dose cal-
culations are unsatisfying for organs partially irradiated by treatment
beams such as the spinal cord for instance. Besides, in Table 6, larger
discrepancies can be observed in 3D as only the organs volume
located outside the beams is considered.
Discrepancies between TPS and measurements increase with dis-
tance to PTV as dose decrease. Those results are in agreement with
dose profiles. Away from PTV, the two TPS algorithms underesti-
mate delivered doses in comparison with measurements. This under-
estimation is particularly high for the furthest organs, that is, lungs
and pelvic organs. Moreover, for most organs (eyes, thyroid, head,
and neck region), TPS algorithms, in particular AAA, only give null
values as previously shown. Thus, for remote organs, the Eclipse™
TPS cannot be used to estimate delivered doses: even though
Acuros® estimates dose further from PTV than AAA, it underesti-
mates head and neck doses up to 50% and triggers important errors
in DVH for organs partially in treatment beams (spinal cord for
instance).
3.B.2 | Tomotherapy TPS
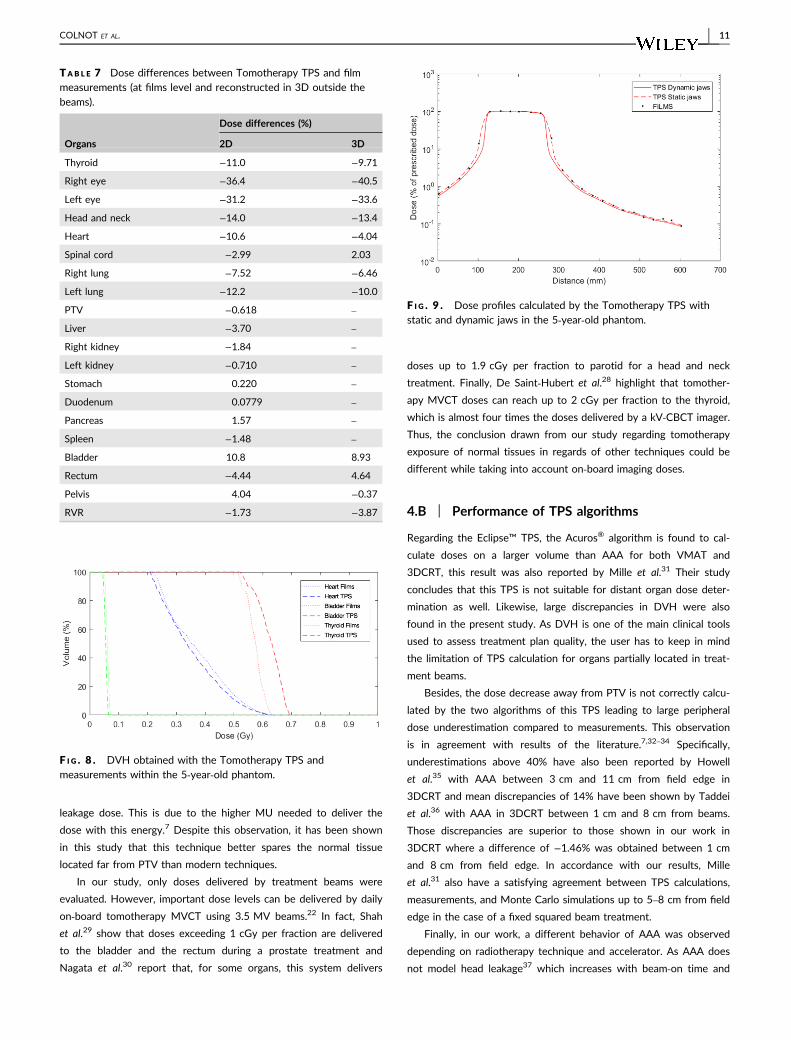
1D comparison
Figure 7 presents dose profiles measured with films and calculated
using the Tomotherapy TPS in the center of the 5‐year‐old phantom
within the water‐equivalent material. This graph is oriented in the
feet–head direction.
Contrary to the Eclipse™ TPS, the Tomotherapy TPS (Accuray)
calculates doses in the whole phantom volume, that is, up to 35 cm
from PTV edge in this case. A good global agreement is obtained
between planned and measured doses. The mean dose difference on
the profile is of 0.73% (σ = 6.82%). The most important discrepan-
cies are reached at the head level: a slight underestimation of 13.1%
is observed for the TPS.
Organs doses
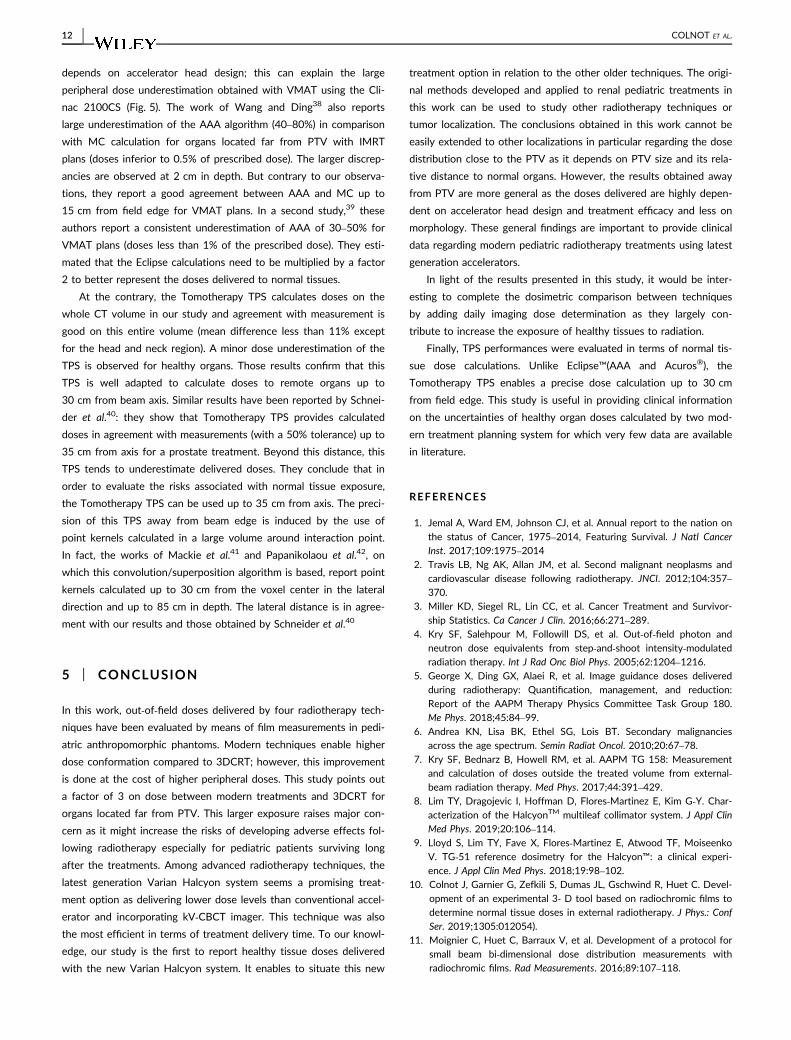
Table 7 summarizes dose discrepancies between TPS and measure-
ments for the different organs delineated in the phantom with in 2D
at the film levels and in 3D outside the beams. Finally, Figure 8 rep-
resents DVHs obtained with the TPS and the 3D reconstruction
tool.
TAB L E 5 Relative difference (%) between 3D interpolated doses forthe 10‐year‐old phantom.
VMAT/3DCRT
Tomotherapy/3DCRT
Halcyon/3DCRT
Heart 22.1 −17.6 8.28
Spinal cord 41.2 −12.2 3.86
Lung R 87.1 14.1 57.1
Lung L 57.5 6.26 16.8
Digestive 45.9 46.6 15.2
Thyroid 339 73.3 151
Ovary R 71.7 107 44.0
Ovary L 53.2 99.0 15.9
Uterus 80.9 90.3 45.9
Bladder 98.1 60.1 54.2
Head and
neck
208 79.3 134
Pelvis 98.3 39.3 30.2
Eye R 167 −28.8 56.7
Eye L 134 1.66 56.9
Pituitary 234 287 191
Rectum 70.4 78.6 32.9
RVR 143 19.9 72.0
COLNOT ET AL. | 7
A good global agreement is shown between calculated and mea-
sured doses in terms of mean doses and DVHs. Indeed, except for
the head and neck region, discrepancies do not exceed 11% (as
observed for the bladder in Fig. 8). A good agreement is obtained
for organs remote from PTV such as the rectum. The most important
differences are obtained for the eyes even though the discrepancy
for the head and neck region is of 14%.
4 | DISCUSSION
4.A | Comparative study of out‐of‐field dosesdelivered by radiotherapy techniques
Despite the difference in PTV size and morphology between the
two phantoms, the results in terms of doses delivered outside treat-
ment beams are consistent. For both phantoms, the highest doses
measured at distance from PTV were obtained with modern tech-
niques. The major difference between the two phantoms is that
more organs are spared with 3DCRT than with modern techniques
for the 10‐year‐old phantom. This is particularly observed for tho-
racic and abdominal organs such as digestive system and lungs. In
fact, for this phantom, the organs are located farther from the high
dose region than for the 5‐year‐old due to PTV size and phantom
morphology. Moreover, the measured dose levels are lower with the
10‐year‐old phantom. Similarly, for this phantom, the relative dis-
crepancies between the doses delivered with modern techniques
and 3DCRT are greater.
The increase in dose outside the treated volume with modern
radiotherapy can be explained by the longer beam‐on time of those
treatments. Indeed, MU delivered in VMAT are 88% and 164%
higher than in 3DCRT for the 10‐year‐old and 5‐year‐old phantoms,
respectively. For tomotherapy, MU are not representative of the
irradiation time as beam‐on time is superior of a factor of 2 in com-
parison with VMAT. The Halcyon system, using FFF beams, is the
most effective modern modality with only 30 s of beam‐on time per
fraction. The longer beam‐on time increases the scattered radiation
and head leakage generated by the treatment. This leads to a larger
patient exposure to secondary radiation which particularly con-
tributes away from the target volume. In this case, as the same
accelerator was used for VMAT and 3DCRT, the higher dose levels
observed with VMAT are directly related to the increase in irradia-
tion time. While comparing VMAT treatments, doses delivered by
Halcyon to thyroid or head and neck region are reduced by a factor
of 2 compared to the doses delivered with the Clinac 2100CS
F I G . 5 . Dose profiles (% of prescribed dose) calculated with the Eclipse™ TPS and compared to radiochromic film measurements for the 5‐year‐old phantom; left: 3DCRT, right: VMAT; bottom: Halcyon.
8 | COLNOT ET AL.
accelerator. These lower dose levels are also due to lower beam‐ontime and reduced stray radiation induced by FFF beams in compar-
ison with the FF beams of conventional accelerators. This larger
exposure of healthy tissues induced by intensity‐modulated radio-
therapy due to MU and beam‐on time increase was also shown by
Wang and Xu.18 They also demonstrate the more beams are used in
IMRT, the more peripheral doses are delivered to patients. More-
over, Stathakis et al.19 report that the whole‐body dose is increased
by a factor 3 with IMRT in comparison to 3DCRT for a prostate
treatment. They also highlight that this factor depends on beam
energy, field size, and collimator rotation which affects leakage
through this piece.
Although tomotherapy needs long treatment times, the recent
Hi‐Art system includes an additional shielding composed of lead
disks and of a 20 cm thick tungsten system. These components
enable to reduce peripheral doses delivered far from the target in
comparison with conventional accelerators. As former tomotherapy
systems did not include this shielding, they used to deliver higher
peripheral doses.20 This shielding is the reason why tomotherapy
better spares tissues located far from PTV in our work. Ramsey
et al.21 show that even if tomotherapy irradiation time is 5–15 times
the one of IMRT, it delivers lower or equivalent dose levels outside
the treatment edges. The use of FFF beams in tomotherapy also
decreases stray radiation coming from the accelerator head.
Recently, D’agostino et al.22 show that, for a prostate cancer,
tomotherapy delivers similar healthy organ doses to those of a 10
MV IMRT treatment taking into account the photon contribution to
the dose. Those authors also show, for a head and neck treatment,
that tomotherapy and 6 MV VMAT equally expose normal tissues
without considering on‐board imaging doses. This result is different
from the larger VMAT doses obtained in this work compared to
tomotherapy; however, as the design of the tomotherapy unit is not
described in,21 the unit may have a less effective shielding than
recent designs as used in the present work. Furthermore, on‐boardimages in tomotherapy performed with MVCT which exposes the
pelvic organs to an additional dose of 10 mGy according to these
authors were considered in.22 Kowalik et al.23 also indicate that
tomotherapy better spares every organ in comparison with IMRT for
a prostate treatment. Finally, Jeraj et al.24 and Balog et al.25 report
that the tomotherapy shielding considerably reduces the radiation
level inside the treatment room and the stray radiation delivered to
the patient. Thus, the leakage radiation in the patient plan comes in
majority from leakage through MLC closed leaves and jaws. This
radiation reaches the patient close to the beam edges; this can
explain the higher dose levels obtained in our study using tomother-
apy in comparison with VMAT. This has mostly been observed for
the 5‐year‐old phantom as the treatment has been performed with
fixed jaws triggering a larger penumbra in the craniocaudal direction
TAB L E 6 Relative dose differences (%) between calculated and measured doses within organs in 2D and 3D.
Organs
3DCRT VMAT Halcyon
2D 3D 2D 3D2D 3D
AAA Acuros® AAA Acuros® AAA Acuros® AAA Acuros® AAA AAA
Right eye −100 −100 −100 −100 −100 −100 −100 −100 −100 −100
Left eye −100 −100 −100 −100 −100 −100 −100 −100 −100 −100
Thyroid −100 −85.1 −100 −77.1 −100 −84.1 −100 −82.2 46.7 25.0
Head and neck −100 −88.0 −100 −94.0 −100 −89.2 −100 −89.6 −29.2 −39.4
Right lung −4.32 −11.6 −16.7 −18.1 −18.2 −27.2 −29.9 −38.8 2.05 31.8
Left lung −5.26 −6.04 −28.9 −17.9 −25.4 −28.3 −44.2 −46.6 −33.3 21.6
Heart 8.68 −4.24 3.94 −10.6 −13.1 −16.9 −28.4 −38.6 −33.0 −0.328
Spinal cord −2.97 −3.87 −44.2 −27.6 −3.64 −4.43 −58.8 −50.8 −8.91 1.23
PTV −0.09 −2.37 – – −1.30 −1.60 – – −4.82 –
Right kidney −8.14 −5.06 – – −4.93 −6.82 – – −1.60 –
Left kidney −0.345 −1.03 – – 3.15 0.154 – – −4.84 –
Liver −0.613 −0.575 – – −3.56 −3.48 – – −7.67 –
Stomach −0.257 0.320 – – −0.676 1.19 – – 2.52 –
Duodenum −0.132 −0.236 – – −2.71 −1.12 – – −4.79 –
Spleen 1.83 1.45 – – 2.70 2.12 – – −9.32 –
Pancreas 0.967 1.27 – – −2.36 −1.78 – – −4.61 –
Rectum −2.14 −7.82 −2.42 −7.41 0.467 −2.84 −15.7 −18.9 −13.5 21.6
Bladder 4.52 −1.02 1.67 −3.54 −5.56 −8.14 −11.0 −14.4 24.4 23.7
Pelvis −21.7 −12.8 −31.0 −17.8 −36.0 −34.1 −43.3 −39.5 20.3 18.7
RVR −2.16 −2.61 −41.0 −23.2 −3.32 −3.53 −55.3 −49.8 −5.44 10.1
COLNOT ET AL. | 9
than with dynamic jaws.26,27 This result is illustrated by Fig. 9 show-
ing calculated profiles on the 5‐year‐old phantom using fixed and
dynamic jaws with the Tomotherapy TPS. In our study, this TPS
proves to be reliable for the out‐of‐field dose calculation: it allows to
confirm the increase in penumbra triggered by static jaws and the
slight increase of peripheral dose. The dose difference between the
two profiles decreases with distance to the target reaching 7% at
30 cm from field edge.
As a consequence, our study reports an increase in dose to the
pelvis: this result raises concern given the gonads radio‐sensitivitythat may lead to an increased side effects risk. Moreover, a larger
dose to the heart has been measured in tomotherapy in comparison
to VMAT and 3DCRT for this phantom. This increase in dose can be
involved in a higher cardiac risk following treatment.28 Finally, the
dynamic jaw mode enables to reduce the dose in beam periphery26;
this is observed up to approximatively 17.5 cm from field edge in
our work.
Moreover, in this study, higher doses are observed in the caudal
direction close to the target with tomotherapy and for the two
phantoms, that is, for the two jaw modes. For instance, for the treat-
ment of the 10‐year‐old phantom, the abdominal‐pelvic organs
located near PTV (uterus, ovaries, digestive system, and rectum)
received higher doses compared to those measured in VMAT. Thus,
tomotherapy unit’s leakage seems to contribute mainly in this direc-
tion. This leakage is more important in proximity of the PTV because
when the pelvic area is considered in whole, the VMAT mean doses
are higher than those delivered in tomotherapy.
Finally, 3DCRT treatments have been performed using 6 MV
beams, which represent the worst‐case scenario in terms of photon
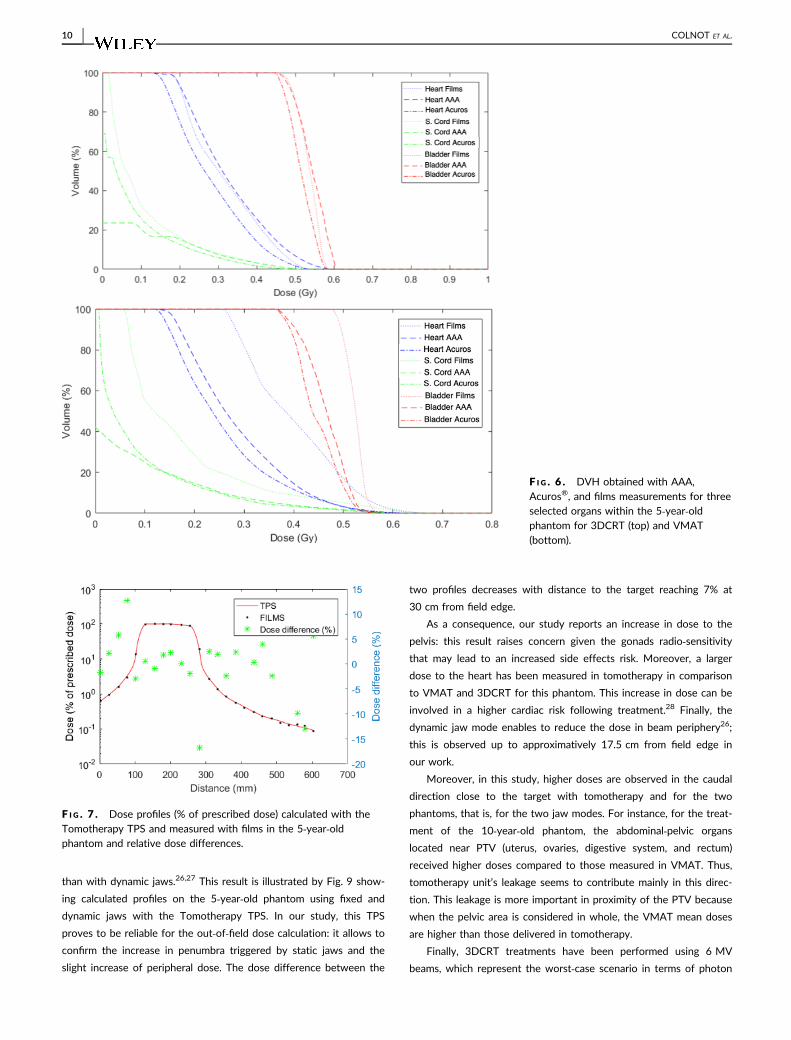
F I G . 6 . DVH obtained with AAA,Acuros®, and films measurements for threeselected organs within the 5‐year‐oldphantom for 3DCRT (top) and VMAT(bottom).
F I G . 7 . Dose profiles (% of prescribed dose) calculated with theTomotherapy TPS and measured with films in the 5‐year‐oldphantom and relative dose differences.
10 | COLNOT ET AL.
leakage dose. This is due to the higher MU needed to deliver the
dose with this energy.7 Despite this observation, it has been shown
in this study that this technique better spares the normal tissue
located far from PTV than modern techniques.
In our study, only doses delivered by treatment beams were
evaluated. However, important dose levels can be delivered by daily
on‐board tomotherapy MVCT using 3.5 MV beams.22 In fact, Shah
et al.29 show that doses exceeding 1 cGy per fraction are delivered
to the bladder and the rectum during a prostate treatment and
Nagata et al.30 report that, for some organs, this system delivers
doses up to 1.9 cGy per fraction to parotid for a head and neck
treatment. Finally, De Saint‐Hubert et al.28 highlight that tomother-
apy MVCT doses can reach up to 2 cGy per fraction to the thyroid,
which is almost four times the doses delivered by a kV‐CBCT imager.
Thus, the conclusion drawn from our study regarding tomotherapy
exposure of normal tissues in regards of other techniques could be
different while taking into account on‐board imaging doses.
4.B | Performance of TPS algorithms
Regarding the Eclipse™ TPS, the Acuros® algorithm is found to cal-
culate doses on a larger volume than AAA for both VMAT and
3DCRT, this result was also reported by Mille et al.31 Their study
concludes that this TPS is not suitable for distant organ dose deter-
mination as well. Likewise, large discrepancies in DVH were also
found in the present study. As DVH is one of the main clinical tools
used to assess treatment plan quality, the user has to keep in mind
the limitation of TPS calculation for organs partially located in treat-
ment beams.
Besides, the dose decrease away from PTV is not correctly calcu-
lated by the two algorithms of this TPS leading to large peripheral
dose underestimation compared to measurements. This observation
is in agreement with results of the literature.7,32–34 Specifically,
underestimations above 40% have also been reported by Howell
et al.35 with AAA between 3 cm and 11 cm from field edge in
3DCRT and mean discrepancies of 14% have been shown by Taddei
et al.36 with AAA in 3DCRT between 1 cm and 8 cm from beams.
Those discrepancies are superior to those shown in our work in
3DCRT where a difference of −1.46% was obtained between 1 cm
and 8 cm from field edge. In accordance with our results, Mille
et al.31 also have a satisfying agreement between TPS calculations,
measurements, and Monte Carlo simulations up to 5–8 cm from field
edge in the case of a fixed squared beam treatment.
Finally, in our work, a different behavior of AAA was observed
depending on radiotherapy technique and accelerator. As AAA does
not model head leakage37 which increases with beam‐on time and
TAB L E 7 Dose differences between Tomotherapy TPS and filmmeasurements (at films level and reconstructed in 3D outside thebeams).
Organs
Dose differences (%)
2D 3D
Thyroid −11.0 −9.71
Right eye −36.4 −40.5
Left eye −31.2 −33.6
Head and neck −14.0 −13.4
Heart −10.6 −4.04
Spinal cord −2.99 2.03
Right lung −7.52 −6.46
Left lung −12.2 −10.0
PTV −0.618 –
Liver −3.70 –
Right kidney −1.84 –
Left kidney −0.710 –
Stomach 0.220 –
Duodenum 0.0779 –
Pancreas 1.57 –
Spleen −1.48 –
Bladder 10.8 8.93
Rectum −4.44 4.64
Pelvis 4.04 −0.37
RVR −1.73 −3.87
F I G . 8 . DVH obtained with the Tomotherapy TPS andmeasurements within the 5‐year‐old phantom.
F I G . 9 . Dose profiles calculated by the Tomotherapy TPS withstatic and dynamic jaws in the 5‐year‐old phantom.
COLNOT ET AL. | 11
depends on accelerator head design; this can explain the large
peripheral dose underestimation obtained with VMAT using the Cli-
nac 2100CS (Fig. 5). The work of Wang and Ding38 also reports
large underestimation of the AAA algorithm (40–80%) in comparison
with MC calculation for organs located far from PTV with IMRT
plans (doses inferior to 0.5% of prescribed dose). The larger discrep-
ancies are observed at 2 cm in depth. But contrary to our observa-
tions, they report a good agreement between AAA and MC up to
15 cm from field edge for VMAT plans. In a second study,39 these
authors report a consistent underestimation of AAA of 30–50% for
VMAT plans (doses less than 1% of the prescribed dose). They esti-
mated that the Eclipse calculations need to be multiplied by a factor
2 to better represent the doses delivered to normal tissues.
At the contrary, the Tomotherapy TPS calculates doses on the
whole CT volume in our study and agreement with measurement is
good on this entire volume (mean difference less than 11% except
for the head and neck region). A minor dose underestimation of the
TPS is observed for healthy organs. Those results confirm that this
TPS is well adapted to calculate doses to remote organs up to
30 cm from beam axis. Similar results have been reported by Schnei-
der et al.40: they show that Tomotherapy TPS provides calculated
doses in agreement with measurements (with a 50% tolerance) up to
35 cm from axis for a prostate treatment. Beyond this distance, this
TPS tends to underestimate delivered doses. They conclude that in
order to evaluate the risks associated with normal tissue exposure,
the Tomotherapy TPS can be used up to 35 cm from axis. The preci-
sion of this TPS away from beam edge is induced by the use of
point kernels calculated in a large volume around interaction point.
In fact, the works of Mackie et al.41 and Papanikolaou et al.42, on
which this convolution/superposition algorithm is based, report point
kernels calculated up to 30 cm from the voxel center in the lateral
direction and up to 85 cm in depth. The lateral distance is in agree-
ment with our results and those obtained by Schneider et al.40
5 | CONCLUSION
In this work, out‐of‐field doses delivered by four radiotherapy tech-
niques have been evaluated by means of film measurements in pedi-
atric anthropomorphic phantoms. Modern techniques enable higher
dose conformation compared to 3DCRT; however, this improvement
is done at the cost of higher peripheral doses. This study points out
a factor of 3 on dose between modern treatments and 3DCRT for
organs located far from PTV. This larger exposure raises major con-
cern as it might increase the risks of developing adverse effects fol-
lowing radiotherapy especially for pediatric patients surviving long
after the treatments. Among advanced radiotherapy techniques, the
latest generation Varian Halcyon system seems a promising treat-
ment option as delivering lower dose levels than conventional accel-
erator and incorporating kV‐CBCT imager. This technique was also
the most efficient in terms of treatment delivery time. To our knowl-
edge, our study is the first to report healthy tissue doses delivered
with the new Varian Halcyon system. It enables to situate this new
treatment option in relation to the other older techniques. The origi-
nal methods developed and applied to renal pediatric treatments in
this work can be used to study other radiotherapy techniques or
tumor localization. The conclusions obtained in this work cannot be
easily extended to other localizations in particular regarding the dose
distribution close to the PTV as it depends on PTV size and its rela-
tive distance to normal organs. However, the results obtained away
from PTV are more general as the doses delivered are highly depen-
dent on accelerator head design and treatment efficacy and less on
morphology. These general findings are important to provide clinical
data regarding modern pediatric radiotherapy treatments using latest
generation accelerators.
In light of the results presented in this study, it would be inter-
esting to complete the dosimetric comparison between techniques
by adding daily imaging dose determination as they largely con-
tribute to increase the exposure of healthy tissues to radiation.
Finally, TPS performances were evaluated in terms of normal tis-
sue dose calculations. Unlike Eclipse™(AAA and Acuros®), the
Tomotherapy TPS enables a precise dose calculation up to 30 cm
from field edge. This study is useful in providing clinical information
on the uncertainties of healthy organ doses calculated by two mod-
ern treatment planning system for which very few data are available
in literature.
REFERENCES
1. Jemal A, Ward EM, Johnson CJ, et al. Annual report to the nation on
the status of Cancer, 1975–2014, Featuring Survival. J Natl Cancer
Inst. 2017;109:1975–20142. Travis LB, Ng AK, Allan JM, et al. Second malignant neoplasms and
cardiovascular disease following radiotherapy. JNCI. 2012;104:357–370.
3. Miller KD, Siegel RL, Lin CC, et al. Cancer Treatment and Survivor-
ship Statistics. Ca Cancer J Clin. 2016;66:271–289.4. Kry SF, Salehpour M, Followill DS, et al. Out‐of‐field photon and
neutron dose equivalents from step‐and‐shoot intensity‐modulated
radiation therapy. Int J Rad Onc Biol Phys. 2005;62:1204–1216.5. George X, Ding GX, Alaei R, et al. Image guidance doses delivered
during radiotherapy: Quantification, management, and reduction:
Report of the AAPM Therapy Physics Committee Task Group 180.
Me Phys. 2018;45:84–99.6. Andrea KN, Lisa BK, Ethel SG, Lois BT. Secondary malignancies
across the age spectrum. Semin Radiat Oncol. 2010;20:67–78.7. Kry SF, Bednarz B, Howell RM, et al. AAPM TG 158: Measurement
and calculation of doses outside the treated volume from external‐beam radiation therapy. Med Phys. 2017;44:391–429.
8. Lim TY, Dragojevic I, Hoffman D, Flores‐Martinez E, Kim G‐Y. Char-acterization of the HalcyonTM multileaf collimator system. J Appl Clin
Med Phys. 2019;20:106–114.9. Lloyd S, Lim TY, Fave X, Flores‐Martinez E, Atwood TF, Moiseenko
V. TG‐51 reference dosimetry for the Halcyon™: a clinical experi-
ence. J Appl Clin Med Phys. 2018;19:98–102.10. Colnot J, Garnier G, Zefkili S, Dumas JL, Gschwind R, Huet C. Devel-
opment of an experimental 3‐ D tool based on radiochromic films to
determine normal tissue doses in external radiotherapy. J Phys.: Conf
Ser. 2019;1305:012054).
11. Moignier C, Huet C, Barraux V, et al. Development of a protocol for
small beam bi‐dimensional dose distribution measurements with
radiochromic films. Rad Measurements. 2016;89:107–118.
12 | COLNOT ET AL.
12. Massillon‐JL G, Chiu‐Tsao S, Domingo‐Munoz I, Chan MF. Energy
dependence of the new Gafchromic EBT3 Film: dose response
curves for 50 kV, 6 and 15 MV X‐Ray beams. Int J Med Phys Clin
Eng Rad Oncol. 2012;1:60–65.13. Brown TAD, Hogstrom KR, Alvarez D, Matthews KL II, Ham K,
Dugas JP. Dose‐response curve of EBT, EBT2, and EBT3 radiochro-
mic films to synchrotron‐produced monochromatic x‐ray beams. Med
Phys. 2012;39:7412–7417.14. Borca VC, Pasquino M, Russo G, et al. Dosimetric characterization
and use of GAFCHROMIC EBT3 film for IMRT dose verification. J
Applied Clin Med Phys. 2013;14:158–171.15. Huet C, Moignier C, Fontaine J, Clairand I. Characterization of the
gafchromic EBT3 films for dose distribution measurements in stereo-
tactic radiotherapy. Rad Meas. 2014;71:364–368.16. Villarreal‐Barajas EJ, Khan RFH. Energy response of EBT3 radiochro-
mic films: Implications for dosimetry in kilovoltage range. J App Clin
Med Phys. 2014;15:331–338.17. Colnot J, Barraux V, Loiseau C, et al. A new Monte‐Carlo model of a
Cyberknife® system for the precise determination of out‐of‐fielddoses. Phys Med Biol. 2019;64:195008.
18. Wang B, Xu XG. Measurements of non‐target organ doses using
Mosfet dosimeters for selected IMRT and 3DCRT radiation treat-
ment procedures. Rad Prot Dosimetry. 2007;128:336–342.19. Stathakis S, Li J, Ma CC. Monte Carlo determination of radiation‐
induced cancer risks for prostate patients undergoing intensity‐mod-
ulated radiation therapy. J Applied Clin Med Phys. 2007;8:14–27.20. Mutic S, Low D. Whole‐body dose from tomotherapy delivery. Int J
Rad Oncol Biol Phys. 1998;42:229–232.21. Ramsey CR, Seibert R, Mahan SL, Desai D, Chase D. Out‐of‐field
dosimetry measurements for a helical tomotherapy system. J Applied
Clin Med Phys. 2006;7:1–11.22. D’Agostino E, Bogaerts R, Defraene G, et al. Peripheral doses in
radiotherapy: a comparison between IMRT, VMAT and Tomother-
apy. Rad Meas. 2013;57:62–67.23. Kowalik A, Jackowiak W, Malicki J, et al. Measurements of doses
from photon beam irradiation and scattered neutrons in an anthro-
pomorphic phantom model of prostate cancer: a comparison
between 3DCRT, IMRT and tomotherapy. Nukleonika. 2017;62:29–35.
24. Jeraj R, Mackie TR, Balog J, et al. Radiation characteristics of helical
tomotherapy. Med Phys. 2004;31:396–404.25. Balog J, Lucas D, DeSouza C, Crilly R. Helical tomotherapy radiation
leakage and shielding considerations. Med Phys. 2005;32:710.
26. Sterzing F, Uhl M, Hauswald H, et al. Dynamic jaws and dynamic
couch in helical tomotherapy. Int J Rad Onc Biol Phys.
2009;76:1266–1273.27. Manabe Y, Shibamoto Y, Sugie C, Hayashi A, Murai T, Yanagi T. Hel-
ical and static‐port tomotherapy using the newly‐developed dynamic
jaws technology for lung cancer. Technol Cancer Res Treat.
2015;14:583–591.
28. De Saint‐Hubert M, Verellen D, Poels K, et al. Out‐of‐field doses
from pediatric craniospinal irradiations using 3D‐ CRT, IMRT, helical
tomotherapy and electron‐based therapy. Phys Med Biol.
2017;62:5293–5311.29. Shah AP, Langen KM, Ruchala KJ, Cox A, Kupelian PA, Meeks SL.
Patient dose from megavoltage computed tomography imaging. Int J
Radiat Oncol Biol Phys. 2008;70:1579–1587.30. Nagata H, Sugimoto S, Hongo H, et al. Patient organ doses from
megavoltage computed tomography delivery with a helical tomother-
apy unit using a general treatment planning system. J Rad Res.
2019;60:401–411.31. Mille MM, Jung JW, Lee C, Kuzmin GA, Lee C. Comparison of nor-
mal tissue dose calculation methods for epidemiological studies of
radiotherapy patients. J Radiol Prot. 2018;38:775–792.32. Joosten A, Bochud F, Baechler S, Levi F, Mirimanoff R‐O, Moeckli R.
Variability of a peripheral dose among various linac geometries for
second cancer risk assessment. Phys Med Biol. 2011;56:5131–5151.33. Joosten A, Matzinger O, Jeanneret‐Sozzi W, Bochud F, Moeckli R.
Evaluation of organ‐specific peripheral doses after 2‐dimensional, 3‐dimensional and hybrid intensity modulated radiation therapy for
breast cancer based on Monte Carlo and convolution/superposition
algorithms: Implications for secondary cancer risk assessment. Rad
Onc. 2013;106:33–41.34. Qi Y, He L, Wang Z, et al. Evaluation of secondary dose and cancer
risk for out‐of‐field organ in esophageal cancer IMRT in a Chinese
hospital using ATOM phantom measurements. Rad Prot Dosimetry.
2017;177:389–396.35. Howell RM, Scarboro SB, Taddei PJ, Krishnan S, Kry SF, Newhauser
WD. Methodology for determining doses to in‐field, out‐of‐field and
partially in‐field organs for late effects studies in photon radiother-
apy. Phys Med Biol. 2010;55:7009–7023.36. Taddei PJ, Jalbout W, Howell RM, et al. Analytical model for out‐of‐
field dose in photon craniospinal irradiation. Phys Med Biol.
2013;58:7463–7479.37. Sievinen J, Ulmer W, Kaissl W. 2005. AAA Photon Dose Calculation
Model in Eclipse™, RAD #7170A.
38. Wang L, Ding GX. The accuracy of the out‐of‐field dose calculations
using a model‐based algorithm in a commercial treatment planning
system. Phys Med Biol. 2014;59:N113.
39. Wang L, Ding GX. Estimating the uncertainty of calculated out‐of‐field organ dose from a commercial treatment planning system. J
Appl Clin Med Phys. 2018;19:319–324.40. Schneider U, Hälg RA, Hartmann M, et al. Accuracy of out‐of‐field
dose calculation of tomotherapy and Cyberknife treatment planning
systems: a dosimetric study. Z Med Phys. 2014;24:211–215.41. Mackie TR, Scrimger JW, Battista JJ. A convolution method of calcu-
lating dose for 15‐MV x‐rays. Med Phys. 1985;12:188–196.42. Papanikolaou N, Mackie TR, Meger‐Wells C, Gehring M, Reckwerdt
P. Investigation of the convolution method for polyenergetic spectra.
Med Phys. 1993;20:1327–1336.
COLNOT ET AL. | 13
Related Documents