Our Forest, Your Trees London’s Growing Assets An Analysis of London’s Urban Forest using the Urban Forest Effects Model (UFORE) prepared by City of London Urban Forestry, Upper Thames River Conservation Authority, USDA Forest Services and Bradwill Ecological Consulting. May 2012

Welcome message from author
This document is posted to help you gain knowledge. Please leave a comment to let me know what you think about it! Share it to your friends and learn new things together.
Transcript

Our Forest, Your TreesLondon’s Growing Assets
An Analysis of London’s Urban Forestusing the Urban Forest Effects Model (UFORE)
prepared by City of London Urban Forestry,Upper Thames River Conservation Authority,
USDA Forest Services and Bradwill Ecological Consulting.
May 2012


Executive Summary p 1 of 4
EXECUTIVE SUMMARY
AbstractFieldwork for the assessment and analysis of
London’s urban forest by the Urban ForestEffects Model (UFORE) was completed in2008. Data was collected from 383randomized and stratified plots for astatistically reliable assessment of the urbanforest structure, function and value. WithinLondon’s Urban Growth Boundary the urbanforest provides 24.7% leaf cover, has nearly 4million healthy trees that would cost morethan $1.5 billion to replace and annuallydelivers about $17 million worth of ecosystemgoods and services (air contaminant removal,greenhouse gas reduction, energyconservation). Recommendations include todevelop an urban forest strategy, to set leafcover goals, to secure plantable space and toimprove tree planting efforts by both publicand private sectors.
IntroductionTrees contribute significantly to human
health and environmental quality. To betterunderstand the structure, function and valueof urban tree resources, the United StatesDepartment of Agriculture-Forest Service(USDA Forest Service) developed the UrbanForest Effects model (UFORE). UFORE is astatistical model that uses a standardizedprotocol for identifying and assessing thestructure, function and value of the urbanforest. UFORE collects standard tree attributesfrom randomly generated sample plots in thefield and incorporates local meteorological, airpollution, energy usage and cost data toestimate the benefits and associated values.UFORE provides a statistically reliablescientific foundation for estimating urbanforest benefits. UFORE predicts the benefits
and economic value of the urban forest forecosystem health by amelioration of climatechange effects due to human use activities,human health by improvements to air quality,and energy conservation by reductions inenergy usage. Outcomes can be compared toother cities utilizing the same model.
BackgroundLondon’s urban forest has changed
dramatically over the past three centuries;rapid and extensive decline between 1840 and1880; positive changes in conservation valuesand conservation practices throughout the1900s leading up to a strengthened naturalheritage system protected through changes inthe Planning Act, Provincial Policy Statementand the Official Plan. An ecosystem-basedmanagement approach to achieve asustainable environment looks at the urbanfabric as the ecological unit and recognizes theurban forest as the collective term that refers
Key TermsLeaf area: cumulative surface area of leavesof tree crown determined from plot data(species, tree diameter and crown width).Leaf cover: area occupied by layer of leaves,branches, and stems of trees that cover theground when viewed from above.Potential Plantable Space: area that isavailable for the establishment of trees (areasnot covered by tree canopy, roads, buildings,and water) or subject to planting constraints(proximity to electric transmisision lines, firehydrants, intersections, etc.)Greenhouse gas: mainly excess carbondioxide leading to warming of the earth’s loweratmosphere; thus, global warming or climatechange.Carbon storage: carbon currently held in treetissue (roots, stems, and branches).Carbon sequestration: estimated amount ofcarbon dioxide removed annually by trees thatis converted to woody tissue.

Executive Summary p 2 of 4
to all trees, whether public or private andgrowing singly, anywhere or together inwooded areas.
MethodsIn the summer of 2008, 298 residents and
businesses within the Urban GrowthBoundary of the City of London participatedin the UFORE project to collect data from 383plots for a statistically reliable assessment ofthe urban forest in London.
• Based on local measurements of tree attributes(species, dbh [diameter at breast height], height,health condition, position, canopy closure) themodel provides estimates of the urban foreststructure (number of trees, species composition,tree density, tree health, leaf area, leaf biomass,information on shrubs and ground cover types).
• Based on plot data for tree species, dbh,crown width the model provides estimates ofcarbon sequestered annually and the amount ofcarbon stored by London’s urban forest.
• Based on local measurements ofmeteorological data and air quality for the criteriaair contaminants (particulate matter, ozone,sulphur dioxide, nitrogen dioxide, carbonmonoxide, and volatile organic compounds), themodel provides estimates of the functional valueof the urban forest for air pollutant removal.
• Based on plot data for tree species, size,health, crown width and position relative tobuildings, the model provides estimates of theeffects of trees on building energy use and on theremoval of carbon dioxide from the atmosphere.
• Based on expert knowledge of thesusceptibility of London’s forest to decline owingto natural causes, pests or disease, the modelprovides estimates of planting and naturalregeneration requirements to maintain the currenttree population in response to normal oraccelerated tree mortality rates.
Results
StructureLondon’s average leaf cover is 24.7% across
all land use types within the study area (UrbanGrowth Boundary). There is an equivalent of 4400 hectares of potential plantable spacedispersed within the study area. The UFOREassessment estimates that there are about 4376 000 trees with a structural value of $1.5billion and that 79% of the trees are in good toexcellent condition. The ratio of trees is about186 trees per hectare or 12 trees per personbased on 2009 population data. By abundance,the top three species are buckthorn (19%),Eastern White Cedar (14%) and Sugar Maple(7%). By leaf area, the top three species areNorway Maple, Sugar Maple and BlackWalnut. The average tree diameter at breastheight (dbh) is 12.2 cm and the percentage oftrees with a dbh less than 15 cm is 77.5%.
Native species abundance is a robustindicator of ecosystem health and of asustainable environment. Fifty-two percent(52%) of the plants inventoried are eithernative trees (40% of total) or native shrubs(12% of total). Natural areas or parks containabout 79% native species. Low densityresidential land use type has about 52% nativespecies.
FunctionEcological goods and services provided by
trees include: carbon sequestration, carbonstorage, water storage, metric tonnes ofgreenhouse gas removed, improved air quality(the ability of trees to reduce pollution, deliveroxygen, and moderate climate change), metrictonnes of air contaminants (PM
2.5, SO
x, NO
x,
CO) removed, residential building energyconsumption reduction (properly positionedtrees cool in summer, allow solar heat inwinter). The structural and functional valuesderived are used to generate monetary values

Executive Summary p 3 of 4
attributable to the ecological goods andservices provided by trees.
ValueTrees are an important component of
London’s green infrastructure and consideredas assets that increase in value with size andover time. The urban forest can be comparedto a bank account with the trees and theirstructural value as the principal or naturalcapital and the annual interest returned as theecological goods and services that treesprovide. The asset will increase with increasednumber and size of healthy trees and thatthrough proper management, will increase theenvironmental and economic returns ofLondon’s urban forest.
The London UFORE assessment calculatedthe structural value of the existing urban forestof 4.4 million trees at $1.5 billion.
Carbon storage can be regarded as an‘ecosystem good.’ The ‘ecosystem services’provided by trees are air pollutant removal,carbon sequestration and energy use reduction.The UFORE model provides a dollar value forthe tonnes of pollutant removed, the tonnes ofcarbon stored, the tonnes of carbonsequestered and the MBTU from natural gasfor heating plus the MWh for electricity forcooling. In terms of functional value (aircontaminant removal, carbon sequestration,carbon storage, energy savings) deliveredannually, London’s urban forest delivers the
storage sequestration
City trees / ha percent tonnes / yr $ / ha tonnes / ha tonnes/ha/yr
London ON 185.5 24.7 15.7 189.9 15.3 0.5Toronto ON 160.4 19.9 25.8 290.7 17.4 0.7Oakville ON 192.9 29.1 17.4 179.5 13.4 0.6
Syracuse NY 134.7 23.1 15.2 160.7 24.2 0.8
CarbonLeafCover
Trees Pollution Removal
Annual ecological goods and services (per ha) provided by trees in London compared with other citieshaving similar climate and vegetation that have completed a UFORE analysis.
equivalent of $10.7 million for ecosystemhealth, $4.5 million for human health and $1.7million in energy conservation for an annualeconomic worth of the ecosystem goods andservices of $17 million.
This is a conservative estimate of the valueof the urban forest as there are many otherfunctional values that were not quantified inthis study (e.g. delivery of oxygen, direct andindirect water quality and water quantitymanagement, shading from UV rays, reductionof air temperature by wind reduction andevapotranspiration.
RecommendationsThis UFORE analysis suggests the need for
policy and practice recommendations to protect,plant maintain and monitor London’s urban forest;and to provide education about the directrelationships between a healthy urban forest and ahealthy sustainable community in order toencourage and to support citizens to protect andplant trees on private property. Pressures andissues that affect the health and long-termsustainability of the urban forest were alsoidentified. These recommendations should bereferred to the Urban Forest Strategy in order to setout plans to maintain and enhance theenvironmental services provided by London’surban forest.

Executive Summary p 4 of 4
Feature MeasureStructure!! Average leaf cover leaf cover 24.7%!! Tree information 4.4 million trees
52% native79% healthy
!! Most common tree species buckthorn, Eastern White Cedar, Sugar Maple, White Ash!! Species with most leaf area Norway Maple, Sugar Maple, Buckthorn, Black Walnut, Silver Maple
!! Preferred species to optimize benefits choose large stature native trees!! Potential plantable space 4 400 hectares dispersed in private and public ownership!! Recognition of threat to sustainable environment buckthorn, an invasive alien species, accounts for about 19% of the
urban forest tree populationPests such as Gypsy Moth, Dutch Elm Disease, Emerald Ash Borer and Asian Longhorn Beetle may cause declines of as much as 40% of the urban forestEmeral Ash Borer alone is estimated to destroy 10% of all trees and thus reduce leaf cover by 7% and the structural value by $80 million
Function!! Greenhouse gas reduction 360 tonnes of carbon stored in existing trees
46 tonnes of carbon removed annually!! Air quality improvement 370 tonnes of PM2.5, SOx, NOx, CO removed annually
!! Energy use reduction 128 300 MBTU + 9 700 MWh saved annually by properly positioned trees that cool in summer, allow solar heat in winter
Value!! Structural value of existing urban forest $ 1.5 billion for the structural value of the existing urban forest!! Ecosystem goods and services $10.3 million for carbon stored in existing trees
$ 0.4 million for carbon sequestered$ 4.5 M for the removal of air contaminants$ 1.7 million for energy conservation
Value of ecosystem goods and services delivered annually by London's urban forest $17 million per year
MAJOR FINDINGS

i
City of London
Planning and DevelopmentJohn M. FlemingAndrew MacphersonIvan ListarBonnie BergsmaMark BoulgerCheryl KotelesLindsey BennettVanessa KinsleyRick Postma
EES Environmental ProgramsJohn ParsonsPatrick DonnellyShauna MilanovicJamie Skimming
Finance and Corporate ServicesJohn Bontje (CAO Technology Services)Dean Thompson (CAO Technology Services)Glynis Tucker (CAO's Department)
Trees and Forests Advisory Committee(TFAC)
Joni BaechlerCrandall BensonKen ElliotGeoff FournieJim GalbraithBill GilmoreJim KennedyJack ParkerJames ReffleJulie RyanDean SheppardBob ShiellGeorge Sinclair
Acknowledgements
This report stems from the UFORE data collection and analysis as a multi-agency collaborative effortof the following partners:
Upper Thames River Conservation Authority(UTRCA)
Chris Harrington (Planning and Research)Tara Tchir (Planning and Research)Eleanor Heagy (Community and Corporate Services)Steve Sauder (Community and Corporate Services)
UTRCA Field CrewJason Belfry (Lands and Facilities)Jay Ebel (Conservation Services)John Enright (Conservation Services)Brenda Gallagher (Conservation Services)Tracey Haycock (Planning and Research)Stephanie Heigl (Planning and Research)Dan Jones (Lands and Facilities)Lorraine Mills (Planning and Research)Sacha Pimiskern (Lands and Facilities)Karen Pugh (Conservation Services)Cathy Quinlan (Planning and Research)Brandon Williamson (Lands and Facilities)
United States Department of Agriculture ForestService (USDA)
Dr. David NowakDaniel CraneRobert Hoehn
University of Western Ontario (UWO)Dr. Jinfei Wang (Professor Geography Dept.)Brad Lehrbass, MSc.Robyn KellerNicholas Lantz
Ontario Ministry of Natural Resources (OMNR)Ian Smythe (Science and Information Branch)Ken Elliott (Science and Information Branch)
Photographs and ArtworkDavid ColvinBill DeYoungSandra Murillo

ii

iii
Table of Contents
EXECUTIVE SUMMARY . . . . . . . . . . . . . . . . . . . . . . . . . . . . . . . . . . . . . . . . . . . . . . . . . . . . . . . . . . 1
INTRODUCTION . . . . . . . . . . . . . . . . . . . . . . . . . . . . . . . . . . . . . . . . . . . . . . . . . . . . . . . . . . . . . . . . . 1Importance of Trees and Woodlands . . . . . . . . . . . . . . . . . . . . . . . . . . . . . . . . . . . . . . . . . . . . . . . . 1The Urban Forest . . . . . . . . . . . . . . . . . . . . . . . . . . . . . . . . . . . . . . . . . . . . . . . . . . . . . . . . . . . . . . . 1Urban Forest Management . . . . . . . . . . . . . . . . . . . . . . . . . . . . . . . . . . . . . . . . . . . . . . . . . . . . . . . . 2Need for Urban Forest Strategy . . . . . . . . . . . . . . . . . . . . . . . . . . . . . . . . . . . . . . . . . . . . . . . . . . . . 2Rationale for Using the UFORE Model . . . . . . . . . . . . . . . . . . . . . . . . . . . . . . . . . . . . . . . . . . . . . . 2Organization of this report . . . . . . . . . . . . . . . . . . . . . . . . . . . . . . . . . . . . . . . . . . . . . . . . . . . . . . . . 4
BACKGROUND . . . . . . . . . . . . . . . . . . . . . . . . . . . . . . . . . . . . . . . . . . . . . . . . . . . . . . . . . . . . . . . . . . 5Natural History and Natural Heritage . . . . . . . . . . . . . . . . . . . . . . . . . . . . . . . . . . . . . . . . . . . . . . . 5Forests to Timber to Agriculture . . . . . . . . . . . . . . . . . . . . . . . . . . . . . . . . . . . . . . . . . . . . . . . . . . . 5City Street and Park Trees . . . . . . . . . . . . . . . . . . . . . . . . . . . . . . . . . . . . . . . . . . . . . . . . . . . . . . . 15Ecosystem Benefits of Trees . . . . . . . . . . . . . . . . . . . . . . . . . . . . . . . . . . . . . . . . . . . . . . . . . . . . . 16Air Quality . . . . . . . . . . . . . . . . . . . . . . . . . . . . . . . . . . . . . . . . . . . . . . . . . . . . . . . . . . . . . . . . . . . 18Ozone . . . . . . . . . . . . . . . . . . . . . . . . . . . . . . . . . . . . . . . . . . . . . . . . . . . . . . . . . . . . . . . . . . . . . . . 19Health Costs . . . . . . . . . . . . . . . . . . . . . . . . . . . . . . . . . . . . . . . . . . . . . . . . . . . . . . . . . . . . . . . . . . 20Trees and the Carbon Cycle . . . . . . . . . . . . . . . . . . . . . . . . . . . . . . . . . . . . . . . . . . . . . . . . . . . . . . 22Carbon Sequestration and Carbon Storage . . . . . . . . . . . . . . . . . . . . . . . . . . . . . . . . . . . . . . . . . . 22Greenhouse Gas and Climate Change . . . . . . . . . . . . . . . . . . . . . . . . . . . . . . . . . . . . . . . . . . . . . . 22Role of Trees in Mitigating Climate Change . . . . . . . . . . . . . . . . . . . . . . . . . . . . . . . . . . . . . . . . . 23Trees and Energy Use . . . . . . . . . . . . . . . . . . . . . . . . . . . . . . . . . . . . . . . . . . . . . . . . . . . . . . . . . . 24Urban Heat Island (UHI) . . . . . . . . . . . . . . . . . . . . . . . . . . . . . . . . . . . . . . . . . . . . . . . . . . . . . . . . 24Role of Trees to Reduce UHI Effect . . . . . . . . . . . . . . . . . . . . . . . . . . . . . . . . . . . . . . . . . . . . . . . 24Threats to Trees by Invasive Alien Species . . . . . . . . . . . . . . . . . . . . . . . . . . . . . . . . . . . . . . . . . . 25
METHODS . . . . . . . . . . . . . . . . . . . . . . . . . . . . . . . . . . . . . . . . . . . . . . . . . . . . . . . . . . . . . . . . . . . . . . 27Project Scope . . . . . . . . . . . . . . . . . . . . . . . . . . . . . . . . . . . . . . . . . . . . . . . . . . . . . . . . . . . . . . . . . 27Fieldwork . . . . . . . . . . . . . . . . . . . . . . . . . . . . . . . . . . . . . . . . . . . . . . . . . . . . . . . . . . . . . . . . . . . . 27Measures from UFORE Model . . . . . . . . . . . . . . . . . . . . . . . . . . . . . . . . . . . . . . . . . . . . . . . . . . . 30Urban Forest Structure . . . . . . . . . . . . . . . . . . . . . . . . . . . . . . . . . . . . . . . . . . . . . . . . . . . . . . . . . . 30Leaf Cover Estimates by Colour Infrared Aerial Photography . . . . . . . . . . . . . . . . . . . . . . . . . . . 31Urban Forest Functions . . . . . . . . . . . . . . . . . . . . . . . . . . . . . . . . . . . . . . . . . . . . . . . . . . . . . . . . . 31Air pollution . . . . . . . . . . . . . . . . . . . . . . . . . . . . . . . . . . . . . . . . . . . . . . . . . . . . . . . . . . . . . . . . . . 32Carbon Storage . . . . . . . . . . . . . . . . . . . . . . . . . . . . . . . . . . . . . . . . . . . . . . . . . . . . . . . . . . . . . . . . 32Carbon Sequestration . . . . . . . . . . . . . . . . . . . . . . . . . . . . . . . . . . . . . . . . . . . . . . . . . . . . . . . . . . . 32Energy Use . . . . . . . . . . . . . . . . . . . . . . . . . . . . . . . . . . . . . . . . . . . . . . . . . . . . . . . . . . . . . . . . . . . 32Urban Forest Value . . . . . . . . . . . . . . . . . . . . . . . . . . . . . . . . . . . . . . . . . . . . . . . . . . . . . . . . . . . . . 32Compensatory Value . . . . . . . . . . . . . . . . . . . . . . . . . . . . . . . . . . . . . . . . . . . . . . . . . . . . . . . . . . . 32Air Contaminant Removal Value . . . . . . . . . . . . . . . . . . . . . . . . . . . . . . . . . . . . . . . . . . . . . . . . . . 33Carbon Storage Value . . . . . . . . . . . . . . . . . . . . . . . . . . . . . . . . . . . . . . . . . . . . . . . . . . . . . . . . . . . 33Carbon Sequestration Value . . . . . . . . . . . . . . . . . . . . . . . . . . . . . . . . . . . . . . . . . . . . . . . . . . . . . . 33Energy Use Reduction Value . . . . . . . . . . . . . . . . . . . . . . . . . . . . . . . . . . . . . . . . . . . . . . . . . . . . . 33Modelling Urban Forest Growth . . . . . . . . . . . . . . . . . . . . . . . . . . . . . . . . . . . . . . . . . . . . . . . . . . 33Recommendations for Tree Species Selection . . . . . . . . . . . . . . . . . . . . . . . . . . . . . . . . . . . . . . . . 34

iv
RESULTS and DISCUSSION . . . . . . . . . . . . . . . . . . . . . . . . . . . . . . . . . . . . . . . . . . . . . . . . . . . . . . . 35Field Data . . . . . . . . . . . . . . . . . . . . . . . . . . . . . . . . . . . . . . . . . . . . . . . . . . . . . . . . . . . . . . . . . . . . 35Urban Forest Structure . . . . . . . . . . . . . . . . . . . . . . . . . . . . . . . . . . . . . . . . . . . . . . . . . . . . . . . . . . 35Tree Species . . . . . . . . . . . . . . . . . . . . . . . . . . . . . . . . . . . . . . . . . . . . . . . . . . . . . . . . . . . . . . . . . . 35Number and Density of Trees . . . . . . . . . . . . . . . . . . . . . . . . . . . . . . . . . . . . . . . . . . . . . . . . . . . . 36Distribution of Species . . . . . . . . . . . . . . . . . . . . . . . . . . . . . . . . . . . . . . . . . . . . . . . . . . . . . . . . . . 37Tree Size Distribution . . . . . . . . . . . . . . . . . . . . . . . . . . . . . . . . . . . . . . . . . . . . . . . . . . . . . . . . . . 38Tree Health . . . . . . . . . . . . . . . . . . . . . . . . . . . . . . . . . . . . . . . . . . . . . . . . . . . . . . . . . . . . . . . . . . . 41Groundcover . . . . . . . . . . . . . . . . . . . . . . . . . . . . . . . . . . . . . . . . . . . . . . . . . . . . . . . . . . . . . . . . . . 42Perviousness . . . . . . . . . . . . . . . . . . . . . . . . . . . . . . . . . . . . . . . . . . . . . . . . . . . . . . . . . . . . . . . . . . 42Plantable Space . . . . . . . . . . . . . . . . . . . . . . . . . . . . . . . . . . . . . . . . . . . . . . . . . . . . . . . . . . . . . . . 43Leaf Area . . . . . . . . . . . . . . . . . . . . . . . . . . . . . . . . . . . . . . . . . . . . . . . . . . . . . . . . . . . . . . . . . . . . 44Leaf Cover . . . . . . . . . . . . . . . . . . . . . . . . . . . . . . . . . . . . . . . . . . . . . . . . . . . . . . . . . . . . . . . . . . . 45Leaf Cover by Image Interpretation . . . . . . . . . . . . . . . . . . . . . . . . . . . . . . . . . . . . . . . . . . . . . . . . 47Total Structural Value . . . . . . . . . . . . . . . . . . . . . . . . . . . . . . . . . . . . . . . . . . . . . . . . . . . . . . . . . . 48Effects and Values of Tree Functions . . . . . . . . . . . . . . . . . . . . . . . . . . . . . . . . . . . . . . . . . . . . . . . 48Air Contaminant Removal by Trees . . . . . . . . . . . . . . . . . . . . . . . . . . . . . . . . . . . . . . . . . . . . . . . . 48Carbon Stored by Trees . . . . . . . . . . . . . . . . . . . . . . . . . . . . . . . . . . . . . . . . . . . . . . . . . . . . . . . . . 50Carbon Sequestration by Trees . . . . . . . . . . . . . . . . . . . . . . . . . . . . . . . . . . . . . . . . . . . . . . . . . . . 50Energy Use Reduction and Cost Savings . . . . . . . . . . . . . . . . . . . . . . . . . . . . . . . . . . . . . . . . . . . . 52Leaf cover and effects of trees for London . . . . . . . . . . . . . . . . . . . . . . . . . . . . . . . . . . . . . . . . . . 52Modelling Tree Planting due to Mortality including Threats from Pests or Disease . . . . . . . . . . . 54Best Tree Choices for London . . . . . . . . . . . . . . . . . . . . . . . . . . . . . . . . . . . . . . . . . . . . . . . . . . . . 55
Towards an Urban Forest Strategy . . . . . . . . . . . . . . . . . . . . . . . . . . . . . . . . . . . . . . . . . . . . . . . . . 56
SUMMARY AND CONCLUSIONS . . . . . . . . . . . . . . . . . . . . . . . . . . . . . . . . . . . . . . . . . . . . . . . . . . 59
GLOSSARY of Terms used in UFORE Report . . . . . . . . . . . . . . . . . . . . . . . . . . . . . . . . . . . . . . . . . . 60
REFERENCES . . . . . . . . . . . . . . . . . . . . . . . . . . . . . . . . . . . . . . . . . . . . . . . . . . . . . . . . . . . . . . . . . . . 64
APPENDIX A. CITY OF LONDON TREE AND WOODLAND INITIATIVES . . . . . . . . . . . . . . . 72APPENDIX B. Excerpts of the City of London Official Plan . . . . . . . . . . . . . . . . . . . . . . . . . . . . . . . 76APPENDIX C. UFORE Land Use Types and
City of London Land Use Designations (City of London 2006) . . . . . . . . . . . . . . . . . . . . . . . . . . 78APPENDIX D. Landowner Contact Letter and Permission Form . . . . . . . . . . . . . . . . . . . . . . . . . . . 83APPENDIX E. Species Observed by Land Use Type . . . . . . . . . . . . . . . . . . . . . . . . . . . . . . . . . . . . . 84APPENDIX F. Leaf Cover by Ward . . . . . . . . . . . . . . . . . . . . . . . . . . . . . . . . . . . . . . . . . . . . . . . . . . 86
Leaf Cover by Subwatershed . . . . . . . . . . . . . . . . . . . . . . . . . . . . . . . . . . . . . . . . . . . . . . . . . . . . . 87APPENDIX G. Comparison of UFORE Outcomes from Cities in North America . . . . . . . . . . . . . . . 88APPENDIX H. Species Recommended for Planting in London . . . . . . . . . . . . . . . . . . . . . . . . . . . . . 90

1
Importance of Trees and WoodlandsLondon is home to 350 thousand people and has
been known as "The Forest City" since 1855 whenthe phrase referred to a city within a forest. Today,its logo is a stylized tree that signifies a moderncity with a healthy urban forest supported by acommunity that appreciates the benefits of treesand woodland cover. “The Forest City” is alsoreminiscent of the extensive mixed hardwood(deciduous) forests within the Carolinian Life Zone(Map1) that have been cleared for agriculture andsettlement. The Carolinian Life Zone is the mostfertile and biologically diverse natural environmentin Canada.
Londoners value historic and residentiallandscapes with mature large trees. Many recentCity initiatives have focused on the value of treesand woodlands in the City of London (AppendixA). For example, community effort in plantingtrees and shrubs to naturalize manicured areaswithin parks and open space areas has grownsteadily. Council has increased funding for streettree planting and established the Trees and ForestAdvisory Committee (TFAC) in 2006 to addresstree related issues.
Building on the consultation process for theCity’s Vision 96 and Official Plan, communitysupport for the identification, protection, andenhancement of a natural heritage system (NHS) isstrong. This vision is articulated in the Official
Plan in both the planning framework as well as inspecific environmental policies (Appendix B).
Many residents and visitors value the remainingnaturally vegetated areas of the city, including thelarge Environmentally Significant Areas (ESAs),the Thames River corridor and its major tributariesand parks with woodlands in London. These andother significant natural features and areas withinthe City form the basis of the natural heritagesystem. They are identified through the planningprocess as important resources to protect andsecure for the ecological processes and values thatare important to the sustainability of healthy urbanand rural environments.
When broad scale land use change occurs, theenvironment changes. Within the urban area,competing land use issues from development andthe associated servicing infrastructure required tosupport residential, industrial or commercial usesmust be balanced with the protection of trees andnatural areas. Air and water pollution, flooding,erosion, rising urban temperatures, and increasedrates of asthma and respiratory illnesses are but afew of the crises our urban environments havecreated or exacerbated (Cooper 2011; MacDonald1996; Oke 1982).
One of the measures of ecological sustainabilitythat has emerged over the past decade is the percentof forested area in the landscape. This measure hasbecome increasingly important as environmentalconcerns related to the effects of climate change,pollution, habitat loss, invasive species, andunsustainable use of resources have emerged. Theincreasing awareness of the importance ofLondon’s urban forest to the quality of life hasbecome an important issue in areas designated forfuture population growth and development.
The Urban ForestAn urban forest ecosystem comprises the
dynamic interrelationships of the collection ofliving matter (plants, animals, people, insects,microbes) and non-living matter (soil, rocks, deadorganic matter) through which there is a cycling of
Figure 1. Carolinian Life Zone in Canada.
INTRODUCTION

2
the flows of nutrients, water and energy (Duryea2000). The urban forest is a collective term thatrefers to all trees within an urban area, regardlessof land use type, whether public or private. Trees inprivate yards, street boulevards, parks, woodlands,plantations, wetlands, riparian areas, ravines andfields in various stages of succession are allincluded in this term. According to the ProfessionalForesters Act (2000) urban forests are “tree-dominated vegetation and related features foundwithin an urban area and include woodlots,plantations, shade trees, fields in various stages ofsuccession, wetland and riparian areas”. Thevariability of the urban forest is a function of landuse type and intensity, species composition, plantstatus (age, stature, condition), canopy closure, siteconditions (sun, soil, moisture and nutrients) andgrowing space.
Urban Forest ManagementUrban forestry, a term first coined by Erik
Jorgenson, a Canadian, has come to mean the art,science and technology of managing trees andresources of urban ecosystems for thephysiological, sociological, economic and aestheticbenefits trees provide society (Jorgenson 1974;Helms 1998; American Forests 2009).Management of the urban forest must integratelandscape ecology, landscape architecture andarboriculture in a system of planning that protectsplantable space; establishes green infrastructure asa primary step in urban design and developmentstandards; and, adequately funds operations toplant and maintain trees to obtain optimal benefitsthat a healthy urban forest ecosystem can provide.
Need for Urban Forest StrategyLondon Municipal Council directed the
development of an Urban Forest Strategy andManagement Plan to provide the vision andstrategic direction for the long term planning,planting, protection and maintenance of trees,woodlands, green space and related resources inour community. The Urban Forest Strategy willguide the refinement of the City’s urban treepolicies, environmental regulations, guidelines andpractices.
The London Urban Forest Strategy willdemonstrate how urban planning and design canprovide a balance of grey infrastructure(transportation, service corridors, sanitary sewage)with green infrastructure (trees, storm watermanagement) plus woodlands and other elements ofthe natural heritage system (natural capital) toensure that London, The Forest City, is a liveable,sustainable community characterized by a healthyurban forest.
An essential first step in the development of theUrban Forest Strategy is a comprehensiveappraisal of the current state of London’s urbanforest. The UFORE model was identified as theappropriate tool to provide the baseline data.
Rationale for Using the UFORE ModelThe general benefits of trees are well documented
in the literature; however, unlike the silviculturalmeasurements used for commercial harvest offorests, very few uniformly accepted measurementsare available for the trees in the urban environment.This is because, until recently, there are very fewtools available to estimate the total number of treesand their distribution, structure, function and valuein the urban environment. Furthermore, little isknown about the economic value and contributionsof trees to society at the forest level.
The United States Department of Agriculture(USDA) Forest Service developed the Urban ForestEffects (UFORE) model to provide a consistentmethodology and statistically reliable “snapshot intime” estimate of the structure and functions of aspecific urban forest.
The UFORE model was selected for this analysisfor a number of reasons. One reason is that the
© David Colvin 2006
3
specific information on tree canopy size and othertree measurements required for calculating thevarious climate, structural and economic values ofthe urban forest were not available in the City’sStreet Tree Inventory or the Natural HeritageDatabase. Although the City of London’s TreeInventory (2002) provides information on the stateand health of London’s street trees and trees inmost of the manicured portions of larger parks, itdoes not provide tree data on private lands, woodedor rural areas. Nor does the Tree Inventory containinformation on tree canopy size for calculating leafcover and other parameters used to calculateecosystem goods and services. The required treedata cannot be accurately estimated from London’scurrent Geographic Information Systems (GIS)databases.
A second reason is the enormous amount ofmoney and effort (time) it would take to measureevery individual tree in the City of London.Instead, the UFORE model statistically inferscharacteristics of the urban trees in the entire Cityby analyzing the characteristics of plot data
When we go to a store, we expect to find usefulgoods and services – the apples we buy to eat andthe refrigerators that keep them chilled. Wedepend on similar goods and services in oureveryday lives. Indeed, we take them for granted.Nature also provides us valuable goods andservices, and we take many of those for granted,as well. When we bite into a juicy apple, forexample, if we pause to think beyond the storewhere it was purchased, we may think of soil andwater; but it is unlikely we also consider the naturalpollinators that fertilized the apple blossom so thefruit can set. When we drink a cool glass of waterfrom the tap we may think of the local reservoir,but the real source of the water quality lies manymiles upstream in the wooded watershed thatfilters and cleans the water as it flows downhill.When we enjoy a fun holiday at the beach we maythink of the warm sun, but not of the carbonsequestration by plants that contributes to climatestability.
Largely taken for granted, healthy ecosystemsprovide a variety of such critical goods and
services. Created by the interactions of livingorganisms with their environment, these“ecosystem services” provide both the conditionsand processes that sustain human life. Theimportance to our well-being of goods provided byecosystems is straightforward. Trees providetimber; coastal marshes provide shellfish. Theservices underpinning these goods, though lessvisible, are equally important. If you doubt this,consider how to grow an apple without the servicesof pollination, pest control or renewal of soilfertility.
Services are provided and enjoyed across arange of scales. Pollination and renewal of soilfertility are local services, while climatestabilization and genetic resources are generatedlocally (through carbon sequestration andbiodiversity conservation) but enjoyed globally.Thus, depending on the service, a wide range oflandscapes can be important service providers,from pristine, intact ecosystems such as naturalforests, wetlands and estuaries, to human-dominated landscapes such as agricultural lands.
Ecosystem services are critical to our well-being
- in Salzman and Mordecai, A Policy Maker's Guide to Designing Payments for Ecosystem Services, 2010.
sampled within the study area. To reach validconclusions, the sampling locations are obtainedrandomly and enough locations are sampled toprovide a statistical accuracy of 90%. UFORE iscurrently the most statistically accurate approachfor urban tree analysis. In fact, we are 95%confident that the UFORE estimates of number andcharacteristics of trees in the entire City are within10% of the actual value.
Third, the UFORE model quantifies theecological goods and services provided by all urbantrees with respect to air pollution reduction, carbonstorage, carbon sequestration, and energy usereduction. The UFORE model provides measuredbaseline data showing how the structure, functionand economic value of the urban forest differacross land use type.
Fourth, the UFORE model uses a standardprotocol that is repeatable and allows forcomparisons against standards and targets desiredfor London.

4
Finally, the information generated by the UFOREanalysis will be used by London for the planningand management of our urban forest to:
• demonstrate how trees enhance human healthand environmental quality in urban areas• provide the scientific basis for thedevelopment of the London Urban ForestStrategy• project future leaf canopy cover based oncurrent leaf cover and possible disturbancescenarios or planting programs• provide data to support the protection andwise management of the urban forest.
Organization of this reportThe Background section of this report presents
the history and current status of trees in London;firstly, by an account of historical forest coverthrough a brief and near total deforestation of theregion followed by a period of replanting andrecovery to the current status of 12% of theLondon area occupied by natural cover; secondly,by an account of changing societal valuessupported by voluntary conservation and municipalstewardship; and, thirdly, by an account of thetrends in natural cover and level and extent ofprotection of the current natural cover.
The second section in the Background chapterdescribes the Internet accessible street treeinventory and its uses.
The third section begins the discussion of urbanforest management and sets it in the context of theecosystem goods and services that trees provide.The many benefits of trees are described in broadterms and the specific benefits of trees that aremodelled by UFORE (air contaminant removal,greenhouse gas reduction, energy conservation) arediscussed further.
The Methods section describes the fieldworkactivities, provides the essentials of the UFOREanalyses and presents a summary of the leaf covercalculation. The Results and Discussion sectionpresents findings of the UFORE assessment andfollows the same sequence as in the Methodssection.
These sections are followed by a report summary;and the report concludes with thirtyrecommendations. Some material helpful to thereader is found in the Glossary, References andAppendices.
5
Forests to Timber to AgricultureThe development of woodland vegetation in
southern Ontario spans a period of dramaticgeological and biological change marked byglaciations, erosion, soil formation, climatechange, species adaptations, migration andsuccession. Pollen records of lake-bottom andpeatland sediments provide evidence that the fullcomplement of dominant forest species foundtoday in southern Ontario were present 9 000years B.C.E. (Larson 1999). Over this period untiltoday, the distributions of most tree species haveremained relatively stable; however, the patternsof tree species dominance have changed manytimes. In London, an excellent example of this isfound at the Sifton (Byron) Botanical Bog, wherethe presence of Black Spruce, Sphagnum andother bog species represents a geographicallyisolated remnant of the peri-glacial Jack Pine andSpruce forests that once dominated the landscapeof southern Ontario 10 000 years B.C.E. (Delcourt1983; Warner 1989; Bergsma 2007).
The pace of change in forest structure hasaccelerated over the past 200 years. BeforeEuropean settlement, this region had areas ofopen plains of oak savanna, tall grassland prairies,and corn fields actively managed by native NorthAmericans; for instance, at Attawandaron nearFanshawe Park and Wonderland Roads. At thetime of European settlement in the early 19thCentury, woodlands and wetlands covered morethan 90% of southern Ontario. The landscape ofLondon was described as an impenetrable area offorests, bogs, swamps, streams, hills and valleys(City of London 2007). Tree species found withinthese original woodlands consisted of White Pineand Hemlock mixed with Sugar Maple, Beech,White Elm, White Ash, hickories and to a lesserextent other hardwood species such as Basswood,Ironwood, Yellow Birch, oaks, cherry andwalnuts. Swamp forests in wetland depressionswere treed with elms, ashes, White Cedar, BlackSpruce, Tamarack and Balsam Fir. From theForks of the Thames, willows, Eastern
BACKGROUND
Natural History and Natural Heritage
Cottonwood, Hackberry, Sycamore and elmfollowed the meandering floodplain of theThames River (Hilts 1977; Miller 1988; Tchir2003).
In 1793, John Graves Simcoe recognized that theforks of the Thames, centrally located along traderoutes, would be a good place for a settlement;London began to be settled after 1825 under themanagement of Thomas Talbot. The 19th Centurywas a century of exploitation and depletion of thevast woodland resource that brought aboutdramatic changes to the landscape. Generally, thewoodlands and wetlands were perceived ashostile obstacles to progress; many areas wereharvested for timber and then cleared foragriculture by burning.
Man appears to contend with the trees of theforest as though they were his most obnoxiousenemies; for he spares neither the young saplingin its greenness, nor the ancient trunk in its loftypride; he wages war against the forest with fireand steel. - C.P. Traill in The Backwoods ofCanada (1832).
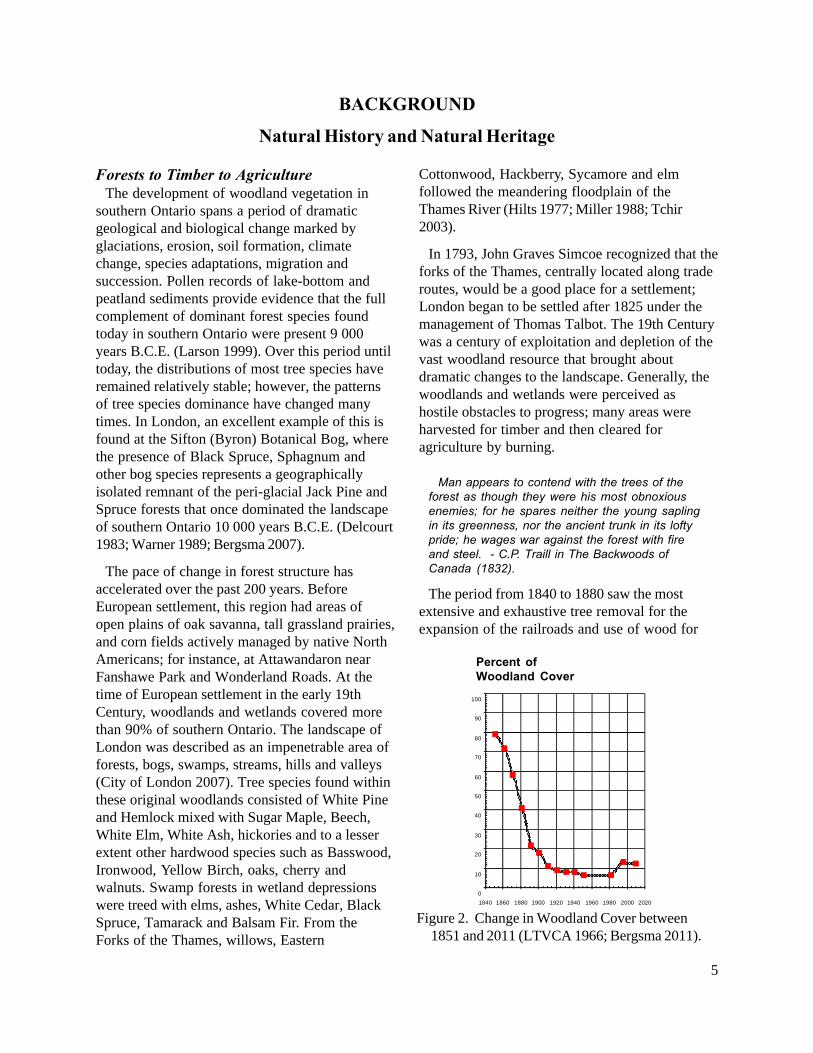
The period from 1840 to 1880 saw the mostextensive and exhaustive tree removal for theexpansion of the railroads and use of wood for
0
10
20
30
40
50
60
70
80
90
100
1840 1860 1880 1900 1920 1940 1960 1980 2000 2020
Figure 2. Change in Woodland Cover between1851 and 2011 (LTVCA 1966; Bergsma 2011).
Percent ofWoodland Cover

6
steam engines for locomotives and inmanufacturing (Figure 2). Logging of White Pineand oak for use as ship masts, telegraph poles andrailway ties was intense. Hemlock was harvestedfor its tannin-rich bark and ash was used toproduce potash. As much as 94% of uplandwoodland, 68% of wetland and 97% of prairieand savanna habitat types had been converted tonon-forest uses by the end of the 19th Century(Hilts 1977; Larson 1999). The once vast andcontinuous forested landscape was converted intoa highly productive agricultural area with onlyscattered, discontinuous woodlands and wetlandsleft along the middle sections of ruralconcessions, and linear corridors associated withthe river and valley systems that were too difficultto access for agriculture or timber harvest (Figure3).
Toward the end of the 19th Century andcontinuing into the 1930s, soil loss due to windand water erosion led to stream degradation,water pollution and flooding. The loss of forestcover across the southern Ontario landscaperemoved the structural protection to withstand theeffects of severe weather events. The Londonfloods of 1883 and 1937 demonstrated the
consequences of over-cutting, over-grazing andover-clearing of the landscape. Alarmed by theseeffects, the agricultural sector initiated the treeplanting movement in the late 19th century as ameans to prevent further degradation ofagricultural lands (OMNR 2001).
Wastelands to WoodlandsIn 1871, “An Act to encourage the planting of
trees upon the highways [of Ontario], and to givea right of property in such trees to the owners ofthe soil adjacent to such highways” became thefirst legislation enacted to encourage tree planting.In 1882, the American Forest Congress was heldin Cincinnati and Montreal. It was the first major“parliament of forestry in North America” andmore than 100 papers were presented. The mostcommonly expounded theme was an ecologicalargument for forest protection. Delegates to theCongress lamented the wanton destruction of theforest and reported that this had brought aboutclimate change, significant soil loss by wind andwater erosion, destructive floods and loss ofwildlife. The apparent exhaustion of the resourcecalled for remedies of standards for forestry;namely, diameter limit (12") cuts, sound forestrypractices, and land classification for best use
Non-Farm Original NaturalWoodlands and Wetlands
Unimproved Farmland
Improved-ClearedFarmland
Cropland
Unimproved Farmland:Non-Wooded
Farm Woodland
Replaced Woodlands
Urban
0
10
20
30
40
50
60
70
80
90
100
1801 1811 1821 1831 1841 1851 1861 1871 1881 1891 1901 1911 1921 1931 1941 1951 1961 1971 1981 1991
Percent ofLandscape
Figure 2. Change in land use between 1801 and 1991 (after Larson 1999).

7
allocation for agriculture, forestry or settlement.The management of the resource for multiple useobjectives could be possible by application ofappropriate silvicultural practices (Lambert 1967).The Tree Act of 1871 was superseded by TheOntario Tree Planting Act in 1883 that provided abonus to municipalities to plant trees. Activitiesassociated with the Trees Act were mostlyfocussed on public education about the value oftrees. During the nine years that the Act was ineffect, 75 000 trees were planted. In 1885, theProvince initiated Arbor Day for schools to bringthe public education to the next generation.Students were taught that values attributable totrees were as an economic resource, for their rolein soil conservation and that trees also serve tobeautify urban neighbourhoods (Lambert 1967).
In 1895, a new Clerk of Forestry, ThomasSouthworth, initiated a more technical emphasiswithin Ontario’s forestry programme. He oversawthe establishment of forest reserves, countyforests and silvicultural practices of 12" diameterlimit cuts, increased efforts at improving theforest condition and protection of foreststhroughout all of Ontario (Lambert 1967). Theneed for tree seedlings to distribute at low cost tolandowners was realized by the establishment ofthe St. Williams Tree Nursery in 1908. Thedirector, Edmund Zavitz, identified “wastelands”unsuitable for agriculture but suitable for trees.These afforestation plots became the provincialforestry stations and tree nurseries. From 1905 to1919, 3.4 million trees were distributed free tolandowners from the provincial tree nurseries. In1921, The Reforestation Act was passed enablingthe province to enter into agreements withmunicipalities to plant and manage afforestationprogams on lands held by counties. Thus beganthe Agreement Forest Program, a successfulventure that saw 147.5 million trees plantedbetween 1921 and 1998 (Lambert 1967; OMNR2001).
Watson H. Porter, in 1936, delivered a forward-thinking reforestation policy paper that called fora new program to inspire the public andmunicipalities across the province to take a moreserious approach to soil and water conservation.This led to two new provincial acts: the
Conservation Authorities Act in 1946 with aprimary mandate for water resources managementthrough flood control systems and the TreesConservation Act for afforestation programs. Inthe London area, the Upper Thames ValleyConservation Authority (UTVCA) was created byOrder in Council on September 18 1947. Theconservation authorities placed much emphasis ondeveloping partnerships with landowners toimprove their properties through various types ofconservation projects, including tree-plantingprograms on marginal lands for erosion control,windbreaks and productive forests. Since the late1940s, the conservation authorities have plantedmore than 51 million trees on private or publiclands (OMNR 2001).
In 1952, the first detailed survey of all vegetatedareas in the Thames River Watershed wascompleted by the UTVCA. Vegetation patchesgreater than 0.4 ha in size, regardless of the levelof disturbance or use, were inventoried, classifiedand mapped. The inventory revealed that grazingwas still a common practice in more than half ofall woodlands. The majority of woodlands (79%)showed evidence of regular cutting, indicated bythe presence of only few large remnant (seed)trees scattered among young second growth trees.Other woodlands (16%) were classified as veryyoung or pioneer growth. The survey resultsindicated a woodland cover of between 6 and 7%within the Thames River Watershed(Conservation Authorities Branch 1952). At thistime there was little to no protection of naturalareas and floodplains within the city or region.
In 1960, the Forestry Act was enacted thatdirected provincial nurseries to provide trees tolandowners at reduced prices. This was followedby the Woodlands Improvement Act in 1966 thatallowed agreements to be made with theDepartment of Lands and Forests and individuallandowners to provide assistance withafforestation and stand improvement. Throughthe provisions of this Act, 213 million trees wereplanted between 1966 and 1993 (OMNR 2001).
Since the ending of the Woodland ImprovementAct program in 1993, there are now a number ofother publicly and privately sponsored tree
8
planting programs: not-for-profit led partnerships,agroforestry initiatives, wetland habitat andbiodiversity stewardship funding, carbonsequestration and biodiversity management(Ontario Power Generation) plus many over-the-counter nursery stock programs to support treeplanting. These various programs have resulted inthe planting of another 11 million trees and over-the-counter sales of 792 million seedlings (OMNR2001). The grand total of tree planting efforts overthe course of 100 years has been 1 billion trees orroughly 10 million trees per year.
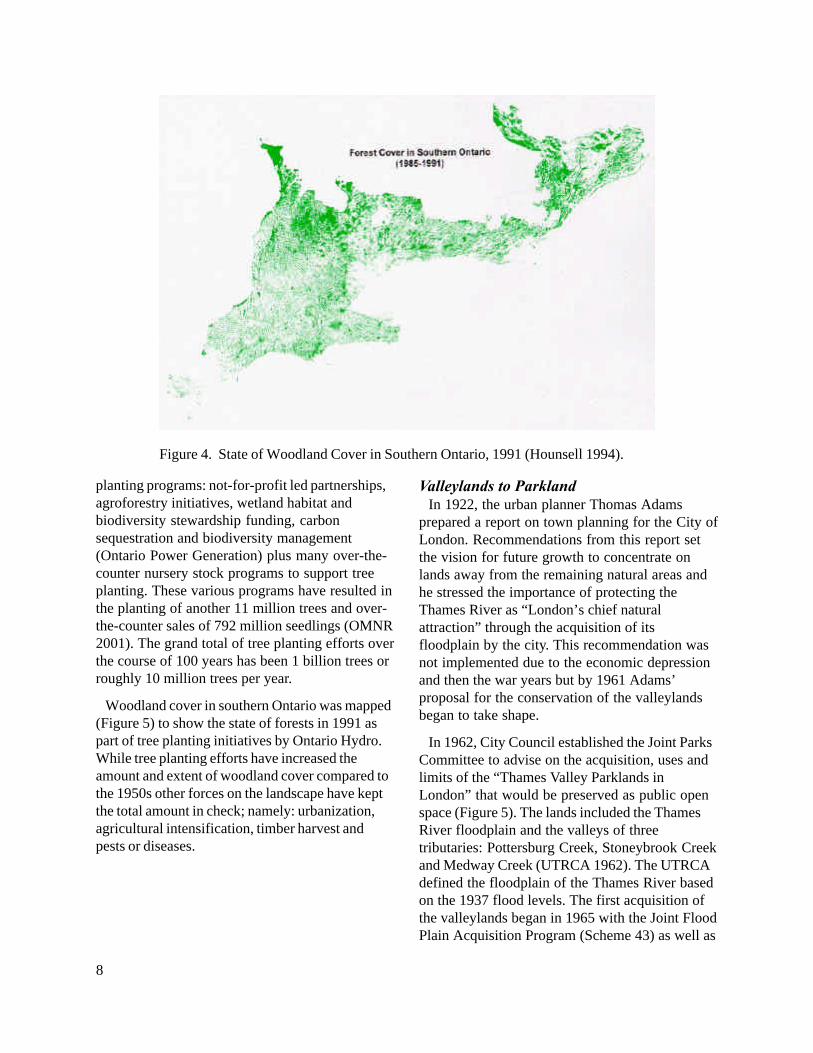
Woodland cover in southern Ontario was mapped(Figure 5) to show the state of forests in 1991 aspart of tree planting initiatives by Ontario Hydro.While tree planting efforts have increased theamount and extent of woodland cover compared tothe 1950s other forces on the landscape have keptthe total amount in check; namely: urbanization,agricultural intensification, timber harvest andpests or diseases.
Valleylands to ParklandIn 1922, the urban planner Thomas Adams
prepared a report on town planning for the City ofLondon. Recommendations from this report setthe vision for future growth to concentrate onlands away from the remaining natural areas andhe stressed the importance of protecting theThames River as “London’s chief naturalattraction” through the acquisition of itsfloodplain by the city. This recommendation wasnot implemented due to the economic depressionand then the war years but by 1961 Adams’proposal for the conservation of the valleylandsbegan to take shape.
In 1962, City Council established the Joint ParksCommittee to advise on the acquisition, uses andlimits of the “Thames Valley Parklands inLondon” that would be preserved as public openspace (Figure 5). The lands included the ThamesRiver floodplain and the valleys of threetributaries: Pottersburg Creek, Stoneybrook Creekand Medway Creek (UTRCA 1962). The UTRCAdefined the floodplain of the Thames River basedon the 1937 flood levels. The first acquisition ofthe valleylands began in 1965 with the Joint FloodPlain Acquisition Program (Scheme 43) as well as
Figure 4. State of Woodland Cover in Southern Ontario, 1991 (Hounsell 1994).

9
the Sifton (Byron) Botanical Bog and WestminsterPonds-Pond Mills (Scheme 44) through which theprovince contributed 50% of the funds. Areasidentified for acquisition included lands subject toerosion, lands with natural treed vegetation andlands with scenic qualities.
In 1971, the City’s Official Plan defined anddesignated the Thames Valley Parklands as MajorOpen Space and included a policy for landacquisition as a long-term program. Categories ofland suitable for acquisition were floodplain,designated conservation areas and greenbelt lands.
In 1975, the UTRCA undertook a new study ofall the floodplain lands designated as Major OpenSpace and the valleylands along the North Branchof the Thames River between the city limits andFanshawe Dam. This study was to serve as amaster plan to guide the development of arecreation system compatible with the policyobjective for conservation of the Thames RiverValley within London as public open space(UTRCA 1975). The Thames Valley LandsFloodplain Acquisition Project (1980) evolvedfrom this study.
The 1970s also marked a period of extensiveecological site surveys of natural areas in theLondon area. This included InternationalBiological Program reports in 1970-1972, Ministryof Natural Resources (MNR) Areas of Natural andScientific Interest (ANSI Life Science and ANSIEarth Science) studies 1972, MNR Sensitive Areareports in 1976-1977, London Ecological SiteSurvey (Hilts 1977), Natural Area Evaluations(Small 1978), MNR wetland evaluations andreports completed by the McIlwraith FieldNaturalists Club of London (now NatureLondon).
The 1977 Ecological Site Survey inventoried andevaluated 34 of the largest remaining natural areasin London. The sites were grouped into one offour categories suggestive of policy alternativesfor protection. The authors recommended that thebest means to achieve the long-term goal ofprotection would be to have an Official Plandesignation for significant natural areas, and acommitment to protection reflected in planningpolicies, enforced through Official Plans (Hilts1977).
Figure 5. Map of City of London showing Thames Valley Parklands, 1962.
10
In 1982, the 1977 study and other sources weresupplemented with additional field surveys of 65sites within Middlesex County. Sites wereevaluated for their relative environmentalimportance based on five (5) criteria; sites meetingone or more criteria were classified as significantnatural areas (Hilts 1982).
Natural Heritage System PolicyA major reform of the Planning Act occurred in
1993 followed by the Comprehensive Set ofPolicy Statements (CSPS). This reform broughtforward a new policy framework using anecosystem-based approach to planning. Thisapproach emphasized water resource managementat subwatershed scales and the identification andprotection of natural heritage systems withlinkages at local, regional and bioregional scales.London was well positioned to implement thenew policies in its new Official Plan to deal withthe annexation of about three times its land area in1993.
The London-Middlesex Act of 1992 required theCity to complete an Official Plan amendmentconsistent with the CSPS. Vision 96 was theprocess that the City of London implemented toincorporate ecosystem-based planning principlesinto its new Official Plan. Subwatershed studieswere undertaken to develop water resourcetargets. A life science inventory of representativevegetation patches in the London subwatershedswas completed in 1994 to identify significantcomponents of the Natural Heritage System(Bowles 1994).
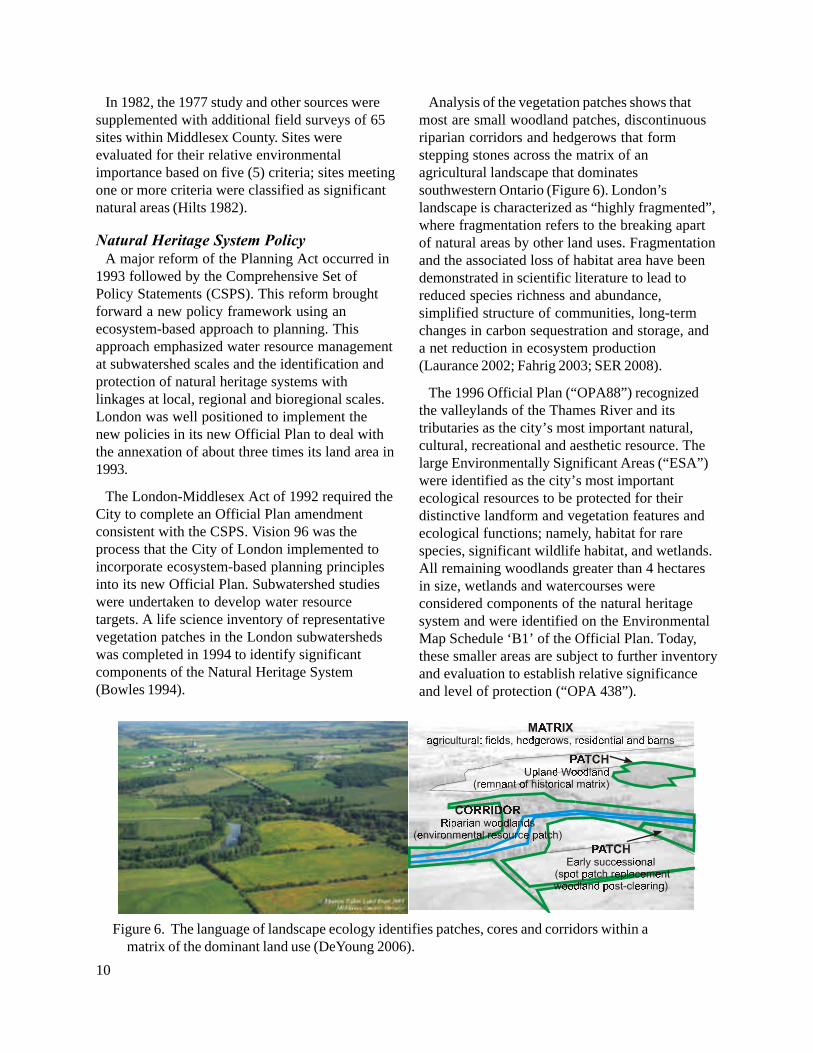
Analysis of the vegetation patches shows thatmost are small woodland patches, discontinuousriparian corridors and hedgerows that formstepping stones across the matrix of anagricultural landscape that dominatessouthwestern Ontario (Figure 6). London’slandscape is characterized as “highly fragmented”,where fragmentation refers to the breaking apartof natural areas by other land uses. Fragmentationand the associated loss of habitat area have beendemonstrated in scientific literature to lead toreduced species richness and abundance,simplified structure of communities, long-termchanges in carbon sequestration and storage, anda net reduction in ecosystem production(Laurance 2002; Fahrig 2003; SER 2008).
The 1996 Official Plan (“OPA88”) recognizedthe valleylands of the Thames River and itstributaries as the city’s most important natural,cultural, recreational and aesthetic resource. Thelarge Environmentally Significant Areas (“ESA”)were identified as the city’s most importantecological resources to be protected for theirdistinctive landform and vegetation features andecological functions; namely, habitat for rarespecies, significant wildlife habitat, and wetlands.All remaining woodlands greater than 4 hectaresin size, wetlands and watercourses wereconsidered components of the natural heritagesystem and were identified on the EnvironmentalMap Schedule ‘B1’ of the Official Plan. Today,these smaller areas are subject to further inventoryand evaluation to establish relative significanceand level of protection (“OPA 438”).
Figure 6. The language of landscape ecology identifies patches, cores and corridors within amatrix of the dominant land use (DeYoung 2006).

11
A Tree Conservation By-law was introduced in1996 to protect identified woodland areas shownon Official Plan mapping. Smaller woodlands andindividual trees were not recognized in theOfficial Plan, but were to be incorporated intodevelopment as appropriate through treepreservation plans.
In 1999, the UTRCA completed the MiddlesexNatural Heritage Study to identify significantwoodland patches to meet the provincial interestfor protection of the natural heritage system(Tchir 2003). The study inventoried 68 woodlandand wetland patches and evaluated and assessedtrends from these plus the 85 patches surveyed inthe City of London Subwatershed Studies(Bowles 1994). Woodland cover of MiddlesexCounty was estimated to be 12.3%.
The study reported that less than 10% of thewoodlands are larger than 40 hectares and thatmore than half of all woodlands are smaller than 4hectares in size. As a result of the relatively smallsize of most woodlands, the presence of forestinterior greater than 100 m from any edge couldbe measured in only 24% of woodlands 12 ha insize or greater. The seral age classificationindicated 64% to be pioneer or young, 30% mid-age and only 6% were considered mature.
The general condition of most woodlandsindicated a disturbed successional state recoveringfrom heavy logging (diameter limit cutting) orwere second growth from previously clearedlands. This was supported by analysis of thediameter class distribution that showed anoverabundance of small trees and few trees in thelargest size class compared with silviculturalstandards (OMNR 2000).
Comparison with the 1952 Conservation Reportby the Upper Thames Valley ConservationAuthority does not show much improvement inforest structure over nearly 50 years. Speciespresent were about the same but the relativedominance had shifted away from commerciallyvaluable timber species (cherry, oak, beech) toearly successional species (ash, aspen). SugarMaple, Yellow Birch and Basswood have beenrelatively constant. Elm was lost to Dutch Elm
Disease and Green Ash has increased its frequencyand dominance to fill the gaps left by elm(Kavanagh 1992; Kock 2008).
In 2000, the City (Bergsma 2000) assignedEcological Land Classification (Lee 1998) data tovegetation patches identified on the Official Planmap schedules “A” and “B” in a new GIS maplayer. This new data layer can be queried togenerate statistics about London’s natural heritagesystem, such as the area of vegetation patchesclassified by ELC Community Series or theamount of woodlands that are protected or havebeen redesignated through the developmentprocess.
A fifth detailed inventory of 55 vegetationpatches located in the agricultural lands and 20smaller parks with woodland areas inside theurban growth boundary of the city wasundertaken in 2004 (NSEI 2008). Vegetationclassification resulted in 365 vegetationcommunities of which 79% were woodlands.Approximately half were classified as deciduousforest, and one-quarter as deciduous swamp. Theage and size structure of these woodlandsindicated that 66% percent were comprised ofyoung trees, 25% were mid-age and less than 10%were considered older or mature in age. There areno old growth forests in the City of London.
The most frequently occurring woodlandvegetation types were Sugar Maple mixed withWhite Ash, Beech, or hickories; and, Silver Mapledeciduous swamp type. Other tree species foundin vegetation types co-dominant with Sugar Maplewere Basswood, Hemlock, Black Cherry andIronwood. Upland woodland vegetation types
© David Colvin 2006

12
represented by their dominant species includedPoplar, White Ash, Beech, Bur Oak, Red Oak,White Oak, Shagbark Hickory, Bitternut Hickoryand White Pine. Lowland and wetland woodlandvegetation types represented by their dominantspecies included White Elm, Black Walnut,Willow, Black Maple, Green Ash, White Cedar,and Red Maple. These tree species mixes reflectthe same species mixes that were present in pre-settlement London according to comparison withsurvey records.
The most recent life science inventory wascompleted for 47 vegetation patches within theThames River Valley as part of the larger ThamesValley Corridor Plan (City of London 2010). Thedominant tree species and vegetation types withinthe unique floodplain habitat of the Thames Riverconsisted of mixtures of Cottonwood, BlackWillow, Black Walnut, Hackberry, Green Ash,Manitoba Maple and Silver Maple. Less frequentlyoccurring vegetation types were White Cedar andHemlock on cool north facing slopes, and SugarMaple and Oak with Basswood and hickory onslightly drier sites.
A review of vegetation records and woodlanddescriptions (UTVCA 1952; Bowles 1994; Tchir2003; NSEI 2008; City of London 2010) showsthat there had not been much improvement in thequality of the woodlands as the seral ages weremostly young due in part to diameter-limit cuts.However, within the City of London, since theTree Conservation By-Law of 1996 that requiresgood forestry practices (OMNR 2000), the qualityof woodlands, at least in terms of age-size classdistributions, level of protection and wildlifehabitat values, has improved compared withrecent data from Oxford and Middlesex Counties(Bergsma 2011, unpublished).
Woodlands, Wetlands and WatercourseProtection
Land use planning decisions over the pasttwenty years have brought a substantial amount ofwoodlands, wetlands, watercourses and wildlifehabitat into the public domain by ownership,stewardship or policy. The Planning Act, theConservation Authorities Act, the ProvincialPolicy Statement and the City of London OfficialPlan guide the efficient development of land forresidential, commercial and industrial uses and toset development in balance with the goal toprotect the natural heritage system. This planningprocess allows for the identification andevaluation of an integrated system of significantnatural areas, significant woodlands, significantwetlands and significant stream corridors asimportant resources to protect and secure for theirinherent ecosystem functions, processes andvalues; and for the provision of passive outdoorrecreational open space for the citizens ofLondon. In such cases, the City or otherconservation agencies and non-profitorganizations explore options for purchasing, orotherwise acquiring, managing or providingaccess to these lands.
A century ago, less than 10% of the landscapehad natural cover of woodlands or wetlands andless than 1% of that was protected in the publicdomain. Before the Conservation Authorities Actof 1946, little was protected; but, by the time ofthe Thames Valley Parkland assembly in 1982 thelandscape had less than 7% in natural cover and© David Colvin 2006
13
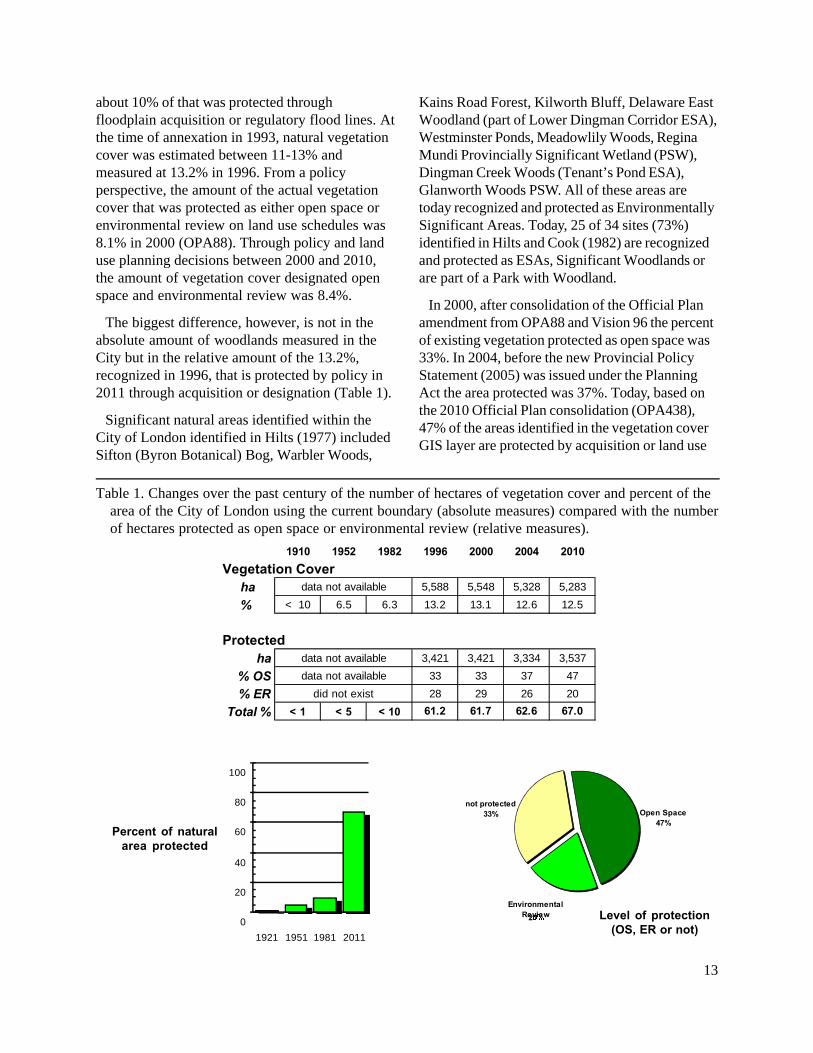
about 10% of that was protected throughfloodplain acquisition or regulatory flood lines. Atthe time of annexation in 1993, natural vegetationcover was estimated between 11-13% andmeasured at 13.2% in 1996. From a policyperspective, the amount of the actual vegetationcover that was protected as either open space orenvironmental review on land use schedules was8.1% in 2000 (OPA88). Through policy and landuse planning decisions between 2000 and 2010,the amount of vegetation cover designated openspace and environmental review was 8.4%.
The biggest difference, however, is not in theabsolute amount of woodlands measured in theCity but in the relative amount of the 13.2%,recognized in 1996, that is protected by policy in2011 through acquisition or designation (Table 1).
Significant natural areas identified within theCity of London identified in Hilts (1977) includedSifton (Byron Botanical) Bog, Warbler Woods,
Kains Road Forest, Kilworth Bluff, Delaware EastWoodland (part of Lower Dingman Corridor ESA),Westminster Ponds, Meadowlily Woods, ReginaMundi Provincially Significant Wetland (PSW),Dingman Creek Woods (Tenant’s Pond ESA),Glanworth Woods PSW. All of these areas aretoday recognized and protected as EnvironmentallySignificant Areas. Today, 25 of 34 sites (73%)identified in Hilts and Cook (1982) are recognizedand protected as ESAs, Significant Woodlands orare part of a Park with Woodland.
In 2000, after consolidation of the Official Planamendment from OPA88 and Vision 96 the percentof existing vegetation protected as open space was33%. In 2004, before the new Provincial PolicyStatement (2005) was issued under the PlanningAct the area protected was 37%. Today, based onthe 2010 Official Plan consolidation (OPA438),47% of the areas identified in the vegetation coverGIS layer are protected by acquisition or land use
Table 1. Changes over the past century of the number of hectares of vegetation cover and percent of thearea of the City of London using the current boundary (absolute measures) compared with the numberof hectares protected as open space or environmental review (relative measures).
1910 1952 1982 1996 2000 2004 2010
Vegetation Coverha 5,588 5,548 5,328 5,283
% < 10 6.5 6.3 13.2 13.1 12.6 12.5
Protectedha 3,421 3,421 3,334 3,537
% OS 33 33 37 47
% ER 28 29 26 20
Total % < 1 < 5 < 10 61.2 61.7 62.6 67.0
data not available
data not available
did not exist
data not available
0
20
40
60
80
100
1921 1951 1981 2011
EnvironmentalReview
not protected33% Open Space
47%Percent of natural
area protected
Level of protection(OS, ER or not)

14
designation as Open Space on Schedule A ofLondon’s Official Plan. An additional 20% ofvegetation cover is designated as EnvironmentalReview on Schedule A, and identified as anunevaluated component of the natural heritagesystem.
This chapter on the history of forests insouthwestern Ontario illustrates a period of rapidand catastrophic change over just 40 years but thatthere has been a sustained and improving effort atwoodland maintenance, afforestation and policyprotection in the 140 year period since the OntarioTree Act of 1871. The current paradigm is of anatural heritage system protected in policy andsupported by municipal and communityprogrammes.
The natural elements that sustain healthyfunctional ecosystems and provide goods andservices, essentially without cost, represent in
economic terms, “natural capital”. Along acontinuum of ecosystem-based management ofvegetation and other resources, there is the othereconomic term, “green infrastructure”. Greeninfrastructure is a strategic approach toconservation and growth management byrecognizing and integrating green networks inplanning as community necessities versusamenities. Green infrastructure is broadly definedas an integrated and interconnected network ofnatural and engineered green elements thatmaintain ecological functions at a variety of scales(Wilkie 2009).
In London, about 55% of vegetation is withinnatural areas and Open Space. Urban forestry isalso concerned with the other 45% and the nextsection will discuss street and otherneighbourhood trees.
© David Colvin 2006

15
City Street and Park Trees
Between 2001 and 2002 the City’s Forestrysection undertook a systematic inventory of theCity-owned boulevard and accessible park trees.The majority of the streets within the urban areawere included as were the most accessible trees inparks. Some new subdivisions at the time, as wellas woodlands, heavily treed portions of parkswithin the urban area, and rural roads andwoodlands outside the urban area were notsampled. The inventory is updated on a continualbasis as new trees are re-planted or removed. In2004 the database was made available on theInternet making London one of the first cities inNorth America with a publicly accessible webbased tree inventory. Residents can access the treeinventory information at the City of London website “www.london.ca” and follow the links toCityMap. By activating the tree layer, residents cansee the location of trees and identify any tree thatis mapped (Figure 7).
The inventory information for each treeincludes: species (Latin and common name),trunk diameter measured 1.3 m above the ground(dbh), and tree condition (health) class. There arecurrently 164 000 individual trees identified in the
inventory and are estimated to be 3.7% of all treesin the City. Boulevard or street trees account for79% and trees in active parks and other publicgreen spaces account for 21%. The most commonboulevard trees are Norway Maple, Little LeafLinden, Honey Locust, Silver Maple and SugarMaple. The most common trees in active parks areSugar Maple, Box Elder (Manitoba Maple),Norway Maple, Silver Maple and Red Oak.
Each tree is geospatially referenced allowing thetree locations to be accurately mapped. The treeinventory information is stored in geographicinformation system (GIS) as a data layer that canbe accessed in combination with otherinformation layers to provide detailed maps forplanning and operational purposes.
The tree inventory database is used to plan andimplement the City’s tree maintenance andplanting programs. It is also used extensively inthe review and approval of new development andreplacement of infrastructure (sewers, gas,electricity, communication lines). The informationin the inventory system is used intensively formanaging the tree maintenance program and pestssuch as the Emerald Ash Borer.
Figure 7. Screen captureof CityMap with treeinventory shown asgreen dots. The treeidentified by the redcircle is a very largeSilver Maple with atrunk diameter (dbh)of 114 cm.

16
© McPherson 1994
Ecosystem Benefits of Trees
This section borrows heavily from the MillenniumEcosystem Assessment (2003), Hastie (2003) andColorado Trees (2010). These are complementarysources and are integrated here without in-textcitations.
Ecosystems are defined as a dynamic complex ofthe non-living environment, plant, animal, andmicroorganism communities all acting together asa functional unit. Humans are an integral part ofecosystems. Ecosystems provide a variety ofservices or environmental benefits to humans thatcan be grouped as supporting, regulating orprovisioning.
Supporting ServicesSupporting services are necessary for the
production of all other ecosystem services;namely, soil formation, nutrient cycling andprimary production. Benefits from within thesupporting services category are the production ofoxygen gas and the conversion of atmosphericcarbon dioxide to carbohydrates throughphotosynthesis. Plants store these carbohydratesas cellulose that is used by humans as timber,edible products and either directly or indirectly inwildlife habitat. Other supporting services includesoil formation, nutrient cycling; cultural services:recreational, spiritual, religious and other non-material benefits.
Regulating ServicesRegulating services provide negative feedback
loops that assure the overall stability of ecosystemprocesses. Benefits obtained from regulatingservices include: climate regulation, air qualityeffects, disease regulation, water regulation, waterpurification and pollination. At all scales fromlocal, bioregional, continental or global, changesin tree cover influence temperature andprecipitation. Climate moderation in the temperatezones is also influenced by the habit of deciduoustrees to lose their leaves in autumn. This has theeffects of firstly, to reduce solar radiation insummer and secondly, to allow increasedradiation receipt in the winter. Trees lower localair temperatures by releasing water vapour
through leaf stomata to the air. Water from dew orprecipitation evaporates from leaf surfaces and thisalso contributes to reduce local air temperatures.
The loss of global forest cover and the increase inthe consumption of fossil fuels leads to relativelyhigh levels of carbon dioxide in the atmosphere.The accumulation of carbon dioxide and otherheat-trapping gases induces the greenhouse effectthat has negative feedback to global climate andglobal air quality.
Water regulation is strongly influenced by landcover and the amount of treed vegetation directlyinfluences the timing and magnitude of runoff,flooding and aquifer recharge. Trees conservewater locally by influencing snowfall and also thetiming of snowmelt; trees can also reduce fog. Leafsurfaces intercept rainfall and extend the durationof runoff. This reduced runoff lessens thefrequency and magnitude of flooding. Topsoil ispreserved, sediment erosion is reduced and harmfulrunoff is prevented from entering watercourses;thus, protecting our water resources and aquaticlife.

17
Figure 8. Leaf processes: photosynthesis, respiration, gaseous exchange, water vapour toatmosphere; and leaf surface functions: precipitation interception, particulate trap and shade.
Tree roots act as pollution filters directly byanchoring soil and by uptake of heavy metals(cadmium, chromium, nickel and lead) that isstored in living or woody tissue.
Leaf surfaces trap particulate matter and gaseouspollutants are extracted from the atmospherethrough leaf stomata (Figure 8). These regulatingservices provide direct environmental benefits tohumans by improved air quality (see Air Quality,below).
Tree leaves shade the surfaces below and thislowers local surface temperatures. Buildings,pavement, sidewalks, vehicles and other objectsshaded by trees receive less solar radiation andthus experience lower temperatures and alsoreflect less heat back into the atmosphere. Forhumans, this reduces the urban heat island effect,lowers the risk of heat stress and reducesexposure to harmful ultra-violet (UV) rays fromthe sun. The reduced surface temperature ofasphalt reduces the volatization of the oil bindersof the asphalt and thus reduces road maintenancecosts by extending the life of the pavement.
Expressed in terms of energy consumption,humans benefit from trees through reducedenergy consumption in three ways: reduced heatloss by controlling wind in winter, reduced heataccumulation by shading in summer and reducedfossil fuel burning used for home heating or airconditioning.
Provisioning ServicesProvisioning services provided by trees include
products obtained directly from ecosystems: food,fresh water, fuel wood, fibre, biochemicals,pharmaceuticals and genetic resources.
Other BenefitsOther benefits of trees are grouped here as
influences on human behaviour for theirintangible, but nevertheless, measurable effects.Trees are used in urban design as integralelements of the architecture of the builtenvironment to control privacy, to articulate spacefor the flow of movement of pedestrians orvehicles, to guide the gradual unfolding of a viewor to screen objectionable views. Trees are valuedfor the aesthetics of shape, texture, color or
18
Pollutant OD
OU
R
VIS
IBIL
ITY
AC
IDD
EP
OS
ITIO
N
SM
OG
CL
IMA
TE
CH
AN
GE
Particulate Matter F F F F FOzone F F F
Sulphur Dioxide F F F F FTotal Reduced Sulphur Compounds F F F
Nitrogen Oxides F F F FCarbon Monoxide F F
Volatile Organic Compounds F F F
Note: after MOE 2008
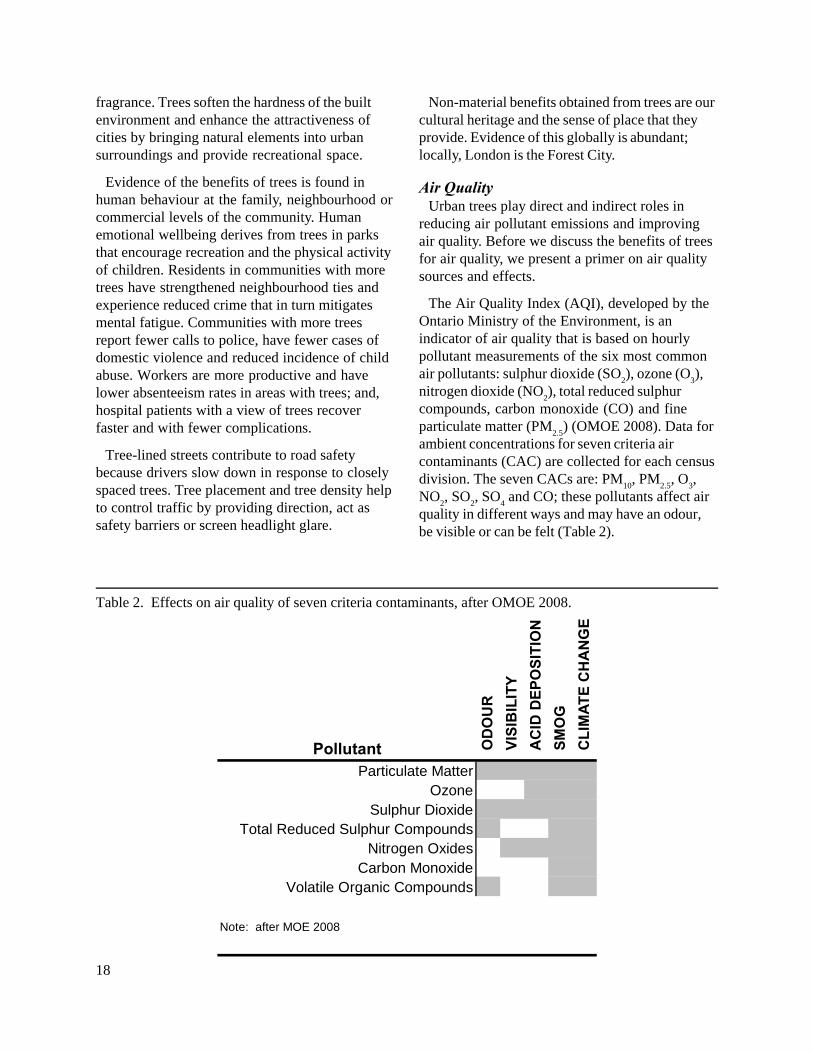
Table 2. Effects on air quality of seven criteria contaminants, after OMOE 2008.
fragrance. Trees soften the hardness of the builtenvironment and enhance the attractiveness ofcities by bringing natural elements into urbansurroundings and provide recreational space.
Evidence of the benefits of trees is found inhuman behaviour at the family, neighbourhood orcommercial levels of the community. Humanemotional wellbeing derives from trees in parksthat encourage recreation and the physical activityof children. Residents in communities with moretrees have strengthened neighbourhood ties andexperience reduced crime that in turn mitigatesmental fatigue. Communities with more treesreport fewer calls to police, have fewer cases ofdomestic violence and reduced incidence of childabuse. Workers are more productive and havelower absenteeism rates in areas with trees; and,hospital patients with a view of trees recoverfaster and with fewer complications.
Tree-lined streets contribute to road safetybecause drivers slow down in response to closelyspaced trees. Tree placement and tree density helpto control traffic by providing direction, act assafety barriers or screen headlight glare.
Non-material benefits obtained from trees are ourcultural heritage and the sense of place that theyprovide. Evidence of this globally is abundant;locally, London is the Forest City.
Air QualityUrban trees play direct and indirect roles in
reducing air pollutant emissions and improvingair quality. Before we discuss the benefits of treesfor air quality, we present a primer on air qualitysources and effects.
The Air Quality Index (AQI), developed by theOntario Ministry of the Environment, is anindicator of air quality that is based on hourlypollutant measurements of the six most commonair pollutants: sulphur dioxide (SO
2), ozone (O
3),
nitrogen dioxide (NO2), total reduced sulphur
compounds, carbon monoxide (CO) and fineparticulate matter (PM
2.5) (OMOE 2008). Data for
ambient concentrations for seven criteria aircontaminants (CAC) are collected for each censusdivision. The seven CACs are: PM
10, PM
2.5, O
3,
NO2, SO
2, SO
4 and CO; these pollutants affect air
quality in different ways and may have an odour,be visible or can be felt (Table 2).
19
© David Colvin 2006
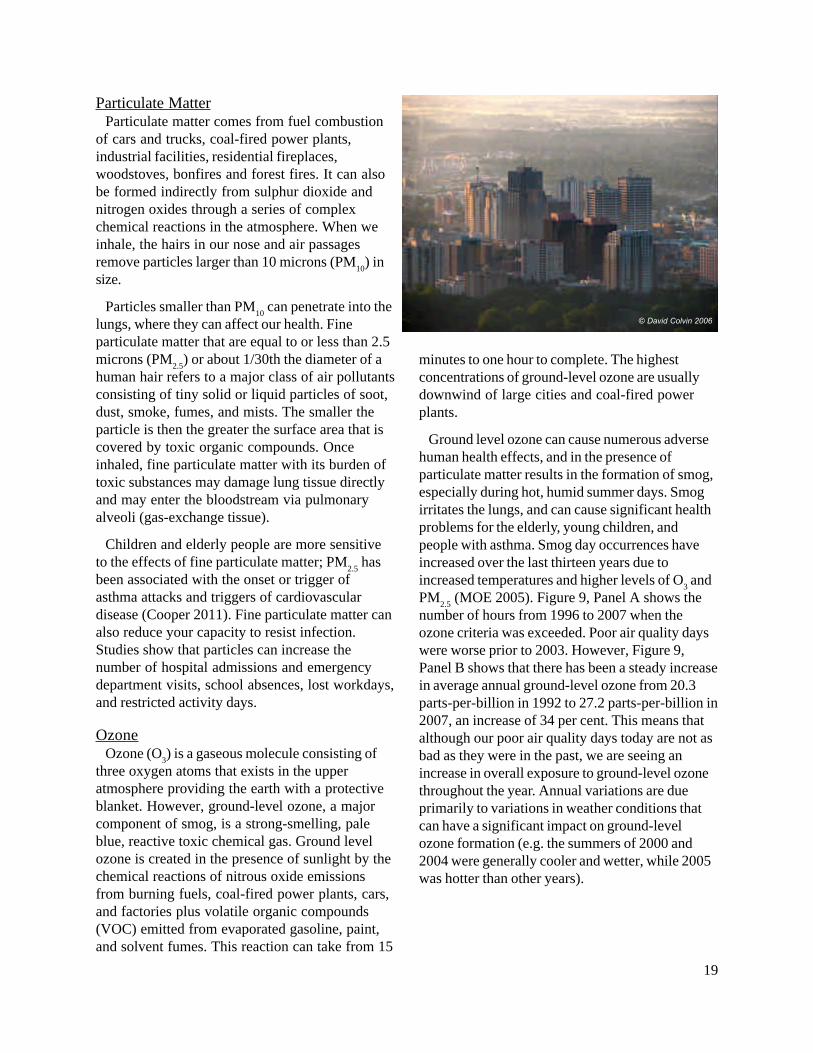
Particulate MatterParticulate matter comes from fuel combustion
of cars and trucks, coal-fired power plants,industrial facilities, residential fireplaces,woodstoves, bonfires and forest fires. It can alsobe formed indirectly from sulphur dioxide andnitrogen oxides through a series of complexchemical reactions in the atmosphere. When weinhale, the hairs in our nose and air passagesremove particles larger than 10 microns (PM
10) in
size.
Particles smaller than PM10
can penetrate into thelungs, where they can affect our health. Fineparticulate matter that are equal to or less than 2.5microns (PM
2.5) or about 1/30th the diameter of a
human hair refers to a major class of air pollutantsconsisting of tiny solid or liquid particles of soot,dust, smoke, fumes, and mists. The smaller theparticle is then the greater the surface area that iscovered by toxic organic compounds. Onceinhaled, fine particulate matter with its burden oftoxic substances may damage lung tissue directlyand may enter the bloodstream via pulmonaryalveoli (gas-exchange tissue).
Children and elderly people are more sensitiveto the effects of fine particulate matter; PM
2.5 has
been associated with the onset or trigger ofasthma attacks and triggers of cardiovasculardisease (Cooper 2011). Fine particulate matter canalso reduce your capacity to resist infection.Studies show that particles can increase thenumber of hospital admissions and emergencydepartment visits, school absences, lost workdays,and restricted activity days.
OzoneOzone (O
3) is a gaseous molecule consisting of
three oxygen atoms that exists in the upperatmosphere providing the earth with a protectiveblanket. However, ground-level ozone, a majorcomponent of smog, is a strong-smelling, paleblue, reactive toxic chemical gas. Ground levelozone is created in the presence of sunlight by thechemical reactions of nitrous oxide emissionsfrom burning fuels, coal-fired power plants, cars,and factories plus volatile organic compounds(VOC) emitted from evaporated gasoline, paint,and solvent fumes. This reaction can take from 15
minutes to one hour to complete. The highestconcentrations of ground-level ozone are usuallydownwind of large cities and coal-fired powerplants.
Ground level ozone can cause numerous adversehuman health effects, and in the presence ofparticulate matter results in the formation of smog,especially during hot, humid summer days. Smogirritates the lungs, and can cause significant healthproblems for the elderly, young children, andpeople with asthma. Smog day occurrences haveincreased over the last thirteen years due toincreased temperatures and higher levels of O
3 and
PM2.5
(MOE 2005). Figure 9, Panel A shows thenumber of hours from 1996 to 2007 when theozone criteria was exceeded. Poor air quality dayswere worse prior to 2003. However, Figure 9,Panel B shows that there has been a steady increasein average annual ground-level ozone from 20.3parts-per-billion in 1992 to 27.2 parts-per-billion in2007, an increase of 34 per cent. This means thatalthough our poor air quality days today are not asbad as they were in the past, we are seeing anincrease in overall exposure to ground-level ozonethroughout the year. Annual variations are dueprimarily to variations in weather conditions thatcan have a significant impact on ground-levelozone formation (e.g. the summers of 2000 and2004 were generally cooler and wetter, while 2005was hotter than other years).

20
Figure 9. Ambient air quality in London for ozoneand fine particulate matter.
Panel A. Number of hours that ozone levels exceeded AQC threshold of 80 parts per billion.
Panel C. Annual mean concentration of fine particulate matter (micrograms per cubic metre).
Panel B. Annual mean concentration of ozone levels (parts per billion).
Health CostsThe National Illness Cost of Air Pollution
(NICAP) quantified the national health andeconomic impacts of air pollution and put a dollarfigure on the health effects and correspondingeconomic costs of air pollution in Canada (CMA2008). NICAP uses the best available knowledgeand data on air quality, human health andeconomics to produce forecasts of health impactsand expected costs relating to changes in airquality.
To estimate the impacts of a wide range ofhealth effects within four age groups, the NICAPmodel uses the seven CAC individual pollutants(Table 2). Based on the advice of an ExpertOpinion Elicitation Process, the National ICAPmodel uses a two pollutant model based on thecombined effect of the two highly predictivepollutants: fine particulate matter (PM
2.5) and
ozone (O3). These two contaminants arise
principally from vehicle emissions. Particulatematter results from complex mixtures ofsulphates, nitrates, ammoniates, polycyclicaromatic hydrocarbons, and metals (Cooper2011). Nitrous oxides, volatile organic compoundsand particulate matter in the presence of sunlightgenerate ground-level ozone.
The health and economic damages of airpollution on the health of Canadians is significantand will become more so over time. Thesedamages are experienced by all Canadians, eitherdirectly due to reduced personal health andquality of life, or through the impaired health offamily members and friends or through increasedcosts of our national healthcare system.
In Ontario, the NICAP report predicts that,annually, there are more than 1 400 acutepremature deaths, more than 4 500 hospitaladmissions, hundreds of thousands of emergencydepartment or doctors office visits, plus millionsof unreported minor illnesses attributable to airquality. The economic consequences are measuredas several billion dollars per year (CMA 2008).
The NICAP report predicts that, annually, thereare more than 230 premature deaths, 690 hospitaladmissions, 2 350 emergency visits, 1 310 000 lost

21
Table 3. Annual amount of pollutants (kg) removed by trees by dbh class size.
dbhPollutantsRemoved
Number of Trees forSame Effect
as one large treeTree Stature cm kg
Small 2.5 - 38.1 0.14 8Medium 38.2 - 68.6 0.63 2
Large > 68.7 1.05 1
Note: after Appendix 4 in Nowak 1994
productivity days valued at 16.6 million dollars andan annual direct cost to the health care system ofmore than 23 million dollars in Middlesex County(OMA 2006). London accounts for 65% of theland area and 83% of the population of Middlesex;thus, the results for the county are highly relevantto London.
Information on air quality issues in London islocated at the CLEAR Network web site at“www.clear.london.ca”. In London, air pollutionoriginates from a variety of sources. Over half ofthe air pollution is ground-level ozone and fineparticulate matter (PM
2.5) that comes from upwind
sources such as large cities and coal-fired powerplants in the U.S. Midwest states. The other halfcomes from the citizens of London, with the mainsource being vehicle emissions. During some smogepisodes, it is estimated that more than 50 per centof London’s fine particulate matter comes from theU.S.
In recent years, there has been a downward trendfor the annual mean concentration of fineparticulate matter in London (Figure 9, Panel C).Air quality index readings of ‘moderate’ and ‘poor’for London are most common during the months ofMay to October when smog day alerts are issued(OMOE 2005). Between 2005 and 2007, therewere only 1 to 3 days every year with ‘poor’ airquality, but 32 to 58 days with ‘moderate’ airquality. More information on health impacts ofozone and appropriate precautions can be found atthe Middlesex London Health Unit web site“www.healthunit.com”.
Role of Trees in Reducing Air ContaminantsTree transpiration and tree canopies reduce air
temperature by affecting radiation absorption, heatstorage, wind speed, relative humidity and watermovement. The reduction in air temperatureimproves air quality because the emissions of manypollutants and ozone-forming chemicals aretemperature dependent (Nowak 1995, Cappiella2005, Pollution Probe 2002). A lowering oftemperature reduces energy consumption inbuildings during the summer, which in turn reducesthe air pollutant emissions from the fossil fuelbased power plants needed to cool those buildings(Abdollahi 2000).
Trees prevent pollutants from re-entry into theatmosphere by trapping small pollutant particles ontheir tissues and by directly absorbing gaseouspollutants, thereby preventing re-entry of thepollutants into the atmosphere.
When it comes to the ability of a tree to reducepollution, size matters: the greater the tree, thegreater leaf surface area, the more air contaminantsremoved (Table 3). Young and small stature treesdo not filter as well, or as much, as large staturetrees; it requires as many as eight small trees toobtain an equal benefit of air contaminant removalas one large stature tree. Planting trees nearsources of automobile exhaust is also important.Planting trees or managing forests is a relativelycost-effective way of removing air pollutants fromthe air at the micro scale; cumulatively, these smallgains in filtering pollutants by trees are significantsince human activities continuously add airpollutants to the atmosphere (Table 4).
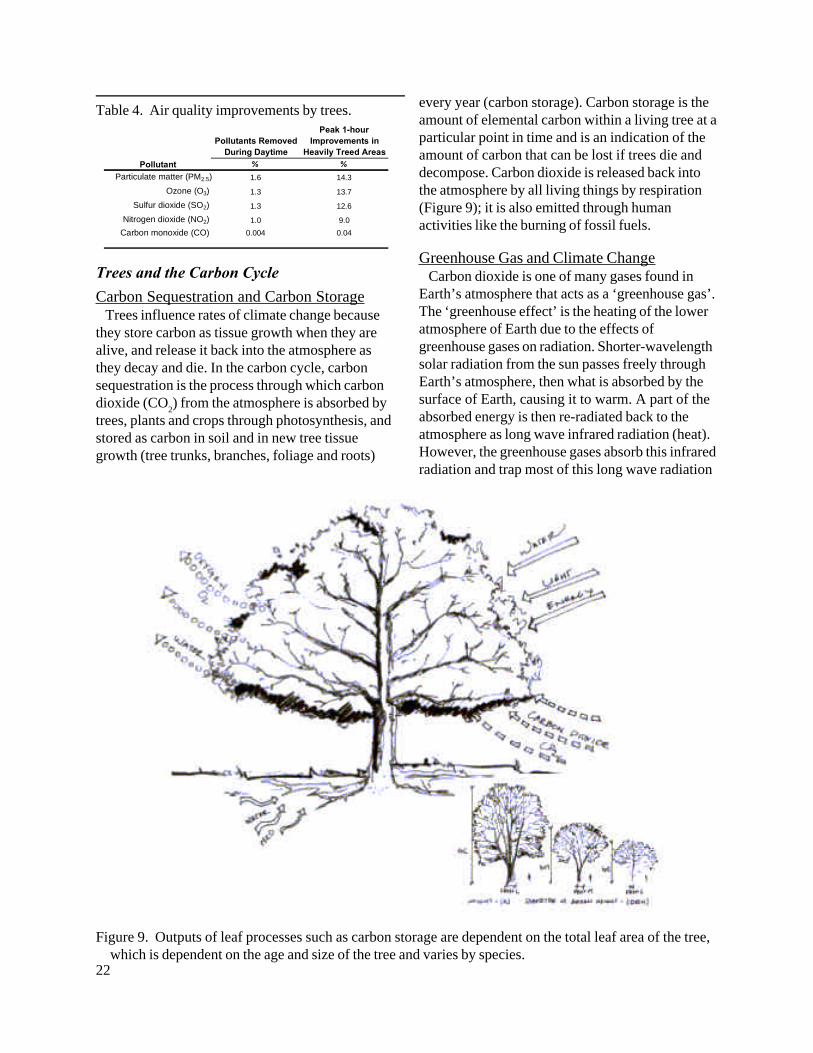
22
every year (carbon storage). Carbon storage is theamount of elemental carbon within a living tree at aparticular point in time and is an indication of theamount of carbon that can be lost if trees die anddecompose. Carbon dioxide is released back intothe atmosphere by all living things by respiration(Figure 9); it is also emitted through humanactivities like the burning of fossil fuels.
Greenhouse Gas and Climate ChangeCarbon dioxide is one of many gases found in
Earth’s atmosphere that acts as a ‘greenhouse gas’.The ‘greenhouse effect’ is the heating of the loweratmosphere of Earth due to the effects ofgreenhouse gases on radiation. Shorter-wavelengthsolar radiation from the sun passes freely throughEarth’s atmosphere, then what is absorbed by thesurface of Earth, causing it to warm. A part of theabsorbed energy is then re-radiated back to theatmosphere as long wave infrared radiation (heat).However, the greenhouse gases absorb this infraredradiation and trap most of this long wave radiation
Figure 9. Outputs of leaf processes such as carbon storage are dependent on the total leaf area of the tree,which is dependent on the age and size of the tree and varies by species.
Pollutants RemovedDuring Daytime
Peak 1-hourImprovements in
Heavily Treed Areas
Pollutant % %
Particulate matter (PM2.5) 1.6 14.3
Ozone (O3) 1.3 13.7
Sulfur dioxide (SO2) 1.3 12.6
Nitrogen dioxide (NO2) 1.0 9.0
Carbon monoxide (CO) 0.004 0.04
Table 4. Air quality improvements by trees.
Trees and the Carbon Cycle
Carbon Sequestration and Carbon StorageTrees influence rates of climate change because
they store carbon as tissue growth when they arealive, and release it back into the atmosphere asthey decay and die. In the carbon cycle, carbonsequestration is the process through which carbondioxide (CO
2) from the atmosphere is absorbed by
trees, plants and crops through photosynthesis, andstored as carbon in soil and in new tree tissuegrowth (tree trunks, branches, foliage and roots)

23
in the atmosphere, allowing only some heat to passthrough to space. This causes the lower atmosphereto warm. If atmospheric concentrations ofgreenhouse gases remain relatively stable, theamount of energy sent from the sun to Earth’ssurface should be about the same as the amount ofenergy radiated back into space, leaving thetemperature of Earth’s surface roughly constant. Ifcarbon dioxide, or any other greenhouse gas,becomes too high in atmospheric concentration, theplanet warms up.
A significant source of atmospheric carbondioxide is deforestation for lumber, pulpwood, fuelwood and the clearing of forests for newagricultural land. As the abundance of treesdeclines, less carbon dioxide can be recycled.Carbon is also released into the air by burning.Fossil fuels were created chiefly by the decay ofplants from millions of years ago. These fossilfuels contain carbon, and when they are burned,they combine with oxygen, forming carbon dioxide.Human activities such as the burning of oil, coaland natural gas to generate electricity, heat ourhomes, power our factories and run our cars, haveincreased CO
2 concentrations in the atmosphere.
Every year humans add over 30 billion tonnes ofcarbon dioxide in the atmosphere by theseprocesses; in 2005, global atmosphericconcentrations of CO
2 were 35% higher than they
were before the Industrial Revolution. This hasupset the balance of the carbon cycle and increasedthe temperature of the planet’s surface (Farquhar2001), causing a change in the climate. Climatechange is an issue of global concern.
Role of Trees in Mitigating Climate ChangeUrban trees help mitigate climate change by
removing atmospheric carbon from carbondioxide and storing it as new tissue growth everyyear (sequestering). Trees also reduce energy use inbuildings, which subsequently reduces carbondioxide emissions from fossil fuel based powerplants.
As trees grow, their capacity to store more carbonincreases with the size of leaf area. The amount ofcarbon annually sequestered is higher in healthiertrees and in larger diameter trees. The very largest
trees store twice as much carbon as medium sizetrees, and approximately twenty times as much assmall trees.
However, as trees die and decay, they releasemuch of the stored carbon back into the atmospherein the form of CO
2. Thus, carbon storage is an
indication of the amount of carbon that can bereturned into the atmosphere as trees die and thewood and leaves decompose. When in balance, thetotal carbon dioxide emissions and removals fromthe entire carbon cycle are roughly equal. Whencarbon sequestration is greater than carbonemissions, a carbon sink occurs. From amanagement perspective, it is important to have ahealthy forest with a high proportion of large-stature trees in order to maximize the carbon sink.
The importance of choosing the largest andlonger-living trees for a site is emphasized inFigure 10. Crape Myrtle is a large shrub or smallornamental tree than can range from 2.5 m to 9 min height depending on variety. Hackberry is amedium stature shade tree that can attain a heightof over 20 m. During its lifetime, Crape Myrtle willhave sequestered only 150 kg while the longer-lived, larger stature Hackberry will havesequestered 3 500 kg; a 23-fold difference makingthe Hackberry a superior investment.
Another way of thinking about the importance ofchoosing large stature trees to obtain optimalbenefits from the urban forest is to comparecarbon emissions from automobile use with carbon
Figure 10. The relationship between tree size,longevity and CO
2 sequestration (McPherson
2009).

24
• excess heat from automobiles, airconditioning, industries and other sources• high levels of pollution that change theradiative (arrangement of electromagneticwaves) properties of the atmosphere.
Role of Trees to Reduce UHI EffectTrees reduce air temperature by providing shade,
altering wind speed and giving off moisture throughthe surface of leaves; a single large tree maytranspire as much as 500 L per day (Kock 2008).Lower air temperatures reduce the amount ofenergy needed to cool buildings in the summer,which in turn reduces the amount of air pollutantemissions from fossil-fuel based power plants usedto cool those buildings (Abdollahi 2000).
Table 5. Equivalent vehicle travel avoided by tree diameter class.
dbhCarbonStorage
CarbonSequestered CO2 Removed
EquivalentVehicle Travel
Number ofTrees for
Same Effectas one large
treeStature1
cm kg kg / yr kg / yr kmSmall
2.5 - 15.2 22 3 9 34 2815.3 - 38.1 469 19 71 256 4
Medium38.2 - 53.3 1,113 28 103 368 353.4 - 68.6 2,139 44 161 573 2
Large> 68.7 4,617 73 268 947 1
Note: (1) see Tree Stature in Glossary
sequestration and carbon storage by trees (Table5). As many as 28 small stature trees with a dbh ofless than 15.2 cm are required to provide theequivalent CO
2 removal as a single large stature
tree that has a dbh greater than 69 cm. This isbecause a healthy large stature tree has more leaveswith much greater leaf surface area than a smallstature tree, thus providing substantially greatersequestration benefits. This trend continues untilthe tree reaches its optimal size (i.e. the size thatcorresponds to the peak carbon filtration point).
Trees and Energy Use
Urban Heat Island (UHI)Cities tend to have three to eight degrees
Fahrenheit (2 to 4 Celsius) higher summertimetemperatures than the countryside (Moll andEbenreck 1989, Barry and Chorley 1987). Themain cause of higher temperatures in the city is thehigh reflectance (albedo) of visible, infrared andultraviolet wavelengths of sunlight by theadditional concrete and asphalt, which absorb andreflect heat differently than the surrounding ruralareas (Oke 1982).
Other reasons that temperatures are higher in thecity include:
• lack of vegetation, which inhibits cooling byevapotranspiration• tall buildings that provide many surfaces forreflecting and absorbing of sunlight, and inhibitcooling by blocking the wind at night

25
Many tree benefits are directly related to theamount of healthy leaf surface area (Kenney 2000)and the position relative to buildings or pavement.In the winter, trees can either increase or decreasebuilding energy use, depending on their locationaround the building. The proper placement of treesnear residential houses can improve benefits forcomfort and reduced energy usage. Deciduous treesplaced on the west, east or south face of a buildingprovide summer cooling but allow winter sun towarm the building. Evergreen coniferous treesgrown as a windbreak along the north can blockwinter winds and thus reduce heat loss andconsequently reduce energy use for home heating.
In addition, since many pollutants and ozone-forming chemicals depend on high temperatures toform, air quality is improved by reducing the airtemperature (Nowak 1995; Cappiella 2005;Pollution Probe 2002).
Threats to Trees by Invasive Alien SpeciesTrees in natural forest settings may live to be
hundreds of years of age; most urban trees have amuch shorter life. Tree mortality rates in northeastern North America have been estimated torange from 1.2 to 6% with 4% being more likelyfor urban trees due to environmental stresses,changes in hydrology in response to developmentand adequacy of long-term maintenance of the tree(Nowak 2010).
This means that with a mortality rate of 4% andno new trees to replace the ones that die, theaverage life span of tree is 25 years. Invasive alienspecies further threaten trees in London; theseinclude Gypsy moth, present since the 1870s andaffecting numerous host trees; Dutch Elm Disease,present since the 1910s and affecting species of elmtrees; Asian Long-horned Beetle, present in theToronto area since 2003 and affect about 40% oftree species present in London; and Emerald AshBorer, confirmed in London since 2006 andaffecting all species of ash trees (Figure 11).
Management options for these pests range fromdo nothing to prevention or treatment by pesticideapplication to pre-emptive tree removal. A Gypsymoth infestation in London in 2009 was effectivelymanaged by treatment with Bacillus thuringiensis(Bt).
© David Colvin 2006
Figure 11. Ash tree at Ross Park, London showingthe galleries created by Emerald Ash Borer larvae.When the galleries overlap the transport of waterand nutrients within the cambial layer is disrupted,thus leading to tree mortality.
© Bill DeYoung, 2012

26
© Bradwill Ecological Consulting
Figure 12. Manual extraction of buckthorn withaid of shovels and WeedWrench® at BerkshirePark, London, 2008.
In the classical predator prey populationdynamic, the intervening century of the presenceGypsy moth in eastern North America has broughtsome balance in its population and thus the extentof its effects. Today, dozens of predators andparasites (fungi, bacteria, viruses) now attackGypsy moth (Kock 2008); but, waiting a centuryfor some measure of a natural balance may not bethe appropriate decision for all pests.
Both the Asian Long-horned Beetle (ALB) andthe Emerald Ash Borer (EAB) have the potential tobring about catastrophic changes to trees inLondon. ALB has not been observed in London;however, Emerald Ash Borer was observed in 10 of14 locations sampled in 2009 by Canadian ForestService and the City of London Urban ForestryDivision. The City of London’s approved EmeraldAsh Borer Strategy includes both the selectiveremoval of certain ash trees and the treatment ofhealthy ash trees with the systemic bioinsecticideTreeAzin™. TreeAzin™ contains Azadirachtinthat inhibits EAB larval development thuspreventing adult emergence. It is approved for useto control EAB in Canada; is also approved by theOrganic Materials Review Institute (OMRI) for usein organic crops; and, is relatively safe forapplicators to handle. The effect of a singletreatment of TreeAzin™ persists for up to twoyears.
Some invasive alien plant species present inwoodlands in London that threaten ecologicalintegrity and ecosystem health include European(Common) and Glossy Buckthorn (Rhamnuscathartica, R. frangula), Norway Maple (Acerplatanoides), Sweet Cherry (Prunus avium),Tartarian Honeysuckle (Lonicera tatarica) andGarlic Mustard (Alliaria petiolata). These plantsvary in distribution and abundance and thus presentvarying degrees of importance for management.
European (Common) and Glossy Buckthorn haverelatively similar biological properties and mostlyoccur as small diameter stems that seldom reachthe size of a small stature tree. Both are invasivespecies that can dominate the understorey ofwoodlands, displace native species and suppressthe growth of new trees because of the relativelyhigh number of stems per square metre taking up
available soil moisture and nutrients; and due to adense leaf canopy that limits light to the forestfloor.
Buckthorn was deliberately planted over a periodof several decades beginning in the 1880s at theDominion of Agriculture Research Station on whatis now the campus of The University of WesternOntario. This made sense at the time because afast-growing windbreak was needed to combat thesoil erosion following the loss of woodlands in themid-19th Century. Now, it is understood thatbuckthorn is an invasive alien species that poses anecological threat to biodiversity, ecologicalintegrity and ecosystem health. Recent experimentsin more than twenty parks in London demonstratethat it is possible to manage most zones wherebuckthorn is present.

27
Project ScopeThis section provides some details about the
methods used in 2008; complete details aboutUFORE and UFORE methods are available at theUFORE web site “www.ufore.org” and at theNortheastern Research Station, Forest Servicesweb site “www.nrs.fs.fed.us/UFORE/Data”.
The City of London (42 681 ha) is divided intotwo areas by the Urban Growth Boundary (UGB)that sets the limit of urban growth to 2016(London 2006). The inner area (23 649 ha)comprises the existing urban and future urbangrowth areas and the outer area (18 649 ha)comprises agriculturally designated land that wasannexed to the City in 1993. This project uses theUGB to define the study limits as the urban areaof London (Figure 13).
FieldworkFieldwork was conducted between May 26 and
September 9 2008 (leaf-on season) to determinethe vegetation structure, functions and values ofthe urban tree resource in the urban area ofLondon (Nowak 2008).
Within this project, a tree is defined as anywoody plant with a dbh (diameter at breast heighttaken at 1.3 metres above the ground) of at least2.54 cm, regardless of species or final height. Thisdefinition allows for standardization of datacollection and removes biases with respect tospecies preferences.
For this assessment, randomly generated one-tenth acre (0.04 ha) circular field plots(radius = 11.33 m) were sampled and analyzedusing the protocol of the UFORE model. Thenumber of plots was set to provide a relativestandard error of +/- 10%, a reasonably high levelof accuracy that balances measurement costs andsample size (Nowak 2008). The location ofsampled plots is shown on Figure 13.
Methods
Fieldwork consisted of 10 steps:Step 1. A grid consisting of equal area cells was
placed across the map of the City of London(urban area and the rural area) using the sampleplot generator utility of the i-Tree Software(USDA 2008).
Step 2. For the urban area, 533 dots wererandomly located in the cells, at a density ofapproximately one dot for every 44 hectares.
Step 3. The eight UFORE Land Use Types(Appendix C) were applied to the urban areabased on a combination of Official Plan Land Useand Property Tax Assessment Codes. In areaswhere there was a discrepancy between the LandUse and the Property Tax Assessment (PTA) datafiles, City of London 2007 air photography wasvisually inspected to assign the most appropriateland use type.
Step 4. A count of the plots for each land usetype was used to ensure that there were sufficientplots in each land use type to provide statisticallyreliable estimates.
Step 5. A data layer was created containing therandomly generated plot centre points and fieldsfor tracking and recording all requiredinformation at each plot (Table 6).
Step 6. A circular plot polygon layer (11.33metre radius, 0.04 ha) was created from the centreof each randomized dot using the ArcMap (ESRI2005) computer program. A new data layer wascreated by intersection of the circular plots withthe parcels of the Property Tax Assessment datalayer. The parcels were reviewed to determinehow many property owners would have to becontacted for permission to access the plot. Someof the 533 randomly located plots crossed aproperty line and a total of 670 property ownerswere identified. Each property owner was sent anotification letter, a permission form and aprepaid return envelope. The notification letter

28
informed the property owner about the project,outlining the project scope and duration(Appendix D). The permission form was to obtainthe owner’s consent to permit UTRCA staff toaccess the property to conduct the UFORE fieldprotocol. Follow-up phone calls were made to thoseowners who had not responded to the mail-outs.UTRCA staff also visited owners who had notresponded; in many cases subsequently obtainedpermission to access the property for this project.Based on the number of refusals or non-response,additional random sample plot locations weregenerated to obtain the desired total and proportionof plots by land use type (Step 4, above).
Step 7. Where permission was granted, a total of383 plots out of 533 potential sample plots(71.9%) were measured during the leaf-on seasonwithin the urban area of the City of London. Mapsof the plots were prepared at a scale of 1 : 500labelled with Plot ID, street address andneighbourhood street names. The percent road andpercent building within the plot were estimatedusing GIS tools with the respective topographicdata layers (City of London 2007). Packagescontaining these maps, a larger scale map fornavigation, and copies of permission forms wereprovided to field crews.
N3000 0 3000 6000
Meters
#
# #
#
## #
# #
#
# #
# #
### # # # #
##
## #
#
## ##
# ##
#
# # ###
# #
# ## # # #
# #
#
## #
## #
#
##
##
#
# ## #
# ## # # #
##
#
##
# ### # #
## #
## #
# ##
##
#
##
# ## #
#
#
# # #
# # #
## #
##
##
##
# ## #
## # #
###
# ## #
# ##
# ##
##
##
##
###
## #
### #
# #
##
# # # ##
# # ### ## #
## # #
#
#
## # # # # #
#
## # ##
# # ##
# ##
#
####
#
##
##
# # #
##
##
#
#
# ## #
###
##
# ## ##
# ## #
# #
# # ##
# # ##
## #
# #
# # ##
##
## #
##
##
# # # #
#
##
# ## # #
#
# ## # # #
# ##
# ##
# #
# ##
# # ##
#
#
## #
# # #
# ###
##
#
#
## ##
# #
# ## #
#
#
##
##
# #
##
#
##
# #
#
##
##
##
#
##
#
#
# ##
#
#
#
#
##
#
# #
# # ##
##
##
# #
# # #
#
#
##
#
# #
Waterbody
Road
Airport Runway
Railway
# UFORE Plot Location
City of London
Urban Growth Boundary
Legend
Figure 13. Locations of random plots within Urban Growth Boundary of the City of London.
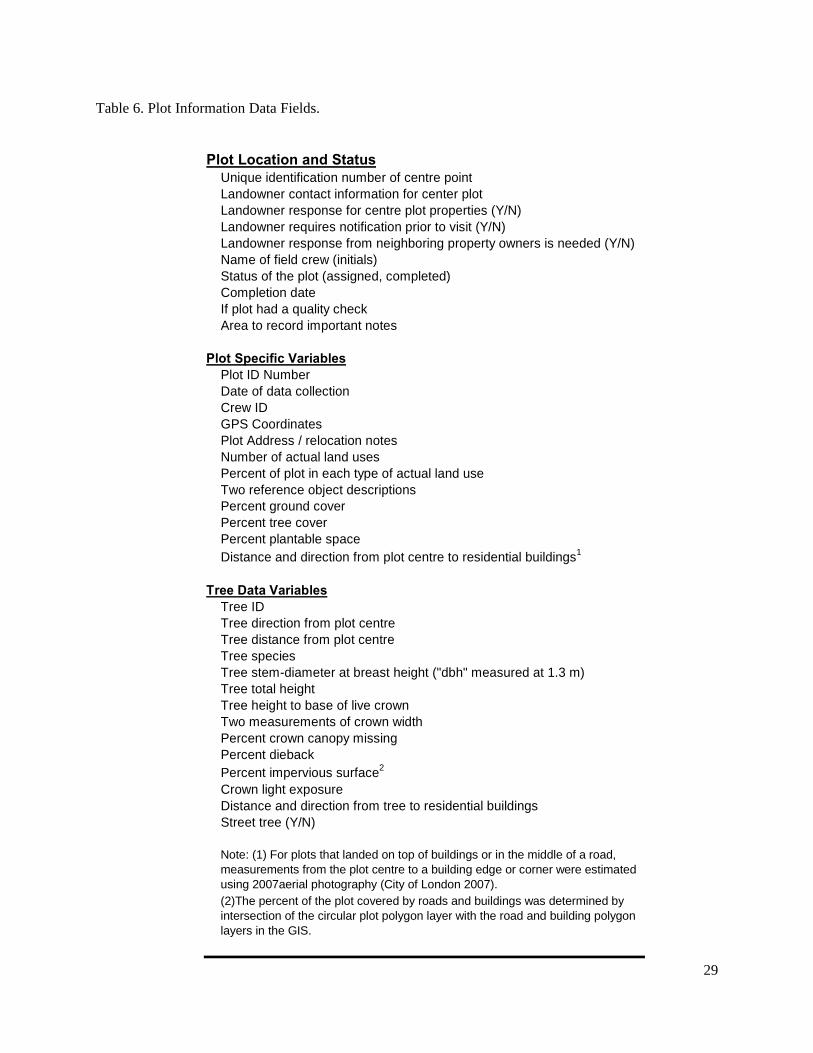
29
Unique identification number of centre pointLandowner contact information for center plotLandowner response for centre plot properties (Y/N)Landowner requires notification prior to visit (Y/N)Landowner response from neighboring property owners is needed (Y/N)Name of field crew (initials)Status of the plot (assigned, completed)Completion dateIf plot had a quality checkArea to record important notes
Plot ID NumberDate of data collectionCrew IDGPS CoordinatesPlot Address / relocation notesNumber of actual land usesPercent of plot in each type of actual land useTwo reference object descriptionsPercent ground coverPercent tree coverPercent plantable spaceDistance and direction from plot centre to residential buildings1
Tree IDTree direction from plot centreTree distance from plot centreTree speciesTree stem-diameter at breast height ("dbh" measured at 1.3 m)Tree total heightTree height to base of live crownTwo measurements of crown widthPercent crown canopy missingPercent diebackPercent impervious surface2
Crown light exposureDistance and direction from tree to residential buildingsStreet tree (Y/N)
Note: (1) For plots that landed on top of buildings or in the middle of a road,measurements from the plot centre to a building edge or corner were estimatedusing 2007aerial photography (City of London 2007).(2)The percent of the plot covered by roads and buildings was determined byintersection of the circular plot polygon layer with the road and building polygonlayers in the GIS.
Plot Location and Status
Plot Specific Variables
Tree Data Variables
Table 6. Plot Information Data Fields.

30
Step 8. Field data was collected by three crews oftwo during the leaf-on season (May 26 toSeptember 9 2008) and plots assigned bygeographic location: Crew 1- East / Southeast,Crew 2 - North and Crew 3 - West / Southwest.Data were recorded to a Personal Data Assistantdevice (PDA) equipped with GeographicalPositioning Satellite technology (GPS) to assist inaccurate location of plot centres. Detailed groundparameters were measured according to theUFORE field data collection manual (Nowak2005, Schaefer 2007) within each circular plot(Table 6).
Step 9. Quality control procedures includedrepeat visits to approximately 5% of the plots toensure that the field data were collectedaccurately. All plots were checked against thedigital records for correct referencing of plotcentres, tree locations, tree attributes, sitecharacteristics, ground cover and land use type.
Step 10. The plot data were downloaded from thePDA to the UFORE software. Each plot waschecked to ensure download and plot informationwere complete. Paper copies of the plots were putinto binders, along with original permission slipsfor future reference. The digital records are storedas part of the corporate data sets of the City ofLondon, Geomatics Division.
Measures from UFORE ModelThe field data was submitted to the Northeastern
Research Station of the US Forest Services foranalysis to obtain information on structure,function and values of the urban forest and theseare detailed below. Other analysis includedmodelling urban forest growth to sustain leafcover or consequences in response to pests ordisease. Tree species recommendations wereobtained with the use of i-Tree software andexpert opinion.
Urban Forest StructureField data measurements of tree attributes:
species, dbh, height, health condition, position,canopy closure and crown width were analyzed todescribe the current urban forest structure. Theurban forest was characterized for the number oftrees, composition (species, percent native), treehealth, tree stature and distribution. Ground coverwas estimated to the nearest 5% and was classifiedas: bare soil, duff or mulch (loose organic material,leaf litter), herbaceous, water (including pools),impervious (sidewalks, driveways, roads),buildings or agricultural crops. Plantable spacewas estimated as the percent of the plot area that issuitable for tree planting based on land use, sitesuitability for soils and lack of constraints.
Leaf area is the total surface area of all leaves ofa tree. Leaf area of individual trees was calculatedusing regression equations and scaled to estimatesof crown volume (Nowak 1996, USDA 2008).
Leaf biomass was calculated by converting leafarea estimates using species specific measurementsof leaf dry weight per square metre of leaf area(Nowak 1991, USDA 2008).
Leaf cover is an estimate of the ground surfacethat is covered by leaves when viewed from above(Figure 14). It is independent of tree species anddoes not distinguish individual trees from treeclusters.
Figure 14. Leaf cover is a two-dimensionalrepresentation of the ground surface covered bythe tree canopywhen viewed from above.

31
Leaf Cover Estimates by Colour InfraredAerial Photography
The City partnered with the University ofWestern Ontario and the Ministry of NaturalResources, Science and Information Branch toestimate leaf cover using summer aerial colourinfrared imagery flown in June 2008 specificallyfor this purpose (Figure 15). Computer assistedinterpretation of the high definition colourinfrared aerial photography was used to obtain anestimate of leaf cover. A team in the Departmentof Geography, University of Western Ontario,carried out image classification, accuracyassessment and generation of a new digital leafcover layer.
The infrared image for the urban area of Londonwas digitized to 30 cm pixels (raster data) andimage classification software was used to groupsimilar pixels into image objects (vector data) thatwere then classified according to their spectral,textural and contextual characteristics. The imagedata was processed through seven steps thatresulted in a new binary vector layer of Treed orNot Treed (Lehrbass 2010). This method canprovide statistics of leaf cover with an accuracy of+/- 10% quickly and at a relatively low labour cost.Based on current technology the resulting mappingis suitable at scales of the region, district orneighbourhood, but not at the block or backyardlevel.
Accuracy AssessmentAlthough the level of accuracy of the estimates of
leaf cover at +/- 10% is sufficient for mappingpurposes, a higher level of +/-1% was desired toprovide the best achievable estimate of leaf coverusing this classification of the infrared image. Apanel of three analysts inspected the imageindependently, to validate the outcome of the newdata layer. A total of 29 572 randomly selectedpoints were inspected for “tree”, which wasdefined as any vegetation tall enough to cast ashadow. Differences of opinion were settled by a2:1 vote (Lehrbass 2010). This method and thenumber of points sampled provide a 99% level ofconfidence for this estimate of leaf cover.
Urban Forest FunctionsThe STRATUM module uses the estimates of the
population of trees to generate first-orderapproximations of the benefits and costs of theurban forest. These approximations come with anaccepted degree of uncertainty and are notdefinitive on a tree-by-tree basis; nonetheless,they provide a platform on which decisions canbe made. Methods used to quantify and pricethese benefits are described in the published seriesof Tree Guides that correspond to the STRATUMClimate Regions and are available at“www.fs.fed.us/psw/programs/cufr/”. Each benefitis quantified in terms of resource units and a dollarvalue is assigned to the resource units.
Crown width data provides the proxy of crownvolume from which to determine leaf area estimatesfor each tree species. Leaf area and urban foreststructure data were applied to local andstandardized data sets in the UFORE model tocalculate tree benefits of air pollution removal,tonnes of carbon storage and carbon sequestration,and energy use reduction.
Figure 15. Colour infrared image of a section ofLondon, June 2008.

32
Air pollutionA hybrid of leaf phenology (size, shape,
thickness) and leaf area model in a multi-layercanopy deposition model was employed to reportthe relative effects of tree species on (a) emissionsreleased by trees to the atmosphere: net ozone (O
3),
carbon monoxide (CO) formation, hourly volatileorganic compound (VOC); and, (b) the metrictonnes of particulate matter (PM
2.5, PM
10)
deposited on tree surfaces, greenhouse gas, sulphurdioxides (SO
x) and nitrogen oxides (NO
x) removed
throughout the year plus the reduced emissions(measured in kg per tree per year) from powerplants (NO
2, PM
10, VOCs, SO
2) due to reduced
energy use (Bidwell 1972; Lovett 1994; Zinke1967).
The model accounts for seasonal variation indeciduous trees (leaf-on and leaf-off periods) andpotential negative effects of trees on air qualitydue to VOC emissions. Local data for hourly airpollution, meteorological data were provided asinput to the model (OMOE 2007; EnvironmentCanada 2008). The contribution of the urbanforest to air quality is expressed as a percentimprovement over the most recently available localdata.
Carbon StorageTree biomass and leaf biomass were calculated
using measured tree data as input to species-specific allometric equations from publishedliterature for each species or the average of agenus or tree type if the species data was notavailable (Nowak 2000). Open grown urban treestend to have less biomass than predicted by forest-derived biomass equations; therefore, the biomasswas adjusted by a factor of 0.8 (Nowak 1994). Thebenefit of trees to atmospheric carbon dioxide isdetermined as the sum of decreased atmosphericCO
2 due to sequestration by trees and reduced
emissions from power plants due to reduced energyuse.
Carbon SequestrationTo estimate the gross amount of carbon removed
from the atmosphere annually, the average diametergrowth was obtained from appropriate tree speciesmatched for diameter class and tree condition; the
annual average growth was added to the existingtree diameter to estimate tree diameter and carbonstorage in subsequent years (Nowak 2010). Themodel accounts for CO
2 released as trees die and
decompose as well as during the care andmaintenance of trees.
Energy UseThe seasonal effects of trees on residential
building energy use was estimated by an energymodel in UFORE that is based on fieldmeasurements of tree distance, tree height, treecondition and direction of trees from residentialstructures (McPherson and Simpson 1999). Thetotal energy benefit is the sum of electricity savedfor air conditioning in summer (measured in kWhper tree per year) and energy saved for heatingrequirement due to reduced natural gas use inwinter (measured in MBTU per tree per year).
Urban Forest ValueThe software module STRATUM of UFORE
processes the structural measures and the treefunctions of tonnes of pollutants removed, tonnesof carbon stored and energy use equivalents todetermine the economic value expressed inCanadian dollar value based on particular treespecies attributes of dbh, canopy cover andhealth. The economic values calculated are (a) theecosystem goods of carbon storage and thereplacement value of the trees in the urban forestand (b) the ecosystem services of air pollutionreduction, net carbon sequestration and energyuse reduction (Nowak 2010).
Compensatory ValueThe compensatory or replacement value of a tree
follows procedures prescribed by the Council ofTree and Landscape Appraisers (CTLA 1992)using values from the International Society ofArboriculture of Ontario (2003) and Nowak(2002). Briefly, the equations incorporate thereplacement cost of a similar or most suitable treeat the largest transplantable size, the local averagecost per unit trunk area, the tree condition, thetrunk area of the existing tree and a location factorbased on land use type (e.g. deciduous tree on thesouth-west or south-east face of a residentialbuilding).

33
Air Contaminant Removal ValueThe monetary value of pollutant removal by trees
was estimated as the median externality values foreach pollutant (measured in dollars per metric ton)removed throughout the year and reducedemissions (measured in kg per tree per year) frompower plants (NO
2, PM
10, VOCs, SO
2). Because
research has not yet shown that trees affect PM2.5
levels, the UFORE model calculates the benefit foronly PM
10. Externality values attempt to account
for the costs to society caused by the pollutant suchas negative effects on human health or materialsdamage. The monetary values used, shown here as$US per metric ton, were: ozone ($6 752), carbonmonoxide ($959), particulate matter (PM10) ($4508), sulphur dioxides ($1 653), and nitrogenoxides ($6 752) (USDA 2008).
Carbon Storage ValueThe value of total stored carbon is calculated by
multiplying the tree dry-weight biomass by theestimated marginal social costs of carbon dioxideemissions; where tree dry-weight equals the wholelive-tree biomass multiplied by 0.5, since treetissue is about 50% carbon (Nowak 1994); themarginal social costs were estimated at $20.3 USper tonne of carbon (Nowak 2010).
Carbon Sequestration ValueThe value of the amount of carbon sequestered
annually by the urban forest is estimated as theequivalent dollar amount to filter carbon dioxide
from the atmosphere by technological means with acost of $22.8 per tonne of carbon (Farquhar 1994;USDA 2008).
Energy Use Reduction ValueThe energy costs were based on published
electricity costs $0.056 or 0.059 per kWh forsummer and winter, respectively (London Hydro2009); and the costs of natural gas $8.67 perMBTU (OEB 2000, NRCAN 2008).
Modelling Urban Forest GrowthThe three principal factors of predicted mortality,
predicted growth rates and predicted naturalregeneration are used to project the number ofreplacement trees required to sustain current livetree population. UFORE software modules can beused to calculate the proportions of leaf area, leafbiomass, tree biomass, live tree population andcompensatory value using field data of speciespresent per land use type, dbh, tree condition classand species-specific growth rates. Future leaf covercan be modelled once a reliable estimate of treemortality is obtained in order to provide estimatesof planting requirements to sustain the existingresource.
The annual mortality rate establishes the numberof trees that need to be planted or naturallyregenerated in order to sustain the current livingtree population. The average mortality rate of thelive tree population of woodlands or urban forestsin the Northeastern United States ranges between1.2% and 6% (McWilliams 1997; Nowak 2004;Elliot 2009). The high range accounts foradditional mortality due to human activities suchas mechanical damage from development,mowing, personal preferences, perceived risk,and environmental stress. Mortality rates can varysignificantly between locations (e.g. boulevardtrees, backyard trees, and woodlands), speciesbiology, insect and disease occurrence, andsusceptibility.
Average tree mortality and removal rates inLondon are not known at this time. Without arealistic estimate of mortality rates, it is difficult toestimate the effort and cost to meet future targetsand to maintain current leaf cover goals. Anaverage mortality rate can be estimated for the City
McPherson 2009

34
by re-sampling the plots from this study. This willbe a reliable and inexpensive estimate because thesame population of trees and plot locations can beused. As mortality rates can vary from year to yeardue to environmental and development impacts, aperiodically scheduled UFORE analysis is requiredto identify the changes in the forest structure overtime. The periodic re-inventory of the City’s treeinventory is critical for determining mortality rates,developing leaf cover goals, managing insects anddiseases, and conducting planting and maintenanceoperations to minimize mortality rates.
Annual increments of the average tree diametergrowth rate of were used:(dbh(y + n) = dbh(y) + n * 0.5 cm dbh per year).Natural regeneration, based on London UFOREplot data, was set at 71% natural regeneration fornatural areas and zero for other land use types.The required number of new trees to be plantedper year is equal to the annual mortality minus thepredicted natural regeneration.
To model the effects of diseases or insects on leafcover, the mortality was set to 100% of each hostspecies: maple trees (Acer sp.) for Asian long-horned beetle (Anoplophora glabripennis) (ALB),many tree species (maple, elm, poplar, willow,birch, alder) for Gypsy moth (Lymantria dispar)(GM), elm trees (Ulmus sp.) for Dutch elm disease(Ophiostoma ulmi) (DED) and ash species(Fraxinus sp.) for Emerald ash borer (Agrilusplanipennis) (EAB), calculated without ashregeneration.
Recommendations for Tree Species SelectionAll trees have value in an urban setting; but,
selecting species that can achieve optimal benefitsof air pollution removal, air temperaturereduction, carbon storage and building energyconservation will provide the best investment inthe urban forest. The i-Tree software relies onattributes of trees for size (> 7.2 m), long life (> 50years) and disease resistance to generate a list ofnative species suitable for London. The softwarescreening selected from a list of 1 585 tree speciesbased on local hardiness zone and importanceweights assigned by the Urban Forester. The CityEcologist and the Urban Forester reviewed theshort list derived from i-Tree. Criteria applied inthe short-listing include knowledge of localconditions for insect or disease problems,maintenance requirements, and adaptation to localconditions of climate and soil plus relativehardiness.
Emerald Ash Borer

35
RESULTS and DISCUSSION
Field DataField data was collected for 383 plots within the
urban growth area and the data is on file in paperand electronic formats at Urban Forestry, City ofLondon and will be stored for use in subsequentUFORE analyses or re-visits of the permanentplots identified for the 2008 data collection.
The number, distribution of plots and area ofplots by land use type shows that each land usetype had approximately the same coverageestablishing that the desired stratified randomsampling was achieved (Table 6 and Figure 11 inMethods, above). Of the 383 plots that weresampled, 123 (32%) were wholly or partiallyowned by either the City of London or the UpperThames River Conservation Authority. Themajority of these publicly owned plots occurred inthe natural area / open space land use type (37%),followed by low density residential (34%).
Most of the woodlands inside the urban area areeither owned by the City or are within CommunityPlanning Areas; these may be acquired by the Citythrough standard development processes(Macpherson 2009).
Urban Forest StructureThis section provides information about the
structure of the urban forest in the urban area andanalyzes it by land use type. The structure of theurban forest is a measure of the followingattributes:
• species• density of tree stems• species distribution• tree stature (height, dbh)• tree health• leaf area• percent of surface that is pervious• amount of plantable space• leaf cover
Tree SpeciesA complete list of species observed by land use
type is presented in Appendix E; plant namesfollow the Ontario Plant List (Newmaster 1998).The London UFORE field data identified 121unique species of trees in London of which three offive are native species. Sixty percent of the treepopulation is represented by the top twenty speciesby percent of the tree population (Figure 16); thetwo lowermost bars show buckthorn at 19.5% andall other trees account for 21.5%. Maple and ashspecies account for 14.6% and 10.8%, respectively,of all trees in the study area.
Urban forests contain a mix of native and non-native tree species that either existed prior to the
Areaof Land Use
PlotsIdentified
Random PlotsSampled
Area of RandomPlots Sampled
Area of Land UseSampled
Land Use Type1 ha n n ha x 0.04 2 %
Agriculture 1,631 61 27 1.08 0.066
Commercial 1,693 37 36 1.44 0.085Industrial 3,144 65 53 2.12 0.067
Institutional 712 24 14 0.56 0.079Low Density Residential 9,615 197 139 5.56 0.058
Med/High Density Residential 2,697 58 42 1.68 0.062Natural Area / Open Space 4,099 88 72 2.88 0.070
TOTAL 23,591 530 383 15.3 0.065
Note: (1) Land Use Types are described in Appendix D, (2) circular field plots = 0.04 ha (radius = 11.33 m).
Table 6. Number and area of plots sampled by land use type.

36
Species Native
Land Use Type n % n% of
population per ha
Agriculture 16 75 19,409 0.4 11.9Commercial 21 81 119,693 3 70.7
Industrial 14 50 155,350 4 49.4Institutional 9 78 1,255 0.03 1.8
Low Density Residential 98 52 1,512,695 35 157.3Medium/High Density Residential 38 55 298,348 7 110.6
Natural Area / Open Space 71 79 2,269,009 52 553.64,375,759 100
Trees
Table 7. Species observed by land use type and estimates of the tree population and density perhectare.
development of the city, were planted by residents,or were introduced by transportation corridors orother means. Thus, cities often have a tree diversitythat is higher than the surrounding naturallandscapes.
The species mix of trees in the urban forest is asimportant as the number of trees. Biodiversity is amatter of Provincial interest (Ontario BiodiversityStrategy 2004) and international convention(Convention on Biodiversity 1992). Native speciesabundance is a robust indicator of ecosystem healthand of a sustainable environment. An increase in
the number of tree species can minimize theoverall impact or destruction by a species-specificinsect or disease. However, an increase in thenumber of non-native species such as Tree ofHeaven, Buckthorn or Norway Maple in naturalareas threaten biodiversity and ecosystem healthwhen they out compete and displace nativespecies.
Number and Density of TreesThe estimated number of trees in the study area
is 4 376 000 ± 10.9%, based on field plot data(Table 7). The overall tree density within the UGB
Figure 16. Percent of tree population for the top 20 tree species by percent of the total tree population.Non-native speccies are indicated by “**”.

37
is approximately 185 trees per hectare or about 12trees per person. The number of trees, the numberor percent of trees per hectare and the relativeproportion of the tree population by land use typeis presented in Table 7 and Figure 17.
Tree density in the natural area / open space landuse type exceeds 550 trees per hectare. Together,the low density residential and the natural area /open space land use types account for more than85% of trees. These data illustrate that the numberand density of trees in the built environment isstrongly influenced by land use from a low of 2 inthe institutional to 157 in the low densityresidential area.
Distribution of SpeciesThe distribution of trees by land use type is
shown in Figure 18 for the top ten species bypercent of the tree population. Two non-nativeplants, buckthorn and Norway Maple are in the topten. Table 7 reveals that natural area / open spaceland use type has the highest number of trees and
that the ratio of native trees to the tree populationis about four out of five trees. The highestdiversity (98 species) was found in low densityresidential, followed by natural area / open space(71 species) and then by medium / high densityresidential land use types (38 species). For theindustrial, low density and medium / high densityresidential land use types the proportion of nativeto non-native species is about one to one.
Nearly twenty-five percent of cedar trees werefound in the commercial and industrial land usetypes. Sugar Maple was found in five of sevenland use types and is most prevalent in thecommercial land use type and a nearly equaloccurrence in the agricultural and natural area /open space land use types. Buckthorn is the mostprevalent non-native species occurring in five ofseven land use types and was recorded as the mostprevalent in the medium / high density residentialand natural area / open space land use types.
Percent of Tree Population Trees per Hectare
Figure 17. Percent of tree population and density of trees (number of living and dead trees per hectare) byland use type.
0
10
20
30
40
50
60
Agriculture Commercial Industrial Institutional Low DensityResidential
Med/HighDensity
Residential
Natural Area /Open Space
0
100
200
300
400
500
600Percent of Tree Population
Trees per Hectare

38
Tree Size DistributionHeights of trees sampled range from 1.8 to 42 m
with an average of 7.63 and a median of 6 m. Theaverage diameter at breast height (dbh) is 11.99and the median is 6.8 (range 2.5 to 142 cm). Thedistribution by size class (Strobl 2000) of the treessampled is shown in Figures 19, 20 and 21.
Figure 19 illustrates that about two-thirds(65.8%) of the trees sampled have a diameter lessthan 10 cm. Large diameter trees (> 61 cm dbh)represent less than 3% of all trees. This
distribution is more a function of the tree speciesfound in London, rather than the age of the urbantrees. London’s urban forest has an abundance oflow stature trees, but not necessarily young asmight be expected from just looking at thediameter distribution in isolation of other factors.An ideal distribution would have a higherpercentage of trees in the smaller dbh size classesand a near equal number of trees per classsize > 25 cm dbh so that as the larger trees die orare removed there are sufficient smaller treesgrowing into the larger class sizes to maintainoptimal benefits and optimal management of theurban forest in a continuing cycle.
Figure 20 shows the diameter distribution for thetop 25 tree species by prevalence in the treepopulation. Two species, Silver Maple and EasternCottonwood, have more than 10% of theirpopulation in the largest diameter class. SilverMaple has the highest proportion of large treeswith 28.1% of its population greater than 61 cmdbh.
Only six other species (Sugar Maple, Box Elder,American Elm, Hackberry, White Ash, and somewillows) have individuals with stem diameters thatexceed 61 cm.
Three of the ten most common tree species(buckthorn, Eastern White Cedar and Hawthorn),
0
10
20
30
40
50
60
70
less than 10 10 to 24 25 to 36 37 to 48 49 to 60 greater than 61
Percent of stems
Figure 19. Diameter distribution (dbh) for trees inthe urban area. Class sizes follow Strobl 2000.
Figure 18. Distribution of the top 10 tree species by land use type.Non-native trees are indicated by “**”.
Percent of TreePopulation

39
Figu
re 2
0. D
iam
eter
dis
trib
utio
n of
the
top
25 tr
ee s
peci
es.
Per
cent
of
tree
sin
siz
e cl
ass.

40
Figure 22. Percent of trees in diameter classes by land use type.
010203040506070
Agricultural Commercial Industrial Low DensityResidential
Medium / HighDensity
Residential
Natural Area /Open Space
cm dbh
2 to 7.6 7.7 to 15.2 15.3 to 22.9 23 to 30.5
30.6 to 38.1 38.2 to 45.7 45.8 to 53.3 53.4 to 61
Percent of trees in size class
Figure 21. Diameter distribution of maple species.
0
10
20
30
40
50
60
70
80
90
100
Sugar Maple Box Elder Norway Maple**
Hybrid SoftMaple
Red Maple Silver Maple Black Maple Amur Maple **
< 10 10 to 24 25 to 36
37 to 48 49 to 60 > 61
Percent of trees in size class

41
which account for 38.5% of all the trees, cannotbiologically attain the larger diameter and heightclasses associated with large shade species such asmaples. The size class distribution of eight maplespecies is represented in Figure 21. Norway Mapleis one of the most abundant trees because it hasbeen extensively planted for more than 100 yearsbut has more trees in the smaller diameter classeswith none in the largest class since it is a mediumstature tree. Silver Maple has a higher proportionin the larger diameter classes. Managementimplications of too many old and too few youngSilver Maple trees include the need to manage theolder trees, to plant more young trees and, whereappropriate, to encourage natural regeneration.
Distribution of size class by land use type(Figure 22) shows an almost equal distribution ofsmall dbh class size in each land use type (> 45%).All land use types show low proportions (< 5%) oflarger dbh class sizes (> 53 cm).
Tree HealthTree condition was assessed in the field based on
the percentage of live and dead branches in thecanopy for each tree and extrapolated across theentire tree population. The average condition fortrees across all land use type was rated as good orexcellent for 81.1%, fair or poor for 10.4% and asdying or dead for 8.5%.
The condition of trees in London varies withland use type (Figure 23). At the positive end oftree health, trees in six of seven land use typeshave an appropriate distribution of health status.Only sixty percent of the trees in the agriculturalland use type were rated as good or excellentwhile 18.8% were rated as dying or dead.
Maintaining tree health is important formaximizing biological and environmentalpotential. As trees decline in health they becomemore susceptible to insects, diseases, wind throwand weakened branches that can be hazardous tothe public.
Natural area / open space and the agriculturalland uses have the highest number of dead or dyingtrees. Trees in these natural land use types contain
Figure 23. Tree condition by land use type.
-
10
20
30
40
50
60
70
80
90
100
Agricultural Commercial Industrial Institutional Low DensityResidential
Medium / HighDensity
Residential
Natural Area /Open Space
Excellent Good Fair Poor Dying Dead

42
Table 8. Types of ground cover by land use type.
Land Use Type Water Building Impervious1
Bare Soil
Duff / Mulch2 Herbaceous3 subtotalAgriculture < 1 0.2 2.7 22.1 75.1 100
Commercial < 1 24.9 40.3 13.3 21.3 100Industrial 1.7 12.2 31.0 13.0 42.1 100
Institutional < 1 13.5 34.5 0.5 51.6 100Low Density Residential 1.2 18.6 22.5 9.8 47.8 100
Med / High Density Residential < 1 10.3 32.6 10.9 46.2 100Natural Area / Open Space 6.4 4.2 7.0 15.2 67.1 100
Average for London 3.1 12.0 24.4 12.1 50.2 100
Note: (1) sidewalks, driveways, roads; (2) exposed surface, leaf litter; (3) crops, lawn, fields.
0% 10% 20% 30% 40% 50% 60% 70% 80% 90% 100%
Natural Area / Open Space
Med / High Density Residential
Low Density Residential
Institutional
Industrial
Commercial
Agriculture
Average for London
Water Building Impervious Bare SoilDuff / Mulch
Herbaceous
Figure 24. Ground cover by land use type. The average for London is shown as the top-most bar.
PerviousnessIn the City of London, impervious surfaces and
buildings cover approximately 36% of the area.Commercial land uses have the highest amount ofimpervious ground cover at 65%. Low densityresidential and medium / high residential land useseach have about equal amounts of total impervioussurfaces or herbaceous ground cover types.
Minimizing impervious surface cover is part ofsmart growth principles for sustainablecommunities. In addition to improving urban airtemperatures, water quality and water quantitymanagement, generally, decreases in imperviouscover will facilitate delivery of water to tree roots,specifically.
a higher percentage of ‘poor’ or ‘dead’ treesbecause of natural competition and lack ofmaintenance. These trees are critical componentsof healthy woodlands as they add nutrients to thesoil when they fall down (collectively calleddowned woody debris) or as a food source andhabitat if left standing (dead standing tree is calleda snag). Tree condition is better in residential andinstitutional lands where the risk associated withpersonal injury or property damage from fallinglimbs is managed and the trees may be watered orfertilized.
GroundcoverEstimates of groundcover by land use are
presented in Table 8 and Figure 24. More than halfof the ground cover is classed as herbaceous (crop,field, lawn). Buildings occupy 14% of all non-agricultural land. About one fourth of the totalurban area is classed as impervious surfaces(sidewalk, driveway, road) but that rises to aboutone-third for the land use types of the built-upareas.

43
0%
5%
10%
15%
20%
25%
30%
35%
40%
45%
Agricultural Commercial Industrial Institutional Low DensityResidential
Medium / HighDensity
Residential
Natural Area /Open Space
Area of UGB (%)
Potential Plantable Space (%)
Figure 25. Potential plantable space as a percent of each land use type.
The City of London contains approximately 2400 ha of public park and open space lands, ofwhich, almost 1 400 ha is considered to be“natural” or woodland. The remaining 1 000 hahas been part of the City’s parkland system formany years and is used mainly for activerecreation activities in neighbourhood parks,district parks, sports fields and parks along theThames River corridor. Since 1994, 12% of theactive parkland along the Thames River has beenplanted with trees and the lands naturalized.Planting of these areas has added approximately18 000 trees to London’s urban forest.
Plantable SpacePotential plantable space is a field estimation of
the percent of the plot area that can accommodatetree planting and for the study area was estimatedto be 19%. The study area is approximately 23 649ha; thus, there is approximately 4 493 ha that isdispersed across the City that is estimated to becapable of growing more trees. However, this is anoverestimate as not all plantable space can beregarded as suitable for trees either operationallyor for optimal space allocation reasons. Thisdispersed plantable space will require evaluationto determine site suitability. Figure 25 shows thearea of potential plantable space as a percent ofthe total area of the given land use type. When thetotal area of each land use type is taken intoconsideration, the natural area / open space has themost area available for additional tree planting,followed by medium / high density residential andinstitutional land use types.

44
benefits inferred from the ratio of percent of totalleaf area to percent of tree population are: SilverMaple, Black Walnut, Norway Spruce, Hackberryand Eastern Cottonwood.
The majority of Silver Maple in London have adbh greater than 76 cm and have large crownvolumes with a great number of leaves. Their totalleaf area of 6.2% when expressed relative to thepercent of the tree population (0.9%) shows seventimes greater contribution to forest function than asmaller stature tree such as Crabapple (0.56% ofthe population and 1.2% of the leaf area). Theseratios of leaf area to population are 6.9 and 1,respectively; thus, we could say that Silver Mapletree delivers seven times the ecosystem benefits ofa Crabapple tree. See photo opposite to seerelative canopy areas of a young tree (leftforeground) contrasted against a mature SilverMaple tree.
Figure 26. Comparison of percent of leaf area to percent of tree population for trees that provide > 1%total leaf area and represent > 0.5 % of the tree population. Non-native trees are indicated by “**”.
0
5
10
15
20
25
30
No
rway
Map
le**
Sugar
Map
le
Buck
thorn
**
Bla
ckW
alnut
Silve
rM
aple
Bo
xE
lder
White
Ash
Eas
tern
White
Ced
ar
Eas
tern
Cottonw
ood
Hac
kber
ry
Norw
ayS
pru
ce**
Sib
eria
nE
lm**
Bla
ckC
her
ry
Gre
enA
sh
Hyb
rid
Soft
Map
le
Red
Map
le
White
Spru
ce
Blu
eS
pru
ce**
Hop
Ho
rnbea
m
Sco
tch
Pin
e**
Percent of Total Leaf AreaPercent of Tree Population
Leaf AreaThe relationships between species dbh and
crown width is utilized in the UFORE model tocalculate the ecosystem services of air pollution,carbon sequestration, carbon storage and energysavings. Tree species differ in the amount of leafarea and the UFORE model uses species-specificestimates of crown volume to generate estimatesof leaf area (Nowak 2000).
The ratio of the percent of leaf area for speciesthat provide more than 1% of total leaf area andthat represent more than 0.5% of the treepopulation is shown in Figure 22. The top fivespecies by total leaf area are: Norway Maple,Sugar Maple, buckthorn, Black Walnut and SilverMaple.
Expressing a ratio of the percent of leaf area tothe percent of the tree population allowscomparisons between species for their contributionto the functions and processes of the urban forest.The top five species by contribution to ecosystem
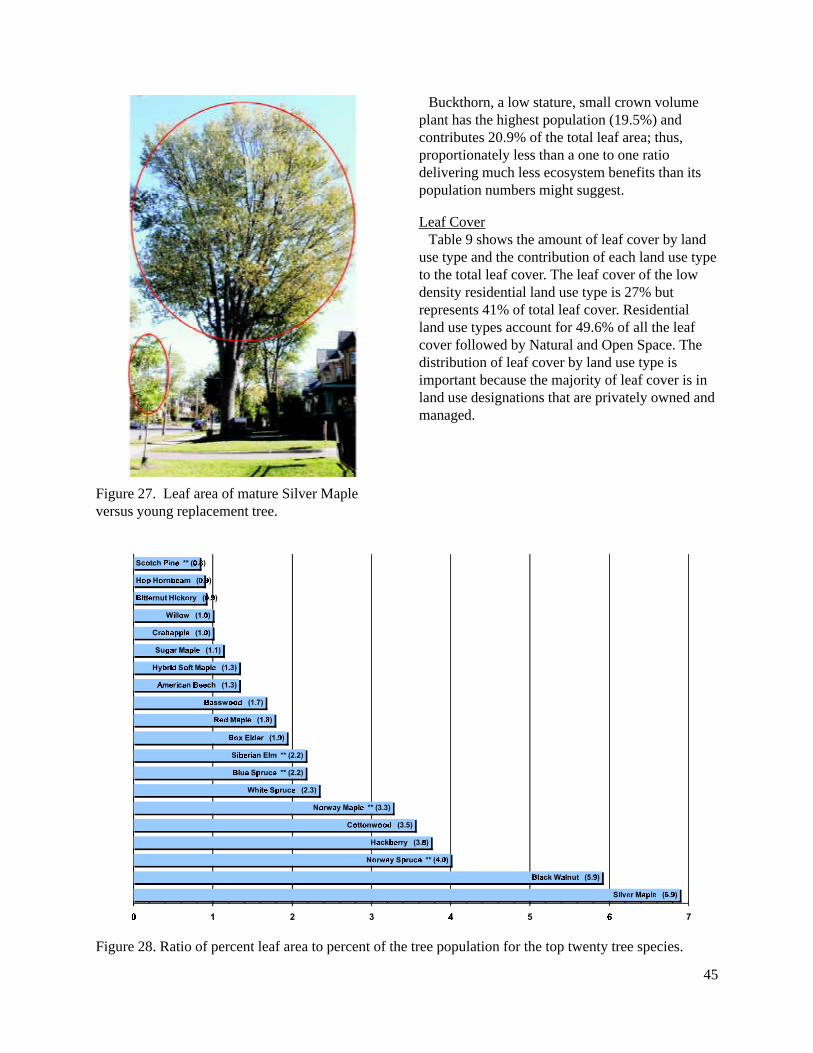
45
Figure 28. Ratio of percent leaf area to percent of the tree population for the top twenty tree species.
Figure 27. Leaf area of mature Silver Mapleversus young replacement tree.
Buckthorn, a low stature, small crown volumeplant has the highest population (19.5%) andcontributes 20.9% of the total leaf area; thus,proportionately less than a one to one ratiodelivering much less ecosystem benefits than itspopulation numbers might suggest.
Leaf CoverTable 9 shows the amount of leaf cover by land
use type and the contribution of each land use typeto the total leaf cover. The leaf cover of the lowdensity residential land use type is 27% butrepresents 41% of total leaf cover. Residentialland use types account for 49.6% of all the leafcover followed by Natural and Open Space. Thedistribution of leaf cover by land use type isimportant because the majority of leaf cover is inland use designations that are privately owned andmanaged.
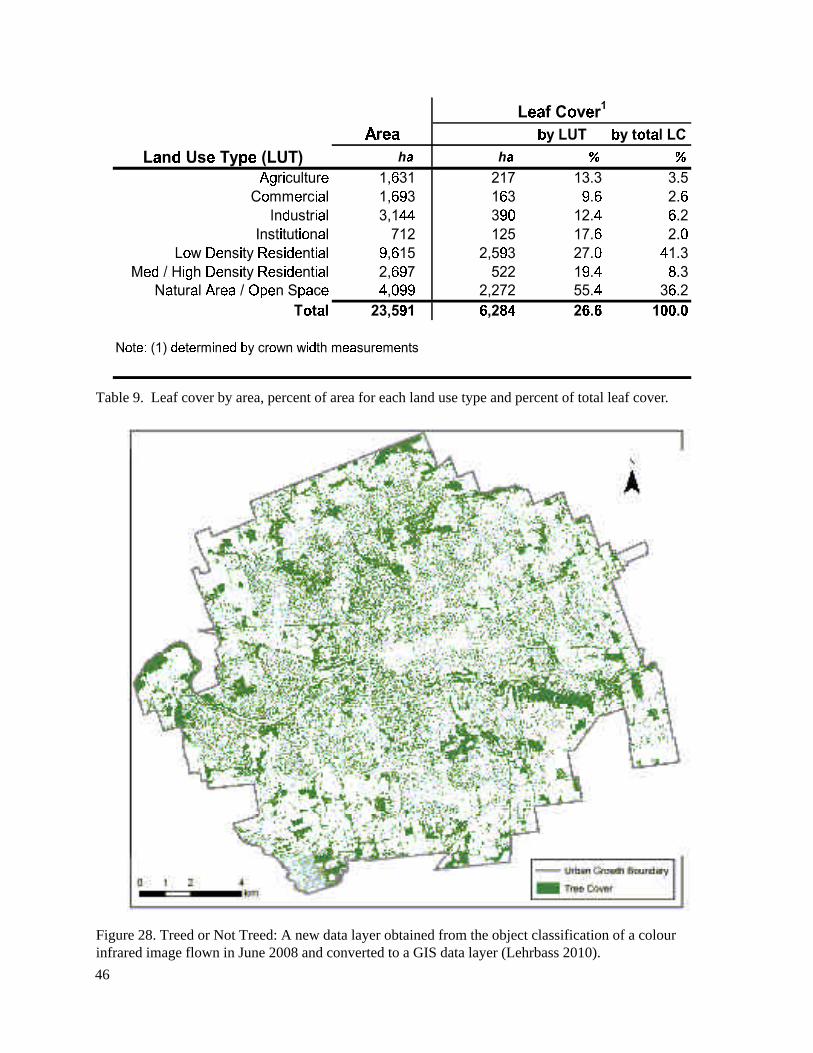
46
Table 9. Leaf cover by area, percent of area for each land use type and percent of total leaf cover.
Figure 28. Treed or Not Treed: A new data layer obtained from the object classification of a colourinfrared image flown in June 2008 and converted to a GIS data layer (Lehrbass 2010).

47
London’s leaf cover is shown in Figure 26. Theleaf cover data can be mapped in many ways suchas by subwatershed, electoral ward, planningdistrict (Figure 29), community plan orneighbourhoods. Appendix F shows leaf covermapped by ward and by subwatershed. Portions ofsome of these mapping units lie outside the urbangrowth boundary and consequently any statisticsderived must be viewed with caution since the leafcover data is for only within the urban growtharea.
Leaf Cover by Image InterpretationLondon’s leaf cover was estimated based on a
binary vector layer of “Treed” or “Not Treed”(Figure 28) derived from object classification ofthe processed colour infrared (CIR) aerial imageflown in June 2008. The leaf cover was verified byvisually spot sampling colour (RGB) aerialimagery at 29 572 random points to provide anestimate of 24.7% ± 1% (23.7-25.7%) with aconfidence level of 99% (Lehrbass 2010). Thisestimation provides the highest level of precisionfor the leaf cover estimate of any method used forLondon, to date.
Figure 29. Treed data layer expressed as percent leaf cover by Planning District.

48
Total Structural ValueAs a physical asset, the grand total for the
structural value of London’s urban forest adds upto an impressive 1.5 billion dollars. Figure 27illustrates that Silver Maple, Norway Maple,Eastern White Cedar and Sugar Maple rankhighest in their contribution to total structuralvalue but not in direct correspondence to theirshare of the tree population. Silver Maple, a largestature tree with less than 1% of the total treepopulation contributes more than 12% of thestructural value. Other large stature trees such asEastern Cottonwood, Black Walnut and WhiteOak similarly represent less than 1% of the treepopulation but contribute as much as or more thanthe most common tree species, buckthorn.
Effects and Values of Tree FunctionsTree functions include a wide range of
environmental and ecosystem functions and aredetermined by the structure of the urban forest.Trees have economic value (positive and negative)based on the functions they perform. These valuestend to increase with increased number and size ofhealthy trees, and decrease in amount as healthy
tree cover declines. Although there are numerousfunctional values that an urban tree can have, notall are easily quantifiable. Four tree functions areevaluated in the UFORE model:
• Air contaminant removal• Carbon storage• Carbon sequestration• Energy use reduction and savings
Air Contaminant Removal by TreesEstimates of the annual air contaminant removed
by trees were calculated based on leaf surface areaand is shown in Figure 31. The UFORE model, inconjunction with field data and hourly pollutionand weather data for 2007, determined thatLondon’s urban forest remove 370 tonnes ofpollutants annually; the greatest effect was forozone (O
3), followed by fine particulate matter
less than 2.5 micrometres (PM2.5
), nitrogen dioxide(NO
2), sulphur dioxide (SO
2) and carbon
monoxide (CO).
Pollutants removed by trees was compared toemissions from the average of all light dutygasoline vehicles in London in 2005 as well as toall pollutant emissions from London in 2005.
Figure 30. Top 20 tree species by percent of total structural value.
0
5
10
15
Sil
ver
Map
le
No
rway
Map
le**
Eas
tern
Wh
ite
Ced
ar
Su
gar
Map
le
Wh
ite
Ash
Hac
kber
ry
Wh
ite
Oak
Eas
tern
Co
tto
nw
oo
d
No
rway
Sp
ruce
**
Sib
eria
nE
lm**
Bu
ckth
orn
**
Bla
ckW
aln
ut
Blu
eS
pru
ce
Bo
xE
lder
Wil
low
Red
Oak
Gre
enA
sh
Lit
tle-
leaf
Lin
den
**
Bit
tern
ut
Hic
kory
Bu
rO
ak
Percent of Tree PopulationPercent of Total Structural Value

49
0
50
100
150
200
250
300
0
500,000
1,000,000
1,500,000
2,000,000
2,500,000
3,000,000
3,500,000tonnes
$ Value
tonnes 51 258 16 43 2
$ Value 448,397 3,422,631 52,517 567,744 3,376
Particulate Matter(PM2.5)
Ozone(O3)
Sulfur dioxide(SO2)
Nitrogen dioxide(NO2)
Carbon monoxide(CO)
Figure 31. Value of Tree Effects on Air Quality.
Trees remove more than 7 times the amount offine particulate matter produced by light dutyvehicles, and almost 5 times as much sulphuroxide (Table 10, left panel).
Total pollutant removed by London trees,excluding ozone because it is not emitted, is 0.4%of the total local emissions data from EnvironmentCanada’s Criteria Air Contaminants Inventory(Table 10, right panel). The greatest percentreduction compared to local emissions was forsulphur dioxide (1.8%) and fine particulate matter(1.8%). These values for local emissions reductionsdo not include indirect emissions associated withelectricity use in London. UFORE estimates thatLondon’s urban forest provides about $4.5 million
per year in equivalent value for the costs of aircontaminant removal by mechanical means.Reference to NICAP studies (p 20, 21 above)suggests that this is in the range of 16.4 to 19.6%of health care costs in Middlesex County, annuallyfor health care costs attributable to poor airquality.
An example of the management implications ofthis analysis would be in parking lots where thehigher temperatures associated with asphaltsurfaces, plus ozone and particulate matter fromvehicle exhaust create conditions that impairhuman health. This knowledge can be used toinfluence parking lot design to provide adequate
Light DutyVehicles
Removed byTrees Reduction
Local Industryand Other
Removed byTrees Reduction
Pollutant % %
CO 7,600 2 0.03 16,900 2 0.01NOx 450 47 10.4 7,200 43 0.6
PM2.5 8 56 700 2,900 51 1.8SO2 4 18 450 900 16 1.8
Total 8,062 123 1.5 27,900 112 0.4
Note: percent reduction = tonnes removed / tonnes emitted * 100
tonnes per year
Local Industry Emissions
tonnes per year
Vehicle Emissions
Table 10. Effect of Annual Pollutant Removal by Trees for 2005 in London.

50
plantable space, appropriate selection andplacement of trees in order to trap air pollutantsand reduce local temperatures of the surface nearthe source of pollution.
Carbon Stored by TreesThe dry weight of trees is estimated based on the
species size and crown dimensions and is expressedas tonnes of carbon stored in woody tissue bothabove and below ground. From this, the net carbonannually removed (sequestered) and the amount ofcarbon stored (sequestered and stored in woodytissue) by trees is estimated. Trees in London areestimated to store 360 000 tonnes of carbon. Twospecies, Silver Maple and Eastern Cottonwood,have relatively low populations in the urban forestbut have more large individuals capable of storingproportionately more carbon in their tissue. Figure32 shows that of all the species sampled, SilverMaple trees store the most carbon (12.3% of thetotal carbon stored), followed by White Ash, SugarMaple, and Eastern Cottonwood.
Together, White and Green Ash trees store closeto 10% of all the carbon and their demise due toEmerald Ash Borer (EAB) would result in a releaseof approximately 8% of the carbon back into theatmosphere over a short period of time.
Carbon Sequestration by TreesGross carbon sequestration is estimated at
12 500 tonnes of carbon per year sequestered inthe form of new woody tissue annually. This isequivalent to approximately 45 750 tonnes ofatmospheric CO2 per year. This accounts for about1.2% of the total carbon dioxide emissions inLondon in 2007 (City of London 2008). If this wasfiltered from the atmosphere by human technologythe cost would be $355 000 annually.
Net carbon sequestration is the differencebetween the amount of carbon taken up by livingtrees to that going back into the atmosphere fromdecomposition. For urban London this is about 9500 tonnes of carbon per year (approximately 34800 tonnes of CO
2 per year), which is equivalent to
removing 8 700 cars from London roads.
Figure 32. Top 10 tree species by percent of total carbon sequestration and total carbon storage.Value labels show % C-stored per year (upper bar) and % C-sequestration per year (lower bar),respectively (e.g. Silver Maple trees store 12.5% of total carbon and annually sequester 5.4% of totalcarbon).

51
Table 11. Carbon sequestration by land use type.
One quarter of all carbon sequestration isaccounted for by four species of large, shade trees(Sugar Maple, Norway Maple, White Ash, andSilver Maple) that together contribute over onequarter of all carbon sequestration (Figure 32) butthese species account for less than 17% of thenumber of trees (Figure 16). These four specieshave the highest total leaf areas and are among thelargest stature trees in the City. Sugar Mapleprovides 8% of the total annual carbonsequestration.
Another one-quarter of annual carbonsequestration is accounted for by five tree species(Eastern White Cedar, Box Elder, EasternCottonwood, Black Walnut, and White Oak).Eastern White Cedar is especially beneficial sinceunlike deciduous trees it can process pollutantsyear round; thus, the type of tree is as important asthe amount of trees when developing canopy covertargets (McPherson 2003).
The low density residential land use typeprovides the most carbon sequestration (Table 11)because of the number of large trees and the totalland base it covers.
Buckthorn, a small stature plant, ranks third withrespect to carbon sequestration. Although itappears that the amount of carbon sequestered bybuckthorn is relatively high, it is the number ofbuckthorn individuals (i.e. 19.5% of all trees,Figure 13), rather than their size, that provides thelarge estimate of sequestration by the UFOREmodel.
In London, the current optimal tree size forcarbon sequestration is between 105 and 115 cmdbh. Cutting down or removing trees before theyreach their optimal size removes a significantcarbon filter. However, as trees grow older, annualgrowth slows down, crowns become sparser andthe rate of carbon sequestration is reduced. Giventhat the overall contribution to carbon storage onan individual tree basis is significantly more fortrees in the largest diameter class, the overallcontribution to carbon processing by large trees ismuch more despite there being fewer large staturetrees (Figure 32).
Net carbon sequestration can be increased byhaving a higher proportion of large stature andlong-lived trees with healthy crowns. Eachlocation and species will be somewhat differentbut all species will benefit from a well-planned,scheduled maintenance cycle to ensure long termsurvival, growth, and health. Decades of improvedarboriculture techniques demonstrate the ability tojudiciously and systematically prune trees to trainthe tree’s form, to promote strong branches and toachieve a longer-lived crown. Other managementactivities include soil aeration to combatcompaction and improve soil moisture conditions,nutrient and water delivery to tree roots will alsocontribute to healthy long lives for trees. Utilizingwood products derived from maintenanceactivities and harvesting trees can further reducethe amount of carbon returning into theatmosphere and provide revenue to owners(Bratkovich 2001).

52
Heating Cooling Subtotal Heating Cooling Subtotal
Tree Shading of BuildingsMBTU 128,300 n/a 128,300 $1,112,000 n/a 1,112,000$MWh 1,100 8,600 9,700 $64,000 $483,000 547,000$
Carbon avoided from fossil-fuel based electricity generationtonnes 2,100 1,100 3,200 $61,000 $31,500 92,500$
$1,751,5001
Note: (1) 92.8% of these savings are in Low Density Residential Land Use Type.
Table 12. Energy use reduction and equivalent cost savings by trees, per year.
Energy Use Reduction and Cost SavingsTree species, distance and direction of trees
relative to buildings are important. The UFOREmodel estimated that energy consumption in thesummer is reduced by approximately 8 600megawatt-hour (MWh) by the shading of buildingsand the evaporative cooling provided by the treesin London (Table 12).
In London, the size and location of the treesprovide an annual savings of 128 300 millionBritish Thermal Units (MBTU) for reducednatural gas for home heating and 1 100 MWhreduced electricity for home air conditioning.Trees also provide an additional $92 500 in valueby reducing the amount of carbon released byfossil fuel based power plants. Total cost savingsin the summer and winter is approximately $1.7million dollars per year. The largest cost savings inheating and cooling is from the location of trees inlow density residential areas because of their sizeand location with respect to the buildings (Figure30).
Leaf cover and effects of trees for LondonThe driving force of ecosystems and of the
quality and quantity of vegetation is climate.Differences amongst cities are attributable toclimate, the age size class distribution, species mixand tree condition. Tables 13a and 13b compareUFORE data amongst cities within the sameecoregion as London; and taking into accountfactors such as population density, the limits of therespective study area versus city limits, land usetype, distribution and intensity. Urban foresteffects are shown for the study area overall andper hectare, respectively.
Appendix F provides a longer list of cities thathave completed a UFORE analysis with which tocompare the London outcomes. The overall treedensity in London is approximately 186 trees perhectare, which is comparable to other Canadiancity tree densities (Appendix F). In Canada, onlyCalgary, Toronto and Vancouver have more treesthan London. Compared to American cities, onlyNew York and Atlanta Georgia have more trees.There are 12.4 trees per person based on 2009census data. This is higher than any Canadian city.Oakville has 11.5 (2006 census) and Calgary has11.4 (2008 census) trees per person.

53
The leaf cover for London’s urban forest is24.7% with a structural or replacement value of$1.5 billion for its 4.4 million trees. The value ofthe ecological services provided by trees inLondon for annual net carbon sequestration of 12500 tonnes plus 410 tonnes of air contaminantsremoved annually has a value of almost $5 millionper year. Expressed on a per hectare basis, the
Leaf Cover TreesCarbonStorage
Net CarbonSequestration
CO2
RemovedPollutantsRemoval Pollution Value
City % n $ CDN
Southern Great Lakes Forest EcoregionOakville, ON 29.1 1,908,000 133,000 6,000 21,960 172 1,776,000London, ON 24.7 4,376,000 360,000 12,500 45,750 370 4,481,000
Syracuse, NY 23.1 876,000 157,000 4,900 17,934 99 1,045,000Toronto, Canada 19.9 10,220,000 1,108,000 46,700 170,922 1,646 18,523,000Philadelphia, PA 15.7 2,113,000 481,000 14,600 53,436 522 5,188,000
tonnes per year
CityTrees perhectare
Carbon Storage(tonnes/ha)
Carbonsequestration(tonnes/ha/yr)
Pollutionremoval
(kg/ha/yr)1
Pollution Value
$ / ha2
Oakville, ON 192.9 13.4 0.6 17.4 179.5
London, ON 185.5 15.3 0.5 15.7 189.9
Syracuse, NY 134.7 24.2 0.8 15.2 160.7
Toronto, Canada 160.4 17.4 0.7 25.8 290.7
Philadelphia, PA 61.9 14.1 0.4 15.3 151.9
Table 13a. Overall urban forest effects by cities within the Southern Great Lakes Forest Ecoregion.
Table 13b. Per hectare, urban forest effects by cities within the Southern Great Lakes Forest Ecoregion.
number of trees, tonnes of carbon storage, tonnesof carbon sequestered annually and tonnes of aircontaminants removed annually all comparefavourably with other municipalities that havecompleted a UFORE analysis.
© David Colvin 2006

54
GypsyMothGM
Dutch ElmDisease
DED
AsianLonghorned
BeetleALB
Emerald AshBorerEAB
Loss of live trees (%) 13.1 0.8 41.3 9.9
Loss of live trees (approx) 520,000 50,000 1,600,000 410,000
Compensatory value $ 303 million $ 9.3 million $ 1,100 million $ 130 million
Table 14. Effects of four exotic pests on tree population and structural value.
Modelling Tree Planting due to Mortalityincluding Threats from Pests or Disease
The UFORE model includes a tool to estimatethe number of trees required to plant per year tosustain the current number of live trees. Similarly,the response of the urban forest to pests or diseasecan also be modelled. Three factors: (1) predictedmortality, (2) predicted growth rates and (3)predicted natural regeneration were used (a) toproject the number of replacement trees requiredto sustain current live tree cover and (b) toestimate the impacts of different rates of naturalmortality and (c) four additional insect pests ordiseases (Tables 13). Mortality may be due tonatural causes (age or damage by storms) orremoval for development purposes.
Six different mortality rates (1.2% to 6%) weretested to determine the number of trees required tomaintain the current number of live trees(McWilliams 1997) using a predicted growth rateof 0.5 cm dbh per year (Nowak 2010) and anatural regeneration rate of 71% (London UFOREplot data).
The estimated number of trees needing to beestablished by planting or natural regeneration tosustain the current living tree population isbetween 47 000 and 235 000 based on annual treemortality rates of 1.2 and 6%, respectively.Additionally, the 495 500 dead trees could bereplaced. Better estimates of tree planting
requirements will be obtained with more reliableestimates of tree mortality rates in London’s urbanforest; this can be achieved by repeat visits to theUFORE permanent plots established for this study.
For the scenario of “Gypsy moth (GM)population peak over three years”, there is apotential to lose 13.1% of the live tree populationwith a structural value of $303 million. Speciesaffected include basswood, crabapple, elm andoak.
For the scenario of “Dutch Elm Disease (DED)complete loss of elm”, there is a potential to lose0.8% of the live tree population, or 2% of leafcover, with a structural value of $9.3 million.
For the scenario of “Asian long-horned beetle(ALB) outbreak”, the replacement rate wasrecalculated for all trees, excluding the hostspecies (alder, ash, basswood, birch, cherry,crabapple, elm, maple, pear, plum, poplar, willow)at a mortality rate of 1.2%. The number of hosttrees predicted to be effected is about 2 out of 5trees (1 600 000) with a structural value of $1.1billion.
For the scenario of “Emerald ash borer (EAB)infestation”, the replacement rate was recalculatedfor all trees, excluding the host species ash, at amortality rate of 1.2%. There is a likelihood tolose 9.9% of the live ash tree population over a 15year period, i.e. 100% loss of ash trees; therefore,the mortality rate for ash was set to 6% per yearfor the 15 year period. The predicted number ofreplacement trees (72 600) is the sum of baselinemortality plus the required replacement for ashtrees lost to EAB. The loss of ash trees has astructural value of $130 million.

55
Best Tree Choices for London
Trees vary in the level of benefits ofcontributions to improved air quality, carbonstorage, carbon sequestration or to reduce energyuse. Tree species suitable for the climate(hardiness) and soils of the London area werescreened against nine criteria for their relativecontributions to the structural and functionalvalues identified in UFORE using the tree selectormodule of i-Tree software (USDA 2008). Theresults of that screening were short-listed by theCity Ecologist and the City Urban Forester tothose trees that are native, long-lived, urbancondition tolerant, large stature and suitable forplanting on boulevards. Table 15 provides thisshort list “Large stature trees recommended forplanting in London”.
A longer list is given in Appendix G “Speciesrecommended for planting in London” that isorganized by tree stature (small, medium, large)and with some ranges of expected sizes of the treesat 10 years and maturity (usually > 40 years).These trees can improve air quality, store carbon intheir woody tissue, sequester carbon from theatmosphere and reduce energy use better than othertrees.
Table 15. Short-list of large stature trees recommended for planting in London.

56
Towards an Urban Forest Strategy
Over 80% of Canadians and 90% of Londonerslive in urban areas (Statistics Canada 2006). Theurban forest, therefore, plays a vital role in theenvironmental and social aspects of our lives. Assuch, there is a new and growing awareness of thevalue of trees and the urban forest. This shift inattitude from trees being liabilities to being assets,and a recognition of trees as green infrastructureand a public utility, is a relatively new concept(McPherson 2006, American Forests 2006, Gill2007). New and improved technology, techniques,and best management practices (e.g. computerizeddata management systems, satellite imagery andstructural soils) are available now to characterizeand use in the management of the urban forest.
UFORE analyses have formed the scientific basisof the urban forest strategies in many Americanand Canadian cities including Calgary, Oakvilleand Toronto.
An Urban Forest Strategy will support London'sOfficial Plan as it provides the vision for the urbanforest and the direction with respect to policies andother legislation, multi-disciplinary planningrequirements, budgetary requirements, operationalpractices, monitoring changes and reporting on thestate of the urban forest. The Urban ForestStrategy will identify long- and short-term goals ina twenty year framework in order to providesufficient time for continuity across the planninghorizon and accommodate changes due to political,economic, environmental or unforseen events. TheUrban Forest Strategy will be supported by a seriesof 5-year program management plans and annualoperating planting and maintenance schedules andbudgets.
Van Wassenaer (2009) identified a model for thedevelopment of an eight-stage urban foreststrategy incorporating a set of criteria andobjectives with measurable performanceindicators proposed by Clark (1997).
The strategic planning process includes:
1. Identification of the urban forest attributes2. Assessment of relevant resource data where it
exists3. Creation of vision reflecting community values4. Determination of the current status of various
components5. Identifying gaps between vision and current
status6. Creation of administrative vehicles to close the
gaps7. Formation of operational plans incorporating
the vision and goals8. Implementation and monitoring of the plan.
Clark (1997) identified three key components ofthe urban forest: 1) the community framework, 2)the vegetation resource and 3) resourcemanagement. These components serve as thebasis for developing the vision and strategicdirection. Public understanding and recognition oftrees and the urban forest as assets and greeninfrastructure are key elements in thedevelopment of an urban forest strategy forLondon. The community develops a shared visionof their forest, agree on the forest benefits, withthe private landowners recognizing the benefits oftheir trees and sharing in the cost of management.A sustainable vegetation resource providescontinuous, high level benefits across the entirecommunity. The philosophy of resourcemanagement includes the development of policiesand appropriate management approaches that varywith the objectives and the extent of forestresource across different land use types andmanagement areas.
An overview of the strategic process and thebasic components of an urban forest strategy areshown graphically in Figure 31.

57
Figure 31. Components of an Urban Forest Strategy (van Wassenaer 2009).
Figure 32. Flow chart of annual operating plans within a Strategic Urban Forest ManagementPlan (van Wassenaer 2009).

58
The following policy and practicesrecommendations are referred to the developmentof the Urban Forest Strategy . They are groupedinto seven general categories: Protect, Plant andMaintain, Human Health, Energy Conservation,Monitor, Public Education and AdditionalPressures and Issues.
Protect 1. Establish leaf cover goals 2. Maintain or increase existing leaf cover
through policies and best managementpractices
3. Sustain and protect large, healthy trees tooptimize per-tree effects for air quality,greenhouse gas reduction and energyconservation benefits
4. Establish and maintain a planned, integratedtree life cycle maintenance program ofwatering, pruning, fertilization andmonitoring
Plant and Maintain 5. Water trees and other vegetation on a regular
basis to enhance pollution removal and toreduce air temperatures
6. Protect and increase the amount of plantablespaces to maintain and increase the numberof trees and leaf cover over time to achieveoptimal benefits from trees
7. Plant the right trees in the right place to satisfymanagement criteria (i.e. air pollutionreduction, carbon sequestration, aesthetics)
8. Plant a diversity of species, sizes, and ages toreduce the impacts of disturbances (e.g. pests,climate change, etc.)
Human Health 9. Plant trees in polluted or heavily populated
areas to optimize tree air quality benefits10. Plant trees in parking lots, along streets, etc. to
shade parked cars and reduce vehicular VOCemissions
11. Use long-lived trees to reduce long-termpollutant emissions
12. Use low maintenance tree species to reducepollutant emissions from maintenanceactivities
RECOMMENDATIONS
13. Avoid pollution-sensitive species to maintainlong-term tree health
14. Utilize evergreen (conifer) trees for year-roundparticulate matter removal
Energy Conservation15. Plant trees in strategic locations to minimize
cooling and heating costs and to reducepollutant emissions from power plants
16. Reduce fossil fuel use when maintainingvegetation to reduce pollutant emissions
Monitor19. Conduct a UFORE analysis every four years to
monitor the state of the urban forest includinglands outside the Urban Growth Boundary
20. Conduct bi-annual assessment of changes toleaf cover using aerial photography analysis
21. Quantify mortality rates of trees
Public Education22. Launch a public education campaign to
increase public awareness of the directrelationship between ecosystem health and thequality of the urban forest to contribute tohuman well-being
23. Encourage and support citizens to protect andplant trees on private property
Additional Pressures and Issues24. Climate change and global warming25. Urban design, development policies and
standards and landscape design practices26. Replacement of existing grey infrastructure
such as sewers and roads and incorporation ofgreen infrastructure principles into urbanplanning and design
27. Urban growth impacts on quantity and qualityof woodlands and the Natural HeritageSystem
28. Development standards and their impact onloss of topsoil and water quantity and quality
29. Maintenance and replacement of agingboulevard trees in the older parts of the City
30. Landscape and development design practicesthat limit the future potential of number oftrees, their future benefits and value to thecommunity.
59
Trees are indicators of a community’s ecologicalhealth. Measuring urban ecosystem health is morecomplex than measuring leaf cover and thisUFORE report presents several measures of theurban forest ecosystem and describes how treescontribute to the health of London’s urbanecosystem. Large healthy trees provide valuableenvironmental benefits. The greater the tree coverand the less the impervious surface, the moreecosystem services are produced; namely,improving air quality, sequestering and storingatmospheric carbon, reducing energyconsumption due to direct shading of residentialbuildings and, reducing storm water runoff.Maintaining a robust urban forest that functions asgreen infrastructure reduces the need and expenseof building infrastructure to manage air and waterresources (American Forests 2009).
This UFORE analysis is a high level, snapshot-in-time that quantified the structure and functionof London’s urban forest within the Urban GrowthBoundary. This analysis determined that London’sleaf cover is 24.7% and the UFORE model wasused to measure the environmental benefits andreplacement value of our trees. London’s urbanforest has a structural value of $1.5 billion andprovides approximately $17 million dollars inannual ecological goods and services of air qualityimprovement and pollution removal, carbon storageand energy conservation. These are conservativeestimates because quantification of the many otherbenefits such as water quantity and water qualityimprovements, climate change mitigation, reductionof heat island impacts on grey infrastructure andultra-violet light reduction were outside the scopeof this analysis.
Summary and Conclusions

60
Air PollutionThe model reports the percent air quality
improvement and relative impacts of tree specieson net ozone and carbon monoxide formation peryear and volatile organic compound (VOC)emissions released per hour by trees to the air.
Area of Natural and Scientific Interest (ANSI)Areas of land and water containing natural
landscapes or features that have been identified ashaving values related to natural heritageprotection, scientific study, or education.
BiodiversityThe genetic, taxonomic and ecosystem variety
(terrestrial, marine, and aquatic) of a given area,environment, ecosystem or the whole planet.
CanopyThe aerial branches of terrestrial plants, together
with their complement of leaves (Lee 1998).
Carbon Sequestration, GrossCarbon sequestration is the storage of carbon in
plant tissue obtained from the air by plantsthrough photosynthesis.
Carbon Sequestration, NetNet carbon sequestration is the difference
between the amount of CO2 measured as gross
carbon sequestration and the amount of carbonreturning to the atmosphere throughdecomposition.
Carbon StorageCarbon storage is the amount of carbon that is
stored in living plant material, both above andbelow the ground, as roots, trunks, branches andleaves; usually measured in tonnes.
Carolinian Life ZoneThe Carolinian Life Zone is an area within the
Eastern Deciduous Forest of the MixedwoodPlains Ecozone characterized by its physiographyand ecoclimate, lying within Southern Great LakesForest (q.v.).
Community(ecological) An integrated group of species
inhabiting a given area and influencing oneanother’s distribution, abundance, and evolution(OMNR 1996).
CorridorEcological corridors are continuous systems of
open space in urban/urbanizing areas, includingsignificant areas and natural resources requiringprotection from disturbances/development, andlands needed for open space and recreation.
DevelopmentDevelopment means the creation of a new lot, a
change in land use, or the construction ofbuildings and structures, requiring approval underthe Planning Act (MMAH 2005).
Diameter at Breast Height (dbh)The diameter of a tree trunk measured at 1.3 m
above the ground.
EcoregionAn ecological land classification unit. An area
characterized by a distinctive regional climate asexpressed by vegetation (after Cauboue 1996).
Ecoregion, Southern Great Lakes ForestThe Southern Great Lakes Forests Ecoregion is
highly influenced by climate and by the post-glacial surficial deposits of sands and clays thatcontibute to the high species diversity of thedeciduous
EcosystemThe sum of the plants, animals, environmental
influences, and their interactions within aparticular habitat (OMNR 1996).
Emerald Ash Borer(EAB) Emerald Ash Borer (Agrilus planipennis)
is a non-native insect present in Ontario since2002 and whose larvae feed within the livingcambial tissue of ash trees which usually leads tothe death of the ash tree.
Glossary of Terms used in UFORE Report

61
Energy UseThe seasonal effects of trees on residential
building energy use estimated by an energy modelin UFORE based on field measurements of treedistance, tree height, tree condition, and directionof trees from residential structures.
Environmental ReviewEnvironmental Review refers to lands shown on
the City's Official Plan Schedule “A” that requireenvironmental studies to determine itsredesignation as Agriculture or Open Space aspart of the Natural Heritage System.
Environmentally Significant Areas (ESA)Environmentally Significant Areas contain
natural features and perform ecological functionsthat warrant their retention in a natural state. (Cityof London 2006)
ForestForest is a terrestrial vegetation community with
at least 60% tree cover (Lee et al. 1998).
FragmentationThe breaking up of the forest into isolated
patches through agriculture and urbandevelopment. (Woodley et al. 1998)
Geographic Information System(GIS) Describes any information system that
captures, integrates stores, edits, analyzes,manages, shares, and displays information or datathat is linked to location.
Geographically ReferencedRefers to the condition of data for which
“positional” information is available, enabling thegeographical position of the data to be establishedand communicated.
Green InfrastructureGreen infrastructure refers to an ecosystem-
based management approach to the establishmentof vegetation and engineered systems to improvethe economic value of the ecosystem goods andservices that vegetation provides.
HabitatAn area with resources (food, cover, water) and
environmental conditions (temperature,precipitation, presence or absence of predatorsand competitors) that promote occupancy,reproduction and survival by individuals of agiven species (or population).
LandscapeA heterogeneous land area composed of a
cluster of interacting ecosystems that is repeatedin similar form throughout (OMNR 1996).
Leaf AreaLeaf area is the total surface area of all leaves
found in the various layers of the crown of a tree.It is calculated using species specific regressionequations scaled to estimates of crown volumefrom field data measurements of crown width anddepth.
Leaf CoverLeaf cover is the proportion (%) of ground
surface that is covered by leaves of trees andshrubs estimated from aerial photography; it doesnot account for the layering of leaves in anindividual tree, shrub or cluster of trees andshrubs in a treed area.
Mixedwood PlainsAn ecozone in southern Ontario on a plain with
some interior hills with forests of mixed broadleafand conifer.
Mixedwood(s)A forest type in which 26-75% of the canopy is
softwood (OMNR 1996).
Mortality RateThe number of trees that die per year divided by
the number of living trees, expressed as a percent.
Natural AreaNatural Areas have natural features and
ecological processes that provide: habitat forplants, fish and wildlife and include: groundwater recharge and discharge areas; streamcorridors; wetlands; and, woodlands.

62
Natural Heritage SystemA system made up of natural heritage features
and areas linked by natural corridors which arenecessary to maintain biological and geologicaldiversity, natural functions, viable populations ofindigenous species and ecosystems.
NaturalizationNaturalization ranges from no-mow zones to
planting to permit natural regeneration tonaturally-succeeding landscapes to improvebiodiversity, wildlife habitat, ecological integrityand ecosystem health and to minimize long-termmaintenance.
Nitrogen oxide (NOx)A group of highly reactive gases that contain
nitrogen and oxygen in varying amounts.
Official Plan (OP)The Official Plan (OP) is a planning document
adopted by a municipality setting goals, objectivesand policies to manage and direct physical changeand the effects on the social, economic andnatural environment of the municipality.
Open Space (OS)Open Space (OS) refers to lands designated to
be maintained as park space or in a natural state.
OzoneA gaseous molecule that contains three oxygen
atoms (O3).
Particulate MatterTiny particles or liquid droplets suspended in
the air less than 2.5 microns (PM2.5
) or between2.5 and 10 microns (PM
10) that contribute to non-
visible or visible haze.
PatchIn landscape ecology, a particular unit with
identifiable boundaries that differs from itssurroundings in one or more ways. These can bea function of vegetative composition, structure,age, or some combination of the three (BCMF2001).
Plantable SpacePlantable space is a field estimation of the
percent of the study plot that can accommodatetree planting based on suitable substrate, canopyclosure or constraints.
Provincial Policy Statement (PPS)The PPS provides direction on matters of
provincial interest related to land use planning,sets the policy foundation for regulating thedevelopment of land and supports the provincialgoal to enhance the quality of life for its citizens(MMAH 2005).
Rural AreaRural area is the land between the UGB (q.v.)
and the City Boundary defined in the Official PlanChapter 8b and shown on Official Plan Schedule“A” (City of London 2006).
ShrubA perennial plant usually with several perennial
stems that may be erect or may lay close to theground and will usually have a height less than 4m and stems no more than about 7.5 cm indiameter.
SpeciesInvasive Alien A non-native weedy plant thatgrows at high population densities and hasnegative effects on other plants, habitats,ecosystems, human health, animal health oragriculture.Native Native species evolve over time and areuniquely adapted to the local ecosystem based onadaptive traits. Native species for this ecoregionare those that are known or are believed to havebeen present prior to European settlement or about1600 C.E.Naturalized Non-native species that reproduceconsistently and sustain populations over morethan one life cycle without direct intervention byhumans; often reproduce freely, and do notnecessarily invade natural, semi-natural or human-made ecosystems.Non-Native Non-native species are those thathave been introduced to a new area, usually a newcontinent.Weedy Native or non-native species that tend to

63
grow at high population densities and may have anegative impact on other plants, habitats,ecosystems, human health, animal health oragriculture.
Street TreesA Street Tree includes a tree, shrub or plant,
alive or dead, that is within the portion of everyroad allowance within the limits of the City ofLondon that is not used as a sidewalk, driveway,travelled roadway or shoulder (City of London2005).
Structural ValueThe structural value, or replacement value, of a
tree is the amount it would cost to replace the treeand is estimated using the diameter and type oftree species, multiplied by the health and locationrating of that tree (Nowak et al. 2002).
TreeA woody plant usually with a single main stem
and capable, under the right conditions, ofreaching heights of several metres or more (Lee1998). In the UFORE model, a tree is any livingor dead woody vegetation greater than 2.5 cmdiameter at breast height (dbh). It can includenative and non-native species, as well as woodyshrub species such as sumac, buckthorn andwhite cedar in hedgerows.
Tree StatureRefers to the relative size of a tree at maturity
(i.e. 40 years after planting) (Centre for UrbanForest Research 2004).Small-stature: Less than 7.6 m tall and wide withtrunk diameters less than 51 cm. Small trees fit in1.2 to 1.5 m tree lawns or landscape strips (e.g.Crabapple).Medium-stature: 7.6 to 12.2 m tall and wide withtrunk diameters 51 to 76 cm (e.g. Norway Maple).Large-stature: Greater than 12.2 m tall and widewith trunk diameters commonly over 76 cm.Large trees need at least a 2.4 m tree lawn orlandscape strip (e.g. Silver Maple).
Treed AreaTreed areas may include all communities with a
tree cover of >10% (Lee 1998).
UnderstoreyUnderstorey refers to the lower level of
vegetation in a forest. Usually formed by groundvegetation, mosses, herbs, lichens and shrubs(NRCAN 2004).
Urban ForestUrban forest is a collective term that refers to all
trees within an urban area, regardless of land usetype, whether public or private. Trees in privateyards, street boulevards, parks, woodlands,plantations, wetlands, riparian areas, ravines andfields in various stages of succession are allincluded in this term. For the purpose of thisproject, the urban area lies within the UrbanGrowth Boundary for the City of London.
Urban Forest Effects Model (UFORE)The Urban Forest Effects Model (UFORE) is a
standardized method for scientifically analyzingthe structure, air quality and climate changebenefits, energy-saving benefits, and economicvalue of urban trees.
Urban Growth Boundary(UGB) The Urban Growth Boundary is a line on
Official Plan Schedule “A” that delineates the areaanticipated for land and services associated withurban growth over planning period of the plan, to2016 (City of London 2006).
WatershedThe area drained by an underground or surface
stream, or by a system of streams (OMNR 1996).
WetlandLand that is seasonally or permanently covered
by shallow water and where the water table isclose to or at the surface; presence of hydric soils;dominance of either hydrophytic or water-tolerantplants.
WoodlandWoodland is a general term which collectively
refers to areas occupied by trees, treed areas,woodlots and forested areas.

64
REFERENCES
Abdollahi KK, Ning ZH, Appeaning A. 2000. Global climate change and the urban forest. Baton RougeLA: GCRCC and Franklin Press. 77 p.
Abraxas Energy Consulting. 2007. Pollution emissions from natural gas. [Internet]. [Cited 2011-Aug-9].Available from: www.abraxasenergy.com/emissions.
American Forests. 2006. Urban Ecosystem Analysis SE Michigan and City of Detroit. [Internet]. [Cited2011-Aug-9]. Available from: www.americanforests.org/resources/urbanforests/analysis/php.
American Forests. 2009. Urban Forests. [Internet]. [Cited 2011-Aug-9]. Available from:www.americanforests.org/resources/urbanforests.
Arquilla B. 1994. Naturalization Area Maintenance Manual. London ON: City of London, Parks andRecreation.
Baldocchi DD. 1988. A multi-layer model for estimating sulfur dioxide deposition to a deciduous oakforest canopy. Atmospheric Environment 22:869-84.
Baldocchi DD, Hicks BB, Camara P. 1987. A canopy stomatal resistance model for gaseous deposition tovegetated surfaces. Atmospheric Environment 21:91-101.
Baral A, Guha GS. 2004. Trees for carbon sequestration or fossil fuel substitution: the issue of cost vs.carbon benefit. Biomass and Bioenergy 27(1):41-55.
Barnes ASL. 1966. Lower Thames Valley Conservation Report. Toronto ON: Queen’s Printer,Department of Energy and Resources Management. 94 p.
Barrett HB. 2008. They had a dream: A history of the St. Williams Forestry Station. Port Rowan ON:Port Rowan/South Walsingham Heritage Association. 191 p.
Barry RG, Chorley RJ. 1987. Atmosphere, weather and climate. 5 ed. New York NY: Routledge. 460 p.Beckett KP, Freer PH, Taylor G. 2000. Particulate pollution capture by urban trees: effect of species and
windspeed. Global Change Biology 6:995-1003.Beedlow PA, Tingey DT, Phillips DL, Hogsett WE, Olszyk DM. 2004. Rising atmospheric CO
2 and
carbon sequestration in forests. Frontiers in Ecology and the Environment 2(6):315-22.Bergsma B, Boitson T. 2000. Ecological Land Classification Project. City of London, Planning Division.Bergsma B, De Young W. 2007. Paradox of the natural in urban parks. Proceedings of the Parks
Research Forum of Ontario. 2007 Apr 4; University of Waterloo.Bidwell RGS, Fraser DE. 1972. Carbon monoxide uptake and metabolism by leaves. Canadian Journal
of Botany 50:1435-9.Blouin G. 2001. An Eclectic Guide to Trees East of the Rockies. Erin ON: Boston Mills Press. 280 p.Bowles JM, Draper W, Heagy A, Kanter M, Larson B. 1994. City of London Sub-Watershed Studies: Life
Science Inventories. London ON: Upper Thames River Conservation Authority and City of London.114 p.
Bratkovich SM. 2001. Utilizing municipal trees: ideas from across the country. NA-TP-06-01 ed. U.S.Department of Agriculture, Forest Service. 91 p.
(BCME) British Columbia Ministry of the Environment. 2011. Residential Wood Burning Emissions inBritish Columbia. Available from: www.env.gov.bc.ca/air/airquality/pdfs/wood_emissions.pdf.
(BCMF) British Columbia Ministry of Forests. 2001. Glossary of Forestry Terms. [Internet]. [Cited 2011-Aug-9]. Available from: www.for.gov.bc.ca/hfd/library/documents/glossary.
(C-CIARN) Canadian Climate Impacts and Adaptation Research Network, editor. 2002. Climate Changeand Ontario’s Vulnerable Communities. 2002 Nov 28.
Canadian Council of Forest Ministers. 2000. Criteria and Indicators of Sustainable Forest Management inCanada: National Status Criteria and Indicators. Ottawa ON: Canadian Forest Service. 140 p.
(CFA) Canadian Forestry Association. 2005. Canadian Forestry Association Teaching Kit. [Internet].[Cited 2011-Aug-9]. Available from: www.canadianforestry.com/kits/english/index.
65
(CMA) Canadian Medical Association. 2008. No Breathing Room: National Illness Costs of Air PollutionSummary Report. [Internet]. [Cited 2011-Aug-9]. Available from: www.cma.ca.
Cappiella K, Schueler T, Wright T. 2005. Urban Watershed Forestry Manual Part 1: Methods forIncreasing Forest Cover in a Watershed. Center for Watershed Protection.
Cauboue M, Strong WL, Archambault L, Sims RA. 1996. Terminology of ecological land classificationin Canada (Report LAU-X-114E). Sainte-Foy QB: Canadian Forest Service, Natural Resources Canada.
Center for Urban Forest Research. 2004. The Large Tree Argument. The Case for Large-Stature Trees vs.Small-Stature Trees. Athens Georgia: Center for Urban Forest Research, Pacific Forest ResearchStation, U.S. Department of Agriculture, Forest Service, Davis California and the Southern Center forUrban Forestry Research and Information, Southern Research Station.
City of London. 2005. Boulevard Tree Protection By-law. [Internet]. [Cited 2011-Aug-9]. Availablefrom: www.london.ca.
City of London. 2005. Tree Planting Guidelines. London ON: City of London, Planning Division. 12 p.City of London. 2006. Digital Mapping CD 2006 - DWG/Shape Files. London ON: City of London,
Planning Division. [Data File].City of London. 2006. Guideline Document for the Evaluation of Ecologically Significant Woodlands.
London ON: City of London, Planning Division.City of London. 2006. The City of London Official Plan. [Internet]. [Cited 2011-Aug-9]. Available from:
www.london.ca.City of London. 2007. Aerial Photographic Layer. London ON: City of London, Planning Division.
[Data File].City of London. 2007. Thames Valley Corridor Plan Phase 1. Scope and Background Study. London
ON: City of London, Planning Division, Parks Planning and Design. 121 pp + 22"x34" Map p.City of London. 2008. Air Quality Index in London. [Internet]. [Cited 2011-Aug-9]. Available from:
www.clear.london.ca/Air_Quality.html.City of London. 2009. CityMap. [Internet]. [Cited 2011-Aug-9]. Available from: webmap.london.ca.City of London. 2010. Thames Valley Corridor Plan Draft Final Report, prepared by ENVision The
Hough Group and Dillon Consulting Limited. London ON: City of London, Planning Division, ParksPlanning and Design. 29 p.
Clark JR, Matheny NP, Cross G, Wake V. 1997. A model of urban forest sustainability. Journal ofArboriculture 23(1):17-30.
Clayton Research Associates Ltd. 2006. Employment, population, housing and non-residentialconstruction projections, City of London, Ontario 2006 update. Toronto ON: Clayton ResearchAssociates Ltd. 74 p.
Conservation Authorities Branch. 1952. Upper Thames Valley Conservation Report 1952. Toronto ON:Queens Printer. 201 p.
Cooper K, Marshall L, Vanderlinden L, Ursitti F. 2011. Early Exposures to Hazardous Chemicals/Pollution and Associations with Chronic Disease: A Scoping Review. Toronto ON: CanadianEnvironmental Law Association (www.cela.ca), the Ontario College of Family Physicians, and theEnvironmental Health Institute of Canada. 160 p.
(CTLA) Council of Tree and Landscape Appraisers. 1992. Guide for Plant Appraisal. 8 ed. ChampaignIL: International Society of Arboriculture.
Daigle JM, Havinga DJ. 1996. Restoring Nature’s Place: A Guide to Naturalizing Ontario Parks andGreenspace. Ecological Outlook Consulting and Ontario Parks Association.
Delcourt HR, Delcourt PA, Webb T. 1983. Dynamic plant ecology: The spectrum of vegetation change inspace and time. Quaternary Science Review.
Deneke F. 1993. Urban Forestry in North America: Towards a Global Ecosystem Perspective. In: BlouinG, Comeau R, editors. Winnipeg MB: Proceedings of the First Canadian Urban Forests ConferenceMay 30-June 2, 1993; p 4-8.

66
DeYoung WJ. 2006. An Evaluation of LANDSAT TM Data GIS Modelling to Identify SignificantWoodlands in Southern Ontario. [dissertation]. London ON: University of Western Ontario.
Diamantakos D. 1997. Private Property Deforestation and Regeneration and the Clerk of Forestry inNineteenth-Century Ontario. Scientia Canadensis: Canadian Journal of the History of Science,Technology and Medicine 21(50):29-48.
Dumanski J. 2004. Carbon sequestration, soil conservation, and the kyoto protocol: Summary ofimplications. Climatic Change 65(3):255-61.
Duryea M, Binelli E, Gill DS. 2000. Basic Ecological Principles to Restoration. In: Duryea M, Binelli E,Korhnak L, editors. Restoring the Urban Forest Ecosystem. Gainesville FL: University of FloridaExtension, Institute of Food and Agricultural Sciences.
Dwyer JF, Nowak DJ, Watson GW. 2002. Future directions for urban forestry research in the UnitedStates. Journal of Arboriculture 28(5):231-6.
Dwyer JF, Nowak DJ, Noble MH, Sisinni SM. 2000. Connecting people with ecosystems in the 21stcentury: an assessment of our nation’s urban forests. Gen.Tech.Rep.PNW-GTR-490. Portland OR: U.S.Department of Agriculture, Forest Service, Pacific Northwest Research Station. 483 p.
Elliot, Ken. 2009. Subject: “Estimated average mortality rate of forest stands in the Northeastern UnitedStates.” eMail Message to: Nowak DJ. 2009-Jun-8.
Energy Information Administration. 1994. Energy use and carbon emissions: non-OECD countries.Available from: http://tonto.eia.doe.gov/bookshelf.
Energy Information Administration. 2001. Total Energy Consumption in U.S. Households by Type ofHousing Unit. Available from: www.eia.doe.gov/emeu/recs/recs2001/detailcetbls.html.
Energy Information Administration. 2003. Emissions of Greenhouse Gases in the United States.Available from: www.eia.doe.gov/oiaf/1605/1605aold.html.
(ESRI) Environmental Systems Research Institute. 2005. ArcMap® GIS 9.1. [Computer Programme].Version 9.1. Redlands CA: Environmental Systems Research Institute, Inc.
Environment Canada. 1985. Wetlands lost before 1967; Wetland Mapping Series map 40P12, February1985. Ottawa ON: Environment Canada.
Environment Canada. 2004. How much habitat is enough. 2nd Edition. Otttawa: Canadian WildlifeService, Environment Canada.
Environment Canada. 2005. A National Ecological Framework for Canada. Available from:www.ec.gc.ca/soer-ree/English/Framework/NarDesc/mixpln_e.cfm.
Environment Canada. 2005. Beyond Islands of Green. Downsview ON: Canadian Wildlife Service,Environment Canada. 80 p.
Environment Canada. 2008. National Pollution Release Inventory. [Internet]. [Cited 2011-Aug-9].Available from: www.ec.gc.ca/pdb/npri/npri_home_e.cfm.
Environment Canada. 2009. Canada’s Offset system for Greenhouse Gases. [Internet]. [Cited 2011-Aug-9]. Available from: www.ec.gc.ca/creditscompensatoires-offsets.
Fahrig L. 2003. Effects of Habitat Fragmentation on Biodiversity. Annual Review of Ecology andEvolutionary Systematics 34:487-515.
Farquhar GD, Fosham MJR, Goulden ML, Heimann M, Jaramillo VJ, Kheshgi HS, Le Quere C, ScholesRJ, Wallace DWR. 2001. The carbon cycle and atmospheric carbon dioxide. New York NY: CambridgeUniversity Press. 881 p.
Forestry Act 1990 R.S.O.Chapter F.26. [Internet]. [Cited 2011-Aug-9]. Available from: www.canlii.org/on/laws/sta/f-26/20060718/whole.html.
Freer-Smith PH, El-Khatib AA, Taylor G. 2004. Capture of particulate pollution by trees: a comparisonof species typical of semi-arid areas (Ficus nitida and Eucalyptus globulus) with European and NorthAmerican species. Water, Air, and Soil Pollution 155:173-87.
Geiger JR. 2006. Trees- The Air Pollution Solution. Davis, CA: Center For Urban Research, PacificSouthwest Research Station, U.S. Department of Agriculture, Forest Service. 4 p.

67
Gill SE, Handley JF, Ennos AR, Pauoleit S. 2007. Adapting cities for climate change: The role of thegreen infrastructure. Built Environment 33(1):115-33.
Giroux P. 2005. Recommended Alternatives to Ash Trees. [Internet]. [Cited 2011-Sep-6]. Available from:www.inspection.gc.ca .
Graham RL, Wright LL, Turhollow AF. 1992. The potential for short-rotation woody crops to reduceU.S. CO2 emissions. Climatic Change 22:223-38.
Greller AM. 1988. Deciduous Forest. In: M.Barbour and W.D.Billings, editor. London UK: CambridgeUniversity Press; p 287-316.
Hastie, C. 2003. The benefits of urban trees. [Internet]. [Cited 2011-Aug-9]. Available from:www.cfr.washington.edu/research.envmind/UF/TreeBenefitsUK.pdf.
Helms J. 1998. The Dictionary of Forestry. Bethesda MD: Society of American Foresters and CABInternational.
Hewitt N. 2003. Trees and Sustainable Urban Air Quality: Using Trees to Improve Air Quality in Cities.Lancaster UK: Lancaster University: Centre for Ecology & Hydrology.
Hilts S. 1977. Natural Areas in London, Ontario: Towards an Appreciation. London ON: University ofWestern Ontario, Department of Geography. 100 p + Site Reports, Maps and Appendices.
Hilts SG, Cook FS. 1982. Significant Natural Areas of Middlesex County. London ON: McIlwraith FieldNaturalists. 189 p + 11"x17" Map.
Houck JE, Tiegs PE, McCrillis RC, Keithley C, Crouch J. 1998. Air emissions from residential heating:the wood heating option put into environmental perspective. Proceedings of U.S. EPA and Air andWaste Management Association Conference: Living in a Global Environment; 373-84.
International Society of Arboriculture of Ontario. 2003. Ontario Supplement to the Guide for PlantAppraisal. 26 p.
Jorgenson E. 1974. Towards an urban forestry concept. Proceedings of the 10th Commonwealth ForestryConference. Ottawa ON: Forestry Service.
Kenney WA. 2000. Leaf Area Density as an urban forestry planning and management tool. The ForestryChronicle 76(2).
Kirschbaum MUF. 2003. Can trees buy time? An assessment of the role of vegetation sinks as part of theglobal carbon cycle. Climatic Change 58(1-2):47-71.
Kock H, Aird P, Ambrose J, Waldron G. 2008. Growing Trees from Seed: A practical guide to growingnative trees, vines and shrubs. Richmond Hill ON: Firefly Books Ltd. 280 p.
Kuhns M, Schmidt T. 1988. Heating with wood: species characteristics and volumes. Lincoln NE:University of Nebraska, Institute of Agriculture and Natural Resources, Cooperative Extension.
Lackey RT. 1998. Seven pillars of ecosystem management. Landscape and Urban Planning 40(1/3):21-30.Lal R. 2004. Soil carbon sequestration to mitigate climate change. Geoderma 123(1-2):1-22.Lambert RS, Pross P. 1967. Renewing nature’s wealth: A centennial history. Ontario Department of
Lands and Forests.Larson B, Riley JL, Snell EA, Godschalk HG. 1999. The Woodland Heritage of Southern Ontario. A
Study of Ecological Change, Distribution and Significance. Toronto ON: Federation of OntarioNaturalists. 262 p.
Layton M. 2004. Electricity environmental performance report: electricity generation and air emissions.Available from: www.energy.ca.gov/2005_energypolicy/documents/2004-11-15_workshop/2004-11-15_03- A_LAYTON.PDF.
Lee HT, Bakowsky WD, Riley J, Bowles J, Puddister M, Uhlig P, McMurray S. 1998. Ecological LandClassification for Southern Ontario: A first approximation and its application, SCSS Field Guide FG-02. North Bay ON: Ontario Ministry of Natural Resources, Southcentral Science Section, ScienceDevelopment and Transfer Branch.

68
Lehrbass B, Wang J, editors. 2009. Object-oriented urban tree cover extraction from high-resolutioncolour-infrared aerial imagery. 2009 Jun 22; Lethbridge AL: Proceedings of the 30th CanadianSymposium on Remote Sensing.
Lehrbass B, Wang J. 2010. Techniques for object-based classification of urban tree cover from high-resolution multispectral imagery. Canadian Journal of Remote Sensing 36(S2):287-97.
Linacre ET, Geerts B. 2002. Estimating the annual mean screen temperature empirically. Theory ofApplied Climatology 71:43-61.
Lockhart BR, Robert C, Weih JR, Keith MS. 2005. Crown radius and diameter at breast heightrelationships for six bottomland hardwood species. Journal of the Arkansas Academy of Science59:110-115.
London Hydro. 2009. Electricity Rates for 2009. [Internet]. [Cited 2009-May-7]. Available from:www.londonhydro.com.
Lovett GM. 1994. Atmospheric deposition of nutrients and pollutants in North America: an ecologicalperspective. Ecological Applications 4:629-50.
MacDonald L. 1996. Global Problems, Local Solutions. American Forests 103(4):26-32.Macpherson, Andrew. 2009. Subject: “woodland acquisition.” eMail Message to: Tchir, Tara. 2009-Jun-
8.McMinn N. 1991. Remnant Woodlot Inventory for the City of London. London ON: London Public
Utilities Commission, Parks and Recreation. 208 p + 22"x34" Map and Appendix C. Woodlot InventoryData Files (bound version).
McNeil J, Vava C. 2006. Oakville’s Urban Forest: Our Solution to Our Pollution. Oakville ON: Town ofOakville Parks and Open Spaces Department. 59 p.
McPherson EG. 2003. A benefit-cost analysis of ten street tree species. Journal of Arboriculture 29(1):1-8.
McPherson EG. 2006. Urban Forestry in North America. Renewable Resources Journal:8-12.McPherson EG, editor. 2009. The urban forest imperative: effects on carbon, water, heat islands and
community quality of life. 2009 Feb 17; Canberra Australia: Greenscapes Symposium.McPherson, EG and Simpson JR. 1999. Carbon dioxide reduction through urban forestry: guidelines for
professional and volunteer tree planters. [Internet]. [Cited 2011-Aug-9]. Available from:www.fs.fed.us/psw/publications/gtrs.shtml.
McPherson EG, Nowak DJ, Rowntree RA. 1994. Chicago’s urban forest ecosystem: results of theChicago Urban Forest Climate Project. NE-186 ed. Radnor, PA: U.S. Department of Agriculture, ForestService, Northeastern Forest Experiment Station. 83 p.
McPherson EG, Simpson JR, Peper PJ, Xiao Q, Maco SE, Hoefer PJ. 2003. Northern Mountain andPrairie Community Tree Guide: Benefits, Costs and Strategic Planting. Davis, CA: Center for UrbanForest Research, U.S. Department of Agriculture, Forest Service, Pacific Southwest Research Station.
McWilliams WH, Arner SL, Barnett CJ. 1997. Summary of mortality statistics and forest healthmonitoring results for the Northeastern United States. In: Pallardy SG, Cecich RA, Garrett HG,Johnson PS, editors. Proceedings of the 11th Central Hardwood Forest Conference; Gen. Tech. Rep.NC-188 ed. St. Paul MN: U.S. Department of Agriculture, Forest Service, Northeastern ForestExperiment Station; p 59-75.
Miller O. 1988. This was London. The first two centuries. Westport ON: Butternut Press Inc.(MMAH) Ministry of Municipal Affairs and Housing. 2005. The Ontario Provincial Policy Statement.
Toronto: Queen’s Printer for Ontario. 37 p.Moll G, Ebenreck S. 1989. Shading our cities: A resource guide for urban and community forests.
Washington D.C.: Island Press. 333 p.Montréal Process Working Group. 1999. The Working Group on Criteria and Indicators for the
Conservation and Sustainable Management of Temperate and Boreal Forests (Montréal Process), 2ndEdition. [Internet]. [Cited 2011-Aug-11]. Available from: www.mpci.org/criteria_e.html.

69
Murray FJ, Marsh L, Bradford PA. 1994. New York state energy plan, vol. II: issue reports. Albany NY:New York State Energy Office.
National Transportation Statistics. 2002. Pollutant emissions from light-duty gas vehicles. Available from:www.bts.gov/publications/national_transportation_statistics/2004.
(NRCAN 2004) Natural Resources Canada. 2004. Canada’s Forests. [Internet]. [Cited 2011-Aug-11].Available from: www.pfc.cfs.nrcan.gc.ca/canforest/canf/mixedwood1_e.html.
(NRCAN 2008) Natural Resources Canada. Most of Canada’s heating supplied by natural gas. [Internet].[Cited 2008-May-7]. Available from: www.nrcan.gc.ca/eneene/sources/pripri/reprap/2008-10-24/supsup-eng.php.
Newmaster SG, Lehela A, Uhlig PWC, McMurray S, Oldham MJ. 1998. Ontario Plant List. ForestResearch Information Paper No. 123 ed. Sault Ste. Marie ON: Ontario Ministry of Natural Resources,Ontario Forest Research Institute. 550 p.
North-South Environmental Inc. 2008. Inventory and Evaluation of Woodlands City of London. LondonON: City of London, Planning Division.
Noss RF, Peters RL. 1995. Endangered ecosystems, a status report on America’s vanishing habitat andwildlife. Washington D.C.: Defenders of Wildlife.
Nowak DJ. 1994. Atmospheric carbon dioxide reduction by Chicago’s urban forest. In: McPherson EG,Nowak DJ, Rowntree RA., editors. General Technical Report NE-186 ed. Radnor PA: U.S. Departmentof Agriculture, Forest Service, Northeastern Forest Experiment Station; p 83-94.
Nowak, DJ. 1995. The effects of urban trees on air quality. [Internet]. [Cited 2011-Aug-9]. Availablefrom: www.treescleanair.org/generalpublic/Articles/nowak_trees.pdf.
Nowak DJ. 2006. Institutionalizing urban forestry as a biotechnology to improve environmental quality.Urban Forestry and Urban Greening. 93 p.
Nowak DJ, Crane DE. 2000. The Urban Forest Effects (UFORE) Model: quantifying urban foreststructure and functions. NC-212. ed. St. Paul MN: U.S. Department of Agriculture, Forest Service,North Central Research Station. 714 p.
Nowak DJ, Dwyer JF. 2000. Understanding the benefits and costs of urban forest ecosystems. New YorkNY: Kluwer Academics/Plenum. 11 p.
Nowak DJ, McPherson EG. 1993. Quantifying the impact of trees: the Chicago Urban Forest ClimateProject. Unasylva 44(173):39-44.
Nowak DJ, Crane DE, Dwyer JF. 2002. Compensatory value of urban trees in the United States. Journalof Arboriculture 28(4):194-9.
Nowak DJ, Kuroda M, Crane DE. 2004. Tree mortality rates and tree population projections inBaltimore, Maryland, USA. Urban Forestry and Urban Greening 2:139-47.
Nowak, DJ, Crane, DE, Stevens, JC, and Hoehn RE. 2005. The urban forest effects (UFORE) model:field data collection manual. [Internet]. [Cited 2011-Aug-9]. Available from: www.fs.fed.us/ne/syracuse/Tools/downloads/UFORE_manual.pdf.
Nowak DJ, Hoehn RE, Crane DE, Stevens JC, Walton JT. 2006. Assessing urban forest effects andvalues, Washington, D.C.’s urban forest. NRS-1 ed. Newtown Square PA: U.S. Department ofAgriculture, Forest Service, Northern Research Station. 24 p.
Nowak DJ, Walton JT, Stevens JC, Crane DE, Hoehn RE. 2008. Effect of plot size and sample size ontiming and precision of urban forest assessments. Arboriculture & Urban Forestry 34(6):386-90.
Nowak DJ, Crane DE, Stevens JC, Hoehn RE, Walton JT, Bond J. 2008. A ground-based method ofassessing urban forest structure and ecosystem services. Arboriculture and Urban Forestry 34(6):347-58.
Oke TR. 1982. The energetic basis of the urban heat island. Quarterly Journal of the RoyalMeteorological Society 108(455):1-24.
Olewiler N. 2004. The value of natural capital in settled areas of Canada. Victoria BC: Ducks UnlimitedCanada and The Nature Conservancy of Canada. 36 p.

70
(OEB) Ontario Energy Board. 2008. Cost of natural gas, 2008. [Internet]. [Cited 2011-Aug-9]. Availablefrom: www.oeb.gov.on.ca/OEB.
(OMA) Ontario Medical Association. 2005. The Illness Costs of Air Pollution in Ontario. A Summary ofFindings. [Internet]. [Cited 2011-Aug-9]. Available from: www.oma.org/Health/smog/icap.asp.
(OMNR) Ontario Ministry of Natural Resources. 2001. Critical review of historical and current treeplanting programs on private lands in Ontario. Toronto ON: Queen’s Printer. 43 p.
(OMOE 2005) Ontario Ministry of the Environment. 2005. Smog Alerts. [Internet]. [Cited 2011-Aug-9].Available from: www.airqualityontario.com/press/smog_advisories.cfm.
(OMOE 2007) Ontario Ministry of the Environment. 2007. Air Quality in Ontario 2007 Report.[Internet]. [Cited 2011-Aug-9]. Available from: www.ene.gov.on.ca/publications/6930e.pdf.
Pan-European Ecological Network. 2003. Fact sheet VI – Ecological corridors and connectivity.[Internet]. [Cited 2011-Sep-28]. Available from: www.eeconet.org/eeconet/index.html
Pollution Probe. 2002. The Smog Primer. Toronto ON: Pollution Probe. 61 p.Professional Foresters Act 2000 R.S.O.Chapter 18. [Internet]. [Cited 2011-Aug-9]. Available from:
www.e-laws.gov.on.ca/html/statutes/english/elaws_statutes_00p18_e.htm.Pullman M. 2008. Particulate deposition and retention during wind and rain events in three conifer
species [dissertation]. Cornell University. 51 p.Salzman J, Mordecai SF. 1995. A policy maker’s guide to designing payments for ecosystem services.
Duke University. 60 p.Sanderson M. 2002. The Climate of Southern Ontario. Toronto ON: University of Toronto Press.Schaefer MA. 2007. i-Tree Software Suite v1.2 User’s Manual: Tools for Assessing and Managing
Community Forests. Radnor PA: U.S. Department of Agriculture, Forest Service Research. 220 p.Small JP. 1978. Natural Areas in Middlesex County: A systematic empirical evaluation of selected sites
with special reference to overstory vegetation [dissertation]. London ON: University of WesternOntario, Department of Geography.
(SER) Society for Ecological Restoration International. 2008. Ecological Restoration as a Tool forReversing Ecosystem Fragmentation. Policy Position Paper. Tucson AZ: Society for EcologicalRestoration International.
Stack RW, McBride DK, and Lamey HA. 1996. Dutch elm disease. [Internet]. [Cited 2011-Sep-6].Available from: www.ag.ndsu.edu/pubs/plantsci/trees/pp324w.htm.
Statistics Canada. 2007. Canadian Social Trends: Census Snapshot of Canada - Urbanization. [Internet].[Cited 2011-Aug-11]. Available from: www.statcan.gc.ca/pub/11-008-x/2007y004/pdf/10313-eng.pdf.
Strobl S, Bland D. 2000. A Silvicultural Guide to Managing Southern Ontario Forests. Toronto ON:Ministry of Natural Resources, Forest Management Branch.
Traill CP. 1832. The backwoods of Canada: Being letters from the wife of an emigrant officer, illustrativeof the domestic economy of British America. Toronto ON: New Canadian Library.
(USDA 2010) U.S. Department of Agriculture, Animal and Plant Health Inspection Service. 2010. PlantHealth - Asian Longhorned Beetle. [Internet]. [Cited 2011-Sep-6]. Available from:www.aphis.usda.gov/plant_health/plant_pest_info/asian_lhb/index.shtml.
(USDA 2005) U.S. Department of Agriculture, Forest Service Northeastern Area. 2005. Gypsy mothdigest. [Internet]. [Cited 2011-Sep-6]. Available from: www.na.fs.fed.us/fhp/gm.
(USDA 2001) U.S. Department of Agriculture, Forest Service Research. 2001. Syracuse Urban ForestMaster Plan: Guiding the City’s Forest Resource into the 21st Century. Newtown Square PA: U.S.Department of Agriculture, Forest Service Research. 50 p.
(USDA 2008) U.S. Department of Agriculture, Forest Service Research. 2008. i-Tree Software.[Computer Programme]. Version 1.2. Radnor PA: U.S. Department of Agriculture, Forest ServiceResearch.
(USDA 2010) U.S. Department of Agriculture, Forest Service Research. 2010. Emerald Ash Borer.[Internet]. [Cited 2011-Sep-6]. Available from: www.emeraldashborer.info.

71
(UTRCA 1975a) Upper Thames River Conservation Authority. 1975. London Valley Lands Study.London ON: Upper Thames River Conservation Authority. 73 p.
(UTRCA 1975b) Upper Thames River Conservation Authority. 1975. The Thames Valley Parklands inLondon. London ON: Upper Thames River Conservation Authority. 8 p + 11"x17" Map.
(UTRCA 2003) Upper Thames River Conservation Authority. 2003. The Middlesex Natural HeritageStudy. A Natural Heritage Study to Identify Significant Woodland Patches in Middlesex County.London ON: Upper Thames River Conservation Authority. 41 p + 9 Appendices.
(UTRCA 2007) Upper Thames River Conservation Authority. 2007. Upper Thames River WatershedReport Cards. [Internet]. [Cited 2011-Aug-9]. Available from: www.thamesriver.on.ca/watershed_report_cards/watershed_report_cards-2007.htm.
Van Wassenaer P, editor. 2009. Sustainable urban forest management planning using criteria andindicators. 2009 Oct 7; Savannah GA: Society of Municipal Arborists 45th Annual Conference.
Waldron G. 2003. Trees of the Carolinian Forest: A guide to species, their ecology and uses. Erin ON:Boston Mills Press. 275 p.
Warner BG, Kubiw HJ, Hanf KI. 1989. An anthropogenic cause for quaking mire formation insouthwestern Ontario. Nature 340:380-4.
Wilkie K, Ashcroft C. 2009. From Grey to Green: The transformation of Canada’s infrastructure. PlanSpring:11-4.
Winterhalder K, Aronson J, Bowers K, Clewell A, Covington W, Harris J, Higgs E, Hobbs R, Martinez D,Murcia C, and Rieger J. 2004. Natural Capital and Ecological Restoration, An Occasional Paper of theSER Science and Policy Working Group. [Internet]. [Cited 2010-Jun-22]. Available from: www.ser.org/content/Naturalcapital.asp.
Woodley S, Forbes G, Skibicki A. 1998. State of the Greater Fundy Ecosystem. Greater FundyEcosystem Research Project. Fredericton NB: University of New Brunswick.
Zinke PJ. 1967. Forest interception studies in the United States. In: Sopper WE, Lull HW, editors. Foresthydrology. Oxford UK: Pergamon Press; p 137-61.

72
Vision '96 Community Involvement ProcessVision 96 and Sub watershed Studies recommended a minimum target of maintaining existing
woodland cover (8.3% in 1996). All vegetation patches over 4 hectares in size were identified forretention as “significant woodlands”, but as a resolution to OMB hearings, they were designated as ER -Environmental Review for further study to confirm their significance.
Creative City task Force - April 2005Several of the recommendations from the Creative City Task Force Report refer to “The Forest City”
and improving our efforts in the areas of tree protection and planting:82. Tourism London and other organizations will be encouraged to promote London as the
centre of Canada's Carolinian Forest.87. The CCTF urges City Council to provide sufficient funding for enhanced tree planting and
protection of our urban forests to enhance London's reputation as the "Forest City".
London 150th Celebrations - 2005In 2005, London had its 150th anniversary as a City and a big part of the celebrations where
community and corporate planting days, including groups like: ReForest London; Friends of StoneyCreek; London Home Builders Association; many Rate Payers Associations; London DevelopmentInstitute and Scouts Canada.
These events were huge successes and brought renewed attention to the value of trees and forest inthe Forest City. The January 2005 “kick-off” event was the ceremonial planting of a large White Sprucetree in Victoria Park.
Corporate Strategy for The Forest CityIn 2006, the Corporation rolled out its new Strategic Plan to focus our efforts on meeting identified
community needs and on improving corporate governance. The Vision for the Forest City is “To bepositioned within the top rank of Canadian municipalities.”. This vision is captured in our openingstatement:
“London has been known as the Forest City since 1856. Londoners have embraced the Forest City asits brand and have adopted a tree as its logo. The tree has become a symbol for growth, renewal,stability and commitment to environmental stewardship, economical prosperity and a high quality oflife.”
The Plan has several Strategic Priorities that relate directly to natural heritage protection.
ECONOMIC PROSPERITY - Our goal is to accelerate the growth of a strong and vibrant economy,and foster private sector investment in the City.
From attracting new businesses or highly skilled employees, to Tourism potential and basic civicpride, the quality of life in a City is critical. One proven factor in attracting new business and people isenvironmental awareness and a community that values their natural heritage features.
Retaining our woodlands and working with our corporate partners - London Home BuildersAssociation and London Development Institute - to grow them, is good for business.
APPENDIX A
CITY OF LONDON TREE AND WOODLAND INITIATIVES

73
INFRASTRUCTURE RENWAL and EXPANSION - Our goal is to construct and maintain a modernand progressive municipal infrastructure that meets the needs of a growing community.
On December 17, 2007, Council directed staff to develop a "Green Infrastructure Plan" to examinethe value of the City's Natural Heritage System in managing increasing storm water flows. Woodlands,tree cover and natural areas help to clean our air, absorb, filter and slow storm water run-off and reducetemperatures (saving us energy) - basic infrastructure roles at a minimal capital and operational cost.
COMMUNITY VITALITY - Our goal is to assure the health, safety and well-being of individualsand families while promoting livable and inclusive neighbourhoods.
A recent publication identified key areas that the community believed was critical to making Londonone of the best places to "live, work and play". One of eleven themes was "Green and HealthyEnvironment" and the outcome of this consultation was four objectives:
i Improved air quality and improved water qualityii More Londoners are actively participating and promoting a green and healthy environmentiii More green space is preservediv Improved preservation of our watershed systemRetaining existing woodlands helps to satisfy all of these objectives.
ENVIRONMENTAL LEADERSHIP - Our goal is to protect a healthy and sustainable environmentand encourage an environmentally sensitive city.
Natural resources include a variety of features and functions that occur in the Urban Area and in ourmore rural lands. These resources are critical to the health of our environment, well-being of ourresidents and to the over-all quality life in our City.
Protection of our remaining natural heritage system is a base value and supported by Official Planpolicies, sub-watershed studies and Council directives.
The role that trees play in energy conservation has also been recognized. For example, landscapingfor energy conservation (planting trees for summertime shade and wintertime wind break benefits) wasone of the seventeen energy innovations that was selected as a priority at the conclusion of the LondonEnergy Efficiency Partnership (LEEP) Project, a partnership between the City of London and the LondonHome Builders Association.
CREATIVE, DIVERSE AND INNOVATIVE CITY - Our goal is to define and strengthen the city’sunique identity.
The intent of the priority is far-reaching in dealing with many community heritage and culturalissues and objectives, but our “identity” is intimately tied to trees in London - a tree is our logo and“Forest City” is our sobriquet.
MANAGED and BALANCED GROWTH - Our goal is to plan and manage growth for the long termeconomic, environmental and social benefit of the community.
Urban development and growth will continue to provide for a vibrant city and countless jobs forLondoners. Managing that growth is a strategic priority to ensure that economic benefits are balancedwith environmental and social benefits. Everyone benefits from a cityscape that protects and values itsnatural heritage system, as proven by increasing real estate prices in close proximity to wetlands,woodlands and other natural areas - residents want these features retained and will pay more to belocated near them.

74
Trees and Forests Advisory Committee - 2006Council endorsed the creation of a permanent committee to provide advice and direction to the City
in our efforts to manage our trees and forests. Three specific areas will be targeted:Planning and ProtectionPlanting and RenewalManagement and Maintenance
OMBI / MPMP - Required Yearly Benchmark ReportingThe Ontario Municipal Benchmark Initiative and the Municipal Performance Monitoring Program
track key factors that represent a wide cross-section of standards and services in Cities. Both haveidentified criteria that measure a municipality's natural open space area relative to other jurisdictions:
PKRS103 Percentage of Open Space AreaPKRS210 Hectares of Natural Parkland / Population
Capital Budget SupportIn an effort to enhance the City's image as the Forest City, Council has supported significant
increases in capital funding for tree/woodland protection, management and planting.
Woodland Acquisition FundA yearly budget established in 2000 to acquire woodlands that have been identified as significant
through application of the Woodland Evaluation Guidelines. Average $250 000 per year,
Woodland Management ProgramA yearly capital program established in 2006 to develop management plans for City-owned
woodlands to ensure their long-term survival. Average $100 000 per year.
Street Tree ProgramA yearly Program to plant on City streets. Increased from $107 000 in 2004 to $460 000.
Downtown Tree ProgramA new program to enhance downtown tree planting. $75 000 in 2008
Ash Tree Replacement ProgramA new program to proactively address the potential loss of ash trees to the Emerald Ash Borer.
$500 000 in 2007.
Community Planting InitiativesYearly programs directed by the City support community planting initiatives. The City works with
community partners such as the Upper Thames River Conservation Authority, ReForest London,“Friends of” community groups (i.e. Dingman Creek, Stoney Creek, Coves Subwatershed, OxbowCreek, Medway Creek), and Scouts Canada to naturalize public and private lands. Typically,approximately 4 to 5 hectares of naturalization is carried out by thousands of volunteers at dozens ofsites across the City every year.

75

76
APPENDIX B
Excerpts of the City of London Official Plan
The City of London’s Official Plan sets out theCity Council’s objectives and policies to guide theshort-term and long-term physical development ofall lands within the boundary of the municipality.It provides direction for the allocation of land use,the provision of municipal services and facilities,and the preparation of regulatory by-laws tocontrol the development and use of land. Thesetypes of policies are considered necessary topromote orderly urban growth and compatibilityamong various land uses.
Planning Framework - Section 2
2.1.3 Strategic Goalsiv) An Environmentally Responsible City:
Our goal is to respect our environment andprotect and enhance the quality of our air, waterand land to sustain healthy plant, animal andhuman communities and the connections betweenthem.
2.2.1 Official Plan Vision Statementi) manage growth and change so that efforts to
foster economic development; protect and enhancenature within the City; provide for the efficientmovement of people and goods; and promoteattractive, cohesive neighbourhoods, are inbalance and supportive of each other.
iv) protect and enhance natural features andattributes that are significant to the maintenance ofecosystem health in the Thames River and KettleCreek watersheds.
2.3.1 Planning Principlesiii) Land use planning should be conducive to
the maintenance and enhancement ofenvironmental quality and conservation of natural,cultural and built heritage resources.
2.4 City Policy Structurexi) Natural Heritage System:
A natural heritage system comprised of areas andfeatures and their connecting links that aresignificant for their contribution to the health anddiversity of the City's natural environment will beidentified and protected through the Official Planand in the planning documents required forimplementation of the Official Plan.
2.9.2 Environmental Goali) Promote a healthy natural environment in
London;
ii) Maintain a healthy Natural Heritage Systemfor the benefit of present and future generations ofLondoners;
iii) Reduce risk to public health and safety fromnatural and human generated hazards; and
iv) Conserve natural resources for the benefit ofpresent and future generations of Londoners.
2.9.3 Environmental StrategiesSubsections i) through ix) identify specific
strategies to reach our goals, such as encouraginga "net gain" in environmental quality.
Environmental Policies - Section 15
15.1.1 Natural Heritage Objectivesi) Achieve healthy terrestrial and aquatic
ecosystems in the City's sub watersheds.
ii) Provide for the identification, protection andrehabilitation of significant natural heritage areas.
iii) Protect, maintain and improve surface andgroundwater quality and quantity where possible.
iv) Enhance the contribution of the NaturalHeritage System to urban form and communitydesign.
15.4.5 WoodlandsWoodlands are complex ecosystems of different
tree species, shrubs, ground vegetation and soilcomplexes that provide habitat for many plants

77
and animals. Woodland is a general term whichcollectively refers to areas occupied by trees, treedareas, woodlots and forested areas. Woodlandsidentified through the Sub watershed PlanningStudies and located outside of the recognizedEnvironmentally Significant Areas are shown as"Vegetation Patches" on Schedule "B".
The significance of Woodlands will be based onan evaluation of the following considerations:
i. The Woodland contains natural features andecological functions that are important to theenvironmental quality and integrity of the NaturalHeritage System.
ii. The Woodland provides important ecologicalfunctions and has an age, size, site quality,diversity of biological communities and associatedspecies that is uncommon for the planning area.
iii. The Woodland is important for the provisionof a balanced distribution of open space amenitiesand passive recreational opportunities across theurban area.
iv. The Woodland provides significant habitat forendangered or threatened species.
v. The Woodland contains distinctive, unusual orhigh quality natural communities or landforms.
Implementation - Section 19
19.14.1 Provincial Policy StatementsCouncil will have regard to Provincial Policy
Statements on matters of provincial interest, inaccordance with the provisions of the PlanningAct.
By-laws that have regard for trees andwoodlands include:
Boulevard Tree Protection By-law P-69 (http://www.london.ca/By-laws/PDFs/boulevard_tree.pdf)
The by-law, passed in 2005, protects trees onboulevards from damage and removal by residents.It allows for consensual removal of trees.
Tree Conservation By-law C.P. 1466-249(http://www.london.ca/By-laws/PDFs/tree_conservation.pdf)
The by-law was enacted in 2007 in order toprotect the environmental values associated withsignificant woodlands in private ownership.Woodlands that are classified EnvironmentallyProtected Areas (EPA) are protected fromdevelopment and require a permit from the Cityfor any major tree removals. All harvesting withinthe EPAs must be in accordance with GoodForestry Practices and appropriate for the siteconditions and the identified environmentalvalues.

78
Appendix C. UFORE Land Use Types andCity of London Land Use Designations (City of London 2006)
Agricultural
Agricultural (AG)Predominant land usg is agricultural and farm-
related activitigs including cash crops, marketgardening, speckalty crops, nurseries, generalfarming, livestock, forestry, aquaculture andagricultural research, as well as woodlands andother natural features, and occurs outside theUGB. Permits farm residence and a secondaryfarm occupation.
Urban Reserve Community Growth (URCG)Large, undeveloped and unserviced parcels of
land that may be developed in the near future andcomprised of predominantly residential uses.
Urban Reserve Industrial Growth (URIG)Large, undeveloped and unserviced parcels of
land that may be developed in the near future andcomprised of uses permitted under LightIndustrial, general Industrial and Office BusinessPark categories.
Commercial
Arterial Mixed-Use Districts (AMUD)Along arterial roads that consist of a mix of
commercial, small scale office and remnantresidential uses that meet pedestrian andvehicular-oriented trade.
Associated Shopping Area Commercial (ASAC)Provide a broad mix of retail, service and office
uses complementary to the Regional andCommunity Shopping areas.
Business Districts (BD)Long-established, pedestrian-oriented shopping
areas in older parts of the city consisting of small,separately-owned commercial properties that meetshopping and service needs of nearby residents orprovide specialty shopping for vehicular-orientedtrade
Commercial Policy Area (CPA)Applied to large tracts of land where substantial
commercial nodes or corridors exist. Theseunique areas cannot be described through the useof a single land use designation, but instead mixthe regulations from several other commercialdesignations.
Community Shopping Areas (CSA)Provide a wide range of goods and services
needed on a regular basis by suburban residentswithin convenient driving distance.
Downtown (DA)Primary multi-functional activity centre that has
high concentration of employment, government,cultural, and retail facilities that involve thebuying and selling of goods and services.
Dual Designation (RSC/HSC)Commercial areas that fulfill both the Highway
and Restricted Service Commercial categories.
Highway Service Commercial (HSC)Commercial uses that cater to travelling public
and are not suited to shopping areas orCommercial Districts because of their area, accessor exposure requirements.
Neighborhood Shopping Areas (NSA)Provide the daily or weekly convenience
shopping and service needs of nearby suburbanresidents.
Office Business Park (OBP)Number of prestige industrial and office-based
uses such as corporate administration and productdevelopment centres, research facilities andtechnology unlikely to have nuisance impacts andlocated in a large park-like setting.

79
Regional Shopping Areas (RSA)Major activity centres of large size and range of
commercial uses that meet a variety of specializedservice and comparison shopping needs ofsuburban residents within driving distance.
Restricted Service Commercial (RSC)Limited range of commercial uses that require
large sites or have nuisance impacts such as noise,odor, traffic, visual, etc. and cater to singlepurpose shopping trips and are not suited toshopping areas or Commercial Districts.
Industrial
General Industrial (GI)Broad range of industrial uses including
activities that could have a detrimental impact onother uses such as assembling, processing,repairing activities, service trades, utilities, largestorage facilities, yards, transportation terminalsand offices and retail outlets ancillary to theseuses.
Light Industrial (LI)Uses with limited impact on surrounding
environment and small in scale includingresearch, communication, printing, publishing,technical, professional or business servicesand offices and retail outlets ancillary to theseuses.
Institutional
Community Facilities (CF)Publicly-owned, smaller, less intensive
institutional uses such as nursing homes, healthclinics, chronic care facilities that are located indeveloped areas and provide the health, educationand other service needs of area residents.
Office Areas (OA)Stand-alone, purpose-designed small- to
medium-scale office buildings and officeconversions, as well as secondary uses that areaccessory to the offices (restaurants, financialinstitutions, personal cervices, child care,pharmacies, laboratories and clinics) located alongmajor roads.
Regional Facilities (RF)Publicly-owned, large institutional uses such as
universities, health care, correctional, religious,military and major recreational and culturalfacilities that are located in developed areas andprovide the health, education and other serviceneeds of regional residents.
Low Density Residential
Low Density Residential (LDR)Low-rise, low density housing forms including
detached, semi-detached and duplex dwellingsand other land uses integral to a residentialenvironment.
Rural Settlement (RS)City of London Official Plan 2006, Ch. 9.
Rural Settlement includes existing clusters orstrips of non-farm settlements outside of theurban community and outside areas designatedfor urban growth. Rural Settlement comprisesresidential communities of single-family dwellingsand parks, community centres, day care centres,group homes, schools and churches, small-scalecommercial and industrial uses.
Medium / High Density Residential
Multi-Family, High Density Residential(MFHDR)
Large-scale, multiple-unit housing formsincluding apartment buildings, apartment hotels,rest homes, boarding houses and other land usesintegral to a residential environment.
Multi-Family, Medium Density Residential(MFMDR)
Low-rise, multiple-unit housing forms includingrow houses, cluster houses, low-rise apartmentbuildings, small scale nursing homes, boardinghouses, emergency care facilities and other landuses integral to a residential environment.
Office / Residential (OR)Mixed office/residential buildings and office
conversions located near downtown.

80
Natural Area / Open Space
Environmental Review (ER)Areas designated Environmental Review on
Schedule “A” - the Land Use Map are vegetationpatches or stream corridors identified through theSubwatershed Planning Studies that require moredetailed environmental studies to determine thatthey satisfy criteria as specific components of theNatural Heritage System and would therefore beredesignated Open Space.
Open Space (OS)Private or public lands maintained as park space
or in a natural state, and used for non-intensiveuses such as parks, cemeteries, and private golfcourses. Areas designated Open Space onSchedule “A” - the Land Use Map, shall consistof, public open space, including district, city-wide, and regional parks; private open space,including such uses as cemeteries and private golfcourses; flood plain lands and lands that aresubject to natural hazards; and natural heritageareas, which are recognized by Council as beingof city-wide, regional or provincial significance.The Open Space designation may also be appliedto natural physical features which are desirablefor preservation.

81

82
May 20, 2008
«OWNER_NAME_»«MAILING_ADDR_»
Dear «OWNER_NAME_»
The City of London, in collaboration with the U.S. Forest Service and the Upper Thames River Conserva-tion Authority (UTRCA), is currently conducting a project called the Urban Forest Effects Model (UFORE).The purpose is to document the effects and benefits trees, shrubs, and other types of vegetation that growwithin the City have on our urban environment. The results of this project will provide background andsupport for the City’s Urban Forest Strategic Plan. In order to accomplish this, sample plots have beenlocated throughout the City, including residential and industrial areas, to gather data about the vegetation.Sample areas may or may not contain vegetation, and it is equally important to the study that we obtaininformation from both.
I am writing you to request consent for access to your property at «MUNICIPAL_ADDRESS» by theUTRCA’s two person crew for the purpose of field work. The two person crew will consist of an experi-enced forester and one field assistant. The field work is quick and unobtrusive and consists of measuringand recording the following: percent tree cover, tree species, diameter of trees, height of trees, width of treecrown, percent of missing tree canopy, amount of dieback, direction and distance to buildings. Plants andanimals are not removed from the site.
The intended period of field work (for the entire City) is May to late September, between the hours of 8 am– 4 pm, Monday to Friday. Each site is surveyed only once and a site visit usually takes less than half a day.Staff carries liability insurance so there is no risk to the landowner. Information about your municipaladdress will be kept confidential. As part of a thank-you package, all residential landowners who permitthe Conservation Authority access to their property will receive a summary of the information collected.Please feel free to contact the fieldwork project coordinator, Tara Tchir, at (519) 451-2800 x 261 for anyquestions regarding any aspect discussed in this letter. To grant your permission, please sign and return theattached permission form as soon as possible and return it in the postage paid envelope.
Thank you for your support and cooperation.
Yours truly,UPPER THAMES RIVER CONSERVATION AUTHORITY
Tara TchirEcologist
APPENDIX D. Landowner Contact Letter and Permission Form
1424 Clarke RoadLondon ON N5V 5B9

83
AUTHORIZATION FOR INVENTORY
As required for the 2008 Urban Forest Effects Model (UFORE)
I hereby give my permission to the Upper Thames River Conservation Authority to enter onto myproperty at «MUNICIPAL_ADDRESS» for the purpose of measuring and recording: percentagetree cover, tree species, diameter of trees, height of trees, width of tree crown, percentage missingtree canopy, amount of dieback, direction and distance to buildings as required for the UFOREproject between May – September 2008. It is understood that Conservation Authority staff carrythe necessary liability insurance for this project.
? YES
? NO (please explain):
Also, please let us know if there are any issues with accessing your property (e.g. dogs, lockedgates, pools) and we will call you prior to visiting your property.
? YES (please explain):
? NO
Name (print):
Signature:
Phone number:
Date:

84
Genus speciesGenus species Common NameCommon Name NNNN AGRAGR COMCOM INDIND INSINS LDRLDR MDRMDR NANAAbies balsamea Balsam Fir •Acer ginnala Amur Maple ** • •Acer negundo Box Elder • • • • • •Acer platanoides Norway Maple ** • • • •Acer rubrum Red Maple • • •Acer saccharinum Silver Maple • • • • •Acer saccharum ssp.nigrum Black Maple •Acer saccharum ssp.saccharumSugar Maple • • • • •Acer x freemanii Hybrid Soft Maple •Aesculus hippocastanum Horse Chestnut ** •Ailanthus altissima Tree-of-heaven ** •Amelanchier arborea Downy Serviceberry •Amelanchier laevis Smooth Serviceberry •Amelanchier sp. Serviceberry •Aralia spinosa Devil’s Walking stick ** •Aronia melanocarpa Black Chokeberry • •Betula papyrifera White Birch •Betula pendula European Weeping Birch ** •Campanula rapunculoides Creeping Bellflower ** •Carpinus caroliniana Blue Beech • •Carya cordiformis Bitternut Hickory • • •Carya ovata Shagbark Hickory • •Catalpa speciosa Northern Catalpa ** •Celtis occidentalis Hackberry • • •Cercis canadensis Redbud •Cornus alternifolia Alternate-leaf Dogwood • •Cornus florida Flowering Dogwood • •Cornus foemina Grey Dogwood •Cornus stolonifera Red-osier Dogwood • • •Cotinus coggygria Smoketree ** •Crataegus sp. Hawthorn • • • •Euonymus alata Winged Burning Bush ** •Fagus grandifolia American Beech •Fagus sylvatica European Beech ** • •Forsythia viridissima Forsythia ** • • •Fraxinus americana White Ash • • • • •Fraxinus excelsior European Ash ** • •Fraxinus nigra Black Ash • • •Fraxinus pennsylvanica Green Ash • • • • •Gleditsia triacanthos Honey Locust • •Gymnocladus dioicus Kentucky Coffee-tree •Juglans cinerea Butternut •Juglans nigra Black Walnut • • •Juniperus communis Common Juniper • •Juniperus horizontalis Creeping Juniper •Juniperus virginiana Eastern Red Cedar • • •Larix decidua European Larch ** •Ligustrum vulgare European Privet ** •Lonicera sp. Honeysuckle •Lonicera tatarica Tartarian Honeysuckle ** • • •Magnolia acuminata Cucumber Tree •Malus (most) Crab Apple ** • • •Malus coronaria Wild Crabapple • •Malus pumila Common Apple ** •Morus alba White Mulberry ** • • •Ostrya virginiana Hop Hornbeam • • •Picea abies Norway Spruce ** • • •Picea glauca White Spruce • •Picea pungens Blue Spruce ** • • • •Pinus nigra Black Pine ** • •Pinus resinosa Red Pine • • •Pinus strobus White Pine • •
Appendix E. Species Observed by Land Use Type

85
Genus speciesGenus species Common NameCommon Name NNNN AGRAGR COMCOM INDIND INSINS LDRLDR MDRMDR NANAPinus sylvestris Scotch Pine ** • • •Platanus occidentalis Sycamore •Platanus x acerifolia London Plane-tree ** • • •Populus alba White Poplar ** •Populus deltoides Eastern Cottonwood • • • • •Populus grandidentata Large-tooth Aspen • •Populus tremuloides Trembling Aspen • • • • •Prunus (varieties) Oranmental Cherry ** • •Prunus avium Sweet Cherry ** •Prunus serotina Black Cherry • • •Prunus virginiana Choke Cherry •Pyrus communis Common Pear ** •Quercus alba White Oak • •Quercus macrocarpa Bur Oak • • •Quercus palustris Pin Oak •Quercus robur English Oak ** •Quercus rubra Red Oak • • •Quercus velutina Black Oak •Rhamnus cathartica European Buckthorn ** • • • • • •Rhamnus frangula Glossy Buckthorn ** • •Rhus aromatica Fragrant Sumac •Rhus typhina Staghorn Sumac • •Robinia pseudo-acacia Black Locust ** • •Rosa sp. Rose •Salix alba White Willow ** •Salix discolor Pussy Willow •Salix exigua Sandbar Willow •Salix fragilis Crack Willow ** •Salix nigra Black Willow •Salix sp. Willow • • •Sassafras albidum Sassafras •Sorbus americana American Mountain-ash •Sorbus aucuparia European Mountain-ash ** •Staphylea trifolia American Bladdernut •Syringa reticulata Japanese Tree Lilac ** •Syringa vulgaris Lilac ** • •Taxus canadensis Canadian Yew •Thuja occidentalis Eastern White Cedar • • • • •Tilia americana American Basswood • • •Tilia cordata Little-leaf Linden ** • • •Tsuga canadensis Eastern Hemlock •Ulmus americana American Elm • • • • •Ulmus parvifolia Lacebark Elm ** • •Ulmus pumila Siberian Elm ** • •Viburnum acerifolium Maple-leaved Viburnum •Viburnum lantanoides Hobblebush •Viburnum lentago Nannyberry • •Zelkova serrata Japanese Zelkova ** • •
Other species ** • • •Atlantic white cedar ** • •Campomanesia ** •English yew ** •Japanese yew ** •Mourning cypress •Rhaphiolepis ** •Rose-of-sharon •Star magnolia ** •White fir ** •Wisteria •
Genus species and Common Name follow Newmaster 1998.
NN Non-native; AGR Agricultural; COM Commercial; IND Industrial; INS Institutional; LDR LowDensity Residential; MDR Medium / High Density Residential;NA Natural Area / Open Space

86
APPENDIX FLeaf Cover by Ward

87
Leaf Cover by Subwatershed

88
APPENDIX GComparison of UFORE Outcomes from Cities in North America
Leaf Cover TreesCarbonStorage
Net CarbonSequestration
CO2Removed
PollutantsRemoval
PollutionValue
City % n $ CDN
Southern Great Lakes Forest EcoregionOakville, ON 29.1 1,908,000 133,000 6,000 21,960 172 1,776,000London, ON 24.7 4,376,000 360,000 12,500 45,750 408 4,943,000
Syracuse, NY 23.1 876,000 157,000 4,900 17,934 99 1,045,000Toronto, Canada 19.9 10,220,000 1,108,000 46,700 170,922 1,646 18,523,000Philadelphia, PA 15.7 2,113,000 481,000 14,600 53,436 522 5,188,000
Atlantic SeabordFreehold, NJ 34.4 48,000 18,000 500 1,830 20 203,000
Woodbridge, NJ 29.5 986,000 145,000 5,000 18,300 191 1,906,000Washington, DC 28.6 1,928,000 477,000 14,700 53,802 379 3,573,000Moorestown, NJ 28.0 583,000 106,000 3,400 12,444 107 1,051,000
Boston, MA 22.3 1,183,000 290,000 9,500 34,770 257 2,615,000Baltimore, MD 21.0 2,627,000 542,000 14,700 53,802 390 3,904,000New York, NY 20.9 5,212,000 1,225,000 38,400 140,544 1,521 14,793,000
Jersey City, NJ 11.5 136,000 19,000 800 2,928 37 365,000Southern Hardwoods
Atlanta, GA 36.7 9,415,000 1,220,000 42,100 154,086 1,509 15,266,000Morgantown, WV 35.5 658,000 84,000 2,600 9,516 65 606,000
Interior ContinentalMinneapolis, MN 26.4 979,000 227,000 8,100 29,646 277 2,803,000
Casper, WY 8.9 123,000 34,000 1,100 4,026 34 344,000Calgary, AB 7.2 11,889,000 404,000 19,400 71,004 296 2,946,000
Pacific SeabordSan Francisco, CA 11.9 668,000 176,000 4,600 16,836 128 1,273,000
tonnes per year

89

90
APPENDIX HSpecies Recommended for Planting in London
Stature
Genus species1 Common Name GAR2a SAT2b Shape Height (m) Width (m) Height (m) Width (m)Small
Carpinus caroliniana Blue Beech Green Spreading Rounded 4 5 7 6Cercis canadensis Redbud Amber Round 5 8 10 10Cornus alternifolia Alternate-leaf Dogwood Green Spreading Rounded 6 3 8 6Cornus florida Flowering Dogwood Green Round 5 5 10 6Malus coronaria Wild Crabapple Green Round 8 5 8 8Prunus americana American Plum Green Horizontal 5 3 10 10Prunus nigra Canada Plum Green Round 5 4 9 6
MediumAcer negundo Box Elder Green Oval 6 8 12 12Acer x freemanii Hybrid Soft Maple Amber Round 6 12 15 15Juniperus virginiana Eastern Red Cedar Green • Columnar 4 4 15 6Ostrya virginiana Hop Hornbeam Green Round 4 7 13 12Quercus muhlenbergii Chinquapin Oak Green Spreading Rounded 7 9 18 15Thuja occidentalis Eastern White Cedar Green Conical 11 3 18 6Tilia cordata Little-leaf Linden Amber Round 8 7 15 10
LargeAcer rubrum Red Maple Green • Round 6 12 21 18Acer saccharinum Silver Maple Green • Upright Oval 8 10 19 18Acer saccharum ssp.nigrum Black Maple Green Oval 5 14 25 15Acer saccharum ssp.saccharum Sugar Maple Green • Upright Oval 5 14 30 18Celtis occidentalis Hackberry Green • Spreading Rounded 7 12 25 18Gymnocladus dioicus Kentucky Coffee-tree Green Round 4 9 20 17Juglans nigra Black Walnut Green • Oval 11 15 25 23Larix laricina Tamarack Green Pyramidal 8 5 25 7Liriodendron tulipifera Tulip Tree Green • Oval 13 9 30 17Picea glauca White Spruce Amber Pyramidal 3 6 20 6Pinus strobus White Pine Green • Pyramidal 3 6 30 12Platanus occidentalis Sycamore Green Spreading Rounded 5 15 24 25Populus deltoides Eastern Cottonwood Green Round 7 18 30 25Populus tremuloides Trembling Aspen Green • Pyramidal 9 10 20 17Prunus serotina Black Cherry Green Round 7 11 30 15Quercus alba White Oak Green Round 5 15 25 20Quercus bicolor Swamp White Oak Green Round 6 7 22 17Quercus macrocarpa Bur Oak Green Oval 6 7 30 15Quercus palustris Pin Oak Amber • Pyramidal 5 8 22 13Quercus rubra Red Oak Green • Round 5 14 25 20Tilia americana American Basswood Green • Oval 8 9 25 13Ulmus americana American Elm Green Round 8 15 30 25
10 Years3 MaturityChoice
GREEN = BEST CHOICES
AMBER = USE WITH CAUTION
RED = AVOIDThese are non-native species that have become problem weeds in southwestern Ontario. They grow fast and reproduce prolifically. When they escape into the wild they compete with native species anddisrupt local ecosystems. They trees should not be planted under any circumstances and should be removed were possible to prevent further invasion.
Note: (1) List developed from i-Tree Species Selector (USDA 2008) and City of London Ecologist (BMB) and Urban Forester (IL).
(2a) GAR = Green, Amber Red Choices (ReForest London 2005); (2b) SAT = Suitable Ash Tree Replacement (Giroux 2005).
(3) Sources for dimensions: Blouin 2001, Giroux 2005, Kock 2008, Waldron 2003.
These trees are native to southwestern Ontario and grow naturally in the London area. They are adapted to the local climate, and are hardier and easier to maintain than non-native species. Some havequite specific soil and moisture requirements and may not do well in all sites, so check their requirements before you buy them.
These species do not grow naturally in the London area. Some of them are native to Ontario. Those in grey are non-native species that are not likely to become problem weeds. These trees may be usedin landscaping projects, but should not be used for naturalization projects.
1 2 3 4 5 6 7
1 pyramidal2 conical3 columnar4 spreading5 vase shaped6 broad7 rounded
Tree shapes


Andy Kenney, University of Toronto
When it comes to trees,size matters.
Related Documents


