
Welcome message from author
This document is posted to help you gain knowledge. Please leave a comment to let me know what you think about it! Share it to your friends and learn new things together.
Transcript


Pacific Basin 2
US$million 1H 2021 1H 2020
EBITDA 244.6 79.2
Underlying (loss) / profit 150.4 (26.6)
Net profit 160.1 (222.4)
US$million 30 June 2021 31 Dec 2020
Available liquidity 417.1 362.5
Net gearing 31% 37%
P&L
B/S
Significant increase in rates and monthly results in the first half with an underlying result in
June of US$53 million, the highest in the company’s history (thanks to our large core fleet)
Vessel values are going up but significant upside remains, especially for good quality second-
hand ships like Pacific Basin’s
Return on equity 28%, total shareholder return of 114%, recommended interim dividend of
HK 14 cents
Our Best Half-Year Result in 13 Years

Pacific Basin
BHSI 38,000 dwt (tonnage adjusted)
* Excludes 5% commission
3
Exceptionally Strong 2021 Market
Source: Baltic Exchange
BSI 58,000 dwt
0
5,000
10,000
15,000
20,000
25,000
30,000
35,000
Jan Feb Mar Apr May Jun Jul Aug Sep Oct Nov Dec
Handysize Market Spot Rates
US$/day net*
27 July 2021
$26,720
0
5,000
10,000
15,000
20,000
25,000
30,000
35,000
Jan Feb Mar Apr May Jun Jul Aug Sep Oct Nov Dec
Supramax Market Spot Rates
US$/day net*
27 July 2021
$30,230

Pacific Basin
0
5,000
10,000
15,000
20,000
25,000
30,000
35,000
40,000
45,000
06 07 08 09 10 11 12 13 14 15 16 17 18 19 20 1Q212Q21 Spot
0
5,000
10,000
15,000
20,000
25,000
30,000
35,000
40,000
45,000
06 07 08 09 10 11 12 13 14 15 16 17 18 19 20 1Q212Q21 Spot
4
Handysize Market TCE Rates* Supramax Market TCE Rates#
* Handysize BHSI 28k dwt until end 2017, BHSI 38k dwt tonnage adjusted since 2018
# Supramax BSI 52k dwt until July 2015, BSI 58k dwt since Aug 2015
US$/day netUS$/day net
Market TCE Rates Now Well Above 2010 Levels

Pacific Basin
26,410
33,190*
-
4,000
8,000
12,000
16,000
20,000
24,000
28,000
32,000
36,000
Jan Feb Mar Apr May Jun Jul + Aug
Indicative Core Fleet P&L Breakeven Level incl G&A for 1H21 = US$10,170
94%
of
days19,960
22,000*
-
4,000
8,000
12,000
16,000
20,000
24,000
28,000
32,000
36,000
Jan Feb Mar Apr May Jun Jul + Aug
Indicative Core Fleet P&L Breakeven Level incl G&A for 1H21 = US$8,630
Our results are driven by our larger core fleet with substantially fixed costs, and increased proportion of Supramax
vessels in our fleet which benefit from larger upside in strong markets
Our monthly TCE rate continue to improve
Increasing market freight rates
One to three month lag between fixing and execution of voyages
The gradual expiry of lower paying cargo contracts
Our stronger second quarter operating activity performance5
Handysize Core Business TCE Supramax Core Business TCE
*Indicative only, voyages are still in progress
US$/day net US$/day net
91%
of
days
The Positive TCE Trend Continues
Pacific Basin 6
Source: Indicative data and material from AXS Marine, all rights reserved
Data is subject to revision
Note: Percentage changes are year-on-year comparisons
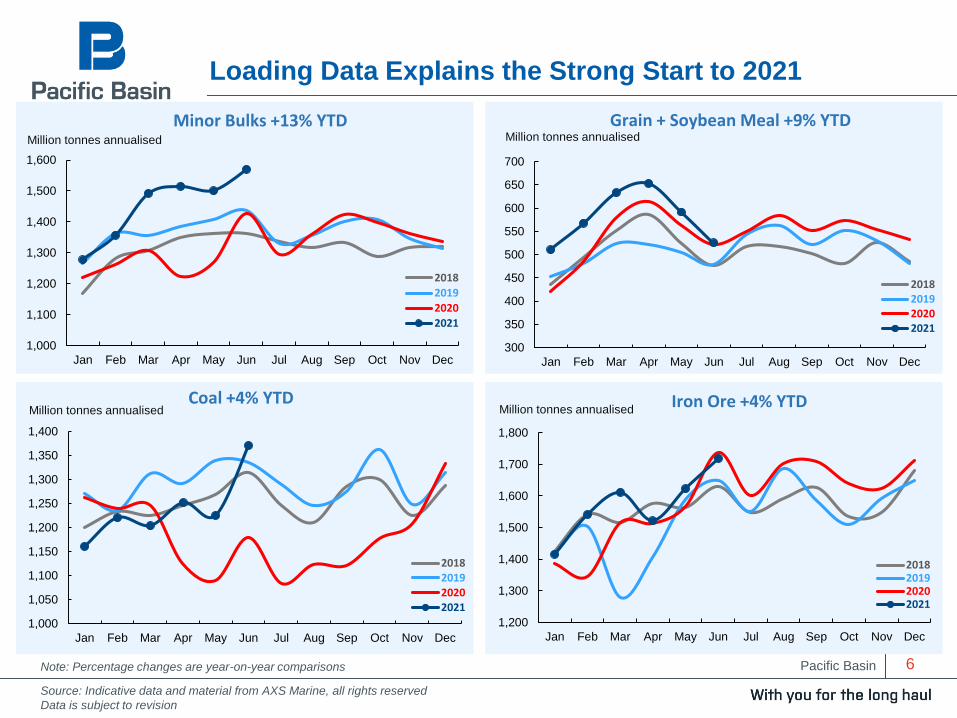
Loading Data Explains the Strong Start to 2021
1,200
1,300
1,400
1,500
1,600
1,700
1,800
Jan Feb Mar Apr May Jun Jul Aug Sep Oct Nov Dec
2018201920202021
Iron Ore +4% YTDMillion tonnes annualised
1,000
1,100
1,200
1,300
1,400
1,500
1,600
Jan Feb Mar Apr May Jun Jul Aug Sep Oct Nov Dec
2018
2019
2020
2021
Minor Bulks +13% YTDMillion tonnes annualised
300
350
400
450
500
550
600
650
700
Jan Feb Mar Apr May Jun Jul Aug Sep Oct Nov Dec
2018201920202021
Grain + Soybean Meal +9% YTDMillion tonnes annualised
1,000
1,050
1,100
1,150
1,200
1,250
1,300
1,350
1,400
Jan Feb Mar Apr May Jun Jul Aug Sep Oct Nov Dec
2018201920202021
Coal +4% YTDMillion tonnes annualised

Pacific Basin 7
Demand Fundamentals Have Driven the Market
Core Market Drivers
Continued strong Chinese demand for dry bulk imports (except coal) with 2Q21 seeing stronger growth to non-Chinese destinations
Global grain loadings in 1H21 were 9% higher than the same period last year, benefiting from record high US soybean exports in the 4Q20
continuing into 2021, as well as significant corn exports to China which is a new and very encouraging trend. Other grain drivers were record
high South American exports in 2Q21 and Australian grain exports seeing very strong volumes and continuing longer than usual
Minor bulk loadings are up 13% year to date with strong Chinese import growth in 1H21, while minor bulk volumes to non-Chinese
destinations picked up pace in the second quarter
Coal loadings have recovered following the pandemic induced weakness particularly due to strong Indian demand countering Chinese
weakness. Global coal loading volumes are now about 12% higher than in the summer of 2020 and close to prior year levels
US dry bulk imports, mostly carried by handysize and supramax tonnage, have seen strong 16% growth so far in 2021 and accelerating
further in the second quarter
Temporary Market Drivers
Trade friction between Australia and China also benefited the dry bulk market with large ships carrying Australian coal stuck at Chinese
ports. This has resulted in China requiring imports from further afield, while Australian coal moved elsewhere in smaller vessels
Exceptionally high container rates making it economical for shippers to shift some cargoes such as steel, logs and break bulk from
containers to dry bulk ships (there is no indication of this stopping) marginally helping dry bulk demand
Covid restrictions are marginally reducing dry bulk fleet efficiency and thereby restricting supply which has added to upward pressure on
vessel earnings
Future Market Drivers
As the South American grain season winds down, Black Sea exports will commence followed by Europe and then later in the year US
shipments will begin
For the remainder of 2021 and 2022 GDP growth forecasts are revised up and we expect the market to be supported by significant
economic stimulus including infrastructure projects and the roll-out of vaccines

Pacific Basin 8
Source: Clarksons Research, data as at July 2021
4.0%3.8%
3.3%
1.4%
-2%
-1%
0%
1%
2%
3%
4%
5%
6%
2019 2020 2021F 2022F
% of Total Fleet
Overall Dry Bulk Supply Development
3.2%
2.9% 2.8%
1.6%
-2%
-1%
0%
1%
2%
3%
4%
5%
6%
2019 2020 2021F 2022F
% of Total Fleet
Handysize / Supramax Supply Development
Scrapping Forecast Scheduled Orderbook
Scrapping (dwt) New deliveries (dwt)
Net Fleet Growth
Net Fleet Growth Well Below 2% in 2022

Pacific Basin 9
All Time Low Dry Bulk Orderbook
23.5%
21.3%
17.8%
8.6%
6.2%5.6%
2.7%
0%
5%
10%
15%
20%
25%
LNG LPG Container Crude Product Dry Bulk Handysize
Source: Clarksons Research
Higher probability of sustained stronger
rates in dry bulk

Pacific Basin
While strong freight rates have historically lead to increased new ordering, we believe
that dry bulk supply growth can remain at moderate levels
Decarbonisation rules result in uncertainty and shorter expected economic lives for
newbuildings with conventional fuel oil engines
The time between ordering and delivering current technology ships is two to three
years, further increasing technical and economic uncertainty
It will be several more years before new technology ships become commercially
viable and the requisite fueling infrastructure is built out globally
Lower priced second-hand ships with prompt delivery in today’s strong market
represent a more attractive investment
IMO rules will force slower speeds from 2023
10
Why Supply is Likely to Remain Moderate

Pacific Basin 11
New Rules Leading to Lower Speeds from 2023
New Regulation Requirement & Timing Impact on the Industry
EEXIEnergy Efficiency Existing Ship Index
Technical design criteria
Vessels maximum engine power will
be capped
Implemented at the annual survey
2023
Marginal impact on PB ships
Larger impact on poorly designed
vessels
CIICarbon Intensity Index
Operational criteria
Vessels will be rated A – E based on
actual fuel consumption and distance
travelled
2023 will be first year of measurement
and 2024 first year of ratings
To retain same rating 2024 – 2026 2%
per year improvement required
Vessels rated D – E will need to
submit plans for improvement
Will have larger impact than EEXI and
will reduce speeds
EU ETSEuropean Union Emissions Trading
System
EU has announced intention to
include shipping in the European
Union Emissions Trading System (EU
ETS) effective 2023
May drive higher pace of
decarbonisation
Adopted in June 2021, IMO rules will require existing ships to combine technical and operational measures
to meet IMO’s 2030 GHG reduction targets
In July 2021 EU announced a number of environmental regulations affecting shipping

Pacific Basin
0
10
20
30
40
50
60
70
80
05 06 07 08 09 10 11 12 13 14 15 16 17 18 19 20 21
US$ Million
Newbuilding (62,000 dwt): US$30.5m
Second-hand 5-year old benchmark (58,000 dwt): US$24.6m
0
10
20
30
40
50
60
05 06 07 08 09 10 11 12 13 14 15 16 17 18 19 20 21
US$ Million
Second-hand 5-year old benchmark (37,000 dwt): US$22.0m
Newbuilding (38,000 dwt): US$27.3m
12
Source: Clarksons Research and Baltic Exchange, data as at July 2021
Handysize Vessel Values Supramax Vessel Values
Second-hand values are still well below both newbuild prices and the levels of 2010
Improved Rates Support Vessel Values

Pacific Basin 13
Current Handysize Values and Earnings vs 2010
Newbuilding Second-hand
Contract Resale 5 YO 10 YO 15 YO
Value end 2010 (US$m) 26.5 30.0 25.0 21.5 15.0Value now (US$m) 27.3 28.0 22.0 14.8 9.0
Upside to 2010 value -3% 7% 14% 45% 67%
Years of EBITDA to scrap 3.2 2.6 1.9 1.3
Approx 1 year TC Rate/day (US$) 28,000 26,000 23,000 18,000
EBITDA*/year (US$m) 7.8 7.0 6.0 4.2EBITDA/value 28% 32% 40% 47%
Note that the scrap value of a typical Handysize vessel today is around US$3.5 million
*Cash cost assumed to be about US$6,000 per day (Opex, dry-dock and G&A)

Pacific Basin 14
Current Supramax Values and Earnings vs 2010
Newbuilding Second-hand
Contract Resale 5 YO 10 YO 15 YO
Value end 2010 (US$m) 31.0 37.0 29.0 24.0 19.0Value now (US$m) 30.5 33.5 27.5 19.0 13.8
Upside to 2010 value 2% 10% 5% 26% 38%
Years of EBITDA to scrap 3.3 2.8 1.9 1.5
Approx 1 year TC Rate/day (US$) 30,000 28,000 26,000 22,000
EBITDA*/year (US$m) 8.5 7.8 7.0 5.6EBITDA/value 25% 28% 37% 41%
Note that the scrap value of a typical Supramax vessel today is around US$5.5 million
*Cash cost assumed to be about US$6,000 per day (Opex, dry-dock and G&A)

Pacific Basin 15
DWT Year Built Delivered
61,115 2015 Feb-2021
61,593 2015 Mar-2021
61,587 2015 Apr-2021
38,190 2014 Apr-2021
61,105 2015 May-2021
61,684 2011 May-2021
Not Previously Announced
38,309 2011 July-2021
61,484 2010 Q4-2021
We also sold four smaller older 28k dwt vessels that delivered to the new owners during the first half
of the year
We Continue to Buy Ships in Line With Our Strategy

Pacific Basin 16
5.0*
0.0
0.5
1.0
1.5
2.0
2.5
3.0
3.5
4.0
4.5
5.0
2012 2013 2014 2015 2016 2017 2018 2019 2020 2021
Significant Growth of Overall Fleet and SupramaxProportion
Supramax Handysize
Million dwt
Owned fleet has expanded from 34 to 119 ships
Good quality, predominantly Japanese built vessels with competitive and substantially fixed costs
Larger Supramax and Ultramax proportion with larger earnings upside in strong markets
The market outlook is positive and we are well positioned to take advantage
This is what our teams both ashore and on board have worked so hard to set ourselves up for
*As at 30 June 2021
Significant Leverage from Our Larger Owned Fleet


Pacific Basin 18
Our Best Half-Year Result in 13 Years
US$160.1 million net profit and US$244.6 million EBITDA
28% return on equity (annualised)
US$203.9 million operating cash flow1 driving a strengthening of the balance
sheet: net borrowings to NBV of owned vessels at 31% and US$417.1 million
available liquidity
HK 14 cents per share interim dividend corresponding to US$86.8 million
1 Inclusive of all long and short term charterhire payments

Pacific Basin 19
Revenue 1,142.0
Voyage expenses (429.8)
Time-charter equivalent ("TCE") earnings 712.2
Owned vessel costs (163.2)
Charter costs (363.9)
Operating performance before overheads 185.1
Adjusted total G&A overheads (34.1)
Taxation & others (0.6)
Underlying profit/(loss) 150.4
Derivatives M2M and one-off items 9.7
Profit/(loss) attributable to shareholders 160.1
Opex (90.3)
Depreciation (57.9)
Finance (15.0)
Derivative M2M 6.9 (4.0)
Closed-out gains on fuel - 7.4
price spread hedge
1H21
1H21 1H20
1H21US$m
Owned vessel costs
Derivatives M2M and one-off items
EBITDA 244.6
681.5
(351.6)
329.9
(166.3)
(160.0)
3.6
(30.0)
(0.2)
(26.6)
(195.8)
(222.4)
1H20
79.2
(83.2)
(66.7)
(16.4)
1H20
Charter costs
Non-capitalised (348.4) (142.6)
1H21 1H20
Capitalised (15.5) (17.4)
Reversal of/(provision for) 3.7 (198.2)
vessel impairment
Disposal gain/(loss) of 1.1 (1.0)
vessels
Provisions (2.0) -
Financial Results

Pacific Basin 20
Core TCE earnings (US$/day)
Core Revenue days (days)
14,380
7,660
Handysize contribution (US$m)
16,030
Supramax contribution (US$m)
Underlying profit/(loss) (US$m)
Adjusted G&A overheads and tax (US$m)
Core TCE earnings (US$/day)
Core Revenue days (days)
Post-Panamax contribution (US$m)
Handysize and Supramax Contribution
Operating Activity contribution (US$m)
1H201H21
(16.0)105.2
150.4 (26.6)
16,980
7,190
7,920
65.9 5.0
9,200
18,260
6,950
9,980
8,960
7,360
(34.7) (30.2)
2.1 2.1
11.9 12.5
Core Owned + LT chartered costs (blended) (US$/day)
Core Owned + LT chartered costs (blended) (US$/day)

Pacific Basin
4,100 4,330
2,620 2,360
660 580
10,020 9,980
7,780 7,660
-
2,000
4,000
6,000
8,000
10,000
12,000
Owned Long-TermChartered
Blended Owned Long-TermChartered
Blended
21
Handysize – Costs Well Controlled and Slightly Lower
Finance Cost
Depreciation
Opex
No. of Ships as at 30 June 2021: 76 12 88
US$/day
Costs FY20
7,270
Costs 1H21
*Indicative Core Fleet P&L Breakeven Level incl G&A = US$7,660 + US$970 (Owned G&A) = US$8,630/day
7,380
G&A per day in 1H21 was US$970 for our owned ships and US$520 for our chartered in ships
Including G&A our core business blended Handysize costs reduced by US$90 per day to US$8,630*

Pacific Basin
4,160 4,420
3,590 3,550
1,070 990
11,920 11,420
9,180 9,200
-
2,000
4,000
6,000
8,000
10,000
12,000
14,000
Owned Long-TermChartered
Blended Owned Long-TermChartered
Blended
22
40 4 44
Costs FY20 Costs 1H21
No. of Ships as at 30 June 2021:
Finance Cost
Depreciation
Opex
*Indicative Core Fleet P&L Breakeven Level incl G&A = US$9,200 + US$970 (Owned G&A) = US$10,170/day
8,9608,820
G&A per day in 1H21 was US$970 for our owned ships and US$520 for our chartered in ships
Including G&A our core business blended Supramax costs increased by US$50 per day to US$10,170*
US$/day
Supramax – Well Controlled

Pacific Basin
Cash Inflow and Outflow in 1H2021
23
Operating cash inflow was US$203.9
million, inclusive of all long and short-term
charter hire payments. This compares
with US$77.5 million in the first half 2020
and US$181.5 million in the full year 2020
Proceeds from sale of 4 Handysize
vessels
Borrowings decreased due to net
repayments of US$143.9 million partly
offset by the draw down of US$45.0
million on new committed facilities
Capex was US$114.6 million of which we
paid US$96.4 million for four second-
hand Ultramaxes that we committed to
purchase in November 2020, and one
additional second-hand Ultramax and one
second-hand Handysize and US$18.2
million for dry dockings and BWTS
1
2
3
4
The information on this slide is presented before the adjustments
required by HKFRS16 ‘‘Leases’’
4321

Pacific Basin 24
Vessels & other fixed assets
Total assets
Total liabilities
Total Equity
Net borrowings to net book
value of owned vessels
Total borrowings
US$m 1H21
Net borrowings
1,711
2,300
1,071
31%
767
540
1,229
2020
1,665
2,190
1,125
37%
864
629
1,065
Balance Sheet Summary Strong operating cash flow has driven a
reduction in net borrowings to NBV of
owned vessels to 31% and an increase in
available liquidity to US$417.1 million
Capital allocation priorities
1) De-lever balance sheet in line with
amortisation profile – careful about
new leverage at these vessel
values
2) Maintain strong available liquidity
position (underpin unsecured
funding and dry powder for future
investments)
3) Shareholder distribution in line with
stated policy
Available liquidity 417.1 362.5
Strengthening Balance Sheet and Available Liquidity


Pacific Basin
Introduction to Our New CEO / Martin Fruergaard
26
53 years old, Danish
2015 – 2021 CEO for Ultragas (fully integrated owner of
gas carriers)
1989 – 2015 Various leadership positions within Maersk,
incl. 10 years at Maersk Bulk
Various board seats, including six years on the board of
Danish Shipping

Pacific Basin 27
Stay specialised in minor bulk and therefore focused on Handysize and Supramax (incl. Ultramax)
Remain customer and cargo focused
Remain asset heavy in our Core Business
Continue to selectively acquire quality second-hand ships in a disciplined way
Leverage our core business with mainly short-term chartered ships (Operating Activity)
Divest older ships when timing is right
Keep our balance sheet and liquidity strong
Remain cost competitive
Keep ship management in-house
Constantly strive to improve our safety performance
Take a practical but ambitious approach to decarbonisation
Strategy Remains Unchanged

Pacific Basin 28
Supporting our teams to ensure we continue to deliver a quality service to our customers while maximising
our earnings in the current strong upturn
Supporting our customers’ longer term cargo contract requirements
Ensuring our vessels continue to operate safely and efficiently despite continued crew-change restrictions
and complications during the Covid pandemic
Enhanced focus on optimising our environmental performance to ensure we meet or exceed the carbon-
efficiency compliance requirements of IMO 2030, etc.
Continue to participate in various industry networks to develop and ultimately adopt a zero-emission solution
to meet IMO’s 2050 GHG reduction goal
Further leverage the increasing amount of in-house data to improve our operational efficiency, cost and
environmental performance, and ultimately to deliver additional value to our customers
Continue to develop and empower our customer-focused organisation as well as our centralised support
functions and systems
With Special Focus on

Pacific Basin 29
• Vaccine and economic
stimulus expected to
lead demand recovery
• IMF forecast global
growth of 6.0% in 2021
• Clarkson Research
expects 4.3% minor
bulk demand growth in
2021
Healthy Demand OutlookFavourable Supply
Fundamentals
Pacific Basin Operating
Leverage
• Dry bulk order book at
5.6% (lowest in
modern time)
• Handy/Supra expected
fleet growth of 2.8% in
2021 and lower in 2022
• Environmental
regulations
discouraging new
ordering
• Regulation will lead to
lower speeds
• Large owned fleet with
fixed costs including
increasing Supramax
proportion means
significant leverage
• Competitive costs and
track record of strong
TCE performance
• Strong balance sheet
allowing strategically
timed investment
We are Well Positioned for the Future
* Based on current fleet and commitments, and all other things equal

Pacific Basin
Disclaimer
This presentation contains certain forward looking statements with respect to the financial condition,
results of operations and business of Pacific Basin and certain plans and objectives of the management of
Pacific Basin.
Such forward looking statements involve known and unknown risks, uncertainties and other factors which
may cause the actual results or performance of Pacific Basin to be materially different from any future
results or performance expressed or implied by such forward looking statements. Such forward looking
statements are based on numerous assumptions regarding Pacific Basin's present and future business
strategies and the political and economic environment in which Pacific Basin will operate in the future.
Our Communication Channels:
Financial Reporting Annual (PDF & Online) & Interim Reports
Quarterly trading updates
Press releases on business activities
Shareholder Meetings and Hotlines Analysts Day & IR Perception Study
Sell-side conferences
Investor/analyst calls and enquiries
Contact IR – Peter Budd
E-mail: [email protected]
Tel : +852 2233 7032
Company Website - www.pacificbasin.com Corporate Information
CG, Risk Management and CSR
Fleet Profile and Download
Investor Relations:
financial reports, news & announcements, excel
download, awards, media interviews, stock quotes,
dividend history, corporate calendar and glossary
Social Media Communications Follow us on Facebook, Twitter, Linkedin,
YouTube and WeChat!
30

Pacific Basin 31
Appendix:
Understanding Our Core Market

Pacific Basin
www.pacificbasin.com
Pacific Basin business principles
and our Corporate Video
Appendix:
Pacific Basin Overview
We operate the world’s largest fleet of interchangeable high-quality Handysize and Supramaxships, equipping us for efficient trading and reliable service any time and anywhere
Cargo system business model – consistently outperforming market rates
Own 119* Handysize and Supramax vessels, with 264 owned and chartered ships on the water serving major industrial customers around the world
Hong Kong headquartered and HKEx listed, 13 offices worldwide, 360+ shore-based staff, 4,300+ seafarers
Strong balance sheet with US$417.1 million available liquidity as of 30 June 2021
Our vision is to be the leading ship owner/operator in dry bulk shipping, and the first choice partner for customers and other stakeholders
32
* Owned fleet as at 30 June 2021

Pacific Basin
COMPREHENSIVE GLOBAL
OFFICE NETWORK
Integrated international service enhanced by
experienced commercial and technical staff
around the world
Being local facilitates clear understanding of and
response to customers’ needs and first-rate
personalised service
Being global facilitates comprehensive market
intelligence and cargo opportunities, and optimal
trading and positioning of our fleet
LARGE FLEET &
MODERN VERSATILE SHIPS
Fleet scale and interchangeable high-quality ships
facilitate service flexibility for customers, optimised
scheduling and maximised vessel and fleet
utilisation
In-house technical operations facilitate enhanced
health & safety, quality and cost control, and
enhanced service reliability and seamless
integrated service and support for
customers
STRONG CORPORATE &
FINANCIAL PROFILE
Striving for best-in-class internal and external
reporting, transparency and corporate stewardship
Strong cash position and track record set us apart as
a preferred counterparty
Hong Kong listing, scale and balance sheet facilitate
access to capital
Responsible observance of stakeholder interests
and commitment to sustainability and good
corporate governance33
MARKET-LEADING
CUSTOMER FOCUS & SERVICE
Priority to build and sustain long-term customer
relationships
Solution-driven approach ensures accessibility,
responsiveness and flexibility for customers
Close partnership with customers generates
enhanced access to spot cargoes and long-
term cargo contract opportunities of mutual
benefit
Delivering TCE earnings that outperform the market
Delivering long-term shareholder value with attractive returns over the shipping cycle
Appendix:
Strategic Model

Pacific Basin 34
Our People
12 local dry
bulk offices
24/7
support
Close to you
Modern quality
ships with the
best-in-class design
Our Fleet
Managed In-house
and Highly Versatile
Low breakeven
cost and
fuel efficient
Trusted and
transparent
Our Record
Strong public
balance sheet and
track record
Award winning
CSR policy and
environmental focus
Appendix:
Business Foundation

Pacific Basin
Appendix:
Diversified Cargo Mix
Diverse range of commodities reduces product risk
China and North America are our largest markets
35

Pacific Basin 36
119Vessels
owned1
16LT
Chartered
129ST
Chartered
264Total
Appendix:
Pacific Basin Current Fleet
135Total

Pacific Basin 37
Core Business Operating Activity
Contract and spot cargoes Spot cargoes
Owned and long-term chartered ships
Short-term ships carrying contract cargoesShort-term ships carrying spot cargoes
Costs largely fixed and disclosed Costs fluctuate with freight market
Key KPI = TCE per day Key KPI = Margin per day
Significant leverage and profits in strong market Can generate profits also in weak markets
Asset heavy – predominantly our own crews /
quality / safety
Asset light – third party crews / quality / safety
(harder to control quality)
Enables reliability, cargo contracts, brand name Enhances and expands the service to our customers
Currently about 80%-85% of total vessel days Currently about 15%-20% of total vessel days
Appendix:
Our Two Main Activities

Pacific Basin 38
Our “core business” is to optimally combine our owned and long-term chartered ships with multi-shipment contract
cargos and spot cargoes to achieve the highest daily TCE earnings. Our core business also uses short-term
chartered ships to carry contract cargoes to maximise the utilisation and TCE of our owned and long-term chartered
ships. The positive (or negative) result on these short-term chartered ships is added to the TCE achieved on our
owned and long-term chartered ships.
We now also disclose the margin per day generated by our “operating activity” which is separate and
complementary to our core business. Through our operating activity, we provide a service to our customers even if
our core ships are unavailable by matching our customers’ spot cargoes with short-term chartered ships, making a
margin and contributing to our group results regardless of whether the market is weak or strong.
For our core business, daily TCE revenue is the important KPI, as costs per day are substantially fixed and disclosed.
For our operating activity, short-term charter costs fluctuate with the freight market and therefore the important KPI is
the margin per day (the net daily difference between TCE revenue and charter costs), not the TCE level itself.
Owned + Long-Term Chartered TCE Revenue +
Short-Term Chartered (excluding Operating) Result
Owned + Long-Term Chartered Revenue Days
Operating Result
Operating Days
Deriving our Core Business Daily TCE Deriving our Operating Activity Daily Margin
Appendix:
New TCE Reporting Methodology

Pacific Basin 39
Sensitivity:
+/- US$1,000 daily TCE = US$35-40 million per year
Adjusted for ca. 20-25% typical long-term forward cargo cover at any point in time
1 Note that core TCE includes the margin (positive or negative) from short term ships carrying contract cargoes2 Long-Term Chartered in ships3 Revenue days + offhire days = cost days
Handysize contribution Core TCE1 x owned & LTC 2 revenue days +
Blended cost x owned & LTC cost days 3 -
= X
Supramax contribution +
-
= X
Operating Activity Operating margin x operating days X
Post Panamax contribution X
Total G&A - X
Underlying Result = X
Core TCE1 x owned & LTC revenue days
Blended cost x owned & LTC cost days 3
Appendix:
How to Model Pacific Basin

Pacific Basin 40
Appendix:
Vessel Days and Long-Term Chartered Commitments

Pacific Basin 41
*Please note that our forward cargo cover for the rest of the year is backhaul heavy, meaning that a
significant share of the covered days is made up of lower daily TCE backhaul voyages. When combined
with better earning fronthaul voyages, the overall TCE is typically higher. Hence, a backhaul-heavy forward
cover can underestimate the TCE earnings we will eventually achieve
Please also note that our Supramax forward cargo cover also excludes any scrubber benefit, currently at
about US$1,250 per day.
Appendix:
Forward Cargo Cover

Pacific Basin 42
IMF forecasts global GDP growth of 6.0% for 2021, moderating to 4.9% in 2022
Clarksons Research forecasts minor bulk demand growth of 4.3% and 3.2% in 2021 and 2022,
versus Handysize and Supramax net supply growth of only 2.8% and 1.6% respectively
Source: Clarksons Research
2.9%2.8%
1.6%
-0.9%
4.3%
3.2%
-2%
-1%
0%
1%
2%
3%
4%
5%
6%
2020 2021F 2022F
Minor Bulk Demand and Supply
Net Fleet Growth Tonne-mile demand
% YOY Change
3.8%
3.3%
1.4%
0.5%
4.3%
2.2%
-2%
-1%
0%
1%
2%
3%
4%
5%
6%
2020 2021F 2022F
% YOY Change
Total Dry Bulk Supply and Demand
Net Fleet Growth Overall Dry Bulk Tonne-mile demand
Appendix:
Favourable Demand / Supply Balance

Pacific Basin
1%
1%
1%
6%
5%
5%
5%
5%
3%
3%
3%
3%
3%
2%
2%
1%
1%
-1%
3%
2%
Coal
Iron Ore
Total Major Bulk (Iron Ore + Coal)
Nickel Ore
Baxuite / Alumina
Manganese Ore
Salt
Copper Concentrates
Agribulks
Scrap Steel
Forest Products
Others
Fertiliser
Wheat / Grains
Steel Products
Cement
Soybean
Sugar
PB focus cargo
Total Dry Bulk
5%
4%
4%
8%
6%
6%
5%
5%
5%
4%
4%
3%
3%
3%
2%
1%
0%
-6%
4%
4%
Coal
Iron Ore
Total Major Bulk (Iron Ore + Coal)
Scrap Steel
Forest Products
Nickel Ore
Wheat / Grains
Cement
Salt
Steel Products
Copper Concentrates
Baxuite / Alumina
Others
Manganese Ore
Soybean
Fertiliser
Agribulks
Sugar
PB focus cargo
Total Dry Bulk
43
Source: Clarksons Research
Million Tonnes
PB
Fo
cu
s
2021F Dry Bulk Trade Volumes
YoY Million Tonnes
PB
Fo
cu
s
YoY
2022F Dry Bulk Trade Volumes
(tonne-mile effect = 2.2%)(tonne-mile effect = 4.3%)
97
386
51
365
1221
1557
2778
148
55
370
35
182
271
47
169
63
2598
5376
1237
1568
54
191
2664
57
37
100
397
278
195
373
375
150
171
190
169
2805
5469
62
174
49
Appendix:
Dry Bulk Demand in 2021 and 2022 Forecast

Pacific Basin 44
Handysize(25,000-41,999 dwt)
Supramax (incl. Ultramax) (42,000-64,999 dwt)
Panamax & Post-Panamax (65,000-119,999 dwt)
Capesize (incl VLOC)(120,000+ dwt)
Total Dry Bulk (>10,000 dwt)
2.7% 12 13% 0.4%
6.2% 10 8% 0.2%
6.1% 11 10% 0.2%
5.9% 9 1% 0.8%
5.6% 11 6% 0.5%
ScheduledOrderbook as % of Existing
Fleet
Average Age
Over 20 Years
1H21 Scrapping as% of 1 January 2021
Existing Fleet
Source: Clarksons Research, as at July 2021
Appendix:
Better Supply Fundamentals for Handysize / Supramax

Pacific Basin 45
Continued growth and strong industrial production
and grain consumption in China, driving demand for
dry bulk commodities
Post-pandemic and stimulus-driven recovery in the
US and rest of the world
Slower vessel operating speeds due to emissions
regulations and increased fuel cost
Limited new ship ordering and deliveries due to
decarbonisation regulations and uncertainty over
future vessel designs and alternative fuels, leading
to tighter supply
Increased scrapping of poor quality and poorly
designed tonnage facing onerous environmental
regulations and expensive maintenance and
upgrade costs
Expanding or renewed pandemic containment
measures impacting global economic activity and
the trade in dry bulk commodities
Excessive new ship ordering in dry bulk driving
increased net fleet growth
Slowing Chinese economic growth and reduced
stimulus, impacting dry bulk demand
Tariffs and protectionism driving local production
at the expense of global trade
The marginal benefit that dry bulk demand is
getting from temporary factors such as fleet
inefficiencies and the very strong container market
may reduce
Opportunities Threats
Appendix:
Possible Market Drivers in the Medium Term
Related Documents


