6 Other Electrode and Toroid Devices 6.1 INTRODUCTION Electrode devices have been put to many other uses than those described in Chapter 5, the earliest of these being the measurement of the resistivity of the invaded or flushed zone R xo . Historically, the first use of the invaded-zone resistivity was, in the absence of any other measurement, to make an estimate of the formation porosity. Since then R xo has found many applications. In earlier chapters we saw that R xo , when compared with R t , gives a visual indication of permeable zones and evidence of moved hydrocarbons. In Chapter 5 we saw the need for R xo in obtaining a better estimate of the deep-resistivity R t . R xo can be combined with other information to determine the water saturation of the invaded zone, S xo , and thereby estimate the efficiency of hydrocarbon recovery. S xo can also be a useful indicator of hydrocarbons on its own. Before discussing these applications, we will examine a few of the electrode devices which have been designed to measure R xo . Their development has paralleled the development of laterologs, but with electrodes mounted on pads and applied against the borehole wall. Similar devices have been put to excellent use to measure the size and direction of formation dip and, later, to make detailed images of the resistivity near the borehole wall. These devices will be mentioned in this chapter but their application is primarily geological and beyond the scope of this book. A further use for electrode devices has been on drill collars to provide logs while drilling. It is now possible to record a resistivity as soon as the bit penetrates a formation. Toroids are used instead of electrodes for current generation and focusing. The final electrode device to be considered measures the resistivity through casing. It might be thought impossible to measure resistivity through a material as conductive 125

Welcome message from author
This document is posted to help you gain knowledge. Please leave a comment to let me know what you think about it! Share it to your friends and learn new things together.
Transcript
6Other Electrode and Toroid
Devices
6.1 INTRODUCTION
Electrode devices have been put to many other uses than those described in Chapter 5,the earliest of these being the measurement of the resistivity of the invaded or flushedzone Rxo. Historically, the first use of the invaded-zone resistivity was, in the absenceof any other measurement, to make an estimate of the formation porosity. Sincethen Rxo has found many applications. In earlier chapters we saw that Rxo, whencompared with Rt , gives a visual indication of permeable zones and evidence of movedhydrocarbons. In Chapter 5 we saw the need for Rxo in obtaining a better estimateof the deep-resistivity Rt . Rxo can be combined with other information to determinethe water saturation of the invaded zone, Sxo, and thereby estimate the efficiency ofhydrocarbon recovery. Sxo can also be a useful indicator of hydrocarbons on its own.
Before discussing these applications, we will examine a few of the electrodedevices which have been designed to measure Rxo. Their development has paralleledthe development of laterologs, but with electrodes mounted on pads and appliedagainst the borehole wall. Similar devices have been put to excellent use to measurethe size and direction of formation dip and, later, to make detailed images of theresistivity near the borehole wall. These devices will be mentioned in this chapter buttheir application is primarily geological and beyond the scope of this book.
A further use for electrode devices has been on drill collars to provide logs whiledrilling. It is now possible to record a resistivity as soon as the bit penetrates aformation. Toroids are used instead of electrodes for current generation and focusing.The final electrode device to be considered measures the resistivity through casing. Itmight be thought impossible to measure resistivity through a material as conductive
125

126 6 OTHER ELECTRODE AND TOROID DEVICES
as casing, but this can now be done. Indeed the measurement sees remarkably deepinto the formation.
Electrodes have thus been put to a wide range of use for logging with wireline orwhile drilling. One word of warning: with few exceptions, electrode devices will notwork in nonconductive muds, such as oil-based muds. For such muds, induction andpropagation measurements are needed, as will be seen in Chapters 7–9.
6.2 MICROELECTRODE DEVICES
Microelectrode devices, as their name implies, are electrical logging tools withelectrode spacings on a much-reduced scale compared to the mandrel tools previouslyconsidered. A further distinction, a result of the smaller spacings, is that their depthof investigation is also much reduced. The electrodes are mounted on special devices,called pads, which are kept in contact with the borehole wall while ascending the well.
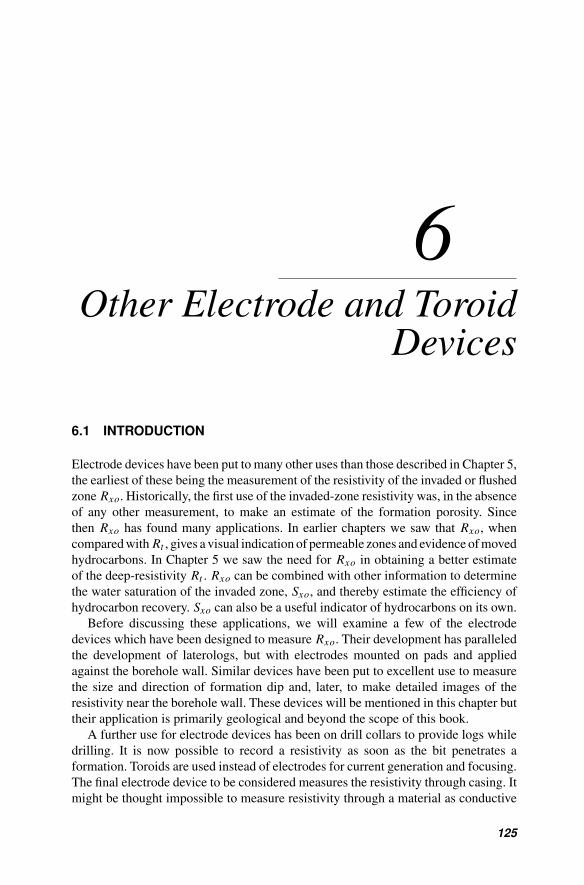
The development of microelectrode devices has undergone the same evolution aselectrode tools. The first was the microlog device (Fig. 6.1), which was an unfocusedmeasurement based on the principle of a normal and a lateral. Current is emittedfrom the button marked A0, and the potentials of the two electrodes M1 and M2 aremeasured. To ensure a shallow depth of investigation, the spacing between electrodes
Mudcake
Formation
Side viewFront view
Rubber pad
Mud
A0
M1
M2
Electrodes
M2o
M1o
A0o
Fig. 6.1 A microlog device: a pad version of the short normal and the lateral. The spacingbetween the electrodes is 1 in. From Serra [1].
MICROELECTRODE DEVICES 127
Insul ating pad
Borehole Fo rm ation
A1 M2
M1
O 1M2
A1
M1 A0M1O 2 M2 A1
A0
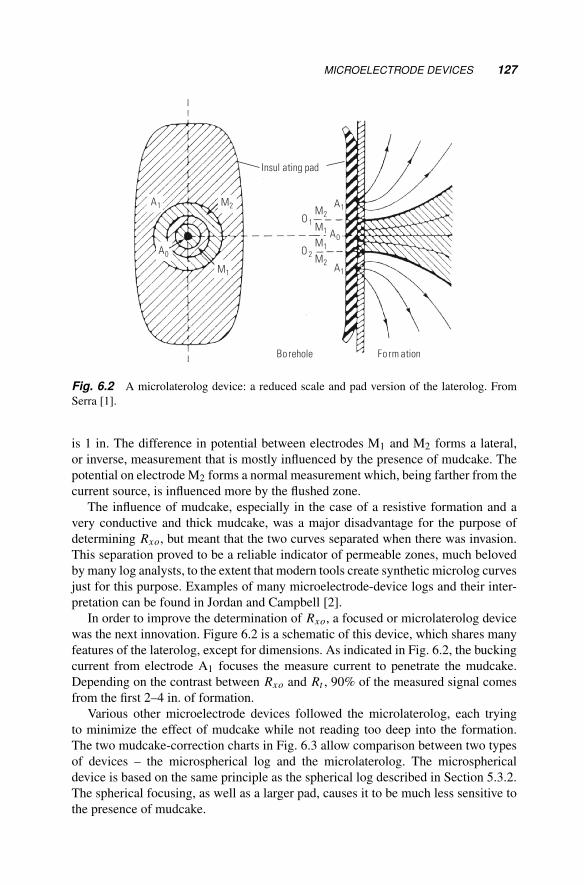
Fig. 6.2 A microlaterolog device: a reduced scale and pad version of the laterolog. FromSerra [1].
is 1 in. The difference in potential between electrodes M1 and M2 forms a lateral,or inverse, measurement that is mostly influenced by the presence of mudcake. Thepotential on electrode M2 forms a normal measurement which, being farther from thecurrent source, is influenced more by the flushed zone.
The influence of mudcake, especially in the case of a resistive formation and avery conductive and thick mudcake, was a major disadvantage for the purpose ofdetermining Rxo, but meant that the two curves separated when there was invasion.This separation proved to be a reliable indicator of permeable zones, much belovedby many log analysts, to the extent that modern tools create synthetic microlog curvesjust for this purpose. Examples of many microelectrode-device logs and their inter-pretation can be found in Jordan and Campbell [2].
In order to improve the determination of Rxo, a focused or microlaterolog devicewas the next innovation. Figure 6.2 is a schematic of this device, which shares manyfeatures of the laterolog, except for dimensions. As indicated in Fig. 6.2, the buckingcurrent from electrode A1 focuses the measure current to penetrate the mudcake.Depending on the contrast between Rxo and Rt , 90% of the measured signal comesfrom the first 2–4 in. of formation.
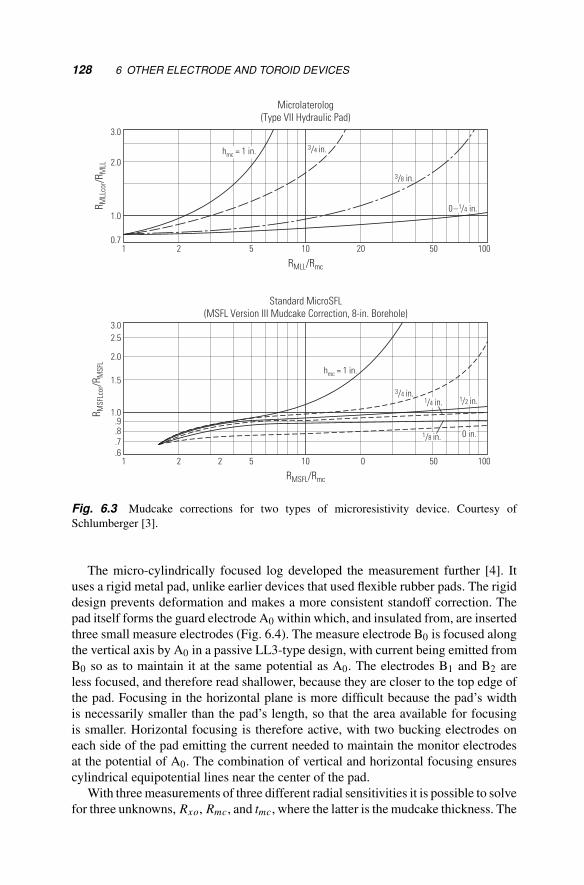
Various other microelectrode devices followed the microlaterolog, each tryingto minimize the effect of mudcake while not reading too deep into the formation.The two mudcake-correction charts in Fig. 6.3 allow comparison between two typesof devices – the microspherical log and the microlaterolog. The microsphericaldevice is based on the same principle as the spherical log described in Section 5.3.2.The spherical focusing, as well as a larger pad, causes it to be much less sensitive tothe presence of mudcake.
128 6 OTHER ELECTRODE AND TOROID DEVICES
2 5 1010.7
1.0
2.0
3.0
20 50 100
R MLL
cor/R
MLL
RMLL/Rmc
Microlaterolog(Type VII Hydraulic Pad)
3/4 in.
3/8 in.
0–1/4 in.
hmc = 1 in.
3.02.5
2.0
1.5
1.0.9.8.7.6
2 5 101 2 0 50 100
RMSFL/Rmc
R MSF
Lcor
/RM
SFL
Standard MicroSFL (MSFL Version III Mudcake Correction, 8-in. Borehole)
hmc = 1 in.
3/4 in.1/4 in.
1/8 in. 0 in.
1/2 in.
Fig. 6.3 Mudcake corrections for two types of microresistivity device. Courtesy ofSchlumberger [3].
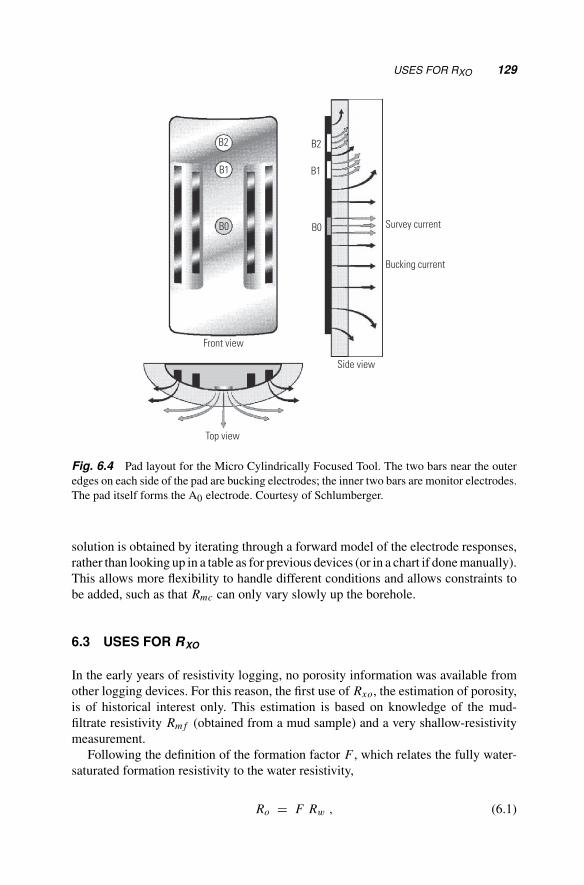
The micro-cylindrically focused log developed the measurement further [4]. Ituses a rigid metal pad, unlike earlier devices that used flexible rubber pads. The rigiddesign prevents deformation and makes a more consistent standoff correction. Thepad itself forms the guard electrode A0 within which, and insulated from, are insertedthree small measure electrodes (Fig. 6.4). The measure electrode B0 is focused alongthe vertical axis by A0 in a passive LL3-type design, with current being emitted fromB0 so as to maintain it at the same potential as A0. The electrodes B1 and B2 areless focused, and therefore read shallower, because they are closer to the top edge ofthe pad. Focusing in the horizontal plane is more difficult because the pad’s widthis necessarily smaller than the pad’s length, so that the area available for focusingis smaller. Horizontal focusing is therefore active, with two bucking electrodes oneach side of the pad emitting the current needed to maintain the monitor electrodesat the potential of A0. The combination of vertical and horizontal focusing ensurescylindrical equipotential lines near the center of the pad.
With three measurements of three different radial sensitivities it is possible to solvefor three unknowns, Rxo, Rmc, and tmc, where the latter is the mudcake thickness. The
USES FOR RXO 129
B2
B1
B0
B2
B1
B0
Front view
Top view
Side view
Survey current
Bucking current
Fig. 6.4 Pad layout for the Micro Cylindrically Focused Tool. The two bars near the outeredges on each side of the pad are bucking electrodes; the inner two bars are monitor electrodes.The pad itself forms the A0 electrode. Courtesy of Schlumberger.
solution is obtained by iterating through a forward model of the electrode responses,rather than looking up in a table as for previous devices (or in a chart if done manually).This allows more flexibility to handle different conditions and allows constraints tobe added, such as that Rmc can only vary slowly up the borehole.
6.3 USES FOR RXO
In the early years of resistivity logging, no porosity information was available fromother logging devices. For this reason, the first use of Rxo, the estimation of porosity,is of historical interest only. This estimation is based on knowledge of the mud-filtrate resistivity Rm f (obtained from a mud sample) and a very shallow-resistivitymeasurement.
Following the definition of the formation factor F , which relates the fully water-saturated formation resistivity to the water resistivity,
Ro = F Rw , (6.1)
130 6 OTHER ELECTRODE AND TOROID DEVICES
one can write an analogous expression for the invaded zone:
Rxo = F Rm f . (6.2)
Here, it is supposed that the mud filtrate of known resistivity Rm f has displaced theconnate water. Also, by analogy, an expression for the mud-filtrate saturation of theinvaded zone can be written:
Sxo =√
FRm f
Rxo, (6.3)
where the mud-filtrate resistivity has replaced Rw in the usual formula, Rxo hasreplaced Rt , and the exponent n is assumed to be 2.
In order to get an estimate of the porosity, one can further make the assumptionthat the invaded zone is completely water-saturated and that the porosity dependenceof F is 1/φ2. From this, one obtains:
1φ2 = Rxo
Rm f. (6.4)
Since the water saturation may not be complete, this can be used to obtain a lowerlimit to porosity, which is given by:
φ ≥√
Rm f
Rxo. (6.5)
With porosity now measured by many other devices, the procedure above is rarelyused. However Rxo has proved useful in many other ways. We have already seenits use for invasion corrections (Chapter 5) and for the identification of movable oil(Chapter 2). It is worthwhile investigating the latter more thoroughly by quantifyingthe separation often observed between the microresistivity curves, which correspondto Rxo, and the deep-resistivity curves, which are usually close to Rt .
From the generalized saturation equation:
Snw = a
φmRw
Rt, (6.6)
it is possible to write an expression to compare the initial value of the water saturation(that in the uninvaded zone, Sw) to the water saturation in the invaded zone (Sxo).This is given by: (
Sw
Sxo
)n
=Rw
RtRm fRxo
= Rw
Rm f
Rxo
Rt. (6.7)
which may also be rewritten as:
Rxo
Rt= Rm f
Rw
(Sw
Sxo
)n
, (6.8)
USES FOR Rxo 131
It is clear that the ratio Rxo/Rt should be equal to the ratio of the mud-filtrateresistivity to the water resistivity in a water zone. The same is true if Sxo = Sw, asmay happen in a zone with residual hydrocarbons that are not displaced by invasion,or in a zone with high-viscosity hydrocarbons such as tar or heavy oil. However, ifthere are any movable hydrocarbons, Sxo will be greater than Sw and the ratio Rxo/Rtwill decrease. This ratio therefore indicates movable hydrocarbons when it decreasesbelow Rm f /Rw. In practice the ratio is often formed by taking the microresistivitylog as Rxo and the deep-resistivity log as Rt .
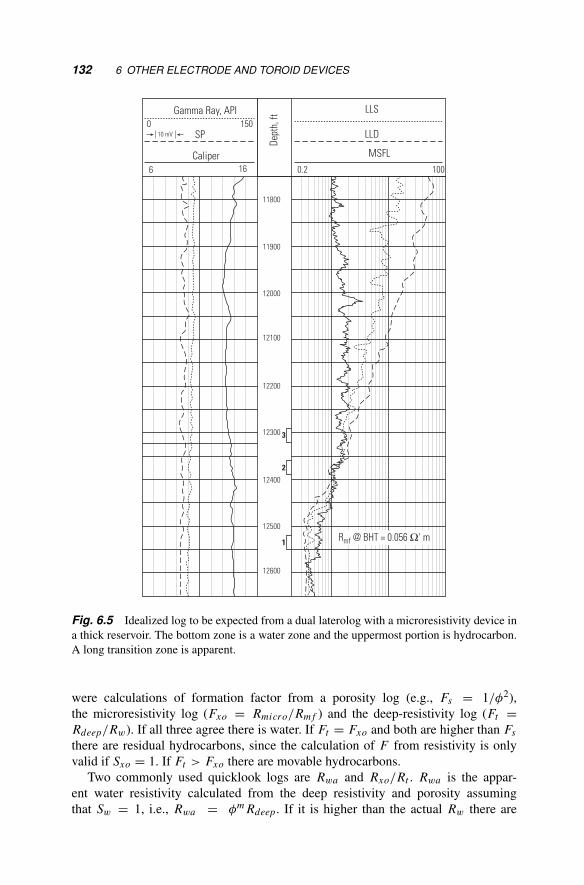
An example of this type of behavior can be seen in the laterolog example of Fig. 6.5.Shown is a log of the bottom 800 ft of a hydrocarbon reservoir. In zone 1 it can beassumed, in the absence of other information, that only water is present; the formationis fully water-saturated, with a shallow (MSFL) and deep-resistivity separation ofabout a factor of 2. Moving up to zones 2 and 3 all three resistivity curves increase.This could be due to a reduction in porosity, but if these zones were water-filled thereshould be the same separation between the curves as in zone 1. The reduction in ratioto about 1 clearly indicates movable oil. Moving further up the reservoir, the watersaturation and hence the resistivity in the invaded zone remains roughly constantwhile the water saturation in the uninvaded zone becomes progressively smaller andthe hydrocarbon saturation progressively greater. The ratio steadily decreases to about1/50 in the upper part of the reservoir.
In the preceding example, we looked at relative saturations between the invadedand deep zones. However, the saturation of the invaded zone is of interest in itsown right. For its determination, additional information is necessary. If the value ofporosity is known from an additional measurement, then the residual oil saturationcan be calculated from:
Snxo = a
φm
Rm f
Rxo. (6.9)
This saturation can be used to determine the efficiency of water-flood production,because it quantifies the residual hydrocarbon saturation after flushing with mudfiltrate. In a water flood, or a reservoir in contact with a water zone, hydrocarbonsare displaced by water leaving a certain volume of residual hydrocarbon behind. Thesame mechanism occurs during invasion, but the rate is higher and the time shorterin the latter so that the displacement can be less efficient. The residual hydrocarbonsaturation estimated from invasion, (1 − Sxo), may then be too high.
Sxo is also a useful indicator of hydrocarbons when the formation water salinity isvariable or unknown. For example if, in Fig. 6.5 we only saw the top section of the logdown to 11,900 ft, we might conclude that this was a water zone with Rw = 50 × Rm f .But we can now calculate Sxo from the known Rm f and porosity from another log. Ifit is less than 1, there are hydrocarbons, although we cannot be sure whether or notthey are movable. This application is particularly useful in sedimentary basins whereformation waters are fresh, since when they are fresh they also tend to vary rapidlybetween reservoirs.
The calculations described above are often presented in the form of “quicklook”logs that are used as visual indicators of hydrocarbons. Which logs are usedtends to vary with time and place. At one time “F logs” were popular [5]. These
132 6 OTHER ELECTRODE AND TOROID DEVICES
6
Gamma Ray, API0 150
10 mV SP
Caliper16
Dept
h, ft
11800
11900
12000
12100
12200
12300
12400
12500
12600
1
LLS
LLD
MSFL0.2 100
Rmf @ BHT = 0.056 Ω' m
3
2
Fig. 6.5 Idealized log to be expected from a dual laterolog with a microresistivity device ina thick reservoir. The bottom zone is a water zone and the uppermost portion is hydrocarbon.A long transition zone is apparent.
were calculations of formation factor from a porosity log (e.g., Fs = 1/φ2),the microresistivity log (Fxo = Rmicro/Rm f ) and the deep-resistivity log (Ft =Rdeep/Rw). If all three agree there is water. If Ft = Fxo and both are higher than Fsthere are residual hydrocarbons, since the calculation of F from resistivity is onlyvalid if Sxo = 1. If Ft > Fxo there are movable hydrocarbons.
Two commonly used quicklook logs are Rwa and Rxo/Rt . Rwa is the appar-ent water resistivity calculated from the deep resistivity and porosity assumingthat Sw = 1, i.e., Rwa = φm Rdeep. If it is higher than the actual Rw there are

AZIMUTHAL MEASUREMENTS 133
hydrocarbons. A common rule of thumb says that when Rwa > 3 × Rw there shouldbe movable hydrocarbons. Rwa is really just the deep resistivity with porosity vari-ations removed. In the same way the ratio Rm f a is a useful indicator when Rw is notknown (Rm f a = φm Rxo). The ratio Rxo/Rt is useful because it does not requirea knowledge of porosity. As shown above this ratio will be reduced in a zone withmovable hydrocarbons. An example of these curves is shown later in Fig. 23.3.
6.4 AZIMUTHAL MEASUREMENTS
The concept of small electrodes mounted on a pad was quickly extended to sondes withthree or four arms, known as dipmeters. Each arm held one or more electrodes pressedagainst the borehole wall and sampled with a fine vertical resolution on the order of 0.1in. Although the measurements are not necessarily calibrated in terms of resistivity,the vertical sequence of resistivity anomalies is of interest for determining the 3Dorientation of strata intersecting the borehole. For a vertical well traversing horizontallayers of formation, the resistivity variations encountered by the measurement padsshould correlate at the same depth. Depending on the orientation of the sonde (whichis determined by an inertial platform or a magnetometer and pendulum), dipping bedswill produce resistivity anomalies at different depths for each arm. The shift requiredto bring them into alignment will depend on the formation dip angle and borehole size.
The raw-resistivity curves of the dipmeter are rarely used directly but are subjectedto various correlation or pattern recognition processing programs. These produce asummary log of the correlated events, which indicates the bedding orientation (dipangle and azimuth). The interpretation of the summary log, or “tadpole plot”, in termsof structural geology and depositional environment, is beyond the scope of this bookbut is thoroughly treated in several references [1, 6–8].
In the 1980s the dipmeter evolved into the electrical microscanner, a device thatincorporates a large number of small electrodes, or buttons, on several pads [9]. Atypical pad contained 27 electrodes of 0.2 in. diameter arranged in four rows. Thetool measures the current emitted by each electrode, while maintaining the potentialof each electrode and the surrounding pad constant relative to a return electrode onthe tool string above. The arrays of staggered electrodes are sampled at a high rateand processed to provide an electrical image of a portion of the borehole wall. Detailson the scale of a few millimeters are resolved, so that the electrical image is nearlyindistinguishable from a core photograph. The main drawback of early tools was thatthe pads did not cover a sufficient fraction of the borehole wall, particularly in largeholes. Modern imaging devices contain a few hundred electrodes mounted on sixarms, or else on four arms with movable flaps, so that up to 80% of the borehole wallcan be covered in an 8 in. hole.
Another drawback was that the devices did not work in nonconductive mudsbecause of the high impedance presented by the mudcake. Initially, dipmeters werefitted with sharp protruding electrodes designed to cut through the mudcake, butthis was never very satisfactory. The Oil-Base Dipmeter Tool used micro-inductionsensors [10], but results were sensitive to the borehole environment. Acoustic images,

134 6 OTHER ELECTRODE AND TOROID DEVICES
described in Chapter 19, are dominated by surface effects and are poor in heavy muds.Then, beginning in 2001, new pad designs allowed images to be recorded in manynonconductive muds [11, 12]. These designs rely on the fact that both mudcake andformation do have some small conductivity due to their clay content, and that thedistance between pad and formation is small. This makes it possible to send currentthrough the formation between electrodes at the top and bottom of a pad and tomeasure the potential, and hence the resistivity, between buttons in the center.
Figure 6.6 compares a log from such a device with a core photograph over a 5ft interval. On the right, the core photograph shows a sequence of thin sand andshale beds. The images on the left were obtained from four microelectrode arrays onmeasurement pads at different azimuths around the borehole wall. Beds as thin as 0.5
MDft
OBMI Image
Conductive Resistive
XX82
XX83
XX84
XX85
XX86
CoreImage
Fig. 6.6 An electrical image of the borehole produced by arrays of microelectrodes on anOil-Base MicroImager tool laid alongside a core photograph of the same section of hole.
RESISTIVITY MEASUREMENTS WHILE DRILLING 135
in. can be identified. This high resolution is very useful in the analysis of laminatedsands (Section 23.3.4). Additional features such as the nonplanar bed boundary at83.4 ft can also be seen. These images are a considerable enhancement over theconventional dipmeter measurements, which can be recorded at the same time. Bedboundaries, fractures and other events can now be picked manually from the images,and their dip and strike automatically computed. This gives an experienced geologistclose control over the interpretation [13].
Images can also be obtained from azimuthal laterolog devices by sectioning oneof the cylindrical current electrodes into separate segments [14]. The current emittedby each segment is adjusted so that the potential on a monitor electrode in its center isthe same as that on two-ring electrodes above and below the segments. The remainderof the long-guard electrode lies above and below these electrodes, so that the wholeassembly makes a monitored LL3 configuration. The resultant image is poorer thanthat of the microelectrode imaging tools, but can identify major structural features.
6.5 RESISTIVITY MEASUREMENTS WHILE DRILLING
The first resistivity measurement made while drilling was a short normal with elec-trodes mounted on an insulated sleeve, itself mounted on a drill collar. This wassubsequently improved by the use of two guard electrodes in an LL3 arrangementthat was also mounted on an insulated sleeve (the Focused Current Resistivity Tool,1987 [15]). Insulated sleeves are not popular in the drilling environment as they tendto wear faster than the steel collars. A much better solution was to use toroids, asproposed by Arps in 1967 [16]. Toroids also offered a solution to the problem ofmeasuring resistivity at the very bottom of the drill string, i.e., at the bit. It has alwaysbeen highly desirable to measure the resistivity of the formation as soon as it is pene-trated, or even beforehand. With this information it is possible, for example, to steera highly deviated well within a reservoir or to stop drilling as soon as the reservoir ispenetrated, as shown in the example of Fig. 6.7. These applications will be discussedin Chapter 20. In this chapter we will discuss how the measurements are made.
6.5.1 Resistivity at the Bit
The first device to measure the resistivity at the bit was the Dual Resistivity MWDTool†, which also makes a type of lateral measurement [17]. The second devicewas the Resistivity at the Bit Tool (RAB∗), which also makes a focused resistivitymeasurement [18]. A removable sleeve with button electrodes can be added to the toolin order acquire data that varies azimuthally and has different depths of investigation.An improved version of the RAB is known as the GVR∗, geoVISION Resistivity sub.
†Mark of Halliburton∗Mark of Schlumberger

136 6 OTHER ELECTRODE AND TOROID DEVICES
0Wireline, GR
0
API
APIRAB GR
100
150
A
Dept
h, ft
0.02
0.02
0.02
0.2
0.2
SFL Offset Wellohm-m
ohm-m
ohm-m
ohm-m
ohm-m
ILM Offset Well
RAB RING Resistivity
RAB BIT Resistivity
ILD Offset Well
200
200
200
2000
2000
Fig. 6.7 Example of a log recorded by the RAB tool. The increase in bit resistivity at Aindicates the top of the reservoir sand. This top can be seen in logs from the offset well (right).Drilling was stopped to set casing. Adapted from Bonner et al. [18]. Used with permission.
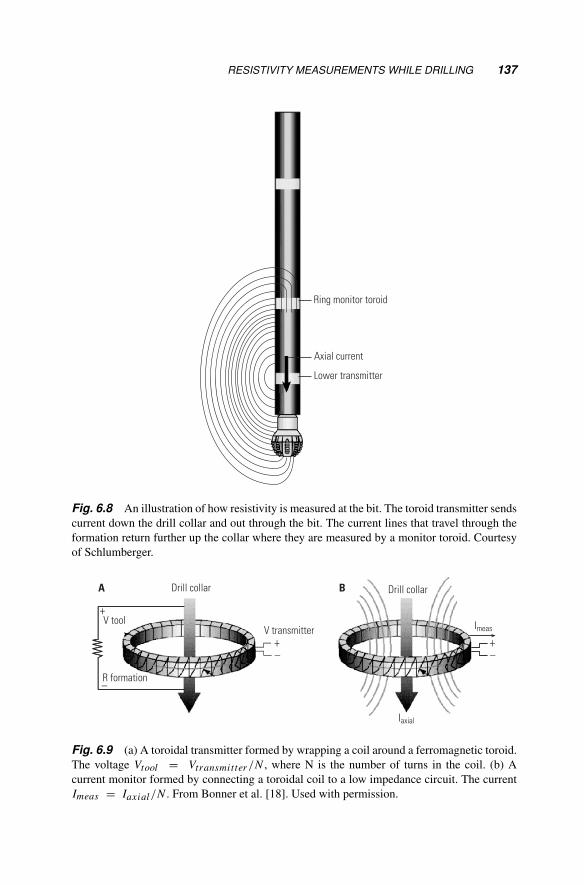
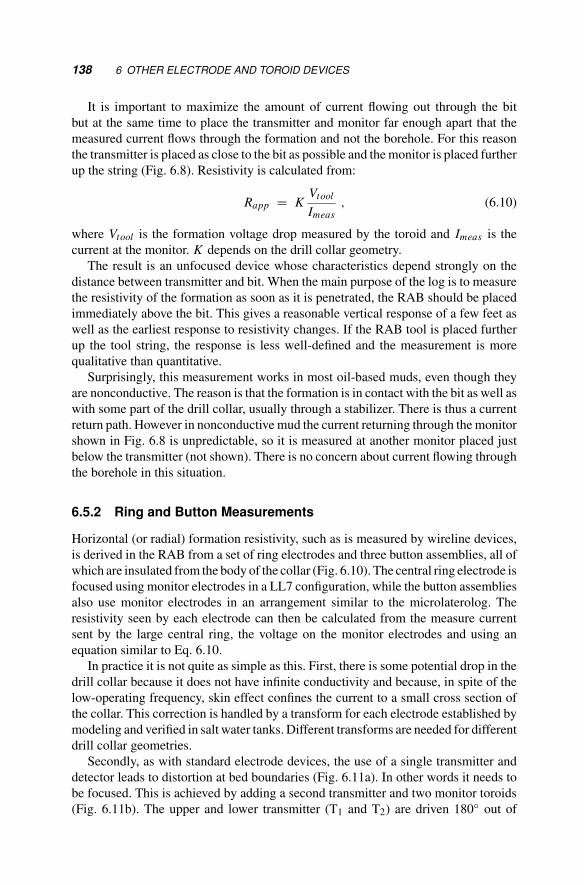
In both the Dual Resistivity MWD Tool and the RAB, a current is sent down thedrill collar and out through the bit by a toroidal transmitter before returning throughthe formation (Fig. 6.8). The toroidal transmitter, shown in Fig. 6.9a, is a transformerwith its coils acting as the primary, and the drill collar and return path through theformation acting as the secondary. A low (1,500 Hz) alternating voltage is applied tothe coil inducing a voltage difference between the collar sections above and belowthe toroid. This voltage difference, which is almost entirely in the formation due tothe low resistance of the collar, is equal to the input voltage divided by the numberof turns in the toroid. The axial current is measured by a toroidal monitor (Fig. 6.9b).This is also a transformer with, in this case, the drill collar and formation acting asthe primary and the coils as the secondary. The current flowing in the coils is equalto the axial current divided by the number of turns.
RESISTIVITY MEASUREMENTS WHILE DRILLING 137
Ring monitor toroid
Axial current
Lower transmitter
Fig. 6.8 An illustration of how resistivity is measured at the bit. The toroid transmitter sendscurrent down the drill collar and out through the bit. The current lines that travel through theformation return further up the collar where they are measured by a monitor toroid. Courtesyof Schlumberger.
A B
+
+
−
−+−
V tool
R formation
Drill collar Drill collar
V transmitter
Iaxial
Imeas
Fig. 6.9 (a) A toroidal transmitter formed by wrapping a coil around a ferromagnetic toroid.The voltage Vtool = Vtransmitter /N , where N is the number of turns in the coil. (b) Acurrent monitor formed by connecting a toroidal coil to a low impedance circuit. The currentImeas = Iaxial/N . From Bonner et al. [18]. Used with permission.
138 6 OTHER ELECTRODE AND TOROID DEVICES
It is important to maximize the amount of current flowing out through the bitbut at the same time to place the transmitter and monitor far enough apart that themeasured current flows through the formation and not the borehole. For this reasonthe transmitter is placed as close to the bit as possible and the monitor is placed furtherup the string (Fig. 6.8). Resistivity is calculated from:
Rapp = KVtool
Imeas, (6.10)
where Vtool is the formation voltage drop measured by the toroid and Imeas is thecurrent at the monitor. K depends on the drill collar geometry.
The result is an unfocused device whose characteristics depend strongly on thedistance between transmitter and bit. When the main purpose of the log is to measurethe resistivity of the formation as soon as it is penetrated, the RAB should be placedimmediately above the bit. This gives a reasonable vertical response of a few feet aswell as the earliest response to resistivity changes. If the RAB tool is placed furtherup the tool string, the response is less well-defined and the measurement is morequalitative than quantitative.
Surprisingly, this measurement works in most oil-based muds, even though theyare nonconductive. The reason is that the formation is in contact with the bit as well aswith some part of the drill collar, usually through a stabilizer. There is thus a currentreturn path. However in nonconductive mud the current returning through the monitorshown in Fig. 6.8 is unpredictable, so it is measured at another monitor placed justbelow the transmitter (not shown). There is no concern about current flowing throughthe borehole in this situation.
6.5.2 Ring and Button Measurements
Horizontal (or radial) formation resistivity, such as is measured by wireline devices,is derived in the RAB from a set of ring electrodes and three button assemblies, all ofwhich are insulated from the body of the collar (Fig. 6.10). The central ring electrode isfocused using monitor electrodes in a LL7 configuration, while the button assembliesalso use monitor electrodes in an arrangement similar to the microlaterolog. Theresistivity seen by each electrode can then be calculated from the measure currentsent by the large central ring, the voltage on the monitor electrodes and using anequation similar to Eq. 6.10.
In practice it is not quite as simple as this. First, there is some potential drop in thedrill collar because it does not have infinite conductivity and because, in spite of thelow-operating frequency, skin effect confines the current to a small cross section ofthe collar. This correction is handled by a transform for each electrode established bymodeling and verified in salt water tanks. Different transforms are needed for differentdrill collar geometries.
Secondly, as with standard electrode devices, the use of a single transmitter anddetector leads to distortion at bed boundaries (Fig. 6.11a). In other words it needs tobe focused. This is achieved by adding a second transmitter and two monitor toroids(Fig. 6.11b). The upper and lower transmitter (T1 and T2) are driven 180 out of

RESISTIVITY MEASUREMENTS WHILE DRILLING 139
Collar
M1M2AO
AO
Fig. 6.10 Mounting of the ring assembly (top) and one of the button assemblies on the collar.Black parts are insulation, grey parts are conductive. The rings above and below the A0 ringare monitor electrodes. Courtesy of Schlumberger.
Nonfocused System
Single transmitter
Ring electrode
Conductive bed
Active Focusing
T1
BSBM
BD
RMO
T2M2
By reciprocityM12 = M21
Upper transmitter
Upper transmitter current
Ring electrodeMonitor toroid
Lower transmitter current
Lower transmitterLower monitor toroid
M01 M02
M12
M21
Fig. 6.11 From the simple concept to the practical device with attendant complications. Leftpanel: the unfocused current map that results from using a single transmitter when a conductivebed prevents the current flowing radially at the ring. Right panel: in the RAB tool, multipletransmitter and monitor toroids are used to maintain radial focusing at the ring electrode. Thecurrent lines at the ring are now nearly radial. The notation M01 indicates the current at M0due to transmitter T1. Adapted from Bonner et al. [18]. Used with permission.
140 6 OTHER ELECTRODE AND TOROID DEVICES
phase so that in a homogeneous formation the axial current at the ring is zero and theradial current is perpendicular to the collar. When the formation resistivities aboveand below the ring are not identical this symmetry must be maintained by adjustingthe outputs of T1 and T2. They are first adjusted so that the axial current at M0 is zero.The ring is close enough to M0 to also have zero axial current. This adjustment couldbe done in hardware by firing the transmitters simultaneously and measuring the netcurrent at M0. In practice it is done in software by firing the transmitters sequentially,measuring the currents that each produce at the monitor, labeled M01 and M02 in thefigure, and adjusting the transmitter outputs accordingly.
The outputs from T1 and T2 must be further adjusted since the current lossesbetween T1 and the ring can be different to those between T2 and the ring. Theselosses are measured by the ratio of currents generated by T1 at M0 and M2 (M01/ M21)and by a similar ratio for T2. This can only be done with one transmitter firing. Forthis reason measurements must be made alternatively from T1 and from T2 and bothadjustments done in software. One final twist – there is no monitor toroid at the uppertransmitter since by the principle of reciprocity the current M12 can be assumed equalto M21 which is already measured.
The result of focusing is that the equipotential surfaces near the ring are cylindersfor a significant distance into the formation. Much effort has been put into focusingthe ring, but what about the buttons? These are intended to be less focused than thering and are therefore placed nearer one of the transmitters. As can be appreciatedfrom the current lines in Fig. 6.11b the nearer the button is to the transmitter the lessfocused it is, and therefore the shallower the depth of investigation. With three buttonsof different depths of investigation it is possible to make invasion corrections in thetraditional manner.
6.5.3 RAB Response
The general features of RAB response are determined by the size and position ofthe electrodes and the fact that it is a resistivity device. Like a laterolog the RABresponds to resistivity and therefore performs best when formation resistivity is high,mud resistivity is low and Rxo < Rt . The small size of the electrodes and the proximityof the buttons to the transmitter give a vertical resolution of approximately 2 in. andshallow depths of investigation of approximately 1, 3, and 5 in. for the buttons, and 8in. for the ring. These depths are considered sufficient to probe the shallow invasionexpected at the time of logging. However, invasion can be significant when LWD logsare run, as discussed in Chapter 2.
The same types of environmental factors apply as for wireline electrode devices:borehole, shoulder bed, and invasion. RAB tools are designed for particular bit sizes, asare all drill collars and LWD tools. Providing the hole is at bit size, borehole correctionsare negligible since the distance between drill collar and borehole wall is less than aninch. There are two exceptions. First, if the hole washes out, the corrections on theshallower and then the deeper measurements rapidly become significant. Second, asthe ratio Rt/Rm drops below 10, the corrections also become increasingly significant.Charts for the borehole effect are available [3].
RESISTIVITY MEASUREMENTS WHILE DRILLING 141
The effect of distant shoulders is small, which is not surprising considering thesmall electrode size and the long drill collars. There are, however some squeeze andanti-squeeze effects at bed boundaries that cause horns at large-contrast boundaries.
The most important effect by far is invasion. We saw in Fig. 5.18 that the pseudo-geometric factors for the laterolog varied with the resistivity contrast Rxo/Rt . Thisis even truer for the RAB. The depths of investigation quoted above are the depthsat which the pseudogeometric factor is 0.5 for the 6.75 in. diameter tool used in 8.5in. boreholes when Rxo = 10 ohm-m and Rt = 100 ohm-m. If the contrast is higherthe depths are less.
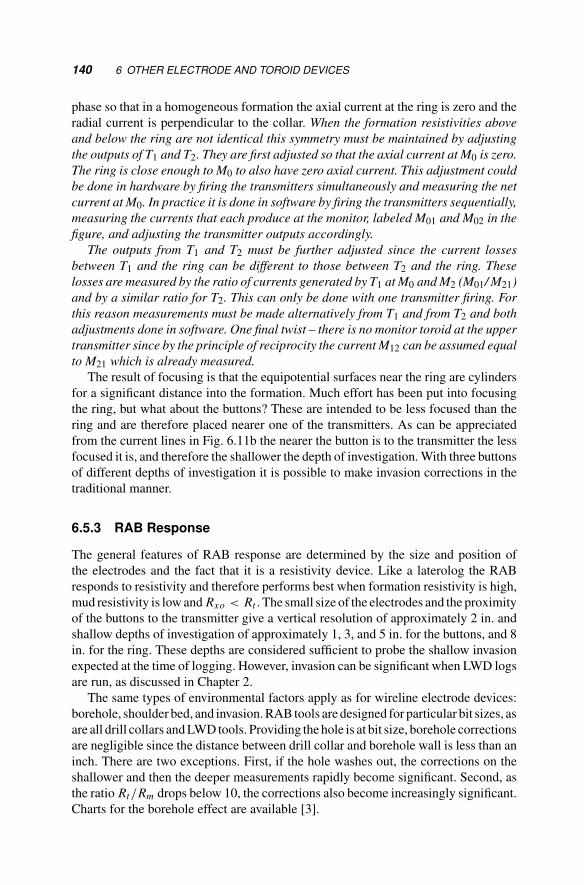
Although pseudogeometric factors give a convenient picture of depth of investi-gation, it can often be more instructive to consider the actual log reading in case ofinvasion. The actual reading depends on Rxo and Rt as well as the pseudogeometricfactor (Eq. 5.16). The top panel of Fig. 6.12 shows the readings on the ring and button
400
100
10
Appa
rent
resi
stiv
ity, o
hm-m
0 4 8 12 16 20 24 2 8 32 3 6 40
12 16 20 24 28 32 36 40
Diameter of invasion, in.
RingB3B2B1
RingB3B2B1
400
100
100 4 8
Diameter of invasion, in.
Appa
rent
resi
stiv
ity, o
hm-m
Fig. 6.12 Top panel: the apparent resistivity seen by the ring and button electrodes for a 10:1conductive invasion and varying invasion diameter. Bottom panel: the apparent resistivity seenby the ring and button electrodes for a 10:1 resistive invasion and varying invasion diameter.Adapted from Bonner et al. [18]. Used with permission.
142 6 OTHER ELECTRODE AND TOROID DEVICES
electrodes as invasion increases for the case where Rxo = 20 ohm-m and Rt = 200ohm-m, i.e., with conductive invasion. The results are plotted in terms of diameter sothat at 8.5 in. (the borehole size) there is no invasion and all measurements read Rt . Asinvasion diameter increases all measurements tend to Rxo. At an invasion diameterof 23 in., which is a depth of invasion of 7.75 in., the ring reads 50% of Rt . Thelarge separation between the curves indicates that it will be easy to invert the loggingmeasurements when Rt , Rxo, and Di are not known. The bottom panel of Fig. 6.12shows the opposite case of resistive invasion. Here the ring reads 50% above Rt atthe very small Di of 10 in., illustrating again that elecrode devices are not suitablewith resistive invasion.
Tornado charts can be formed for a given contrast and other conditions providingthere is conductive invasion. For the RAB we have the luxury of four measurements(if the sleeve with the buttons has been run). As one might deduce from Fig. 6.12athe three buttons are used when invasion is very shallow, and the two deeper buttonsand the ring when invasion is deeper. More sophisticated techniques that use all fourmeasurements are also available [19]. In Chapter 5 we saw that tornado charts areonly valid for thick beds. Given the small size of the buttons and the high verticalresolution, the effect of surrounding beds and other 2D effects are much less severethan with a laterolog.
6.5.4 Azimuthal Measurements
The RAB buttons respond to the resistivity in front of them, so that if the drill string isrotated it is possible to record an image of the formation at different azimuths. This isa powerful feature as it allows images of formation features to be seen while drilling.Magnetometers orient the tool with respect to the earth’s magnetic field. RAB imagesdo not have the vertical resolution of electrical microscanners but do reflect beddingand structural features from which formation dip can be determined. This informationcan be very useful in near real time. For example, in highly deviated wells an imagecan determine whether a new bed is being entered from above or below, somethingthat cannot be done with non-azimuthal measurements. An example of this is givenin Chapter 20.
6.6 CASED-HOLE RESISTIVITY MEASUREMENTS
The ability to measure water saturation through casing is highly desirable, mainlyin old wells to monitor changes with depletion and identify zones that still haveproducible oil. It has been done for many years using pulsed neutron devices (Chapter15). However these have relatively shallow depths of investigation and do not alwaysgive satisfactory answers. At first sight it would seem impossible to measure resistivitythrough the highly conductive casing, but the method has been recognized for years,with the first patent being filed in the 1930s [20]. The main difficulty is the extremelysmall electrical potential that must be measured, but this was overcome in two devices
CASED-HOLE RESISTIVITY MEASUREMENTS 143
that appeared in the late 1990s: the Through Casing Resistivity Tool and the Cased-Hole Formation Resistivity Tool [21, 22].
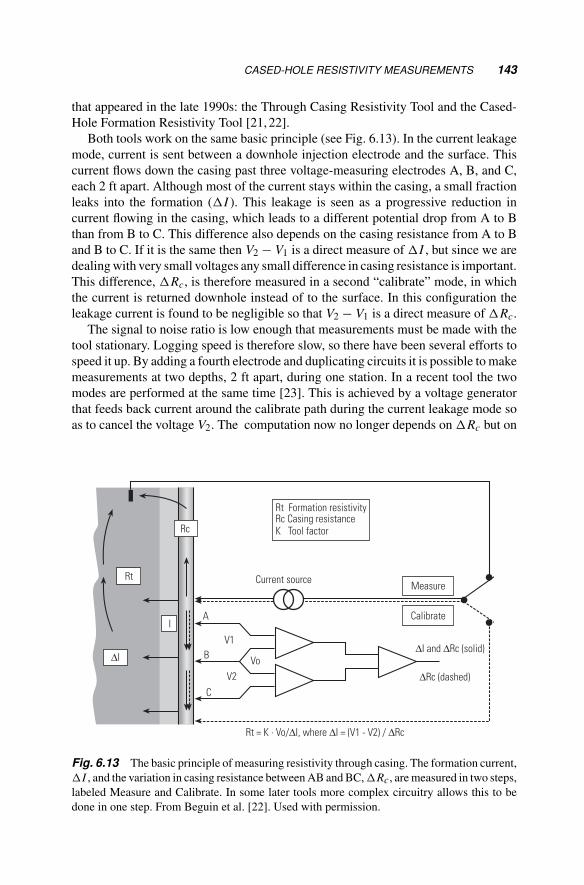
Both tools work on the same basic principle (see Fig. 6.13). In the current leakagemode, current is sent between a downhole injection electrode and the surface. Thiscurrent flows down the casing past three voltage-measuring electrodes A, B, and C,each 2 ft apart. Although most of the current stays within the casing, a small fractionleaks into the formation (I ). This leakage is seen as a progressive reduction incurrent flowing in the casing, which leads to a different potential drop from A to Bthan from B to C. This difference also depends on the casing resistance from A to Band B to C. If it is the same then V2 − V1 is a direct measure of I , but since we aredealing with very small voltages any small difference in casing resistance is important.This difference, Rc, is therefore measured in a second “calibrate” mode, in whichthe current is returned downhole instead of to the surface. In this configuration theleakage current is found to be negligible so that V2 − V1 is a direct measure of Rc.
The signal to noise ratio is low enough that measurements must be made with thetool stationary. Logging speed is therefore slow, so there have been several efforts tospeed it up. By adding a fourth electrode and duplicating circuits it is possible to makemeasurements at two depths, 2 ft apart, during one station. In a recent tool the twomodes are performed at the same time [23]. This is achieved by a voltage generatorthat feeds back current around the calibrate path during the current leakage mode soas to cancel the voltage V2. The computation now no longer depends on Rc but on
Rt Formation resistivityRc Casing resistanceK Tool factorRc
Rt
∆l
Current source
A
V1B Vo
V2
C
Rt = K . Vo/∆I, where ∆I = (V1 - V2) / ∆Rc
Measure
Calibrate
∆I and ∆Rc (solid)
∆Rc (dashed)
I
Fig. 6.13 The basic principle of measuring resistivity through casing. The formation current,I , and the variation in casing resistance between AB and BC, Rc, are measured in two steps,labeled Measure and Calibrate. In some later tools more complex circuitry allows this to bedone in one step. From Beguin et al. [22]. Used with permission.
144 6 OTHER ELECTRODE AND TOROID DEVICES
V1 and the Rc between A and B. The latter can be measured at the same time as, butwith a different frequency than, the current leakage. The result is a reduced sensitivityto measurement errors and a one-step, faster, recording.
With the formation current I known, Rapp can be calculated from Eq. 6.10 withthe voltage on the casing at the electrodes, V0, and a K-factor. V0 is measured bysending current as in the current leakage mode and measuring the voltage betweenthe downhole voltage electrodes and a surface reference (not shown in Fig. 6.13).Although V0 varies slowly with depth it is not easy to measure accurately becauseit is small (less than 100 mV) and because of problems with the surface referenceelectrode: for example, it may not be possible to place the electrode far enough fromthe casing to be considered at zero potential. In practice cased-hole resistivity logsmay need to be shifted to match openhole logs in a shale or other zone where formationresistivity should not have changed with time. Any such shift needs to be adjustednear the bottom of the casing where voltage changes fast with depth.
Casing Segment Resistance0
0
ohm-m
Gamma RayAPI
0.0002
150
MD,
ft 1
1
750
800
850
900
HART
ohm-m
CHFR apparent Rtohm-m
1000
1000
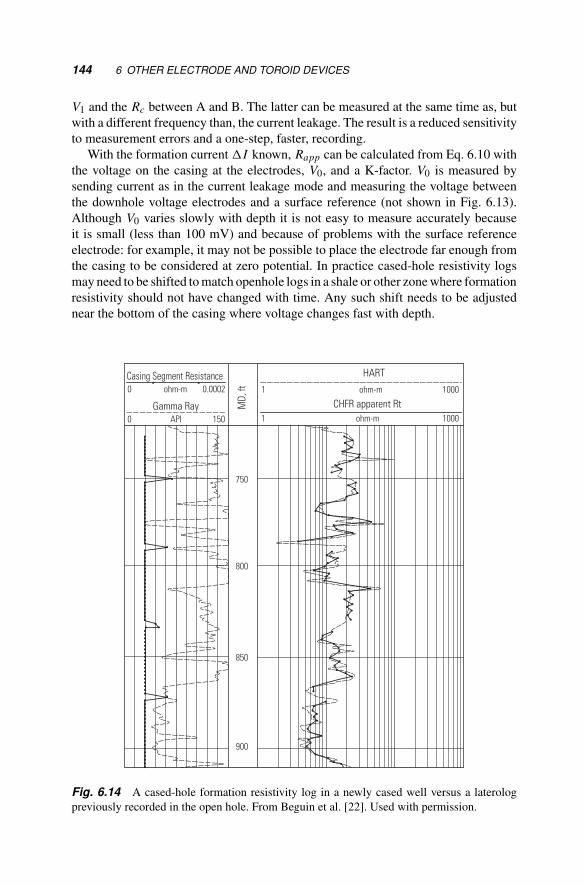
Fig. 6.14 A cased-hole formation resistivity log in a newly cased well versus a laterologpreviously recorded in the open hole. From Beguin et al. [22]. Used with permission.
REFERENCES 145
Understandably there are some limitations to the through-casing measurement.First we should appreciate that formation resistivity is typically nine orders of mag-nitude larger than that of the casing. However the formation presents a much largerarea than the casing, so that the ratio of resistances and hence of leakage current tototal current is around 10−4. This current is measured through a casing resistancethat is a few tens of micro-ohms, leading to a differential voltage V2 − V1 that is innanovolts. In order to achieve sufficient signal to noise, this small voltage must bemeasured over a period of time with the tool stationary. The measurement frequencyis no more than a few Hz: at higher frequencies the skin depth in the casing would bereduced, confining even more of the current within the casing and further decreasingthe leakage current, while a direct current would polarize and drift.
For the time being the tool works best in the formation resistivity range 1 ohm-mto 100 ohm-m. Below 1 ohm-m the measurement becomes sensitive to the cementresistivity and thickness, neither of which are well known. As resistivity increases, theformation current drops. This can be partially overcome by repeating the measurementfor a longer period at each station, but there is a practical limit on how much this canbe done. The good agreement that can be obtained within the 1–100 ohm-m rangebetween cased-hole resistivity and an openhole laterolog can be seen in Fig. 6.14.
Once measured, the resistivity through casing has some appealing features. Thecasing acts as a giant guard electrode so that the leakage current is particularly wellfocused. In an infinitely thick formation the depth of investigation is of the order oftens of feet, much larger than a laterolog. Like any laterolog, this is reduced in thinnerbeds. Also like a laterolog, an invaded zone or cement that is more resistive than Rtaffects strongly the measurement.
REFERENCES
1. Serra O (1984) Fundamentals of well-log interpretation. Elsevier, Amsterdam,The Netherlands
2. Jordan JR, Campbell FL (1986) Well logging II – electric and acoustic logging.SPE Monograph Series, SPE, Dallas, TX
3. Schlumberger (2005) Log interpretation charts. Schlumberger, Houston, TX
4. Eisenmann P, Gounot M-T, Juchereau B, Trouiller J-C, and Whittaker SJ (1994)Improved Rxo measurements through semi-active focusing. Presented at the 69thSPE Annual Technical Conference and Exhibition, paper SPE 28437
5. Schlumberger (1989) Log interpretation principles/applications. Schlumberger,Houston, TX
6. Schlumberger (1970) Fundamentals of dipmeter interpretation. Schlumberger,New York
146 6 OTHER ELECTRODE AND TOROID DEVICES
7. Serra O (1985) Sedimentary environments from wireline logs. Schlumberger,New York
8. Doveton JH (1986) Log analysis of subsurface geology, concepts and computermethods. Wiley, New York
9. Ekstrom MP, Dahan CA, Chen MY, Lloyd PM, Rossi DJ (1986) Formationimaging with microelectrical scanning arrays. Trans SPWLA 27th AnnualLogging Symposium, paper BB
10. Adams J et al. (1989) Advances in log interpretation in oil-base mud. OilfieldRev. 1(2):22–38
11. Cheung P et al. (2002) A clear picture in oil-base muds. Oilfield Rev. winter2001/2002:2–27
12. Lofts J, Evans M, Pavlovic M, Dymmock S (2003) New microresistivity imagingdevice for use in non-conductive and oil-based muds. Petrophysics 44(5):317–327
13. Luthi S (2001) Geological well logs: their use in reservoir modeling. Springer,Berlin
14. Smits JW, Benimeli D, Dubourg I, Faivre O, Hoyle D, Tourillon V, TrouillerJC, Anderson BI (1995) High resolution from a new laterolog with azimuthalimaging. Presented at the 70th SPE Annual Technical Conference and Exhibition,paper 30584
15. Evans HB, Brooks AG, Meisner JE, Squire RE (1987) A focused currentresistivity logging system for MWD. Presented at the 62nd SPE AnnualConference and Exhibition, Dallas, paper 16757
16. Arps JJ (1967) Inductive resistivity guard logging apparatus including toroidalcoils mounted in a conductive stem. US patent No 3,305,771
17. Gianzero S, Chemali R, Lin Y, Su S, Foster M (1985) A new resistivity tool formeasurement while drilling. Trans SPWLA 26th Annual Logging Symposium,paper A
18. Bonner S, Bagersh A, Clark B, Dajee G, Dennison M, Hall JS, Jundt J, Lovell J,Rosthal R, Allen D (1994) A new generation of electrode resistivity measurementsfor formation evaluation while drilling. Trans SPWLA 35th Annual LoggingSymposium, paper OO
19. Li Q, Rasmus J, Cannon D (1999) A novel inversion method for the interpretationof a focused multisensor LWD laterolog resistivity tool. Trans SPWLA 40thAnnual Logging Symposium, paper AAA
20. Alpin LM (1939) The method of the electric logging in the borehole with casing.U.S.S.R. Patent No 56026
PROBLEMS 147
21. Maurer HM, Hunziker J (2000) Early results of through casing resistivity fieldtests. Trans SPWLA 41st Annual Logging Symposium, paper DD
22. Beguin P, Benimeli D, Boyd A, Dubourg I, Ferreira A, McDougall A, Rouault G,and van der Wal, P (2000) Recent progress on formation resistivity measurementthrough casing. Trans SPWLA 41st Annual Logging Symposium, paper CC
23. Benimeli D, Levesque C, Rouault G, Dubourg I, Pehlivan H, McKeon D, FaivreO (2002) A new technique for faster resistivity measurements in cased holes.Trans SPWLA 43rd Annual Logging Symposium, paper K
Problems
6.1 Using the SP and resistivity fundamentals, show that the following relationholds for clean formations:
S P = − K[
log10Rxo
Rt+ 2 log10
Sxo
Sw
]. (6.11)
6.2 A section of sandstone reservoir was logged and found to have a porosity of18%. The water resistivity is estimated to be 0.2 ohm-m, and Rt was measured to be10 ohm-m.
6.2.1 What is the water saturation?6.2.2 What error in Sw (in saturation units) is induced by a 10% relative uncertainty
for each of the three parameters?
6.3 Given the log of Fig. 6.5 with Rm f indicated at formation temperature, answerthe following:
6.3.1 Over the zone 11,800–12,200 ft, what is the average value of the lower limitto porosity which can be established?
6.3.2 Evaluate Sw every 50 ft over the above interval and make a linear plot of Sw
versus depth.6.3.3 The actual average porosity over the zone in question is 30 p.u. How does this
compare with your estimate? Is this discrepancy reasonable? How does this additionalinformation impact the actual value of Sw along the zone (replot curve)?
6.4 In the bottom section of the well studied in question 6.3, assume that the porosityis constant at 30% over the entire interval and answer the following:
6.4.1 In the zones marked 1, 2, and 3, determine the corrected values of RL Ld andthe diameter of invasion.
6.4.2 Estimate the value of Rw in this reservoir.
6.5 In the same well (Fig. 6.5) calculate the value of Rxo/Rt at 12,550, 12,450,12,400, 12,200 and 11,800 ft. Use the results to identify intervals of water, residualoil, and movable oil. Calculate Sw using the value derived for Rw in the last questionand the often-used empirical relation Sxo = S0.2
w .

148 6 OTHER ELECTRODE AND TOROID DEVICES
6.6 A common rule of thumb is that when Rwa = 3 × Rw or greater there aremovable hydrocarbons. Assuming m = n = 2 what Sw does this correspond to?
6.7 At what diameter of invasion does the J-factor equal 0.5 for the ring electrodein the top and bottom panels of Fig. 6.12? In which of these cases would you say thatthe ring reads deeper?
Related Documents