Osteocalcin and matrix Gla protein in zebrafish (Danio rerio) and Senegal sole (Solea senegalensis): Comparative gene and protein expression during larval development through adulthood Paulo J. Gavaia a , Dina C. Simes a , J.B. Ortiz-Delgado a,c , Carla S.B. Viegas a , Jorge P. Pinto a,1 , Robert N. Kelsh b , M. Carmen Sarasquete c , M. Leonor Cancela a, * a CCMAR, Universidade do Algarve, 8005-139 Faro, Portugal b CRM, Department of Biology and Biochemistry, University of Bath, Claverton Down, Bath BA2 7AY, UK c CSIC – Andalusia Institute of Marine Sciences, Pol. Rio San Pedro s/n, Apdo, Oficial 11510, Puerto Real (Cadiz), Spain Received 25 April 2005; received in revised form 17 November 2005; accepted 19 November 2005 Available online 2 February 2006 Abstract Bone Gla protein (Bgp or osteocalcin) and matrix Gla protein (Mgp) are important in calcium metabolism and skeletal development, but their precise roles at the molecular level remain poorly understood. Here, we compare the tissue distribution and accumulation of Bgp and Mgp during larval development and in adult tissues of zebrafish (Danio rerio) and throughout metamorphosis in Senegal sole (Solea senegalensis), two fish species with contrasting environmental calcium levels and degrees of skeletal reorganization at metamor- phosis. Mineral deposition was investigated in parallel using a modified Alizarin red/Alcian blue protocol allowing sensitive simulta- neous detection of bone and cartilage. In zebrafish, bgp and mgp mRNAs were localized in all mineralized tissues during and after calcification including bone and calcified cartilage of branchial arches. Through immunohistochemistry we demonstrated that these pro- teins accumulate mainly in the matrix of skeletal structures already calcified or under calcification, confirming in situ hybridization results. Interestingly, some accumulation of Bgp was also observed in kidney, possibly due to the presence of a related protein, nephro- calcin. Chromosomal localization of bgp and mgp using a zebrafish radiation hybrid panel indicated that both genes are located on the same chromosome, in contrast to mammals where they map to different chromosomes, albeit in regions showing synteny with the zebra- fish location. Results in Senegal sole further indicate that, during metamorphosis, there is an increase in expression of both bgp and mgp, paralleling calcification of axial skeleton structures. In contrast with results obtained for previously studied marine fishes, in zebrafish and Senegal sole Mgp accumulates in both calcified tissues and non-mineralized vessel walls of the vascular system. These results suggest different patterns of Mgp accumulation between fish and mammals. Ó 2005 Elsevier B.V. All rights reserved. Keywords: Danio rerio; Solea senegalensis; BGP; Osteocalcin; MGP; Skeletal development; Gene expression; In situ hybridization; Immunolocalization; Bone; Cartilage 1. Results and discussion 1.1. Identification and molecular cloning of zebrafish and sole bgp and mgp Matrix c-carboxyglutamic acid (Gla) protein (Mgp) and bone Gla protein (also known as Bgp or osteocalcin) are small extracellular matrix proteins originally isolated from vertebrate bone (Price et al., 1976, 1983) and belong to the family of Ca 2+ -binding vitamin K-dependent proteins. 1567-133X/$ - see front matter Ó 2005 Elsevier B.V. All rights reserved. doi:10.1016/j.modgep.2005.11.010 * Corresponding author. Tel.: +351 289800971; fax: +351 289818353. E-mail address: [email protected] (M.L. Cancela). 1 Present address: Institute for Molecular and Cell Biology, Laboratory of Molecular Immunology, Rua do Campo Alegre, 823, 4150-180 Porto, Portugal. www.elsevier.com/locate/modgep Gene Expression Patterns 6 (2006) 637–652

Welcome message from author
This document is posted to help you gain knowledge. Please leave a comment to let me know what you think about it! Share it to your friends and learn new things together.
Transcript

www.elsevier.com/locate/modgep
Gene Expression Patterns 6 (2006) 637–652
Osteocalcin and matrix Gla protein in zebrafish (Danio rerio)and Senegal sole (Solea senegalensis): Comparative gene and
protein expression during larval development through adulthood
Paulo J. Gavaia a, Dina C. Simes a, J.B. Ortiz-Delgado a,c, Carla S.B. Viegas a,Jorge P. Pinto a,1, Robert N. Kelsh b, M. Carmen Sarasquete c, M. Leonor Cancela a,*
a CCMAR, Universidade do Algarve, 8005-139 Faro, Portugalb CRM, Department of Biology and Biochemistry, University of Bath, Claverton Down, Bath BA2 7AY, UK
c CSIC – Andalusia Institute of Marine Sciences, Pol. Rio San Pedro s/n, Apdo, Oficial 11510, Puerto Real (Cadiz), Spain
Received 25 April 2005; received in revised form 17 November 2005; accepted 19 November 2005Available online 2 February 2006
Abstract
Bone Gla protein (Bgp or osteocalcin) and matrix Gla protein (Mgp) are important in calcium metabolism and skeletal development,but their precise roles at the molecular level remain poorly understood. Here, we compare the tissue distribution and accumulation ofBgp and Mgp during larval development and in adult tissues of zebrafish (Danio rerio) and throughout metamorphosis in Senegal sole(Solea senegalensis), two fish species with contrasting environmental calcium levels and degrees of skeletal reorganization at metamor-phosis. Mineral deposition was investigated in parallel using a modified Alizarin red/Alcian blue protocol allowing sensitive simulta-neous detection of bone and cartilage. In zebrafish, bgp and mgp mRNAs were localized in all mineralized tissues during and aftercalcification including bone and calcified cartilage of branchial arches. Through immunohistochemistry we demonstrated that these pro-teins accumulate mainly in the matrix of skeletal structures already calcified or under calcification, confirming in situ hybridizationresults. Interestingly, some accumulation of Bgp was also observed in kidney, possibly due to the presence of a related protein, nephro-calcin. Chromosomal localization of bgp and mgp using a zebrafish radiation hybrid panel indicated that both genes are located on thesame chromosome, in contrast to mammals where they map to different chromosomes, albeit in regions showing synteny with the zebra-fish location. Results in Senegal sole further indicate that, during metamorphosis, there is an increase in expression of both bgp and mgp,paralleling calcification of axial skeleton structures. In contrast with results obtained for previously studied marine fishes, in zebrafishand Senegal sole Mgp accumulates in both calcified tissues and non-mineralized vessel walls of the vascular system. These results suggestdifferent patterns of Mgp accumulation between fish and mammals.� 2005 Elsevier B.V. All rights reserved.
Keywords: Danio rerio; Solea senegalensis; BGP; Osteocalcin; MGP; Skeletal development; Gene expression; In situ hybridization; Immunolocalization;Bone; Cartilage
1567-133X/$ - see front matter � 2005 Elsevier B.V. All rights reserved.
doi:10.1016/j.modgep.2005.11.010
* Corresponding author. Tel.: +351 289800971; fax: +351 289818353.E-mail address: [email protected] (M.L. Cancela).
1 Present address: Institute for Molecular and Cell Biology, Laboratoryof Molecular Immunology, Rua do Campo Alegre, 823, 4150-180 Porto,Portugal.
1. Results and discussion
1.1. Identification and molecular cloning of zebrafish and sole
bgp and mgp
Matrix c-carboxyglutamic acid (Gla) protein (Mgp) andbone Gla protein (also known as Bgp or osteocalcin) aresmall extracellular matrix proteins originally isolated fromvertebrate bone (Price et al., 1976, 1983) and belong to thefamily of Ca2+-binding vitamin K-dependent proteins.

638 P.J. Gavaia et al. / Gene Expression Patterns 6 (2006) 637–652
In mammals, genetic studies have provided evidence thatBgp and Mgp function as inhibitors of tissue calcification(Ducy et al., 1996; Luo et al., 1997), with expression ofbgp being specific to bone tissue and dentine (Price, 1990)while expression of mgp is mainly associated with cartilage,soft tissues, and vascular system (Fraser and Price, 1988;Cancela et al., 1990, 2001; Hao et al., 2004). Mgp is alsoa decisive factor for differentiation and maturation ofchondrocytes and a key regulator of endochondral andintramembranous ossification (Luo et al., 1995; Yagamiet al., 1999; Newman et al., 2001). However, the molecularmechanism of action for these two proteins remains to beelucidated.
Bgp was first identified in swordfish bone by Price et al.(1977) and later purified from scales of bluegill (Lepomis
macrochirus), bone of seabream (Sparus aurata), and carp(Ciprinus carpio) where it was found in amounts compara-ble to those extracted from mammalian bone (Cancelaet al., 1995; Nishimoto et al., 1992; Roy et al., 2001).Mgp was first purified from a cartilaginous fish, the soupfinshark (Galeorhinus galeus) (Rice et al., 1994), but its purifi-cation from a teleost fish was only achieved recently inArgyrosomus regius, a fish with large calcified branchialarches, the only tissue where Mgp was found to accumulatein significant amounts (Simes et al., 2003), in contrast withresults obtained for mammals, chicken, and amphibian,which accumulate Mgp in bone tissue. Despite these firstresults for fish Bgp and Mgp, not much is known abouttheir function in non-mammalian organisms and in partic-ular, during the early formation of fish skeletal elements.Since these proteins are known to be endogenous calcifica-tion inhibitors, we chose two different teleost fishes living inenvironments with very different calcium concentrations,freshwater and seawater. Zebrafish (Danio rerio, Dr) is afreshwater teleost with cellular (osteocyte containing) boneand a major model for vertebrate development. The cellsinvolved in bone formation and remodeling are describedas being similar in many aspects to those found in mam-mals, with the presence of osteoblasts (bone forming cells)and both mononucleated and multinucleated osteoclasts(bone resorbing cells) although little is known on how thesecells interact to modulate bone matrix formation andremodeling (Witten et al., 2001). In contrast, the Senegalsole (Solea senegalensis, Sse) is an important marine fishfor aquaculture and was chosen because it undergoes a rad-ical change in skeletal morphology during larval stages,crucial for its later survival, and acquisition of a benthic lifestyle (Gavaia et al., 2002).
In this article, we report, for the first time, the cloningof full-length bgp and mgp cDNAs from zebrafish andsole, and provide a comprehensive description of theonset of their expression and sites of protein accumula-tion in relation with the appearance of bone and cartilag-inous structures throughout larval development and intoadulthood.
Taking advantage of the N-terminal amino acidsequence obtained for purified zebrafish and sole Bgp
(Simes et al., 2004), we obtained the complete nucleotidesequence of the corresponding cDNAs by a combinationof RT and 5 0RACE-PCR (AY178836 and AY823525,respectively, see supplementary data Figure 1). Withinthe mature protein, 36 residues were 100% conserved,including the three Gla residues and the two cysteinesrequired for the disulfide bridge, contrasting with only 18conserved out of 55 residues in the pre-pro regions.
The zebrafish and sole mgp cDNAs (AY072811 andAY113679, respectively), were cloned by a combinationof RT- and 5 0-RACE PCR, and comparison between thetwo sequences showed conservation of the phosphorylationmotif in the N-terminal region (Ser-Xxx-Glu-Ser-Xxx-Glu-Ser), the Ala-Asn-Xxx-Phe motif, and the three putativeGla residues located within the region containing the twocysteines responsible for the disulfide bridge (Gla-Xxx-Xxx-Xxx-Gla-Xxx-Cys-Gla-Xxx-Xxx-Xxx-Xxx-Cys) (seesupplementary Figure 2). In both species, the fish-specificC-terminal extension of Mgp was identified, in agreementwith previous results in other fish species (Simes et al.,2004; Laize et al., 2005).
1.2. Chromosomal mapping of zebrafish mgp and bgp genes
using the LN54 panel
The zebrafish mgp and bgp genes were mapped on theradiation hybrid panel LN54 by PCR amplification. Thisshowed that both genes were located on LG3, with mgp
9.54 cR from the marker Z1209 (best LOD score, 12.5)and bgp at 3.87 cR from the marker Z15479 (best LODscore, 12.1).
The presence of mgp and bgp on the same chromosome(LG3) (Fig. 7) in zebrafish differs from what is known inmammals, where the two genes are located in differentchromosomes [in human: chromosomes 12 and 1 for mgp
and bgp, respectively (Cancela et al., 1990; Puchacz et al.,1989); in mouse: chromosomes 6 and 3 for mgp and bgp,respectively (Johnson et al., 1991; Desbois et al., 1994b)].Studies showing the existence of conserved synteny groupsbetween zebrafish and human (e.g., Barbazuk et al., 2000)have raised the possibility that significant portions of thezebrafish genome are uninterrupted by rearrangementssince the divergence of the teleost and tetrapod ancestors.Indeed, analysis of LG3 shows a considerable degree ofsynteny with human chromosomes 17, 19, and 22. Further-more, other genes are present in this Linkage Group thatlocates in different chromosomes in human, suggestingthe existence of considerable differential chromosome rear-rangement since divergence between teleost and mammali-an lineages. Several events are supposed to have occurredin the teleost genome since this divergence, in particularwhole genome duplication in the teleost lineage or, alterna-tively, a more restricted duplication, rather than a single,whole-genome event (Amores et al., 1998; Gates et al.,1999). Recent examination of the pufferfish genomesequences gives strong evidence for the whole genomeduplication scenario in early teleost differentiation (Jaillon

P.J. Gavaia et al. / Gene Expression Patterns 6 (2006) 637–652 639
et al., 2004). However, we found no evidences of geneduplication, either for mgp or bgp, which is in agreementwith our previous findings for both genes in other lowervertebrate species (Pinto et al., 2001; Viegas et al., 2002;Conceicao et al., 2002). Previously, Cancela et al. (1995),based on structural similarity, suggested that Bgp andMgp may share a common ancestor, which, by gene dupli-cation and/or exon shuffling, would have originated twodistinct, however related, proteins (Cancela et al., 1985,2001), an hypothesis reinforced in a more recent paper(Laize et al., 2005). The location of the two genes only2Mb away in the same chromosome reinforces this claim.More studies on the location of the two genes in otherlow vertebrates are, however, necessary to further test thishypothesis.
1.3. Detailed description of zebrafish skeletal development
Zebrafish has an accelerated development comparedwith other teleosts and, in general, structures developearlier and faster than for the marine fish species exam-ined here and elsewhere (Gavaia et al., 2002; Pintoet al., 2003). In our work, we used an improved histo-logical procedure to follow development of the zebrafishskeleton by detecting simultaneously calcium depositionand cartilage formation with the histological markersalizarin red and alcian blue. Specimens of zebrafish col-lected during the hatching period (between 48 and 52 hpost-fertilization, hpf) present an underdeveloped skele-ton, composed only of cartilaginous elements and theotoliths. Structures present in the head skeleton are thebasihyal and the first branchial arches, ceratohyal andceratobranchials 1, 2, and 3, Meckel’s cartilage, palato-quadrate, hyosymplectic, ethmoid plate, and trabeculae.The notochord is the only axial support element andthe paired pectoral fins appear as cartilaginous plates,attached to a cartilaginous coraco–scapular complex.No calcified structures were visible at this stage, besidethe otoliths. At 72 hpf the larvae presented a similar dis-tribution of skeletal elements, although more elongatedand the number of ceratobranchials increased to 5. Mec-kel’s cartilage migrated forward and the mouth wasalready opened. At this stage a calcified cleithrumbecame visible, supporting the coraco–scapular complex.The first calcified pharyngeal teeth appeared at 96 hpf(Fig. 1A) attached to the fifth pair of ceratobranchialsas ventral elements, while perichordal calcification ofthe basioccipital articulatory process (BOP) started, thisbeing the first structure of the axial support skeletonto mineralize. At 5 days post-fertilization (dpf) calcifica-tion continued to increase in the cleithrum, pharyngealteeth, and BOP, and extended to the opercular bones(Fig. 1B). At 6 dpf the hyosymplectic started to mineral-ize in a perichondral manner (Fig. 1C), while the periph-ery of the opercula started to calcify. The ceratohyalcartilage began mineralizing in a median region at8 dpf (Fig. 1D) extending subsequently to both extremi-
ties and the first two cartilaginous hypural platesappeared ventrally at the posterior extremity of thenotochord (Fig. 1E). The first forming vertebrae wereobserved at 9 dpf as a mineral deposition over the noto-chord (Fig. 1F), starting on the dorsal zone and thenextending ventrally. The first vertebrae to form were 3,4, 5, and 6, followed shortly by vertebrae 1 and 2. Cal-cification continued in the head structures and the carti-laginous hypural 3 appeared. Vertebral formationcontinued towards the posterior end and at 12 dpf allindividuals showed vertebrae surrounding the notochordto the level of caudal vertebrae 20–25 (Fig. 1G). The fivehypurals, parhypural, and modified hemal arches werealready present (Fig. 1H) and the first calcified rays ofthe caudal fin were forming by intra-membranous calci-fication. The ceratobranchial 5 was almost completelycalcified and the first mineral deposits appear in thebasihyal, palatoquadrate, and Meckel’s cartilage. Thefirst neural arches appeared at 14 dpf on the fourth ver-tebra, already with visible calcification (Fig. 1I) while thecartilaginous elements of the hypuralia were beginningendochondral mineralization (Fig. 1J). An almost com-pletely formed vertebral column was visible at 19 dpf(Fig. 1K), with all structures calcified, except for thetwo most posterior vertebra that form the urostile, stillundergoing calcification, and in the process of upwardsinflexion. The caudal fin achieved the total number ofstructures with all rays, hypurals, epurals, and modifiedarches and spines. The dorsal and anal fins were alreadyformed and largely mineralized while in pectorals, miner-alization of the rays just began. The head was largelymineralized although skull bones forming by intramem-branous calcification and cartilage undergoing endochon-dral ossification continued to develop until late juvenilestages. A schematic representation of the early skeletonis given in Fig. 1L and is centered on the structuresfocused in this study.
This study complements earlier studies describing thedevelopment of skeletal structures during specific periods.Schilling et al. (1996), Piotrowski et al. (1996), and Schil-ling and Kimmel (1997) have described only the chondro-cranium in embryos up to 120 h, focusing in particularon the development of pharyngeal arches. The skeletaldevelopment of larval and adult individuals was also stud-ied by Cubbage and Mabee (1996) but with special refer-ence to the cranium and paired fins while Du et al. (2001)used calcein to describe development of the axial skeletonin larvae up to 23 days post-fertilization (dpf) althoughtheir study only allowed visualization of calcified struc-tures. Our results concerning mineralization are in goodgeneral agreement with those obtained by Du et al.(2001) but allow us to extend their findings by detecting,in parallel, the appearance of cartilaginous structures. Wedetected calcification one day sooner in the head region,which may result from differences in feeding regimes, butoverall timings of subsequent events of skeletal develop-ment remained similar.

Fig. 1. Time-course of skeletal development in zebrafish using Alcian blue–Alizarin red double staining. Whole mount double staining of the skeleton wasused to follow ontogenic development of cartilaginous and calcified structures. (A) 96 hpf zebrafish larvae head skeleton presenting calcified pharyngeal teeth(PT), cleithrum (Cl), and basioccipital articulatory process (BOP) while other structures like Meckel’s cartilage (MC) and ceratohyal (CH) remain as cartilage(100·); (B) 5 dpf zebrafish larva presenting calcification on the opercula (Op) (40·); (C) beginning of the calcification of the hyosymplectic (HS) in a 6 dpf larva(100·); (D) Beginning of the calcification of the ceratohyal (CH) in a 8 dpf zebrafish (100·); (E) First hypurals (Hyp) developing at 8 dpf (100·); (F) Theformation of the first vertebrae (V) is observed at 9 dpf (100·); (G) Calcification of the trabeculae (T) is observed at 11 dpf, vertebrae continue to form (in ananterior–posterior direction) towards the posterior end of the notochord (40·); (H) Caudal hypuralia acquires final number of structures with modified hemalarches (MHA) and caudal fin rays (CR) appearing at 12 dpf (100·); (I) Formation of the first neural arches (NA) is observed dorsally in the anterior vertebraeat 14 dpf; note that the mandibular is already calcified (M) (40·); (J) beginning of calcification of the hypurals (Hyp) under the urostile (Ur) at 14 dpf (40·); (K)composite image of a 19 dpf D. rerio with most skeletal structures formed and calcified; (L) schematic representation of the major zebrafish skeletal elementsfocused on this study. (SM) Supra-mandibular, (PT) pharyngeal teeth, (Ot) otolith, and (HA) hemal arches.
640 P.J. Gavaia et al. / Gene Expression Patterns 6 (2006) 637–652
P.J. Gavaia et al. / Gene Expression Patterns 6 (2006) 637–652 641
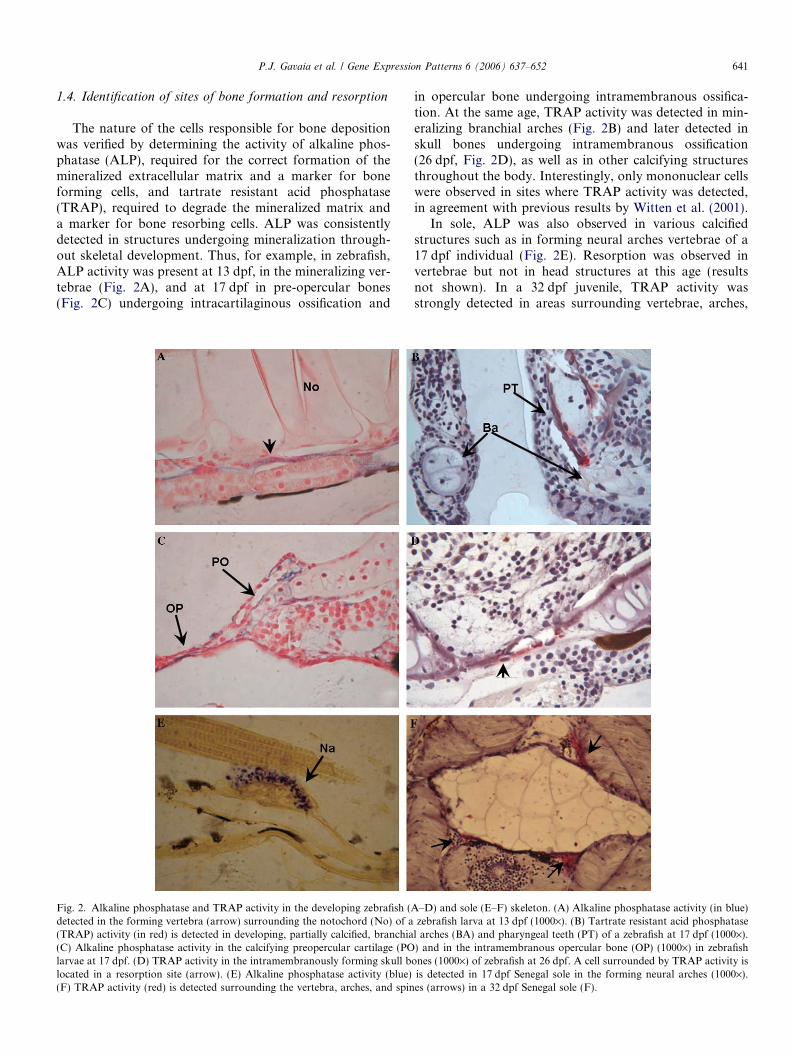
1.4. Identification of sites of bone formation and resorption
The nature of the cells responsible for bone depositionwas verified by determining the activity of alkaline phos-phatase (ALP), required for the correct formation of themineralized extracellular matrix and a marker for boneforming cells, and tartrate resistant acid phosphatase(TRAP), required to degrade the mineralized matrix anda marker for bone resorbing cells. ALP was consistentlydetected in structures undergoing mineralization through-out skeletal development. Thus, for example, in zebrafish,ALP activity was present at 13 dpf, in the mineralizing ver-tebrae (Fig. 2A), and at 17 dpf in pre-opercular bones(Fig. 2C) undergoing intracartilaginous ossification and
Fig. 2. Alkaline phosphatase and TRAP activity in the developing zebrafish (Adetected in the forming vertebra (arrow) surrounding the notochord (No) of a(TRAP) activity (in red) is detected in developing, partially calcified, branchia(C) Alkaline phosphatase activity in the calcifying preopercular cartilage (POlarvae at 17 dpf. (D) TRAP activity in the intramembranously forming skull blocated in a resorption site (arrow). (E) Alkaline phosphatase activity (blue)(F) TRAP activity (red) is detected surrounding the vertebra, arches, and spin
in opercular bone undergoing intramembranous ossifica-tion. At the same age, TRAP activity was detected in min-eralizing branchial arches (Fig. 2B) and later detected inskull bones undergoing intramembranous ossification(26 dpf, Fig. 2D), as well as in other calcifying structuresthroughout the body. Interestingly, only mononuclear cellswere observed in sites where TRAP activity was detected,in agreement with previous results by Witten et al. (2001).
In sole, ALP was also observed in various calcifiedstructures such as in forming neural arches vertebrae of a17 dpf individual (Fig. 2E). Resorption was observed invertebrae but not in head structures at this age (resultsnot shown). In a 32 dpf juvenile, TRAP activity wasstrongly detected in areas surrounding vertebrae, arches,
–D) and sole (E–F) skeleton. (A) Alkaline phosphatase activity (in blue)zebrafish larva at 13 dpf (1000·). (B) Tartrate resistant acid phosphatase
l arches (BA) and pharyngeal teeth (PT) of a zebrafish at 17 dpf (1000·).) and in the intramembranous opercular bone (OP) (1000·) in zebrafish
ones (1000·) of zebrafish at 26 dpf. A cell surrounded by TRAP activity isis detected in 17 dpf Senegal sole in the forming neural arches (1000·).es (arrows) in a 32 dpf Senegal sole (F).

642 P.J. Gavaia et al. / Gene Expression Patterns 6 (2006) 637–652
and spines (Fig. 2F). Like in zebrafish, only mononucleatedcells were detected associated to sites of TRAP activity.Interestingly, although calcified structures were present inthe head region, only faint TRAP-positive signals wereobserved in individuals undergoing ocular migration dur-ing metamorphosis (15 dpf), suggesting multiple sites oflow TRAP-positive resorption activity which will requirefurther studies and possibly optimization of the techniquesto be able to see it more clearly.
1.5. bgp expression during larval development
Using mRNA in situ hybridization on sections of larvalfish, we examined the time-course of bgp expression in bothzebrafish and sole. Zebrafish bgp gene expression was firstobserved by in situ hybridization at 7 dpf on the fifth cer-atobranchial cartilage, when calcified pharyngeal teethare already present. At 11 dpf, both BOP and otic capsulespresented bgp-positive cells, as well as Meckel’s cartilage
Fig. 3. In situ localization of zebrafish and sole bgp mRNA. bgp gene expressiosole (G–I) larvae collected at different ages and developmental stages. (A) bgp
(200·). (B) Detection of bgp expression in a neural arch (arrowhead) at the bdetected in the branchial arches (BA) (arrowheads), ceratobranchial (CB), anexpression is detected in chondrocytes of the BOP (arrows) (1000·). (E) Expresthe pterigophores (Pt) of the dorsal fin of a 24 dpf zebrafish (1000·). (F) At 24 d(arrows), branchial arches (arrowheads), and trabeculae (small arrow) (100·). (just posterior to the BOP at 15 dpf (400·). (H) Expression in the dorsal pterigoin the dorsal pterigophores (Pt) and distal radials (Dr) of a 20 dpf larva (200juvenile sole (1000·). For other abbreviations, see Fig. 1.
(Fig. 3A). At 13 dpf, vertebrae developing around thenotochord and hypertrophic cells in the forming vertebralarches showed positive signal for bgp expression (Fig. 3B)as did other structures undergoing calcification like opercu-lar bones and ceratobranchials or the BOP at 20 dpf (Figs.3C and 3D). At 24 dpf, bgp mRNA was observed in cellsassociated to mineralizing cartilaginous pterigophoresfrom dorsal fin (Fig. 3E). As the number of mineralizingstructures increased in the head region, a more generalizedexpression was observed as seen in a 24 dpf sample(Fig. 3F). In adult fish, the proportion of matrix greatlyincreased relative to cell number, and the positive signalindicating bgp expression became restricted to areas con-taining cells with a hypertrophic phenotype.
Localization of bgp gene expression in sole by in situhybridization was first detected after the beginning ofmineralization and in parallel with the onset of metamor-phosis in the head structures, a process that initiated ataround 12–13 dpf in the studied individuals. In 15 dpf
n was detected by in situ hybridization in sections of zebrafish (A–G) andexpression in the calcifying Meckel’s cartilage (arrows) of an 11 dpf larvaeginning of formation at 11 dpf (1000·). (C) At 13 dpf, bgp expression isd calcifying preopercular bones (Pop) (arrow) (100·). (D) At 20 dpf, bgp
sion is visible in the mineralizing internal fin support skeleton, in this casepf, bgp expression is strongly detected in the calcifying preopercular bones
G) bgp expression in the first vertebra forming over the notochord (arrow),phores (Pt) and distal radials (Dr) of a 20 dpf larvae (200·). (I) Expression·). (I) Osteoblasts (arrow) expressing bgp in the mandibula of a 56 DAH

P.J. Gavaia et al. / Gene Expression Patterns 6 (2006) 637–652 643
larvae, bgp expression was detected in the first vertebraforming over the notochord (Fig. 3G), and later, in cellswithin forming neural arches. It was also detected in headstructures such as endochondral bones from skull. At20 dpf larvae also showed expression in the forming skele-tal elements of the fins such as dorsal pterigophores anddistal radials (Fig. 3H). At 58 dpf osteoblasts expressingbgp were clearly visible in the mandibula of a juvenile sole(Fig. 3I).
In summary, zebrafish showed bgp expression mainlyrestricted to cells of already mineralized structures or thoseundergoing calcification (e.g., cartilages undergoing endo-chondral calcification), in agreement with results obtainedfor other fish species (Pinto et al., 2001; Simes et al.,2003). Our observation of bgp expression in hypertrophicchondrocytes at a stage when cartilage calcification is occur-ring is in agreement with earlier in vitro findings in culturesof hypertrophic chondrocytes from chicken (Neugebaueret al., 1995) and mouse (Strauss et al., 1990), and may reflectthe finding that during cartilage calcification a number ofstructures calcify before osteoblasts have been observed.
In sole bgp was observed much later, at 15 dpf, and at amore advanced stage of skeletal development, when calci-fied structures were prominent, both in head and axial skel-eton. At this age, sole were already mineralizing thevertebral column (Gavaia et al., 2002) and there was exten-sive calcification in the head region. Our data indicate thatin this slower growing species, bgp expression initiates laterthan in the faster growing zebrafish, consistent with resultsobtained for Sparus aurata (Pinto et al., 2001), where pres-ence of mRNA is only detected at relatively late stages(39 dpf).
1.6. Time-course of Bgp accumulation
To confirm and extend our studies on bgp expression, weused a well-characterized antibody (Simes et al., 2004) tocharacterize the distribution of accumulated protein byimmunohistochemistry and immunofluorescence analysis.Zebrafish Bgp was found to accumulate in calcifyingmatrix and first detected at 8 dpf in the BOP and calcifiedteeth of the branchial arch 5 and in the otoliths (Fig. 4A).At 9 dpf accumulation was observed in the cleithrum andBOP undergoing intra-membranous mineralization(Fig. 4B) and at 13 dpf, in the calcified upper jaw and inthe mineralized matrix deposited by osteoblasts on the sur-face of Meckel’s cartilage undergoing perichondral miner-alization (Fig. 4C) as well as in the mineralized matrix ofthe forming vertebrae and arches on the surface of thenotochord sheath (Fig. 4D). At 20 dpf the skeletal elementsof the fin and fin support were mineralizing and Bgp accu-mulation was observed in the coraco–scapular complex(Fig. 4E) and in the last vertebral element, the urostile,within sites undergoing perichordal mineralization (arrowsin Fig. 4F). A strong Bgp accumulation was associatedwith a noticeable thickening of the mineralized tissue sur-rounding the notochord (Fig. 4G). At 31 dpf all the struc-
tures that compose the caudal fin, including hypurals,lepidotrichia, and the last vertebrae, clearly showed accu-mulation of Bgp associated with the mineralized matrix,a signal that became stronger as vertebra and archesbecame thicker (Fig. 4H). Bgp accumulated strongly injuvenile and adult calcified tissues, as seen in the supraman-dibular, trabeculae, and skull bones (Fig. 4I), and in thebranchial arches of a juvenile (Fig. 4J). A clear signalwas also observed in the kidney of juveniles and adults,associated with the glomeruli (Fig. 4K).
In sole, Bgp was found to accumulate in mineralizedskeletal structures but with a slight delay in respect to theappearance of mineralization. At 15 dpf, larvae showedBgp accumulation in the mineralized vertebrae formingaround the notochord (Fig. 4L), at 17 dpf in the calcifyingcaudal vertebrae, and associated neural and hemal archesand at 25 dpf in all vertebral elements (Fig. 4M). A strongaccumulation of Bgp was visible in calcified vertebral col-umn and parapophysis of 25 dpf individuals with a com-pleted metamorphosis and in the cartilaginous distalradials undergoing endochondral calcification (Fig. 4N).Juveniles (41 dpf) presented strong Bgp accumulation inall calcified structures (Fig. 4O) including all bones, bothfrom endochondral or intramembranous origin, and allcartilages that presented calcification.
Our data on protein accumulation are highly consistentwith our mRNA in situ hybridization data, indicating thattranslation of bgp mRNA proceeds rapidly. The overallsites of expression are comparable with those observedfor bgp in mammals (mouse; Desbois et al., 1994a) or fish(seabream; Pinto et al., 2001), confirming its primary siteof accumulation to be within calcified structures, bone,teeth, and cartilage. The major exception is our observa-tion of Bgp accumulation in kidney, a location not seenfor Bgp in mouse. A related protein, nephrocalcin, hasbeen described to be expressed in mammalian kidney (Des-bois et al., 1994a) and could explain our findings, but addi-tional studies are required to confirm this hypothesis.
1.7. mgp expression during larva development
Using mRNA in situ hybridization on sections of larvalfish, we examined the time-course of mgp expression inboth zebrafish and sole. In zebrafish, mgp expression wasfirst detected at 96 h post-fertilization (hpf) on chondro-cytes of the ethmoid plate (Fig. 5A). At 9 dpf, mgp expres-sion was located in chondrocytes both from trabecularcartilage and ceratobranchial arches (Fig. 5B) as well asin Meckel’s cartilage and quadrate (Fig. 5C) and at10 dpf, in cartilage from pectoral fin, but not in the clei-thrum (Fig. 5D). At 13 dpf mgp expression was observedin ceratobranchials, mainly in hypertrophic chondrocytesand in the BOP (Fig. 5E) as well as in Meckel’s cartilageand hyaline cartilage from the basibranchial cartilage(Fig. 5F). At 16 dpf mgp mRNA remained in BOP chon-drocytes (Fig. 5G), within the cytoplasm of hypertrophicchondrocytes from Meckel’s cartilage and within chondro-
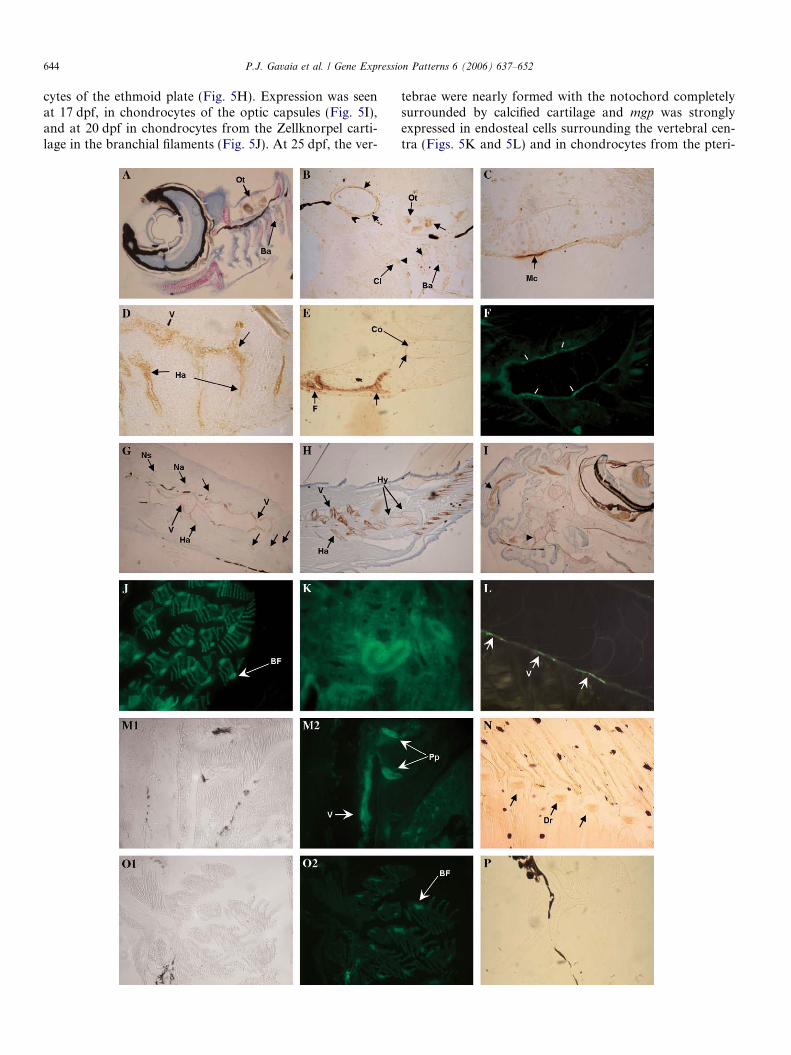
644 P.J. Gavaia et al. / Gene Expression Patterns 6 (2006) 637–652
cytes of the ethmoid plate (Fig. 5H). Expression was seenat 17 dpf, in chondrocytes of the optic capsules (Fig. 5I),and at 20 dpf in chondrocytes from the Zellknorpel carti-lage in the branchial filaments (Fig. 5J). At 25 dpf, the ver-
tebrae were nearly formed with the notochord completelysurrounded by calcified cartilage and mgp was stronglyexpressed in endosteal cells surrounding the vertebral cen-tra (Figs. 5K and 5L) and in chondrocytes from the pteri-

P.J. Gavaia et al. / Gene Expression Patterns 6 (2006) 637–652 645
gophores (Fig. 5L). In the adult fish, mineralization of theskeleton increased and expression of mgp was only detectedin chondrocytes within the remaining cartilage islands.
In sole, mgp gene expression was observed mainly inskeletal structures, both cartilaginous and calcified. At7 dpf mgp mRNA was first observed in the branchialarches. At 11 dpf was observed in chondrocytes of bran-chial arches, trabeculae, and hyosymplectic (Fig. 5M). At17 dpf, when vertebral structures are forming, mgp
mRNA was observed in the chondrocyte-like cells atthe base of the vertebral arches, and in the developinginternal skeleton of the fins, as seen in the dorsal pteri-gophores in Fig. 5N. In juveniles, mgp expression waspresent only in non-calcified skeletal structures, like thecartilaginous growth zones or the cartilage in the baseof the vertebra arches, as observed in a 47 dpf sole(Fig. 5O), in agreement with what was observed in zeb-rafish at comparable stages.
1.8. Detection of sites of Mgp accumulation by
immunohistochemistry
Using a previously validated polyclonal antibody forMgp (Simes et al., 2004), we examined the accumulationof Mgp in both zebrafish and sole structures throughoutdevelopment by immunohistochemistry.
In zebrafish, Mgp accumulation was first observed in themineralized otoliths at 96 hpf and the intensity of stainingincreased as the structure grew, as observed in a 6 dpf larva(Fig. 6A). As new calcified structures appeared (see Fig. 1),accumulation of Mgp was consistently observed in the min-eralized matrix as soon as it formed, as can be observed ina 8 dpf larvae in the mineralized otolith and cleithrum(Figs. 6B and C), at 13 dpf in pleural vertebrae where min-eralization of neural arches initiated, as seen in vertebrae3–5 (Fig. 6D), and in the mineralizing branchial archesand pharyngeal teeth (Fig. 6E). At 20 dpf, Mgp accumula-tion was present in the mineral layer over cranial cartilagesundergoing endochondral ossification (Fig. 6F) and in theforming caudal vertebra and associated arches (Fig. 6G).In 40 dpf juveniles, Mgp accumulation was observed inthe pre-opercular bones undergoing endochondral ossifica-
Fig. 4. Immunohistochemical and immunofluorescent detection of Bgp accuAccumulation of Bgp in the teeth of branchial arch 5 (Ba) and otolith (Ot) of aof Bgp in the teeth of branchial arch 5, otolith and cleithrum of a 9 dpf larva(1000·). (D) Accumulation of Bgp is first detected in calcifying vertebra and hpectoral fin (F) and coraco–scapular complex (Co) at 20 dpf (400·). Notice thmineralization. (F) Immunofluorescent detection of Bgp accumulation in thevertebral column (V), neural arches (Na), neural spines (Ns), and hemal archhemal arches, and in the mineralizing matrix of hypural plates (Hy) of the cAccumulation of Bgp in a juvenile is detected in all the bones and calcifyingbones, the ethmoid plate (arrowhead), and the supra orbital cartilage that simmunofluorescence in the branchial arches of a juvenile (200·). (K) Bgp accum(400·). (L–P) Bgp in sole. L-Immunofluorescent detection of Bgp in the formi(M) Detection of Bgp accumulation in the vertebra and parapophysis (Pp) at 25in the calcifying distal radials (Dr) at 25 dpf. (O0 Bgp is strongly detected in thefield) (250·). (P) Control immunohistochemical detection with pre-immune se
b
tion (Fig. 6H) and in skull bones undergoing intra-mem-branous ossification (Fig. 6I).
In sole, Mgp accumulation was first detected at 8 dpf inthe cartilaginous otic capsules (Fig. 6J) but not in the oto-liths, in contrast with the data from zebrafish. As calcifica-tion initiated, Mgp accumulation was observed in themineralizing matrix of forming endochondral and intra-membranous bones such as vertebrae and cranial struc-tures, as can be observed in calcified matrix below thetrabecula of a 17 dpf larva (Fig. 6K), and in mineralizingbranchial arches, but also aorta and cardiac arterial bulbusof a 26 dpf post-larva (arrowhead in Fig. 6L).
1.9. Relationship between expression of bgp and mgpmRNAs and the onset of metamorphosis
The analysis of mRNA transcripts for bgp and mgp instages ranging 32 hpf to 47 dpf by quantitative real-timePCR revealed expression of both transcripts in all develop-mental stages investigated, but with different patterns forthe two species (Figure 3 in supplementary data). In zebra-fish there was a peak for Bgp at 120 hpf, corresponding tothe periods when calcification of cranial bones and initialformation of axial skeleton elements take place. The pat-tern of mgp levels closely matched that of bgp with expres-sion levels of both genes increasing in parallel throughoutlarval development and showing stable expression levelsof mRNA at late larval and juvenile stages.
In contrast, in sole, mgp mRNA was less abundant thanbgp until 14 dpf. At this stage, which corresponds to thebeginning of metamorphosis, we observed a dramaticincrease (over 100-fold) of both bgp and mgp expression,coincident with the time of dramatic rotation of the skeletalstructures to the ocular (right) side. This increase may berelated both to the high number of structures that formde novo and calcify during the metamorphosis and to thecorresponding need for rearrangement of pre-existingstructures, which must rotate and change morphology.By 20 dpf, as metamorphosis ended, bgp mRNA levelsreturned transiently to the pre-metamorphic stages, butagain increased in juveniles possibly reflecting an increasein bone formation at a stage, with a high number of
mulation at different developmental stages. (A–K) Bgp in zebrafish. (A)8 dpf larva (200·); counterstaining with toluidine blue. (9B) Accumulation(400·). (C) Accumulation of Bgp in Meckel’s cartilage of a 13 dpf larvaemal arches at 13 dpf (1000·). (E) Accumulation of Bgp in the calcifyinge accumulation at the periphery of the coracoid undergoing perichondralmineralizing urostile at 20 dpf (400·). (G) Accumulation of Bgp in the
es (Ha) at 20 dpf (200·). (H) Bgp accumulation in the vertebral column,audal fin and in the mineralized fin rays of a 31 dpf juvenile (100·). (I)cartilages of the head region, e.g., supramaxillary (arrow) and associatedurrounds the eye (100·). (J) Accumulation of Bgp is widely detected byulation in epithelial cells from some renal tubules of the kidney in juveniles
ng vertebra (arrows) surrounding the notochord of a 15 dpf larvae (400·).dpf (M1 bright field and M2 dark field) (250·). (N) Accumulation of Bgpcalcified branchial arches of a 41 dpf juvenile (O1 bright field and O2 dark
rum lacks staining, shown here in cranial bones of a 20 dpf larvae.

Fig. 5. In situ localization of zebrafish and sole mgp mRNA. Sites of mgp gene expression were detected by in situ hybridization in sections of zebrafish(A–L) and sole larvae (M–O). (A) mgp expression in the ethmoid plate of a 96 hpf larva (200·). (B) Detection of mgp expression in chondrocytes from thetrabecular cartilage (T) and ceratobranchial arches from a 9 dpf larva (Cb) (1000·). (C) mgp expression in Meckel’s cartilage (Mc) and palato quadrate(PQ) in a 9 dpf larva (100·). (D) Cartilage from the pectoral fin of a 10 dpf larva showing mgp expression located within the chondrocytes (arrow). Notethe absence of signal in the cleithrum (asterisk) (1000·). (E) In 13 dpf larvae, mgp expression in the ceratobranchials (Cb) and in the BOP (1000·). (F) At13 dpf, mgp expression was also evident in the hypertrophic chondrocytes from Meckel’s cartilage (Mc), ethmoid plate (Ep), and in chondrocytes from thebasibranchial cartilage (Bb) (200·). (G) mgp expression in a 16 dpf larva, showing expression in chondrocytes from the BOP (arrowhead) (1000·). (H) At16 dpf, mgp expression is also detected in hypertrophic chondrocytes of Meckel’s cartilage (Mc) and in chondrocytes from the ethmoid plate (Ep) (1000·).(I) 17 dpf larva showing mgp expression in chondrocytes from the optic capsules (arrowheads) (1000·). (J) Gill filaments showing mgp expression close tothe plasma membrane in chondrocytes from the Zellknorpel (arrow) (1000·). (K) mgp expression in endosteal cells surrounding the vertebral centra fromthe neural arch (Na) in a 25 dpf larva (1000·). (L) mgp expression in chondrocytes from the pterigophores in a 25 dpf larva (Pt). Note also the presence offusiform cells surrounding the central core of a vertebra (arrow) (1000·). (M) mgp expression at the ceratobranchials (Cb), trabecula (T), andhyosymplectic (asterisk) at 11 dpf (200·). (N) mgp expression in the chondrocytes of the dorsal pterigophores (Pt) at 17 dpf (500·). (O) mgp geneexpression in the vertebral cartilage at 47 dpf (1000·).
646 P.J. Gavaia et al. / Gene Expression Patterns 6 (2006) 637–652

Fig. 6. Immunohistochemical detection of Mgp accumulation in zebrafish (A–I) and sole (J–L). (A) Accumulation of Mgp in the otolith at 6 dpf (400·)and (B) in the otolith and cleithrum at 8 dpf (400·); (C) Consecutive section (to that in B) of the otolith (arrowhead) and cleithrum (arrow) stained byAlizarin red and counterstained with toluidine blue (400·); (D) accumulation of Mgp at the zones initiating mineralization of neural arches in pleuralvertebrae 3–5 of a 13 dpf larva (1000·); (E) accumulation of Mgp in the mineralizing branchial arches and pharyngeal teeth at 13 dpf; (F) consecutivesection (to that in E) stained with von Kossa’s; (G) Mgp accumulation in the forming caudal vertebra and associated arches at 20 dpf (250·); (H) Mgpaccumulation in the preopercular bones under endochondral ossification (arrows) in a 40 dpf juvenile (1000·); (I) Mgp accumulation in skull bonesundergoing intramembranous ossification (arrow) at 40 dpf (1000·); (J) Mgp accumulation in the otic capsule (OC) at 8 dpf (200·); (K) Mgp accumulationin the mineralizing matrix under the trabecula (T) of a 17 dpf larva (400·); (L) Mgp accumulation in the mineralizing branchial arches and pharyngealteeth of a 26 dpf (200·), but also in the aorta and cardiac arterial bulbus (arrowhead). No staining was observed in control sections incubated with preimmune serum (results not shown).
P.J. Gavaia et al. / Gene Expression Patterns 6 (2006) 637–652 647
calcified structures that are rapidly increasing in thickness.In contrast, mgp expression levels remained high through-out metamorphosis and in juveniles.
1.10. Sites of Mgp accumulation in freshwater versus marine
fish
We made a comprehensive study of gene expression andprotein accumulation for these two important mineraliza-
tion-related proteins during d evelopment of the skeletonin these fish species with different ecologies. Arterial accu-mulation of Mgp was not observed in zebrafish. In con-trast, marine fish like sole do accumulate Mgp in thearterial walls. This is consistent with the proposed rolefor Mgp in inhibiting ectopic mineralization coupled withthe fact that marine species experience a much higher con-centration of calcium both in their environment and intheir extracellular fluids (Boyd, 1979; Wurst, 1987).

Fig. 7. Chromosomal localization of zebrafish mgp and bgp using the LN54 panel. mgp and bgp map on LG3, at 9.54cR from Z1209 and 3.87cR fromZ15479 markers, respectively. Some synteny was observed between zebrafish LG3 and human chromosomes 1 and 12, as indicated by lines betweensyntenic homologues.
648 P.J. Gavaia et al. / Gene Expression Patterns 6 (2006) 637–652
1.11. Sites of Bgp and Mgp accumulation in fish versus
mammals
Data on expression and accumulation of Bgp and Mgpare summarized in Tables 1 and 2. It is clear that expressionof mgp is detected only in cartilaginous structures or form-ing endochondral bones, soon after the formation of thecorresponding structure, while bgp is expressed shortlyafter the onset of mineralization in all structures. In theotoliths, we only observed an accumulation of both pro-teins since they are non-cellular structures.
Mgp in zebrafish and sole accumulated mainly in siteswhere a calcified matrix was present, either bone, teethor calcified cartilage, in contrast to observations in A.
regius where Mgp accumulated not only in mineralizedstructures (Simes et al., 2003; Ortiz-Delgado et al.,2005) but also in non-mineralized cartilage matrix andin chondrocytes (Simes et al., 2003). The reason for thisdiscrepancy is not clear but could be related to the ageof the analyzed fish or to other intrinsic differencesbetween species. However, our results for both sole andzebrafish are in general agreement with those found inmammals, where Mgp was found to accumulate only inthe extracellular matrix of bone, cartilage, and toothcementum (Price et al., 1983; Hashimoto et al., 2001),despite the fact that mgp mRNA was present in cartilageand various soft tissues, particularly in heart, kidney,and arterial vessel wall (Fraser and Price, 1988).
Previous studies carried out in mammals reported thatBgp appears to be absent during early stages of osteoblastmaturation, being undetectable in undifferentiated or
recently differentiated osteoblasts near the growth platebut clearly detectable in mature osteoblasts (Mark et al.,1988; Liu et al., 1994). Likewise, studies on the accumula-tion of Bgp in osteoblastic cells by immunolabeling couldonly detect this protein in cuboidal cells with a clear osteo-blastic phenotype (Liu et al., 1994). The relationshipbetween Bgp and mineralization remains unclear evenwithin the same species, since some authors detect Bgp pri-or to mineralization (Bronckers et al., 1987; Gerstenfeldet al., 1987; Mark et al., 1988; Liu et al., 1994) and othersat the onset or after the beginning of mineralization (Grootet al., 1986; Boivin et al., 1990; Owen et al., 1990, 1991;Pockwinse et al., 1992; Pinto et al., 2001). This discrepancyremains to be explained.
2. Materials and methods
2.1. Larval rearing and maintenance
Sole eggs were collected from natural spawning of a broodstock adapt-ed to captivity, incubated, and fed as previously described (Gavaia et al.,2002). Zebrafish eggs were obtained from natural spawning of wild-typebreeding fish, maintained at 28.5 �C on a 14 h light/10 h dark photoperi-od. Larvae were maintained and raised by standard methods, accordingto Westerfield (1995). Samples of larval and juvenile individuals were ran-domly collected at regular intervals, from hatching to juvenile stages. Forhistological analysis, individuals were anesthetized with 0.1% 2-phenoxy-ethanol (Sigma, St. Louis, MO) and fixed in buffered 4% paraformalde-hyde (pH 7.4 in PBS) for 24 h at 4 �C. After fixation, samples processedfor skeletal double staining or conserved in methanol at �20 �C until fur-ther processing. For RNA preparation, individuals were frozen in liquidnitrogen and either immediately processed or stored at �80 �C for lateruse.

Table 1Summarized information on the development of skeletal structures of D. rerio with times of cartilaginous appearance, mineralization and detection of mgp
and bgp by in situ hybridization ( ) and immunolocalization ( )
Age is expressed in days post-fertilization (dpf).
Table 2Summarized information on the development of skeletal structures of Solea senegalensis with times of cartilaginous appearance, mineralization anddetection of mgp and bgp by in situ hybridization ( ) and immunolocalization ( )
Age (DPF) 0 1 2 3 4 5 6 7 8 9 10 11 12 13 14 15 16 17 18 19 20 21 22 23 24 25 26 27 28 29 30 31 32 33 34 Structure
Hypurals
Vertebrae and arches
Cleithrum
Basioccipital articulatory process
BGP
MGP
Calcium
Cartilage
BGP
MGP
Calcium
Cartilage
BGP
MGP
Calcium
Cartilage
BGP
MGP
Calcium
Cartilage
BGP
MGP
Calcium
Cartilage
Otolith
Age is expressed in days post-fertilization (dpf).
P.J. Gavaia et al. / Gene Expression Patterns 6 (2006) 637–652 649
2.2. Histological procedures
Development of skeletal structures was followed from hatching tojuvenile stages through specific whole mount staining according toGavaia et al. (2000). Some individuals of the same age and develop-
mental stage those used for whole mount skeletal staining wereincluded either in paraffin or Historesin Plus (Jung), sectioned (6–8or 2–5 lm, respectively), collected in TESPA (3-aminopropyltriethoxy-silane, Sigma)-coated slides, and stained for detection of mineraldeposits either with Alizarin red S/hematoxylin or with silver nitrate

650 P.J. Gavaia et al. / Gene Expression Patterns 6 (2006) 637–652
by the von Kossa’s method. Adjacent sections were stained withhematoxylin–eosin (HE) or toluidine blue to identify physiologicalstructures.
Tartrate resistant acid phosphatase (TRAP) detection was performedusing a modification of a previously established method (Burstone,1959). Plastic sections of mineralizing larvae and juveniles were incubatedin a working solution containing naphthol-ASBI-phosphate, sodiumnitrite, hexazotized pararosanilin, and 50 mM sodium tartrate in veronalacetate buffer at pH 5, for 1 h at 37 �C. Counterstaining was performedwith hematoxylin. After staining, the sections were dehydrated andmounted with EUKIT (Merck).
Alkaline phosphatase activity was demonstrated by incubating samplesfor 1 h at 37 �C in a solution containing naphthol AS-MX phosphate, Fastblue BB, and magnesium sulfate, in 0.1 M Tris buffer (pH 8.0). Counter-staining was performed with nuclear fast red for 10 min. After staining,the sections were dehydrated by air-drying and mounted with EUKIT.
2.3. Molecular cloning of bgp cDNAs
Partial cDNAs for zebrafish and sole bgp (Accession Nos. AY078413and AF059349, respectively) were amplified by RT-PCR from totalRNA extracted from vertebral columns and heads of adult fishes by stan-dard conditions using a specific forward primer, respectively, ZbBGP6F(designed from the N-terminal amino acid sequence previously obtained,Simes et al., 2004) or SBG5F (designed based on alignments of all fishbgp sequences previously known) and the universal adapter as reverseprimer. The 5 0 ends of the two cDNAs were amplified by 5 0 RACE-PCR using poly(A+) RNA from either a whole zebrafish specimen or amix of vertebral column, branchial arches, kidney, and heart of a juvenilesole, the Marathon cDNA Amplification Kit (Clontech), and specificreverse primers (ZbBGP1R or SseBGP1R) designed within the corre-sponding partial bgp cDNA sequences previously obtained. Amplificationconditions used were those indicated by the supplier. All PCR productswere inserted into pGEMT (Promega), cloned, and identified by standardDNA sequence analysis.
2.4. Molecular cloning of mgp cDNAs
A partial cDNA sequence for zebrafish mgp (BF938148) was obtainedby TblastN search on the NCBI GenBank (EST: fm73a11.y1). One for-ward primer was designed based on this sequence (DrMGP1F) and usedto amplify the complete 3 0 end sequence by RT-PCR using total RNAobtained from heads and vertebral columns and the universal adapter asreverse primer. A partial sole mgp sequence was amplified by RT-PCRfrom total RNA isolated from head and vertebral column using a consen-sus forward primer (CorvMGP3F, Simes et al., 2003) and the universaladapter as reverse primer. The 5 0-ends were amplified by RACE-PCRusing specific reverse primers constructed based on the partial mgp cDNAsequences (DrMGP1R) and (SseMGP1R) and the same Marathonlibraries and PCR conditions of bgp cDNA 5 0-end amplifications. PCRproducts were inserted into the plasmid pGEMT, cloned, and identifiedby standard DNA sequence analysis. Complete cDNAs were submittedto the GenBank database with Accession Nos. AY072811 (zebrafish)and AY113679 (sole).
2.5. Detection of bgp/mgp gene expression by quantitative real-time
PCR
Total RNA was isolated with Trizol reagent from different larval andjuvenile stages, ranging from 32 h post-fertilization (hpf) to 47 days post-fertilization (dpf). One microgram of total RNA was reverse transcribedusing an oligo(dT) adapter. Real-time PCR was performed in an iCycleriQ PCR system (Bio-Rad), using the following primer sets: (1) for zebrafish:ZBGP8F and ZBGP2R for bgp, DrMGP4F and DrMGP2R for mgp, andDr28SRIB1F and Dr28SRIB for 28S ribosomal RNA; (2) for sole:SsBGP3F and SsBGP2R for bgp, SsMGP2F and SsMGP2R for mgp,and SsACT1F and SsACT1R for. b-Actin (based on a partial sequence
previously obtained, AF059350). The PCRs were set up in triplicate byadding 2 ll of a 1:10 cDNA dilution to a 18 ll reaction mix containing0.5 lM of each primer, and 10 ll iQ SYBR green Supermix (Bio-Rad).The PCR program contained an initial cycle of 3 min at 95 �C followed by50 cycles comprising of a denaturation at 95 �C for 30 s and annealing/extension at 68 �C for 30 s. The fluorescence was measured at the end ofeach extension cycle in the FAM-490 channel. Relative levels of expressionwere determined using as control levels those found for the youngestspecimen analyzed in each species (29 hpf for zebrafish and 72 hpf for sole).All primer sequences used are provided as supplementary data (Table 1s).
2.6. Immunohistochemistry and in situ hybridization
Immunohistochemistry was performed as described using rabbit poly-clonal primary antibodies previously validated for zebrafish and sole Bgp
and Mgp (Simes et al., 2004). For in situ hybridization, digoxigenin(DIG)-labeled sense and antisense RNA probes were synthesized fromthe cDNA sequences obtained following manufacturer’s specificationswith either T7 or SP6 RNA polymerases (Boehringer–Mannheim). Sec-tions were prepared and in situ hybridization was performed as described(Simes et al., 2003).
2.7. Zebrafish chromosomal mapping of mgp and bgp
Zebrafish mgp and bgp were mapped on the radiation hybrid panelLN54 (Hukriede et al., 1999) by PCR using primer pairs ZFMGP-MAP1F/ZFMGPMAP1R and ZFBGPMAP1F/ZFBGPMAP1R.
Acknowledgments
This work was partially funded by research Grants POC-TI/CVT/42098/2001 (FISHDEV) from the Portuguese Sci-ence and Technology Foundation (FCT) and MCYT/AGL2003-03558 from the Spanish Ministry of Science andTechnology. Part of this work was performed under a collab-orative action between L. Cancela and R. Kelsh, fundedthrough a Portuguese C.R.U.P.-British council protocol.P.J. Gavaia and J.P. Pinto were recipients, respectively, ofPhD (PRAXIS XXI/BD/19665/99) and post-doctoral(PRAXIS XXI/BPD/20229/99) fellowships from FCT.The authors thank Dr. Marie-Andre Akimenko from theLoeb Research Institute in Ottawa for reviewing and com-ments. We thank Dr. Marc Ekker, from the Center for Ad-vanced Research in Environmental Genomics, Universityof Ottawa, for kindly providing the LN54 radiation hybridpanel.
Appendix A. Supplementary data
Comparison between zebrafish and sole BGP (Figure 1s)and MGP (Figure 2s) cDNA sequences, primer sequences(Table 1s), and Real-Time PCR results (Figure 3s) are pro-vided as supplementary material. Supplementary dataassociated with this article can be found, in the online ver-sion, at doi:10.1016/j.modgep.2005.11.010.
References
Amores, A., Force, A., Yan, Y.L., Joly, L., Amemiya, C., Fritz, A., Ho,R.K., Langeland, J., Prince, V., Wang, Y.L., et al., 1998. Zebrafishhox clusters and vertebrate genome evolution. Science 282, 1711–1714.

P.J. Gavaia et al. / Gene Expression Patterns 6 (2006) 637–652 651
Barbazuk, W.B., Korf, I., Kadavi, C., Heyen, J., Tate, S., Wun, E., Bedell,J.A., McPherson, J.D., Johnson, S.L., 2000. The syntenic relationshipof the zebrafish and Human genomes. Genome Res. 10, 1351–1358.
Boivin, G., Morel, G., Lian, J.B., Anthione-Terrier, C., Dubois, P.M.,Meunier, P.J., 1990. Localization of endogenous osteocalcin inneonatal rat bone and its absence in articular cartilage: effect ofwarfarin treatment. Pathol. Anat. 417, 505–512.
Boyd, C.E., 1979. Water Quality in Warmwater Fish Ponds. AuburnUniversity Press, Auburn, AL, 359 pp.
Bronckers, A.L., Gay, S., Finkelman, R.D., Butler, W.T., 1987. Devel-opmental appearance of Gla proteins (osteocalcin) and alkalinephosphatase in tooth germs and bones of the rat. Bone Miner. 2 (5),361–373.
Burstone, M.S., 1959. Histochemical demonstration of acid phosphataseactivity in osteoclasts. J. Histochem. Cytochem. 7, 39–41.
Cancela, L., Hsieh, C.L., Francke, U., Price, P.A., 1990. Molecularstructure, chromosome assignment and promoter organization ofthe Human matrix gla protein gene. J. Biol. Chem. 265, 15040–15048.
Cancela, M.L., Williamson, M.K., Price, P.A., 1995. Amino-acid sequenceof bone Gla protein from the African clawed toad Xenopus laevis andthe fish Sparus aurata. Int. J. Peptide Protein Res. 46, 419–423.
Cancela, M.L., Ohresser, M.C.P., Reia, J.P., Viegas, C.S.B., Williamson,M.K., Price, P.A., 2001. Matrix Gla Protein in Xenopus laevis:molecular cloning, tissue distribution and evolutionary considerations.J. Bone Miner. Res. 16, 1611–1622.
Conceicao, N., Henriques, N.M., Ohresser, M.C., Hublitz, P., Schule, R.,Cancela, M.L., 2002. Molecular cloning of the Matrix Gla Proteingene from Xenopus laevis. Functional analysis of the promoteridentifies a calcium sensitive region required for basal activity. Eur.J. Biochem. 269, 1947–1956.
Cubbage, C.C., Mabee, P.M., 1996. Development of the cranium andpaired fins in the zebrafish Danio rerio (Ostariophysi, Cyprinidae). J.Morphol. 229, 121–160.
Desbois, C., Hogue, D.A., Karsenty, G., 1994a. The mouse osteocalcingene cluster contains three genes with two separate spatial andtemporal patterns of expression. J. Biol. Chem. 269, 1183–1190.
Desbois, C., Seldin, M.F., Karsenty, G., 1994b. Localization of theosteocalcin gene cluster on mouse chromosome 3. Mamm. Genome 5,321–322.
Du, S.J., Frenkel, V., Kindschi, G., Zohar, Y., 2001. Visualizing normaland defective bone development in zebrafish embryos using thefluorescent chromophore calcein. Dev. Biol. 238, 239–246.
Ducy, P., Desbois, C., Boyce, B., Pinero, G., Story, B., Dunstan, C.,Smith, E., Bonadio, J., Goldstein, S., Gundberg, C., Bradley, A.,Karsenty, G., 1996. Increased bone formation in osteocalcin-deficientmice. Nature 382, 448–452.
Fraser, J.D., Price, P.A., 1988. Lung, heart, and kidney express high levelsof mRNA for the vitamin K-dependent matrix Gla protein. J. Biol.Chem. 23, 11033–11036.
Gates, M.A., Kim, L., Egan, E.S., Cardozo, T., Sirotkin, H.I., Dougan,S.T., Lashkari, D., Abagyan, R., Schier, A.F., Talbot, W.S., 1999. Agenetic linkage map for zebrafish: comparative analysis and localiza-tion of genes and expressed sequences. Genome Res. 9, 334–347.
Gavaia, P.J., Sarasquete, C., Cancela, M.L., 2000. Detection of mineral-ized structures in early stages of development of marine Teleostei usinga modified alcian blue-alizarin red double staining technique for boneand cartilage. Biotech. Histochem. 75 (2), 79–84.
Gavaia, P.J., Dinis, M.T., Cancela, M.L., 2002. Osteological developmentand abnormalities of the vertebral column and caudal skeleton inlarval and juvenile stages of hatchery-reared Senegal sole (Solea
senegalensis). Aquaculture 211, 305–323.Gerstenfeld, L.C., Chipman, S.D., Glowacki, J., Lian, J.B., 1987.
Expression of differentiated function by mineralizing cultures ofchicken osteoblasts. Dev. Biol. 122, 49–60.
Groot, C.G., Danes, J.K., Blok, J., Hoogendijk, A., Hauschka, P.V., 1986.Light and electron microscopic demonstration of osteocalcin antige-nicity in embryonic and adult rat bone. Bone 7, 379–385.
Hao, H., Hirota, S., Ishibashi-Ueda, H., Kushiro, T., Kanmatsuse, K.,Yutani, C., 2004. Expression of matrix Gla protein and osteonectinmRNA by human aortic smooth muscle cells. Cardiovasc. Pathol. 13,195–202.
Hashimoto, F., Kobayashi, Y., Kobayashi, E.T., Sakai, E., Kobayashi,K., Shibata, M., Kato, Y., Sakai, H., 2001. Expression and localizationof MGP in rat tooth cementum. Arch. Oral Biol. 46, 585–592.
Hukriede, N., Joly, L., Tsang, M., Miles, J., Tellis, P., Epstein, J.,Barbazuk, W., Li, F., Paw, B., Postlethwait, J., Hudson, T., Zon, L.,McPherson, J., Chevrette, M., Dawid, I., Johnson, S., Ekker, M.,1999. Radiation hybrid mapping of the zebrafish genome. Proc. Natl.Acad. Sci. USA 96, 9745–9750.
Jaillon, O., Aury, J.M., Brunet, F., Petit, J.L., Stange-Thomann, N.,Mauceli, E., Bouneau, L., Fischer, C., Ozouf-Costaz, C., Bernot, A.,Nicaud, S., Jaffe, D., Fisher, S., Lutfalla, G., Dossat, C., Segurens, B.,Dasilva, C., Salanoubat, M., Levy, M., Boudet, N., Castellano, S.,Anthouard, V., Jubin, C., Castelli, V., Katinka, M., Vacherie, B.,Biemont, C., Skalli, Z., Cattolico, L., Poulain, J., de Berardinis, V.,Cruaud, C., Duprat, S., Brottier, P., Coutanceau, J.-P., Gouzy, J., Parra,G., Lardier, G., Chapple, C., Mckernan, K.J., Mcewan, P., Bosak, S.,Kellis, M., Volff, J.-N., Guigo, R., Zody, M.C., Mesirov, J., Lindblad-Toh, K., Birren, B., Nusbaum, C., Kahn, D., Robinson-Rechavi, M.,Laudet, V., Schachter, V., Quetier, F., Saurin, W., Scarpelli, C.,Wincker, P., Lander, E.S., Weissenbach, J., Crollius, H.R., 2004.Genome duplication in the teleost fish Tetraodon nigroviridis reveals theearly vertebrate proto-karyotype. Nature 431, 946–957.
Johnson, T.L., Sakaguchi, A.Y., Lalley, P.A., Leach, R.J., 1991. Chro-mosomal assignment in mouse of matrix GLA protein and bone GLAprotein genes. Genomics 11, 770–772.
Laize, V., Martel, P., Viegas, C.S.B., Price, P.A., Cancela, M.L., 2005.Evolution of matrix and bone c-carboxyglutamic acid proteins invertebrates. J. Biol. Chem. 280 (29), 26659–26668.
Liu, F., Malaval, L., Gupta, A.K., Aubin, J.E., 1994. Simultaneousdetection of multiple bone-related mRNAs and protein expressionduring osteoblast differentiation: polymerase chain reaction andimmunocytochemical studies at the single cell level. Dev. Biol. 166,220–234.
Luo, G., D’Souza, R., Hogue, D., Karsenty, G., 1995. The matrix Glaprotein gene is a marker of the chondrogenesis cell lineage duringmouse development. J. Bone Miner. Res. 10, 325–334.
Luo, G., Ducy, P., McKee, M.D., Pinero, G.J., Loyer, E., Behringer,R.R., Karsenty, G., 1997. Spontaneous calcification of arteries andcartilage in mice lacking matrix Gla protein. Nature 386, 78–81.
Mark, M.P., Butler, W.T., Prince, C.W., Finkelman, R.D., Ruch, J.V.,1988. Developmental expression of 44-kDa bone phosphoprotein(osteopontin) and bone gamma-carboxyglutamic acid (Gla)-containingprotein (osteocalcin) in calcifying tissues of rat. Differentiation 37,123–136.
Newman, B., Gigout, L.I., Sudre, L., Grant, M.E., Wallis, G.A., 2001.Coordinated expression of matrix Gla protein is required duringendochondral ossification for chondrocyte survival. J. Cell Biol. 154(3), 659–666.
Neugebauer, B.M., Moore, M.A., Broess, M., Gerstenfeld, L.C., Haus-chka, P.V., 1995. Characterization of structural sequences in thechicken osteocalcin gene: expression of osteocalcin by maturingosteoblasts and by hypertrophic chondrocytes in vitro. J. Bone Miner.Res. 10 (1), 157–163.
Nishimoto, S.K., Araki, N., Robinson, F.D., Waite, J.H., 1992. Discoveryof bone c-carboxyglutamic acid protein in mineralized scales. Theabundance and structure of Lepomis macrochirus bone c-carboxyglu-tamic acid. J. Biol. Chem. 267 (16), 11600–11605.
Ortiz-Delgado, J.B., Simes, D.C., Gavaia, P.J., Sarasquete, C., Cancela,M.L., 2005. Expression and localization of osteocalcin (BGP) andmatrix GLA protein (MGP) in developing teleost teeth. Identificationof sites of mRNA and protein accumulation at single cell resolution.Histochem. Cell Biol. 124 (2), 123–130.
Owen, T.A., Aronow, M., Shalhoub, V., Barone, L.M., Wilming, L.,Tassinari, M.S., Kennedy, M.B., Pockwinse, S., Lian, J.B., Stein, G.S.,

652 P.J. Gavaia et al. / Gene Expression Patterns 6 (2006) 637–652
1990. Progressive development of the rat osteoblast phenotype in vitro:reciprocal relationships in expression of genes associated with osteo-blast proliferation and differentiation during formation of the boneextracellular matrix. J. Cell. Physiol. 143, 420–430.
Owen, T.A., Aronow, M.A., Barone, L.M., Bettencourt, B., Stein, G.S.,Lian, J.B., 1991. Pleiotropic effects of vitamin D on osteoblast geneexpression are related to the proliferative and differentiated state of thebone cell phenotype: dependency upon basal levels of gene expression,duration of exposure, and bone matrix competency in normal ratosteoblast cultures. Endocrinology 128, 1495–1504.
Pinto, J.P., Ohresser, M., Cancela, M.L., 2001. Cloning of the bone Glaprotein gene from the teleost fish Sparus aurata. Evidence for overallconservation in molecular structure and pattern of expression from fishto man. Gene 270, 77–91.
Pinto, J.P., Conceicao, N., Gavaia, P.J., Cancela, M.L., 2003. Matrix Glaprotein gene expression and protein accumulation co-localize withcartilage distribution during development of the teleost fish Sparus
aurata. Bone 32, 201–210.Piotrowski, T., Schilling, T.F., Brand, M., Jiang, Y.-J., Heisenberg,
C.-P., Beuchle, D., Grandel, H., van Eeden, F.J.M., Furutani-Seiki, M., Granato, M., Haffter, P., Hammerschmidt, M., Kane,D.A., Kelsh, R.N., Mullins, M.C., Odenthal, J., Warga, R.M.,Nusslein-Volhard, C., 1996. Jaw and branchial arch mutants II:anterior arches and cartilage differentiation. Development 123,345–356.
Pockwinse, S., Wilming, L., Conlon, D., Stein, G.S., Lian, J.B., 1992.Expression of cell growth and bone specific genes at single cellresolution during development of bone tissue-like organization inprimary osteoblast cultures. J. Cell Biochem. 49, 310–323.
Price, P.A., Otsuka, A.S., Poser, J.W., Kristaponis, J., Raman, N., 1976.Characterization of a gamma-carboxyglutamic acid-containing proteinfrom bone. Proc. Natl. Acad. Sci. USA 73 (5), 1447–1451.
Price, P.A., Otsuka, A., Poser, J.W., 1977. Comparison of gamma-carboxyglutamic acid containing proteins from bovine and swordfishbone: primary structure and Ca2+ binding. In: Wasserman, R.H. et al.(Eds.), Calcium Binding Proteins and Calcium Functions. Elsevier/North-Holland, New York, pp. 333–337.
Price, P.A., Urist, M.R., Otawara, Y., 1983. Matrix Gla protein, a new c-carboxyglutamic acid-containing protein which is associated with theorganic matrix of bone. Biochem. Biophys. Res. Commun. 117, 765–771.
Price, P.A., 1990. Vitamin K-dependent bone proteins. In: Saito, H.,Suttie, J.W. (Eds.), Vitamin K-Dependent Proteins and Their Meta-bolic roles. Elsevier, New York, pp. 49–70 (Chapter 3).
Puchacz, E., Lian, J.B., Stein, G.S., Wozney, J., Huebner, K., Croce, C.,1989. Chromosomal localization of the Human osteocalcin gene.Endocrinology 124, 2648–2650.
Rice, J.S., Williamson, M.K., Price, P.A., 1994. Isolation and sequence ofthe vitamin K-dependent matrix Gla protein from the calcifiedcartilage of the Soupfin shark. J. Bone Miner. Res. 9, 567–576.
Roy, M.E., Nishimoto, S.K., Rho, J.Y., Bhattacharya, S.K., Lin, J.S.,Pharr, G.M., 2001. Correlations between osteocalcin content, degreeof mineralization, and mechanical properties of C. carpio rib bone. J.Biomed. Mater. Res. 54, 547–553.
Schilling, T.F., Kimmel, C.B., 1997. Musculoskeletal patterning inthe pharyngeal segments of the zebrafish embryo. Development 124,2945–2960.
Schilling, T.F., Piotrowski, T., Grandel, H., Brand, M., Heisenberg, C.-P.,Jiang, Y.-J., Beuchle, D., Hammerschmidt, M., Kane, D.A., Mullins,M.C., van Eeden, F.J.M., Kelsh, R.N., Furutani-Seiki, M., Granato,M., Haffter, P., Odenthal, J., Warga, R.M., Trowe, T., Nusslein-Volhard, C., 1996. Jaw and branchial arch mutants in zebrafish I:branchial arches. Development 123, 329–344.
Simes, D.C., Williamson, M.K., Ortiz-Delgado, J.B., Viegas, C.S.B.,Price, P.A., Cancela, M.L., 2003. Purification of Matrix Gla Proteinfrom a marine teleost fish, Argyrosomus regius: calcified cartilage andnot bone as the primary site of MGP accumulation in fish. J. BoneMiner. Res. 18, 244–259.
Simes, D.C., Williamson, M.K., Schaff, B.J., Gavaia, P.J., Ingleton, P.M.,Price, P.A., Cancela, M.L., 2004. Characterization of osteocalcin(BGP) and matrix Gla protein (MGP) fish specific antibodies:validation for immunodetection studies in lower vertebrates. Calcif.Tissue Int. 74, 170–180.
Strauss, P.G., Closs, E.I., Schimdt, J., Erfle, V., 1990. Gene expressionduring osteogenic differentiation in mandibular condyles in vitro.J. Cell Biol. 110, 1369–1378.
Viegas, C.S., Pinto, J.P., Conceicao, N., Simes, D.C., Cancela, M.L., 2002.Cloning and characterization of the cDNA and gene encoding Xenopus
laevis osteocalcin. Gene 289, 97–107.Yagami, K., Suh, J.-Y., Enomoto-Iwamoto, M., Koyama, E., Abrams,
W.R., Shapiro, M.S., Pacifici, M., Iwamoto, M., 1999. Matrix GlaProtein is a developmental regulator of chondrocyte mineralizationand, when constitutively expressed, blocks endochondral and intra-membranous ossification in the limb. J. Cell Biol. 147 (5), 1097–1108.
Westerfield, M., 1995. The Zebrafish Book. Guide For The Laboratory Useof Zebrafish (Danio rerio), third ed. University of Oregon Press, Eugene.
Witten, P.E., Hansen, A., Hall, B.K., 2001. Features of mono- andmultinucleated bone resorbing cells of the zebrafish Danio rerio andtheir contribution to skeletal development, remodeling, and growth.J. Morphol. 250, 197–207.
Wurst, W.A. (1987). An evaluation of specific ionic and growth param-eters affecting the feasibility of commercially producing red drum(Sciaenops ocellatus). Doctoral dissertation. Texas A&M University,College Station, Texas, USA.
Related Documents


