Osmotic Extraction of Hypotonic Fluid from the Lungs RIcEIARi M. EFFROS From the Department of Medicine, New Jersey School of Medicine, Newark, New Jersey 07103 A B S T R A C T After injections of sucrose, NaCl, and urea solutions, the flow of tissue fluid from the lungs amounted to 0.182, 0.216, and 0.152 X 10' mi/s per mosmol/kg of concentration difference between plasma and tissues in each gram of wet tissue weight. The ex- tracted fluid contained less than 20% of the Na', K' and urea concentrations of the plasma. It was concluded that this fluid was distinctly hypotonic in comparison with the fluids of the plasma and tissue compartments both before and after the injection of hypertonic solutions. The presence of low solute concentrations in the ex- tracted fluid is attributed to the passage of this fluid across cellular membranes, which are relatively imperme- able to small hydrophilic solutes. Movement of fluid out of the junctions appears to be less than that through the endothelial cells. It is suggested that the injected solutes rapidly leak into the junctions and consequently induce relatively little movement of water or tissue solutes out of the junctions. Concentrations of tritiated water and ["4C]antipyrine in the extracted fluid are essentially the same as base-line plasma concentrations when the ani- mals have been primed with these tracers. It is there- fore likely that these tracers can readily traverse cellu- lar membranes. Red cell transit through the lungs is impaired by hy- pertonic solutions of sucrose and NaCl with transient increases in pulmonary arterial hemoglobin concentra- tions of as much as 35% of base-line values. INTRODUCTION Basic to the Starling hypothesis of capillary fluid ex- change is the assumption that the capillaries restrict the passage of large "proteid" molecules but readily permit the movement of water and small solute molecules, such as sodium and chloride ions (1-3). Starling found that An abstract of this work was presented at the annual meeting of the Microcirculatory Society in 1973 and was published in Microvasc. Res. 6: 120-121, 1973. Received for publication 3 July 1973 and in revised form 28 May 1974. the decline of intravascular pressure that followed acute hemorrhage resulted in the passage of isotonic fluid from the tissues to the blood. He concluded that the protein oncotic pressure of the plasma was responsible for this flow of isotonic fluid. Over the past 20 yr, a number of studies have been made of the flow of fluid from tissues induced by hyper- tonic solutions of small solute molecules (4-8). The ef- fect of leakage of small solute molecules out of the vas- cular space may be evaluated in terms of the reflection coefficients of the capillaries to these solutes (9). The reflection coefficients provide a measure of the relative efficacy of such solutions in dehydrating tissues in com- parison to equivalent solutions of impermeant large molecules or decreases in capillary hydrostatic pressure. These reflection coefficients may be used to estimate the dimensions of the "pores" through which the small sol- ute molecules leak (5-7, 10, 11). Although some information has been obtained on the quantity of fluid extracted from tissues by hypertonic solutions of low molecular weight solutes, there appears to be little information available on the nature of this fluid. In the present study, concentrations of hemo- globin, T-1824-labeled plasma protein, and a number of small solutes are measured in the blood emerging from the lungs after injections of hypertonic solutions. From these data, it is possible to determine not only the net quantity of fluid removed from the lungs, but the solute concentration of this fluid as well. In marked contrast to the isotonic tissue fluid flows observed by Starling after decreases in capillary hydrostatic pressure, the fluid re- moved from the lungs by hypertonic solutions of small solutes appears to be distinctly hypotonic. It is shown on the basis of a model of parallel flows through capil- lary cells and junctions that these observations are quite consistent with the Starling hypothesis that small solute molecules rapidly traverse the capillary walls. METHODS Two groups of experiments were performed. In the first group, measurements were made of the flow of fluid from The Journal of Clinical Investigation Volume 54 October 1974 935-947 935

Welcome message from author
This document is posted to help you gain knowledge. Please leave a comment to let me know what you think about it! Share it to your friends and learn new things together.
Transcript
Osmotic Extraction of Hypotonic Fluid from the Lungs
RIcEIARi M. EFFROS
From the Department of Medicine, NewJersey School of Medicine,Newark, NewJersey 07103
A B S T R A C T After injections of sucrose, NaCl, andurea solutions, the flow of tissue fluid from the lungsamounted to 0.182, 0.216, and 0.152 X 10' mi/s permosmol/kg of concentration difference between plasmaand tissues in each gram of wet tissue weight. The ex-tracted fluid contained less than 20% of the Na', K' andurea concentrations of the plasma. It was concluded thatthis fluid was distinctly hypotonic in comparison withthe fluids of the plasma and tissue compartments bothbefore and after the injection of hypertonic solutions.
The presence of low solute concentrations in the ex-tracted fluid is attributed to the passage of this fluidacross cellular membranes, which are relatively imperme-able to small hydrophilic solutes. Movement of fluid outof the junctions appears to be less than that through theendothelial cells. It is suggested that the injected solutesrapidly leak into the junctions and consequently inducerelatively little movement of water or tissue solutes outof the junctions. Concentrations of tritiated water and["4C]antipyrine in the extracted fluid are essentially thesame as base-line plasma concentrations when the ani-mals have been primed with these tracers. It is there-fore likely that these tracers can readily traverse cellu-lar membranes.
Red cell transit through the lungs is impaired by hy-pertonic solutions of sucrose and NaCl with transientincreases in pulmonary arterial hemoglobin concentra-tions of as much as 35% of base-line values.
INTRODUCTION
Basic to the Starling hypothesis of capillary fluid ex-change is the assumption that the capillaries restrict thepassage of large "proteid" molecules but readily permitthe movement of water and small solute molecules, suchas sodium and chloride ions (1-3). Starling found that
An abstract of this work was presented at the annualmeeting of the Microcirculatory Society in 1973 and waspublished in Microvasc. Res. 6: 120-121, 1973.
Received for publication 3 July 1973 and in revised form28 May 1974.
the decline of intravascular pressure that followed acutehemorrhage resulted in the passage of isotonic fluid fromthe tissues to the blood. He concluded that the proteinoncotic pressure of the plasma was responsible for thisflow of isotonic fluid.
Over the past 20 yr, a number of studies have beenmade of the flow of fluid from tissues induced by hyper-tonic solutions of small solute molecules (4-8). The ef-fect of leakage of small solute molecules out of the vas-cular space may be evaluated in terms of the reflectioncoefficients of the capillaries to these solutes (9). Thereflection coefficients provide a measure of the relativeefficacy of such solutions in dehydrating tissues in com-parison to equivalent solutions of impermeant largemolecules or decreases in capillary hydrostatic pressure.These reflection coefficients may be used to estimate thedimensions of the "pores" through which the small sol-ute molecules leak (5-7, 10, 11).
Although some information has been obtained on thequantity of fluid extracted from tissues by hypertonicsolutions of low molecular weight solutes, there appearsto be little information available on the nature of thisfluid. In the present study, concentrations of hemo-globin, T-1824-labeled plasma protein, and a number ofsmall solutes are measured in the blood emerging fromthe lungs after injections of hypertonic solutions. Fromthese data, it is possible to determine not only the netquantity of fluid removed from the lungs, but the soluteconcentration of this fluid as well. In marked contrast tothe isotonic tissue fluid flows observed by Starling afterdecreases in capillary hydrostatic pressure, the fluid re-moved from the lungs by hypertonic solutions of smallsolutes appears to be distinctly hypotonic. It is shownon the basis of a model of parallel flows through capil-lary cells and junctions that these observations are quiteconsistent with the Starling hypothesis that small solutemolecules rapidly traverse the capillary walls.
METHODSTwo groups of experiments were performed. In the firstgroup, measurements were made of the flow of fluid from
The Journal of Clinical Investigation Volume 54 October 1974 935-947 935

_ 380< 360
X 7 340
320
U)
0
()
"I.
3
2
11.-;
E
16 0
rz) <
3 g 02- .9 0.1U)
y - 00
*I -
F-
I I I _ PA5 1U it
TIME (s)5 20
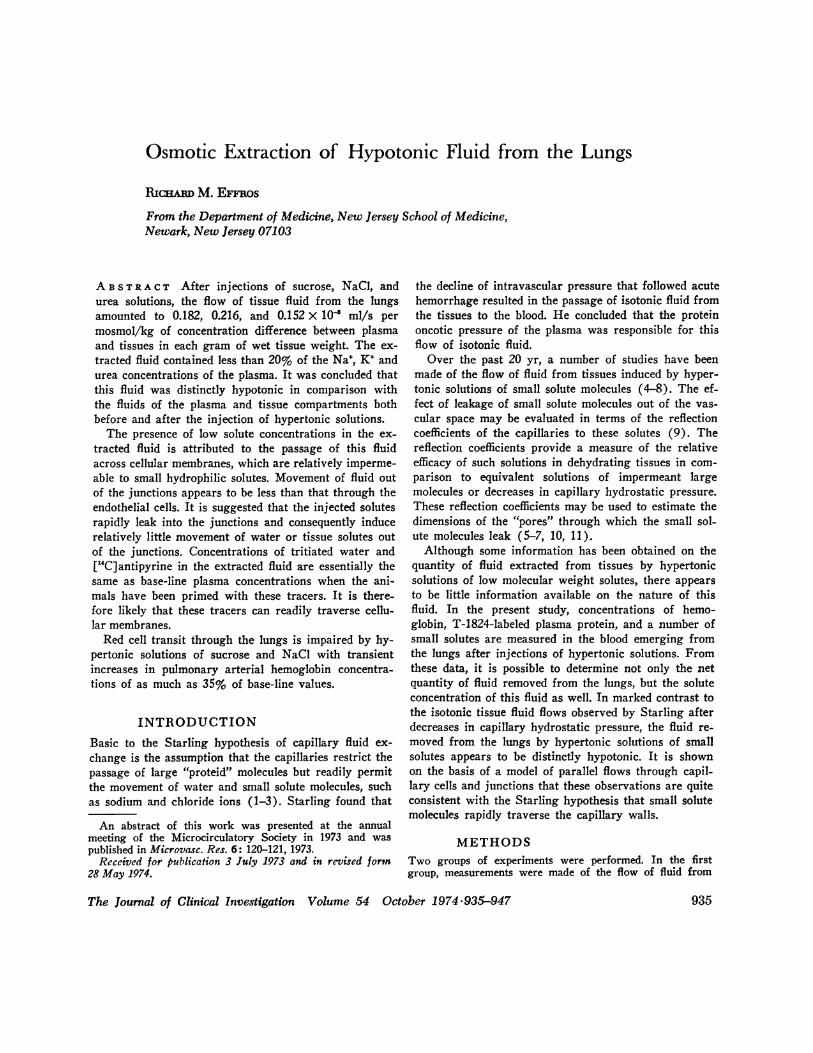
FIGURE 1 Response of tissue fluid flow to a boof Trare- Inner nnnel - nltnma oqmnlqlitvVI bU%-LV5'Z- V1JJJ1C PCUICI . 11t31aolxct wosVZaL,>1\uLLJYs k1s1s%=
by freezing point depression). Second panel: Fractionalchanges in whole blood concentration of hemoglobin (Hgb)and T-1824. Note earlier and more pronounced decline ofhemoglobin levels, attributed to impairment of red cellpassage through the lungs. Third panel: "Instantaneous"pulmonary blood flow (based on FT}IO). Fourth panel:calculated tissue fluid flow (FT). Negative values of FTindicate return of fluid to the tissue. Fifth panel: calculatedvalues of aKS/W are plotted against time.
the lungs into the blood after rapid injections of hypertonicsolutions of sucrose, NaCl, or urea. An additional calcula-tion was made of hemoglobin retention within the organ,observed after injections of hypertonic sucrose and sodiumchloride.
In the second group of experiments, solute concentrationsof the fluid removed from the lung after these inj ectionswere determined.
Osmolalities were measured by freezing-point determina-tion of plasma samples. Methods for determining soluteconcentrations and activities are described in a previouspublication (12).
Except where stated, all determinations were made inwhole blood, and changes in concentration do not reflectmovement of water or solutes between red cells and plasmaof the collected blood.
Tissue fluid flow. Determination of tissue fluid flow wasdependent upon measurement of the flow of blood throughthe lungs and the concomitant dilution of the blood by thefluid removed from the lung tissue.
Mongrel dogs were anesthetized with sodium pentobarbi-tal (30 mg/kg, i.v., and 50 mg as needed), intubated, andventilated with a Harvard pump (Harvard Apparatus Co.,
Inc., Millis, Mass.) for the duration of the study. Intra-< venous injections of succinylcholine (20 mg and as needed),
heparin (20,000-40,000 USP units), and T-1824 (300-500-J--.-- mg in 30-50 ml of 0.154 M NaCi, 30-60 min before the
hypertonic injections were begun) were then administered.T-1824 was used as a convenient indicator of plasma pro-tein concentration (primarily albumin) (13).
The thorax was opened at the level of the left atriumand a double-lumen catheter was placed in the left atrium.A second catheter was placed in the superior vena cava
oHgb by way of the right jugular vein and a third catheter was*T-1824 introduced into the aorta through the left carotid artery.
Additional catheters were placed in the femoral artery (forblood pressure measurements) and the femoral vein (forintravenous saline infusion and i.v. medications).
A volume of 3.5-8 ml of 2.25 M sucrose, 2 M NaCl, or2-9.5 M urea was rapidly injected within a 2-s intervalthrough the superior vena cava catheter. Blood was with-drawn at 4-6 ml/s from the aorta catheter with a peristalticpump and collected in serial tubes, which were changedat A-i-s intervals by a moving rack collector.
Measurement of the pulmonary blood flow that prevailedas the hypertonic bolus and the fluid extracted from thelungs arrived in the aorta was determined in the followingmanner: A solution of tritiated water (THO) l in isotonicsaline (10 mCi/liter) was infused at a constant rate (0.14ml/s) by a syringe pumip into one luinen of the left atrial
!_I____ catheter. This infusion was begun 5 s before the hyper-tonic bolus was injected into the superior vena cava. Con-centrations of the tritiated water were determined in blood
olus inj ection collected from the aorta and blood flow (FTHo) leaving the(determined lungs was calculated from the dilution of the tritiated water:
[THO].FTHO=[THOI
[THO~b (1)
where [THO] i and [THO] b designate the THO activityof the infusion solution and collected blood samples and Irepresents the flow rate of the infusion solution. (The con-tribution of the infusion rate to the blood flow was negligibleand was therefore neglected.)
The success of this procedure depends upon documenta-tion that influx and efflux of the tritiated water throughthe left heart and proximal aorta are equal when flow ismeasured. This was accomplished by giving a bolus of[fI]albumin through the second lumen of the left atrialcatheter when the THO infusion began. It was assumedthat when the [lI]albumin bolus had fully emerged in theaortic blood, influx and efflux of the THO through the leftheart and aorta had become equal. It was found in fivestudies that the outflow patterns of THO and [5I]albuminwere the same and that the recirculation of [HI] albumin(judged from a rise in concentrations above exponentiallyextrapolated values) could be used to predict recirculationof THO. These studies indicated that when blood flow wasmeasured with the THO infusion in the experiments re-ported in this paper, the outflow of THO averaged 0.97
1 Abbreviations frequently used in this paper: F, bloodflow; FT, true tissue fluid flow; FT, ., uncorrected tissue fluidflow; H, maximum excess pulmonary retention of hemo-globin; Hgb, hemoglobin; I, flow rate of infusion; Kr, fil-tration constant; S, capillary surface area; a, Stavermanreflection coefficient; THO, tritiated water; 7, collectiontube interval; W, wet weight of tissue; w, fractional con-centration. (Additional symbols are defined in the text.)
936 R. M. Effros
I

+0.03 2 (n = 18) of the infusion rate of THO and re-circulation of THOto the outflow site produced an averageerror of only 0.03±0.03 (n = 18) in the calculated bloodflow. Good correlations were found between flows deter-mined by the THO infusions and flows calculated in thesame experiments from the areas under the indicator dilu-tion curves of ['lI]albumin, osmolality, and the injectedsolute concentrations.3
It was assumed that the contribution to outflow madeby the red cells present in the outflow at any time could beestimated from the measured hemoglobin concentration ofthe collected sample and the ratio between the hematocritand hemoglobin concentration of the control blood. Similarly,it was assumed that the contribution to outflow made byplasma that had traversed the organ could be estimatedfrom the T-1824 concentration of the collected samples andthe ratio between the plasmacrit (1 - Hct) and the T-1824concentration of the control blood. There are three addi-tional sources from which fluid outflow from the lung mightbe derived: (a) the injection volume, (b) the pulmonarytissues, and (c) red cells transiently trapped within theorgan after injections of sucrose or sodium chloride (aneffect described below). Flow of fluid from all three ofthese sources is designated as FT,. and is calculated fromthe equation:
f HfIgbt- )-7u=t-1-[11gb] [Hglb]
- [T-1824] [T l824]j FTHO (2)
where FT,. refers to the calculated tissue fluid flow (un-corrected for the injection artifact described below); [Hgb]and [HgbI refer to the hemoglobin concentration in bloodperfusing the organ before the hypertonic inj ection and inthe collected sample after the injection; [T-1824]. and [T-1824] similarly refer to base-line and collection sample con-centrations of T-1824 in whole blood. Hct. designates thebase-line hematocrit, and FTHO designates the cardiac out-put determined from the THO dilution in the collectedsample.
The injection bolus contained neither red cells nor T-1824-labeled albumin and the whole blood concentrations ofhemoglobin and T- 1824 in the collection samples weretherefore diluted by the injection fluid ("injection artifact").Dilution of the collected blood by the injection solutionproved to be modest, and an approximate correction for thisartifact was accomplished by assuming that the arrival ofthe injection fluid in the collected blood coincided with thearrival of the injected solute and could be estimated fromthe osmolality curve. Subtraction of the fluid flow attributedto the injection volume from the uncorrected tissue fluid flow(FT,,) yielded the true tissue fluid flowvs (FT), indicated
in Figs. 1, 2, and 3.After injections of hypertonic sucrose or sodium chloride,
the flow of red cells through the organ is impaired relativeto the concomitant flow of plasma. This effect has been
'All means are provided with standard deviations.3F~d =1.23 FTHO-5.84, r=0.79, n=15, P<0.001. Fo.m
= 1.19 FTHO- 5.08, r = 0.82, n = 20, P < 0.001. Fi2I = 0.80FTRO+4.59, r = 0.84, n = 18, P < 0.001. Find, Fosm, and Frefer to the pulmonary blood flow calculated from the areasunder the injected solute, osmolality, and ['lI]albumincurves and FTHO designates flow calculated for the observa-tion interval from the THOinfusion.
o -00r
0o()
38036034032030C280C
* ' -. 4-
Lool g0 S 0 00.95- o Hgb095o *t Jw
*. T-1824
0.9C_X0.85
45I40
35
I
0310. 1
- -I 5 10 15TIME (s)
FIGURE 2 Response of tissue fluid flow to a bolus injectionof NaCl (see legend of Fig. 1).
described in detail elsewhere and the transient retention ofhemoglobin within the lung is quantitated below. It is notpossible from the present data to be sure what portion ofthe outflow (Fr) is derived from "trapped" red cells ratherthan by tissue in these experiments. However, as indicatedin the Results section, there appeared to be no correlationbetween the prevailing hematocrit and the relative rate atwhich fluid was withdrawn from the organ, suggestingthat the contribution from retained red cells was modest.
Measurements of the flow of fluid from the lung wereconfined to the early samples containing both the injectedsolution and tissue fluid. I assumed that maximal tissuefluid flows will occur upon the initial exposure of the capil-lary bed to the hypertonic solution, before tissue soluteconcentrations have increased appreciably. I also assumedthat the tissue fluid present in these early samples wasderived from a relatively small portion of the lung:specifically, that portion with relatively short transit times.I further assumed that the solute present in these earlysamples traversed the same small portion of the lung-and the observed fluid flows were compared with the ob-served increases in osmolality to characterize the responseof these portions of the lung to the rise in osmolality. Ineffect, it was assumed that the tissue fluid and the injectedsolute leaving the capillaries are diluted to the same extentby blood from areas of the lung not yet exposed to theinjected solute. The permeability of this portion of thelung may not be representative of the permeability of thelung as a whole.
Evidence will be presented that the fluid extracted fromthe lings contains very low concentrations of solute. Entry
Osmotic Dehydration of the Lungs 937
L& 41,ft
.CP
0) 2:.-Z0
0 1x
.a- .9U) -.;-Y 1,
b E

I-
I'3
O Q2 IO hI
333
- --I
,n *e-e - .60-
03940s2
- 0
00
70 _LLR 60_
x 50_
43
LL! 2_ I
Too,
O-f
0-
0.x-;; QC
:5 10
TIME s)
FIGuRE 3 Response of tissue fluid flow toof urea. Upper panel: see legend of Fig.Note proportional decline of hemoglobincentrations. No evidence of selective impaiflow was demonstrated. Third, fourth, andlegend of Fig. 1.
across the capillary wall equal to C - C., where C. repre-sents the osmolality of the blood and tissues before theosmotic bolus was injected.
Provided hydrostatic pressure gradients are relativelysmall compared to the imposed osmotic gradients, then
FT = aKfSEC - C.] (5)00; where a is the Staverman reflection coefficient (9) and
000 00 provides a measure of the relative flow of fluid througho Hgb the capillary wall induced by the osmotic pressure gradient*T-1824 in comparison to an equivalent hydrostatic pressure gradient
Kr is the filtration constant in units of ml sl (mosmol/kgH20) 'cm', and S represents the capillary surface area(cm'). In the present experiment, values have been obtainedfor FT/[ (C - C.) W] where Wrepresents the wet weightof the lung. This quantity is designated by the equivalentterm oKS/W at the bottom of Figs. 1, 2, and 3.
Excess hemoglobin retention. After injections of hyper-tonic sucrose or sodium chloride solutions, the decline inhemoglobin concentration of blood leaving the organ ex-ceeded the concomitant decline in whole blood T-1824 con-centrations. This is illustrated in Figs. 1 and 2. This ob-
. servation was reported in an earlier publication (12) inwhich tracer studies also indicated that red cell transitthrough the lungs was impaired by injections of these solu-tions. It was not possible, however, to calculate the quan-tity of hemoglobin retained by the organ in excess of T-1824-labeled albumin in these earlier studies because mea-
I surements of pulmonary blood flow during the collection20 25 of each sample of blood were not obtained. In the present
studies, these measurements of flow were made with thebolu.n THO infusion technique and it was therefore possible to
.a bolus injecion calculate the quantity of hemoglobin retained within the1. Second panel: lung in excess of proportional quantities of T-1824-labeledand T-1824 con- albumin.
irment of red cell The maximum retention of hemoglobin (up to the timeI fifth panels: see when T-1824 concentrations in the effluent blood became
proportionately greater than corresponding hemoglobin con-centrations) was calculated from the equation:
of this dilute tissue fluid into the vascular space should de-crease the osmolality of the blood perfusing the lungs. Ihave assumed that the pulmonary arterial osmolality (C.)and pulmonary venous osmolality (C,) of the blood per-fusing the lungs are related by the equation
Ca = CvFTHO/ (FTHO- FT) (3)
where Fr represents the flow of tissue fluid and FTHgO desig-nates the outflow from the lung determined with THOinfusion. Like Bohr (14), Kety (15), Renkin (16), Crone(17), and Yudilevich, Renkin, Alvarez, and Bravo (18)and subsequent workers, I assumed that the osmolality ofthe blood containing injected solute declines exponentiallyfrom the arterial to the venous ends of the exchange area ofthe lung. Thus the average osmolality along the capillarymay be calculated from the measured venous osmolalityand the derived arterial osmolality with the equation:
Ca - C
In Ca-In Cv (4)
Furthermore, it has been assumed that tissue concentrationsremain unchanged at early times and the observed flow oftissue water has been produced by an osmotic gradient
Hb=E {[T-1824J]iEHgb], -[HgbijFr~bjF (6)
where H represents the maximum quantity (in grams) ofhemoglobin stored within the organ over and above thecorresponding quantity of albumin within the organ, a rep-resents the time when [Hgb],/[Hgb]. began to decline andb the time when [Hgb] ,/[Hgb], again became equal to[T-1824],/[T-1824].. [Hgb]./[T-1824]. designates the ratiobetween the hemoglobin and T-1824 found in the collectedsample, and r represents the collection tube interval.
Tissue fluid solute concentrations. A second set of stud-ies was performed to obtain information on the solute con-centration of fluid extracted from lungs. In these studies noattempt was made to measure instantaneous blood flow,and flow was determined from the areas under the osmoticconcentration curves. The left atrial catheters were not in-serted and the tritiated water infusion and [I]albumininjections were not given. The experimental procedure wasotherwise unchanged: The hypertonic solution was injectedinto the superior vena cava and aortic blood was pumpedinto the collection tubes. In addition to hemoglobin andT-1824, whole blood concentrations of sodium and potas-sium were determined by flame photometry.
938 R. M. Effros
i_
Values were calculated for the concentrations of Na' andK+ in the extracted tissue fluid by solving the equations:
[Na+]B.i = [Hgb]B,i [Hgb]Eo
+ [T-1824]B.i [Na8]po + ENa+]Ti FTu (7)[T-1824]p,o F
[K+]B,i = [Hgb]sB, [Hgb]E ,
+ [T-1824]B,i [T1824]p + K+]T, F (8)
where the subscripts B, P, and R refer to whole blood,plasma, and red cells and o and i refer, respectively, to thecontrol sample obtained before the injection and the ithsample collected after the injection. [Na+Jr.. and [K+]r,idesignate extracted tissue fluid concentrations of Nat andK+. Values for Fr,./F were obtained from Eq. 2.
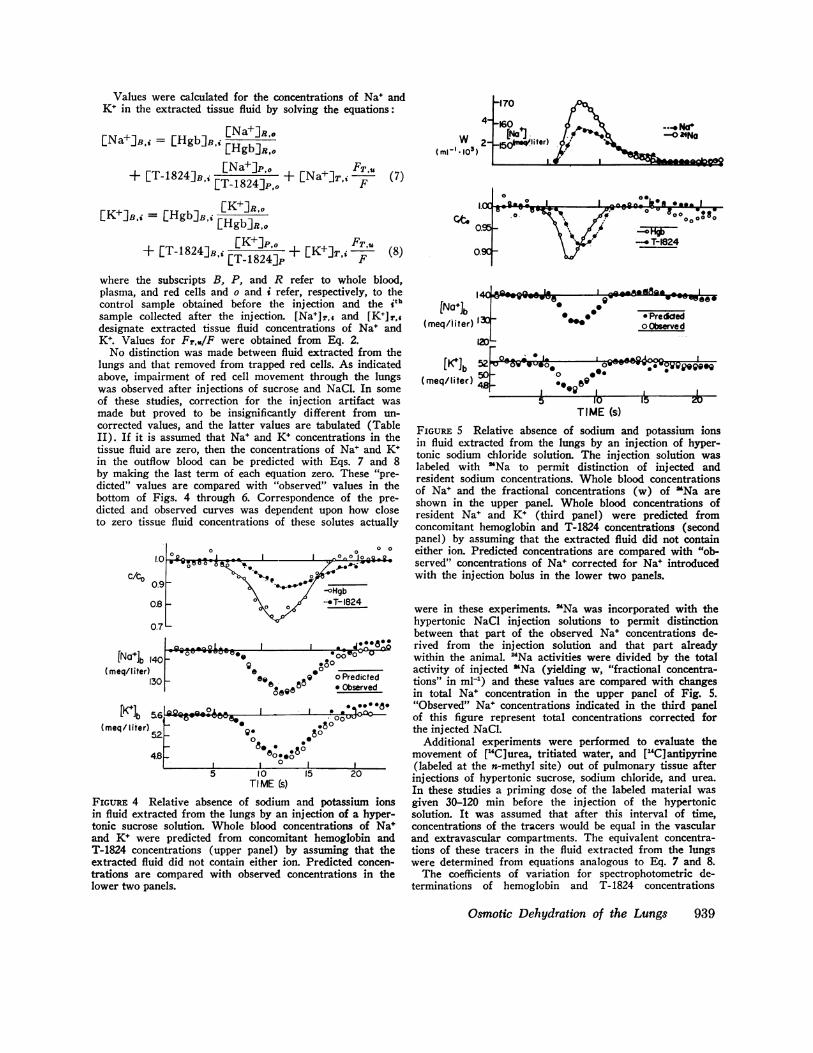
No distinction was made between fluid extracted from thelungs and that removed from trapped red cells. As indicatedabove, impairment of red cell movement through the lungswas observed after injections of sucrose and NaCl. In someof these studies, correction for the injection artifact wasmade but proved to be insignificantly different from un-corrected values, and the latter values are tabulated (TableII). If it is assumed that Nat and Ki concentrations in thetissue fluid are zero, then the concentrations of Na+ and K+in the outflow blood can be predicted with Eqs. 7 and 8by making the last term of each equation zero. These "pre-dicted" values are compared with "observed" values in thebottom of Figs. 4 through 6. Correspondence of the pre-dicted and observed curves was dependent upon how closeto zero tissue fluid concentrations of these solutes actually
0.9_c/
[Na*]b Ii(meq/l iter)
[K Ib '(meq/ liter),
FIGURE 4 Iin fluid extr;tonic sucroseand K+ werT-1824 concextracted flutrations arelower two pa
W)( ml-l 1.103 )
-.no Na
II
I eB0OI a _-W
IAIj w I_
[N+ lb(meq/liter) 130_
ED1.. 0_(mq/ltb 52er
(meq/liter) 48 -
* -'WW0 @0W* Preddedo Observed
o.
0 Im1_~~~~~~~~~~~~
o .*. A
I I
0n_,_ wopopeog0*
15 1L 15I0
TIME (s)FIGuRE 5 Relative absence of sodium and potassium ionsin fluid extracted from the lungs by an injection of hyper-tonic sodium chloride solution. The injection solution waslabeled with 'Na to permit distinction of injected andresident sodium concentrations. Whole blood concentrationsof Na' and the fractional concentrations (w) of 'Na areshown in the upper panel. Whole blood concentrations ofresident Nat and K+ (third panel) were predicted fromconcomitant hemoglobin and T-1824 concentrations (secondpanel) by assuming that the extracted fluid did not containeither ion. Predicted concentrations are compared with "ob-served" concentrations of Na+ corrected for Na+ introducedwith the injection bolus in the lower two panels.
rt --' '{ were in these experiments. 'Na was incorporated with the
07L hypertonic NaCl injection solutions to permit distinctionbetween that part of the observed Na* concentrations de-
_Qt-9~,LA. I J. Add rived from the injection solution and that part already40 - 00° -° within the animal. 24Na activities were divided by the total
0e o° activity of injected "Na (yielding w, "fractional concentra-30 88 9 0 Predicted tions" in ml[) and these values are compared with changes
oeQO in total Nat concentration in the upper panel of Fig. 5.O. *8* "Observed" Nat concentrations indicated in the third panel
5.6 A , j 81000U- of this figure represent total concentrations corrected for52 ~ ,.80 the injected NaCl.
08 .8. Additional experiments were performed to evaluate the4.8 _ 800.o movement of [14C]urea, tritiated water, and ["4C]antipyrineX| 0 I _ | (labeled at the n-methyl site) out of pulmonary tissue after
TIM10 20 injections of hypertonic sucrose, sodium chloride, and urea.TI ME Cs) In these studies a priming dose of the labeled material was
Relative absence of sodium and potassium ions given 30-120 min before the injection of the hypertonicacted from the lungs by an injection of a hyper- solution. It was assumed that after this interval of time,e solution. Whole blood concentrations of Nat concentrations of the tracers would be equal in the vascularre predicted from concomitant hemoglobin and and extravascular compartments. The equivalent concentra-.entrations (upper panel) by assuming that the tions of these tracers in the fluid extracted from the lungsid did not contain either ion. Predicted concen- were determined from equations analogous to Eq. 7 and 8.compared with observed concentrations in the The coefficients of variation for spectrophotometric de-
nels. terminations of hemoglobin and T- 1824 concentrations
Osmotic Dehydration of the Lungs 939
-tqy-vww
, _ fry _
I- I -- Adt- -
-W

c/tO0.95
0.90
0.85140
[Na ]b 130
120H
[Ki b4.61
0809%AA-.*.Q e.00
-6Q-lsOO56 o
0a * ° o Prec
,° * Obsee558 * ee* * @
I*o~~~~~~~~~~~~~~oA,~~~~~~~
- .ASn10 AIs
v - I-JOV- o0
d0
a eQ .0
5 10TIME (s)
FIGURE 6 Relative absence of sodium and potassfluid extracted from the lungs by an inj ectiontonic urea solution. See legend of Fig. 4.
amounted to 0.5%, whereas values of approxinwere obtained for osmolality and sodium andconcentrations. If tissue fluid flow is 10% ofoutput, then errors of 1% in absolute concentralof these determinations will produce errors ofculated values of oKfS/W or estimated concesodium or potassium in the extracted fluid. Tof random errors of this nature is reflected in 1deviations of the reported data (Tables I and:variation (dependent upon the activity of the safound for the radioactive determination.
RESULTS
Site of fluid extraction. In view of the cgreater surface area of the pulmonary capill10 m' in a 200-g lung) (19) in comparisonface area of the great vessels and the walls ofchambers (less than 0.2 m'), it is likely t1the water extracted by hypertonic solutionsfrom the lungs rather than the heart or la
The observation that the mean transit timand ['"I]albumin injected into the left atrisentially the same indicates that the rapidly ensvater volume in the left heart and base of 1
negligible. In addition, collection of bloopulmonary artery after hypertonic injectionsand NaCl in two studies (not shown) failed t
extraction of water from the superior venawalls of the right atrial or ventricular cavthe normal interval of the study (25 s). Itconcluded that the extracted tissue fluid waobtained from the exchange area of the lung
Tissue fluid flow and hemoglobin retention. The' 0 0 0 0 initial flow of tissue fluid into the blood stream after
.... ° injections of hypertonic solutions of sucrose, NaCl, and
* .. urea is reflected by fractional declines in hemoglobin and
b T-1824. These data are indicated with plasma osmo-824 lality in Figs. 1, 2, and 3, in which concentrations are
expressed as fractions of average base line valuesse... (C/CO refers to [Hgb]/I Hgb]o and [T-1824]/[T-0c0 184o
° ° This period of tissue dehydration was followed by a
Jicted return of fluid to the tissue in the blood, which followederved the hypertonic bolus. During this latter process, hemo-
.. I- V V globin and T-1824 concentrations rose above base lineooze -Uo levels.
After injections of hypertonic sucrose and NaCl,hemoglobin concentrations fell more rapidly than T-1824concentrations and later increased above the correspond-ing T-1824 concentrations (Figs 1 and 2). This ob-servation has been described more fully in a previous
sium ions in publication (12) and has been ascribed to a loss of redof a hyper- cell deformability with a consequent temporary reten-
tion of red cells in excess of comparable amounts ofT-1824 entering the lungs. The maximum excess pul-
nately 1.0% monary retention of hemoglobin (H) over and abovei potassium T-1824 retained within the lungs has been calculatedthe cardiac by Eq. 15 and these values are presented in Table I.
tions of any H averaged 2.25±1.70 g (SD, n = 7) after NaCl in-10%o in cab jections and 1.63±1.21 g (SD, n = 7) after sucrose in-he presence jections. The equivalent declines in hemoglobin and
the standard T-1824 concentrations observed with injections of urea
II). Similar (Fig. 3) is consistent with the observation that ureaimples) was rapidly enters red cells and therefore does not produce
persistent red cell dehydration, diminished deforma-bility or impairment of red cell passage through thelungs.
onsiderably The pulmonary outflow (F) for the interval duringaries (over which tissue water was extracted was calculated fromto the sur- the THO infusion data (Eq. 1) and has been plottedthe cardiac in the same figures. During this brief interval, blood flow
hat most of generally remained relatively constant: the mean fractional; is derived variation during the four-sample observation interval (seerge vessels. below) averaged 0.035±0.02 (n = 20).tes of THO The flow of extracted fluid was calculated from theium are es- blood flow data, and the hemoglobin and T-1824 data
xchangeable with Eq. 2, and is presented in Figs. 1, 2, and 3 belowvthe aorta is the blood flow data. These flows were corrected for theI from the injection artifact (see Methods) and only the corrected; of sucrose values (FT) are indicated. Tissue fluid flows rose to an
to detect the average fraction of 0.087±0.046 (n = 20) of the totalcava or the pulmonary blood flow in these studies but rapidly declinedities during and flow ceased within 5-10 s after it had begun; at ais therefore time when plasma osmolality averaged 61% of the maxi-
is primarily mumosmolality attained. At the end of the four-sampleUs. observation interval, the net total loss of fluid from the
940 R1. M. Effros
--wwwoawwA-
- -I
4.2'
:1

TABLE IPulmonary Blood Flow, Solute Reflection Coefficients, and Hemoglobin Retention Determined from
'Solute Injection Experiments
MaximumDog Lung Amount increase in KfS
Experiment weight weight Hct, Hgb. injected osmolality FTHO W H
kg g g/100 ml mol mosmol/kg mi/s (ml/s) 10-3 g(mosmol,'kg) g
Sucrose1-1 17.3 236 0.38 9.9 10.8 5 1 50.9 0.237 1.382-2 19.2 269 0.41 15.3 10.7 47 38.8 0.083 0.473-1 18.6 215 0.46 15.1 17.3 96 26.0 0.293 3.354-2 17.0 187 0.34 12.3 15.3 89 36.5 0.192 0.715-3 19.8 290 0.51 17.8 14.0 85 30.2 0.079 2.726-3 21.5 180 0.47 13.1 16.3 106 21.0 0.229 2.467-2* 30.0 344 0.16 6.2 15.3 65 50.7 0.164 0.31
Mean 0.182 1.63SD 0.080 1.21
NaCi1-2 17.3 236 0.42 9.6 12.7 46 33.1 0.258 1.172-1 19.2 269 0.40 15.8 12.6 45 45.1 0.129 1.163-3 18.6 215 0.44 15.7 15.5 173 26.7 (0.298 5.574-2 17.0 187 0.34 12.1 13.7 107 50.3 0.201 1.885-2 19.8 290 0.52 17.5 12.5 85 41.4 0.251 2.266-1 21.5 180 0.48 13.6 14.6 122 29.5 0.226 3.187-1* 30.0 344 0.15 6.7 13.6 30 60.4 0.149 0.50
Mean 0.216 2.25SD 0.061 1.70
Urea1-2 17.3 236 0.42 10.1 10.8 43 23.3 0.1842-3 19.2 269 0.40 15.7 10.7 41 26.8 0.0613-1 18.6 215 0.46 16.1 26.6 122 36.1 0.1904-3 17.0 187 0.35 10.9 23.6 106 43.4 0.2295-1 19.8 290 0.53 17.6 21.5 65 59.0 0.1396-2 21.5 180 0.46 13.4 25.2 132 29.0 0.113
Mean 0.152SD 0.060
Abbreviations: FTHO, pulmonary blood flow determined from tritiatedglobin concentration before injection; oI(S/W data were calculated as iwithin the organ (Eq. 6).* Animal bled and infused with saline to diminish hematocrit.
lung averaged 2.8%, 3.7%, and 2.9% of the pulmonarywater content, estimated from the wet weight of thelungs.
As indicated in the Methods section, knowledge ofthe tissue fluid flow (FT), the change in serum osmo-lality (AC), and the wet weight of the lung (W) per-mitted calculation of the term aKrS/W. Values fororKrS/W were calculated from data obtained in theearly sample tubes and are plotted in the bottom panelsof Figs. 1, 2, and 3. These values decline rapidly andonly the first four points were averaged to obtain esti-mates of aKrS/W when tissue fluid flows are maximal.oKrS/W for sucrose, NaCI, and urea averaged 0.182±0.080 (n = 7), 0.216±0.061 (n = 7), and 0.152±0.052(n = 6) ml s-' (mosmol/kg) 1 (g wet tissue wt) 1. Nosignificant differences were found between these values,nor were correlations found between orKrS/W values forany of the solutes and the flow per unit weight of tissue,
water infusion data; Hcto, hematocrit before injection; Hgb, hemo-indicated in text from Eq. 5; H. maximum excess hemoglobin stored
the maximum venous osmolality, or the base-line hemo-globin concentration or hematocrit.
Solute concentrations in the extracted fluid. If it isassumed that the water that leaves the lungs in responseto the osmotic bolus contains no Na, K+, or [14C]urea(after an earlier priming dose of ['4C]urea), then theconcentrations of these small solutes in the blood leavingthe organ can be predicted from the concomitant hemo-globin and T-1824 concentrations with Eqs. 7 and 8 andan analogous equation for ["4C]urea. The relative suc-cess of this procedure is illustrated in Figs. 4, 5, and 6for Na+ and K+, in which the predicted concentrationsof Na' and K+ are compared with the observed data. Inthose experiments in which NaCl was injected (Fig. 5),it was necessary to distinguish between the injectedNa+ and "resident" Na+ already present within the bloodand/or tissues at the time of injection. This was ac-complished by labeling the injected Na+ with 'Na and
Osmotic Dehydration of the Lungs 941

TABLE I ICalculated Solute Concentrations in Extracted Fluid
Fraction of plasma concentrationExtracted Injection
solute solution Mean SD n
Na+ Sucrose 0.03 0.14 8NaCl 0.16 0.23 13Urea 0.00 0.09 7
K+ Sucrose 0.03 0.18 8NaCi 0.00 0.27 16Urea 0.01 0.13 5
[l4C)Urea Sucrose 0.12 0.18 4NaCl 0.19 0.12 5Urea 0.10 0.22 4
THO Sucrose 0.96 0.07 3NaCl 0.97 0.05 3Urea 1.02 0.10 8
calculating resident Nae with Eqs. 7 and 8 from thetotal and labeled Nat concentrations. The values of totalNa and labeled Nat are indicated in the upper portionof Fig. 5.
The actual solute concentrations in the initial flow oftissue fluid from the lungs have been calculated withEqs. 7 and 8 from the differences found between theobserved and predicted solute concentrations. Thesevalues have been divided by prevailing concentrationsof solute in the plasma and are presented in Table II. Asindicated under Methods, these values are not correctedfor the injection artifact, since corrected and uncorrectedmean values were not significantly different in thoseexperiments in which enough data was collected. Fur-thermore, some of the extracted with sucrose and NaClsolutions is presumably derived from trapped red cells.The presence of negative values for some of the calcu-lated solute concentrations in the extracted fluid repre-sents an apparent entry of solute into the tissues of thelung when fluid is being removed from the lungs.
It is evident from Figs. 4, 5, and 6 and the data pre-sented in Table II that water extracted from the lungsis accompanied by relatively small quantities of smallsolute molecules. Average concentrations of Na', K@, andurea in extracted fluid were less than 20% of base-lineplasma values after injections of NaCl, sucrose, andurea. The standard deviations are relatively great andno significant differences were found between thesevalues.
As anticipated, the osmotic flow of water out of thetissue does carry with it tritiated water (administeredas a priming dose before the experiment). The failureof THO concentrations to decline significantly afteran injection of urea is indicated in Fig. 7. Calculatedconcentrations of THO in the extracted fluid remainedclose to base-line plasma concentrations (Table II).Concentrations of ['Clantipyrine also failed to decline
after injections of hypertonic urea in each of two ex-periments (not shown).
DISCUSSIONTissue fluid flow. Losses of fluid from the lung tis-
sue after sudden injections of hypertonic solutions ob-served in the present study are considerably more rapidthan would be anticipated from data published by Taylorand Gaar (7). These investigators estimated pulmonarycapillary reflection coefficients (a) from the ratio of Fr,tissue fluid flow from the lungs induced by hypertonicinfusions, to the flow (FP) of fluid into the same quantityof tissue produced by corresponding increases in capil-lary hydrostatic pressures:
or = [FT/(AC W)][FpRT/(APW)]
where AC is the osmotic concentration difference be-tween the infusion fluid and the tissues before infu-sion, AP represents the increase in capillary hydrostaticpressure, R is the gas constant, and T is the absolutetemperature. Taylor and Gaar reported that the reflec-tion coefficients of urea, glucose and sucrose were0.018±0.003, 0.026+0.002, and 0.044+0.004 (SEM),respectively. The corresponding values for Fr/(ACW)are not provided by these authors but may be estimatedfrom their own estimates of the pulmonary capillaryreflection coefficient K, (7.1 X 10-' cm5/dyne-s) and Sper gram of tissue (480 cm5/g):
FT/(ACW) = oFpRT/(APW) = oKfS/W (10)Calculated values of Fr/(ACW) for urea, glucose andsucrose derived from their study average 0.0158 X 10',0.0228 X 10-, and 0.0386 X 10' (ml/s) (mosmol/kg)1gl. In the present study FT/(ACW) for urea, NaCl, andsucrose averaged 0.152 X 10V, 0.216 X 10-, and 0.182X 10' WAm~) (mosmol/kg)' g'l.
Injections of sodium chloride and sucrose in thisstudy resulted in transient retention of red cells withinthe lungs. It is therefore likely that some of the fluidremoved from the lungs with these solutions was de-rived from retained red cells rather than the lung itself.However, red cell retention does not occur after injec-tions of urea. Furthermore, the rate of fluid removalafter injections of sodium chloride and sucrose did notappear to be correlated with the prevailing hematocrit.It must therefore be concluded that significantly morefluid has been extracted from the lung in the presentstudy than would be anticipated from the study of Taylorand Gaar.
The experimental procedure of Taylor and Gaar dif-fered in five major respects from the procedure re-ported here. (a) Taylor and Gaar used a perfusedexcised lung preparation mounted on a balance, whereas
942 R. M. Effros

the lungs were left in situ in this study. (b) Increasesin vascular osmolality were imposed as sustained in-fusions in their experiments; plasma osmotic pressureswere increased transiently in the present experiments.(c) Although sustained for longer intervals, increasesin osmolality in the Taylor and Gaar report were smallerthan those produced in the present study. Taylor andGaar indicate osmolalities ranging from 20 to 36 mos-mol/kg. In the present study venous osmolalities transi-ently increased by 41-173 mosmol/kg and even greaterosmolalities must have been present at the capillary level.(d) Measurements of tissue fluid flow were based uponchanges in lung weight in their studies, whereas lossesof tissue fluid in the present study were based upon di-lution of blood flowing from the lungs. (e) Measurementswere made relatively later in the Taylor and Gaar stud-ies. Observations were made at 6-s intervals by Taylorand Gaar whereas observations were made at 0.75-s in-tervals in this study.
Perl, Chowdhury, and Chinard (8) in our laboratoryhave recently repeated the studies of Taylor and Gaarusing a rapidly responding strain gauge to monitor earlychanges in organ weight after very small increases in per-fusion osmolality (from 1.0 to 5.0 mosmol/kg). They ob-served a rapid decline in the rate of tissue dehydrationafter approximately 5 s, as would be predicted from theresponse of the lungs to injections of much more con-centrated solutions found in the present in situ study.Using the initial rate of loss of organ weight for theircalculations, these investigators calculated reflection co-efficients very much greater than those obtained byTaylor and Gaar at later times: ONac1 = 0.3, oglucoue =
0.3, 0sucrose = 0.3, and 0raf fInose = 0.2. These values areof the same order of magnitude as those calculated forcat hindlimb (4, 11) and rabbit heart capillaries (5).Taylor and Gaar (7) have suggested that the pulmo-nary capillary reflection coefficients, which they re-ported, were too low, since they necessitated the pres-ence of "pores" or junctions as large as 80 A in diameter,larger than those observed in morphological studies.Since tissue osmolality must approach vascular osmo-lality with the passage of time, it is likely that the os-motic gradients responsible for the flows observed byTaylor and Gaar after 5 s have declined significantlyfrom initial values. The sustained slow flow observed bythese investigators may represent the movement of waterinto the pulmonary capillaries from more remote areas,perhaps those areas normally perfused by the bronchialcirculation. Because some degree of equilibration be-tween the pulmonary tissues and even the earliest samplesof collected blood must have occurred, the values foroKtS/W reported in the present study, as well as thereflection coefficient values reported by Perl et al. (8),may underestimate the true values of 7K,'S/W.
0
0
TIME (s)
*T-1824oTHO
1U
FIGuRE 7 Presence of THO in fluid extracted from thelung by a bolus injection of a hypertonic urea solution.The activity of THO in the blood leaving the lung re-mained essentially unchanged despite the presence of tissuefluid in the collected blood (indicated by the decline inT-1824 concentrations).
Solute concentration of extracted tissue fluid. It isapparent from the present studies that fluid extractedfrom the lungs with injections of hypertonic solutionsof small solute molecules contains relatively low con-centrations of Na', K+, and urea. Since these solutesand corresponding anions constitute a very large por-tion of the extravascular solute content, it is reasonableto assume that the fluid removed from the lungs is hy-potonic relative to the osmolality of the blood and tis-sues both before and after the injection. The relativefailure of small hydrophilic solute molecules to accom-pany water leaving the tissues indicates the presenceof barriers permeable to water but relatively imperme-able to these solutes.
The movement of water between the blood and lungtissue may occur through the endothelial cells or thejunctions between the endothelial cells. It has been vari-ously estimated that from 15% (11) to 50% (20, 21)of the flow of fluid into tissues after increases in capil-lary hydrostatic pressure traverses the endothelial cells.Because cell membranes are relatively impermeable to
small lipophobic molecules, it has been suggested thatthe fluid which passes through the endothelial cells isvery hypotonic (21). It is further assumed that thesesolute molecules are carried into the interstitium by wa-
ter flowing through the interendothelial junctions. Al-though earlier reports suggested that pulmonary capil-laries are relatively impermeable to small lipophobic sol-utes (22), more recent evidence suggests that thesesubstances readily enter the pulmonary parenchyma,presumably by way of the intercellular junctions (23,24). This hypothesis is illustrated in Fig. 8A. It shouldbe noted that if the flow of hypotonic fluid into andacross the capillary cell results in a local decline insolute concentration, flow by way of the cellular path
Osmotic Dehydration of the Lungs 943

A B HYPERTONICSOLUTIONHYDROSTATIC PRESSURE (High mol wI)
Interstitium <' "
. :::kEridoteliaiCelI.................
ml..... ..,........a n...............Capillary
Lumen
HYPERTONIC SOLUTION )D ISOGRAVIMETRIC STUDYHYPERTONICSOLUTION (Low mol wt)
X w,(Lowmolwl)wt
z FLOWOF WATER--)RESIDENT SOLUTE FLUX
FIGURE 8 Parallel path model of fluid and resident solutemovements through the pulmonary capillary cells and junc-tions in response to (A) a rise in capillary hydrostaticpressure; (B) an increase in the vascular concentration ofa high molecular-weight substance; (C) an increase in thevascular concentration of a low molecular-weight substance;(D) and a simultaneous isogravimetric increase in serumosmolality (with a low molecular weight substance) andcapillary hydrostatic pressure.
will decrease relative to the concomitant flow throughthe junctions (this effect is discussed in the Appendix).The accumulation of edema fluid may therefore largelyproceed through the junctions rather than the endo-thelial cells.
If large molecules are injected and do not leak into theinterstitium, then similar though opposite flows of wa-ter through cells and water, and solute through junc-tions, may be anticipated (Fig. 8B).
It is proposed that the injection of hypertonic solu-tions of small lipophobic solutes is followed by the rapidleakage of the injected solute through the junctions intothe interstitium. In the limiting case, illustrated in Fig.8C and presented in conventional irreversible thermo-dynamic terms in the Appendix, the injected solute istotally excluded from the endothelial cells but rapidlyleaks through the junction and pulls no fluid out of thejunction. This is equivalent to the assumptions that thereflection coefficient of the cell to the solute is one andthe reflection coefficient of the junction is zero. Underthese circumstances, one would expect that all of the ex-tracted fluid would pass through the cellular pathunaccompanied by solute. Furthermore the observed flowwould represent the flow through the cells that wouldoccur if the capillary hydrostatic pressure rather thanthe osmotic pressure were increased to the same extent.
Data obtained in these experiments suggest that mostof the water extracted from the lungs by hypertonicsolutions of small lipophilic molecules does pass through
the endothelial cells. Since the solute concentrations ofthe extracted fluid average less than 20% of plasma andpresumably interstial solute concentrations, it would ap-pear likely that the cellular path is responsible for morethan 80% of the observed flow. These observations areconsistent with the hypothesis that the reflection coeffi-cients of the junctions are very low. On the assumptionthat the narrowest portion of the interendothelial junc-tions is only 40 A wide, Perl (11) has calculated thatthe reflection coefficients of the interendothelial junc-tions should be 0.035 for NaCl, 0.209 for sucrose, and0.052 for urea.
It is probable that arrival of the injection solution atthe capillaries initially produces endothelial dehydration,rapidly followed by interstitial and then epithelial celldehydration. As interstitial solutes become more con-centrated, some diffusion of these solutes into theplasma should occur by way of the junctions. However,it was difficult to demonstrate reproducible entry of sol-ute into the vascular space in the present experiments.This may reflect the insensitivity of the technique torelatively slow solute fluxes out of the interstitial volume.On the other hand, it is possible that the interstitiumnever becomes very contracted. If the injected soluterapidly penetrates the junctions, then the osmolality ofthe interstitium will increase because of the entry ofinjected solute rather than the loss of water, and cellularrather than interstitial dehydration will occur. It maybe expected that during a constant infusion of a hyper-tonic solution, equilibration of the infused solute be-tween the vascular space and interstitium will eventu-ally occur and at that time only cellular dehydrationwould be present.
Two additional factors may tend to diminish themovement of interstitial water and solute out of thelung. It has been suggested by Guyton, Granger, andTaylor (25) that the structural components of theinterstitial compartment tend to keep the compartmentalvolume from diminishing with the creation of subatmos-
l)heric interstitial hydrostatic pressures. These relativelynegative pressures would tend to inhibit the flow of fluidout of the interstitium. In addition, the movement ofinjected solute into the junction may produce a localflow into the interstitium when the majority of flow isproceeding in the opposite direction through the cells,an effect described in frog skin by Ussing and others(26-28). Thus although it is likely that significant cel-lular dehydration occurs after these injections, the short-term effects of such solutions upon interstitial volumeremain unclear. As indicated above, prolonged infusionsof these solutions should result in the eventual return ofthe interstitium to its original volume. The ultimatevolume of the interstitial compartment should be de-termined by standard Starling relationship between the
944 R. M. Effros

hydrostatic pressures and macromolecular compositionof the vascular and interstitial volumes.
Expansion of the interstitial compartment must in-evitably occur in isogravimetric experiments. In thesestudies (4), the flow of fluid out of the tissue in re-sponse to a hypertonic infusion is prevented by raisingthe capillary hydrostatic pressure. Although changesin organ weight may be avoided in this fashion, con-siderable local fluid circulation may be anticipated if thesolute can leak through the pores. This illustrated inFig. 8D. Hypotonic fluid leaves the tissue in response tothe hypertonic infusion. An equal and opposite flow offluid containing solute traverses the junctions underthe influence of the hydrostatic pressure gradient. Therise in tissue osmolality is therefore dependent uponloss of hypotonic fluid and leakage of the infused solutesinto the tissues. The entry of solute into the tissue isproduced both by diffusion and solvent drag through thejunctions: because solvent drag in the isogravimetricpreparation increases solute flux into the tissue, mea-surements of capillary permeability to solutes in suchpreparations should be somewhat higher than tracermeasurements of permeability in the absence of con-vectional effects.
The observation that THO accompanies the flow ofwater out of the lung probably reflects movement ofthe tracer and bulk water through the same channels.Although concentrations of ["C]antipyrine in the ex-tracted fluid are also much the same as ["C]antipyrincconcentrations in the plasma and probably the tissuecompartments as well, it should not be assumed thatantipyrine traverses the capillary wall with bulk water.Since the solubility of antipyrine in lipid exceeds thesolubility of water in lipid, it is possible that some ofthe antipyrine traverses lipid pathways that may differfrom the pathways accessible to bulk water movement.Passage of the antipyrine from the tissue to blood mayresult from diffusion as local concentrations increasewith loss of tissue water rather than from the convectiveforce of solvent drag.
Pulmonary red cell retention. Impairment of red cellpassage through the lungs after injections of hypertonicsucrose and sodium chloride was again observed (12).Because concomitant blood flow was determined as wellas hemoglobin and T-1824-labeled plasma protein con-centrations, it was possible in the present study to de-termine the quantity of hemoglobin in excess of corre-sponding quantities of plasma protein retained withinthe lung. This amounted to an average of 1.63 g aftersucrose injections and 2.25 g after NaCl injections. Ifit is assumed that the arterial volume is 50 ml (29) andpulmonary arterial hemoglobin concentration is 14 g/100ml, then a 25 or 35% rise in pulmonary arterial hemo-globin concentration may be anticipated after these in-
jections. As indicated previously, impairment of red cellpassage is attributable to a decline in red cell deforma-bility due to red cell dehydration (12, 30, 31). Urearapidly enters red cells (ti of equilibration, approximately?h s) (32) and hypertonic urea solutions do not ap-preciably decrease red cell deformability or impair redcell passage through the lungs.
APPENDIXA parallel pathway model similar to a number of previousmodels (11, 21, 33-35) has been used to predict the effectof injections of hypertonic solutions of small solute mole-cules. The following symbols are used: As, A0, areas ofjunctions and cells (cm2); Cr, resident solute concentrationin tissue (mol/liter) ; Fj, F., the flows of fluid throughjunctions and cells (ml/s); FTO, FTP, the flow of fluidinto the tissue in response to a rise in osmolality; in hydro-static pressure (ml/s); Jr, flux of resident solute fromtissue to blood (mol/s); Lp,j, Lp,CJ filtration constants ofjunctions and cells (ml s-' cm-2 torr') ; zP, hydrostaticpressure difference across capillary wall (torr); Art,osmotic pressure difference across capillary wall pro-duced by injected solute (torr) ; an,{, oc,r solute reflectioncoefficients of cells to injected and resident solutes; aj,
jr, solute reflection coefficients of junctions to injected andresident solutes.
As a limiting case, assume that for a hypertonic solutionof some specific injected solute i, the following conditionsare met: (a) the reflection coefficient of the junctions iszero; (b) the reflection coefficient of the cells is one;(c) concentrations of all solutes other than the injectedsolute remain the same in the vascular and extravascularcompartments; and (d) there are no hydrostatic pressuresgradients across the capillary wall.
Then the flow of water from tissue to blood may becalculated from the equation:
F7,o0 = Fj + F, = ajljLpjAri+ -cAcLPA7ri = A0cLpcA7r,. (I A)
Consider now the flow of water produced by an increasein capillary hydrostatic pressure in the absence of any in-crease in solute concentration:
FTp = AjLpjAP + AcLp,,4AP. (2A)
Comparison of Eq. IA and 2A shows that the flow elicitedby the inj ected solute equals the corresponding portion ofthe flow that traverses the cell path when hydrostatic pres-sure is increased by the same amount.
With respect to the movement of other solutes within thetissue, let us further assume that: (a) the reflection co-efficient of the cells to the resident solute is one; (b) thereis no interaction between the movement of resident andinjected solute. Then the movement of resident solute outof the tissue should be zero because F3 and (1 - o-,r) areeach zero:
Jr = (1 - Uir)erFi + (1 - 0cr),CrFc = 0 (3A)
Although Eq. 2A may correctly predict the initial flowof fluid through cells and junctions after an increase inhydrostatic pressure, flow through cells will tend to decline
Osmotic Dehydration of the Lungs 945

as the osmolality of the tissues is diminished by hypotonicfluid traversing the cells. Since the reflection coefficient ofthe cells to small solute molecules within the tissue (suchas Na+ and Cl-) is presumably much greater than the cor-responding reflection coefficient at the junctions, the declinein tissue osmolality relative to plasma osmolality will serveto diminish flow of water through the cells more thanflow of solution through the junctions. Any distention of thecapillaries with increased hydrostatic pressure may alsoserve to widen the junctions and increase the flow throughthe junctions (36, 37).
ACKNOWLEDGMENTSThe good advice and encouragement of Drs. William Perland Francis P. Chinard throughout these studies is acknowl-edged. Miss Kathleen Marold was responsible for the ardu-ous analytical procedures, which were performed verycompetently. Mrs. Barbara McDonald and Miss AnneHaberle provided expert secretarial assistance.
This work was supported in part by NHLI researchgrants HL12879 and HL15490 and NHLI career develop-ment award HL70649 and a grant from the Life InsuranceMedical Research Fund.
REFERENCES1. Starling, E. H. 1896. On the absorption of fluids from
the connective tissue. J. Physiol. (Lond.). 19: 312-326.2. Starling, E. H. 1896. The Arris and Gale lectures on
the physiological factors involved in the causation ofdropsy. Lecture I. The production of the lymph. Lancet.1: 1267-1270.
3. Starling, E. H. 1908. The absorption of the interstitialfluids in the fluids of the body. Herter Lectures. 1909.Keener and Co., Chicago. 88-103.
4. Pappenheimer, J. R., E. M. Renkin, and L. M. Borrero.1951. Filtration, diffusion and molecular sieving throughperipheral capillary membranes. A contribution to thepore theory of capillary permeability. Am. J. Physiol.167: 1346.
5. Vargas, F., and J. A. Johnson. 1964. An estimate ofreflection coefficients for rabbit heart capillaries. J. Gen.Physiol. 47: 667-677.
6. Fenstermacher, J. D., and J. A. Johnson. 1966. Filtra-tion and reflection coefficients of the rabbit blood-brainbarrier. Am. J. Physiol. 211: 341-346.
7. Taylor, A. E., and K. A. Gaar, Jr. 1970. Estimation ofequivalent pore radii of pulmonary capillary and alveo-lar membranes. Am. J. Physiol. 218: 1133-1140.
8. Perl, W., P. Chowdhury, and F. P. Chinard. 1973.Osmotic reflection coefficient of dog lung endotheliumto sodium chloride glucose, sucrose, raffinose and albu-nin. Microvasc. Res. 6: 125-126. (Abstr.)
9. Staverman, A. J. 1951. The theory of measurement ofosmotic pressure. Rec. Trav. Chim. Pays- Bas. 70: 344-352.
10. Solomon, A. K. 1968. Characterization of biologicalmembranes by equivalent pores. J. Gen. Physiol. 51:335s-364s.
11. Perl, W. 1971. Modified filtration-permeability modelfor transcapillary transport-a solution of the Pappen-heimer pore puzzle? Microvasc. Res. 3: 233-251.
12. Effros, R. M. 1972. Impairment of red cell transitthrough the canine lungs following injections of hyper-,tonic fluids. Circ. Res. 31: 590-601.
13. Rawson, R. A. 1943. Binding of T-1824 and struc-turally related diazo dyes by the plasma proteins. Am.J. Physiol. 138: 708-717.
14. Bohr, C. 1909. tlber die spezifische Tatigkeit der Lun-gen bei der respiratorischen Gasaufnahme und ihr Ver-halten zu der durch die Alveolarwand stattfindendanGasdiffusion. Skand. Arch. Physiol. 22: 221-280.
15. Kety, S. S. 1951. Theory and applications of the ex-change of inert gas at the lungs and tissues. Pharmacol.Rev. 3: 141.
16. Renkin, E. M. 1959. Transport of potassium-42 fromblood to tissue in isolated mammalian skeletal muscles.Am. J. Physiol. 197: 1205-1210.
17. Crone, C. 1963. The permeability of capillaries in vari-ous organs as determined by use of the "indicator dif-fusion" methods. Acta Physiol. Scand. 58: 292-305.
18. Yudilevich, D. L., E. M. Renkin, 0. A. Alvarez, and I.Bravo. 1968. Fractional extraction and transcapillaryexchange during continuous and instantaneous traceradministration. Circ. Res. 23: 325-336.
19. B. Siegwart, P. Gehr, J. Gil, and E. R. Weibel. 1971.Morphometric estimation of pulmonary diffusion ca-pacity. IV. The normal dog lung. Respir. Physiol. 13:141-159.
20. Yudilevich, D. L., and 0. A. Alvarez. 1967. Water,sodium and thiourea transcapillary diffusion in the dogheart. Am. J. Physiol. 213: 308-314.
21. Tosteson, D. C. 1970. Discussion. In Capillary Perme-ability. C. Crone and N. A. Lassen, editors. AcademicPress, Inc., New York. 658-664.
22. Chinard, F. P., and T. Enns. 1954. Transcapillary pul-monary exchange of water in the dog. Am. J. Physiol.178: 197-202.
23. Wangensteen, 0. D., L. E. Wittmers, Jr., and J. A.Johnson. 1969. Permeability of the mammalian blood-gasbarrier and its components. Am. J. Physiol. 216: 719-727.
24. Chinard, F. P., W. Perl, and R. M. Effros. 1971.Theoretical and practical considerations on the mea-surement of extravascular lung water. In Central hemo-dynamics and gas exchange. C. Giuntini, editor. Min-erva Medica (Edizioni), S. A., Torino, Italy. 57-75.
25. Guyton, A. C., H. J. Granger, and A. E. Taylor. 1971.Interstitial fluid pressure. Physiol. Rev. 51: 527-563.
26. Ussing, H. H. 1966. Anomalous transport of electro-lytes and sucrose through the isolated frog skin inducedby hypertonicity of the outside bathing solution. Ann.N. Y. Acad. Sci. 137: 543-555.
27. Ussing, H. H., and B. Johansen. 1969. Anomalous trans-port of sucrose and urea in toad skin. Nephron. 6: 317-328.
28. Franz, T. J., and J. T. Van Bruggen. 1967. Hyperos-molarity and the net transport of nonelectrolytes infrog skin. J. Gen. Physiol. 50: 933-949.
29. Feisal, K A., J. Soni, and A. B. Dubois. 1962. Pul-monary arterial circulation time, pulmonary arterialvolume and the ratio of gas to tissue volume in thelungs of dogs. J. Clin. Invest. 41: 390400.
946 R. M. Effros

30. Read, R. C., J. A. Johnson, J. A. Vick, and M. W.Meyer. 1960. Vascular effects of hypertonic solutions.Circ. Res. 8: 538-547.
31. Rand, P. W., and E. Lacombe. 1965. Effects of angio-cardiographic injections on blood viscosity. Radiology.84: 1022-1032.
32. Jacobs, M. H. 1958. Measurement of cell permeabilitywith particular reference to the erythrocyte. Mod.Trends Physiol. Biochem. 6: 149-171.
33. Katchalsky, A., and P. F. Curran. 1965. NonequilibriumThermodynamics in Biophysics. Harvard UniversityPress, Cambridge, Mass. 113-132.
34. Patlak, C. S., and S. I. Rappoport. 1971. Theoreticalanalysis of net tracer flux due to volume circulation in
a membrane with pores of different sizes. J. Gen. Phys-iol. 57: 113-124.
35. Lifson, N. 1970. Revised equations for the osmotictransient method. In Capillary Permeability. C. Croneand N. A. Lassen, editors. Academic Press, Inc., NewYork. 302-305.
36. Shirley, H. H., Jr., C. G. Wolfram, K Wasserman,and H. S. Mayerson. 1957. Capillary permeability tomacromolecules: stretched pore phenomenon. Am. J.Physiol. 190: 189-193.
37. Pietra, G. G., J. P. Szidon, M. M. Leventhal, andA. P. Fishman. 1969. Hemoglobin as a tracer in hemo-dynamic pulmonary edema. Science. (Wash. D. C.).166: 1643-1646.
Osmotic Dehydration of the Lungs 947
Related Documents