Welcome message from author
This document is posted to help you gain knowledge. Please leave a comment to let me know what you think about it! Share it to your friends and learn new things together.
Transcript
OsmaniaJournal of Management
Volume - XIV Number - 1 Oct - Dec 2021
DEPARTMENT OF BUSINESS MANAGEMENTOSMANIA UNIVERSITY
Hyderabad, Telangana, India
Peer - Reviewed Management Journal
Editor-in-chiefProf. R. Nageshwar Rao
HEADDepartment of Business Management
Osmania University, Hyderabad.
Executive EditorDr. Y. Jahangir
Associate Professor,Department of Business Management
Osmania University, Hyderabad.
Editorial Board MemberProf. K. Mallikarjuna Reddy
Department of Business ManagementOsmania University, Hyderabad.
Prof. P. VenkataiahDepartment of Business Management
Osmania University, Hyderabad.
Prof. K.G. ChandrikaDepartment of Business Management
Osmania University, Hyderabad.
Prof. D. SreeramuluDepartment of Business Management
Osmania University, Hyderabad.
Prof. V. SudhaDepartment of Business Management
Osmania University, Hyderabad.
Prof. K.S. ChandrasekharManagement Studies, University of
Kerala, Thiruvananthapuram.
Prof. G.V.R.K. AcharyuluDean, School of Management Studies,
University of Hyderabad.
OSMANIA JOURNAL OF MANAGMENTVolume XIV Number 1 Oct - Dec 2021
Contents
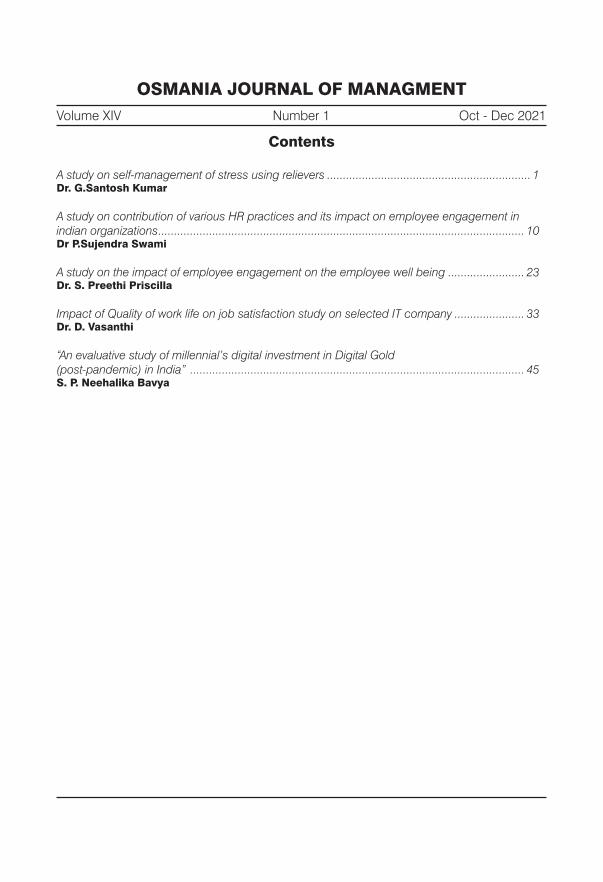
A study on self-management of stress using relievers ................................................................ 1Dr. G.Santosh Kumar
A study on contribution of various HR practices and its impact on employee engagement in indian organizations ................................................................................................................... 10Dr P.Sujendra Swami
A study on the impact of employee engagement on the employee well being ........................ 23Dr. S. Preethi Priscilla
Impact of Quality of work life on job satisfaction study on selected IT company ...................... 33Dr. D. Vasanthi
“An evaluative study of millennial’s digital investment in Digital Gold (post-pandemic) in India” ......................................................................................................... 45S. P. Neehalika Bavya

�
ISSN No. 0976 - 4208
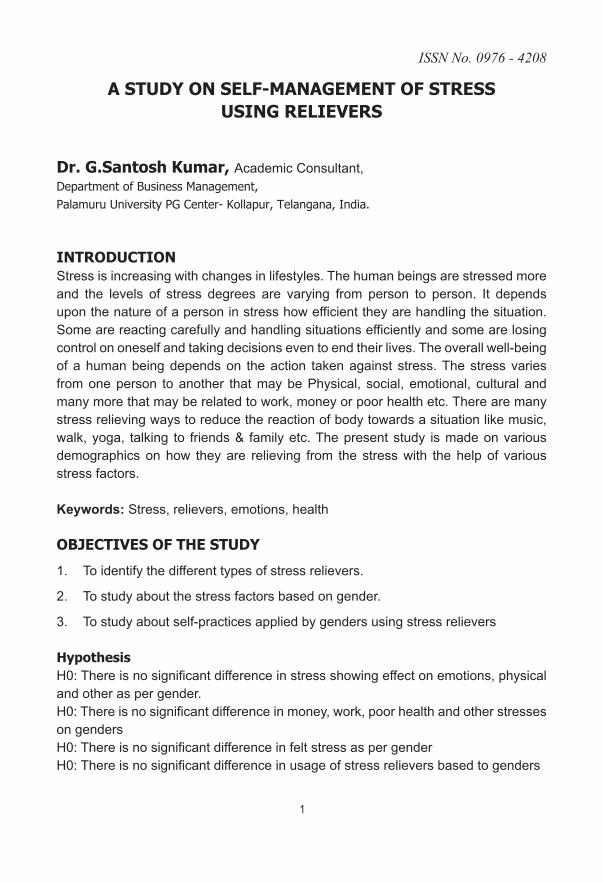
A study on self-mAnAgement of stress using relievers
dr. g.santosh Kumar, Academic Consultant,Department of Business Management,Palamuru University PG Center- Kollapur, Telangana, India.
introductionStress is increasing with changes in lifestyles. The human beings are stressed more and the levels of stress degrees are varying from person to person. It depends upon the nature of a person in stress how efficient they are handling the situation. Some are reacting carefully and handling situations efficiently and some are losing control on oneself and taking decisions even to end their lives. The overall well-being of a human being depends on the action taken against stress. The stress varies from one person to another that may be Physical, social, emotional, cultural and many more that may be related to work, money or poor health etc. There are many stress relieving ways to reduce the reaction of body towards a situation like music, walk, yoga, talking to friends & family etc. The present study is made on various demographics on how they are relieving from the stress with the help of various stress factors.
Keywords: Stress, relievers, emotions, health
objectives of the study
1. To identify the different types of stress relievers.
2. To study about the stress factors based on gender.
3. To study about self-practices applied by genders using stress relievers
hypothesisH0: There is no significant difference in stress showing effect on emotions, physical and other as per gender.H0: There is no significant difference in money, work, poor health and other stresses on gendersH0: There is no significant difference in felt stress as per genderH0: There is no significant difference in usage of stress relievers based to genders
�
Osmania Journal of Management
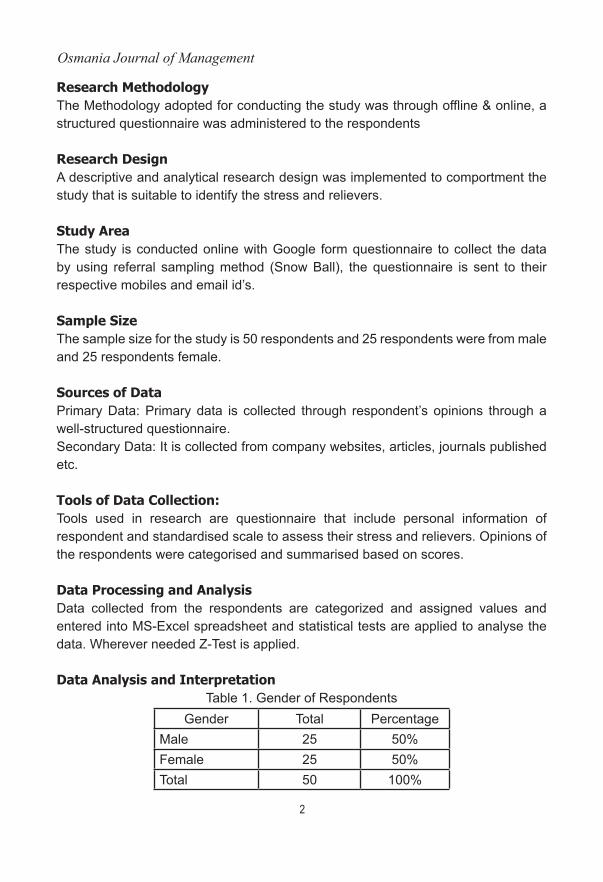
research methodologyThe Methodology adopted for conducting the study was through offline & online, a structured questionnaire was administered to the respondents
research design A descriptive and analytical research design was implemented to comportment the study that is suitable to identify the stress and relievers.
study AreaThe study is conducted online with Google form questionnaire to collect the data by using referral sampling method (Snow Ball), the questionnaire is sent to their respective mobiles and email id’s.
sample sizeThe sample size for the study is 50 respondents and 25 respondents were from male and 25 respondents female.
sources of dataPrimary Data: Primary data is collected through respondent’s opinions through a well-structured questionnaire.Secondary Data: It is collected from company websites, articles, journals published etc.
tools of data collection:Tools used in research are questionnaire that include personal information of respondent and standardised scale to assess their stress and relievers. Opinions of the respondents were categorised and summarised based on scores.
data Processing and AnalysisData collected from the respondents are categorized and assigned values and entered into MS-Excel spreadsheet and statistical tests are applied to analyse the data. Wherever needed Z-Test is applied.
data Analysis and interpretationTable 1. Gender of Respondents
Gender Total PercentageMale 25 50%Female 25 50%Total 50 100%
�
ISSN No. 0976 - 4208
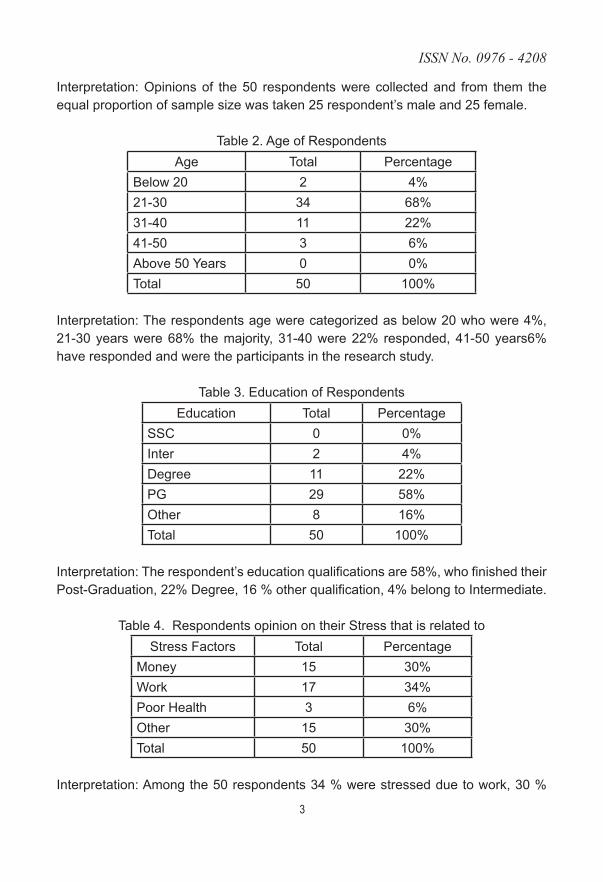
Interpretation: Opinions of the 50 respondents were collected and from them the equal proportion of sample size was taken 25 respondent’s male and 25 female.
Table 2. Age of RespondentsAge Total Percentage
Below 20 2 4%21-30 34 68%31-40 11 22%41-50 3 6%Above 50 Years 0 0%Total 50 100%
Interpretation: The respondents age were categorized as below 20 who were 4%, 21-30 years were 68% the majority, 31-40 were 22% responded, 41-50 years6% have responded and were the participants in the research study.
Table 3. Education of RespondentsEducation Total Percentage
SSC 0 0%Inter 2 4%Degree 11 22%PG 29 58%Other 8 16%Total 50 100%
Interpretation: The respondent’s education qualifications are 58%, who finished their Post-Graduation, 22% Degree, 16 % other qualification, 4% belong to Intermediate.
Table 4. Respondents opinion on their Stress that is related toStress Factors Total Percentage
Money 15 30%Work 17 34%Poor Health 3 6%Other 15 30%Total 50 100%
Interpretation: Among the 50 respondents 34 % were stressed due to work, 30 %
�
Osmania Journal of Management
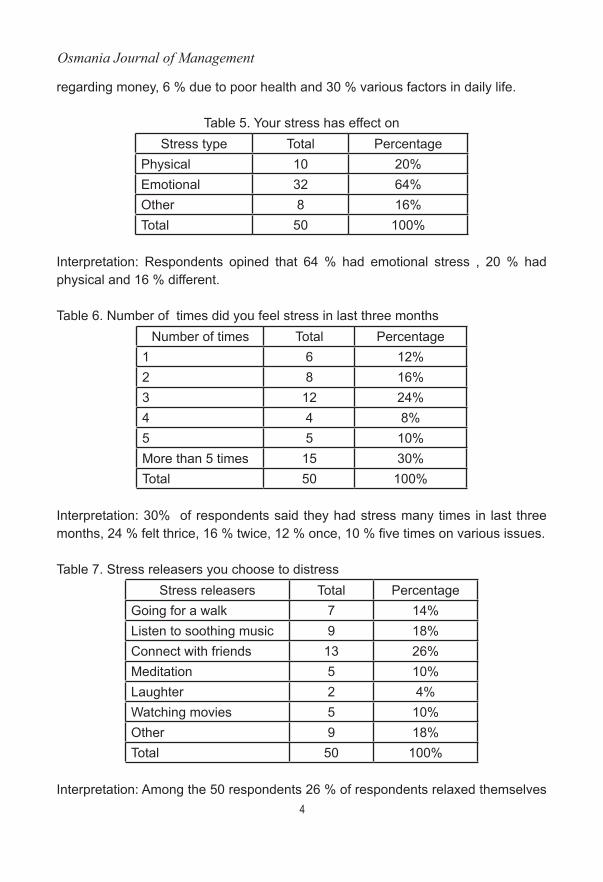
regarding money, 6 % due to poor health and 30 % various factors in daily life.
Table 5. Your stress has effect on Stress type Total Percentage
Physical 10 20%Emotional 32 64%Other 8 16%Total 50 100%
Interpretation: Respondents opined that 64 % had emotional stress , 20 % had physical and 16 % different.
Table 6. Number of times did you feel stress in last three monthsNumber of times Total Percentage
1 6 12%2 8 16%3 12 24%4 4 8%5 5 10%More than 5 times 15 30%Total 50 100%
Interpretation: 30% of respondents said they had stress many times in last three months, 24 % felt thrice, 16 % twice, 12 % once, 10 % five times on various issues.
Table 7. Stress releasers you choose to distressStress releasers Total Percentage
Going for a walk 7 14%Listen to soothing music 9 18%Connect with friends 13 26%Meditation 5 10%Laughter 2 4%Watching movies 5 10%Other 9 18%Total 50 100%
Interpretation: Among the 50 respondents 26 % of respondents relaxed themselves
�
ISSN No. 0976 - 4208
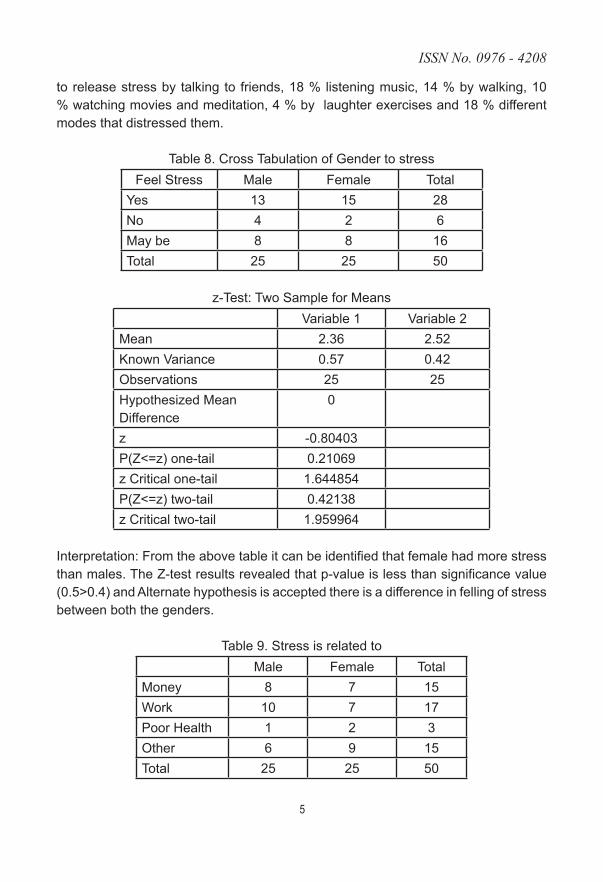
to release stress by talking to friends, 18 % listening music, 14 % by walking, 10 % watching movies and meditation, 4 % by laughter exercises and 18 % different modes that distressed them.
Table 8. Cross Tabulation of Gender to stressFeel Stress Male Female Total
Yes 13 15 28No 4 2 6May be 8 8 16Total 25 25 50
z-Test: Two Sample for MeansVariable 1 Variable 2
Mean 2.36 2.52Known Variance 0.57 0.42Observations 25 25Hypothesized Mean Difference
0
z -0.80403P(Z<=z) one-tail 0.21069z Critical one-tail 1.644854P(Z<=z) two-tail 0.42138z Critical two-tail 1.959964
Interpretation: From the above table it can be identified that female had more stress than males. The Z-test results revealed that p-value is less than significance value (0.5>0.4) and Alternate hypothesis is accepted there is a difference in felling of stress between both the genders.
Table 9. Stress is related toMale Female Total
Money 8 7 15Work 10 7 17Poor Health 1 2 3Other 6 9 15Total 25 25 50
�
Osmania Journal of Management
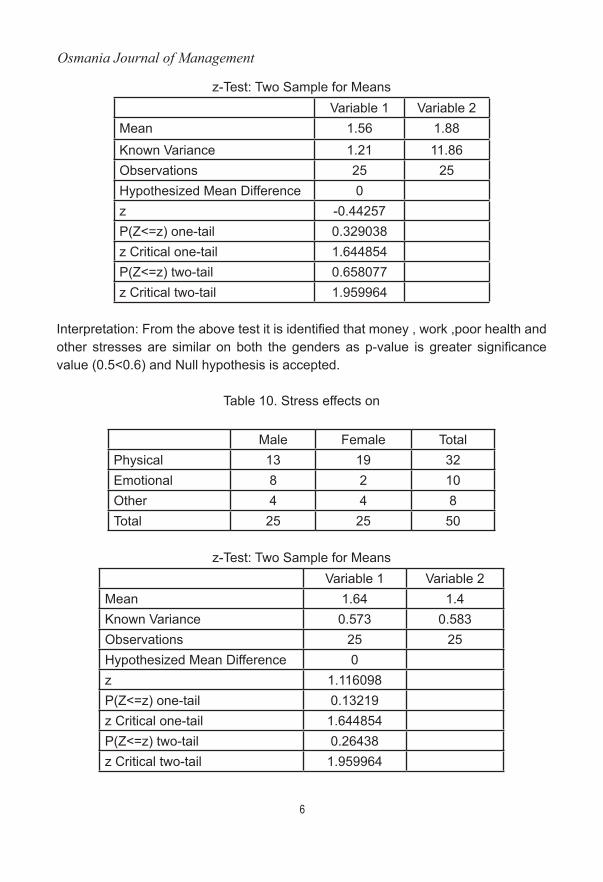
z-Test: Two Sample for MeansVariable 1 Variable 2
Mean 1.56 1.88Known Variance 1.21 11.86Observations 25 25Hypothesized Mean Difference 0z -0.44257P(Z<=z) one-tail 0.329038z Critical one-tail 1.644854P(Z<=z) two-tail 0.658077z Critical two-tail 1.959964
Interpretation: From the above test it is identified that money , work ,poor health and other stresses are similar on both the genders as p-value is greater significance value (0.5<0.6) and Null hypothesis is accepted.
Table 10. Stress effects on
Male Female TotalPhysical 13 19 32Emotional 8 2 10Other 4 4 8Total 25 25 50
z-Test: Two Sample for MeansVariable 1 Variable 2
Mean 1.64 1.4Known Variance 0.573 0.583Observations 25 25Hypothesized Mean Difference 0z 1.116098P(Z<=z) one-tail 0.13219z Critical one-tail 1.644854P(Z<=z) two-tail 0.26438z Critical two-tail 1.959964
�
ISSN No. 0976 - 4208
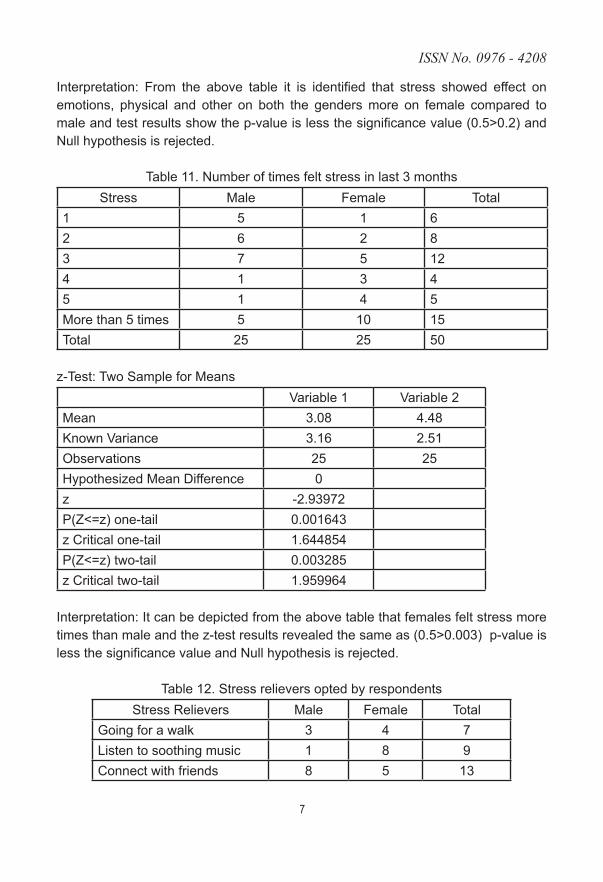
Interpretation: From the above table it is identified that stress showed effect on emotions, physical and other on both the genders more on female compared to male and test results show the p-value is less the significance value (0.5>0.2) and Null hypothesis is rejected.
Table 11. Number of times felt stress in last 3 monthsStress Male Female Total
1 5 1 62 6 2 83 7 5 124 1 3 45 1 4 5More than 5 times 5 10 15Total 25 25 50
z-Test: Two Sample for Means Variable 1 Variable 2Mean 3.08 4.48Known Variance 3.16 2.51Observations 25 25Hypothesized Mean Difference 0z -2.93972P(Z<=z) one-tail 0.001643z Critical one-tail 1.644854P(Z<=z) two-tail 0.003285z Critical two-tail 1.959964
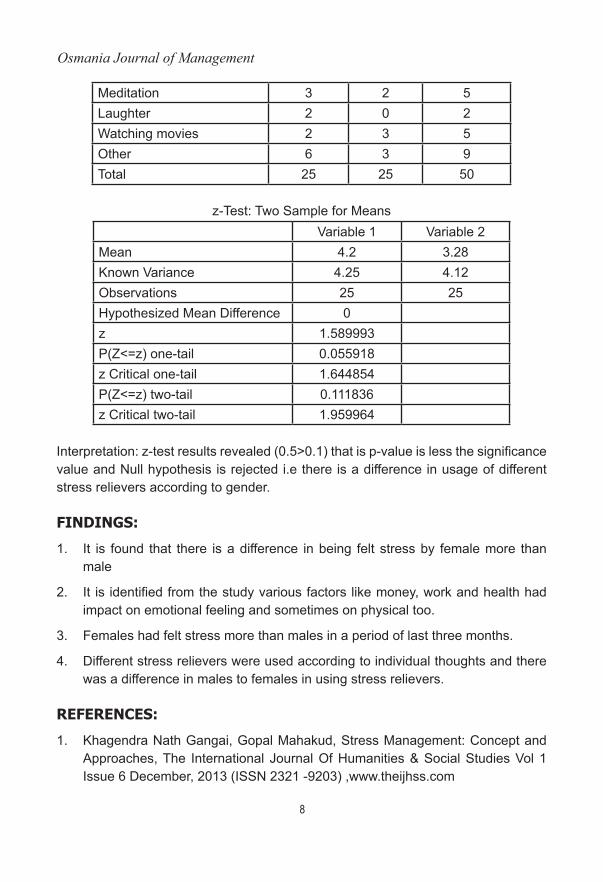
Interpretation: It can be depicted from the above table that females felt stress more times than male and the z-test results revealed the same as (0.5>0.003) p-value is less the significance value and Null hypothesis is rejected.
Table 12. Stress relievers opted by respondentsStress Relievers Male Female Total
Going for a walk 3 4 7Listen to soothing music 1 8 9Connect with friends 8 5 13
�
Osmania Journal of Management
Meditation 3 2 5Laughter 2 0 2Watching movies 2 3 5Other 6 3 9Total 25 25 50
z-Test: Two Sample for MeansVariable 1 Variable 2
Mean 4.2 3.28Known Variance 4.25 4.12Observations 25 25Hypothesized Mean Difference 0z 1.589993P(Z<=z) one-tail 0.055918z Critical one-tail 1.644854P(Z<=z) two-tail 0.111836z Critical two-tail 1.959964
Interpretation: z-test results revealed (0.5>0.1) that is p-value is less the significance value and Null hypothesis is rejected i.e there is a difference in usage of different stress relievers according to gender.
findings:
1. It is found that there is a difference in being felt stress by female more than male
2. It is identified from the study various factors like money, work and health had impact on emotional feeling and sometimes on physical too.
3. Females had felt stress more than males in a period of last three months.
4. Different stress relievers were used according to individual thoughts and there was a difference in males to females in using stress relievers.
references:
1. Khagendra Nath Gangai, Gopal Mahakud, Stress Management: Concept and Approaches, The International Journal Of Humanities & Social Studies Vol 1 Issue 6 December, 2013 (ISSN 2321 -9203) ,www.theijhss.com
�
ISSN No. 0976 - 4208
2. Manoj Kumar, A. and Bawthra, R., A STUDY ON STRESS MANAGEMENT STRATEGIES OF STUDENTS, Asian Journal of Science and Technology ,Vol. 11, Issue, 01, pp.10788-10791, February, 2020
3. Yasmin, H., Khalil, S., & Mazhar, R. (2020). COVID 19: stress management among students and its impact on their effective learning. International technology and education journal, 4(2), 65-74
4. Neil Schneiderman, Gail Ironson, and Scott D. Siegel, STRESS AND HEALTH: Psychological, Behavioral, and Biological Determinants, Annu Rev Clin Psychol. 2005; 1: 607–628. doi: 10.1146/annurev.clinpsy.1.102803.144141
5. IvanaKati,TatjanaKneževi,NemanjaBerber,AndreaIvaniševi,andMarjanLeber , The Impact of Stress on Life, Working, and Management Styles: How to Make an Organization Healthier? http://www.mdpi.com/journal/sustainability, Sustainability 2019, 11, 4026; doi:10.3390/su11154026
�0
Osmania Journal of Management
A study on contribution of vArious hr PrActices And its imPAct on emPloyee engAgement in indiAn orgAniZAtions
dr P.sujendra swami, Associate Professor,Wesley Post Graduate College, Secundrabad.
AbstrActThe labor market in India is undergoing a significant amount of change, with many organizations within it geared towards achieving various facets of the country’s future vision. Achieving such a lofty target would require an employee to engaged in the target and the process of achieving it. As it stands, there has not been much research conducted on employee engagement in this market.. Employees valued having informal, flexible treatment from their managers, and greatly valued having the opportunities to train and develop their skills and careers. Compensation and benefits showed a more dependent effect, being considered a factor that is not necessarily positively correlated on its own. Organizational culture displayed some positive effect on engagement but not a significant one. This paper uses a survey method to collect information from employees on four identified factors based on literary studies in other sectors and/or countries: Compensation and benefits, organizational culture, flexibility, and training and development. The survey data gathered shows a strong trend of culture and compensation having a strong influence on employee engagement. This agrees with what research on literature established in other countries and industries.
Keywords:
introductionTo enhance engagement through your selection of employees, identify those candidates who are best-suited to the job and your organization’s culture. Also use candidate- assessment methods that have obvious relevance to the job in question—for example, by asking interviewees what they know about the role and having them provide work samples. Most candidates will view these techniques more positively than tests with less apparent relevance, such as personality and integrity assessments.29 Successful candidates feel good about having “passed the test,” and see your company as careful and capable for having selected them. A positive
��
ISSN No. 0976 - 4208
initial impression of an employer encourages growth of long-term commitment. “Effective Employee Selection” summarizes lessons from this section. Employees who are truly engaged will be motivated to do their best work every day and stay with a company who is taking employee engagement seriously. By investing in employee engagement, your company will be able to increase productivity, work quality, and retain top talent.
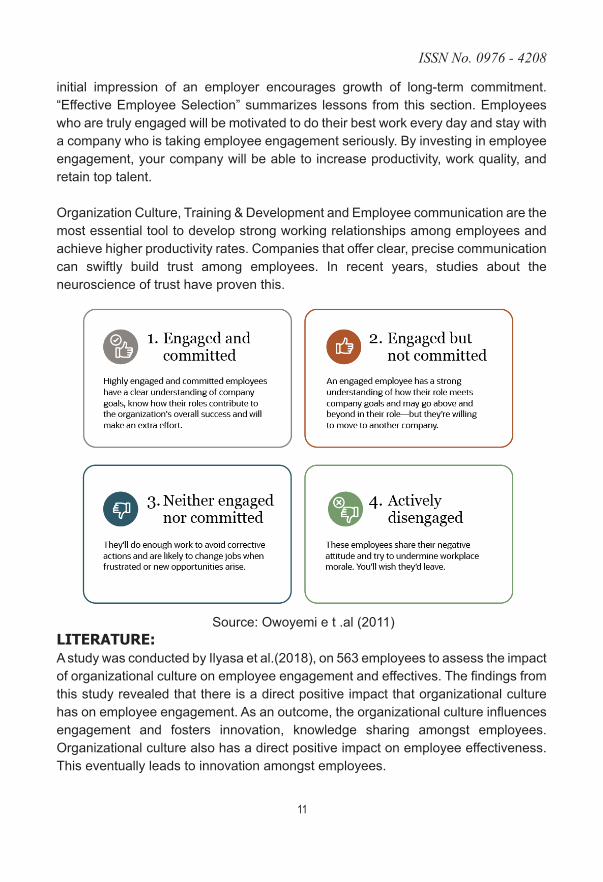
Organization Culture, Training & Development and Employee communication are the most essential tool to develop strong working relationships among employees and achieve higher productivity rates. Companies that offer clear, precise communication can swiftly build trust among employees. In recent years, studies about the neuroscience of trust have proven this.
Source: Owoyemi e t .al (2011)literAture:A study was conducted by Ilyasa et al.(2018), on 563 employees to assess the impact of organizational culture on employee engagement and effectives. The findings from this study revealed that there is a direct positive impact that organizational culture has on employee engagement. As an outcome, the organizational culture influences engagement and fosters innovation, knowledge sharing amongst employees. Organizational culture also has a direct positive impact on employee effectiveness. This eventually leads to innovation amongst employees.
��
Osmania Journal of Management
Organizational culture usually exists in the observed and prevalent practices being followed by an organization and the manner in which people recognize that which occurs within the organization. It helps organizational guidelines (documents) and by perceiving the way how activities are carried out within an organization, the organization culture of an organization can be interpreted (Kuscu et al., 2015).
Khan et.al. (2016) construed that training and development and job satisfaction are to important parameters of employee performance. In their study they made an attempt to study the effect of training and development on performance of the employee through job satisfaction. A sample of 105 employees from telecom companies in Pakistan were collected and analyzed. The results revealed that there is a positive impact of training and development on job satisfaction and performance of the employees. Thus they concluded that by investing in training and development programs job satisfaction among the employees will increase. Hence the satisfied employees will perform their assigned tasks responsibly and with best performance.
Arunmozhi (2015) conducted a research on employee engagement and involvement at ICICI bank, Chennai. Responses were collected and analyzed from 300 employees. The statistical analysis revealed that that there is a significant difference amongst the engaged and disengaged employees with respect to employees who underwent training and those employees who didn’t undergo any training to enhance the work efficiency. Results show that Employee engagement has a positive correlation with performance of the employee, safety of the officers and their retention. While, employee engagement did not had any correlation with recognition and incentive for job, and job satisfaction among the employees. Research by Condos Jr. (2016) showed that engaged employee results in 95% higher assets, 68% higher sales, and 29% intended to retain at this current company. Anitha J (2013) defined seven factors that support the existence of employee engagement. Those seven factors are job environment, leadership, team, training and development, compensation, company rules, and workplace well being. Brand supposed to be visual, verbal, and behavior expression which is unique from corprate’s business model. In order to implement 3 organization brand, there are five factors called 5C (Blumenthal, 2011).
methodology:objectives:
1 ) To identify various HR practices impact on Employee Engagement
2) To study Organization culture support to Employee engagement success
��
ISSN No. 0976 - 4208
3 ) To know Training & Development influence on employee Engagement4) To analyze Compensation contribution towards successful Employee Engagement.
hypothesis:Ho1: There is no significance relation between Training & Development and employee engagementHo2: There is no association between Organization Culture and employee engagement successHo3: The Compensation has no such significant impact on Employee Engagement.
sample & scope of the study:The sample consists of 116 respondents representing from the Government, Semi-Government and Private sector in various public and priate oraganizations like NMDC, ONGC , NABARD, LIC and ICICI , Wipro companies in Hyderabad.
The scope of the study is limited to the Government, Semi-Government and Private sector organizations in Hyderabad.
data collection:Primary Data Was collected with the help of structured questionnaire contain four dimension like Organization Culture, Training & development , Compensation and Flexibility and each dimension consist of related sub questions.
dAtA AnAlysisThe data analysis was conducted in a Four-stage process. First, factor analysis of the collected data was conducted to find the relationship between the variables followed by Confirmatory Factor Analysis (CFA) was performed to confirm the findings. Reliability and validity test was done on the model followed by Structural Equation Model (SEM). SPSS Statistics 25.0 software is used factor analysis. SPSS Amos 22.0 software is used for CFA model fit and SEM to estimate the relationships between the independent variables and the dependent variable so as to accept or reject the hypothesis.
eXPlorAtory fActor AnAlysis:The Kaiser-Meyer-Oklin (KMO) and Bartlett’s Test is used to test suitability of data for factor analysis. KMO value was .882exceeding the recommended value of 0.70 which can be considered as adequate (Kaiser and Rice, 1974) while Bartlett’s Test of sphericity reached statistical significance (Approx. chi-square 2338.726, df210and Sig .000) which signifies the data is good for conducting factor analysis.
��
Osmania Journal of Management
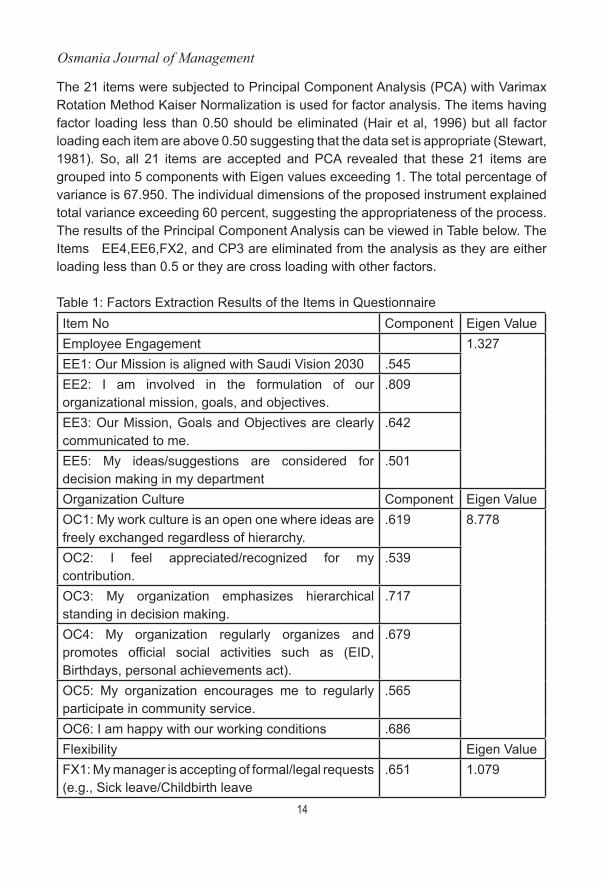
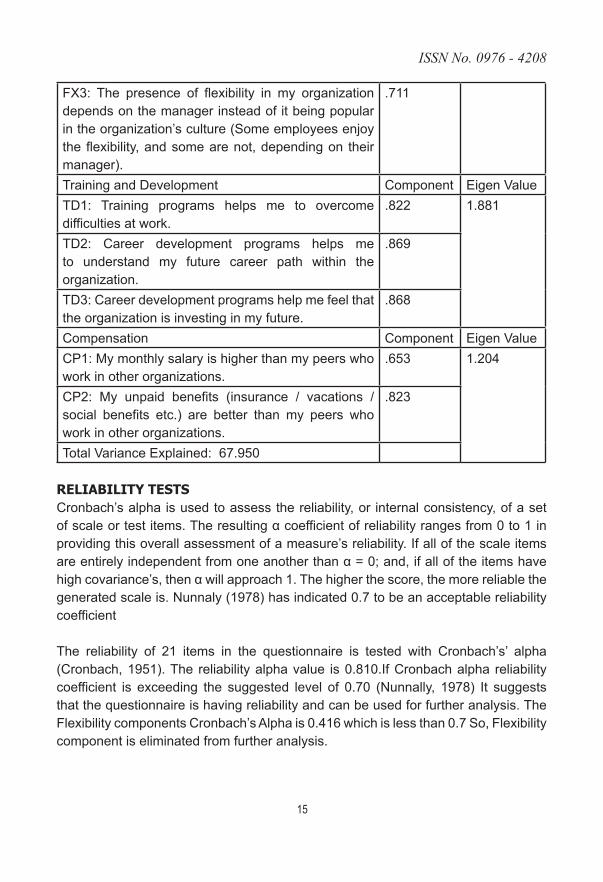
The 21 items were subjected to Principal Component Analysis (PCA) with Varimax Rotation Method Kaiser Normalization is used for factor analysis. The items having factor loading less than 0.50 should be eliminated (Hair et al, 1996) but all factor loading each item are above 0.50 suggesting that the data set is appropriate (Stewart, 1981). So, all 21 items are accepted and PCA revealed that these 21 items are grouped into 5 components with Eigen values exceeding 1. The total percentage of variance is 67.950. The individual dimensions of the proposed instrument explained total variance exceeding 60 percent, suggesting the appropriateness of the process. The results of the Principal Component Analysis can be viewed in Table below. The Items EE4,EE6,FX2, and CP3 are eliminated from the analysis as they are either loading less than 0.5 or they are cross loading with other factors.
Table 1: Factors Extraction Results of the Items in QuestionnaireItem No Component Eigen ValueEmployee Engagement 1.327EE1: Our Mission is aligned with Saudi Vision 2030 .545EE2: I am involved in the formulation of our organizational mission, goals, and objectives.
.809
EE3: Our Mission, Goals and Objectives are clearly communicated to me.
.642
EE5: My ideas/suggestions are considered for decision making in my department
.501
Organization Culture Component Eigen ValueOC1: My work culture is an open one where ideas are freely exchanged regardless of hierarchy.
.619 8.778
OC2: I feel appreciated/recognized for my contribution.
.539
OC3: My organization emphasizes hierarchical standing in decision making.
.717
OC4: My organization regularly organizes and promotes official social activities such as (EID, Birthdays, personal achievements act).
.679
OC5: My organization encourages me to regularly participate in community service.
.565
OC6: I am happy with our working conditions .686Flexibility Eigen ValueFX1: My manager is accepting of formal/legal requests (e.g., Sick leave/Childbirth leave
.651 1.079
��
ISSN No. 0976 - 4208
FX3: The presence of flexibility in my organization depends on the manager instead of it being popular in the organization’s culture (Some employees enjoy the flexibility, and some are not, depending on their manager).
.711
Training and Development Component Eigen ValueTD1: Training programs helps me to overcome difficulties at work.
.822 1.881
TD2: Career development programs helps me to understand my future career path within the organization.
.869
TD3: Career development programs help me feel that the organization is investing in my future.
.868
Compensation Component Eigen ValueCP1: My monthly salary is higher than my peers who work in other organizations.
.653 1.204
CP2: My unpaid benefits (insurance / vacations / social benefits etc.) are better than my peers who work in other organizations.
.823
Total Variance Explained: 67.950
reliAbility testsCronbach’s alpha is used to assess the reliability, or internal consistency, of a set ofscaleortestitems.Theresultingαcoefficientofreliabilityrangesfrom0to1inproviding this overall assessment of a measure’s reliability. If all of the scale items areentirelyindependentfromoneanotherthanα=0;and,ifalloftheitemshavehighcovariance’s,thenαwillapproach1.Thehigherthescore,themorereliablethegenerated scale is. Nunnaly (1978) has indicated 0.7 to be an acceptable reliability coefficient
The reliability of 21 items in the questionnaire is tested with Cronbach’s’ alpha (Cronbach, 1951). The reliability alpha value is 0.810.If Cronbach alpha reliability coefficient is exceeding the suggested level of 0.70 (Nunnally, 1978) It suggests that the questionnaire is having reliability and can be used for further analysis. The Flexibility components Cronbach’s Alpha is 0.416 which is less than 0.7 So, Flexibility component is eliminated from further analysis.
��
Osmania Journal of Management
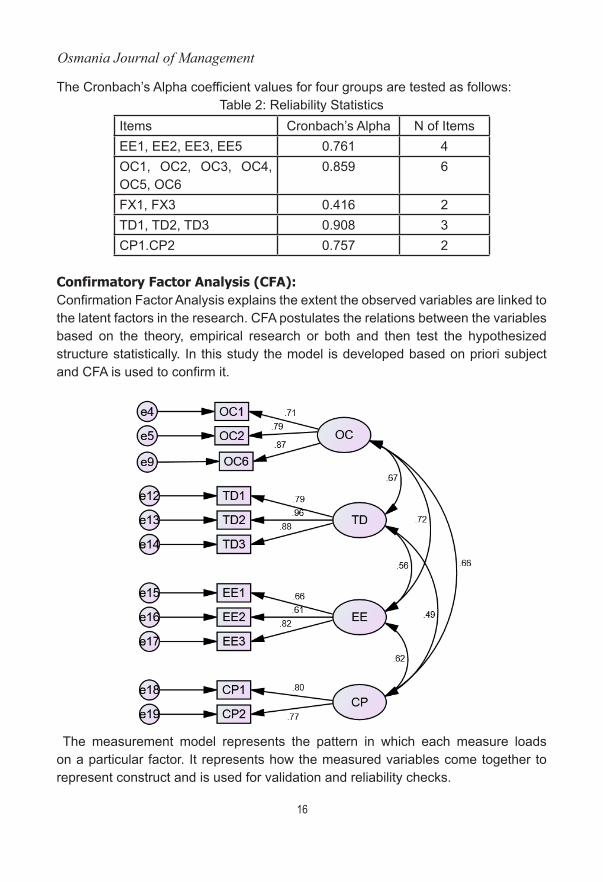
The Cronbach’s Alpha coefficient values for four groups are tested as follows:Table 2: Reliability Statistics
Items Cronbach’s Alpha N of ItemsEE1, EE2, EE3, EE5 0.761 4OC1, OC2, OC3, OC4, OC5, OC6
0.859 6
FX1, FX3 0.416 2TD1, TD2, TD3 0.908 3CP1.CP2 0.757 2
confirmatory factor Analysis (cfA):Confirmation Factor Analysis explains the extent the observed variables are linked to the latent factors in the research. CFA postulates the relations between the variables based on the theory, empirical research or both and then test the hypothesized structure statistically. In this study the model is developed based on priori subject and CFA is used to confirm it.
The measurement model represents the pattern in which each measure loads on a particular factor. It represents how the measured variables come together to represent construct and is used for validation and reliability checks.
��
ISSN No. 0976 - 4208
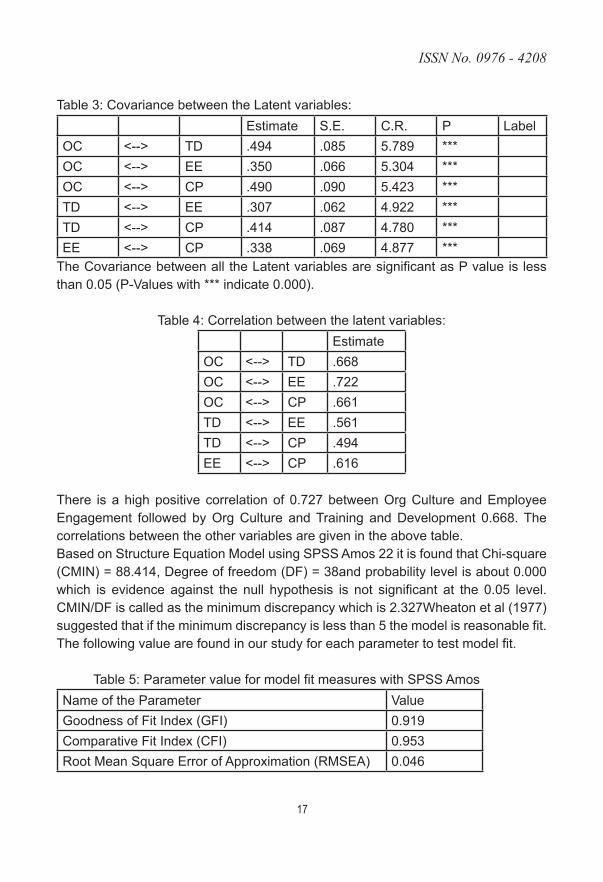
Table 3: Covariance between the Latent variables:Estimate S.E. C.R. P Label
OC <--> TD .494 .085 5.789 ***OC <--> EE .350 .066 5.304 ***OC <--> CP .490 .090 5.423 ***TD <--> EE .307 .062 4.922 ***TD <--> CP .414 .087 4.780 ***EE <--> CP .338 .069 4.877 ***
The Covariance between all the Latent variables are significant as P value is less than 0.05 (P-Values with *** indicate 0.000).
Table 4: Correlation between the latent variables:Estimate
OC <--> TD .668OC <--> EE .722OC <--> CP .661TD <--> EE .561TD <--> CP .494EE <--> CP .616
There is a high positive correlation of 0.727 between Org Culture and Employee Engagement followed by Org Culture and Training and Development 0.668. The correlations between the other variables are given in the above table.Based on Structure Equation Model using SPSS Amos 22 it is found that Chi-square (CMIN) = 88.414, Degree of freedom (DF) = 38and probability level is about 0.000 which is evidence against the null hypothesis is not significant at the 0.05 level. CMIN/DF is called as the minimum discrepancy which is 2.327Wheaton et al (1977) suggested that if the minimum discrepancy is less than 5 the model is reasonable fit. The following value are found in our study for each parameter to test model fit.
Table 5: Parameter value for model fit measures with SPSS AmosName of the Parameter ValueGoodness of Fit Index (GFI) 0.919Comparative Fit Index (CFI) 0.953Root Mean Square Error of Approximation (RMSEA) 0.046
��
Osmania Journal of Management
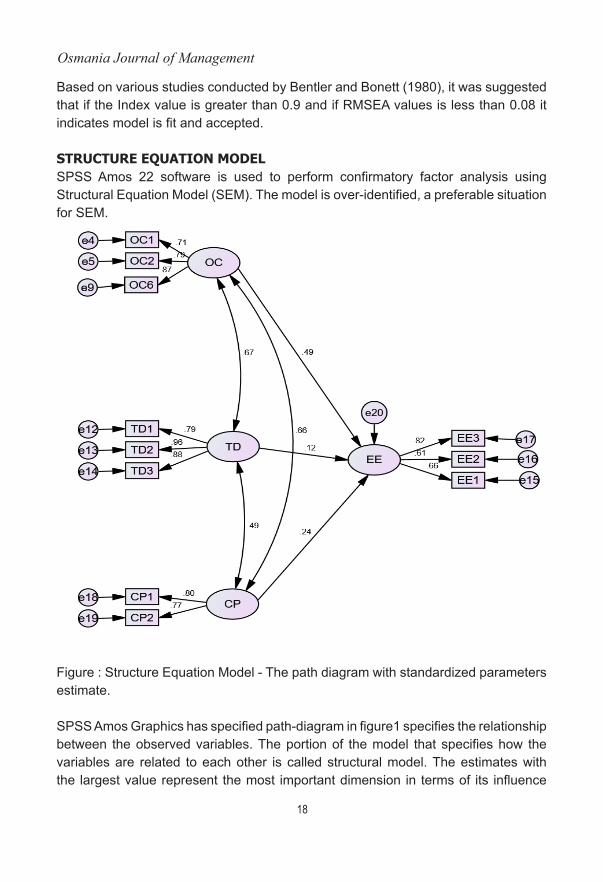
Based on various studies conducted by Bentler and Bonett (1980), it was suggested that if the Index value is greater than 0.9 and if RMSEA values is less than 0.08 it indicates model is fit and accepted.
structure eQuAtion modelSPSS Amos 22 software is used to perform confirmatory factor analysis using Structural Equation Model (SEM). The model is over-identified, a preferable situation for SEM.
Figure : Structure Equation Model - The path diagram with standardized parameters estimate.
SPSS Amos Graphics has specified path-diagram in figure1 specifies the relationship between the observed variables. The portion of the model that specifies how the variables are related to each other is called structural model. The estimates with the largest value represent the most important dimension in terms of its influence
��
ISSN No. 0976 - 4208
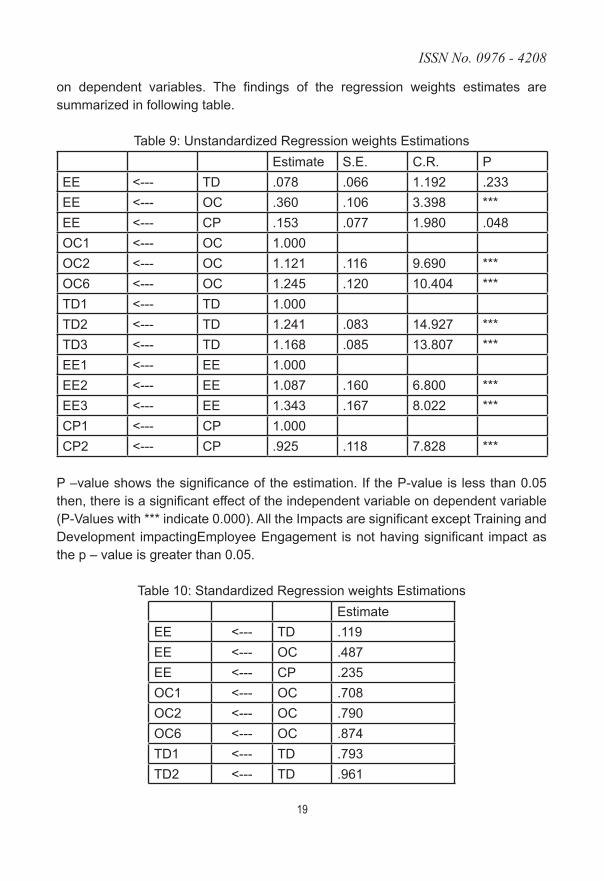
on dependent variables. The findings of the regression weights estimates are summarized in following table.
Table 9: Unstandardized Regression weights EstimationsEstimate S.E. C.R. P
EE <--- TD .078 .066 1.192 .233EE <--- OC .360 .106 3.398 ***EE <--- CP .153 .077 1.980 .048OC1 <--- OC 1.000OC2 <--- OC 1.121 .116 9.690 ***OC6 <--- OC 1.245 .120 10.404 ***TD1 <--- TD 1.000TD2 <--- TD 1.241 .083 14.927 ***TD3 <--- TD 1.168 .085 13.807 ***EE1 <--- EE 1.000EE2 <--- EE 1.087 .160 6.800 ***EE3 <--- EE 1.343 .167 8.022 ***CP1 <--- CP 1.000CP2 <--- CP .925 .118 7.828 ***
P –value shows the significance of the estimation. If the P-value is less than 0.05 then, there is a significant effect of the independent variable on dependent variable (P-Values with *** indicate 0.000). All the Impacts are significant except Training and Development impactingEmployee Engagement is not having significant impact as the p – value is greater than 0.05.
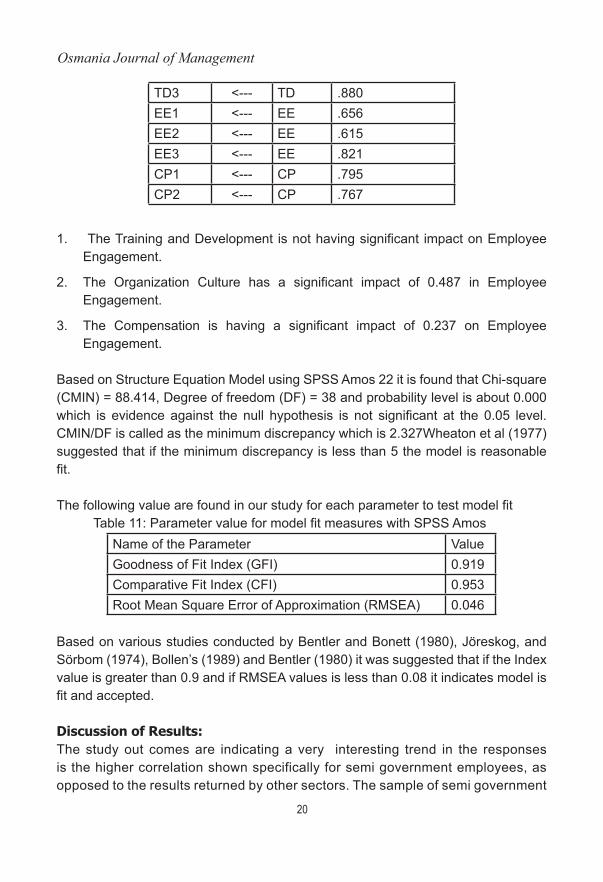
Table 10: Standardized Regression weights EstimationsEstimate
EE <--- TD .119EE <--- OC .487EE <--- CP .235OC1 <--- OC .708OC2 <--- OC .790OC6 <--- OC .874TD1 <--- TD .793TD2 <--- TD .961
�0
Osmania Journal of Management
TD3 <--- TD .880EE1 <--- EE .656EE2 <--- EE .615EE3 <--- EE .821CP1 <--- CP .795CP2 <--- CP .767
1. The Training and Development is not having significant impact on Employee Engagement.
2. The Organization Culture has a significant impact of 0.487 in Employee Engagement.
3. The Compensation is having a significant impact of 0.237 on Employee Engagement.
Based on Structure Equation Model using SPSS Amos 22 it is found that Chi-square (CMIN) = 88.414, Degree of freedom (DF) = 38 and probability level is about 0.000 which is evidence against the null hypothesis is not significant at the 0.05 level. CMIN/DF is called as the minimum discrepancy which is 2.327Wheaton et al (1977) suggested that if the minimum discrepancy is less than 5 the model is reasonable fit.
The following value are found in our study for each parameter to test model fit Table 11: Parameter value for model fit measures with SPSS Amos
Name of the Parameter ValueGoodness of Fit Index (GFI) 0.919Comparative Fit Index (CFI) 0.953Root Mean Square Error of Approximation (RMSEA) 0.046
Based on various studies conducted by Bentler and Bonett (1980), Jöreskog, and Sörbom (1974), Bollen’s (1989) and Bentler (1980) it was suggested that if the Index value is greater than 0.9 and if RMSEA values is less than 0.08 it indicates model is fit and accepted.
discussion of results:The study out comes are indicating a very interesting trend in the responses is the higher correlation shown specifically for semi government employees, as opposed to the results returned by other sectors. The sample of semi government
��
ISSN No. 0976 - 4208
employees alone is not enough to produce a fully valid statistical analysis, but this can point to the possibility of a focused study on that sector alone producing different results. Da Costa (2018) hypothesized and found some results for open, adhocracy cultures being valued in startup organizations, and semi government organizations here are reputed to have similar values to startups. This factor also helped guide towards ideas such as employees valuing their ideas being heard and used for formulating organizational goals and missions, which became its own factor as we will discuss.
The study also indicated that several diverse attributes pertaining to organizational culture can have substantial positive influence over employee engagement which in turn could impact organizational performance. Organizational culture is a system of approach which is rather open that has interactive as well as inter-dependent links with performance of the organization. The sophisticated and broad nature of this research could also extend value to studies pertaining to organizational culture and employee engagement by offering significant viewpoints in the realm of organizational culture, employee engagement and its overall impact while initiating extended discussion on the development of an effective framework between organizational culture, employee engagement and how it impacts organizational performance on the whole.
The results show that training and development negatively contribute to the engagement level of employees. In most of the HR realted studies, it is indicaited that Trainig & Develment is obviously has positive impact in all means , but especilly in Indian organizations, Semi govermant organizations are not at all deciding factor of succesful employee engagment.But effective career development programs makes employees feel that they are valued and that their organizations are investing on them, which is positively affecting employees loyalty and engagement anf not in this study. This means, in organizations, in order to improve the engagement level of employees, organization’s leaders and executives need not focus much on Training programs for their employees.
As evident from the results of the present study individual bring in organizations their own deep rooted psyche. This is developed out of their socialization in life. That is why training and development did not have any impact on the emotional connect of the employees with their organization. While, the results of this study clearly shows that there no significant impact of training and development practices on job satisfaction, organizational commitment, advocacy, intent to stay, pride and the overall employee engagement.
��
Osmania Journal of Management
references:
1. Anitha, J 2014. ‘Determinants of employee engagement and their impact on employee performance’. International Journal of Productivity and Performance Management, Vol. 63, N. 3, pp. 308-323
2. Arunmozhi, T. (2015). A Study On Employee Engagement And Involvement Practices In ICICI Bank Ltd., Chennai.
3. Blumenthal, D 2011. Internal branding: does it improve employees’ quality of life? Institute for Brand Leadership.
4. Condos, JR 2016. The relationshop between transformational leadership and employee engagement in Southwest Louisiana Law Firms. Dissertation, Northcentral University, Northcentral
5. Ilyasa, Madhakomala & Ramly, M. (2018). The Effect of Organization Culture, Knowledge Sharing and Employee Engagement on Employee Work Innovation. International Journal of Scientific Research and Management. 6 (1).
6. Khan, A. A., Abbasi, S. O., Waseem, R. M., Ayaz, M., and Ijaz, M. (2016). Impact of Training and Development of Employees on Employee Performance through Job Satisfaction: A Study of Telecom Sector of Pakistan. Business Management and Strategy , 7(1)
7. Kuºcu, Z.K., Yener, M. & Gürbüz, F.G. (2015). Learning Organization and its Cultural Manifestations: Evidence from a Global White Goods Manufacturer. Procedia - Social and Behavioral Sciences. 210. pp. 154–163.
8. Owoyemi, O. A., Oyelere, M., Elegbede, T., and Gbajumo-Sheriff, M. (2011). Enhancing Employees’ Commitment to Organisation through Training. International Journal of Business and Management , 6 (7).
9. PratimaSarangi & Nayak, B. (2016). Employee Engagement and Its Impact on Organizational Success – A Study in Manufacturing Company, India. IOSR Journal of Business and Management (IOSR-JBM). 18 (4). pp. 52–57.
10. Rothmann, S. & Baumann, C. (2017). Employee engagement: The effects of work-home/homework interaction and psychological conditions. South African Journal of Economic and Management Sciences. 17 (4). pp. 515– 530.
11. Terera, S. R., and Ngirande, H. (2014). The Impact of Training on Employee Job Satisfaction and Retention among Administrative Staff Members: A Case of a Selected Tertiary Institution. Journal of Socila Sciences , 39 (1), 43-50.
12. Ugargol, J.D. & Patrick, H.A. (2018). The Relationship of Workplace Flexibility to Employee Engagement among Information Technology Employees in India. South Asian Journal of Human Resources Management. 5 (1). pp. 40– 55.
��
ISSN No. 0976 - 4208
A study on the imPAct of emPloyee engAgement on the emPloyee Well being
dr. s. Preethi Priscilla, Associate Professor,Sri Indu PG College, Ibrahimpatnam.
AbstrActThe pandemic situation has changed the way businesses operate in the current world. Employees are forced to be confined to their places with minimum social and physical interaction. It has been reported from all across the world that there is a significant increase in the employee stress levels. Organisations across various industries are trying to find ways to build up and maintain employee well being which has a significant positive impact on organisational performance. The current study aims at finding the impact of employee engagement on employee well being. The study is undertaken in the city of Hyderabad which is a home to many multinational companies. A sample of 323 fully filled questionnaires have been used for the study and the data has been analysed using Linear Regression Model. The results indicated a positive correlation between employee engagement and employee well being.
Keywords:
introductionThe business world has been facing a very challenging work environment in the pandemic period which has hit the entire world. Work cultures, workplace definitions, organisation cultures have been defined in a whole new way. Virtual workplaces have become the new normal. This new forced trend in the workplaces has brought along many side effects like lack of social interaction, increased work hours, technical issues disrupting the work, work life balance issues and many more of similar kind, resulting in a lot of stress on the employees at all levels. Companies are taking measures to tackle this stress in order to motivate and boost the employee morale. Employee engagement is a field of study which defines the nature of the relationship between an organization and its employees. An “engaged employee” who is completely occupied by and proactively interested towards their job and hence actively engages in a productive behaviour to promote organization’s reputation and interests. An engaged employee always carries a positive outlook towards the organization and its objectives. On the other hand, a disengaged employee is likely
��
Osmania Journal of Management
to contribute bare minimum to the organisation.
benefits of employee engagement:An organisation is greatly benefited with employee engagement policies. The output can be clearly observed in various facets of the organisation. Following are some of the benefits of employee engagement.
Better team performance - Every engaged employee contributes significantly to the team and hence the team emerges as a high performing team. This group of engaged employees develop synergy for the team. Added to this, engaged employees have a very high morale which can be easily transmitted
Increased employee productivity - Employee efficiency greatly increases with employee engagement and as a result employees produce high quality work, Employees become more accountable and work in line with the organisational goals.
Higher employee retention and lower turnover rates - Building a performing organisation needs a committed workforce. If the employee retention is high, the strength of the organisation is feeble. Long standing employees develop a stock of knowledge and understand organisational culture which helps them to perform better. They develop a strong commitment to the organisational objectives which makes it less likely for the employees to leave the organisation.
Achieving team objectives - Engaged employees are very clear about their goals and objectives and effectively contribute to the team’s success. Such employees have a clear vision and they take a clear path towards the goals.
Lower employee absenteeism - Employees show excitement towards their work and they are less likely to miss their work.
Less workplace stress - Stress is a part of every workplace and every employee has to face it. Employees who are excited about their work plan and execute their work systematically. Thus they a create a happy workspace for themselves and for people around them.
Lower risk of burnout - Employee burnout as defined by the WHO is an occupational phenomenon as a result of severe workplace stress which is improperly managed. Burnout has adverse effect on the overall organisational performance. Engaged employees are less likely to face burnout.
��
ISSN No. 0976 - 4208
Companies have to carefully formulate HR practices which show a significant impact on employee engagement. Some of the measures to boost and promote employee engagement are
• Job enrichment - Designing the jobs with meaning, variety, autonomy to provide a broader view of the work to the employees so that they are willing to take up challenging tasks beyond their regular tasks.
• Recruitment and selection - The recruitment process should attract candidates who love their job to be more challenging and interesting and discourage those who dont exhibit such behaviour. Careful selection of the candidates who are inclined to perform beyond their jobs and voluntarily contribute for the growth of the organisation.
• Training and development - Training helps employees to gain better understanding also upgrading their skill set. It can also help employees understand their role in the development of the organisation.
• Strategic compensation - Compensation is a strong motivator for employee performance, Companies can adopt performance based pay systems to encourage employees for a proactive behaviour.
• Performance management - Providing challenging goals in alignment with the goals of an organisation, facilitating a strong feedback mechanism, and acknowledging employee contribution helps in enhancing employee performance.
Employee wellbeing is defined as the employees’ work and workplace influences their overall health and happiness. Different dimensions of employee wellbeing are
Social Wellness - It is all about developing and maintaining strong and healthy relationships at a consistent level. An employee must be given the scope to develop such relations.
Emotional Wellness - Work places have emerged to be more robust, dynamic and challenging which are stressful. Organisations must satisfy the emotional needs of an employee in every aspect.
Environmental Wellness - Workplace environment sets the tone for an employee performance. Toxic cultures disturb the employee momentum while a balanced culture promotes employee satisfaction.
Physical Wellness - Every employee is a physical being and a person’s body and
��
Osmania Journal of Management
mind work together, Companies must therefore help employees maintain physical health to the possible extent.
Importance of a wellbeing strategy - Employee wellbeing has a lot of advantages to offer to an organisation which makes it a subject of prominence. Some of the benefits are
• Enhanced work focus
• Decreased Stress levels
• Job satisfaction and positive approach
• Improved overall and physical health
• Healthy interpersonal relationships
• Improved performance and enhanced productivity
• Decrease in the levels of absenteeism
• Talent retention
Some major employers have well defined and employee oriented wellness programmes. For example:
• Wipro designs a range of wellness programmes for the employees from both the IT and BPO sector. The programmes are designed to provide services such as nutrition consulting, Arena (health centres), medical camps, employee well being events, Mitr (Friend) initiative which provides counselling and emotional support to the employee.
• Infosys has taken a holistic approach which builds a positive environment through collaborative care and wellness management among its employees. The program is carefully planned to improve the health standards of the employees resulting in reduced absenteeism and enhanced productivity.
• PepsiCo in collaboration with ILO worked to raise awareness about HIV/AIDS with the company’s own employees and those working for its business partners.
review of literatureDr. PratimaSarangi, Dr. Bhagirathi Nayak (2016) found that employee engagement has a positive effect on promoting organisational success in a study conducted in a manufacturing sector in India. Purushothaman, S. and Kaviya, E(2020) observed that
��
ISSN No. 0976 - 4208
engaged employees offer a better productivity and higher competitive advantages to the organisation in their research conducted in the IT industry. Blazej Motyka (2018) identifies a significant positive relation between employee engagement and employee performance in his research paper. Arti Chandani et al (2016) in their study observed that training programs enhance employee engagement which can significantly contribute to organisational performance. Julianne Tillman etal (2017) found tha employee engagement and stress have a positive influence on work outcomes like organisational citizenship behaviour . Brad and Thomas (2013) in their study found that engaged employees displayed high levels of emotional and social well being.
research methodologyThe current study is conducted among the employees working in various private organisations in the city of Hyderabad. A well defined questionnaire consisting of 31 questions related to employee engagement and employee mental well being has been distributed to 350 employees, out of which 323 are found to be complete and have been used for the study. A simple random sampling technique has been used to collect the data. SPSS package has been used to analyse the data and the statistical tools used for the study are Linear Regression Model have been used for demographics.
objective of the study• To study the impact of employee engagement on employee well being.
The null and alternative hypothesis are as follows
H0: There is no impact of employee engagement on employee well being
H1: There is an impact of employee engagement on employee well being
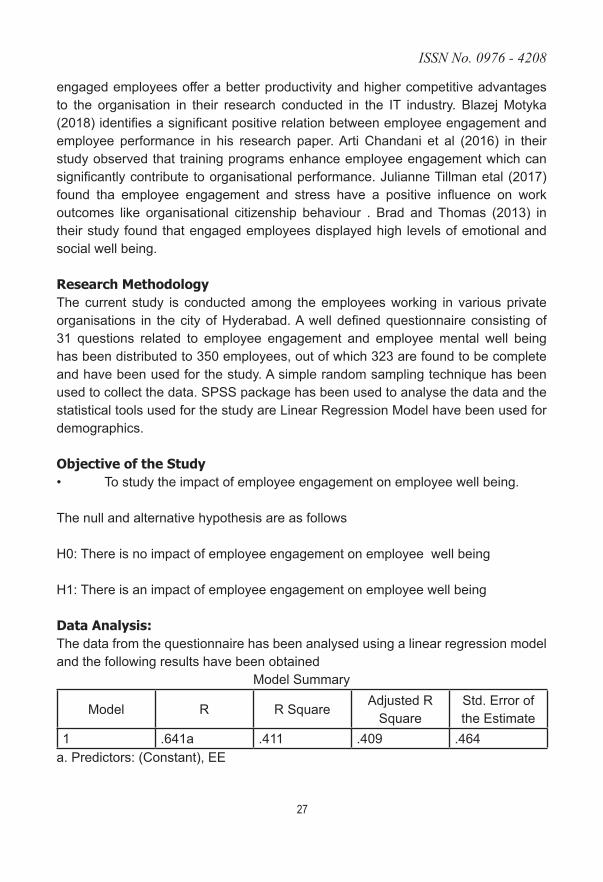
data Analysis:The data from the questionnaire has been analysed using a linear regression model and the following results have been obtained
Model Summary
Model R R SquareAdjusted R
SquareStd. Error of the Estimate
1 .641a .411 .409 .464a. Predictors: (Constant), EE
��
Osmania Journal of Management
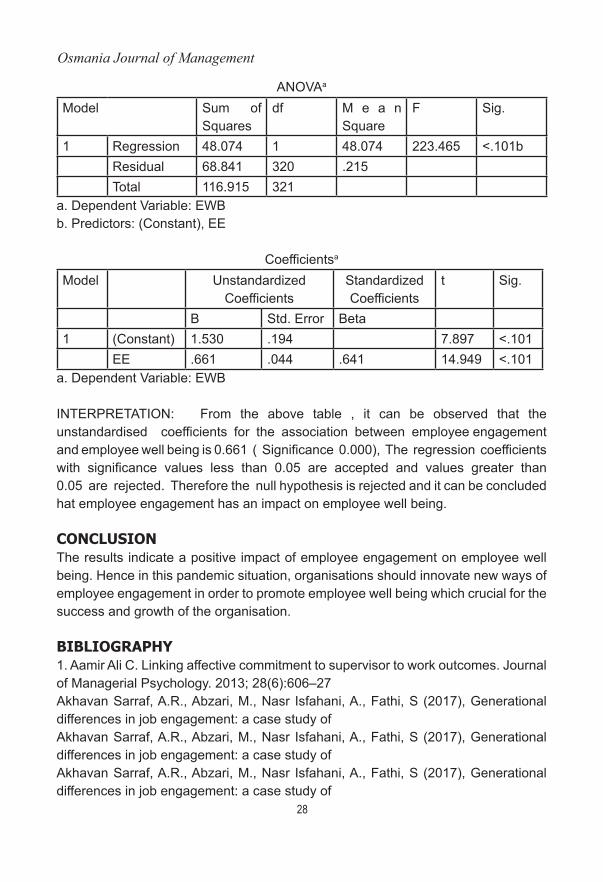
ANOVAa
Model Sum of Squares
df M e a n Square
F Sig.
1 Regression 48.074 1 48.074 223.465 <.101bResidual 68.841 320 .215Total 116.915 321
a. Dependent Variable: EWBb. Predictors: (Constant), EE
Coefficientsa
Model Unstandardized Coefficients
Standardized Coefficients
t Sig.
B Std. Error Beta1 (Constant) 1.530 .194 7.897 <.101
EE .661 .044 .641 14.949 <.101a. Dependent Variable: EWB
INTERPRETATION: From the above table , it can be observed that the unstandardised coefficients for the association between employee engagement and employee well being is 0.661 ( Significance 0.000), The regression coefficients with significance values less than 0.05 are accepted and values greater than 0.05 are rejected. Therefore the null hypothesis is rejected and it can be concluded hat employee engagement has an impact on employee well being.
conclusion The results indicate a positive impact of employee engagement on employee well being. Hence in this pandemic situation, organisations should innovate new ways of employee engagement in order to promote employee well being which crucial for the success and growth of the organisation.
bibliogrAPhy1. Aamir Ali C. Linking affective commitment to supervisor to work outcomes. Journal of Managerial Psychology. 2013; 28(6):606–27Akhavan Sarraf, A.R., Abzari, M., Nasr Isfahani, A., Fathi, S (2017), Generational differences in job engagement: a case study of Akhavan Sarraf, A.R., Abzari, M., Nasr Isfahani, A., Fathi, S (2017), Generational differences in job engagement: a case study of Akhavan Sarraf, A.R., Abzari, M., Nasr Isfahani, A., Fathi, S (2017), Generational differences in job engagement: a case study of
��
ISSN No. 0976 - 4208
Akhtar, A., Nawaz, M.K., Mahmood, Z., Shahid, M.S. (2016), Impact of high performance work practices on employees’ Akhtar, A., Nawaz, M.K., Mahmood, Z., Shahid, M.S. (2016), Impact of high performance work practices on employees’ Akhtar, A., Nawaz, M.K., Mahmood, Z., Shahid, M.S. (2016), Impact of high performance work practices on employees’ 2. Alan SM. Antecedents and consequences of employee engagement. Journal of Managerial Psychology. 2006; 21(7):600–19.Albdour, A.A., Altarawneh, I.I. (2014), Employee engagement and organizational commitment: Evidence from Jordan, Albdour, A.A., Altarawneh, I.I. (2014), Employee engagement and organizational commitment: Evidence from Jordan, Albdour, A.A., Altarawneh, I.I. (2014), Employee engagement and organizational commitment: Evidence from Jordan, 3. Albrecht Simon L, ManuelaA. The influence of empowering leadership, empowerment and engagement on affective commitment and turnover intentions in community health Alessandri, G., Consiglio, C., Luthans, F., Borgogni, L. (2018), Testing a dynamic model of the impact of psychological capital Alessandri, G., Consiglio, C., Luthans, F., Borgogni, L. (2018), Testing a dynamic model of the impact of psychological capital Alessandri, G., Consiglio, C., Luthans, F., Borgogni, L. (2018), Testing a dynamic model of the impact of psychological capital Alfes, K., Truss, C. (2013), The relationship between line manager behavior, perceived HRM practices, and individual Alfes, K., Truss, C. (2013), The relationship between line manager behavior, perceived HRM practices, and individual Alfes, K., Truss, C. (2013), The relationship between line manager behavior, perceived HRM practices, and individual Ali, M., Lodhi, S.A., Raza, B., Ali, W. (2018), Examining the impact of managerial coaching on employee job performance: Ali, M., Lodhi, S.A., Raza, B., Ali, W. (2018), Examining the impact of managerial coaching on employee job performance: Ali, M., Lodhi, S.A., Raza, B., Ali, W. (2018), Examining the impact of managerial coaching on employee job performance: an industrial organization in Iran, Industrial and Commercial Training, Vol. 49, No. 3, pp. 106–115.an industrial organization in Iran, Industrial and Commercial Training, Vol. 49, No. 3, pp. 106–115.an industrial organization in Iran, Industrial and Commercial Training, Vol. 49, No. 3,
�0
Osmania Journal of Management
pp. 106–115.4. AndrewaOlogbo C, SaudahSofanbP. Individual factors and work outcomes of employee engagement. Social and Behavioural Sciences. 2012; 40:498–508.Anitha, J. (2014), Determinants of employee engagement and their impact on employee performance, International Journal of Anitha, J. (2014), Determinants of employee engagement and their impact on employee performance, International Journal of Anitha, J. (2014), Determinants of employee engagement and their impact on employee performance, International Journal of Badal, S., Harter, J.K. (2014), Gender diversity, business-unit engagement, and performance, Journal of Leadership & Organi-Badal, S., Harter, J.K. (2014), Gender diversity, business-unit engagement, and performance, Journal of Leadership & Organi-Badal, S., Harter, J.K. (2014), Gender diversity, business-unit engagement, and performance, Journal of Leadership & Organi-Bailey, C., Madden, A., Alfes, K., Fletcher, L. (2017), The meaning, antecedents and outcomes of employee engagement: A Bailey, C., Madden, A., Alfes, K., Fletcher, L. (2017), The meaning, antecedents and outcomes of employee engagement: A Bailey, C., Madden, A., Alfes, K., Fletcher, L. (2017), The meaning, antecedents and outcomes of employee engagement: A Bakker, A.B., Bal, P.M. (2010), Weekly work engagement and performance: A study among starting teachers, Journal of Bakker, A.B., Bal, P.M. (2010), Weekly work engagement and performance: A study among starting teachers, Journal of Bakker, A.B., Bal, P.M. (2010), Weekly work engagement and performance: A study among starting teachers, Journal of 5. Bhatnagar J. Talent management strategy of employee engagement in Indian ITES employees: key to retention. Employee Relations.2007; 29(6):640–63.7. Chandani, Arti & Mehta, Mita & Mall, Akanksha & Khokhar, Vashwee. (2016). Employee Engagement: A Review Paper on Factors Affecting Employee Engagement. Indian Journal of Science and Technology. 9. 10.17485/ijst/2016/v9i15/92145.8. Consultin DTZ. Consulting and Research Employee engagement in the public sector. Scottish Executive Social Research.2007.9. Cristina WDEMZ, David PP. A perfect match: decoding employee engagement – part ii: engaging jobs and individuals. Industrial and Commercial Training. 2008; 40(4):206–10.10. Dale Carnegie & Associates What Drives Employee Engagement And Why It Matters. Dale Carnegie Training White Paper,2012.11. Derek AR, David WC. McKay Patrick F. Engaging the aging workforce: The
��
ISSN No. 0976 - 4208
relationship between perceived age similarity, satisfaction with co-workers, and employee engagement. Journal of Applied Psychology. 2007; 92(6):1542–56.12. Dow S, TomM, MarkR, Mel S. The Impact of reward programs on employee engagement. World at Work. 2010 Jun.13. Dr. PratimaSarangi, Dr. Bhagirathi Nayak (2016), Employee Engagement and Its Impact on Organizational Success – A Study in Manufacturing Company, India, IOSR Journal of Business and Management (IOSR-JBM) e-ISSN: 2278-487X, p-ISSN: 2319-7668. Volume 18, Issue 4 .Ver. I (Apr. 2016), PP 52-5714. Else B, Pascale M, BlancL, Wilmar SB. An online positive psychology interventions to promote positive emotions, self efficacy and engagement at work. Career Development International Conference on Technology and Business Management.2013 Mar. p. 18–20.International Journal of Business, Vol. 19, No. 2, pp. 192–212.International Journal of Business, Vol. 19, No. 2, pp. 192–212.International Journal of Business, Vol. 19, No. 2, pp. 192–212.International.2013; 18(2):173–95.15. Jessic X, Cooper TH. How can leaders achieve high employee engagement? Leadership and Organization Development Journal. 2011; 32(4):399–416.8. SumitJ. Analysis of factors affecting employee engagement and job satisfaction: a case of Indian IT Organization.Journal of Commerce Social Sciences, Vol. 12, No. 1, pp. 253–282.Journal of Commerce Social Sciences, Vol. 12, No. 1, pp. 253–282.Journal of Commerce Social Sciences, Vol. 12, No. 1, pp. 253–282.16. Jyotsna B. Managing capabilities for talent engagement and pipeline development. Industrial and Commercial Training. 2008; 40(1):19–28.17. Kenneth GW Jr, BobbyM. Enhancing performance through goal setting, engagement and optimism. Industrial Management and Data Systems. 2009; 109(7):943–56.Mediating role of work engagement, leader-member-exchange quality, job satisfaction, and turnover intentions, Pakistan Mediating role of work engagement, leader-member-exchange quality, job satisfaction, and turnover intentions, Pakistan Mediating role of work engagement, leader-member-exchange quality, job satisfaction, and turnover intentions, Pakistan 18. Mona MN. Investigating the high turnover of Saudi nationals versus non- nationals in Private sector com-panies using selected Antecedents and Consequences of employee engagement.International Journal of Business and Management. 2013; 8(18):41–52.19. Motyka, Blazej. (2018). Employee engagement and performance: a systematic
��
Osmania Journal of Management
literature review. International Journal of Management and Economics. 54. 227-244. 10.2478/ijme-2018-0018.narrative synthesis, International Journal of Management Reviews, Vol. 19, No. 1, pp. 31–53.narrative synthesis, International Journal of Management Reviews, Vol. 19, No. 1, pp. 31–53.narrative synthesis, International Journal of Management Reviews, Vol. 19, No. 1, pp. 31–53.20. Neeta B. To study the employee engagement practices and its effect on employee performance with special reference to ICICI and HDFC bank in Lucknow. International Journal of Scientifc and Engineering Research. 2011Aug; 2(8):291–7.Occupational & Organizational Psychology, Vol. 83, No. 1, pp. 189–206Occupational & Organizational Psychology, Vol. 83, No. 1, pp. 189–206Occupational & Organizational Psychology, Vol. 83, No. 1, pp. 189–206on work engagement and job performance, Career Development International, Vol. 23, No. 1, pp. 33–47.on work engagement and job performance, Career Development International, Vol. 23, No. 1, pp. 33–47.on work engagement and job performance, Career Development International, Vol. 23, No. 1, pp. 33–47.performance in Pakistan: Examining the mediating role of employee engagement, Pakistan Journal of Commerce Social performance in Pakistan: Examining the mediating role of employee engagement, Pakistan Journal of Commerce Social performance in Pakistan: Examining the mediating role of employee engagement, Pakistan Journal of Commerce Social performance: Examining the mediating role of engagement, Human Resource Management, Vol. 52, No. 6, pp. 839–859.performance: Examining the mediating role of engagement, Human Resource Management, Vol. 52, No. 6, pp. 839–859.performance: Examining the mediating role of engagement, Human Resource Management, Vol. 52, No. 6, pp. 839–859.Productivity & Performance Management, Vol. 63, No. 3, pp. 308–323.Productivity & Performance Management, Vol. 63, No. 3, pp. 308–323.Productivity & Performance Management, Vol. 63, No. 3, pp. 308–323.21. Purushothaman, S. and Kaviya, E., A Study on Employee Engagement in a IT Company (2020). Journal of Management (JOM), 7 (3), 2020, pp. 1–7; http://www.iaeme.com/JOM/issues.asp?JType=JOM&VType=7&IType=3, Available at SSRN: https://ssrn.com/abstract=373577122. Robert P,NiruK. Engagement and innovation: the Honda case. VINE: The Journal
��
ISSN No. 0976 - 4208
imPAct of QuAlity of WorK life on job sAtisfAction study on selected it comPAny
dr. d. vasanthi, Assistant Professor,IPE, Shameerpet, MM District.
AbstrActQuality of work life is a strategic tool being used by organizations in the present days to attract and retain human resources. Quality of work life policies are gaining importance as they are part of business strategies in influencing the employees to higher job satisfaction, improve performance, maintain work life balance, commitment to work/organization. The research sought to determine 1) Impact of select demographic variables (age, gender, marital status, education, designation, salary, experience) on Quality of work life, 2) Impact of select demographic variables (age, gender, marital status, education, designation, salary, experience) on Job satisfaction, 3) Major determinants of Quality of work life influencing Job satisfactions, 4) Association between the variables Quality of work life and Job satisfaction. The study is conducted on IT employees in the select IT service companies situated in Hyderabad city, Telangana state. A sample of 1056 is drawn by simple random sampling technique. The data is collected by administering as well-structured questionnaire, tested for reliability and validity. The study employed descriptive statistics and inferential statistics I.e ANOVA/t test, Correlation, Regression ANOVA/t test, Correlation, Regression using SPSS17.0 package. The result indicated that there is a signification association between the Quality of work life and job satisfaction. The result also indicated that there is a significant impact of the demographic variable experience of the employee on Quality of work life and Job satisfaction. The significant predictors of Job satisfaction are constitutionalism, social integration, Social Relevance and work life, Opportunity for development, opportunity for growth and security, Work and total life space, Experience in present company. The variables Adequate and fair compensation and Safety and healthy work condition were statistically significant but weak correlation with job satisfaction. The results implies that the IT employees are affected by their social needs and career development that are physiological and safety needs. The findings of the study provide insights for the managers, about the factors that contribute to quality of work life and job satisfaction of employees, to make effective decisions.Keywords: Quality of work life, Job satisfaction, IT services industry
��
Osmania Journal of Management
introductionHuman resources play a vital role in every organization. The manager interaction with the employees will affect their working behavior and attitudes. When the employees experience positive attitude towards the job due to their manager or organizational; they are more motivated to work efficiently. Cooperation of the employees improves the affectivity and high function of organizations. Thus, needs of the employees are given importance to improve their efficiency and effectiveness.
Quality of work life means employees satisfaction that is derived from fulfillment of their needs from sources, activities and results acquired from their working environment. Earlier in some articles, Quality of work life and job satisfaction are perceived as same concepts, but the psychologists and management knowledge experts believed that they are different concepts. The major difference is that job satisfaction is one of the results of the Quality of work life. Walton(1975) mentioned, regardless of position or status, every employees is affected by dissatisfaction with work life at one time or another. The monotony of job, boredom, frustration, conflict, anger and dissatisfaction of salary, superior-subordinate relations etc., cause employee dissatisfaction, thereby disenchant from their work life which will be costly to handle at both individual and organizational level. Thus, QWL stimulates the employee job satisfaction and is required for organizational and operational productivity improvement.
Job satisfaction for an employee means that the job meets his/her needs. Job satisfaction achieved when the needs and expectations are met. If there are unfulfilled needs, the result in negative effects on job satisfaction. Job satisfaction is employee perception about their duties and the organization. Job satisfaction compares between desired rewards and actual rewards, provides employee feedback about his/her work. Job satisfaction is an indicator of work behaviors of employee such as withdrawal behaviors like absenteeism, turnover and organizational citizenship. Life satisfaction is correlated with job satifaction; one of the research finding. Personality variables and deviant work behavior are moderately related to job satisfaction.
Various researchers studied that quality of work life has positive effects on job satisfaction.
The present study concentrates on IT services which are a part of IT industry, which have been developed from managing IT by providing cost arbitration to provide enterprise digital transformation in long run. According to NASSCOM, Indian IT services are expected to reach USD 80 billions in FY 2018. This is because IT services companies are upgrading from process and delivery strategy to transformational
��
ISSN No. 0976 - 4208
solution providers. The key strategies are leadership restructuring, technology usage, business differentiation, M&As and partnership platform based services. The present study is conducted in IT services because human resources from the backbone of IT industry.
Quality of Work life:The Quality of Work life (QWL) in an organization is defined as the degree to which the employees feel comfortable and enjoyable work life. It is the degree of favorable work situation which will exist within the organization. The employees experience about their work life I.e. the level of satisfaction, motivation, involvement, and commitment individuals experience is referred as QWL. It is the degree to which individuals are able to satisfy their important personal needs while employed by the firm. Quality of work life is multidimensional concept which deals with job involvement, job satisfaction, productivity, motivational, health and safety, job security, competence development and work life balance.
job satisfaction:Job satisfaction is the degree to which employees like their job. Some of them like job to the core and enjoy it whereas others hate to work and do so because they have to. Job satisfaction is defined by Locke as positive emotional state or pleasurable feel which resulting from the appraisal of employee job or job experiences. Employees perceive rewards form organization when their needs and wants are satisfied, which include compensation, promotion, recognition, development, and meaningful work, meet or exceed their expectation.
Def: Hoppock defined job satisfaction as any combination of psychological, physiological and environmental circumstances that cause a person truthfully to say I am satisfied with my job. According to their approach, although job satisfaction is under the infuluence of many external factors, it remains internal that has to do with the way how the employee feels.
information technologyIn the global scenario, India is elevated by the IT industry. This industry as a growth catalyst is significantly affecting the Indian economy. For achieving the powerful and resilient India, IT industry is playing a major role by contributing to the increased GDP, urban employment, improved exports etc. IT service providers make other sector efficient business processes. According to NASSCOM, Indian IT services sector has grown by 12- 14 percent in 2015-16 and will reach revenue $300 billion by 2020.
��
Osmania Journal of Management
Human resources are the backbone of the IT industry, as they play a vital role in the success of the IT industry. As a result, IT industry concentrates on its intellectual capital for enhancing its growth. By providing a satisfactory quality work life, they make employees committed and satisfied. The factors like job satisfaction, organizational commitment, job involvement and tenure of the employee are highly influenced by QWL on IT industry compared to other industry.
objectives of the study:
1. To study the perception of employees on the variables of QWL in selected IT companies.
2. To study the perception of employees on the variables of Job Satisfaction in selected IT companies.
3. To study the variables of Quality of Work life that influence Job satisfaction in selected IT companies.
4. To study the impact of QWL on Job Satisfaction in IT industry.
research methodology:The study intends to cover top five IT companies in Hyderabad region, which are in service industry. These IT companies are selected based on the NASSCOM survey. The companies have been randomly chosen based upon the population size which is approximately 5000 and above. The research will be basically descriptive in nature, employing survey method to get responses in a 5-point Likert attitude scale.
The information will be collected from five IT companies I.e. 3i Infotect Ltd, Cybage Software, Zensar Technology, Cyient , Persistent System.
Tools used in this study for collection of data were the well designed questionnaire developed by Richard E. Walton(1975) to measure the Quality of Work Life and job satisfaction .The questionnaire containes three sections, all using five-point Likert scale, to measure(a) Demographics, (b) Employee Perception on Quality of work life, and ( c) Employee perception on Job satisfaction. The population of this study was estimated to be 43,500 IT professionals with a sample size of 1054 calculated for this study. Internal consistency of the scales was tested using the Cronach’s alpha coefficient (Cronbach, 1951). The Cronbach’s alpha value for Quality of work life is 0.852 and Cronbach’s alphs value of Job satisfaction is 0.802.
A set of seven items on demographics was prepared to understand the employee profile. The demographic variables considered are Age, Gender, Marital Status,
��
ISSN No. 0976 - 4208
Qualification, Designation, Income and Work Experience of the IT professionals. Descriptive statistics help in better understanding of the demographic profile of the employees. The correlation between Quality of work life and job satisfaction is studied by Spearman’s correlation.
The significance between the dependent variable, I.e. job satisfaction and Quality of work life was determined by using Multiple Regression Analysis. The significance of demographics on job satisfaction and Quality of work Life is determined by an analyses of variance (ANOVA) method that examines significant mean differences among more than two groups, measured on a Nominal scale. Post-hoc analyses using Games-Howel tests were performed to know the differences between means of various groups. The research has a strong base from the literature that the employee perception of Quality of Work Life and demographic characteristics are antecedent of Job Satisfaction. The demographic variables have strong influence on job satisfaction, but impact is less compare to QWL variables, so demographics variables are considered as moderating variables. A well-structured, self-administered questionnaire was used to gather data from the IT employees.
hypotheses of the study:H01: There is no impact of demographic variables of Age, Gender, Marital Status, Education, Designation, Salary/Income and Experience on Quality of Work Life of the IT professionals.
Sub hypothesis H01a: There is no impact of demographic variable Age on Quality of Work life of the IT professionals.
The above hypothesis is tested for significance with the help of Descriptive Statistics Correlation, Test of homogeneity of variances, ANOVA, Regression model between the variables age and Quality of work life. The Age group 31-35 years is high, compared to others. Correlation coefficient(r=.182) there is a weak correlation. ANOVA result F(2,1053)=36.312 is significant, Regression Model R Square=.033 and Regression Equation QWL Score=89.495+(4.325)Age.
Hence the null Hypothesis is rejected and alternate hypothesis is accepted. Thus, there is weak relationship between Age and Quality of Work Life of IT professionals. Thus, Age (R square = 0.033) has less impact on Quality of work Life.
H01b: There is no impact of demographic variable Gender Quality of work life of the IT professionals.
��
Osmania Journal of Management
The above hypothesis is tested for significance with the help of Descriptive Statistics Correlation, Test of homogeneity of variances, T test, Regression, model between the variables gender and Quality of work life. QWL score of respondents is high for the male group than mean of respondents of female group. Correlation(r=.271) is weak negative correlation. T test t(1054)=9.144, p<0.05 is significant, Regression Model R Square =.074 and Regression Equation QWL Score =111.709+(-7.632) Gender.
Hence, the null Hypothesis is rejected and alternate hypothesis is accepted. Thus, there is weak relationship between Gender and Quality of work life of IT professionals. Thus, Gender (R Square=.074) has less impact on Quality of work life.
H01c: There is no impact of demographic variable marital status on Quality of work life of the IT professionals.
The above hypothesis is tested for significance with the help of Descriptive Statistics, Correlation, Test of homogeneity of variances, T test, Regression model between the variables marital status and Quality of work life. It is observed that QWL score of respondents is high for the single marital status group that the mean of respondents of married group. Correlation coefficient (r=-.076) show there is weak correlation. T-test results t(1054)=2.481,p<0.05 is significant, Regression Model R Square= .008 Regression Equation QWL Score=65.469+(1.475) Marital Status.
Hence, the hull Hypothesis is rejected and alternate hypothesis is accepted. There is impact of marital status on Quality work life of the IT professionals. Thus, there is weak relationship between marital status and Quality of work life of IT professionals. Thus, marital status (R Square=.008) has less impact on Quality of work life. QWL=65.469+(1.475) marital status.
H01d: There is no impact of demographic variable Qualification on Quality of work life of the IT professionals.
The above hypothesis is tested for significance with the help of Descriptive Statistics Correlation, Test of homogeneity of variances, t test, Regression model between the variables qualification and Quality of work life. It is observed from the result that QWL score of respondents is high for the post graduates group than the mean of respondents of under graduate group. Correlation coefficient (r=.043) show a weak correlation. T rest results t(1054)=1.383,p>0.05. Therefore, there is no enough evidence to reject the null hypothesis. Hence the Null Hypothesis is accepted. There is no impact of demographic variable Education Qualification on Quality work life of
��
ISSN No. 0976 - 4208
the IT professionals.
H01e: There is no impact of demographic variable Designation on Quality of work life of the IT professionals.
The above hypothesis is tested for significance with the help of Descriptive Statistics Correlation, Test of homogeneity of Variances, ANOVA, Regression model between the variable designation and Quality of work life. It is observed from the result that QWL score of respondents is high for the Team leaders and Project managers group that the mean of respondents Team members. Correlation coefficient(r=.084) show a weak correlation. F(2,1053)=18.174,p<0.05 is significant, Regression Model R Square=.007 and Regression Equation QWL score=97.751+(1.639) Designation.
Hence, the null Hypothesis is rejected and alternate hypothesis is accepted. Thus, there is weak relationship between designation and Quality of work life of IT professionals. Thus, Designation (R Square=.007) has less impact on Quality of work life.
H01f: There is no impact of demographic variable Salary on Quality of work life of the IT professionals.
The above hypothesis is tested for significance with the help of Descriptive Statistics, Correlation Test of homogeneity of variance, ANOVA/T test, Regression model between the variables salary and Quality of work life. It is observed from the result that the Age group 30-35 years is high compared to others. Correlation (r=.294) is weak correlation. ANOVA results F(4,1051)=208.170,p<0.05 is significant, Regression Model R Square=.086 and Regression Equation QWL Score =91.056+(2.722) Salary of the employee.
Hence, the null Hypothesis is rejected and alternate hypothesis is accepted. Thus, there is moderate relationship between Salary and Quality of work of IT professionals.Thus, Salary( R Square=.086) has less impact on Quality of work life.
H01g: There is no impact of demographic variable Experience on Quality of work life of the It professionals.
The above hypothesis is tested for significance with the help of Descriptive Statistics, Correlation, Test of homogeneity of variances, ANOVA, Regression model between the variables experience and Quality of work life it is observed from the results that QWL score of respondents is high for the more experienced (6-8 years) group
�0
Osmania Journal of Management
than the mean of respondents with less experience Correlation coefficient(r=.527) shows moderate correlation. ANOVA results F(2,1053)=202.674,p<0.05 is significant Regression Model R Square=.278 and Regression Equation QWL score=80.826+(12.652) Experience in current company.
Hence, the null Hypothesis is rejected and alternate hypothesis is accepted. Thus, Experience (R Square=.278) has significant impact on Quality of work life.
H02: There is no impact of demographic variables of Age, Gender, Marital Status, Designation, Education, Salary/Income and Experience and Experience on Job satisfaction of the IT professionals.
H02(a): There is no impact of demographic variable Age on job satisfaction of the IT professionals.
The above hypothesis is tested for significance with the help of Descriptive Statistics, Correlation, Test of homogeneity of variances, ANOVA, Regression model between the variables age and Job satisfaction. IT is observed from the results that Job satisfaction score of respondents is high for the 30-35 years age group than the mean of respondents with lesser age. Correlation coefficient(r=.211) is weak correlation ANOVA results F(2,1053)=69.257,p<0.05 is significant, Regression Model R Square=.045 and Regression Equation is Job satisfaction=59.749+(3.045) Age.
Hence, the null Hypothesis is rejected and alternate hypothesis is accepted. Thus, there is weak relationship between Age and Job Satisfaction of IT professionals. Thus, Age ( R Square=.045) has less impact on job satisfaction.
H02b: There is no impact of demographic variable Gender on job satisfaction of the IT professionals.
The above hypothesis is tested for significance with the help of Descriptive Statistics, Correlation, Test of homogeneity of variances, T test, Regression model between the variables gender and job satisfaction. It is observed from the results that Job satisfaction score of respondents is same for the male group and female group. Correlation(r=0.005) is weak negative correlation. T rest results, t(1054)=9.144, p>0.05, the level of significance. Therefore, there is no enough evidence to reject the null hypothesis and the null hypothesis is accepted. There is no impact of demographic variable Gender on Job satisfaction of the IT professionals.
H02c: There is no impact of demographic variable marital on Job satisfaction of the
��
ISSN No. 0976 - 4208
IT professionals.
The above hypothesis is tested for significance with the help of Descriptive Statistics, Correlation, Test of homogeneity of variances, T test, Regression model between the variables marital status and job satisfaction. It is observed from the results that Job satisfaction score of respondents is high in married group than the mean of respondents of Single group. Correlation coefficient(r=.087) is weak correlation. T test results t(1054) =-2.822,p<.05 is not significant. Hence the null Hypothesis is rejected. Thus, there is an impact of demographic variable marital status on Job satisfaction of the IT professionals.
H02d: There is no impact of demographic variable Qualification on Job satisfaction of the IT professionals.
The above hypothesis is tested for significance with the help of Descriptive Statistics, Correlation, Test of homogeneity of variances, T test, Regression model between the variables qualification and job satisfaction. It is observed from the results that Job satisfaction score of respondents is high for Post graduate group than the mean of respondents of Under graduate group. Correlation coefficient(r=.174) is weak correlation. T test results t(1054) =5.748,p<.05. Hence there is no enough evidence to reject the null Hypothesis is rejected. Thus, there is no impact of demographic variable Qualification on Job satisfaction of the IT professionals.
H02e: There is no impact of demographic variable Designation on Job satisfaction of the IT professionals.
The above hypothesis is tested for significance with the help of Descriptive Statistics, Correlation, Test of homogeneity of variances, ANOVA, Regression model between the variables designation and job satisfaction. It is observed from the results that Job satisfaction score of respondents is high for Team lead and Project managers group than the mean of respondents of team member group. Correlation coefficient(r=.287) is weak correlation. F(2,1053)=58.302,p<.05 is significant, Regression Model R Square=.082.Job satisfaction=61.158+(3.406) Designation. Hence, the null Hypothesis is rejected and alternative hypothesis is accepted. Thus, there is weak relationship between designation and Job satisfaction.Thus, there is no impact of demographic variable designation on Job satisfaction of the IT professionals.
H02e: There is no impact of demographic variable Salary on Job satisfaction of the IT professionals.
��
Osmania Journal of Management
The above hypothesis is tested for significance with the help of Descriptive Statistics, Correlation, Test of homogeneity of variances, ANOVA/t test, Regression model between the variables salary and job satisfaction. It is observed from the results that Job satisfaction score of respondents is high for salary group above 30000-45000 is high compare to others. Correlation coefficient(r=.186) is weak correlation. ANOVA results F(4,1051)=133.352,p<0.05 is significant, Regression Model R Square=.035.
Job satisfaction=64.018+(1.045) Salary. Hence, the null Hypothesis is rejected and alternative hypothesis is accepted. Thus, there is weak relationship between salary and Job satisfaction. Thus, there is no impact of demographic variable salary on Job satisfaction of the IT professionals.
H02f: There is no impact of demographic variable Experience on Job satisfaction of the IT professionals.
The above hypothesis is tested for significance with the help of Descriptive Statistics, Correlation, Test of homogeneity of variances, ANOVA, Regression model between the variables salary and job satisfaction. It is observed from the results that Job satisfaction score of respondents is high for (6-8 years) experience group than less experience group. Correlation coefficient(r=.489) is weak correlation. ANOVA results F(2,1053)=208.625,p<0.05 is significant, Regression Model R Square=.239.
Job satisfaction=56.509+(7.107) experience in current company. Hence, the null Hypothesis is rejected and alternative hypothesis is accepted. The Experience (R Square=.239) has significant impact on Quality of work life.
H03:There is no significant association between Quality of Work Life and Job satisfaction.
The above hypothesis is tested for significance with the help of Descriptive Statistics, Correlation, Test of homogeneity of variances, ANOVA, Regression model between the variables Quality of work life and job satisfaction. It is observed from the results that there is a positive correlation between Quality of work and Job satisfaction. Correlation coefficient(r=.886). The two tailed significance value is .000 suggest that the correlation is statistically significant. The Model R Square=.786, variable in Quality of work life explains about 78.6% of variation in job satisfaction score. ANOVA results F(1,1054)=3.836E3,p<0.05 is significant, Regression Equation is Job Satisfaction=13.665+(.536) QWL. Hence, the null Hypothesis is rejected and alternative hypothesis is accepted. Thus, there is impact of Quality of Work life on job satisfaction.
��
ISSN No. 0976 - 4208
company Profiles:3i Infotech Ltd: (established as ICICI Infotech Ltd) is an Indian IT company, based in India, founded in 1993. The current revenue is US$150 million and 4500+ employees as per annual report of 2017.
Cybage Software: is an information technology consulting company founded in 1995 in India with more than 5700+ employees as per annual report of 2016-17.
Zensar Technologies: is an information technology services and infrastructure services provider with headquarters in India. Zensar has operations and a customer base spanning across 29 global locations.The revenue of the company is US$440 million and 8300+ employees as per annual report of 2016-17.
Cyient (formerly Infotech Enterprises) is a global solutions provider focused on engineering, manufacturing, data analytics, and networks & operations. Infotech Enterprises Ltd. was established in 1991 in Hyderabad, India. The current revenue is US$550 million and 14,000+ employees as per annual report of 2017.
Persistent Systems is a technology services company which was incorporated on 16 May 1990 as Persistent Systems Private Limited. The current revenue is US$450 million and 9000+ employees as per annual report of 2018.
information technologyIn the global scenario, India is elevated by the IT industry. This industry as a growth catalyst is significantly affecting the Indian economy. For achieving the powerful and resilient India, IT industry is playing a major role by contributing to the increased GDP, urban employment, improved exports etc. IT service providers make other sector efficient business processes. According to NASSCOM, Indian IT services sector has grown by 12- 14 percent in 2015-16 and will reach revenue $300 billion by 2020.
Human resources are the backbone of the IT industry, as they play a vital role in the success of the IT industry. As a result, IT industry concentrates on its intellectual capital for enhancing its growth. By providing a satisfactory quality work life, they make employees committed and satisfied. The factors like job satisfaction, organizational commitment, job involvement and tenure of the employee are highly influenced by QWL on IT industry compared to other industry.
conclusionHuman resources are the major backbone of the It industry as they play a vital
��
Osmania Journal of Management
role in the success of the IT industry. So, IT industry concentrates on its intellectual capital for enhancing its growth. By providing a satisfactory Quality work life they make employees committed and satisfied. It is found that the QWL in IT industry influences Job satisfaction, job involvement, Organizational commitment, Tenure to greater extent compared to other industry.
In the present study the perception of employees on the variables of Quality work life and job Satisfaction, Job involvement, Organizational commitment, Tenure to greater extent compared to other industry.
In the present study the perception of employees on the variables of Quality of work life and job satisfaction in select IT companies is analyzed and found that major impacting demographic variable is experience. The variables of Quality Work life that influences the job satisfaction in selected companies are opportunity for Growth and security (.493), Work and total life space (.557), Opportunity for development (.620), Social integration (.737), Constitutionalism (.742), Social relevance and work life (.717). the variation in above variables explains about 85.1% of variation in job satisfaction score (R Square=.851). The variation in Quality of work life impacts about 78.6% of variation in job satisfaction score (R Square=0.786). Therefore, it is concluded that quality of work life is the antecedents of the job satisfaction.
��
ISSN No. 0976 - 4208
“An evAluAtive study of millenniAl’s digitAl investment in digitAl gold (Post-PAndemic) in indiA”
s. P. neehalika bavya, Assistant Professor,Department of Management,St. Mary’s Centenary Degree College, St. Francis Street, Secundrabad.
AbstrActIndia has one of the largest millennial populations in the world, making up around 34% of the total population and accounting for a major part of the workforce. Due to increased utilization of technology and recent changes in the business markets has led investors to look up to new investment trends such as “Digital Gold Investments”. Millennials are early adopters of evolving technologies as they’re the first generation to be known as digital natives. They tend to use technology, being an integral part of almost everything they do such as shopping, communicating, listening to music, and investments too in recent times by using many personal finance and investment apps are available in the market today has attracted towards digital investments.
Digital gold facilitates the investor an opportunity of owning physical gold along with the benefits of new-age technology that avoids the inconvenience of inspecting physical gold for purity. The technology makes investment in gold digitally accessible and convenient to suit the preference of holding an asset digitally over physically is a smart decision. This study has been made to explore the trends in “Gold Investments in India on Digital Platform” its scope in today’s business markets, applications, effects on investors, and opportunities offered in the present and its evolution in future periods
Keywords: Gold Investments, digital gold, millennials, digital investments, new-age technology, digital natives, gold digitally accessible
introductionIn today’s world Gold is no longer used as an ornament but is used as an investment. Gold has acquired a store of value for over 3000 years, much longer than any currency anywhere around the globe. In India, Gold is believed to be God’s owned Money and is offered to holy temples on account of every auspicious occasion, which
��
Osmania Journal of Management
made India be the largest importer of Gold in the world today. Historically the most popular ways of investing in gold are by purchasing or investing in physical gold which can be bought in the forms such as Jeweller, Gold coins, and Bullion, we also have Sovereign Gold Bonds, Gold Mutual Funds, and Gold ETFs.
Traveling along with the new changes in technology and adapting them has led to a new form of investment in gold i.e Digital Gold. This form of gold investment on e-commerce platforms has possessed immense attention in the midst of the global pandemic, where Indians have found a new way to invest in the yellow metal using Digital Gold.
Digital gold is an investment alternative available to investors upon physical gold. It is the most convenient and cost-effective way to accumulate yellow metal for those who prefer to invest in the physical form of gold. The most astonishing reason behind digital gold gaining investors’ attention is that it enables investors to buy, sell and acquire pure gold in any proportions at anytime and anywhere. The other striking reason is the minimum monetary investment required for digital gold investment is Re. 1, therefore, anyone can own a certain quantity of the precious metal.
Due to the convenience provided to the buyer and accelerated investment in gold across the globe during the pandemic, digital gold is rapidly gaining ground amongst the investor community in India. In our country, the option of investing in digital gold is being offered in collaboration with Augmont, MMTC-PAMP. Augmont Gold Ltd. has witnessed its businesses increase by 40-50% during the lockdown period this record serves as a result of the people’s hesitation to visit jewellery stores and gold dealers where they are able to procure gold online easily have been a perfect solution to many investors.
objectives of the study:
1. To study the millennial’s digital investment priority towards digital gold.
2. To understand the awareness of digital gold investments among millennial investors
3. To comprehend the impact of COVID19 pandemic on digital investments.
An overview on “digital gold”“digital gold” has become so popular:Every gram purchased by an investor would be equal to real 24K physical gold, which is easily sold back online at a market-linked gold price. The investor need not worry about the concerns of re-sale sale value and storage cost.
��
ISSN No. 0976 - 4208
It is a super accessible way to invest in digital gold depending on the platform an investor chooses and also can get his gold delivered in the form of coins, bars, or jewelry at doorstep when investor desire to convert his digital gold into physical gold. Hence, ensuring purity, storage, security, and the flexibility to purchase gold with little money, which makes it a very attractive mode of purchasing gold in India.
investor’s convenienceOn the other hand, can be bought online and is stored in insured vaults by the seller on behalf of the customers easily. It results to overcome all the issues of physical gold purchases such as identifying legitimacy and purity, problems of safekeeping and storage. And the last point is all you require for investment in this digital gold is Internet/mobile banking at anytime and anywhere.
hassle-free experience for millennials Millennials are used to digital-first and easy approach due to their regular use of apps and online platforms as they tend to avoid the time-consuming ways of face-to-face interactions and chooses the efficient ways of digital technology like the availability of digital gold at their convenience.
Digital gold provides the investor an advantage of owning physical gold with the benefits of new-age technology which eliminates the hassles of inspecting physical gold for purity and then figuring out a secure storage option. The only most trusted fintech platforms offering digital gold guarantees the purity of the gold purchased and store it into secure vaults along with providing full insurance for the customer. Hene, this eventually attracted the young investors towards this trending yellow metal investment virtually.
convenient investment:During the uncertainty caused by the COVID-19 pandemic, gold became a more attractive investment option, thanks to its stability and resilience, irrespective of the state of the exchange, especially as millennials were found more curious about investing within the alpha-beta brass over ever before during these recent times. The platforms providing digital gold acquires a whip hand over traditional suppliers as they reduced the barrier of entry by making fractional quantities of gold available to buy digitally. This observed demand from millennials who had never invested in gold before as digital gold makes gold easily accessible as investors not should save a payment amount to shop for gold. This works well with the millennials who are newly earning and need to be able to both invest their money for future returns and save a bit for private expenses.
��
Osmania Journal of Management
invest when the worth is right:The older generations are often inclined to shop for physical gold on auspicious dates like on Akshaya Tritiya or Dhanteras. But whereas, millennials are more sensitive to the costs of gold and would favor to shop for it when the costs decline. Such unconstrained investments is possible only with digital gold, the rationale is that an investor is feasible to form a sale at the precise right moment and might also purchase the maximum amount or as little as they need to. enterprises offering digital gold investment:Digital gold online Investment will be easily made on Finserv Markets, in India like Augmont Enterprises Private Limited, state-owned Metals, and Minerals Trading Corporation of India (MMTC), Produits Artistiques Métaux Précieux, Switzerland (PAMP), and Digital Gold India Pvt. Issuing digital gold investments.
Working Principle of digital gold:Digital gold investment is possible from any of the e-wallet platforms like Google Pay, Paytm, and PhonePe and also through HDFC securities, Bajajfinserv, and Motilal Oswal. of these e-wallet websites and corporations provide a platform for the trading companies like MMTC-PAMP, SafeGold, and Augmont. Therefore, the above-mentioned e-wallet apps and websites play the role of intermediary between the trading platforms and investors. As investor purchases gold on these platforms, the trading company places a similar amount of physical gold on the investor’s name in his vault. Hence all investors are expected to only invest in gold on these platforms, and therefore the rest is taken care of by the trading companies.
drivers resulting in digital gold investment:a.No worries about hefty making charges anymore:Whenever we buy physical gold within the style of jewelry, making charges are bared but whereas Digital gold solves this problem by avoiding making charges to the worth of gold.
b. Paying Just for Gold:When purchasing gold jewelry, we pay not just for gold alone except for amalgamated precious metals or stones too. Whereas, after you purchase digital gold, then it means you’re investing in 24Kgold.
c. Gold enchased at any-time and anywhere:It is easier to sell the quantity of gold instantly online than compared to physical gold. After selling a specific quantity of gold, the equivalent amounts are transferred to the investor’s registered checking account within some hours.
��
ISSN No. 0976 - 4208
d. No expensive bank vaults:If you invest in digital gold, don’t worry about storing them in bank vaults, as instead, it’ll be stored as a secure vault without investors spending anything for the service unlike just in case storing physical gold in bank vaults would charge a fee for the service.
e. Hassle-free Gold TradingTrading of physical gold is time-consuming and arduous, especially when buying gold jewelry as we are often spoilt for choices. However, digital gold offers you the chance to freely trade terms of your purchased digital gold anytime, anywhere.
role of taxes on digital gold:Investment in digital gold is treated similarly to physical ownership of such assets, then the number of tax prone to be paid depends on the holding period of the asset. joined owns digital gold (or the holding period) for 36 months or less, then returns from it is considered as short-term financial gain or STCG and therefore the returns are added to the yearly taxable income of the holder. Whereas returns from such investments are considered as long-term capital gains or LTCG if it’s sold after 36 months of ownership (or after 36 months holding period).In these above-mentioned instances, the digital gold holder is required to pay a tax of 20% on gains, together with an extra cess of 4%. At last, the tax on LTCG is calculated with the advantageof indexation.
conclusionToday’s millennial generation is interested in a hassle-free life as they’re searching for convenience and a seamless user experience. Gold investments tools like jewelry, bars, and coins possess requirements like as storage, safety, and maintenance that require to be satisfied. As technology evolves, so will people’s preference of investment tools to adjust to the new changes. Millennials who tend to earn newly are turning to take a position in digital alternatives. Millennials began to grasp gold as a profitable instrument that is saving and also fetches long-term gains. With these prerequisites and India’s affinity for gold, investment in digital gold has become the right option for digitally-savvy millennials, who are searching for easy-to-understand, accessible, and profitable investment
references :
1.) Arulmurugan, D. K. (February 2013). A Study on Investment Behavior of ProfessorsTowards Gold with Special Reference to Tamilnadu State.International Journal of Scientific Research, 233-237
�0
Osmania Journal of Management
2) Ahmed, A. R. (2011). Passion for Ornamental Gold jewellery in India, International Journal of Enterprise Innovation Management Studies(IJEIMS), 125-135.
3) Bakhshi, R. C. (2016). The Critical Review of Gold Monetisation Scheme and Sovereign Gold Bond Scheme, Journal of Applied Management, JIDNYASA, 18-27.
4) Dr. Nishad Nawan and Sudindra V R (2013). A study on various forms of gold investment, Asia Pacific Journal of Research, 1-16.
5) Dr.P.Menakadevi (2021),An Awareness of Multifaceted Investment behaviour in Different Gold Instrument - as Paper, Physical and Digital GoldAnnals of R.S.C.B., ISSN:1583-6258, Vol. 25, Issue 4, 2021, Pages.14939-14951
6) Huynh, T.L.D., Ahmed, R., Nasir, M.A. et al. The nexus between black and digital gold: evidence from US markets. Ann Oper Res (2021)
7) Soniya Garg, (2021). A Study of factors influencing investor behaviour towards gold as an investment avenue with factor analysis. Materials today: Proceedings, 37(2), 2587- 2590
8) Suresh, A. (2021). Contrarian Investment on Paper Gold in Digital Economy Platform - A Behavioral Study on Indian Market amidst COVID-19 Pandemic. Journal of Finance and Accounting,12,1-12.
9) Jalpa Thakkar,“An empirical study on gold investment rage among the professionals”- a comparative analysis of gold, etf, egold and gold fund, ASM’s international e journal, 2013.
10) Mr. P. Arulmurugan, Dr. K.Balanagaguruthan, “A Study on Investment Behavior of Professors Towards Gold with Special Reference to Tamilnadu State”,Vol 2, Issue 2,Feb 2013.
11) Luther, William J., Digital Gold: The Case for Cryptocurrencies (August 15, 2021). AIER Sound Money Project Working Paper No. 2021-13.
��
ISSN No. 0976 - 4208
subscriPtion informAtion
1. Subscription Rate:
OJM-DBM Journal of Management is published quarterly in a year in English. Subscription rate is Rs. 1200/- per annum (Including postage and handling charges).
2. Subscription order should be addressed to
Dr Y.JahangirExecutive Editor-OJMSr. Assistant Professor
Department of Business ManagementOsmania University, Hyderabad. 500007.
3. Subscription order and Payment
Subscription order should be accompanied by Account payee bankers cheque/Demand Draft in favor of “Head, Department of Business Management, Osmania University” payable at Hyderabad.
SUBSCRIPTION ORDER FORM:
Subscriber Name / Insttute:…………….................………………………………….......
Desination ....................……………………………...................…………………………
Organization Name:..……………………………………………...................……………
Mailing Address …………..................…………..............…………………………......
………………………………………………………………………………..…...........……
…………...……………………………………………………………………………………
Phone (landline with STD) …………………………… Mobile ………………………...
Subscriber signature with seal.
��
Osmania Journal of Management
Author guidelines
1) Manuscript neatly typed in Times New Roman alone must be sent.2) The Article must necessarily have following contents, Title, Author, His/ Her
affiliation, Abstract, Key Words, Introduction, Main Message, Tables, Findings, Conclusion and References.
3) Font size of Title should be 14, Sub Headings 13, Text 12 of Times New Roman, with 1.5 space.
4) Number of References shall not exceed 15 and they are to be arranged in an Alphabetical order.
5) This is a peer reviewed quarterly Journal published in four issues in a year.6) The Article should send between 1st and 15th of January, 1st and 15th of April,
1st and 15th of July, 1st and 15th of October. Of that particular respective issues.
7) The content used in the text as well as the figure and facts cited by the author have to be thoroughly checked to avoid plagiarism. The author/s is/are held totally responsible for any legal consequences that may arise in future after the publication of the said article in OJM.
8) The followings thrust areas are given preference for publication. • General management• Human resource management• Financial management• Marketing management• Commerce & Trade• E-commerce/ Online Marketing• Supply chain Management• Business Process Reengineering• Entrepreneurship• Investment Trends/ FDI’s• Total Quality Management
9) The declaration should be sent in hard copy to the editor, after acceptance for publication, duly signed by author (s).
10) All the manuscript are sent to [email protected].
For Further CommunicationDr Y.Jahangir
Executive Editor-OJMSr. Assistant Professor
Department of Business ManagementOsmania University, Hyderabad. 500007.
Related Documents