CENSUS OF INDIA 1991 DISTRICT CENSUS HANDBOOK OSMANABAD Compiled by THE MAHARASHTRA CENSUS DIRECTORATE PRINTED IN INDIA BY THE MANAGER, GOVERNMENT CENTRAL PRESS, MUMBAI-400 004 AND PUBLISHED BY THE DIRECTOR, GOVERNMENT PRINTING AND STATIONERY, MAHARASHTRA STATE, MUMBAI-400 004. 1995 Price Rs. 100

Welcome message from author
This document is posted to help you gain knowledge. Please leave a comment to let me know what you think about it! Share it to your friends and learn new things together.
Transcript
CENSUS OF INDIA 1991
DISTRICT CENSUS HANDBOOK
OSMANABAD
Compiled by
THE MAHARASHTRA CENSUS DIRECTORATE
PRINTED IN INDIA BY THE MANAGER, GOVERNMENT CENTRAL PRESS, MUMBAI-400 004 AND
PUBLISHED BY THE DIRECTOR, GOVERNMENT
PRINTING AND STATIONERY, MAHARASHTRA STATE,
MUMBAI-400 004.
1995
Price Rs. 100
,_
Q
= c. z c a .. o ... u -~ :--Q
,_
h
c
MOTIF
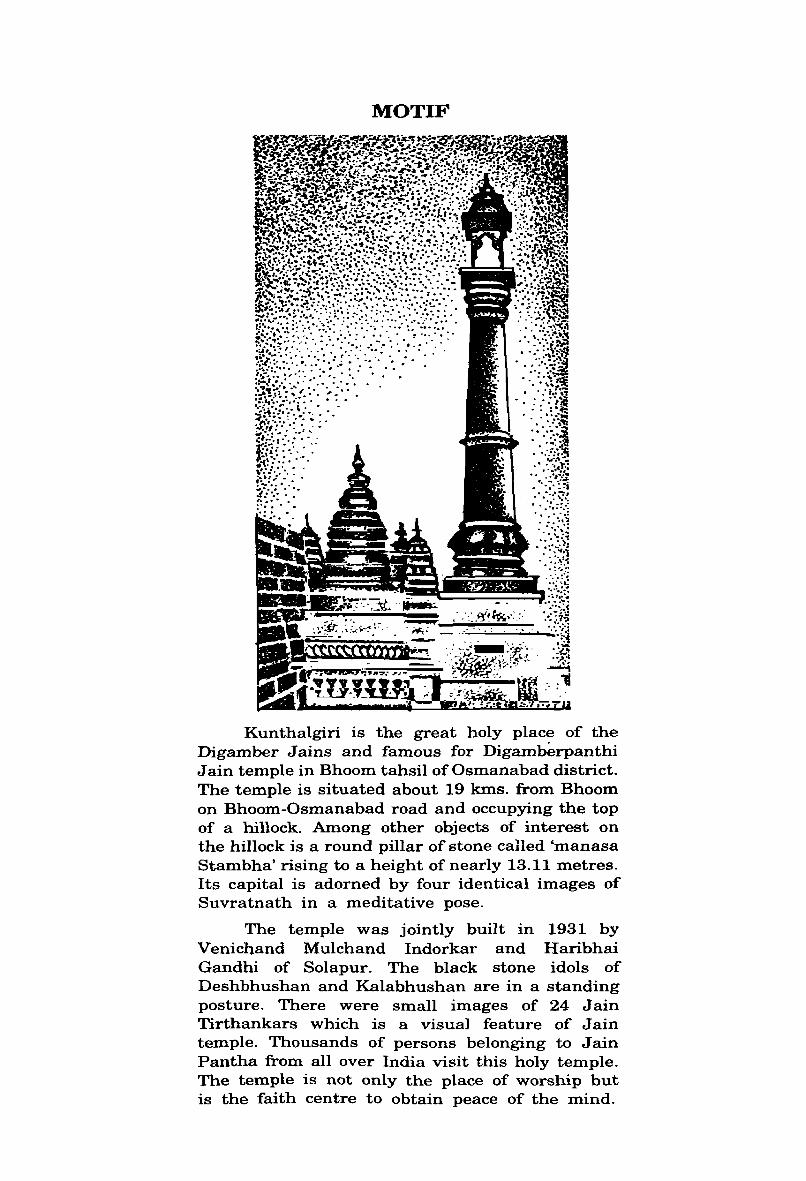
Kunthalgiri is the great holy place of the Digamber J ains and famous for Digamberpanthi Jain temple in Bhoom tahsil of Os mana bad district. The temple is situated about 19 kms. from Bhoom on Bhoom-Osmanabad road and occupying the top of a hillock. Among other objects of interest on the hillock is a round pillar of stone called 'manasa Stambha' rising to a height of nearly 13.11 metres. Its capital is adorned by four identical images of Suvratnath in a meditative pose.
The temple was jointly built in 1931 by Venichand Mulchand Indorkar and Haribhai Gandhi of Solapur. The black stone idols of Deshbhushan and Kalabhushan are in a standing posture. There were small images of 24 Jain Tirthankars which is a visual feature of Jain temple. Thousands of persons belonging to Jain Pantha from all over India visit this holy temple. The temple is not only the place of worship but is the faith centre to obtain peace of the mind.
Foreword
Preface
Acknowledgement
District Highlights - 1991 Census
CONTENTS
N arne of the headquarters of Districvrahsil,
PAGE
v
ix
xi
xiii
their rural/urban status and distance from district headquarters xiv
Important Statistics - I (a) 1
Important Statistics - I (b) 4
Ranking of tahsils in the district - II 6
Summflry Table 1 - Population of the District at the Censuses from 1901 to 1991 7
Summary Table 2 - Number of inhabited villages and related population in 8 specified population size ranges.
Appendix 1 to Summary Table 2 .;_ Area, Number of villages/towns and population 9
Appendix 2 to Summary table 2 - Towns with Population under 5,000. 10
Appendix 3 to Summary table 2 - Houseless and Institutional PopUlation. 10
Analytical Note
I. HISTORY AND SCOPE OF DISTRICT CENSUS HANDBOOK 11 Brief History of the district (11)
2. ADMINISTRATIVE SET-UP 12 Zilla Parishad and Panchayat Samitis (13), Urban Local Bodies (14)
3. LOCATION, SIZE, RELIEF, DRAINAGE AND CROPPING PATTERN 14 Climate (14), Soil and Cropping Pattern (15)
4. NATURAL WEALTH 15 Minerals (15), Fisheries (15)
5. BRIEF NOTE ON CENSUS 15 Census Concepts - Building (16), Census Houses and Households (16), Housing data (16), Electricity and Toilet facilities (16), Rural & Urban Area (17), Urban Agglomeration (17), Standard Urban Area (17).
6. 1991 CENSUS FINDINGS - POPULATION, ITS DISTRmUTION 17 Distribution of population in rural and urban area (17), Size, Class and status of town (18), Villages by population size (19).
7. POPULATION GROWTH, DENSITY AND SEX RATIO 20
Population growth (20), Density (21), Sex Ratio (21)
8. SCHEDULED CASTES AND SCHEDULED TRIBES 23 Scheduled Castes and Scheduled T~ibes in Mah'arashtra State (23), Scheduled Castes and Scheduled Tribes in 1981 (25), SC/ST population, decadal variation and sex ratio (26).
9. LITERACY 29 Definition of a literate (29), Rural and Urban literacy (29), Male-Female share in total literates (30), Literacy among SC and ST (31).
10. ECONOMIC ACTIVITY.
Definition of work and classification of workers (31), Types of workers (32), Workers by Industrial categories (34), Non-workers (36)
31
ii
CONTENTS - contd.
11. AMENITIES IN VILLAGES AND TOWNS Educational facilities (36), Medical (39), Drinking Water (40), Postal (40), Weekly market (40), Communication (40), Approach road (41), Power supply (42).
12. LAND UTILISATION - LAND USE PATTERN Forest (43), Irrigated and Unirrigated land (43)
n BRIEF NOTE ON TOWN DIRECTORY
14. INDUSTRIES
15. TRADE AND COMMERCE Workers in trade and commerce (47).
16. MUNICIPAL FINANCE
17. FAIRS AND PLACES OF TOURIST IMPORTANCE Fairs (48), Places of historical and tourist importance (48)
18 .. MAJOR CHARACTERISTICS OF THE DISTRICT Contribution of the district (49).
PAGE
36
43
44 45 46
47 48
49
·PART A - VILLAGE AND TOWN DIRECTORY (SECTIONS I AND II)
SECTION I - VILLAGE DIRECTORY
Note explaining the abbreviations used in the Village Directory.
Statement - List of villages fully merged in towns and outgrowths at
Map - TAHSIL OSMANABAD ........... . Alphabetical list of Villages-Osmanabad C.D. Block Village Directory-Osmanabad C.D. Block
.(Facing Page)
Map - TAHSIL KALAMB ......... . . . . .(Facing Page) Alphabetical list of villages-Kalamb C.D. block Village Directory-Kalamb C.D. Block
Map - TAHSIL UMARGA '.' . . . . . . . . . . . . . . . .(Facing Page) Alphabetical list of villages-Umarga C.D. Block Village Directory-Umarga C.D. Block
Map - TAHSIL TULJAPUR . . . . . . . . . . . . . . . . .(Facing Page) Alphabetical list of villages-Tuljapur C.D. Block Village Directory-Tuljapur C.D. Block
Map - TAHSIL PARANDA ................. (Facing Page) Alphabetical list of villages-Paranda C.D. Block Village Directory-Paranda C.D. Block
Map - TAHSIL BHUM ................... (Facing Page) Alphabetical list of villages-Bhum C.D. Block Village Directory-Bhum C.D. Block
53
1991 Census. 57
58 59 62
76 77 80
94 95 98
114 115 118
132 133 136
150 151 152
1JI
CONTENTS - contd.
Appendix I
C.D. Blockwise (Rural) Abstract of educational, medical arid other amenities
Appendix II
Land Utilisation data in respect of non-municipal towns (Census Towns)
Appendix III
C.D. Blockwise list of villages where no amenity other than drinking water facility is available
Appendix IV
PAGE
168
170
170
Summary showing number of villages having or not having SC/ST population. 170 C.D. Blockwise list of villages according to the proportion of Scheduled Caste and 171 Scheduled Tribe population to the total population by ranges.
Appendix V
Alphabetical list of villages alongwith manual as well as computerised codes, 1991 and 1981.
Appendix VI
Statement showing Social Forest Area in the villages.
Appendix VII
Statement showing number of Girls Schools in the villages
SECTION II - TOWN DIRECTORY
Note explaining the abbreviations used in the Town Directory.
Town Directory Statements (1 to VI and N-A)
STATEMENT I - Status and Growth History
STATEMENT II - Physical aspects and location of towns, 1989
STATEMENT III - Municipal Finance, 1988-1989
STATEMENT IV - Civic and other amenities, 1989
STATEMENT IV-A - Civic and other amenities in notified slums, 1989
STATEMENT V - Medical, Educational, Recreational and Cultural Facilities,
STATEMENT VI - Trade, Commerce. Industry and Banking, 1989.
Appendix to Town Directory
1989
183
195
196
199
202
203
204
205
206
207
209
210
IV
CONTENTS - contd.
PART B - PRIMARY CENSUS ABSTRACT.
District Primary Census Abstract (General)
Appendix to District Urban Primary Census Abstract
District Primary Census Abstract for Scheduled Castes
District Primary Census Abstract for Scheduled Tribes
C.D.Blockwise Village Primary Census Abstract
Primary Census Abstract: Osmanabad C.O. Block
Primary Census Abstract - Kalamb C.O. Block
Primary Census Abstract - Umarga C.O. Block
Primary Census Abstract r Tuljapur C.D. Block
Primary Census Abstract - Pararida C.O. Block
Primary Census Abstract - Bhum C.D. Block
Town Primary Census Abstract (1 to 8)
Annexure I - Note on Fertility-Mortality and Migration
Annexure II - Various measures of fertility and mean age at marriage, 1981
Annexure III - Percentage Distribution of Migrants by place of birth, 1981 Census.
214
220
226
232
238
250
262
274
286
298
310
\ ... 334
339
340
FOREWORD
Publication of the District Census Handbooks (DCHs) was initiated after
the 1951 Census and is continuing since then with some innovations/modifications
after each decennial Census. This is the most valuable district level publication
brought out by the Census Organisation on behalf of each State Govt.lUnion
Territory administration. It inter-alia provides data/information on some of the
basic demographic and socio-economic characteristics and on the availability of
certain important civic amenities/facilities in each village and town of the
respective districts. This publication has thus proved to be of immense utility
to the planners, administrators, academicians and researchers.
The scope of the DCH was initially confined to certain important census
tables on population, economic and socio-cultural aspects as also the Primary
Census Abstract (PCA) of each village and town (ward-wise) of the distriot.
The DCHs published after the 1961 Census contained a descriptive account of' •
the district, administrative statistics, census tables and Village and Town
Directories including PCA. After the 1971 Census, two parts of the District
Census Handbooks (Part-A comprising Village and Town Directories and Part-B
comprising Village and Town PCA) were released in all the States and Union
Territories. The third Part (C) of the District Census Handbooks comprising
administrative statistics and district census tables, which was also to be brought
out could not be published in many State slUTs due to considerable delay in
compilation of relevant material. In 1981 some new features alongwith the
restructuring of the formats of Village and Town Directory were introduced in
the DCHs. These were published in two parts for each district after the 1981
Census. While Part-A comprised Village and Town Directories, the PCA of
villages and towns (ward-wise) including Scheduled Caste and Scheduled Tribe
PCA upto tahsil/town level were provided in Part-B. To illustrate, all the
amenities except electricity, were brought together in the Village Directory and
vi
if an amenity was not available in the referrent village, the distance in broad
ranges from the nearest place having such amenity was given. Information on
some new items such as adult literacy centres, primary health sub-centres and
community health workers in the villages were provided so as to meet some
of the requirements of the Revised Minimum Needs Programme. Similarly,
information on approach to the village was also provided for the first time in
the Village Directory so as to give an idea about the number of inaccessible
villages in each district. In case of Town Directories also, keeping in view the
requirements of the Minimum Needs Programme, a Statement IV-A on slums
was provided so as to enable the planners to chalk out the ptogrammes for
providing better civic and other amenities in the slums. In this statement "
details on civic and other amenities were reported for the slums of class I and
Class II towns. Apart from this, one column ()n the Scheduled Castes and
SchedulEXl Tribes population and another on adult literacy classes/centres were
added in Statements IV and V respectively.
The manner of presentation of the DCHs for the 1991 Census is by and
large the same as followed in 1981. However, the format of PCA has been
rest~~ttu'ed slightly in the 1991 Census for the benefit of data users. Nine-fold
industrial classification of main workers has been given as against four-fold
industrial classification presented in the 1981 Census. In addition to this, the
sex-wise population in the 0-6 age-group has also been included in PCA for
the first time with a view to enabling data users to compute more realistic
literacy rate as all children below 7 years of age have been treated as illiterate
at the time of the 1991 Census. It is expected that the above mentioned
modifications will help the planner in chalking out more effective development
programmes.
One of the most important innovations in the 1991 Census is the Community
Development Block-level presentation of data in the Village Directory and PCA
instead of the traditional TahsilfralukalPS level presentation. It is expected
vii
that the presentation of Village Directory and PCA data at C.D. Block level
will help the planners in formulation of micro-level developmental plans, as
the C.D. Block is the lowest administrative unit for development planning.
In order to facilitate the task of administrators, planners and researchers
intending to use Village DirectorylPCA data, either from the magnetic
tapes/floppies or from the published records, both the computer ann lllamlal
codes for each village have been provided for the 1991 Census alongwith the
corresponding codes of 1981.
This publication is a joint venture of the State Govt./UT administration
and the Census Organisation. The data have been collected and compiled under
the direction of Shri J.K. Banthia Director of Census Operations, Maharashtra
on behalf of the State Govt./UT administration which has borne the cost of
printing. The task of planning, designing and coordination of the publication
was initiated by Dr. K.P. Ittaman, former Deputy Registrar General (Social
Studies) and Shri M.M.Dua, Joint Director. For the sake of uniformity in '.
presentation of information/data and for preparation of analytical note depicting
the salient features emerging from a micro-level analysis of Census/non-Census
data, a model District Census Handbook from each State and Union Territory
was thoroughly scrutinised in the Social Studies Division under the guidance
of Shir M.K. Jain, the present Deputy Registrar General (S.S.). This task was
carried out by Shri A.K. Singh, Deputy Director who was assisted by Shri
N.S. Soam, Assistant Director and his staff. Technical guidance in the preparation
of the maps was inti ally provided by Dr. B.K. Roy, former Deputy Registrar
General (Map) and later by Mrs. Minati Ghosh, the present Dep~ty Registrar
General (Map)
I am thankful to all those who have contributed to this project.
New Delhi
June 11, 1992
A. R. NANDA
Registrar General, India

PREFACE
The Registrar General and Census Commissioner of India has in his
foreword to this series of publications, not only provided the reader with the
historical background of the District Census Handbooks but has also explained
at some length the scope and coverage envisaged for this country-wide project.
This volume contains the salient results based on the data gathered at the
actual head-count and in addition contain a wealth of other non-census
information in repect of Villages and Towns of the District. It is hoped that
this volume would go a long way to meet the ever increasing demand for the
micro-level data in this era of planned development.
District Census Handbook of Maharashtra is a joint venture of the
Government of Maharashtra and the Census Organisation of the Government
of India. The design for the 1991 District Census Handbook was evolved
Centrally by the Census Commissioner, India. In the preparation of the District
Census Handbook, the role played by the Census Organisation is that of qata
gatherer and the cost of publication is borne by the State Government. Ih
accomplishing this task we have had the ready and wholehearted Co-operation
of the staff at various levels of different departments of the State Government.
Much of the data so supplied by these field-level officers have been cross-checked
with the data obtained from various departments and an attempt has been
made to reconcile the discrepancies as well.
I am deeply grateful to Shri A.R.Nanda, tA.S. the Registrar General, India
for the benefit I have derived by way of guidance and advice. I also express
my thanks to Shri M.K.Jain, Deputy Registrar General (Social Studies), Dr.
B.K.Roy former Deputy Registrar General (Map) and Mrs. Minati Ghosh, the
present Deputy Registrar General (Map).
Shri J.K. Banthia, I.A.S. held the Office of Director 9f Census Operations,
Maharashtra and guided the operations of the 1991 Census. At Present he is
deputed for training at London in School of Economics and Political Science.
x
The data presented in this handbook were collected and compiled under the
direction and guidance of Shri Banthia. We would deem it our duty, therefore,
to offer him our sincere and grateful thanks foy all that he did for this project.
In this Directorate, Smt. V.Y.Joshi, Assistant Director spearheaded the
D.C.H.B. unit which meticulously scrutinised the non-Census data collected
from various sources, finalised the list of villages and towns, etc. with the
help of Shri S.V. Deorukhkar, Investigator. AS regards, the write-up portion
the persons who drafted the text, scrutinised, edited and supervised have been
mentioned in the "Acknowledgement". The maps inserted in the D.C.H.B. are ,
prepared by the cartography section under the guidance of Shri D. N. Chaurasia,
Sr. Geographer.
The write-up on fertility and mortality patterns and migration patterns , \
based on 1981 Census data are contributed by S/Shri S.S. Kashyap and J.D.
Mhaiskar, Deputy Directors, respectively.
I take this opportunity to offer my grateful thanks to all officials in various
grades who have been actively involved in voluminous work of compilation and
preparation of this volume.
Lastly I am thankful to the Government of Maharashtra for having agreed
readily to bear the cost of publication of the District Census Handbook volumes
and for the special efforts to Shri P.S. More, Director, Printing and Stationery
and his colleagues to print out the publication in a very nice fashion.
Census Directorate,
Maharashtra, Bombay
Dated 1 st May, 1993
(Maharashtra Day).
A.S. DANGE
Joint Director of Census Operations
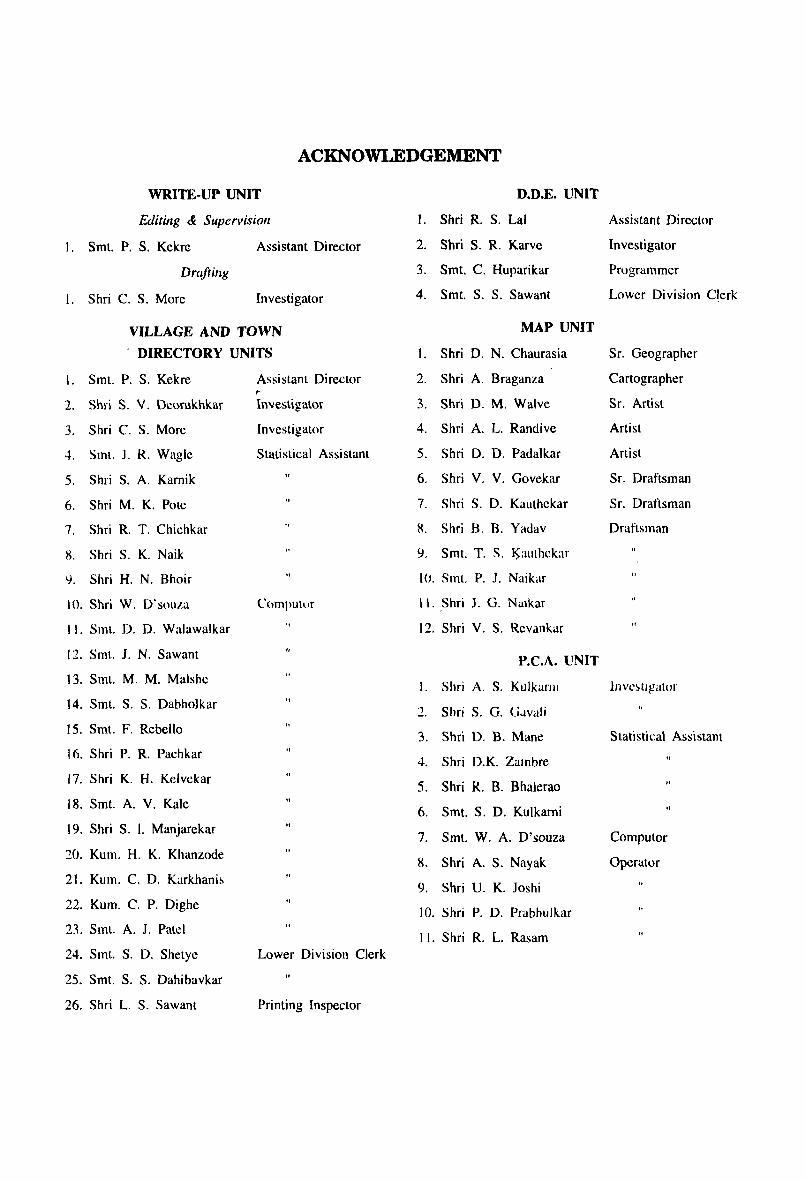
ACKNOWLEDGEMENT
WRITE-UP UNIT D.D.E. UNIT
Editing & Supervision 1. Shri R. S. Lal Assistant Director
I. Smt. P. S. Kekre Assistant Director 2. Shri S. R. Karve Investigator
Drafting 3. Smt. C. Huparikar Programmer
I. Shri C. S. More Investigator 4. Smt. S. S. Sawant Lower Division Clerk
VILLAGE AND TOWN MAP UNIT
. DIRECTORY UNITS I. Shri D. N. Chaurasia Sf. Geographer
1. Smt. P. S. Kekre Assistant Director 2. Shri A. Braganza Cartographer r-
2. Shri S. V. Dcorukhkar In\lestigator 3. Shri D. M. WaIve Sr. Artist
3. Shri C. S. More Investigator 4. Shri A. L. Randive Artist
4. Smt. J. R. Wagle Statistical Assistant 5. Shri D. D. Padalkar Artist
5. Shri S. A. Karnik 6. Shri V. V. Govekar Sr. Draftsman
6. Shri M. K. Pote 7. Shri S. D. Kauthekar Sf. Draftsman
7. Shri R. T. Chichkar X. Shri B. B. Yadav Draftsman
X. Shri S. K. Naik 9. Smt. T. S. ISauthckar
9. Shri H. N. Bhoir 10. Smt. P. 1. Naikar
10. Shri W. IYsollla Chmpulur II. Shri J. G. NUlkar
II. Smt. D. D. Walawalkar 12. Shri V. S. Rcvankar
12. Smt. I. N. Sawant P.C.A. UNIT 13. Smt. M. M. Malshe
I. Shri A. S. KulkarnI Illvc~tl~ator
14. Smt. S. S. Dabholkar '1 Shri S. G. (j,lvaJi
15. Smt. F. Rebello 3. Shri D. B. Mane Statistical Assistant 16. Shri P. R. Pachkar
4. Shri D.K. Zambre 17. Shri K. H. Kelvekar
5. Shri R. B. Bhalerao 18. Smt. A. V. Kale "
6. Smt. S. D. Kulkarni 19. Shri S. 1. Manjarekar "
7. Smt. W. A. D'souza Computor 20. Kum. H. K. Khanzode S. Shfi A. S. Nayak Operator 21. Kum. C. D. Karkhani~
9. Shri U. K. Joshi 22. Kum. C. P. Dighe
10. Shri P. D. Prabhulkar 23. Sml. A. J. Patel
II. Shri R. L. Rasam 24. Smt. S. D. Shetyc Lower Division Clerk
25. Smt. S. S. Dahibavkar
26. Shri L. S. Sawant Printing Inspector

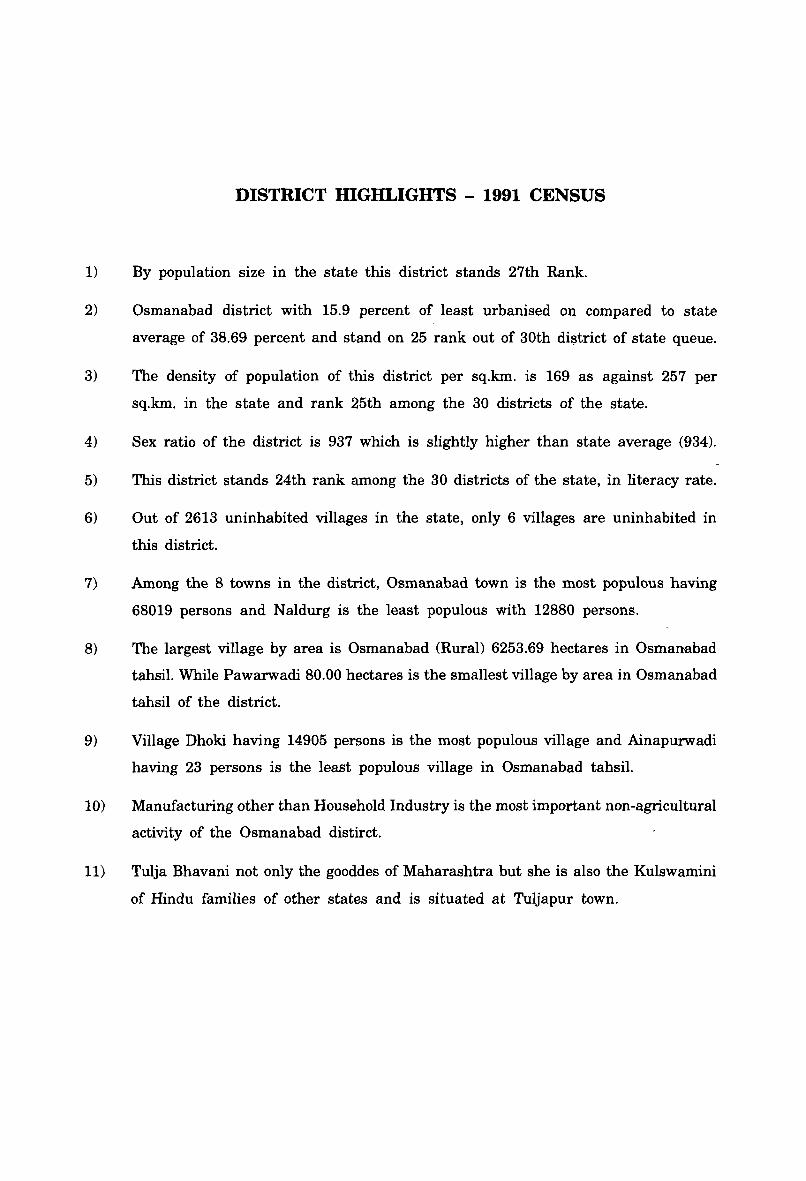
DISTRICT HIGHLIGHTS - 1991 CENSUS
1) By population size in the state this district stands 27th Rank.
2) Osmanabad district with 15.9 percent of least urbanised on compared to state
average of 38.69 percent and stand on 25 rank out of 30th di~trict of state queue.
3) The density of population of this district per sq.km. is 169 as against 257 per
sq.km. in the state and rank 25th among the 30 districts of the state.
4) Sex ratio of the district is 937 which is slightly higher than state average (934).
5) This district stands 24th rank among the 30 districts of the state, in literacy rate.
6) Out of 2613 uninhabited villages in the state, only 6 villages are uninhabited in
this district.
7) Among the 8 towns in the district, Osmanabad town is the most populous having
68019 persons and Naldurg is the least populous with 12880 persons.
8) The largest village by area is Osmanabad (Rural) 6253.69 hectares in Osmanabad
tahsil. While Pawarwadi 80.00 hectares is the smallest village by area in Osmanabad
tahsil of the district.
9) Village Dhoki having 14905 persons is the most populous village and Ainapurwadi
having 23 persons is the least populous village in Osmanabad tahsil.
10) Manufacturing other than Household Industry is the most important non-agricultural
activity of the Osmanabad distirct.
11) Tulja Bhavani not only the gooddes of Maharashtra but she is also the Kulswamini
of Hindu families of other states and is situated at Tuljapur town.
xiv
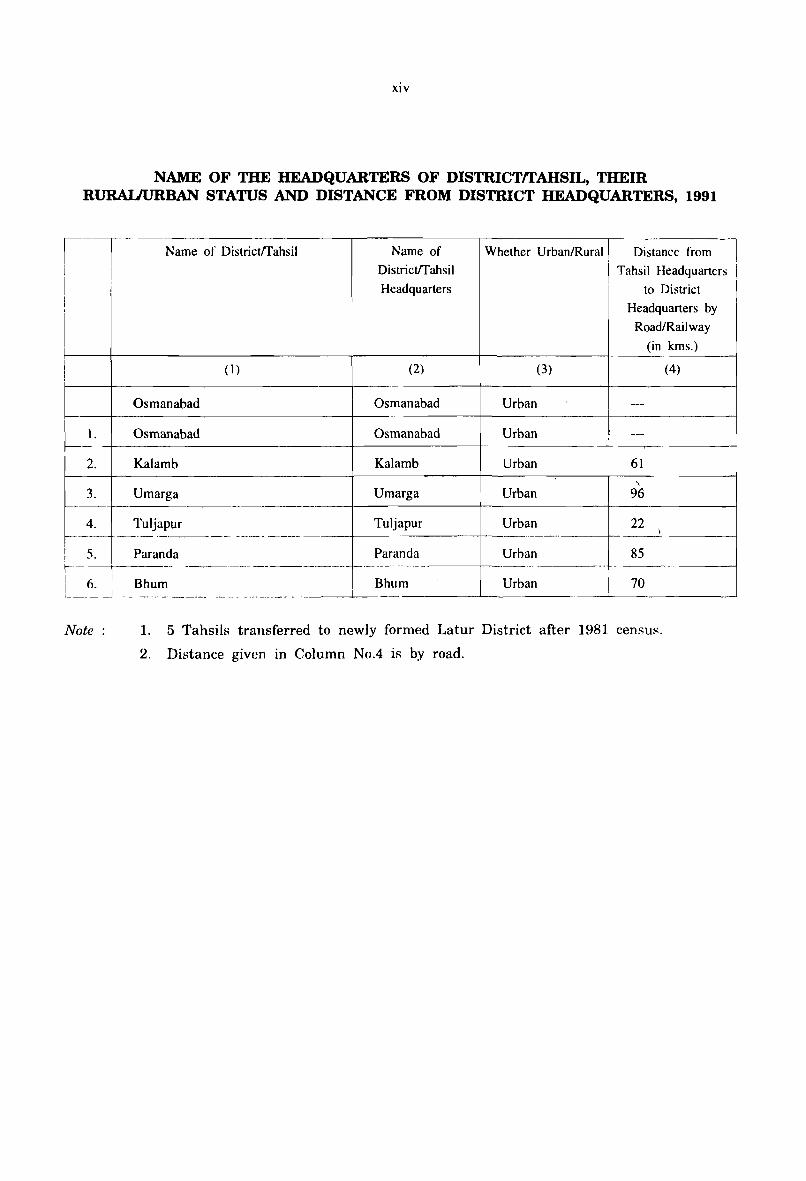
NAME OF THE HEADQUARTERS OF DISTRICTffAHSIL, THEIR RURAlIURBAN STATUS AND DISTANCE FROM DISTRICT HEADQUARTERS, 1991
II Name of Districtffahsil Name of
Districtffahsil
Headquarters
Whether Urban/Rural I Distance from I
I I
I I
I
Osmanabad
(I) (2)
Osmanabad
~~. ~ __ O __ sm __ an_a_b_a_d __________________ r-_O __ sm __ an_a_b_a_d ____ T
2. Kalamb Kalamb
3. Umarga Umarga
(3)
Urban
Urban
Urban
Urban
I Tahsil Headquarters i I to District I
Headquarters by I RoadlRailway
(in kms.)
(4)
---
---
61
96 r-----r-·-------------------------·---+--------------~--------------+_------------~
4. Tuljapur Tuljapur Urban 22 \
f----- ----- ------- ---- ----- -----j---------------t------- -----j------'-------j
Urhan 85 i 5. I r---Paranda Paranda
----------- ----------- r----- -- _- -----.-----f-
Bhum Bhum Urban 70 I 6. II l ___________________ . ________________ '--___________ ~ __________ ~ __________ ____'
Note 1. 5 Tahsils transferred to newly formed Latur District after 1981 census.
2. Distance given in Column No.4 is by road.
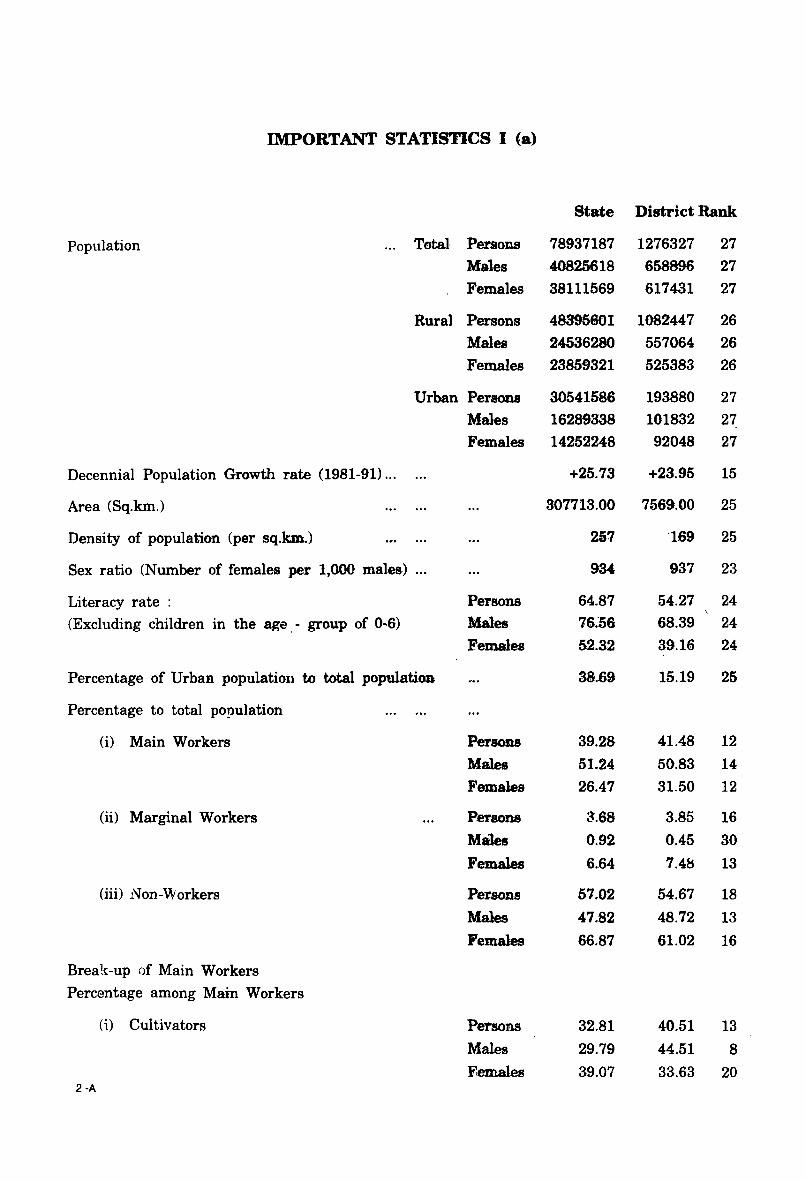
IMPORTANT STATISTICS I (a)
State District Rank
Population '" Total Persons 78937187 1276327 27
Males 40825618 658896 27
Females 38111569 617431 27
Rural Persons 48395601 1082447 26
Males 24536280 557064 26
Females 23859321 525383 26
Urban Persons 30541586 193880 27
Males 16289338 101832 27
Females 14252248 92048 27
Decennial Population Growth rate (1981-91) ... +25.73 +23.95 15
Area (Sq.km.) 307713.00 7569.00 25
Density of population (per sq.km.) 257 '169 25
Sex ratio (Number of females per 1,000 males) ... 934 937 23
Literacy rate : Persons 64.87 54.27 24
(Excluding children in the age, - group of 0-6) Males 76.:56 68.39 24
Females 52.32 39.16 24
Percentage of Urban population to total population 38.69 15.19 25
Percentage to total po!)ulation
(i) Main Workers PerSODS 39.28 41.48 12
Males 51.24 50.83 14
Females 26.47 31.50 12
(ii) Marginal Workers Persons 3.68 3.85 16
Males 0.92 0.45 30
Females 6.64 7.48 13
(iii) Non-Workers Persons 57.02 54.67 18
Males 47.82 48.72 13
Females 66.87 61.02 16
Break-up of Main Workers
Percentage among Main Workers
(1) Cultivators Persons 32.81 40.51 13
Males 29.79 44.51 8
F.em.ales 39.07 33.63 20 2 -A
2
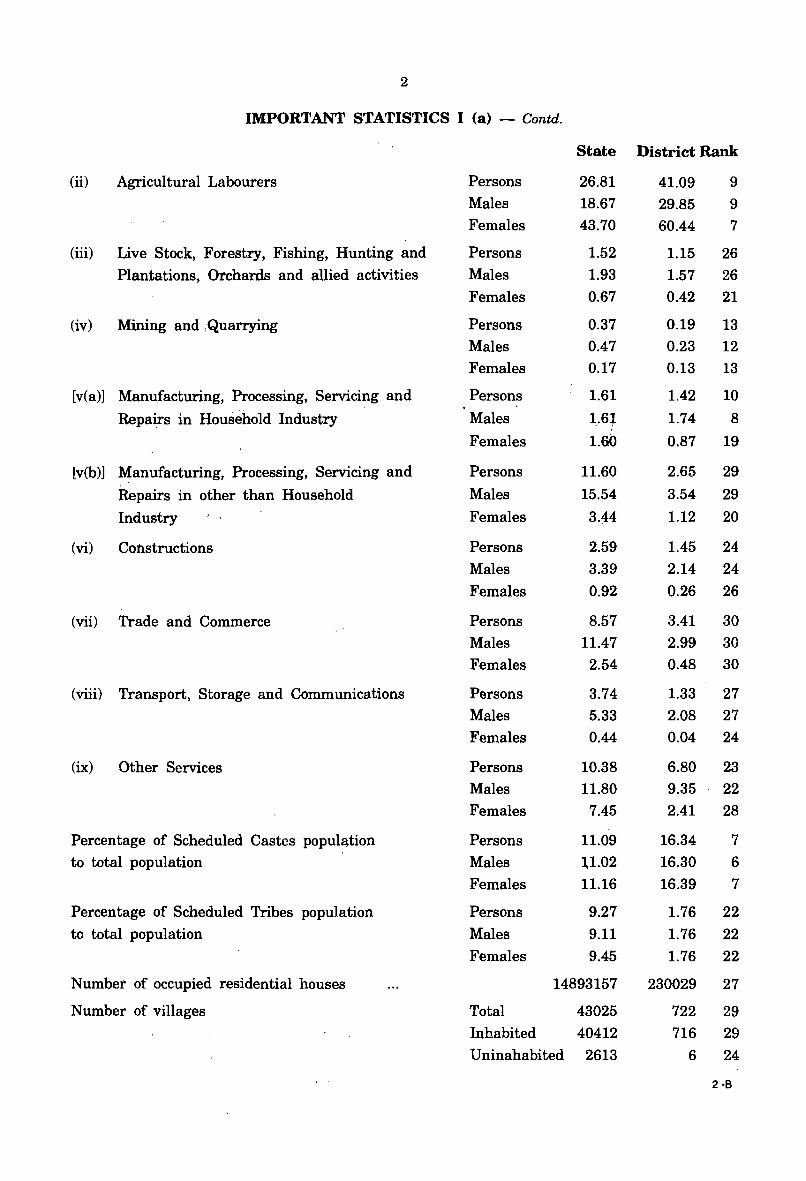
IMPORTANT STATISTICS I (a) - Contd.
State District Rank
(ii) Agricultural Labourers Persons 26.81 41.09 9
Males 18.67 29.85 9 Females 43.70 60.44 7
(iii) Live Stock, Forestry, Fishing, Hunting and Persons 1.52 1.15 26
Plantations, Orchards and allied activities Males 1.93 1.57 26
Females 0.67 0.42 21
(iv) Mining and ,Quarrying Persons 0.37 0.19 13
Males 0.47 0.23 12
Females 0.17 0.13 13
[yea)] Manufacturing, Processing, Servicing and Persons 1.61 1.42 10
Repairs in Household Industry Males 1 .. 6J 1.74 8 ,
Females 1.60 0.87 19
[v(b)] Manufacturing, Processing, Servicing and Persons 11.60 2.65 29
Repairs in other than Household Males 15.54 3.54 29
Industry Females 3.44 1.12 20
(vi) Constructions Persons 2.59 1.45 24
Males 3.39 2.14 24
Females 0.92 0.26 26
(vii) Trade and Commerce Persons 8.57 3.41 30
Males 11.47 2.99 30
Females 2.54 0.48 30
(viii) Transport, Storage and Communications Persons 3.74 1.33 27
Males 5.33 2.08 27
Females 0.44 0.04 24
(ix) Other Services Persons 10.38 6.80 23
Males 11.80 9.35 22
Females 7.45 2.41 28
Percentage of Scheduled Castes population Persons 11.09 16.34 7
to total population Males l1.02 16.30 6
Females 11.16 16.39 7
Percentage of Scheduled Tribes population Persons 9.27 1.76 22
to total population Males 9.11 1.76 22
Females 9.45 1.76 22
Number of occupied residential houses 14893157 230029 27
Number of villages Total 43025 722 29
Inhabited 40412 716 29
Uninahabited 2613 6 24
2-8
3
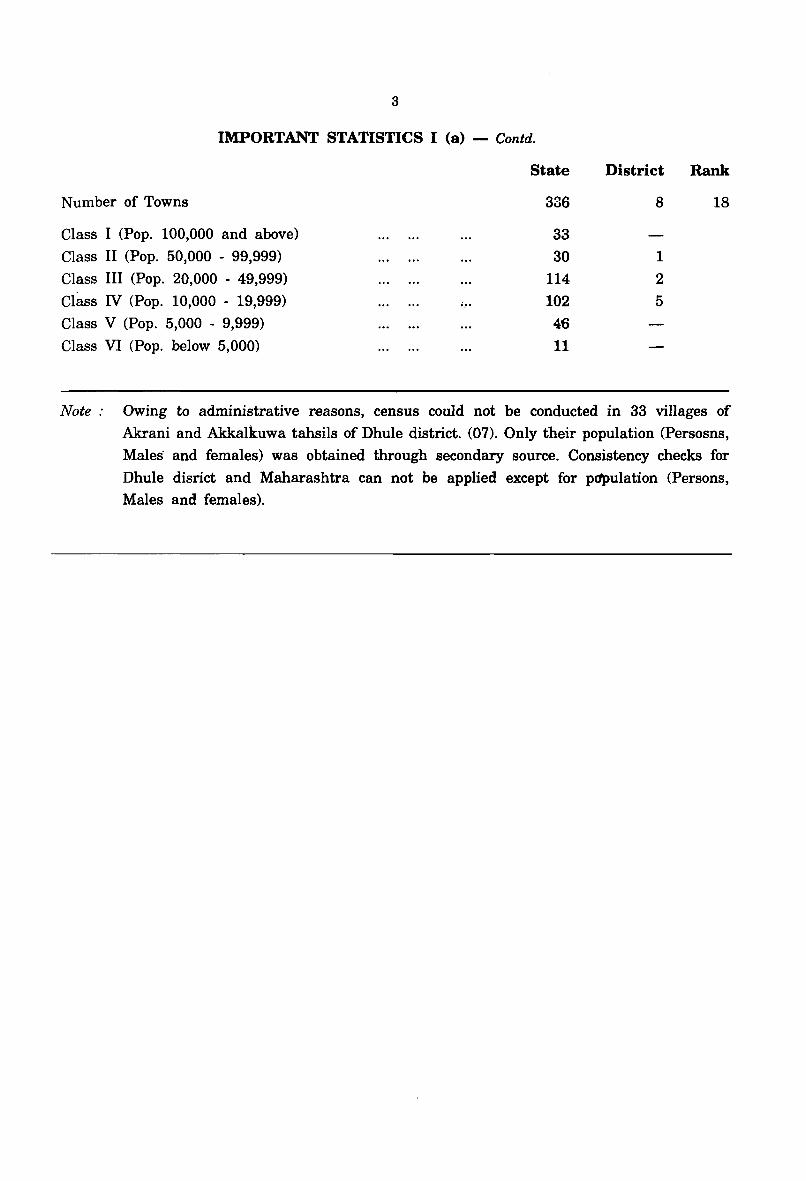
IMPORTANT STATISTICS I (a) - Contd.
State
Number of Towns 336
Class I (Pop. 100,000 and above) 33 Class II (Pop. 50,000 - 99,999) 30 Class III (Pop. 20,000 - 49,999) 114
Class IV (Pop. 10,000 - 19,999) ., .. 102 Class V (Pop. 5,000 - 9,999) 46
Class VI (Pop. below 5,000) 11
Ilistrict ~
8 18
1
2
5
Note: Owing to administrative reasons, census could not be conducted in 33 villages of
Akrani and Akkalkuwa tahsils of Dhule district. (07). Only their population (Persosns,
Males and females) was obtained through secondary source. Consistency checks for
Dhule disrict and Maharashtra can not be applied except for papulation (Persons, Males and females).
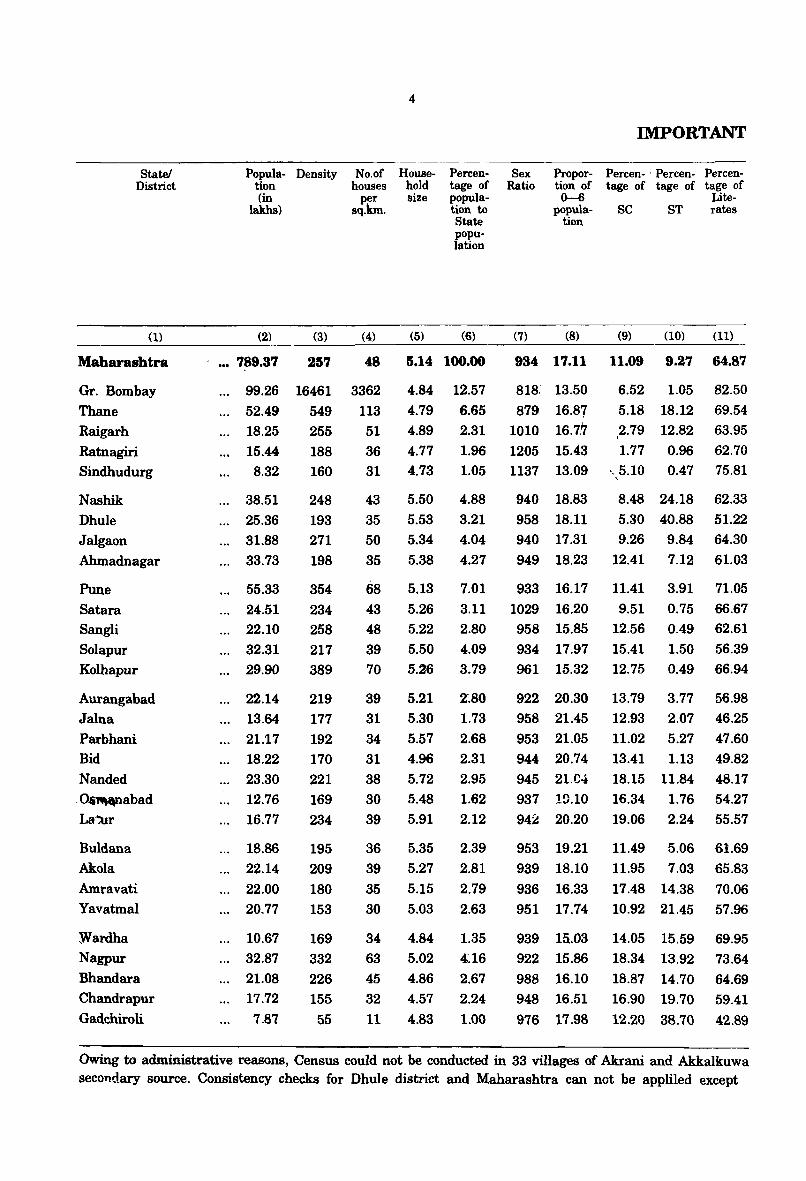
Statel District
(1)
Maharashtra
Gr. Bombay
Thane Raigarh
Ratnagiri Sindhudurg
Nashik
Dhule Jalgaon
Ahmadnagar
Pune Satara Sangli
Solapur
Kolhapur
Aurangabad
Jalna
Parbhani Bid
Nanded
.Os~abad
La":ur
Buldana
Akola
Amravati
Yavatmal
YVardha Nagpur
Bhandara Chandrapur
Gadchiroli
Popula- Density tion (in
lakhs)
(2) (3)
•.• 789.37 257
99.26 16461
... 52.49 549
18.25 255
15.44 188
8.32 160
38.51
25.36 31.88
33.73
55.33
... 24.51 22.10
... 32.31
... 29.90
22.14
13.64
21:17
18.22
23.30
12.76
16.77
... 18.86
... 22.14
22.00
20.77
10.67
32.87
21.08
17.72
7.87
248
193
271
198
354
234 258
217
389
219
177
192
170
221 169
234
195
209
180
153
169 332
226
155
55
4
No.of House- Percentage of population to
houses hold per size
sq.km.
(4) (5)
State population
(6)
48 5.14 100.00
3362
113 51
36 31
43
35
50
35
68
43 48
39 70
39
31
34
31
38
30
39
36
39
35
30
34
63
45
32
11
4.84
4.79
4.89
4.77 4.73
12.57
6.65 2.31
1.96 1.05
5.50 4.88
5.53 3.21
5.34 4.04
5.38
5.13
5.26 5.22
5.50 5.26
5.21
5.30
5.57
4.96
5.72
5.48
4.27
7.01 3.11 2.80
4.09
3.79
Z.80
1.73
2.68
2.31
2.95
1.62
5.91 2.12
5.35
5.27
5.15
5.03
4.84
5.02
4.86
4.57
4:.83
2.39
2.81
2.79
2.63
1.35
4:.16
2.67
2.24
1.00
Sex Ratio
(7)
Proportion of 0-6
population
(8)
IMPORTANT
Percen- . Percen- Percentage of tage of tage of
Lite-se ST rates
(9) (10) (11)
934 17.11 11.09 9.27 64.87
818: 13.50
879 16.87 10to 16.7,7
1205 15.43 1137 13.09
940 18.83
958 18.11 940 17.31
949 18.23
933 16.17
1029 16.20
958 15.85
934 17.97
961 15.32
922 20.30
958 21.45
953 21.05
944 20.74
945 21.04
937 !D.10
,
6.52 1.05
5.18 18.12
2.79 12.82
1.77 0.96
·.5.10 0.47
82.50
69.54
63.95
62.70
75.81 ,
8.48 24.18 62.33
5.30 40.88 51.22 9.26 9.84 64.30
12.41
11.41
9.51 12.56
15.41
12.75
7.12 61.03
3.91 71.05
0.75 66.67
0.49 62.61
1.50 56.39 0.49 66.94
13.79 3.77 56.98
12.93 2.07 46.25
11.02 5.27 47.60 13.41 1.13 49.82
18.15 11.84 48.17
16.34 1.76 54.27
94~ 20.20 19.06 2.24 55.57
953 19.21
939 18.10
936 16.33
951 17.74
939 15.03
922 15.86
988 16.10
948 16.51
976 17.98
11.49 5.06 61.69
11.95 7.03 65.83
17.48 14.38 70.06
10.92 21.45 57.96
14.05 15.59 69.95
18.34 13.92 73.64
18.87 14.70 64.69
16.90 19.70 59.41
12.20 38.70 42.89
Owing to administrative reasons, Census could not be conducted in 33 villages of Akrani and Akkalkuwa secondary source. Consistency checks for Dhule district and Maharashtra can not be appliled except
5
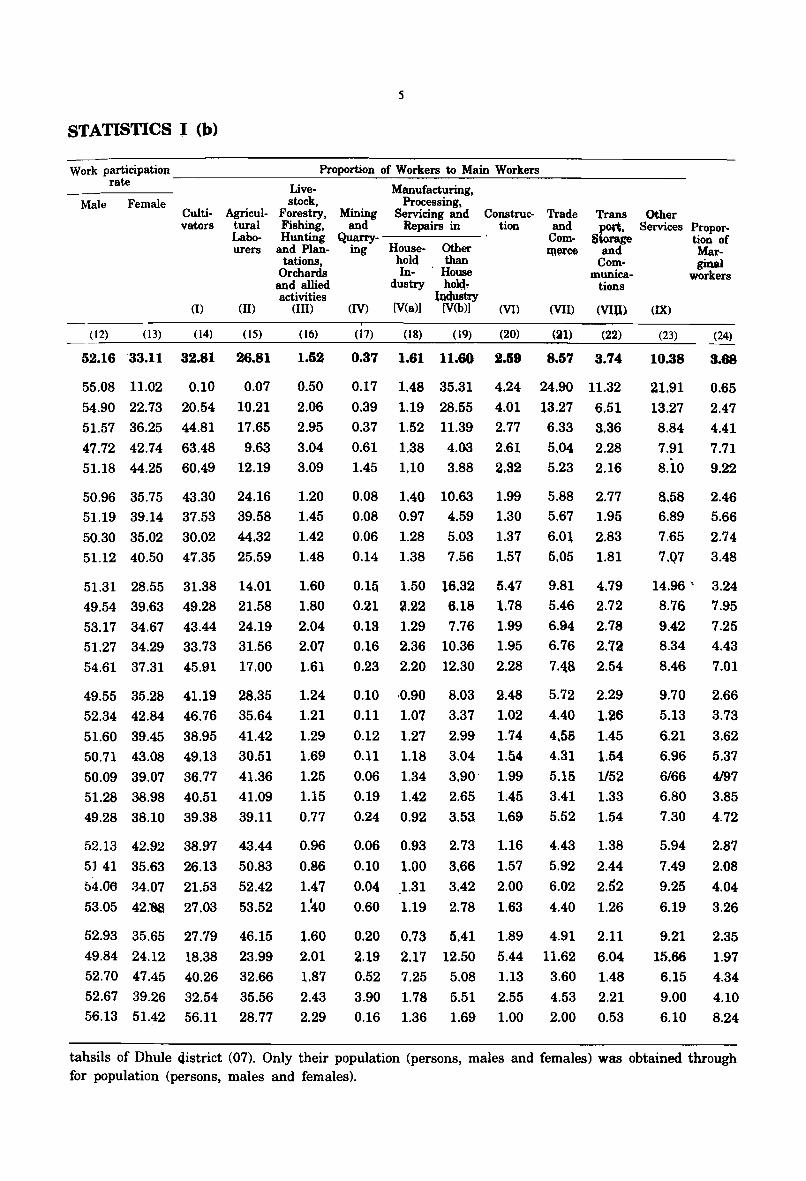
STATISTICS I (b)
Work participation _________ Pr~opo~rti....:.·o.::.n....:o..:_f _.:.;W..::.or:..::k:.:.;ers:..::......:to..::....::..M:..::a=in:.._W.:..:....::..;;or=ke:..::rs.::..._ ______ _ rate
Male Female Culti- Agricul-vators tural
Labourers
m (II)
(12) (13) (14)
52.16 33.11 32.81
55.08 11.02 0.10
54.90 22.73 20.54
51.57 36.25 44.81
47.72 42.74 63.48
51.18 44.25 60.49
(15)
26.81
0.07
10.21
17.65
9.63 12.19
50.96 35.75 43.30 24.16 51.19 39.14 37.53 39.58
50.30 35.02 30.02 44.32
51.12 40.50 47.35 25.59
51.31 28.55
49.54 39.63
53.17 34.67 51.27 34.29
54.61 37.31
31.38
49.28
43.44
33.73
45.91
14.01
21.58
24.19 31.56
17.00
49.55 35.28 41.19 28.35
52.34 42.84 46.76 35.64
51.60 39.45 38.95 41.42
50.71 43.08 49.13 30.51
50.09 39.07 36.77 41.36
51.28 38.98 40.51 41.09
49.28 38.10 39.38 39.11
52.13 42.92 38.97 43.44
5J 41 35.63 26.13 50.83
64.06 34.07 21.53 52.42
53.05 42.'88 27.03 53.52
52.93 35.65 27.79 46.15
Live- Manufacturing, stock, Processing,
Forestry, Mining Servicing and Construe- Trade Trans Other Fishing, and Repairs in Hunting Quarry------
tion and Commwce
port. Services Propo~ Storage tion of
and Plan- ing House- Other tations, hold than
and Mar-
Orchards In- 'House Com- gina}
munica- workers and allied dustry hoIq, tions activities lndustry
(III) (IV) (V(a») (V(b») (VI) (VII) (VlU) (IX)
(16)
1.52
0.50
2.06
2.95
3.04 3.09
1.20 1.45
1.42
1.48
1.60
1.80
2.04 2.07
1.61
1.24
1.21
1.29
1.69
1.25
1.15
0.77
0.96
0.86
1.47 1.~0
1.60
(17) (18) (19) (20) (91) (22)
0.37 1.61 11.60 2.59 8.57 3.74
0.17 1.48 35.31
0.39 1.19 28.55 0.37 1.52 11.39
0.61 1.38 4.03
1.45 1.10 3.88
4.24 24.90 11.32
4.01 13.27 6.51 2.77 6.33 8.36
2.61 5.04 2.28 2.32 5.23 2.16
0.08 1.40 10.63 1.99 0.08 0.97 4.59 1.30
0.06 1.28 5.03 1.37
0.14 1.38 7.56 1.57
0.15 0.21
0.13
0.16
0.23
1.50 16.32
2.22 6.18 1.29 7.76
2.36 10.36
2.20 12.30
5.47 1.78
1.99 1.95
2.28
0.10 ·0.90
0.11 l.07
0.12 1.27
0.11 l.18
0.06 1.34
0.19 1.42
0.24 0.92
0.06 0.93
0.10 1.00
0.04 .1.31
0.60 l.19
0.20 0.73
8.03 2.48
3.37 1.02
2.99 1.74
3.04 1.54
3.90' 1.99
2.65 1.45
3.53 1.69
2.73 1.16
3.66 1.57
3.42 2.00
2.78 1.63
5.41 1.89
5.88 2.77 5.67 1.95
6.01 2.83
5.05 1.81
9.81 5,46
6.94 6.76
7.48
4.79 2.72 2.78
2.72 2.54
5.72 2.29
4.40 1.26
4.55 1.45
4.31 1.54
5.15 1152 3.41 1.33
5.52 1.54
4.43 1.38
5.92 2.44
6.02 2.52
4.40 1.26
4.91 2.11
(23)
10.38
21.91
13.27 8.84
7.91 8.10
8.58 6.89
7.65
7.Q7
(24)
3.68
0.65
2.47 4.41
7.71
9.22
2.46 5.66
2.74 3,48
14.96' 3.24 8.76 7.95
9.42 8.34
8,46
9.70
5.13
6.21
6.96
6/66 6.80
7.30
5.94
7.49
9.25
6.19
9.21
7.25 4.43
7.01
2.66
3.73
3.62
5.37
4/97
3.85
4.72
2.87
2.08
4.04
3.26
2.35 49.84 24.12 18.38 23.99 2.01 2.19 2.17 12.50 5.44 11.62 6.04 15.66 1.97 52.70 47,45 40.26 32.66 1.87 0.52 7.25 5.08 1.13 3.60 1.48 6.15 4.34 52.67 39.26 32.54 35.56 2.43 3.90 1.78 5.51 2.55 4.53 2.21 9.00 4.10 56.13 51.42 56.11 28.77 2.29 0.16 1.36 1.69 1.00 2.00 0.53 6.10 8.24
tahsils of Dhule Qistrict (07). Only their population (persons, males and females) was obtained through for population (persons, males and females).
6
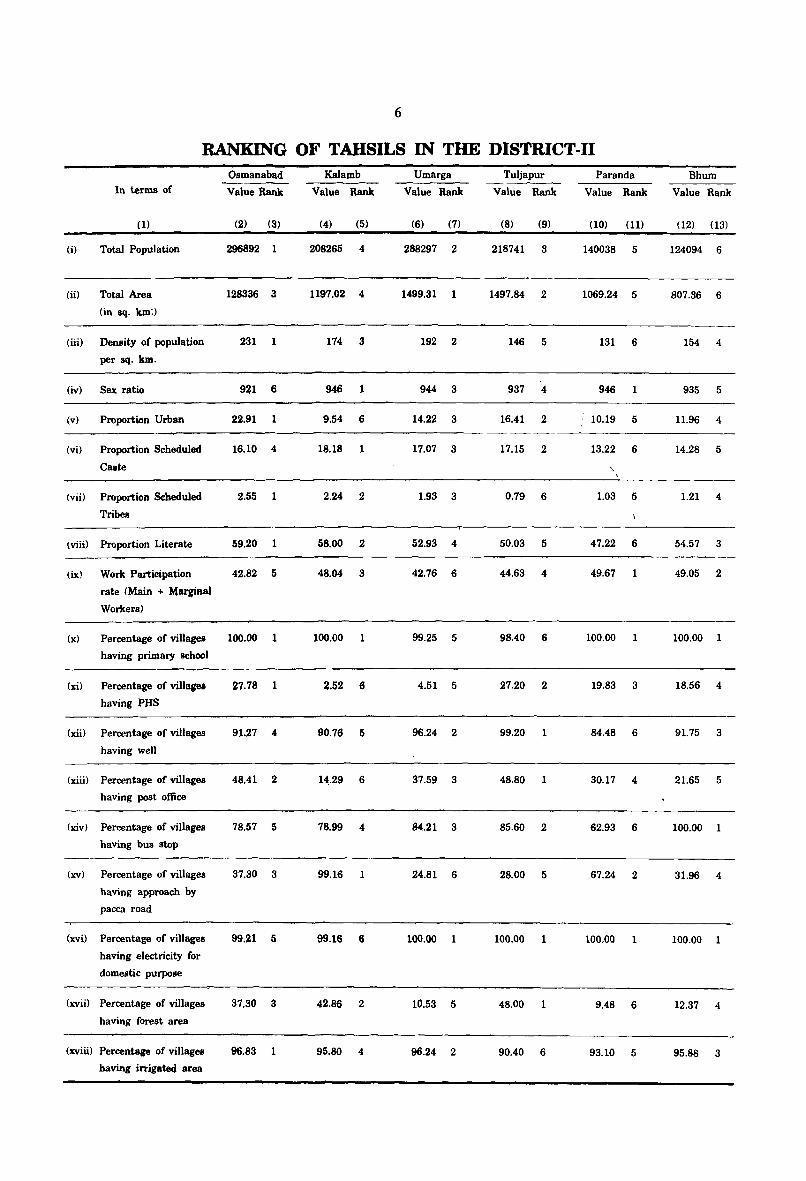
RANKING OF TAHSILS IN THE DISTRICT·I1
In terms of
(1)
(i) Total Population
(ii) Total Area
(in sq. km:)
(iii) Density of population
per sq. kin.
(iv) Sex ratio
(v) Proportion Urban
(vi) Proportion Scheduled
Caste
(vii) Proportion Scheduled
Tribes
(viii) Proportion Literate
(ixl Work Participation
rate (Main + Mlll'(iBaJ
Workers)
(x) Percentage of villages
having primary school
(xi) Percentage of villages
having PHS
(xii) Percentage of villages
having well
(xiii) Percentage of villages
having post office
(xiv) Pen:entage of villages
having bus stop
(xv) Percentage of villages
having approach by
pacca road
(xvi) Percentage of villages
having electricity for
domestic purpose
(xvii) Percentage of villages
having forest area
(xviii) Percentage of villages
having irrigated area
Osmanabad
Value Rank
(2) (3)
296892 1
128336 3
231 1
921 6
22.91 1
16.10 4
2.55 1
59.20 1
42.82 5
100.00 1
27.78 1
91.27 4
48.41 2
78.57 5
37.30 3
99.21 5
37.30 3
96.83 1
Kalamb
Value Rank
(4) (5)
208265 4
1197.02 4
174 3
946 1
9.54 6
18.18 1
2.24 2
58.00 2
4S.04 3
100.00 1
2.52 6
90.76 5
1~.29 6
7S.99 4
99.16 1
99.16 6
42.86 2
95.80 4
Umarga Tuljapur Paranda
Value Rank Value Rank Value Rank
(6) (7) (8) (9) (10) (11)
288297 2 218741 3 140038 5
1499.31 1 1497.84 2 1069.24 5
192 2 146 5 131 6
944 3 937 4 946 1
14.22 3 16.41 2 10.19 5
17.07 3 17.15 2 13.22 6
1.93 3 0.79 6 1.03 5
52.93 4 50.03 5 47.22 6
42.76 6 44.63 4 49.67 1
99.25 5 98.40 6 100.00 1
4.51 5 27.20 2 19.53 3
96.24 2 99.20 1 84.48 6
37.59 3 48.80 1 30.17 4
84.21 3 85.60 2 62.93 6
24.81 6 2S.00 5 67.24 2
100.00 1 100.00 1 100.00 1
10.53 5 48.00 1 9.48 6
96.24 2 90.40 6 93.10 5
Bhum
Value Rank
(12) (13)
124094 6
807.36 6
154 4
935 5
11.96 4
14.28 5
1.21 4
54.57 3
49.05 2
100.00 1
lS.56 4
91.75 3
21.65 5
100.00 1
31.96 4
100.00 1
12.37 4
95.88 3
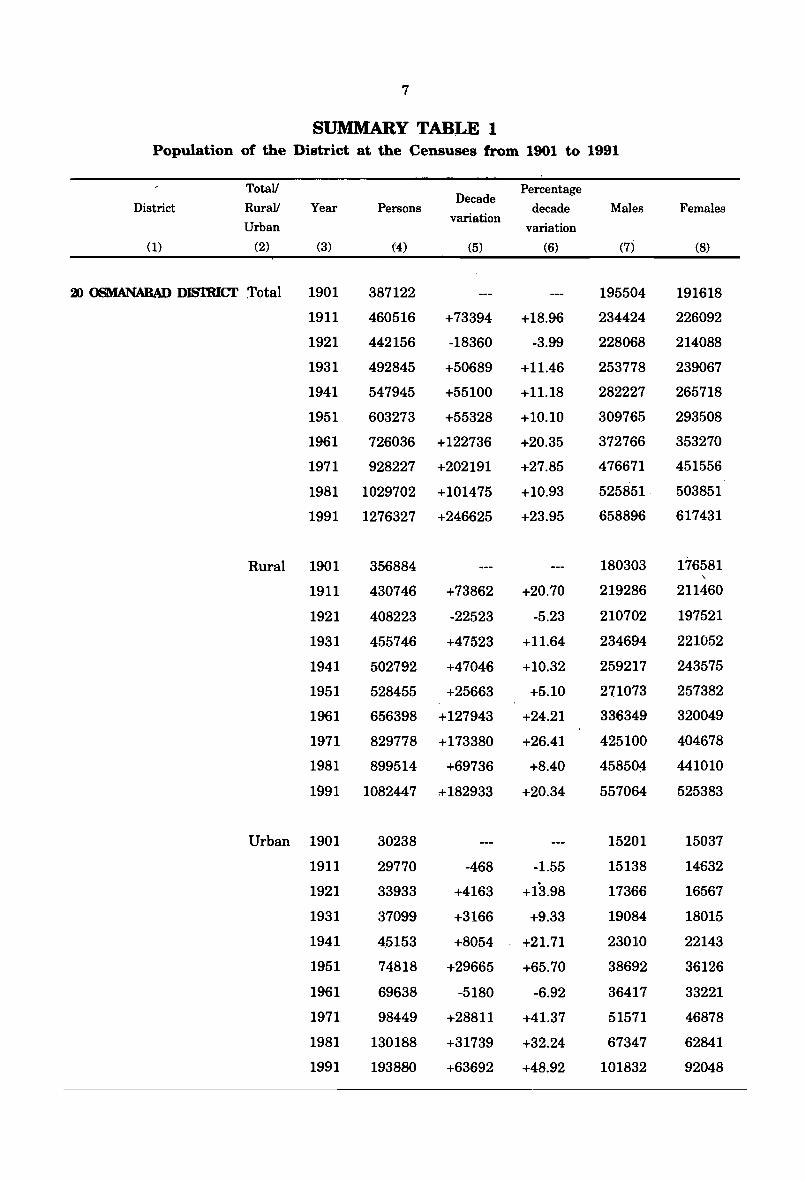
7
SUMMARY TABLE 1 Population of the District at the Censuses from 1901 to 1991
TotaV Percentage Decade
District RuraV Year Persons decade Males Females
Urban variation
variation
(1) (2) (3) (4) (5J (6) (7) (8)
~ OSMANABAD DISlRICT Total 1901 387122 195504 191618
1911 460516 +73394 +18.96 234424 226092
1921 442156 -18360 -3.99 228068 214088
1931 492845 +50689 +11.46 253778 239067
1941 547945 +55100 +11.18 282227 265718
1951 603273 +55328 +10.10 309765 293508
1961 726036 +122736 +20.35 372766 353270
1971 928227 +202191 +27.85 476671 451556
1981 1029702 +101475 +10.93 525851· 503851
1991 1276327 +246625 +23.95 658896 617431
Rural 1901 356884 180303 176581 , 1911 430746 +73862 +20.70 219286 211460
1921 408223 -22523 -5.23 210702 197521
1931 455746 +47523 +11.64 234694 221052
1941 502792 +47046 +10.32 259217 243575
1951 528455 +25663 +5.10 271073 257382
1961 656398 +127943 +24.21 336349 320049
1971 829778 +173380 +26.41 425100 404678
1981 899514 +69736 +8.40 458504 441010
1991 1082447 +182933 +20.34 557064 525383
Urban 1901 30238 15201 15037
1911 29770 -468 -1.55 15138 14'632
1921 33933 +4163 +13.98 17366 16567
1931 37099 +3166 +9.33 19084 18015
1941 4,5153 +8054 +21.71 23010 22143
1951 74818 +29665 +65.70 38692 36126
1961 69638 -5180 -6.92 36417 33221
1971 98449 +28811 +41.37 51571 46878
1981 130188 +31739 +32.24 67347 62841
1991 193880 +63692 +48.92 101832 92048
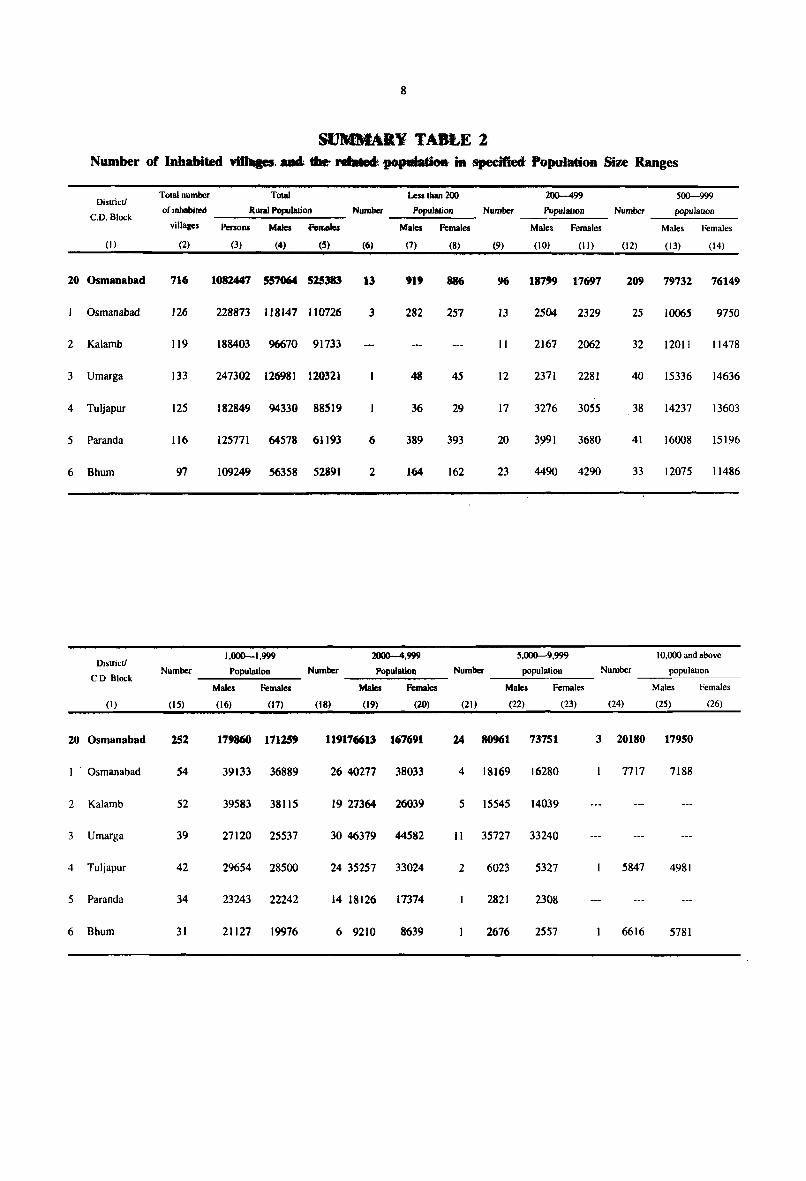
8
SDMllAR¥ TARE 2 Number of Inhabited ..... aa4 *' reI.1t popaIatioB' in, speeitiect Population Size Ranges
District! Total number Total Less than 200 200-499 500-999
C,D,Block of mhabited Rural Population Number Population Number Populanon Number populatlon
villages Persons Males FeIlliBles Males Females Males Females Males Females
(I) (2) (3) (4) (5) (6) (7) (8) (9) {I 0) (II) {I 2) (l3) (14)
20 Osmanabad 716 1082447 557064 525383 13 919 8116 96 18799 17697 209 79732 76149
Osmanabad 126 228873 118147 110726 3 282 257 13 2504 2329 25 10065 9750
2 Kalamb 119 188403 96670 91733 11 2167 2062 32 12011 11478
3 Umarga 133 247302 126981 12~321 411 45 12 2371 2281 40 15336 14636
, 4 Tuljapur 125 182849 94330 88519 36 29 17 3276 30S5 38 14237 13603
5 Paranda 116 125771 64578 61193 6 389 393 20 3,991 3680 41 16008 15196
6 Bhum 97 109249 56358 52891 2 164 162 23 4490 4290 33 12075 11486
1,000-1,999 2000-4,999 5,000-9,999 10,000 and above DIstrict!
Number Number Number Population Populalioo Number population populatIon CD Block
Males Females Males Females Males Females Males Females
(I) {I 5) {I 6) (l7) (18) {I 9) (20) (21) (22) (23) (24) (25) (26)
20 Osmanabad 252 179860 171259 119176613 167691 24 80961 737S1 3 20180 17950
, Osmanabad 54 39133 36889 2640277 38033 4 18169 16280 7717 7188
2 Ka1amb 52 39583 38115 19 27364 26039 5 15545 14039
3 Umarga 39 27120 25537 30 46379 44582 11 35727 33240
4 Tu1japur 42 29654 28500 24 35257 33024 2 6023 5327 5847 4981
5 Paranda 34 23243 22242 14 18126 17374 2821 2308
6 Bhum 31 21127 19976 6 9210 8639 2676 2557 6616 5781
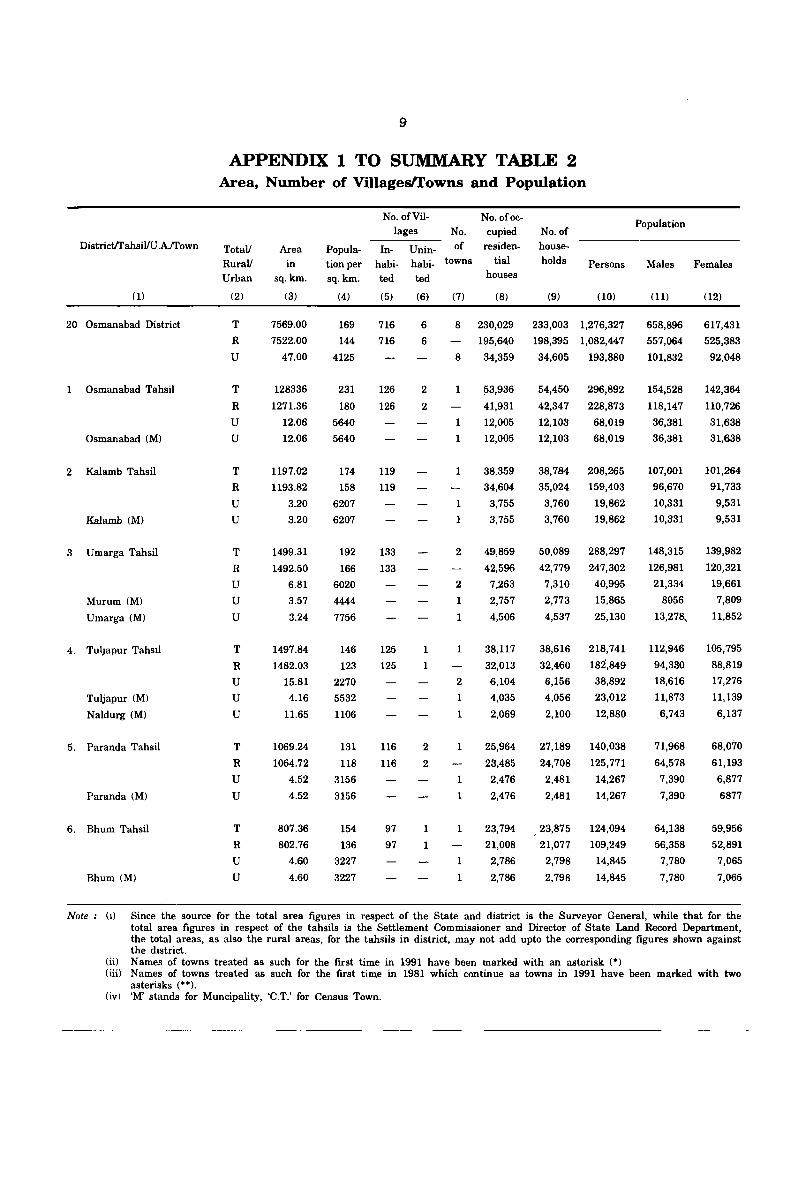
DistricVTahsillU .A.trown
(1)
20 Osmanabad District
1 Osmanabad Tahsil
Osmanabad (M)
2 Kalamb Tahsil
Kalamb (M)
3 Umarga Tahsil
Murum (M)
Umarga (M)
4. TulJapur TahsIl
Tuljapur (M)
Naldurg (M)
5. Paranda Tahsil
Paranda (M)
6. Bhum Tahsil
Bhum (M)
9
APPENDIX 1 TO SUMMARY TABLE 2 Area, Number of VillagesITowns and Population
Total!
Rural! Urban
(2)
T
R
U
T
R
U
U
T R
U
U
T
R
U
U
U
T
R
U
U
U
T
R
U
U
T
R
U
U
Area in
sq.km.
(3)
7569.00
7522.00
47.00
128336
1271.36
12.06
12.06
1197.02
1193.82
3.20
3.20
1499.31
1492.50
6.81
3.57
3.24
1497.84
1482.03
15.81
4.16
11.65
1069.24
1064.72
4.52
4.52
807.36
802.76
4.60
4.60
Population per sq.km.
(4)
169
144
4125
231
180
5640
5640
174
158
6207
6207
192
166
6020
4444
7756
146
123
2270
5532
1106
131
118
3156
3156
154
136
3227
3227
No.ofoc-No. of Villages No. cupied No. of
Inhabited
(5)
716
716
126
126
119
119
133
133
125
125
116
116
97
97
Unin- of habi- towns
ted
(6), (7)
residential
houses
(8)
households
(9)
Persons
(10)
6
6
8 230,029 233,003 1,276,327
2
2
1
2
2
1
1
8
1
1
1
1
1
1
2
2
1
1
1
2
1
1
1
1
1
1
1
1
195,640 198,395 1,082,447
34,359
1>3,936
41,931
12,005
12,005
38,359
34,604
3,755
3,755
49,859
42,596
7,263
2,757
4,506
38,117
32,013
6,104
4,035
2,069
25,964
23,485
2,476
2,476
34,605 193,880
54,450
42,347
12,103
12,103
296,892
228,873
68,019
68,019
38,784 208,265
35,024 159,403
3,760
3,760
19,862
19,862
50,089 288,297
42,779 247,302
7,310
2,773
4,537
40,995
15,865
25,130
38,616 218,741
32,460 182,849
6,156 38,892
4,056 23,012
2,100 12,880
27,189 140,038
24,708 125,771
2,481
2,481
14,267
14,267
23,794 • 23,875 124,094
21,008 21,077 109,249
2,786 2,798 14,845
2,786 2,798 14,845
Population
Males
(11)
658,896
557,064
101,832
154,528
118,147
36,381
36,381
107,001
96,670
10,331
10,331
148,315
126,981
21,334
8056
13,27a_
112,946
94,330
18,616
11,873
6,743
71,968
64,578
7,390
7,390
64,138
56,358
7,780
7,780
Females
(12)
617,431
525,383
92,048
142,364
110,726
31,638
31,638
101,264
91,733
9,531
9,531
139,982
120,321
19,661
7,809
11,852
105,795
88,819
17,276
11,139
6,137
68,070
61,193
6,877
6877
59,956
52,891
7,065
7,065
Note: (1) Since the source for the total area figures in respect of the State and district is the Surveyor General, while that for the total area figures in respect of the tahsils is the Settlement Commissioner and Director of State Land Record Department, the total areas, as also the rural areas, for the tahsils in district, may not add upto the corresponding figures shown against the dlstrict.
(ii) Names of towns treated as such for the first time in 1991 have been marked with an asterisk (*) (iii) Names of towns treated as such for the first time in 1981 which continue as towns in 1991 have been marked with two
asterisks (*.). (iv) 'M' stands for Muncipality, 'C.T.' for Census Town.
10
APPENDIX 2 TO SUMMARY TABLE 2 Towns with Population under 5,000
Name of Districttrahsil Number of Towns Population in the
concerned town
Percentage to Urban population
of the respective District/
Tahsil (1)
DistricttrahsillU .A.trown
(1)
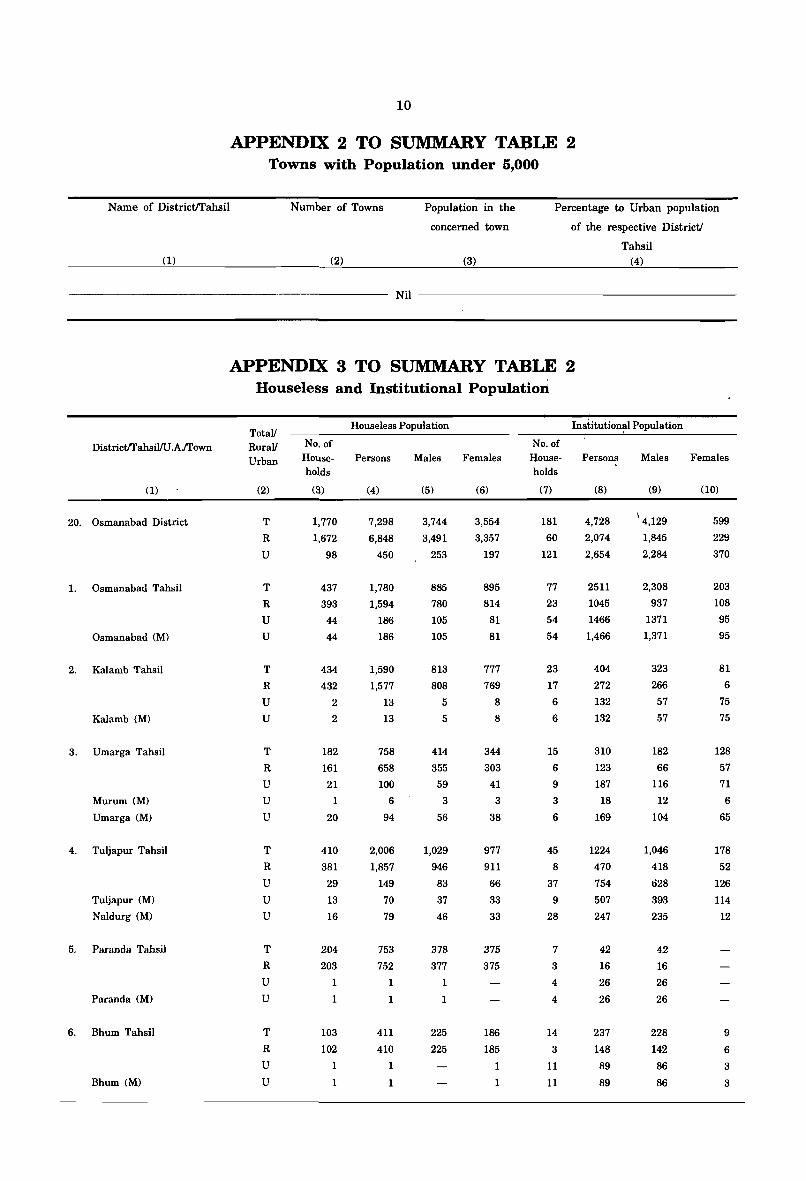
20. Osmanabad District
1. Osmanabad Tahsil
Osmanabad (M)
2. Kalamb Tahsil
Kalamb (M)
3. Umarga Tahsil
Murum (M)
Umarga (M)
4. Tuljapur Tahsil
Tuljapur (M)
Naldurg (M)
5. Paranda Tahsil
Paranda (M)
6. Bhum Tahsil
Bhum (M)
(2) (3) (4)
Nil ----------------------------------------------
APPENDIX 3 TO SUMMARY TABLE 2 Houseless and Institutional Populatio:rt
Totall RuraV Urban
Houseless Population Imltitutional Population
(2)
T
R
U
T
R
U
U
T
R
U
U
T
R
U
U
U
T
R
U
U
U
T
R
U
U
T
R
U
U
No. of Households
(3)
1,770
1,672
98
437
393
44
44
434
432
2
2
182
161
21
1
20
410
381
29
13
16
204
203
1
1
103
102
1
1
Persons
(4)
7,298
6,848
450
1,780
1,594
186
186
1,590
1,577
13
13
758
658
100
6
94
2,006
1,857
149
70
79
753
752
1
1
411
410
1
1
Males
(5)
3,744
3,491
253
885
780
105
105
813
808
5
5
414
355
59
3
56
1,029
946
83
37
46
378
377
1
1
225
225
Females
(6)
3,554
3,357
197
895
814
81
81
777
769
8
8
344
303
41
3
38
977
911
66
33
33
375
375
186
185
1
1
No. of House- Persons holds
(7)
181
60
121
77
23
54
54
23
17
6
6
15
6
9
3
6
45
8
37
9
28
7
3
4
4
14
3
11
11
(8)
4,728
2,074
2,654
2511
1045
1466
1,466
404
272
132
132
310
123
187
18
169
1224
470
754
507
247
42
16
26
26
237
148
89
89
Males
(9)
\ 4,129
1,845
2,284
2,308
937
1371
1,371
323
266
57
57
182
66
116
12
104
1,046
418
628
393
235
42
16
26
26
228
142
86
86
Females
(10)
599
229
370
203
108
95
95
81
6
75
75
128
57
71
6
65
178
52
126
114
12
9
6
3
3
ANALYTICAL NOTE
1. mSTORY AND SCOPE OF DISTRICT CENSUS HANDBOOK 1.1 District Census Handbook CDCHB) is a
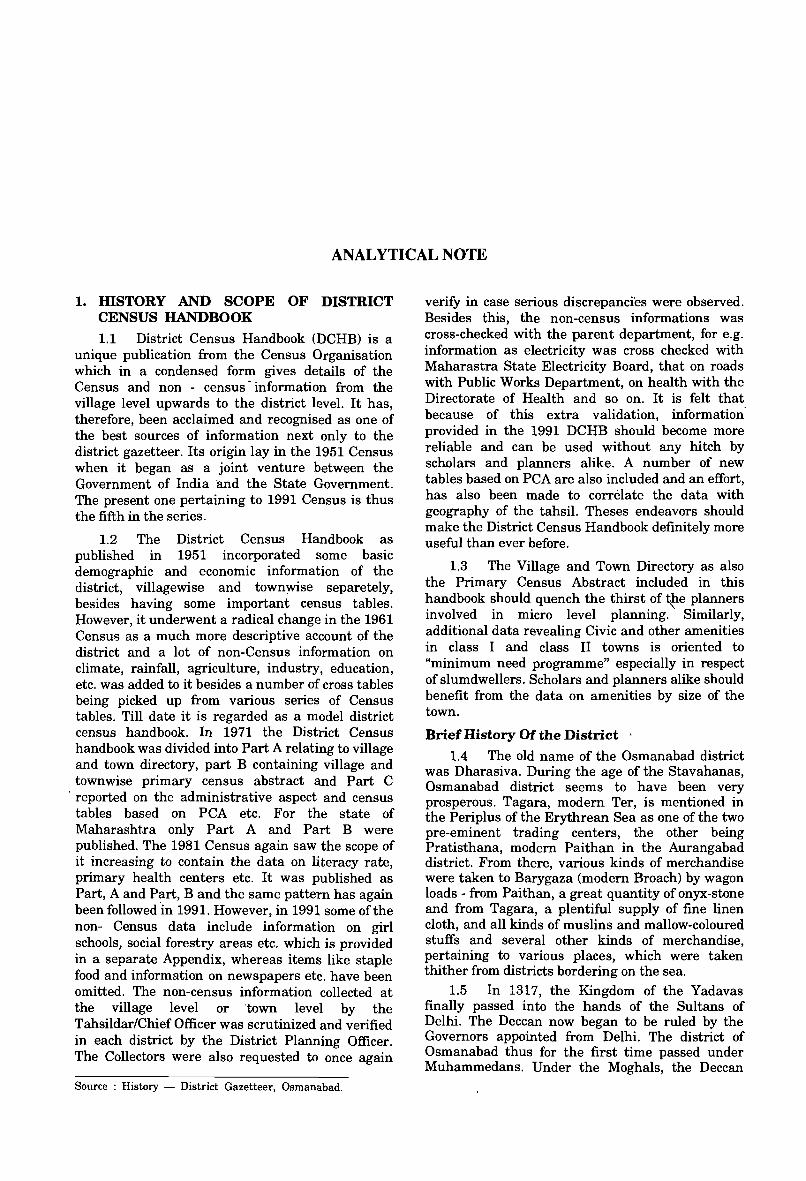
unique publication from the Census Organisation which in a condensed form gives details of the Census and non - census· information from the village level upwards to the district level. It has, therefore, been acclaimed and recognised as one of the best sources of information next only to the district gazetteer. Its origin lay in the 1951 Census when it began as a joint venture between the Government of India and the State Government. The present one pertaining to 1991 Census is thus the fifth in the series.
1.2 The District Census Handbook as published in 1951 incorporated some basic demographic and economic information of the district, villagewise and townwise separetely, besides having some important census tables. However, it underwent a radical change in the 1961 Census as a much more descriptive account of the district and a lot of non-Census information on climate, rainfall, agriculture, industry, education, etc. was added to it besides a number of cross tables being picked up from various series of Census tables. Till date it is regarded as a model district census handbook. In 1971 the District Census handbook was divided into Part A relating to village and town directory, part B containing village and townwise primary census abstract and Part C
, reported on the administrative aspect and census tables based on PCA etc. For the state of Maharashtra only Part A and Part B were published. The 1981 Census again saw the scope of it increasing to contain the data on literacy rate, primary health centers etc. It was published as Part, A and Part, B and the same pattern has again been followed in 1991. However, in 1991 some of the non- Census data include information on girl schools, social forestry areas etc. which is provided in a separate Appendix, whereas items like staple food and information on newspapers etc. have been omitted. The non-census information collected at the village level or town level by the Tahsildar/Chief Officer was scrutinized and verified in each district by the District Planning Officer. The Collectors were also requested to once again
Source : History - District Gazetteer, Osmanabad.
verify in case serious discrepanci'es were observed. Besides this, the non-census informations was cross-checked with the parent department, for e.g. information as electricity was cross checked with Maharastra State Electricity Board, that on roads with Public Works Department, on health with the Directorate of Health and so on. It is felt that because of this extra validation, infor!llation' provided in the 1991 DCHB should become more reliable and can be used without any hitch by scholars and planners alike. A number of new tables based on PCA are also included and an effort, has also been made to correlate the data with geography of the tahsil. Theses endeavors should make the District Census Handbook definitely more useful than ever before.
1.3 . The Village and Town Directory as also the Primary Census Abstract included in this ~andbook ~hould. quench the thirst .of ~e planners mvolved m mIcro level plannmg. Similarly, additional data revealing Civic and other amenities in class I and class II towns is oriented to "minimum need programme" especially in respect of slumdwellers. Scholars and planners alike should benefit from the data on amenities by size of the town.
Brief History Of the District .
1.4 The old name of the Osmanabad district was Dharasiva. During the age of the Stavahanas, Osmanabad district seems to have been very prosperous. Tagara, modern Ter, is mentioned in the Periplus of the Erythrean Sea as one of the two pre-eminent trading centers, the other being Pratisthana, modern Paithan in the Aurangabad district. From there, various kinds of merchandise were taken to Barygaza (modern Broach) by wagon loads - from Paithan, a great quantity of onyx-stone and from Tagara, a plentiful supply of fine linen cloth, and all kinds of muslins and mallow-coloured stuffs and several other kinds of merchandise , pertaining to various places, which were taken thither from districts bordering on the sea.
1.5 In 1317, the Kingdom of the Yadavas finally passed into the hands of the Sultans of Delhi. The Deccan now began to be ruled by the Governors appointed from Delhi. The district of Osmanabad thus for the first time passed under Muhammedans. Under the Moghals, the Deccan
was divided into six Subhas viz. Khandes, Berar, Aurangabad, Bidar, Bijapur and Hyderabad. The present district of Osmanabad which was roughly divided into two districts viz. Paranda and Naldurg then formed part of Aurangabad and Bijapur Subhas. In 1722, Nizam-UI-Mulk was appointed as the Vazir of Moghal empire, but he soon got tired of the court intrigues and returned to the Deccan in the following year. The emperor ordered the Subhedar of Hyderabad, Mubariz Khan to oppose him. A battle was fought at Fatehkharda in October 1724 in which the Nizam emerged victorious. This battle established the independence of the Nizam-Ul-Mulk. Osmanabad district thus after a century of direct rule by the Delhi Emperors passed under the Nizam's sovereignty.
1.6 The district was temporarily ceded to the British Government in 1853 and it was reverted to Hyderabad State in the year 1860, with its headquarters at Naldurg. The district waSt-known as Naldurg district till 1904. Naldurg district was subsequently abolished and new district of Osmanabad was carved out with headquarters at Osmanabad. 1905 witnessed the abolition of 2 tahsils ~ith their headquarters at Wasi and N aldurg. The former was merged in Kalamb and latter in Tuljapur.
1. 7 Among the Marathwada region,
12
from the district to Solapur. With the reorganisation of States, the district became a part of Bombay State in 1956. Three tahsils viz. Ahmadpur, Nilanga and Udgir were transferred from the neighbouring Bidar district (Karnataka) to Osmanabad district. In 1960, Bombay state was bifurcated into Maharashtra and Gujarat and Osmanabad became an intergral part of Maharashtra state. Since then the district had 11 tahsils and 13 towns upto 1981. Due to administrative reasons, Osmanabad district was bifurcated into two district on 16 August, 1982. The newly formed Latur district has 5 tahsils and 5 towns, while Osmanabad district has 6 tahsils and 8 towns.
2. ADMINISTRATIVE SET-UP I
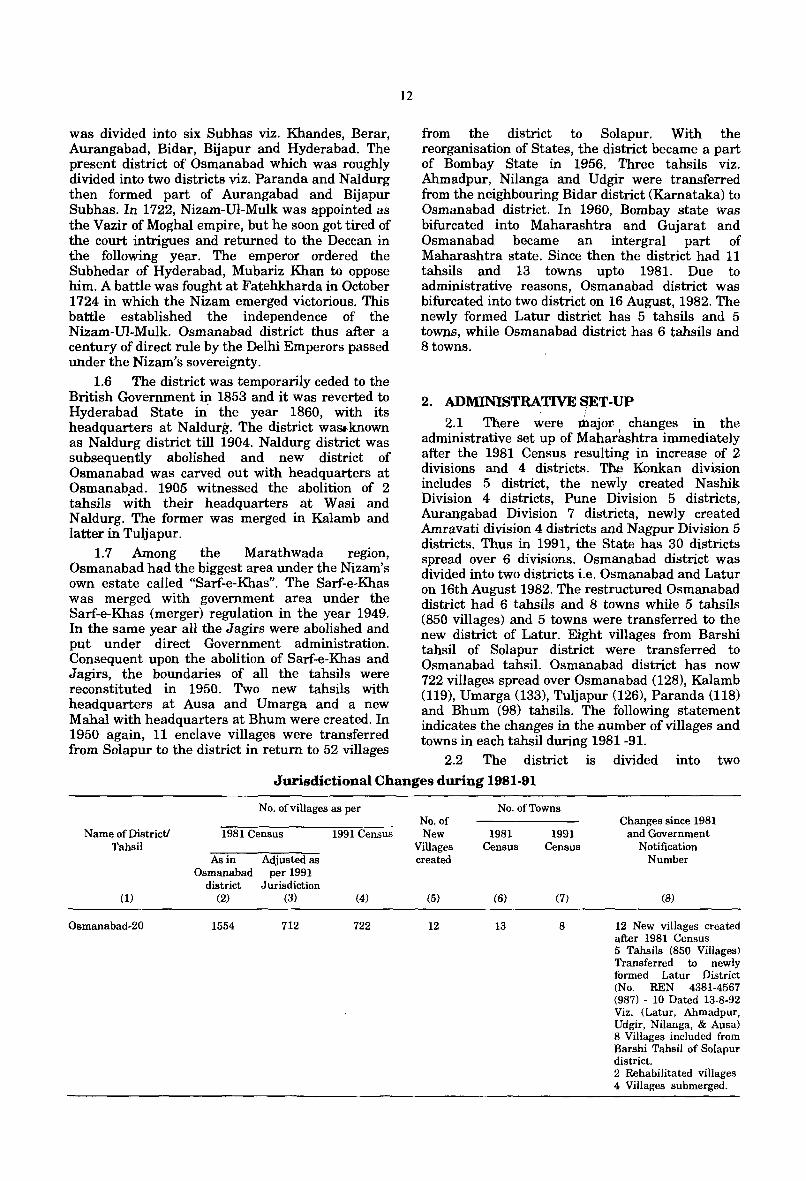
2.1 There were major changes in the administrative set up of Maharashtra immediately after the 1981 Census resulting in increase of 2 divisions and 4 districts. The Konkan division includes 5 district, the newly created N ashik Division 4 distri,cts, Pune Division 5 districts, Aurangabad Division 7 districta, newly created Amravati division 4 districts and Nagpur Division 5 districts. Thus in 1991, the State has 30 districts spread over 6 divisions. Osmanabad district was divided into two districts i.e. Osmanabad and Latur on 16th August 1982. The restructured Osmanabad district had 6 tahsils and 8 towns while 5 tahsils (850 villages) and 5 towns were transferred to the new district of Latur. Eight villages from Barshi tahsil of Solapur district were transferred to Osmanabad tahsil. Osmanabad district has now 722 villages spread over Osmanabad (128), Kalamb (119), Umarga (133), Tuljapur (126), Paranda (118) and Bhum (98) tahsils. The following statement indicates the changes in the number of villages and towns in each tahsil during 1981-91.
Osmanabad had the biggest area under the Nizam's own estate called "Sarf-e-Khas". The Sarf-e-Khas was merged with government area under the Sarf-e-Khas (merger) regulation in the year 1949. In the same year all the Jagirs were abolished and put under direct Government administration. Consequent upon the abolition of Sarf-e-Khas and Jagirs, the boundaries of all the tahsils were reconstituted in 1950. Two new tahsils with headquarters at Ausa and Umarga and a new Mahal with headquarters at Bhum were created. In 1950 again, 11 enclave villages were transferred from Solapur to the district in return to 52 villages
2.2 The district is divided into two
Jurisdictional Changes during 1981-91
Name of Districtl Tahsil
(1)
Osmanabad-20
No. of villages as per
1981 Census 1991 Census
As in Adjusted as Osmanabad per 1991
district Jurisdiction (2) (3) (4)
1554 712 722
No. of New
Villages created
(5)
12
No. of Towns
1981 1991 Census Census
(6) (7)
13 8
Changes since 1981 and Government
Notification Number
(8)
12 New villages created after 1981 Census 5 Tahsils (850 Villages) Transferred to newly formed Latur District (No. REN 4381-4567 (987) - 10 Dated 13-8-92 Viz. (Latur, Ahmadpur, Udgir, Nilanga, & Ausa) 8 Villages included from Barshi Tahsil of Solapur district. 2 Rehabilitated villages 4 Villages submerged.
13
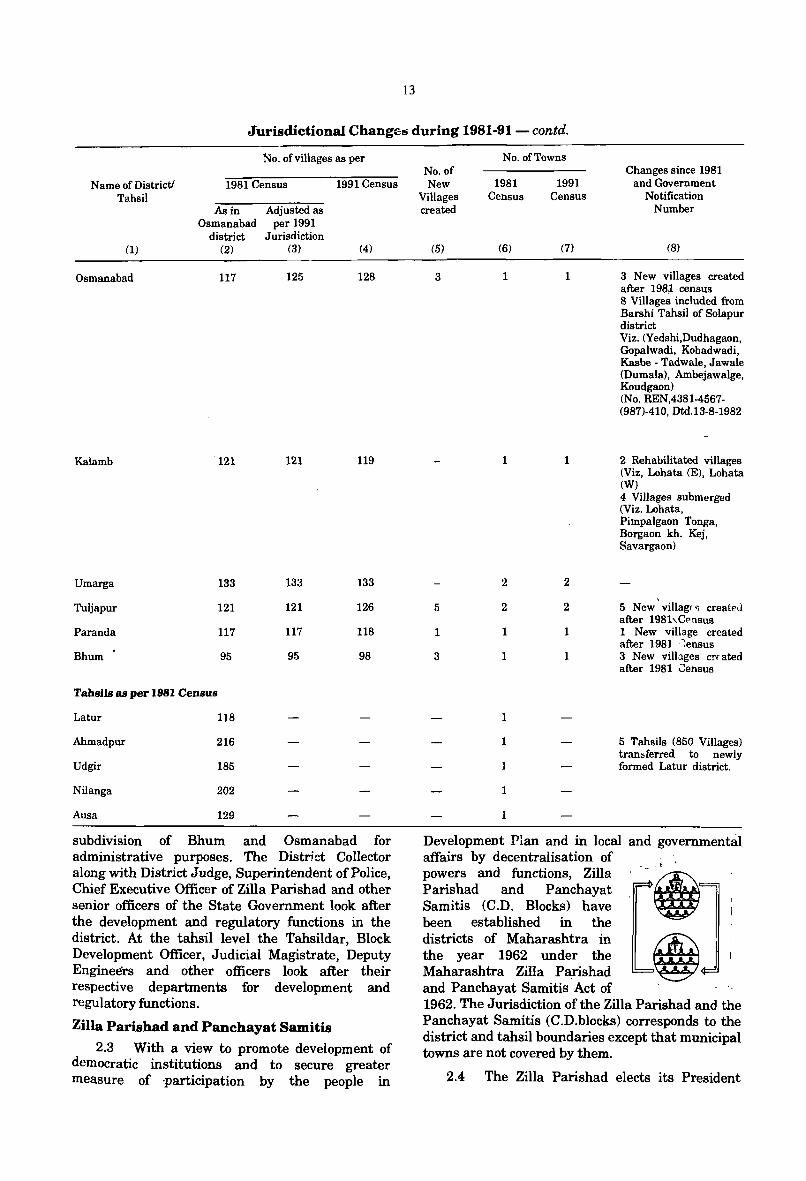
Jurisdictional Changel!i during 1981·91 - contd.
No. of villages as per
Name of DistrictJ Tahsil
(1)
Osmanabad
Kaiamb
Umarga
Tuljapur
Paranda
Bhum
1981 Census
As in Adjusted as Osmanabad per 1991
district Jurisdiction (2) (3)
117 125
121 121
133 133
121 121
117 117
95 95
Tahsils as per 1981 Census
Latur 118
Ahmadpur 216
Udgir 185
Nilanga 202
Ausa 129
1991 Census
(4)
128
119
133
126
118
98
subdivision of Bhum and Osmanabad for administrative purposes. The District Collector along with District Judge, Superintendent of Police, Chief Executive Officer of Zilla Parishad and other senior officers of the State Government look after the development and regulatory functions in the district. At the tahsil level the Tahsildar, Block Development Officer, Judicial Magistrate, Deputy Engineers and other officers look after their respective departments for development and regulatory functions.
Zilla Parishad and Pancbayat Samitis
2.3 With a view to promote development of democratic institutions and to secure greater measure of ·participation by the people in
No. of Towns No. of New 1981 1991
Villages Census Census created
(5) (6) (7)
3 1 1
1 1
2 2
5 2 2
1 1 1
3 1 1
1
1
1
1
Changes since 1981 and Government
Notification Number
(8)
3 New villages created after 198~ census 8 Villages included from Barshi Tahsil of SoIapur district Viz. (Yedshi,Dudhagaon, Gopalwadi, Kobadwadi, Kasbe - Tadwale, Jawale (Dumala), Ambejawalge, Koudgaon) (No. REN,4381-4567-(987)-410, Dtd.13-8-1982
2 Rehabilitated villages (Viz, Lohata (E), Lohata (W) 4 Villages submerged (Viz. Lohata, Pimpalgaon Tonga, Borgaon kh. Kej, Savargaon)
5 New' villag. ~ createJ after 1981,Cpnsus 1 New village created after 1981 . ;ensus 3 New vilbges crr ated after 1981 Census
5 Tahsils (850 Villages) transferred to newly formed Latur district.
Development Plan and in local and governmental affairs by decentralisation of powers and functions, Zilla Parishad and Panchayat Samitis (C.D. Blocks) have been established in the districts of Maharashtra in the year 1962 under the Maharashtra Zilla Parishad and Panchayat Samitis Act of
. t - '
1962. The Jurisdiction of the Zilla Parishad and the Panchayat Samitis (C.D.blocks) corresponds to the district and tahsil boundaries except that municipal towns are not covered by them.
2.4 The Zilla Parishad elects its President
and Vice-President and Chairmen of its committees from amongst the elected. councillors. The term of office of the councillors is five years. An officer in the senior scale of LA.S. is deputed by the State Government as the Chief Executive Officer to the Zilla Parishad. The Parishad is also assisted by various departments and the heads of those departments at the district level are Officers of Class I or II Service under the State Government. At the Block level, the Panchayat Samitis (C.D.blocks) have an elected Chairman and Deputy Chairman. The Block Development Officer works as Secretary to the Panchayat Samiti (C.D.blocks). ~he Exe~utive authority for the purpose of carrying out the provisions of the Maharashtra Zilla Parishad and Panchayat Samitis (C.D. Blocks) Act vests in the Chief Executive Officer and the Block Development Officers. The Deputy Chief Executive Officer works as a Secretary of the General body of the Zilla Parishad.
Urban Local Bodies 2.5 The statutory Urban local bodies are
cantonments, municipalities or municipal corporations. The urban local bodies elect a councillor from each of the wards and his term is 5 years. The President of the Municipal Council or the Mayor of the Corporation as also his Deputy are elected from amongst elected councillors and their term is for one year. The Chairman of various· committees are also elected from amongst the elected councillors with a term of one year. Although for day to day administration the Chief Officer is responsible in a municipal council, he works under the administrative control of the President of Municipal Council. In Corporations, a senior lAS Officer is deputed by the State Government as Municipal Commissioner who is responsible for day to day administration and the executive authority lies in him.
3. LOCATION, SIZE, RELIEF DRAINAGE . AND CROPPING PA'M'ERN
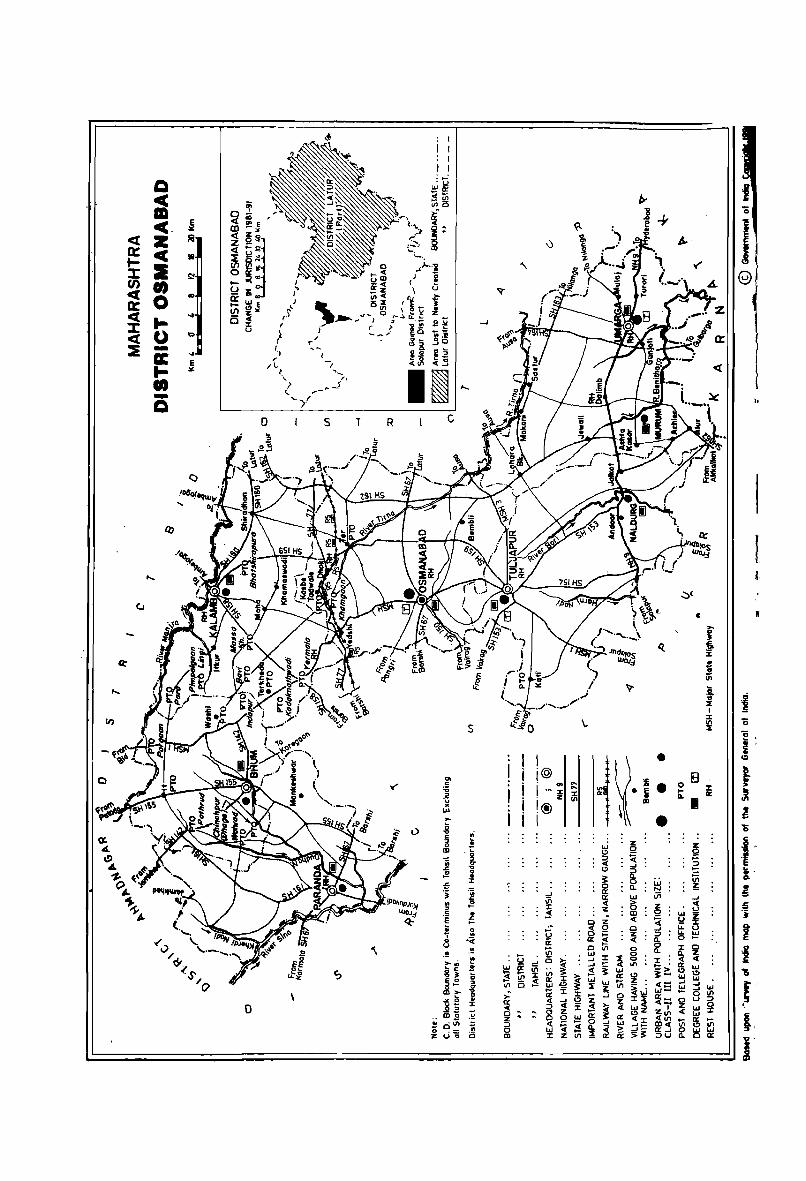
3.1 Osmanabad district is situated between 17"37' and 1&°42' north latitude and 75°17' and 76° 4 7' east longtitude. It is surrounded by Bid district in the North, Latur district in the East, Karnataka State in the South East, Solapur district in the South West and Ahmadnagar district in the North West.
3.2 Osmanabad district has ah area of 7,569 sq.kms. and a population of 1,276,327 as per the 1991 Census. The headquarters of the district is located at Osmanabad, a town with a population of 68,019 as per the 1991 Census. The nearest railway
14
station is Yedsi, about 18 kms. to the North, on the Latur-Kurduwadi route. The district accounts for 2.46 per cent of the area of the State and 1.62 per cent of the popUlation. It ranks 25 in terms of area and 27 in terms of popUlation amongst the 30 districts of the State.
3.3 Most of the district lies on the Balaghat plateau. The plateau region rises rather steeply from the plains in the west and slopes gently towards the east. It is narrow and high in the North West but broader and lower in the South East. The interfluves between the streams are rocky with poor stony soils and are mostly barren. The valleys of the streams have better soils and rabi wheat and jowar are grown.
3.4 The western bulge consisting of Paranda tahsil and the western' part of Bhum belong to the Sina drainage. This region lis characterised by sharp relief and innumerable sma\! streams with rugged interfluves in betwe~n. The valleys have fertile soils and abundant ground water supplies. The innumerable streams crossing 'this region have enabled the execution of several minor irrigation worked but have hindered the development of good
\ roads.
3.5 Except for the Manjra and the Terna rivers which flow westward and belong to 'the Godl:!.vari drainage system the rest of the district is drained by tributaries of the Bhima drainage system of which the Sina is the most important.
3.6 The Sina river, a major tributary of the Bhima river, rises in Ahmadnagar district and runs in a South Easternly direction along the western district boundary. It receives a number of more or less parallel streams flowing in a south or South Westernly direction. The important amongst these are the Kheri, the Nalli and the Dudhna.
3.7 'The Benithora, a tributary of the Bhima rises on the slopes of Deobet hill within the district. About 4 kms. south of Murum it turns east and receives a number of tributaries like Ganjoti and Umarga nalas. It then turns south and flows outside the district. The Manjra river rises near the northern edge of the Balaghat plateau in Bid district. It forms a part of the northern district boundary of Osmanabad.
Climate
3.8 The climate of the district is generally dry except during the monsoon season. The year may be divided into four seasons. The , \ \- \
\ • II .' cold .season from \\ \ \ \ \ \ \ \ \ . December to about \ \ \ ,~ the middle of February is followed by the hot season which lasts till the end of May. June to September
is the South West monsoon and October to November the postmonsoon or retreating monsoon season.
3.9 The average mannual rainfall in the district is about 800 mm., however, this is not evenly distributed. In general, the rainfall increases as one proceeds towards North East. About 84 per cent of the annual rainfall in the district is received during the South West monsoon season. The variation in the annual rainfall from year to year is large.
3.10 Towards the end of November temperatures begin to fall rapidly. December is the coldest month of the year with the mean daily minimum temperature at about 15°C. Occasionally the minimum temperature may drop to about 4°C or 5°C. From about the middle of February temperatures begin to rise. May is generally the hottest month of the year with the mean daily maximum temperature at about 40°C. The heat during the summer is intense and maximum temperature may rise to 45°C. With the onset of the South West monsoons there is an appreciable drop in the day temperature. With the withdrawal of the monsoon· day temperatures increase slightly while night temperatures progressively decline.
3.11 Except during the South West monsoon season, the air is generally dry particularly in the afternoons. Skies are mostly clear or lightly clouded. During the South West monsoon season the skies are heavily clouded to overcast.
3.12 Winds are light but increase in the force during the latter half of summer and in the South West monsoon season. Dust storms occur in summer while thunderstorms occur in the summer and monsoon seasons.
Soils and Cropping Pattern
3.13 The soils of the district are essentially derived from the Deccan Trap which is the predominant rock formation of the district. The cropping pattern is strongly influenced by the climate and the total quantity and distribution of rainfall.
3.14 The soils of the district can broadly be classified into four groups viz. shallow soils (0"9"), medium soils (9"18"), medium deep soils (18"36") and deep soils (above 36").
ShallOW Soils
3.15 Small patches of shallow occur in the western and North Western parts of the district. These soils are light brown to dark grey in colour . They are loamy to clay loam in texture and granular to sub angular blocky in structure. The soils tends to be alkaline in reaction and deficient in nitrogen and organic matter.
15
Medium Soils
3.16 Medium soils are found in part of Bhum, Kalamb and Osmanabad tahsils. They are dark brown to dark grey brown in colour. These soils are sub angular blocky to blocky in structure. The soils are alkaline in reaction. They have a fair amount of phosphate but are deficient in nitrogen.
Medium and Deep Soils
3.17 Deep soils occur in patches in Tuljapur tahsil. The colour of these soils vary from dark grey brown to vary dark grey. They are clayey in texture and sub angular blocky to blocky in structure. The soils 'lre alkaline in reaction and total soluble salt are fairly high.
4. NATURAL WEALTH
Minerals
4.1 The district as a whole is monotonously covered by Deccan Trap basaltic lava flows whIch are spread out in the form of horizontal sheets or beds. Trap rocks are generally barren of any economically useful and important minerals but being hard, dense and durable are most suitable for building purposes.
Fisheries
4.2 Osmanabad district is not rich in fisheries as it is not richly endowed with fluvial waters. However, reservoirs built for, irrigation purposes have enhanced the prospects of fisheries.There are very few fishermen and £hey are. mainly from the Dheemer, Kahar, Bhoi and Koli communities. Fishing is generally done by cast, gill, or drag nets besides hook and line. Fast growing varieties of fish viz. Rohu, Catla and Mrigal are partly imported from Calcutta and are stocked in reservoirs, tanks and privately owned ponds.
5. BRIEF NOTE ON CENSUS
5.1 Census -taking is a massive operation carried out in a short span of time with the active participation of a veritable army of enumerators. The reference moment for the 1991 Census is the sunrise of March 1, 1991. i.e., the census provides a snap -shot of the population of the country as it existed at the sunrise of March 1, 1991. Actual enumeration was spread over a period of 20 days from 9.2.91 to 28.2.91 followed by a revisional round upto 5.3.91 for updating of the population figures with reference to the sunrise of March 1, 1991. Individual slip having 23 questions for every person was canvassed by the enumerator along with the household schedule. With a view to ensuring uniformity in approach in understanding the various concepts and in properly eliciting and recording of the information, the enumerators and supervisory officers were imparted both theoretical and practical training intensively for a total of 6 days in 3 rounds.
5.2 Ai:, a prelude to the actual census the urban and rural areas were identified and listed out in respect of each administrative unit. The Directors of Census Operations had prepared the list of urban areas (which is generally referred to as town list) and simultaneously, a list of villages. These lists formed the basic frame for the organisation of the census operations. Thereafter, geographical areas that could be conveniently covered by each census enumerator were carefully carved out to constitute the enumerator's block.
5.3 The second major step, was the houselisting operation which was carried out in the State during May-June 1990. Thereafter, in order to adhere to the prescribed work-load norms the actual census enumerator's blocks were carefully demarcated on the basis of the houselist population and the lay-out sketches and notional maps prepared for the houselisting operation. Houselisting operation was also utilised to collect wealth of information on items such as predominant, construction material used for houses, amentities available to the census households, number ofliving rooms etc.
5.4 Houselisting operation was, also, combined, with economic census and accordingly 'enterprise list' developed by the Central Statistical Organisation was canvassed along with the houselist. The enterprise lists so canvassed have been handed over to the Central Statistical Organisation and presentation of data is being done by that Organisation.
Census Concepts
Building
5.5 A building is generally a single structure on the ground .. Sometimes it is mad~ up of more than one component units which are used or likely to be used as dwellings (residences) or establishments such as shops, b~~iness houses, offices, factories, worksheds, schools, places of entertainment, places of worship, godowns, stores etc. It is also possible that buildings which have component units may be used for a combination of purposes such as shop-cum-residence, workshop-cum-residence, office-cum- residence etc.
Census Houses and Households
5.6 According to Indian Census, 'Census house' is a building or part of a building having a separate main entrance from the road or common courtyard or staircase etc. used or recognised as a separate unit. It may be occupied or vacant. It may be used for a residential or non- residential purpose or both. A 'household' is a group of persons who commonly live together and would take their meals from a common kitchen, unless the exigencies of work prevented them from doing so. A 'household' may be of persons related by blood or unrelated
16
person or having a mix of both. There may be single member or more than one member households. Households of only unrelated persons termed as institutional households include boarding, houses, messes, hostels, residential hostels, rescue homes, jails, ashrams, etc.
5.7 Houseless population or houseless households include persons who do not· have any shelter. They just live on street, pavements or in open spaces like gardens, railway platforms etc. without erecting huts or any other structures.
5.8 Total number of houses and households in Osmanabad district are 230,029 and 233,003 respectiveJy Among the 6 tahsils of the district, Osmanabad tahsil tops in respect of number of houses (53,936) and households (54,450). Total number of house less and institutional households in the district are 1,770 and 181 respectively. Average size of households in i the district is 5.5 corresponding to 5.1 in the! State.
Housing Data
5.9 In Osmanabad distri~t, 79.24 per cent of all the houses are used as dwellings (including partially residential houses), 7.42 l?er cent as 'other non residential houses', 6.44 per dmt are reported to be vacant and the remaining 6.90 per cent are used as shops, hotels, business houses, factories,
. places of worship and schools etc. In rural areas of the district, 79.84 per cent of the houses are used as dwellings (including partially residential houses), 8.13 per cent as 'other non tesidential' houses, 6.22 per cent of the houses are reported as vacant and the remaining 5.81 per cent are used as shops, hotels, business houses, factories and places of worship etc. In urban areas, the corresponding figures are 75.79 per cent (including partially residential), 3.35 per cent 7.65 per cent and 13.21 per cent. The percentage of census houses accommodating hotels, shops (including sweetmeat shops and restaurants), business houses, faJ:!tories and places of entertainment and worship is significantly higher in urban areas (13.21) than in rural areas (5.81). Electricity and toilet facilities
5.10 Electricity is available for 46.45 per cent of the total households in the district and the population covered is 48.40 per cent. 89.26 per cent of the popUlation who enjoy this facility live in owned houses and 9.09 per cent live in r,ented houses. Similarly toilet facility is available to only 5.74 per cent of the households covering 5.60 per cent of the population. 58.93 per cent of the population having toilet facility live in owned houses while 37.50 per cent live in rented hou~es. In urban areas, electricity is available to 70.23 per cent of the households covering 71.20 per cent of the population. 66.43 per cent of the population having this facility live in owned houses and 30.76 per cent live in rented houses. Toilet facility is available to 31.67 per cent of the households and the population
served by this facility is 31.30 per cent. 5.11 In rural areas, electricity is available to
42,52 per cent of the households and 44.70 per cent of the population is served by electricity. 95.08 per cent of the population having this facility live in owned houses and 3.36 per cent live in rented houses. Toilet facility is available to only 1.45 per cent of the households and the population served is 1.40 per cent. It is seen that the proportion of population having electricity facility and owning houses is substantially higher in rural areas compared to urban areas, whereas the latter are much better placed in the overall availability of both electricity and toilet facilities.
'* Rural and Urban Areas
5.12 One of the basic characteristics of the population obtained through the census is the rural-urban distribution of the people. For the purpose of maintenance· of comparability and for administrative convenience, the detlnition of urban unit which was adopted for 1981 census has been continued in 1991 census also. The census defines a place as 'urban' if it has a municipality or a cantonment board already constituted for it, irrespective of population, and if it does not have a civic body already constituted, then:
(1) if it is expected to attain a population of at least 5,000 at the ensuing census;
(2) if the density of population is expected to reach a figure of 400 per sq.km.;
(3) if at the immediately preceding census, at least three-fourths of its male working population was engaged in non-agricultural pursuits.
It may be noted that the classification of places as 'urban' or 'rural' for purpose of a census is made in advance of the launching of that census. Once the classification is made on the expectation, it sticks even though the expectations may not be fulfilled.
5.13 In addition, the Directors of Census Operations, in consultation with Registrar General's office, were also permitted to classify marginal cases as urban units, taking into consideration the local circumstances. Such marginal cases which could have qualified as urban units would include major project colonies, new areas of intensive industrial development, railways colonies and important tourist centers, etc. Urban Agglomeration
5.14 As in 1971 the concept of urban agglomeration has been adopted for 1981 and 1991 censuses too. An urban agglomeration may constitute:
3-11
(a) A city with contiguous outgrowth (the part of the outgrowth being outside the statutory limits but falling within the boundaries of adjoining village or villages);
17
(b) One town with similar outgrowth or two or more adjoining towns with their outgrowths as in (a); or
(c) A city and one or more adjoining towns with their outgrowths all of which fonns a continuous spread.
Osmanabad district has no urban agglomeration.
Standard Urban Area
5.15 Standard Urban Area (S.U.A.) concept introduced in 1971, has been followed in 1981 and 1991, The essential requirements for the constitution ofS.U.A. are:
(i) It should have a core town or a minimum population of 50,000;
(ii) The contiguous areas made up of other urban as well as rural administrative units should have mutual socio-economic links with the core town; and -
(Hi) In all probability this entire area should get fully urbanised within a span of two or three decades.
There is no standard urban area is Osmanabad district.
5.16 The basic unit for rural area is a revenue village. A 'village' may be def1ned as a stat~tory recognised unit having definite bo~dary and separate land records. 6. 1991 CENSUS FINDINGS· POPULATION,
ITS DISTRmUTION
Distribution of population in rural and urban areas
6.1 According to the 1991 Census the total population of Osmanabad district stands at 12,76327 with 658,896 males and 617,431 females constituting 1.62 per cent of State's population and spread over 2.46 per cent of its area. Among the 6 tahsils of district, Osmanabad tahsil (296,892) is the most populous and Bhum tahsil (124,094) the least. Other tahsils in order of their size of population are (1) Kalamb (208,265), (2) Umarga (288,297). (3) Tuljapur (218,741) and (4) Paranda (140,038).
6.2 Out of the total 12,76,327 population of the district, 10,82,447 persons (84.81%) are residing in rural areas and remaining 193,880 persons (15.19%) are residing in urban areas. Thus, whereas in Maharashtra State 38.69 per cent of the total population is urban, in Osmanabad district, only 15.19 per cent of the total population is urban. The average number of towns per hundred inhabited villages is often considered as an index of urbanisation. In Osmanabad district, there are 1.12 towns for every hundred inhabited villages. Osmanabad district is thus one of the less urbanised districts in the State. (Table 1).
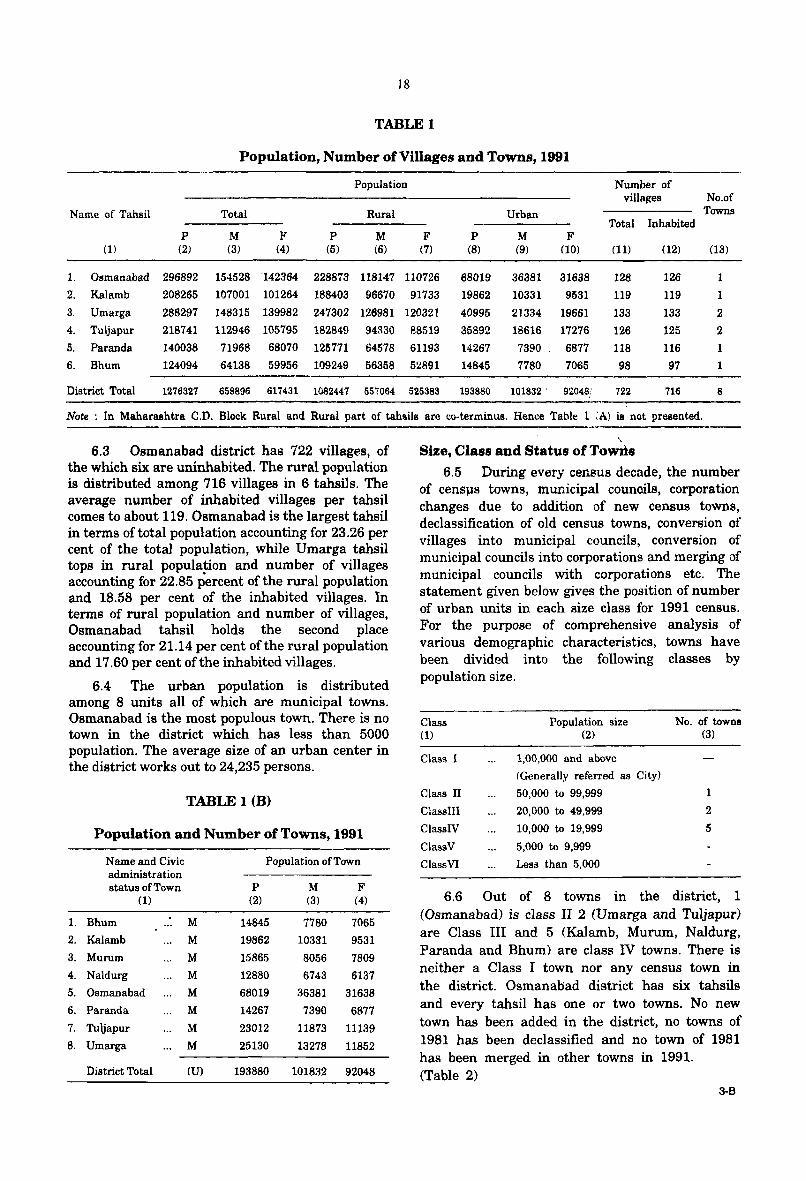
18
TABLE 1
Population, Number of Villages and Towns, 1991
Population Number of villages No.of
Name of Tahsil Total Rural Urban Towns Total Inhabited
P M F P M F P M F (1) (2) (3) (4) (5) (6) (7) (8) (9) (10) (11) (12) (13)
l. Osmanabad 296892 154528 142364 228873 118147 110726 68019 36381 31638 128 126 1
2. Kalamb 208265 107001 101264 188403 96670 91733 19862 10331 9531 119 119 1
3. Umarga 288297 148315 139982 247302 126981 120321 40995 21334 19661 133 133 2 4. Tuljapur 218741 112946 105795 182849 94330 88519 35892 18616 17276 126 125 2 5. Paranda 140038 71968 68070 125771 64578 61193 14267 7390 6877 118 116 1 6. Bhum 124094 64138 59956 109249 56358 52891 14845 7780 7065 98 97 1
District Total 1276327 658896 617431 1082447 557064 525383 193880 101832 92048/ 722 716 8
Note: In Maharashtra C.D. Block Rural and Rural part of tah,ils are co-terminus. Hence. Table 1 ;A) is' not presented.
6.3 Osmanabad district has 722 villages, of the which six are uninhabited. The rural population is distributed among 716 villages in 6 tahsils. The average number of inhabited villages per tahsil comes to about 119. Osmanabad is the largest tahsil in terms of tot a} population accounting for 23.26 per cent of the total population, while Umarga tahsil tops in rural popula~ion and number of villages accounting for 22.85 percent of the rural popUlation and 18.58 per cent of the inhabited villages. In terms of rural population and number of villages, Osmanabad tahsil holds the second place accounting for 21.14 per cent ofthe rural population and 17.60 per cent of the inhabited villages.
6.4 The urban population is distributed among 8 units all of which are municipal towns. Osmanabad is the most populous town. There is no town in the district which has less than 5000 population. The average size of an urban center in the district works out to 24,235 persons.
TABLE 1 (B)
Population and Number of Towns, 1991
Name and Civic Population of Town administration status of Town P M F
(1) (2) (3) (4)
1. Bhum M 14845 7780 7065 2. Kalamb M 19862 10331 9531
3. Murum M 15865 8056 7809 4. Naldurg M 12880 6743 6137 5. Osmanabad M 68019 36381 31638 6. Paranda M 14267 7390 6877 7. Tuljapur M 23012 11873 11139 8. Umarga M 25130 13278 11852
District Total (U) 193880 101832 92048
Size, Class and Status of TO~8 6.5 During every census decade, the number
of censps towns, municipal counoils, corporation changes due to addition of new census towns, declassification of old census towns, conversion of villages into municipal councils, conversion of municipal councils into corporations and merging of municipal councils with corporations etc. The statement given below gives the position of number of urban units in each size class for 1991 census. For the purpose of comprehensive analysis of various demographic characteristics, towns have been divided into the following classes by population size.
Class (1)
Class I
Class II
CJasslII
Class IV
ClassY
ClassVl
PopUlation size (2)
1,00,000 and above
(Generally referred as City)
50,000 to 99,999
20,000 to 49,999
10,000 to 19,999
5,000 to 9,999
Less than 5.000
No. of towns (3)
1
2
5
6.6 Out of 8 towns in the district, 1 (Osmanabad) is class II 2 (Umarga and Tuljapur) are Class III and 5 (Kalamb, Murum, Naldurg, Paranda and Bhum) are class IV towns. There is neither a Class I town nor any census town in the district. Osmanabad district has six tahsils and every tahsil has one or two towns. No new town has been added in the district, no towns of 1981 has been declassified and no town of 1981 has been merged in other towns in 1991. (Table 2)
3-B
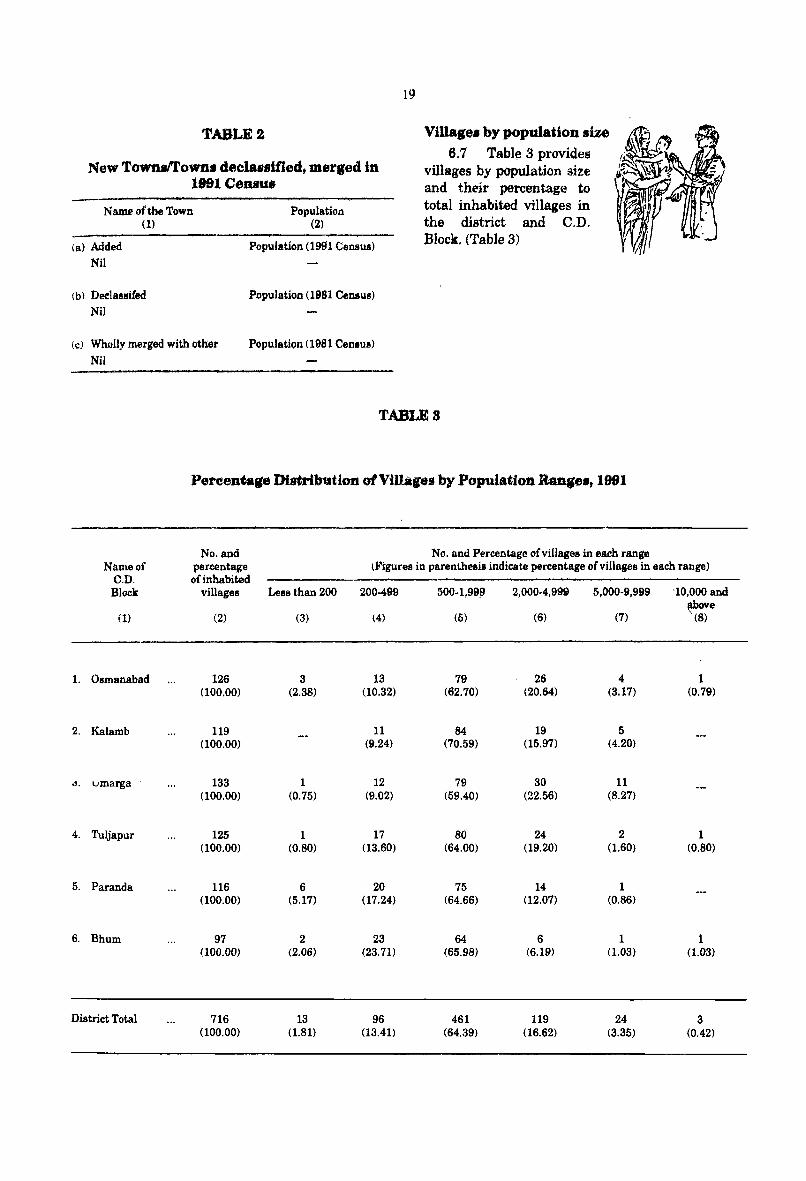
TABLE!
New TownslTowna declassitled, mer,ed in 1991 Censu&
Name of the Town (1)
(a) Added Nil
(b) Declassi(ed
Nil
(cJ Wholly merged with other
Nil
Population (2)
Population (1991 Census)
Population (1981 Census)
Population (1981 Cenlus)
19
Tabl(! 3 provides villages by population size and their percentage to total inhabited villages in the district and C.D. Block. (Table 3)
TABLE 8
Percentage Di8iribution ofViIla,ctJ by Population Ran,s., 1991
No. and No. and Percentage of village a in each range Name of percentage (Jo'igurea in parenthesis indicate percentage ofvillages in each range)
C.D. Block
(1)
1. Osmanabad
2. Kalamb
.,. umarga
4. Tuljapur
5. Paranda
6. Bhum
District Total
of inhabited villages
(2)
126 (l00.00)
119 (l00.00)
133 (100.00)
125 (l00.00)
116 (l00.00)
97 (100.00)
716 (100.00)
Less than 200
(3)
3 (2.38)
1 (0.75)
1 (0.80)
6 (5.17)
2 (2.06)
13 (1.81)
200-499
(4)
13 (10.32)
11 (9.24)
12 (9.02)
17 (13.60)
20 (17.24)
23 (23.71)
96 (13.41)
500-1,99~
(5)
79 (62.70)
84 (70.59)
79 (59.40)
80 (64.00)
75 (64.66)
64 (65.98)
461 (64.39)
2,000-4,999
(6)
26 (20.64)
19 (15.97)
30 (22.56)
24 (19.20)
14 (12.07)
6 (6.19)
119 (16.62)
5,000-9,999
(7)
4 (3.17)
5 (4.20)
11 (8.27)
2 (1.60)
1 (0.86)
1 (1.03)
24 (3.35)
'10,000 and ~bove
(8)
1 (0.79)
1 (0.80)
i (1.03)
3 (0.42)

6.8 In Osmanabad district, un an average village has population of 1,512 persons and·10.51 sq. km. of area. Of the 716 inhabited villages, 13 (1.82%) are small sized with population below 200, 96 (13.41%) are in the size class 200-499, 461 (64.39%) in the. size class 500-1999, 119 (16,62%) in the size class 2000-4999, 24 (3.35%) in the size class 5000-9999 and remaining 3 (0.42%) are in the size class 10,000+. For a broader generalisation, villages have been further grouped as small sized (below 500) medium sized (500-1999), large sized (2000-4999) and exceptionally large sized (5000+). Within the district, small sized villages of less than 500 inhabitant together account for 15.22 per cent of the total inhabited villages with 3.54 per cent of the rural population in the district, medium sized (500-1999) 64.39 per cent of the total inhabited villages and 46.84 per cent of the rural population, large sized (200-4999) 16.62 per cent of the total
20
of large and exceptionally large villages, the percentage has gone up from 110 (15.63%) in 1981 to 146 (20.39%) in 1991.
,;- #" • ,
6.10 Within the ~ix t8heils of the district, percentages of small sized (less than 500) villages is the highest in Bhum tahsil (25.77%) and the lowest in Kalamb tahsil (9.~4%). The percentage of medium sized (500-1999) villages is the highest in Kalamb tahsil (70.59%) and the lowest in Umarga tahsil (59.40%). The percentage of large sized (2000-4999) villages is the highest m Umarga tahsil (22.56%) and lowest in Bhum tahsil (6.19%). There are 27 exceptionally large sized villages (5000 and above). 'They are found in Umarga tahsil (11), Osmanabad tahsil (5), Kalamb tahsil (5), Tuljapur tahsil (3), Bhum tahsil (2), and Paranda tahsil (1).
7. POPULATION GROWTH. DENSITY AND SEX RATIO :'
inhabited villages and 31.81 per cent of the rural Population Growth population and exceptionally large sized (5000+) 7.1 According to the 198i\Census, the total 3.77 per cent of the to~al inhabited· village.s and ''POPulation of the district was 1,029,702. During the 17.81 per cent of the rural population. 1981-91 decade there has been llet addition of
6.9 A size groupwise distribution of the 2,46,625 persons. The decadal growth rate of the inhabited villages highlights the predominance of district which works out to 23.95 per cent is lower small and medium sized units. Small sized villages as compared to the corresponding growth rate of ofless than 500 inhabitants accounts for 15.22 per Maharashtra State (25.73%). All the six tahsils of cent as compared to 20.17 per cent in 1981 adjusted the district have shown positive growth rate during to 1991 jUrisdiction. There is, thus, decrease in the 1981-91. Among them Tuljapur tahsil has recorded number of smaller units. This may be due to the highest growth rate of 27.13 per cent, while upgrading of a number of villages from this Kalamb has shown the lowest growth rate of 18.88 category to the medium sized category. The per cent. The rate of growth in Osmanabad, proportion of medium sized villages having 500 to Umarga and Tuljapur are above the district 1,999 inhabitants being as high as 64.39 per cent average (23.95%). The remaining tahsils have has slightly increased from the corresponding growth rates below the district average. The growth proportion of 64.20 per cent in 1981. This is rates for the district and tahsils for total, rural and possibly due to shifting of a few villages from small urban areas and percentage of urban population t~ sized class of less than 500 population. In the class total population are given in Table 4.
Table 4
Decadal Change in Distribution of Population
Population Percentage decad~l Percentage Variation Of Urban
Name of Tahsil 1981 1991 (1981-91) Population
Total Rural Urban Total Rural Urban Total Rural Urban 1981 1991 (1) (2) (3) (4) (5) (6) (7) (8) (9) (10) (11) (12)
1. Osmanabad 233605 194537 39068 296892 228873 68019 +27.09 +17.65 +74.10 16.72 22.91
2. Kalamb 175191 161403 13788 208265 188403 19862 +18.88 +16.73 +44.05 7.87 9.54
3. Umarga 230048 200510 29538 288297 247302 40995 +25.32 +23.34 +38.79 12.84 14.22
4. Tuljapur 172062 145456 26606 218741 182849 35892 +27.13 +25.71 +34.90 15.46 16.41
5. P.aranda 116467 105573 10894 140038 125771 14267 +20.24 +19.13 +30.96 9.35 10.19 6. Bhum 102329 92035 10294 124094 109249 14845 +21.27 +18.70 +44.21 10.06 11.96
District Total 1Q29702 899514 130188 1276327 1082447 193880 +23.95 . +20.34 +48.92 12.64 15.19
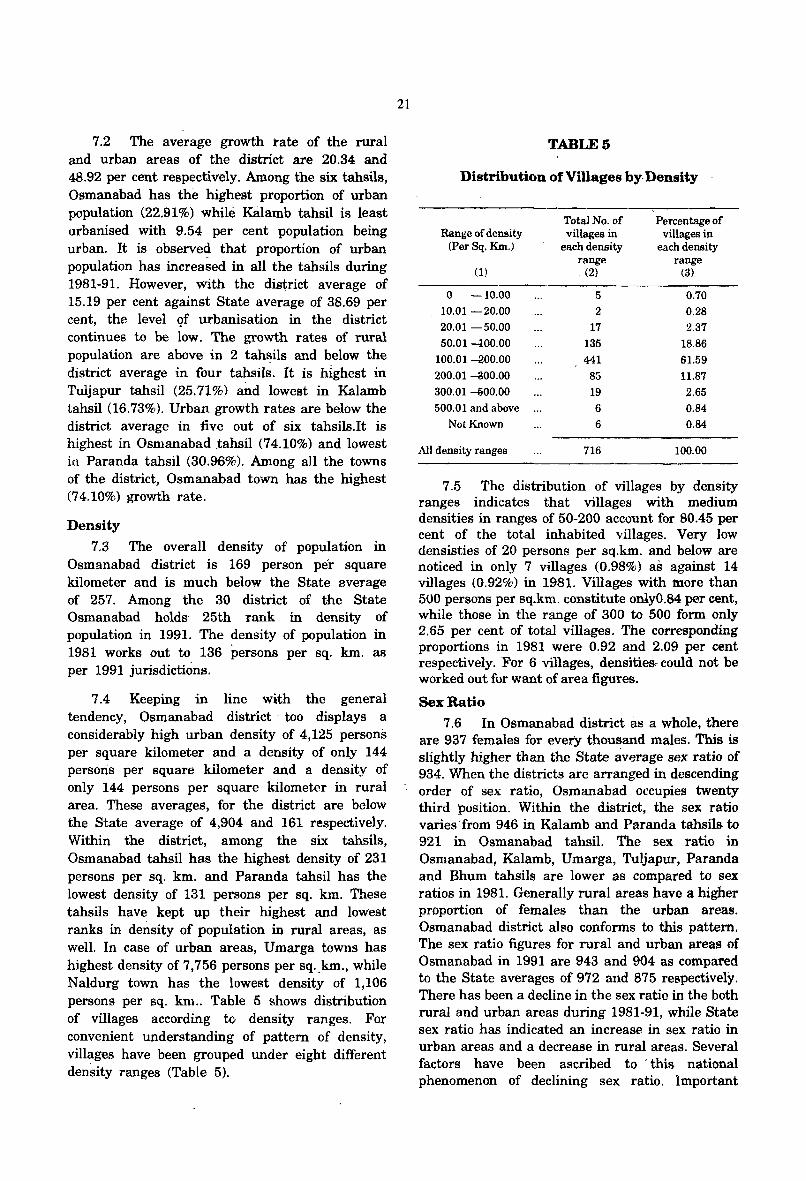
7.2 The average growth tate of the rural and urban areas of the district are 20.34 and 48.92 per cent respectively. Among the six tahsils, Osmanabad has the highest proportion of urban population (22.91%) while Kalamb tahsil is least urbanised with 9.54 per cent population being urban. It is observed that proportion of urban population has increased in all the tahsils during 1981-91. However, with the district average of 15.19 per cent against State average of 38.69 per cent, the level 9f urbanisation in the district continues to be low. The growth rates of rural population are above in 2 tahsils and below the district average in four tahsils. It is hJ.ghest in Tuljapur tahsil (25.71%) and lowest in Kalamb tahsil (16.73%). Urban growth rates are below the district average in five out of six tahsils.It is highest in Osmanabad .tahsil (74.10%) and lowest in Paranda tahsil (30.96%). Among all the towns of the district, Osmanabad town has the highest (74,10%) growth rate.
Density
7.3 The overall density of population in Osmanabad ' district is 169 person per square kilometer and is much below the State average of 257. Among the 30 district of the State Osmanabad holds 25th :rank in density of population in 1991. The density of population in 1981 works out to 136 persons per sq. km. as per 1991 jurisdictions.
7.4 Keeping in line with the general tendency, Osmanabad district, too displays a considerably high urban density of 4,125 personS per square kilometer and a density of only 144 persons per square kilometer and a density of only 144 persons per square kilometer in rural area. These averages, for the district are below the State average of 4,904 and 161 respectively. Within the district, among the six tahsils, Osmanabad tahsil has the highest density of 231 persons per sq. km. and Paranda tahsil has the lowest density of 131 persons per sq. km. These tahsils have kept up their highest and lowest ranks in density of population in rural areas, as well. In case of urban areas, Umarga towns has highest density of 7,756 persons per sq.,km., while Naldurg town has the lowest density of 1,106 persons per sq. km .. Table 5 shows distribution of villages according to density ranges. For convenient understanding of pattern of density, villages have been grouped under eight different density ranges (Table 5).
21
TABLE 5
Distribution ofViUages by Density
Total No. of Percentage of Range of density villages in villages in
(Per Sq. Km.) each density each density range range
(1) (2) (3)
0 -10.00 5 0.70 10.01 -20.00 2 0.28 20.01 -50.00 17 2.37 50.01 -l00.00 135 18.86
100.01 -QOO.OO 441 61.59 200.01 ~OO.OO 85 11.87 300.01 ~OO.OO 19 2.69 500.01 and above ... 6 0.84
Not Known 6 0.84
All density ranges 716 100.00
7.5 The distribution of villages by density ranges indicates that villages with medium densities in ranges of 50-200 account for 80.45 per cent of the total inhabited villages. Very low densisties of 20 persons per sq.km. and below are noticed in only 7 villages (0.98%) as against 14 villages (0.92%) in 1981. Villag.es with lUore than 500 persons per sq.km. constitute onlyO.84 per cent, while those in the range of 300 to 500 form only 2.65 per cent of total villages. The corresponding proportions in 1981 were 0.92 and 2.09 per cent respectively. For 6 villages, densities, could not be worked out for want of area figures.
Sex Ratio 7.6 In Osmanabad district as a whole, there
are 937 females for everY thousand males. This is slightly higher than the State average sex ratio of 934. When the districts are arranged in descending order of sex ratio, Osmanabad occupies twenty third position. Within the district, the sex ratio varies' from 946 in Kalamb and Paranda tahsils to 921 in Osmanabad tahsil. The sex ratio in Osmanabad, Kalamb, Umarga, Tuljapur, Paranda and Bhum tahsils are lower as compared to sex ratios in 1981. Generally rural areas have a higher proportion of females than the urban areas. Osmanabad district also conforms to this pattern. The sex ratio figures for rural and urban areas of Osmanabad in 1991 are 943 and 904 as compared to the State averages of 972 and 875 respectively. There has been a decline in the sex ratio in the both rural and urban areas during 1981-91, while State sex ratio has indicated an increase in sex ratio in urban areas and a decrease in rural areas. Several factors have been ascribed to' this national phenomenon of declining sex ratio. Important
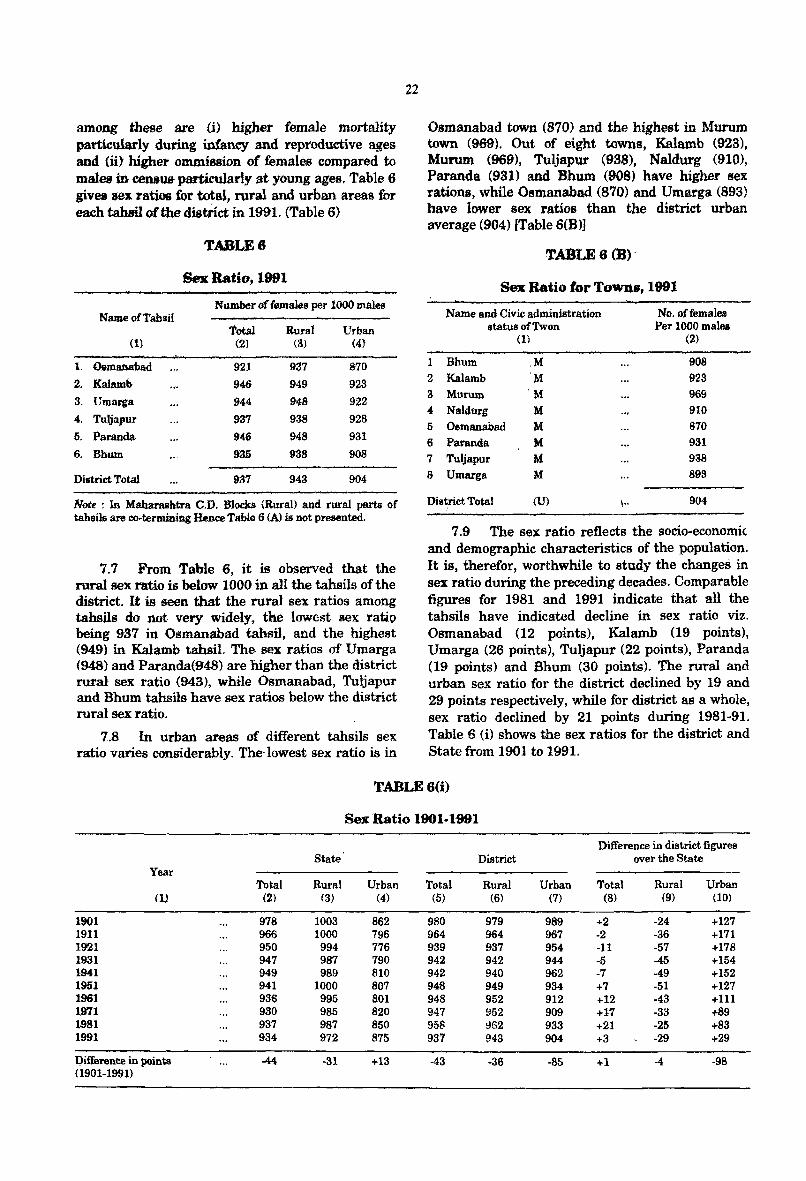
among these are (i) higher female mortality particularly during infancy and reproductive ages and (ii) higher ommission of females compared to males in OOIl$UiJ particularly at young ages. Table 6 gives sex ratios for total, rural and urban areas for each tahsil of the district in 1991. (Table 6)
TABLES
Sex Ratio, 1991
Number of females per 1000 males Name ofTahsiI
'total Rural Urban (1) (Z) (3) (4}
1. Osmanabad 921 937 870
2. KaWnh 946 949 923
3. Umarga 944 946 922
4. Tuljapur 937 938 928
5. Faranda 946 948 931
6. Bbum 935 938 908
District Total 937 943 904
Note : In Maharashtra C.D. Blocks (Rural) and rural parts of tahsils are eo·termining Hence Table 6 (A) is not presented.
7.7 From Table 6, it is observed that the rural sex ratio is below 1000 in all the tahsils of the district. It is seen that the rural sex ratios among tahsils do not very widely, the lowest sex rat.io being 937 in Osmanahad tahsil, and the highest (949) in Kalamb tahsil. The sex ratios of Umarga (948) and P3l"anda(948) are higher than the district rural sex ratio (943), while Osmanabad, Tuljapur and Bhum tahsils have sex ratios below the district ruTal sex ratio.
7_8 In urban areas of different tahsils sex ratio varies considerably. The' lowest sex ratio is in
22
Osmanabad town (870) and the highest in Murum town (969). Out of eight towns, Kalamb (923), Murum (969), Tuljapur (938), Naldurg (910), Paranda (931) and Bhum (908) have higher sex rations, while Osmanabad (870) and Umarga (893) have lower sex ratios than the district urban average (904) [Table 6(B)]
TABLE6(B)'
Sex Ratio for TO'WIlB, 1991
Name and Civic administration No.offemalee status ofTwon Per 1000 malet
{ll (2)
1 Bhum ,M 908 2 Kalamb 'M 923 3 Murom M 969 4 Naldurg M 910 5 Osmanabad M 870 6 Paranda M 931 7 Tuljapur M 938 8 Umarga M 893
District Total (U) \ .. 904
7.9 The sex ratio reflects the socio-economi<. and demographic charact.eristics of the population. It is, therefor, worthwhile to study the changes in sex ratio during the preceding decades. Comparable figures for 1981 and 1991 indicate that all the tahsils have indicated decline in sex ratio viz. Osmanabad (12 points), Kalamb (19 points), Umarga (26 points), Tuljapur (22 points), Paranda (19 points) and Bhum (30 points). The rural and urban sex ratio for the district declined by 19 and 29 points respectively, while for district as a whole, sex ratio declined by 21 points during 1981-91. Table 6 (i) shows the sex ratios for the district and State from 1901 to 1991.
TABLE6(i)
Sex Ratio 1901·1991
Difference in district figures State District over the State
Year Total Rural Urban Total Rural Urban Total Rural Urban
(1) (2) (3) (4) (5) (6) (7) (8) (9) (10)
1901 978 1003 862 980 979 989 +2 -24 +127 1911 966 1000 796 964 964 967 -2 -36 +171 1921 950 994 776 939 937 954 ·11 ·57 +178 1931 947 987 790 942 942 944 ·5 45 +154 1941 949 989 810 942 940 962 -7 -49 +152 1951 941 1000 807 948 949 934 +7 -51 +127 1961 936 995 801 948 952 912 +12 -43 +111 1971 930 985 820 947 952 909 +1'1 ·33 +89 1981 937 987 850 958 :;62 933 +21 -25 +83 1991 934 972 875 937 943 904 +3 -29 +29
Difference in points 44 -31 +13 -43 -36 -85 +1 -4 -98 (1901-1991)
7.10 1991 Census recorded a sex ratio of 937 females per 1,000 males in the district. The sex ration in the district remained lower than that of State froml911 to 1941. Sex ratio at the State level declined by 44 point and at district level by 43 points during the last 90 years. Similarly, the sex ratio for the rural areas decreased by 31 and 36 points at State and district levels respectively. But for the urban areas a reverse trend is seen at State level i.e. it increased by 13 points, while at the district level it decreased by 85 points during the last 9 decades. When the differences in sex ratios of district and State are compared, it is· observed that district sex ratio exceeded State figures by 2, 7, 12, 17 and 21 points during 1901, 1951, 1961, 1971 and 1981. However, the excess of district sex ratio over State average has come down to only 3 points in 1991. The sex ratio in Osmanabad district fluctutated between 980 to 937 during 1901 to 1991 exhibiting more or less a declining trend while the state average varied between 978 to 930 during the same period, also indicating a declining trend in general. .
8. SCHEDULED CASTES AND SCHEDULES TRffiES
8.1 Census provides the necessary data about the Scheduled Castes and Scheduled Tribes for evolving suitable plans for their socio economic upliftment and both the planners and the administrators heavily depend on this data base. The highlights of 1991 Census as that of previous census, is the collection of detailed information on the socio-economic characteristics of Scheduled Castes and Scheduled Tribes.
8.2 The President of India by gazette notification under article 341 (1) of the Indian Constitution, has declared some castes,races of tribes as Scheduled'Castes as there is no standard definition of Scheduled Castes. Similarly Scheduled Tribes mean all such tribes of tribal community or part of group within such tribe or tribal community as are declared by the President of India to be treated as Scheduled Tribe under article 342 (1) of the Indian Constitution. There is a slight change in definition of Scheduled Castes in 1991. Upto 1981, Scheduled Castes could belong to Hindu or Sikh religions only, but for 1991 Census, in addition to Hindu and Sikh religions, Scheduled Caste may belong to Buddhist and Navbuddhist religions also. For Maharashtra there are some minor changes in the list which was published in 1981 Census and accordingly in 1991 Census, 59 cast and 47 tribes have been declared to be recognised as Scheduled Castes and Scheduled Tribes respectively and the list of Scheduled Castes and Scheduled Tribes in the State is given below.
23
Scheduled Castes and Scheduled Tribes in Maharashtra State
I LIST OF SCHEDULED CASTES
1. Agel'
2. Anamuk
3. Al'ay Mala
4. ArwaMala
5. Bahna, Bahana
6. Bakad, Bant
7. Balahi, Balai
8. Basor, Burud, Bansor, Bansodi
9. Beda Jangam, Budga Jangam
10. Bedar
11. Bhambi, Bhamhhi, Asadaru, Asodi, Chamadia, Chamar, Chamari, Chambhar, Chamgar, Haralayya, Harali, Khalpa, Machigar, Mochigar, Madar, Madig, Mochi, Telegu Mochi, Kamati Mochi, Ranigar, Rohidas, Nona Ramnami, Rohit, Samgar, Samagara, Satnami, Surjya Banshi, Surjayaramnami
12. Bhangi, Mehtar, Olgana, Rukhl, Malkana, Halalkhor, Lalbegi, Balmiki, Koral', Zadmalli
13. Bindla
14. Byagara
15. Chalvadi, Channayya
16. Chenna Dasar. Holaya Dasar. Holeya Dasan
17. Dakkal, Dokkalwar
18. Dhor, Kakkayya, Kankayya, Dohor
19. Dom, Dumar
20. EUamalvar, Yellammalawandlu
21. Ganda, Gandi
22. Garoda, Garo
23. Ghasi, Ghasia
24. BaIleeI'
23. Halsar, Hm~lar, Hulasvar, Halasvar
26 Holar, Valhar
27. Rolaya, Holer, Holeya, Holiya
28. Kaikadi (in Akola, Amravati, Bhandara, Buldana, Nagpur, Wardha, Yavatmal and Gadchiroli districts and Chandrapur district other than Rajura tahsil)
29. Katia, Patharia
30. Khangar, Kanera, Mirdha
31. Khatik, Chikwa, Chikvi
32 .. Kolupulvandlu
33. Kori
34. Lingader
35. Madgi
36. Madiga
37. Mahar, Mehra Taral, Dhegu Megu
38. Mahyavanshi, Dhed, Vankar, Maru Vankar
39. Mala
40. Male Dasari
41. Mala Hannai
42. MalaJangam
43. Mala Masti
44. Mala Sale, Netkani
45. Mala Sanyasi
46. Mang, Matang, Minimadig, Dankhni Mang, Mahashi, Madari, Garudi, Radhe Mang
47. Mang Garodi, Mang Garudi
48. Manne
49. Mashti
50. Meghval, Menghvar
51. Mitha Ayyalvar
52. Mukri
53. Nadia,Hadi
54. Pasi
55. Sansi
56. Shenva, Chenva, Sedma, Ravat
57. Sindhollu, Chindollu
58. Tirgar, Tirbanda
59. Turi II. LIST OF SCHEDULED TRIBES
1. Andh
2. Baiga
3. Barda
4. . Bavacha, Bamcha
5. Bhaina
6. Bharia Bhumia, Bhuinhar Bhumia, Pando
7. Bhattra
8. Bhil, Bhil Garasia, Dholi, Bhil, Dungril Bhil, Dungri Garasia, Mewasi Bhil, Rawal Bhil, Tadvi Bhil, Bhagalia, Bhilala, Pawra, Vasava, Vasave
9. Bhunjia
10. Binjhwar
24
11. Birhul, Birhor
12. Chodhara (excluding Akola, Amravati, Bhandara, Buldana, Chandrapur, Gadchiroli, Nagpur, Wardha, Yavatmal, Aurangabad, Jalna, Bid, Nanded Osmanabad, Latur, and Parbhani districts and Goverdhanpur, Sarala, Mahankal Vadgaon and Bhamthan villages of Shrirampur tahsil of Ahmadnagar district which have been transfel'l.'ed from Vaijapur tahsil of Aurangabad district. But will be treated as, Scheduled Tribe in Yedashi, Dudhagaon, Gopalwadi, Kombadwadi, Kasbe-Taddavale, Jawale(Duma:la), Ambejavalga and: Koudgaon villages of Osmanabad tahsil of Osmanabad district , , which are transferred from Barshi tahsil of Solapur djstrict)
"
13. Dhanka, Tadvi, Tetaria~Valvi
14. Dhanwar
15. Dhodia
16. Dubla, Talavia, Halpati
17. Gamit, Gamta. Gavit, Mavchi Padvi
18. Gond, Rajgond, Arakh, Arrakh, Agaria, Asur, Badi Maria, Bada Maria, Bhatola, Bhimma, Bhuta, Koilabhuta, Koilabhuti, Bhar, Bisonhorn Maria, Chota Maria, Dandami Maria, Dhuru, Dhurwa, Dhoba, Dhuliil, DorIa, Gaiki, Gatta, Gatti, Gaita, Gond Gowari, Hill Maria, Kandra, Kalanga, Khatola, Koitar Koya, Khirwar, Khirwara Kukha Maria, Kuchaki Maria, Madia, Maria, Mana, Mannewar, Moghya, Mogia. Monghya, Mudia Muria, N agarchi, Naikpod, Nagwanshi, Ojha, Raj, Sonjhari Jhareka, Thatia, Thotya, Vada Maria, Wade Maria
19. Halba, Halbi
20. Kamar
21. Kathodi, Katkari, Dhor Kathodi, Dhor Katkari, Son Kathodi, SonKatkari
22. Kawar, Kanwar, Kaur, Cherwa, Rathia, Tanwar, Chattri
23. Khairwar
24. ·Kharia
25. Kokna, Kokni, Kukna,
26 Kol
27. Kolam, Mannervarlu
28. Koli Dhor, Tokre Koli, Kocha, Koigha
29. Koli Mahadev, Dongar Koli
30. Koli Malhar
31. Kondh, Khond, Kandh
32. Korku. Bopchi, Mouasi, Nihal, Nahul, Bondhi, Bondeya
33. Koya, Bhine Koya, Rajkoya
34.
35.
N agesia, N agasia
N aikda, N ayaka, Kapadia N ayaka, Nayaka
36. Oraon, Dhangad
Cholivala N ayaka, Mota N ayaka Nana
37. Pardhan, Pathari, Saroti
38. Pardhi, Advichincher, Phans pardhi, Phanse Pardhi~ Langoli Pardhi, Bahelia, Bahellia, Chita Pardhi, Shikari, Takankar, Takia
39. Parja
40. Patelia
41. Pomla
42. Rathawa
43. Sawar. Sawara
44. Thakur, Thakar, Ka Thakur, Ka Thakar, Ma Thaku, Ma Thakar
45. Thoti (inAurangabad, Jalna, Bid, Nanded, Osmanabad, Latur, Parbhani, districts and Rajura Tahsil of Chandrapur district and Govardhanpur, Sarala, Mahankal Vadgaon and Bhamthan villages of Shrirampur tahsil of Ahmadnagar district which have been transferred from Vaijapur tahsil of Aurangabad district. But will not be treated as Scheduled Tribe in Yedashi, Dudhagaon, Gopalwadi, Kombadwadi, Kasbe-Tadavale, . J awale (Dumala), Ambejavalge and Koudgaon villages of Osmanabad tahsil of Osmanabad district transferred from Barshi tahsil of Solapur district)
46. Varli
47. Vitolia, Kotwalia, Barodia
Scheduled Caste and Scheduled Tribes in 1981
8.3 In 1981 Census, Osmanabad district (undivided) returned 342,461 persons comprising 174,475 males and 167,986 females as Scheduled Castes accounting for 15.35 per cent of the total population of the district. Osmanabad of 1981 adjusted to 1991 boundaries returned Scheduled Caste population of 144,887. 88.87 per cent of Scheduled Castes population live in rural areas,
25
while only 11.13 per cent· were found in urban areas. As many as 46 Scheduled Castes were recorded in the district. The major five Scheduled Castes were Mang, Mahar, Bhambi, Mala Jangam and Lingader. All these Scheduled Castes were found scattered all over the district and constituted 91.03 per cent of the total Scheduled Caste population in the district.
,8.4 The literacy rate among the Scheduled Castes was 24.13 per cent as against the general literacy rate of 35.36 percent in the district. In rural areas 1034 persons (including 32 females) were returned as graduates and above, while in urban areas 490 (including 44 females) were returned as graduates and 143 (including 14 females) were reported as Post graduates. Among the five major castes, Lingaders had the highest literacy rate (52.90%). Female literacy rate was also highest among (36.46%): Mahars reported the highest number(352) persons as graduates and above (including 10 females ) in rural areas and 148 persons (including 10 females are graduates and 34 post graduates (including 2 females) in urban areas. The work participation rate among Scheduled Castes was 43.79 per cent as against 38.87 per cent for the general population. The Scheduled Castes were mainly engaged as agricultural labourers (71.47%). Each of the five major castes we~e mainly engaged as agricultural labourers and female proportions in this category were substantially higher compared to their male counterparts in all the major castes. Among all Scheduled Castes, 2,715 persons (5.75%) (including 2,228 females) were reported married in age group 10-14 while 10,231 persons (36.78%) (including 8,581 females) were reported married in the age group 15-19. Among the major castes, Mangs reported the highest number (1,360) (7.57%) of married persons (including 1,125 females) in age group 10-14 as well as age group 15-19 (4,399 persons (41.83%) including 3,604 females).
8.5 In 1981 Census, Schedule Tribes accounted for 2.33 per cent of the total population of undivided Osmanabad i.e. 52,013 persons comprising of 26,482 males and25,531 females. 91.25 per cent of the Scheduled Tribes lived in rural and r~maining 8.75 per cent lived in urban areas. Osmanabad of 1981 adjusted to 1991 boundaries kad Scheduled Tribe population of 19,320. As many as 35 Scheduled Tribes were recorded in the district, among which five major tribes were Koli Mahadeo, Dhangad, Pardhi, Naika, and Thaku. These five major tribes were found scattered allover the district and constituted 89.46 per cent of the total Scheduled Tribe popUlation
of the district. The literacy rate among Scheduled Tribe was 23.21 per cent as against general literacy rate of 35.36 per cent in the district. In rural areas, 112 persons (including 3 females) were returned as graduates and above, while in urban areas 58 (including 4 females) were reported as post graduates.Among five major tribes, Thakurs had the highest literacy rate (45.15%). Females literacy rate was also highest among Thakurs (30.51%). Koli Mahadeos reported the highest number of persons as graduates and above (41 including 2 females) in rural areas and in urban areas they returned 17 graduates (all males) and 3 post graduates (all males). The work participation rate among Scheduled Tribes was 42.40 per cent as compared to 38.87 per cent in the general population. Scheduled Tribes were mainly engaged as agricultural labourers (53.10%), Among five major tribes, three were mainly engaged as agricultural labourers, while Dhangad and Thakurs were mainly working as cultivators. Among agricultural labourers, female proportions were substantially higher compared to males among the afore mentioned 3 tribes. Among all Scheduled Tribes, 414 persons (5,75%) (including 354 females) were reported married in the age group 10-14 and 1608 (38.41%) persons (including 1,325 females) were married in age group 15-19. Among the major tribes Koli Mahadeos reported 222 (5.57%) persons (including 191 females) married in the age group 10-14 and 857 (38.11%) persons (including 719 females) married in age group 15-19.
SC/ST Population, Decadal variation and sex ratio
8.6 The Scheduled Castes population at the time of 1991 Census in Osmanabad district was
26
208, 609 comprising of 107,398 males and 101,211 females. They constituted 16.34 per cent of the total district population which is higher than the State average of 11.09 per cent. In the 1981 Census, the population of Scheduled Caste stood at 144,887 as per 1991 jurisdiction. Table 7 indicat.es jhe distribution of villages by percentage ranges of Scheduled Caste population to total popUlation.
TABLE 7
Proportion of Scheduled Caste Population to total Population in the Villages
Percentage range ofSchNuled No. of Percentage Caste population to t~tal villages in of villages in
population each range each range (1) (2) (3)
No SC population 14 1.96 - 5,00 67 9.36
5,01-10.00 "t>6 13.41 10.01 -15.00 161 22.49 15.01 - 20.00 176 24.57 20.01 - 30,00 158 22.07 30.01 and above 44 6,14
All ranges 716 100.00
8.7 In Osmanabad district, out of 716 villages in 1991, 14 villages (1.96%) have no Scheduled Caste population at all. Among the remaining 702 villages, the share of Scheduled Caste population is 10 per cent or less in 163 villages and above 10 per cent in 539 villages. In 1981 Census, Osmanabad district (comparable with 1991) had 705 inhabited villages out of which 30 had no Scheduled Caste population, 199 villages had Scheduled Caste population upto 10 per cent and remaining 476 had proportion above 10 per cent. Table 7 (i) indicates the decadal variation in Scheduled Caste population.
TABLE 7(i)
Decadal variation in Scheduled Caste Population
Scheduled Caste Population Percentage decadal variation
Name of Tahsil 1981 1991 1981-91 Total Rural Urban Total Rural Urban Total Rural Urban
(1) (2) (3) (4) (5) (6) (7) (8) (9) (10)
1. Osmanabad 30,021 27,074 2,947 47,797 37,525 10,272 +59.21 +38.60 +248.56
2. Kalamb 25,611 24,730 881 37,868 34,628 3,240 +47.86 +40.02 +267,76
3. Umarga 35,548 30,682 4,866 49,200 42.380 6,820 +38.40 +38.13 +40.16
4. Tuljapur 26,665 24,303 2,362 37,512 32,612 4,900 +40,68 +34.19 +107.45
5. Paranda 14,562 13,581 981 18,512 16,695 1,817 +27.13 +22.93 +85.22
6. Bhum 12,480 11,590 890 17,720 15,754 1,966 +41.99 +35.93 +120,90
District Total 1,44,887 1,31,960 12,927 2,08,609 1,79,594 29,015 +43.98 +36,10 +124.45
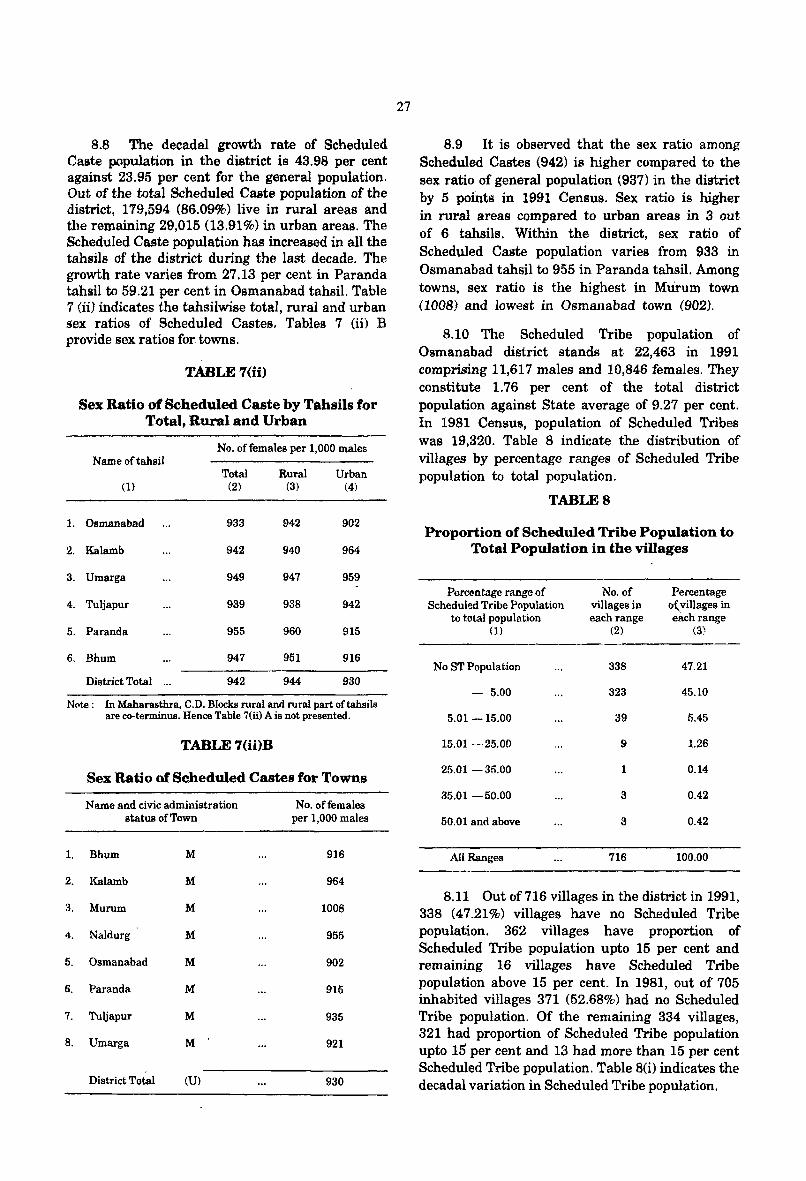
8.8 The decadal growth rate of Scheduled Caste population in the district is 43.98 per cent against 23.95 per cent for the general population. Out of the total Scheduled Caste population of the district, 179,594 (86.09%) live in rural areas and the remaining 29,015 (13.91%) in urban areas. The Scheduled Caste population has increased in all the tahsils of the district during the last decade. The growth rate varies from 27.13 pel' cent in Paranda tahsil to 59.21 per cent in Osmanabad tahsil. Table 7 (ii) indicates the tahsilwise total, rural and urban sex ratios of Scheduled Castes, Tables 7 (ii) B provide sex ratios for towns.
1.
2.
3.
4.
5.
6.
TABLE7(ii)
Sex Ratio of Scheduled Caste by Tahsils for Total, Rural and Urban
No. offemales per 1,000 males Name of tahsil
Total Rural Urban (1) (2) (3) (4)
Osmanabad 933 942 902
Kalamb 942 940 964
Umarga 949 947 959
Tuljapur 939 938 942
Paranda 955 960 915
Bhum 947 951 916
District Total ... 942 944 930
Note; In Maharasthra, C.D. Blocks TUral and TUral part oftahsils are co-terminus. Hence Table 7(ii) A is not presented.
TABLE 7(ii)B
Sex Ratio of Scheduled Castes for Towns
Name and civic administration No. of females status of Town per 1,000 males
1. Bhum M 916
2. Kalamb M 964
3. Murum M 1008
4. Naldurg M 955
5. Osmanabad M 902
6. Paranda M 915
7. Tuljapur M 935
8. Umarga M 921
District Total (U) 930
27
8.9 It is observed that the sex ratio among Scheduled Castes (942) is higher compared to the sex ratio of general population (937) in the district by 5 points in 1991 Census. Sex ratio is higher in rural areas compared to urban areas in 3 out of 6 tahsils. Within the district, sex ratio of Scheduled Caste popUlation varies from 933 in Osmanabad tahsil to 955 in Paranda tahsil. Among towns, sex ratio is the highest in MUrum town (1008) and lowest in Osmanabad town (902).
8.10 The Scheduled Tribe popUlation of Osmanabad district stands at 22,463 in 1991 comprising 11,617 males and 10,846 females. They constitute 1.76 per cent of the total district population against State average of 9.27 per cent. In 1981 Census, popUlation of Scheduled Tribes was 19,320. Table 8 indicate the distribution of villages by percentage ranges of Scheduled Tribe population to total population.
TABLES
Proportion of Scheduled Tribe Population to Total Population in the villages
Percentage range of Scheduled Tribe Popuiation
to t.otal population (J)
No ST PopUlation
- 5.00
5.01-15.00
15.01 --25.00
25.01 - 35.00
35.01-50.00
50.01 and above
All Ranges
No. of villages in each range
(2)
338
323
39
9
1
3
3
716
Percentage o,villages in each range
(3\
47.21
45.10
5.45
1.26
0.14
0.42
0.42
100.00
8.11 Out of 716 villages in the district in 1991, 338 (47.21%) villages have no Scheduled Tribe population. 362 villages have proportion of Scheduled Tribe population upto 15 per cent and remaining 16 villages have Scheduled Tribe population above 15 per cent. In 1981, out of 705 inhabited villages 371 (52.68%) had no Scheduled Tribe population. Of the remaining 334 villages, 321 had proportion of Scheduled Tribe population upto 15 per cent and 13 had more than 15 per cent Scheduled Tribe popUlation. Table 8(i) indicates the decadal variation in Scheduled Tribe population.
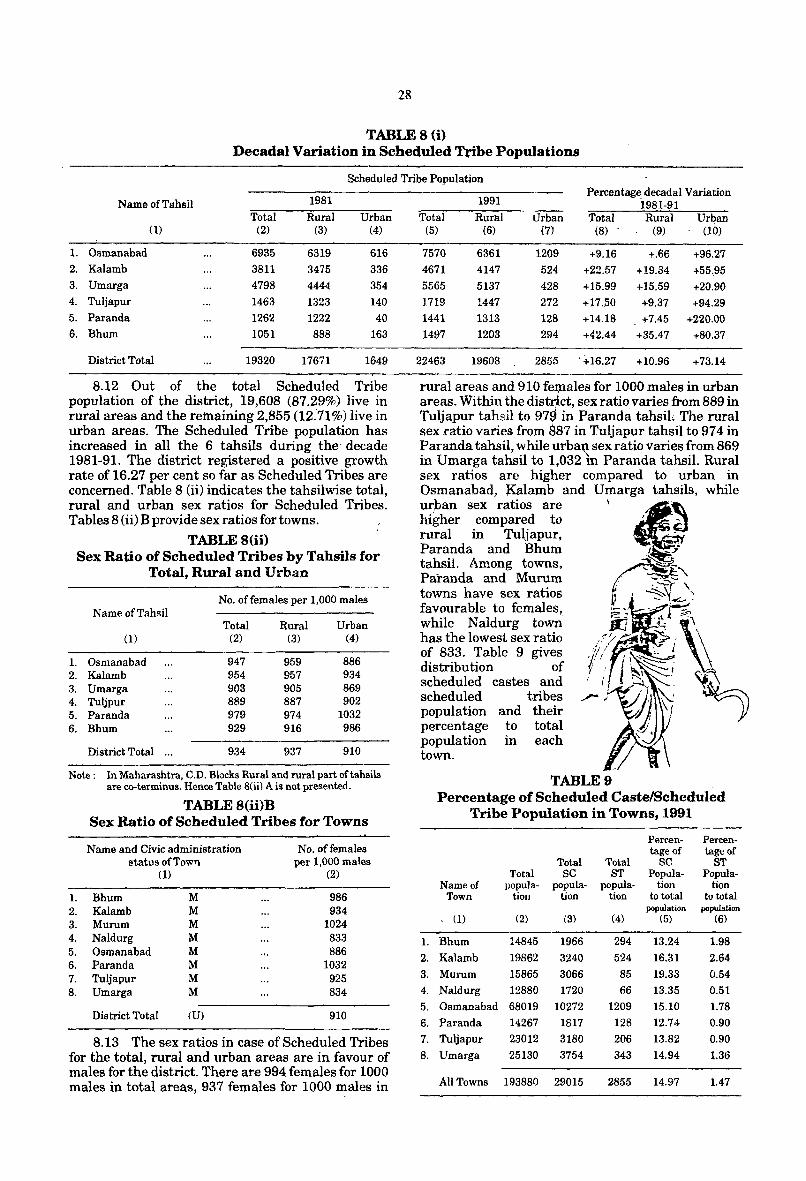
28
TABLE 8 (i) Decadal Variation in Scheduled Tribe Populations
Scheduled Tribe Population
Name of Tahsil 1981
Total Rural Urban (1) (2) (3) (4)
1. Osmanabad 6935 6319 616
2. Kalamb 3811 3475 336
3. Umarga 4798 4444 354
4. Tuijapur 1463 1323 140
5. Paranda 1262 1222 40
6. Bhum 1051 888 163
District Total 19320 17671 1649
8.12 Out of the total Scheduled Tribe population of the district, 19,608 (87.29%) live in rural areas and the remaining 2,855 (12:71 %) live in urban areas. The Scheduled Tribe population has increased in all the 6 tahsils during the· decade 1981-91. The district registered a positive growth rate of 16.27 per cent so far as Scheduled Tribes are concerned. Table 8 (ii) indicates the tahsilwise total, rural and urban sex ratios for Scheduled Tribes. Tables 8 (ii) B provide sex ratios for towns.
1. 2. 3. 4. 5. 6.
TABLE8(ii) Sex Ratio of Scheduled Tribes by Tahsils for
Total, Rural and Urban
No. offemales per 1,000 males Name of Tahsil
Total Rural Urban (1) (2) (3) (4)
Osmanabad 947 959 886 Kalamb 954 957 934 Umarga 903 905 869 Tuljpur 889 887 902 Paranda 979 974 1032 Bhum 929 916 986
District Total ... 934 937 910
Note: In Maharashtra, C.D. Blocks Rural and rural part of tahsils are co-terminus. Hence Table 8(ii) A is not presented.
TABLE8(ii)B Sex Ratio of Scheduled Tribes for Towns
Name and Civic administration No. offemales status of Town per 1,000 males
(1) (2)
1. Bhum M 986 2. Kalamb M 934 3. Murum M 1024 4. Naldurg M 833 5. Osmanabad M 886 6. Paranda M 1032 7. Tuljapur M 925 8. Utnarga M 834
District Total (U) 910
B.13 The sex ratios in case of Scheduled Tribes for the total, rural and urban areas are in favour of males for the district. There are 994 females for 1000 males in total areas, 937 females for 1000 males in
1991 Percentagedecadal Variation
.1981-91 Total Rural Urban Total Rural Urban
(5) (6) (7) (8) (9) (10)
7570 6361 1209 +9.16 +.66 +96.27 4671 4147 524 +22.57 +19.34 +55 .. 95 5565 5137 428 +15.99 +15.59 +20.90 1719 1447 272 +17 .. 50 +9.37 +94.29 1441 1313 128 +14.18 +7.45 +220.00
1497 1203 294 +42.44 +35.47 +80.37
22463 19608 2855 . +16.27 +10.96 +73.14
TABLE 9 Percentage of Scheduled Caste/Scheduled
Tribe Population in Towns, 1991
Perc.en- Percen-tageof tageof
Total Total SC ST Total se ST Pop'.lla- Popula-
Name of popula- popula- popula- tion tion Town tion tion tion to total to total
population population (1) (2) (3) (4) (5) (6)
1. Bhum 14845 1966 294 13.24 1.98
2. Kalamb 19862 3240 524 16.31 2.64
3. Murum 15865 3066 85 19.33 0.54
4. Naldurg 12880 1720 66 13.35 0.51
5. Osmanabad 68019 10272 1209 15.10 1.78
6. Paranda 14267 1817 128 12.74 0.90
7. Tuljapur 23012 3180 206 13.82 0.90
8. Umarga 25130 3754 343 14.94 1.36
All Towns 193880 29015 2855 14.97 1.47
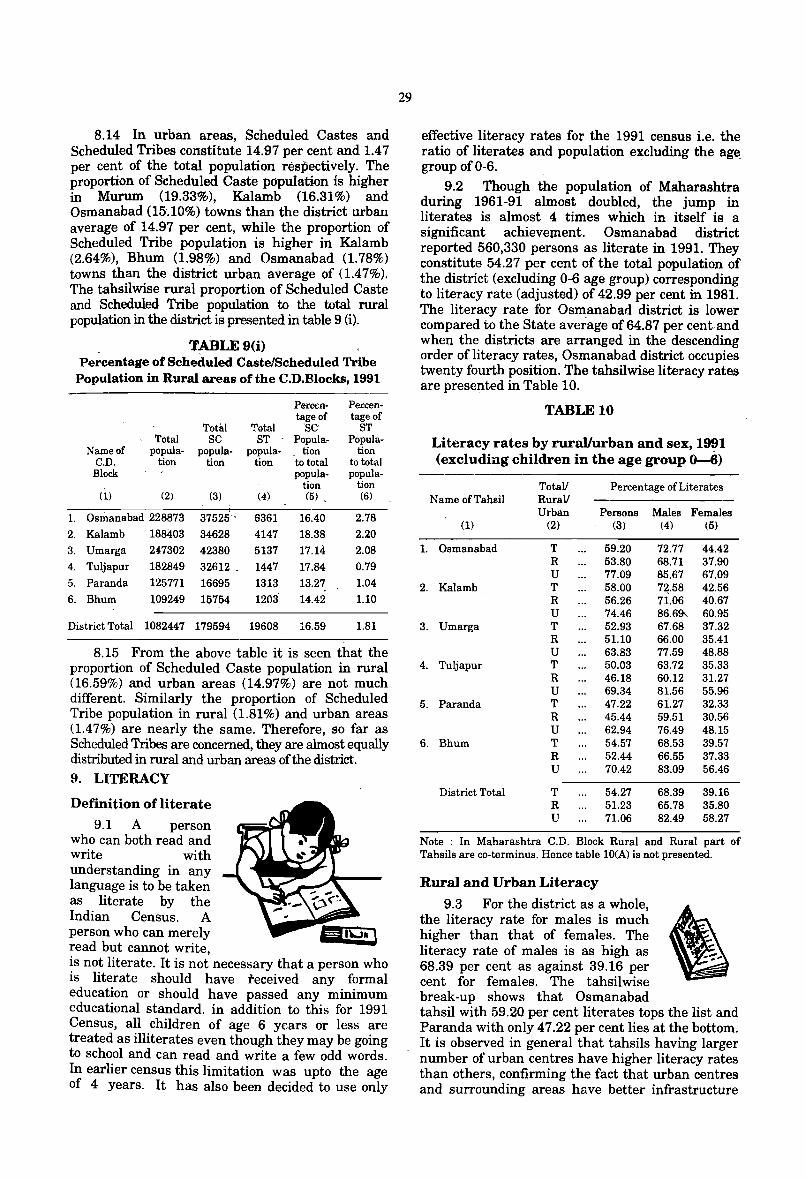
8.14 In urban areas, Scheduled Castes and Scheduled Tribes constitute 14.97 per cent and 1.47 per cent of the total population resPectively. The proportion of Scheduled Caste population is higher in Murum (19.33%), Kalamb (16.31%) and Osmanabad (15.10%) towns than the district urban average of 14.97 per cent, while the proportion of Scheduled Tribe population is higher in Kalamb (2.64%), Bhum (1.98%) and Osmanabad (1.78%) towns than the district urban average of (1.47%). The tahsilwise rural proportion of Scheduled Caste and Scheduled Tribe population to the total rural population in the district is presented in table 9 (i).
TABLE 9(i) Pe~centage of Scheduled Caste/Scheduled Tribe
Population in Rural areas of the C.D.Blocks, 1991
Percen- Percen-tage of tage of
Total Total 'Be ST Total SC ST ~ Popula- Popula-
Name of popula- populll- popula- tion tion C.D. tion tion tion to total to total Block popula- popula-
tion tion (1) (2) (3) (4) (5) , (6)
1. Osmanabad 228873 37525 . 6361 16.40 2.78
2. Kalamb 188403 34628 4147 18.38 2.20
3. Umarga 247302 42380 5137 17.14 2.08
4. Tuljapur 182849 32612 ~ 1447 17.84 0.79
5. Paranda 125771 16695 1313 13.27 1.04
6. Bhum 109249 15754 1203 14.42 1.10
District Total 1082447 179594 19608 16.59 1.81
8.15 From the above table it is seen that the proportion of Scheduled Caste population in rural (16.59%) and urban areas (14.97%) are not much different. Similarly the proportion of Scheduled Tribe population in rural (1.81%) and urban areas (1.47%) are nearly the same. Therefore, so far as Scheduled Tribes are concerned, they are almost equally distributed in rural and urban areas of the district. 9. LITERACY
Definition of literate
9.1 A person who can both read and write with understanding in any language is to be taken as literate by the Indian Census. A person who can merely read but cannot write, is not literate. It is not necessary that a person who is literate should have teceived any formal education or should have passed any minimum educational standard. in addition to this for 1991 Census, all children of age 6 years or less are treated as illiterates even though they may be going to school and can read and write a few odd words. In earlier census this limitation was upto the age of 4 years. It has also been decided to use only
29
effective literacy rates for the 1991 census i.e. the ratio of literates and population excluding the age group of 0-6.
9.2 Though the population of Maharashtra during 1961-91 almost doubled, the jump in literates is almost 4 times which in itself is a significant achievement. Osmanabad district reported 560,330 persons as literate in 1991. They constitute 54.27 per cent of the total population of the district (excluding 0-6 age group) corresponding to literacy rate (adjusted) of 42.99 per cent in 1981. The literacy rate for Osmanabad district is lower compared to the State average of 64.87 per cent. and when the districts are arranged in the descending order of literacy rates, Osmanabad district occupies twenty fourth position. The tahsilwise literacy rates are presented in Table 10.
TABLE 10
Literacy rates by rurallurban and sex, 1991 (excluding children in the age group 0-6)
Tot-al! Percentage of Literates Name of Tahsil Rural!·
Urban Persons Males Females (1) (2) (3) (4) (5)
1. Osmanabad T 59.20 72.77 44.42 R 53.80 68.71 37.90 U 77.09 85.67 67.09
2. Kalamb T 58.00 7~.58 42.56 R 56.26 71.06 40.67 U 74.46 86.69-. 60.95
3. Umarga T 52.93 67.68 37.32 R 51.10 66.00 35.41 U 63.83 77.59 48.88
4. Tuljapur T 50.03 63.72 35.33 R 46.18 60.12 31.27 U 69.34 81.56 55.96
5. Paranda T 47.22 61.27 32.33 R 45.44 59.51 30.56 U 62.94 76.49 48.15
6. Bhum T 54.57 68.53 39.57 R 52.44 66.55 37.33 U 70.42 83.09 56.46
District Total T 54.27 68.39 39.16 R 51.23 65.78 35.80 U 71.06 82.49 58.27
Note : In Maharashtra C.D. Block Rural and Rural part of Tahsils are co-terminus. Hence table 10CA) is not presented.
Rural and Urban Literacy
9.3 For the district as a whole, the literacy rate for males is much higher than that of females. The literacy rate of males is as high as 68.39 per cent as against 39.16 per cent for females. The tahsilwise break-up shows that Osmanabad
(\ -,
tahsil with 59.20 per cent literates tops the list and Paranda with only 47.22 per cent lies at the bottom. It is observed in general that tahsils having larger number of urban centres have higher literacy rates than others, confirming the fact that urban centres and surrounding areas have better infrastructure
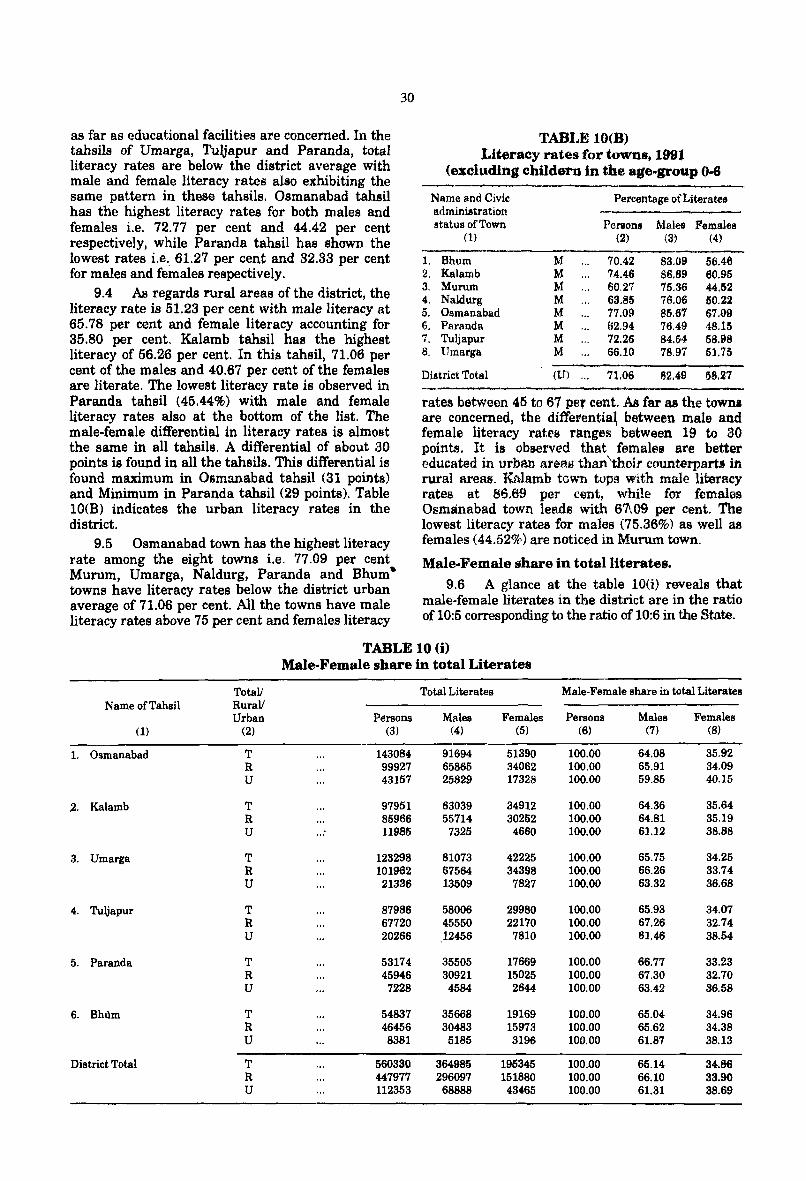
as far as educational facilities are concerned. In the tahsils of Umarga, Tu1japur and Paranda, total literacy rates are below the district average with male and female literacy rates also exhibiting the same pattern in these tahsils. Osmanabad tahsil has the highest literacy rates for both males and females Le. 72.77 per cent and 44.42 per cent respectively, while Paranda tahsil has shown the lowest rates i.e .. 61.27 per cent and 32.33 per cent for males and females respectively.
9.4 AB regards rural areas of the district, the literacy rate is 51.23 per cent with male literacy at 65.78 per cent and female literacy accounting for 35.80 per cent. Kalamb tahsil has the highest literacy of 56.26 per cent. In this tahsil, 71.06 per cent of the males and 40.67 per cent of the females are literate. The lowest literacy rate is observed in Paranda tahsil (45.44%) with male and female literacy rates also at the bottom of the list. The male-female differential in literacy rates is almost the same in all tahsils. A differential of about 30 points is found in all the tabeils. This differential is found maximum in Osmanabad tahsil (31 points) and Minimum in Paranda tahsil (29 points). Table 10(B) indicates the urban literacy rates in the district.
9.5 Osmanabad town has the highest literacy rate among the eight towns Le. 77.09 per cent Murum, Umarga, Naldurg, Paranda and Bhum" towns have literacy rates below the district urban average of 71.06 per cent. All the towns have male literacy rates above 75 per cent and females literacy
30
TABI .. E lO(B) Literacy rates for towns, 1991
(excluding childern in the age-group 0-6
Name and Civic Percentage of Literates administration status of Town Perlone Males Females
(1) (2) (3, (4)
1. Bhum M 70.42 83.09 56.46 2. Kalamb M 74.46 86.69 60.95 3. Murum M 60.27 75.36 44.52 4. Naldurg M 63.85 76.06 50.22 5. Osmanabad M 77.09 85.67 67 . .09 6. Paranda M 1;2.94 76.49 48.15 " Tuljapur M 72.26 84.64 58.98 I.
8. Umarga .M 56.10 78.97 5].75
District Total (U) ... 71.06 82.49 58.27
rates between 45 to 67 per cent. As far as the towns are concerned, the differentia~ between lllale and female literacy rrates ranges between 19 to 30 points. It is observed that females are better educated in urban area~ than "their counterpart, in rural areas. Knlamb tCWll tops with male literacy rates at 86.69. per cent, while for females Osmanabad town leads with 67\09 per cent. The lowest literacy rates for males (75.36%) as well as females (44.52%) are noticed in Munun town.
Male·Female share in total literates. 9.6 A glance at the table lO(i) reveals that
male-female literates in the district are in the ratio of 10:5 corresponding to the ratio of 10:6 in the State.
TABLE 10(i) Male-Female share in total Literates
Totall Total Literates Male-Female share in total Literates Name of Tahsil Rurall
Urban Persons Males Females Persons Males Females (l) (2) (3) (4) (5) (6) (7) (8)
1. Osmanabad T 143084 91694 51390 100.00 64.08 35.92 R 99927 65865 34062 100.00 65.91 34.09 U 43157 25829 17328 100.00 59.85 40.15
2. Kalamb T 97951 63039 34912 100.00 64.36 35.64 R 85966 55714 30252 100.00 64.81 35.19 U 11985 7325 4660 100.00 61.12 38.88
3. Umarga T 128298 81073 42225 100.00 65.75 34.25 R 101962 67564 34398 100.00 66.26 33.74 U 21336 13509 7827 100.00 63.32 36.68
4. Tuljapur T 87986 58006 29980 100.00 65.93 34.07 R 67720 45550 22170 100.00 67.26 32.74 U 20266 12456 7810 100.00 61.46 38.54
5. Paranda T 53174 35505 17669 100.00 66.77 33.23 R 45946 30921 15025 100.00 67.30 32.70 U 7228 4584 2644 100.00 63.42 36.58
6. Bhlim T 54837 35668 19169 100.00 65.04 34.96 R 46456 30483 15973 100.00 65.62 34.38 U 8381 5185 3196 100.00 61.87 38.13
District Total T 560330 364985 196345 100.00 65.14 34.Bii R 447977 296097 151880 100.00 66.10 33.90 U 112353 68888 43465 100.00 61.31 38.69
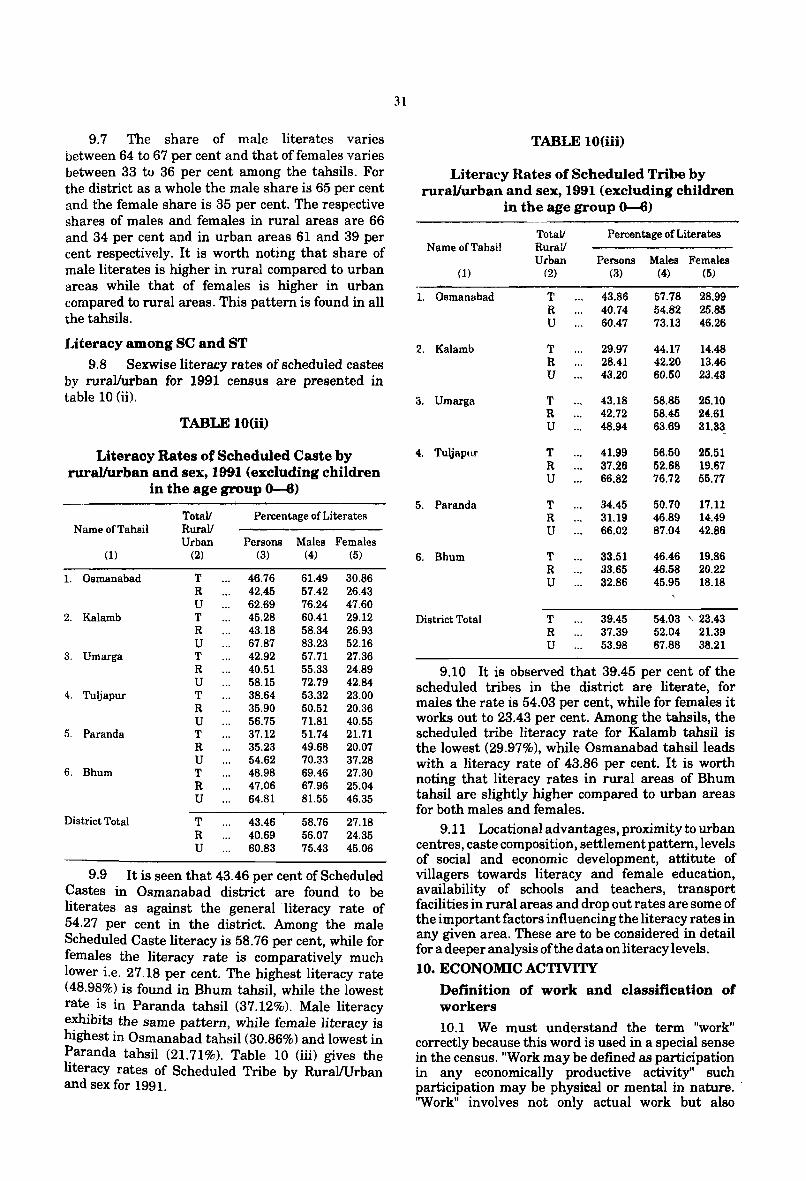
9.7 The share of male literates varies between 64 to 67 per cent and that offemales varies between 33 to 36 per cent among the tahsils. For the district as a whole the male share is 65 per cent and the female share is 35 per cent. The respective shares of males and females in rural areas are 66 and 34 per cent and in urban areas 61 and 39 per cent respectively. It is worth noting that share of male literates is higher in rural compared to urban areas while that of females is higher in urban compared to rural areas. This pattern is found in all the tahsils.
Literacy among se and ST 9.8 Sexwise literacy rates of scheduled castes
by rural/urban for 1991 census are presented in table 10 (ii).
TABLE 10(ii)
Literacy Rates of Scheduled Caste by ruraJ/urban and sex, 1991 (excluding children
in the age group 0-6)
TotaV Percentage of Literates Name of Tahsil RuraV
Urban Persons Males Females (1) (2) (3) (4) (5)
1. Osmanabad T 46.76 61.49 30.86 R 42.45 57.42 26.43 U 62.69 76.24 47.60
2. Kalamb T 45.28 60.41 29.12 R 43.18 58.34 26.93 U 67.87 83.23 52.16
3. Umarga T 42.92 57.71 27.36 R 40.51 55.33 24.89 U 58.15 72.79 42.84
4. Tuljapur T 38.64 53.32 23.00 R 35.90 50.51 20.36 U 56.75 71.81 40.55
5. Paranda T 37.12 51.74 21.71 R 35.23 49.68 20.07 U 54.62 70.33 37.28
6. Bhum T 48.98 69.46 27.30 R 47.06 67.96 25.04 U 64.81 81.55 46.35
District Total T 43.46 58.76 27.18 R 40.69 56.07 24.35 U 60.83 75.43 45.06
9.9 It is seen that 43.46 per cent of Scheduled Castes in Osmanabad district are found to be literates as against the general 'literacy rate of 54.27 per cent in the district. Among the male Scheduled Caste literacy is 58.76 per cent, while for females the literacy rate is comparatively much lower Le. 27.18 per cent. The highest literacy rate (48.98%) is found in Bhum tahsil, while the lowest rate is in Paranda tahsil (37.12%). Male literacy exhibits the same pattern, while female literacy is highest in Osmanabad tahsil (30.86%) and lowest in ~aranda tahsil (21. 71 %). Table 10 (iii) gives the hteracy rates of Scheduled Tribe by RurallUrban and sex for 1991.
31
TABLE 10(iii)
Literacy Rates of Scheduled Tribe by rural/urban and sex, 1991 (excluding children
in the age group 0-6)
Total! Percentage of Literates Name of Tahsil Rural!
Urban Persons Males Females (1) (2) (3) (4) (5)
1. Osmanabad T 43.86 57.78 28.99 R 40.74 54.82 25.85 U 60.47 73.13 46.26
2. Kalamb T 29.97 44.17 14.48 R 28.41 42.20 13.46 U 43.20 60.50 23.48
3. Umarga T 43.18 58.85 25.10 R 42.72 58.45 24.61 U 48.94 63.69 31.33
-
4. Tuljapur T 41.99 56.50 25.51 R 37.26 52.68 19.67 U 66.82 76.72 55.77
5. Paranda T 34.45 50.70 17.11 R 31.19 46.89 14.49 U 66.02 87.04 42.86
6. Bhum T 33.51 46.46 19.86 R 33.65 46.58 20.22 U 32.86 45.95 18.18
District Total T 39.45 54.03 '. 23.43 R 37.39 52.04 21.39 U 53.98 67.88 38.21
9.10 It is observed that 39.45 per cent of the scheduled tribes in the district are literate, for males the rate is 54.03 per cent, while for females it works out to 23.43 per cent. Among the tahsils, the scheduled tribe literacy rate for Kalamb tahsil is the lowest (29.97%), while Osmanabad tahsil leads with a literacy rate of 43.86 per cent. It is worth noting that literacy rates in rural areas of Bhum tahsil are slightly higher compared to urban areas for both males and females.
9.11 Locational advantages, proximity to urban centres, caste composition, settlement pattern, levels of social and economic development, attitute of villagers towards literacy and female education, availability of schools and teachers, transport facilities in rural areas and drop out rates are some of the important factors influencing the literacy rates in any given area. These are to be considered in detail for a deeper analysis of the data on literacy levels. 10. ECONOMIC ACTIVITY
Definition of work and classification of workers
10.1 We must understand the term "work" correctly because this word is used in a special sense in the census. "Work may be defined as participation in any economically productive activity" such participation may be pbysieal or mental in nature .. "Work" involves not only actual work but also
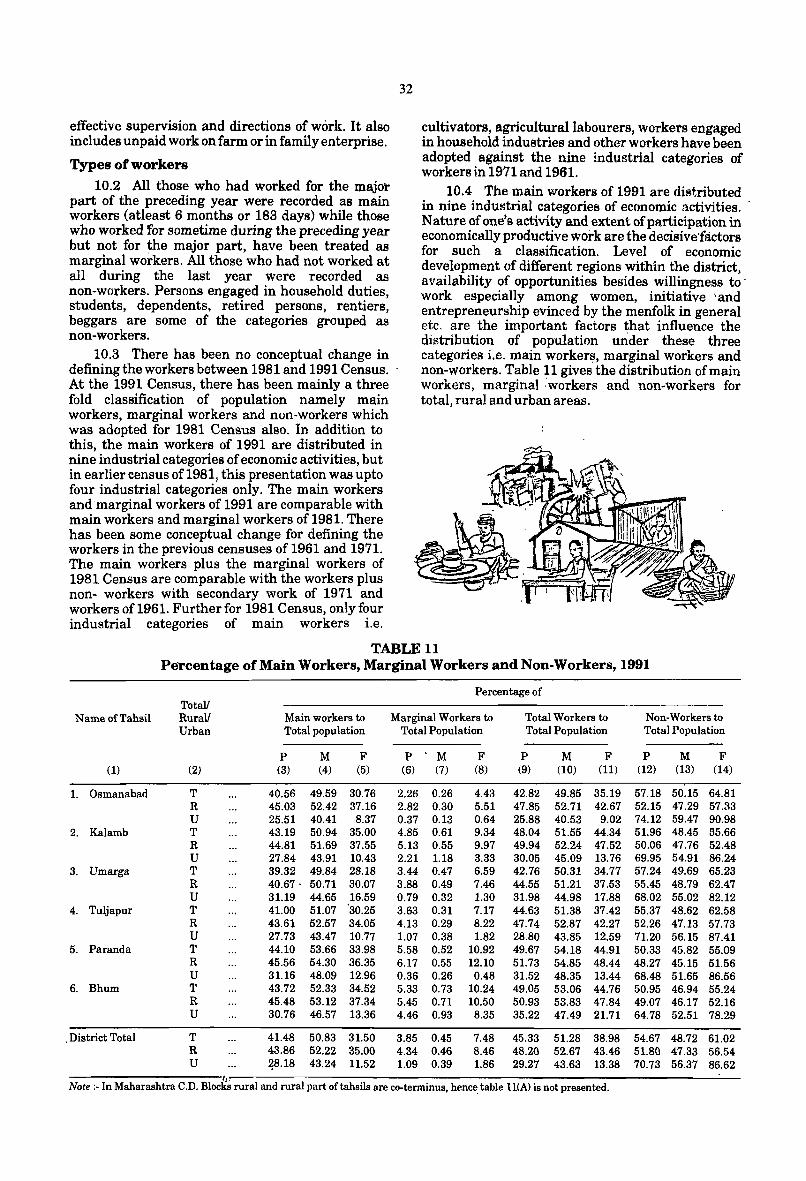
effective supervision and directions of work. It also includes unpaid work on farm or in family enterprise.
Types of workers
10.2 All those who had worked for the major part of the preceding year were recorded as main workers (atleast 6 months or 183 days) while those who worked for sometime during the preceding year but not for the major part, have been treated as marginal workers. All those who had not worked at all during the last year were recorded as non-workers. Persons engaged in household duties, students, dependents. retired persons, rentiers, beggars are some of the categories grouped as non-workers.
10.3 There has been no conceptual change in defining the workers between 1981 and 1991 Census. At the 1991 Census, there has been mainly a three fold classification of popUlation namely main workers, marginal workers and non-workers which was adopted for 1981 Census also. In addition to this, the main workers of 1991 are distributed in nine industrial categories of economic activities, but in earlier census of 1981, this presentation was upto four industrial categories only. The main workers and-marginal workers of 1991 are comparable with main workers and marginal workers of 1981. There has been some conceptual change for defining the workers in the previous censuses of 1961 and 1971. The main workers plus the marginal workers of 1981 Census are comparable with the workers plus non- workers with secondary work of 1971 and workers of 1961. Further for 1981 Census, only four industrial categories of main workers i.e.
32
cultivators, agricultural labourers, workets engaged in household industries and other workers have been adopted against the nine industrial categories of workers in 1971 and 1961.
10.4 The main workers of 1991 are distributed in nine industrial categories of economic activities. Nature of one's activity and extent of participation in economically productive work are the decisive'factors for such a classification. Level of economic development of different regions within the district, availabiHty of opportunities besides willingness to' work especially among women, initiative; and entrepreneurship evinced by the menfolk in general etc. are the important factors that influence the distribution of population urider these three categories i.e. main workerl,', marginal workers and non-workers. Table 11 gives the distribution of main workers, marginal 'workers and non-workers for total, rural and urban areas.
TABLE 11 Pe"rcentage of Main Workers, Marginal Workers and Non-Workers, 1991
Percentage of Totall
Name of Tahsil Rurall Main workers to Marginal Workers to Total Workers to Non-Workers to Urban Total population Total Population Total Population Total Population
P M F P M F P M F P M F (1) (2) (3) (4) (5) (6) (7) (8) (9) (10) (11) (12) (13) (14)
1. Osmanabad T 40.56 49.59 30.76 2.26 0.26 4.43 42.82 49.85 35.19 57.18 50.15 64.81 R 45.03 52.42 37.16 2.82 0.30 5.51 47.85 52.71 42.67 52.15 47.29 57.33 U 25.51 40.41 8.37 0.37 0.13 0.64 25.88 40.53 9.02 74.12 59.47 90.98
2. Kalamb T 43.19 50.94 35.00 4.85 0.61 9.34 48.04 51.55 44.34 51.96 48.45 65.66 R 44.81 51.69 37.55 5.13 0.55 9.97 49.94 52.24 47.52 50.06 47.76 52.48 U 27.84 43.91 1Q.43 2.21 1.18 3.33 30.05 45.09 13.76 69.95 54.91 86.24
3. Umarga T 39.32 49.84 28.18 3.44 0.47 6.59 42.76 50.31 34.77 57.24 49.69 65.23 R 40.67· 50.71 30.07 3.88 0.49 7.46 44.55 51.21 37.53 55.45 48.79 62.47 U 31.19 44.65 16.59 0.79 0.32 1.30 31.98 44.98 17.88 68.02 55.02 82.12
4. Tuljapur T 41.00 51.07 30.25 3.63 0.31 7.17 44.63 51.38 37.42 55.37 48.62 62.58 R 43.61 52.57 34.05 4.13 0.29 8.22 47.74 52.87 42.27 52.26 47.13 57.73 U 27.73 43.47 10.77 1.07 0.38 1.82 28.80 43.85 12.59 71.20 56.15 87.41
5. Paranda T 44.10 53.66 33.98 5.58 0.52 10.92 49.67 54.18 44.91 50.33 45.82 55.09 R 45.56 54.30 36.35 6.17 0.55 12.10 51.73 54.85 48.44 48.27 45.15 51.56 U 31.16 48.09 12.96 0.36 0.26 0.48 31.52 48.35 13.44 68.48 51.65 86.56
6. Bhum T 43.72 52.33 34.52 5.33 0.73 10.24 49.05 53.06 44.76 50.95 46.94 55.24 R 45.48 53.12 37.34 5.45 0.71 10.50 50.93 53.83 47.84 49.07 46.17 52.16 U 30.76 46.57 13.36 4.46 0.93 8.35 35.22 47.49 21.71 64.78 52.51 78.29
. District Total T 41.48 50.83 31.50 3.85 0.45 7.48 45.33 51.28 38.98 54.67 48.72 61.02 R 43.86 52.22 35.00 4.34 0.46 8.46 48.20 52.67 43.46 51.80 47.33 56.54 U ~8.18 43.24 11.52 1.09 0.39 1.86 29.27 43.63 13.38 70.73 56.37 86.62
Note :- In Maharashtra C.D. Bloc~s rural and rural part oftahsils are co-terminus, hence. table lI(A) is not presented.
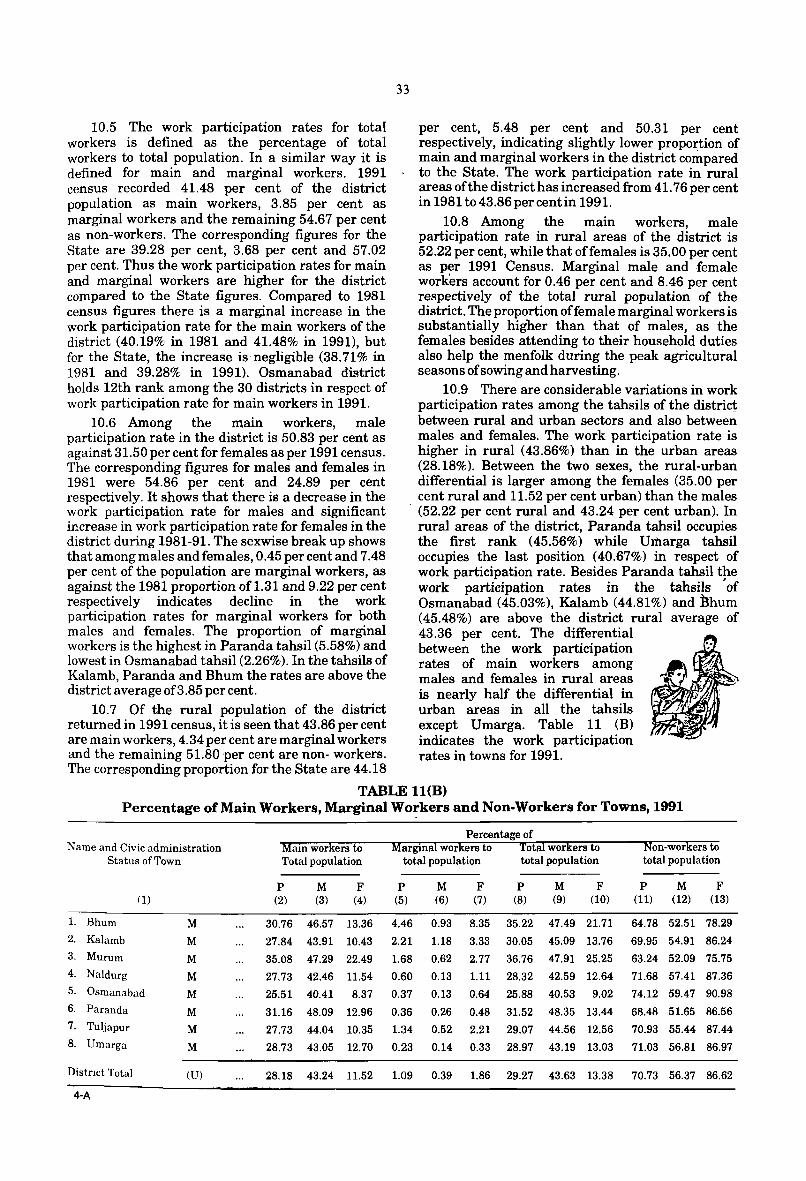
10.5 The work participation rates for total workers is defined as the percentage of total workers to total population. In a similar way it is defined for main and marginal workers. 1991 census recorded 41.48 per cent of the district population as main workers, 3.85 per cent as marginal workers and the remaining 54.67 per cent as non-workers. The corresponding figures for the State are 39.28 per cent, 3.68 per cent and 57.02 per cent. Thus the work participation rates for main and marginal workers are higher for the district compared to the State figures. Compared to 1981 census figures there is a marginal increase in the work participation rate for the main workers of the district (40.19% in 1981 and 41.48% in 1991), but for the State, the increase is negligible (38.71% in 1981 and 39.28% in 1991). Osmanabad district holds 12th rank among the 30 districts in respect of work participation rate for main workers in 1991.
10.6 Among the main workers, male participation rate in the district is 50.83 per cent as against 31.50 per cent for females as per 1991 census. The corresponding figures for males and females in 1981 were 54.86 per cent and 24.89 per cent respectively. It shows that there is a decrease in the work participation rate for males and significant increase in work participation rate for females in the district during 1981-91. The sexwise break up shows that among males and females, 0.45 per cent and 7.48 per cent of the population are marginal workers, as against the 1981 proportion of 1.31 and 9.22 per cent respectively indicates decline in the work participation rates for marginal workers for both males and females. The proportion of marginal workers is the highest in Paranda tahsil (5.58%) and lowest in Osmanabad tahsil (2.26%). In the tahsils of Kalamb, Paranda and Bhum the rates are above the district average of3.85 per cent.
10.7 Of the rural population of the district returned in 1991 census, it is seen that 43.86 per cent are main workers, 4.34 per cent are marginal workers and the remaining 51.80 'per cent are non- workers. The corresponding proportion for the State are 44.18
33
per cent, 5.48 per cent and 50.31 per cent respectively, indicating slightly lower proportion of main and marginal workers in the district compared to the State. The work participation rate in rural areas of the district has increased from 41. 76 per cent in 1981 to 43.86 per cent in 1991.
10.8 Among the main workers, male participation rate in rural areas of the district is 52.22 per cent, while that offemales is 35.00 per cent as per 1991 Census. Marginal male and female workers account for 0.46 per cent and 8.46 per cent respectively of the total rural population of the district. The proportion offemale marginal workers is substantially higher than that of males, as the females besides attending to their household duties also help the menfolk during the peak agricultural seasons of sowing and harvesting.
10.9 There are considerable variations in work participation rates among the tahsils of the district between rural and urban sectors and also between males and females. The work participation rate is higher in rural (43.86%) than in the urban areas (28.18%). Between the two sexes, the rural-urban differential is larger among the females (35.00 per cent rural and 11.52 per cent urban) than the males
. (52.22 per cent rural and 43.24 per cent urban). In rural areas of the district, Paranda tahsil occupies the first rank (45.56%) while Urharga tahsil occupies the last position (40.67%) in respect of work participation rate. Besides Paranda tahsil the work participation rates in the tahsils ' of Osmanabad (45.03%), Kalamb (44.81%) and Bhum (45.48%) are above the district rural average of 43.36 per cent. The differential between the work participation rates of main workers among males and females in rural areas is nearly half the differential in urban areas in all the tahsils except Umarga. Table 11 (B) indicates the work participation rates in towns for 1991.
TABLE l1(B) Percentage of Main Workers, Marginal Workers and Non-Workers for Towns, 1991
Name and Civic administration Status of Town
(1)
1. Bhum M 2. Kalamb M 3. Murum M 4. Naldurg M 5. Osmanabad M 6. Paranda M 7. Tuljapur M 8. Umarga M
Distnct Total (U)
4-A
Mam workers to Total population
P M F (2) (3) (4)
30.76 46.57 13.36
27.84 43.91 10.43
35.08 47.29 22.49
27.73 42.46 11.54
25.51 40.41 8.37
31.16 48.09 12.96
27.73 44.04 10.35
28.73 43.05 12.70
Percentage of Marginal workers to Total workers to
total population total popUlation
P M F (5) (6) (7)
4.46 0.93 8.35
2.21 1.18 3.33
1.68 0.62 2.77
0.60 0.13 1.11
0.37 0.13 0.64
0.36 0.26 0.48
1.34 0.52 2.21
0.23 0.14 0.33
P (8)
35.22
30.05
36.76
28.32
25.88
31.52
29.07
28.97
M (9)
47.49
45.09
47.91
42.59
40.53
48.35
44.56
43.19
F (10)
21.71
13.76
25.25
12.64
9.02
13.44
12.56
13.03
Non-workers to total population
P M F (11) (12) (13)
64.78 52.51 78.29
69.95 54.91 86.24
63.24 52.09 75.75
71.68 57.41 87.36
74.12 59.47 90.98
68.48 51.65 86.56
70.93 55.44 87.44
71.03 56.81 86.97
28.18 43.24 11.52 1.09 0.39 1.86 29.27 43.63 13.38 70.73 56.37 86.62
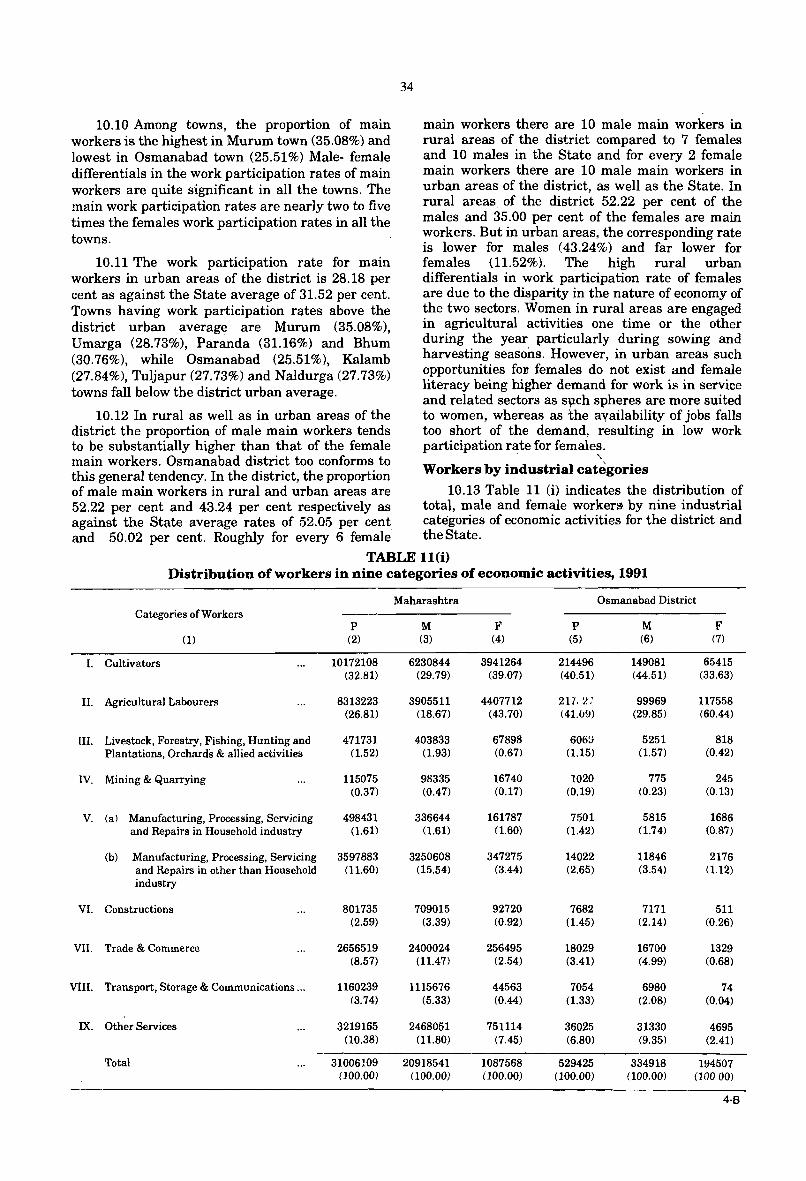
10.10 Amung towns, the proportion of main workers is the highest in Murum town (35.08%) and lowest in Osmanabad town (25.51%) Male- female differentials in the work participation rates of main workers are quite significant in all the towns. The main work participation rates are nearly two to five times the females work participation rates in all the towns.
10.11 The work participation rate for main workers in urban areas of the district is 28.18 per cent as against the State average of 31.52 per cent. Towns having work participation rates above the district urban average are Murum (35.08%), Umarga (28.73%), Paranda (31.16%) and Bhum (30.76%), while Osmanabad (25.51%), Kalamb (27.84%), Tuljapur (27.73%) and Naldurga (27.73%) towns fall below the district urban average.
34
main workers there are 10 male main workers in rural areas of the district compared to 7 females and 10 males in the State and for every 2 female main workers there are 10 male main workers in urban areas of the district, as well as the State. In rural areas. of the district 52.22 per cent of the males and 35.00 per cent of the females are main workers. But in urban areas, the corresponding rate is lower for males (43.24%) and far lower for females (11.52%). The high rural urban differentials in work participation rate of females are due to the disparity in the nature of economy of the two sectors. Women in rural areas are engaged in agricultural activities one time or the other during the year particularly during sowing and harvesting seasons. However, in urban areas such opportunities for females do not exist and female literacy being higher demand for work is in service and related sectors as s¥,:ch spheres are more suited
10.12 In rural as well as in urban areas of the to women, whereas as the availability of jobs falls district the proportion of male main workers tends too short of the demand, resulting in low work to be substantially higher than that of the female participation rate for females. main workers. Osmanabad district too conforms to . "-this general tendency. In the district, the proportion Workers by industrial categories of male main workers in rural and urban areas are 10.13 Table 11 (i) indicates the distribution of 52.22 per cent and 43.24 per cent respectively as total, male and female workers by nine industrial against the State average rates of 52.05 per cent categories of economic activities for the district and and 50.02 per cent. Roughly for every 6 female the State.
TABLE l1(i) Distribution of workers in nine categories of economic activities, 1991
Maharashtra Osmanabad District Categories of Workers
p M F P M F (1) (2) (3) (4) (5) (6) (7)
I. Cultivators 10172108 6230844 3941264 214496 149081 65415 (32.81) (29.79) (39.07) (40.51) (44.51) (33.63)
II. Agricultural Labourers 8313223 3905511 4407712 217.2; 99969 117558 (26.81) (18.67) (43.70) (41.u9) (29.85) (60.44)
III. Livestock, Forestry, Fishing, Hunting and 471731 403833 67898 606:1 5251 818 Plantations, Orchards & allied activities (1.52) (1.93) (0.67) (1.15) (1.57) (0.42)
IV. Mining & Quarrying 115075 98335 16740 1020 775 245 (0.37) (0.47) (0.17) (0.19) (0.23) (0.13)
V. (a) Manufacturing, Processing, Servjcing 498431 336644 161787 7501 5815 1686 and Repairs in Household industry (1.61) (1.61) (1.60) (1.42) (1.74) (0.87)
(b) Manufacturing, Processing, Servicing 3597883 3250608 347275 14022 11846 2176 and Repairs in other than Household (11.60) (15.54) (3.44) (2.65) (3.54) (1.12) industry
VI. Constructions 801735 709015 92720 7682 7171 511 (2.59) (3.39) (0.92) (1.45) (2.14) (0.26)
VII. Trade & Commerce 2656519 2400024 256495 18029 16700 1329 (8.57) (11.47) (2.54) (3.41) (4.99) (0.68)
VIII. Transport, Storage & Communications ... 1160239 1115676 44563 7054 6980 74 13.74} (5.33) (0.44) (1.33) (2.08) (0.04)
IX. Other Services 3219165 2468051 751114 36025 31330 4695 (10.38) (11.80) (7.45) (6.80) (9.35) (2.41)
Total 31006109 20918541 1087568 529425 334918 194507 (100.00) (100.00) (100.00) (100.00) (100.00) (10000)
4·8
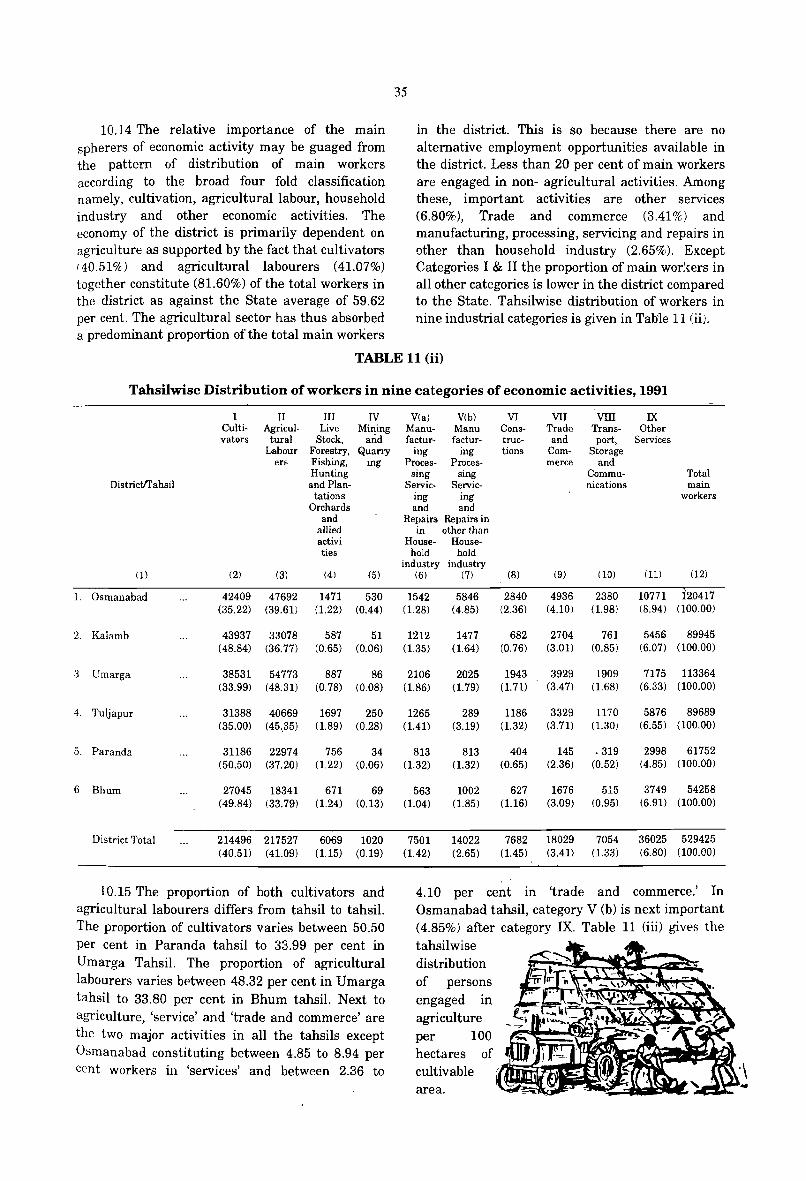
10.14 The relative importance of the main spherers of economic activity may be guaged from the pattern of distribution of main workers according to the broad four fold classification namely, cultivation, agricultural labour, household industry and other economic activities. The economy of the district is primarily dependent on agriculture as supported by the fact that cultivators (40.51%) and agricultural labourers (41.07%) together constitute (81.60%) of the total workers in the district as against the State average of 59.62 per cent. The agricultural sector has thus absorbed a predominant proportion of the total main workers
35
in the district. This is so because there are no alternative employment opportunities available in the district. Less than 20 per cent of main workers are engaged in non- agricultural activities. Among these, important activities are other services (6.80%), Trade and commerce (3.41%) and manufacturing, processing, servicing and repairs in other than household industry (2.65%). Except Categories I & II the proportion of main wor~{ers in all other categories is lower in the district compared to the State. Tahsilwise distribution of workers in nine industrial categories is given in Table 11 (ii).
TABLE 11 (ii)
Tahsilwise Distribution of workers in nine categories of economic activities, 1991
Districtlrahsil
1. Osmanabad
2. Kalamb
3 Umarga
4. Tuljapur
5. Paranda
6 Bhum
District Total
I Cultivators
(2)
II Agricul
tural Labour
ers
(3)
III Live
Stock, Forestry, Fisbing, Hunting and Plan-
tations Orchards
and allied activi ties
(4)
IV Mining
and Quarry
rng
(5)
Via) V(b) Manu- Manu factur- factur-
ing ing Proces- Proces-
sing sing Servic- Servic-
ing ing and and
Repairs Repairs in in other than
House- House-hold hold
industry industry (6) (7)
42409 47692 1471 530 1542 5846 (4.85) (35.22) (39.61) (1.22) (0.44) (1.28)
43937 33078 587 51 1212 (48.84) (36.77) (0.65) (0.06) (1.35)
38531 54773 887 86 2106 (33.99) (48.31) (0.78) (0.08) (1.86)
31388 40669 1697 250 1265 (35.00) (45.,35) (1.89) (0.28) (1.41)
31186 22974 756 34 813 (50.50) (37.20) (1.22) (0.06) (1.32)
27045 18341 (49.84) (33.79)
214496 217527 (40.51) (41.09)
671 69 (1.24) (0.13)
6069 1020 (1.15) (0.19)
563 (1.04)
7501 (1.42)
1477 (1.64)
2025 (1.79)
289 (3.19)
813 (1.32)
1002 (1.85)
14022 (2.65)
VI Construetions
(8)
VII Trade and
Commerce
(9)
VIII Transport,
Storage and
Communications
(10)
2840 4936 2380 (2.36) (4.10) (1.98)
682 2704 761 (0.76) (3.01) (0.85)
1943 3929 1909 (1.71) (3.47) (1.68)
1186 3329 1170 (1.32) (3.71) (1.30)
404 145 .319 (0.65) (2.36) (0.52)
627 (1.16)
7682 (1.45)
1676 (3.09)
18029 (3.41)
515 (0.95)
7054 (1.33)
IX Other
Services
(11)
Total main
workers
(12)
10771 120417 (8.94) (100.00)
5456 89945 (6.07) (100.00)
7175 113364 (6.33) (100.00)
5876 89689 (6.55) (100.00)
2998 61752 (4.85) (100.00)
3749 54258 (6.91) (100.00)
36025 529425 (6.80) (100.00)
10.15 The proportion of both cultivators and agricultural labourers differs from tahsil to tahsil. The pr~portion of cultivators varies between 50.50 per cent in Paranda tahsil to 33.99 per cent in Umarga Tahsil. The proportion of agricultural labourers varies between 48.32 per cent in Umarga tahsil to 33.80 per cent in Bhum tahsil. Next to agriculture, 'service' and 'trade and commerce' are the two major activities in all the tahsils except Osmanabad constituting between 4.85 to 8.94 per cent workers in 'services' and between 2.36 to
4.10 per cent in 'trade and commerce.' In Osmanabad tahsil, category V (b) is next important (4.85%) after category IX. Table 11 (iii) gives the tahsilwise distribution of persons engaged in agriculture per 100 hectares of cultivable J'k.::::::!i.,~~fl
area.
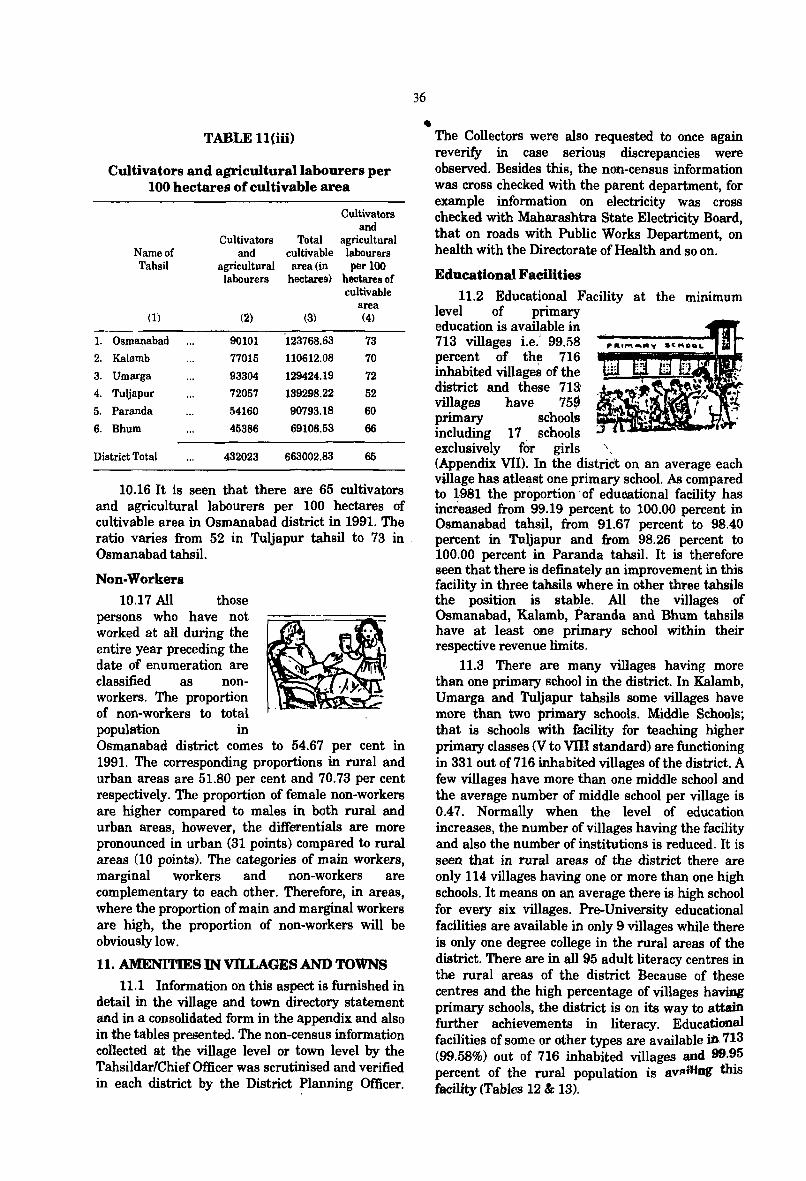
TABLE 11(iii)
Cultivators and agricultural labourers per 100 hectares of cultivable area
Name of Tahsil
(1)
1. Osmanabad
2. Kalamb
3. Umarga
4. Tuljapur
5. Paranda
6. Bhum
District Total
Cultivators and
agricultural labourers
(2)
90101
77015
93304
72057
54160
45386
432023
Cultivators and
Total agricultural cultivable labourers area (in per 100
hectares) hectares of cultivable
area (3) (4)
123768.63 73
110612.08 70
129424.19 72
139298.22 52
90793.18 60
69106.53 66
663002.83 65
10.16 It is seen that there are 65 cultivators and agricultural labourers per 100 hectares of cultivable area in Osmanabad district in 1991. The ratio varies from 52 in Tuljapur tahsil to 73 in . Osmanabad tahsil.
Non-Workers
10.17 All those persons who have not worked at all during the entire year preceding the date of enumeration are classified as nonworkers. The proportion of non-workers to total population in Osmanabad district comes to 54.67 per cent in 1991. The corresponding proportions in rural and urban areas are 51.80 per cent and 70.73 per cent respectively. The proportion of female non-workers are higher compared to males in both rural and urban areas, however, the differentials are more pronounced in urban (31 points) compared to rural areas (10 points). The categories of main workers, marginal workers and non-workers are complementary to each other. Therefore, in areas, where the proportion of main and marginal workers are high, the proportion of non-workers will be obviously low.
11. AMENITIES IN VlLLAOES AND TOWNS
11.1 Information on this aspect is furnished in detail in the village and town directory statement and in a consolidated form in the appendix and also in the tables presented. The non-census information collected at the village level or town level· by the Tahsildar/Chief Officer was scrutinised and verified in each district by the District Planning Officer.
36
• The Collectors were also requested to once again reverify in case serious discrepancies were observed. Besides this, the non-census information was cross checked with the parent department, for example information on electricity was cross checked with Maharashtra State Electricity Board, that on roads with Public Works Department, on health with the Directorate of Health and so on.
Educational Facilities
11.2 Educational Facility at the minimum level of primary education is available in 713 villages Le.' 99.58 percent of the 716 inhabited villages of the district and these 713' villages have 75~ primary schools including 17 schools exclusively for girls ", (Appendix VII). In the district on an average each village has atleast one .primary school. AB compared to ~981 the proportion· of educational facility has incteased from 99.19 percent to 100.00 percent in Osmanabad tahsil, from 91.67 percent to 98.40 percent in Tuljapur and from 98.26 percent to 100.00 percent in Paranda tahsil. It is therefore seen that there is definately an improvement in this facility in three tahsils where in other three tahsils the position is stable. All the villages of Osmanabad, Kalamb, Paranda and Bhum tahsils have at least one primary school within their respective revenue limits.
11.3 There are many villages having more than one primary school in the district. In Kalamb, Umarga and Tuljapur tahsils some villages have more than two primary schools. Middle Schools; that is schools with facility for teaching higher primary classes (V to VIII standard) are functioning in 331 out of 716 inhabited villages of the district. A few villages have more than one middle school and the average number of middle school per village is 0.47. Normally when the level of education increases, the number of villages having the facility and also the number of institutions is reduced. It is seen that in rural areas of the district there are only 114 villages having one or more than one high schools. It means on an average there is high school for every six villages. Pre-University educational facilities are available in only 9 villages while there is only one degree college in the rural areas of the district. There are in all 95 adult literacy centres in the rural areas of the district Because of these centres and the high percentage of villages having primary schools, the district is on its way to attain further achievements in literacy. Educational facilities of some or other types are available in. 713 (99.58%) out of 716 inhabited villages and 99.95 percent of the rural population is a"",4tmg this facility (Tables 12 & 13).
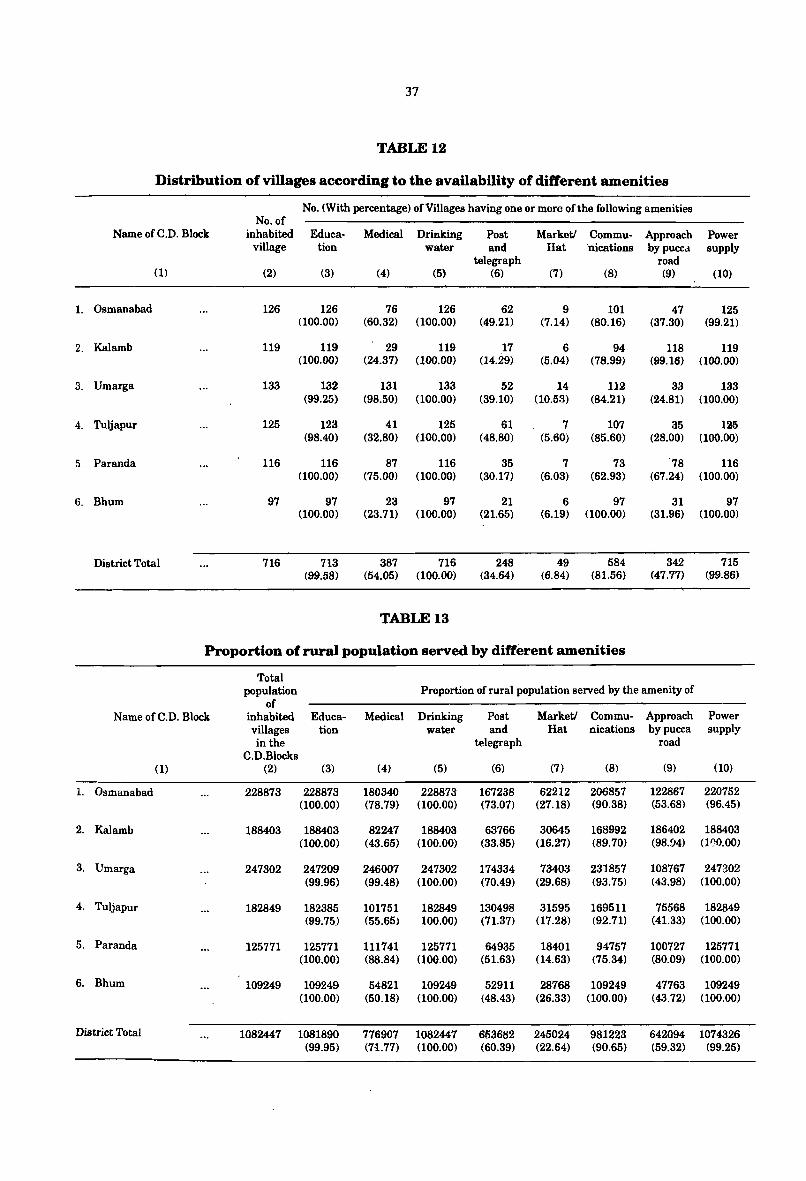
37
TABLE 12
Distribution of villages according to the availability of different amenities
No. (With percentage) of Villages having one or more of the following amenities No. of
Name of C.D. Block inhabited Educa- Medical Drinking Post Marketl Commu- Approach Power village tion water and Hat nications bypuccd supply
telegraph road (1) (2) (3) (4) (5) (6) (7) (8) (9) (10)
1. Osmanabad 126 126 76 126 62 9 101 47 125 (100.00) (60.32) (100.00) (49.21) (7.14) (80.16) (37.30) (99.21)
2. Kalamb 119 119 29 119 17 6 94 118 119 (100.00) (24.37) (100.00) (14.29) (5.04) (78.99) (99.16) (100.00)
3. Umarga 133 132 131 133 52 14 112 33 133 (99.25) (98.50) (100.00) (39.10) (10.53) (84.21) (24.81) (100.00)
4. Tuljapur 125 123 41 125 61 7 107 35 125 (98.40) (32.80) (100.00) (48.80) (5.60) (85.60) (28.00) (100.00)
5. Paranda 116 116 87 116 35 7 73 78 116 (100.00) (75.00) (100.00) (30.17) (6.03) (62.93) (67.24) (100.00)
6. Bhum 97 97 23 97 21 6 97 31 97 (100.00) (23.71) (100.00) (21.65) (6.19) (100.00) (31.96) (100.00)
District Total 716 713 387 716 248 49 584 342 715 (99.58) (54.05) (100.00) (34.64) (6.84) (81.56) (47.77) (99.86)
TABLE 13
Proportion of rural population served by different amenities
Total population Proportion of rural population served by the amenity of
of Name of C.D. Block inhabited Educa- Medical Drinking Post Marketl Commu- Approach Power
villages tion water and Hat nications bypucca supply in the telegraph road
C.D.Blocks (1) (2) (3) (4) (5) (6) (7) (8) (9) (10)
1. Osmanabad 228873 228873 180340 228873 167238 62212 206857 122867 220752 (100.00) (78.79) (100.00) (73.07) (27.18) (90.38) (53.68) (96.45)
2. Kalamb 188403 188403 82247 188403 63766 30645 168992 186402 188403 (100.00) (43.65) (100.00) (33.85) (16.27) (89.70) (98.94) (100.00)
3. Umarga 247302 247209 246007 247302 174334 73403 231857 108767 247302 (99.96) (99.48) (100.00) (70.49) (29.68) (93.75) (43.98) (100.00)
4. Tuljapur 182849 182385 101751 182849 130498 31595 169511 75568 182849 (99.75) (55.65) 100.00) (71.37) (17.28) (92.71) (41.33) (100.00)
5. Paranda 125771 125771 111741 125771 64935 18401 94757 100727 125771 (100.00) (88.84) (100.00) (51.63) (14.63) (75.34) (80.09) (100.00)
6. Bhum 109249 109249 54821 109249 52911 28768 109249 47763 109249 (100.00) (50.18) (100.00) (48.43) (26.33) (100.00) (43.72) (100.00)
District Total 1082447 1081890 776907 1082447 653682 245024 981223 642094 1074326 (99.95) (71.77) (l00.00) (60.39) (22.64) (90.65) (59.32) (99.25)
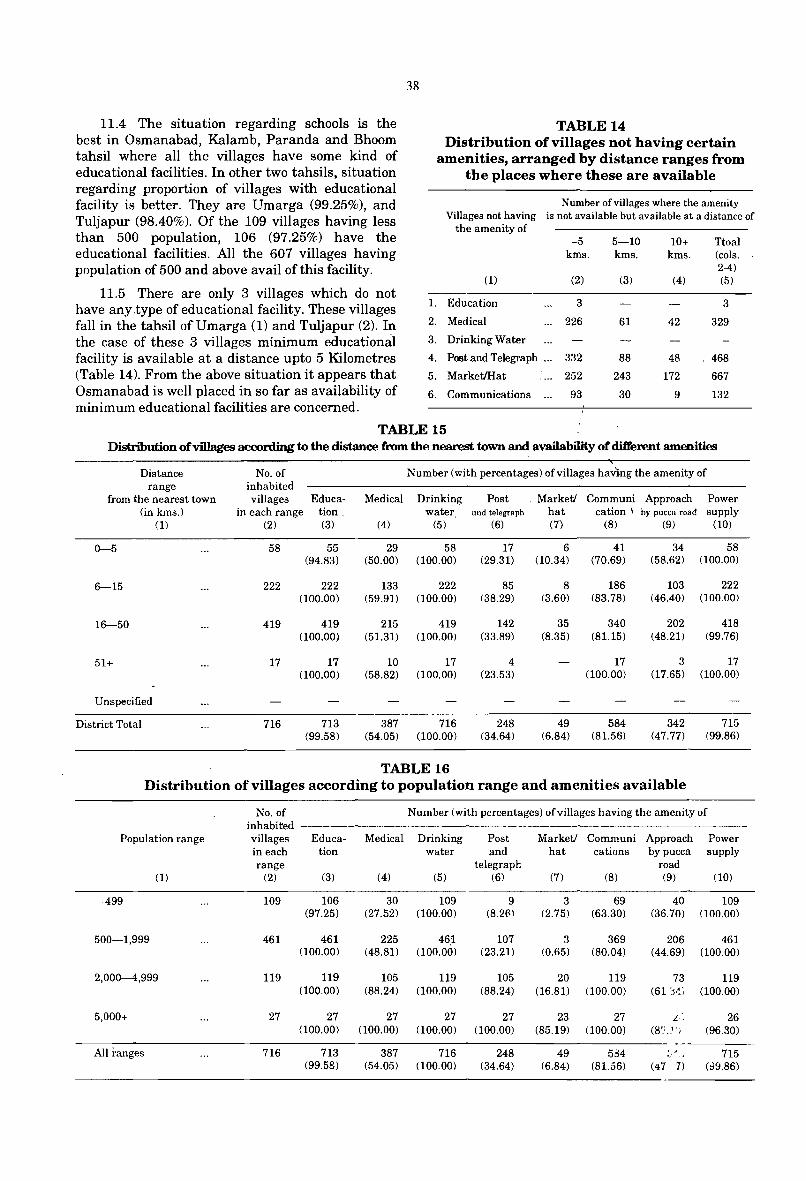
11.4 The situation regarding schools is the best in Osmanabad, Kalamb, Paranda and Bhoom tahsil where all the villages have some kind of educational facilities. In other two tahsils, situation regarding proportion of villages with educational facility is better. They are Umarga (99.25%), and Tuljapur (98.40%). Of the 109 villages having less than 500 population, 106 (97.25%) have the educational facilities. All the 607 villages having population of 500 and above avail of this facility.
11.5 There are only 3 villages which do not have any.type of educational facility. These villages fall in the tahsil ofUmarga (1) and Tuljapur (2). In the case of these 3 villages minimum educational facility is available at a distance upto 5 Kilometres (Table 14). From the above situation it appears that Osmanabad is well placed in so far as availability of minimum educational facilities are concerned.
38
1.
2.
3.
4.
5.
6.
TABLE 14 Distribution of villages not having certain
amenities, arranged by distance ranges from the places where these are available
Number of villages where the amenity Villages not having is not available but available at a distance of
the amenity of -5 5-10 10+ Ttoal
kms. kms. kms. (cols. 2-4)
(1) (2) (3) (4) (5)
Education 3 3
Medical ... 226 61 42 329
Drinking Water
Post and Telegraph ... 332 88 48 468
MarketJHat 252 243 172 667
Communications 93 30 9 132
TABLE 15 Distribution of villages according to the distance from the nearest town and availability of different amenities
Distance No. of Number (with percentages) of villages having the amenity of range inhabited
from the nearest town villages Educa- Medical Drinking Post , Marketl Communi Approach Power (in kms.) in each range tion. water and telegraph hat cation \ by pucca road supply
(1) (2) (3) (4) (5) (6) (7) (8) (9) (10)
0-5 58 55 29 58 17 6 41 34 58 (94.83) (50.00) (100.00) (29.31) (10.34) (70.69) (58.62) (100.00)
6-15 222 222 133 222 85 8 186 103 222 (100.00) (59.91) (100.00) (38.29) (3.60) (83.78) (46.40) (100.00)
16-50 419 419 215 419 142 35 340 202 418 (100.00) (51.31) (100.00) (33.89) (8.35) (81.15) (48.21) (99.76)
51+ 17 17 10 17 4 17 3 17 (100.00) (58.82) (100.00) (23.53) (100.00) (17.65) (100.00)
Unspecified
District Total 716 713 387 716 248 49 584 342 715 (99.58) (54.05) (100.00) (34.64) (6.84) (81.56) (47.77) (99.86)
TABLE 16 Distribution of villages according to population range and amenities available
No. of Number (with percentages) of villages having the amenity of inhabited
Population range villages Educa- Medical Drinking Post Market! Communi Approach Power in each tion water and hat cations by pucca supply range telegraph road
(1) (2) (3) (4) (5) (6) (7) (8) (9) (10)
-499 109 106 30 109 9 3 69 40 109 (97.25) (27.52) (100.00) (S.2{:) (2.75) (63.30) (36.70) (100.00)
500-1,999 461 461 225 46.1 107 3 369 206 461 (100.00) (48.81) (100.00) (23.21) (0.65) (SO.04) (44.69) (100.00)
2,000-4,999 119 119 105 119 105 20 119 73 119 (100.00) (8S.24) (100.00) (88.24) (16.S1) (100.00) (61 'l'1; (100.00)
5,000+ 27 27 27 27 27 23 27 L··. 26 (100.00) (100.00) (100.00) (100.00) (85.19) (100.00) (8C:..1'i (96.30)
All ranges 716 713 387 716 248 49 534 ' , 715 ~.: , ..
(99.58) (54.05) (100.00) (34.64) (6.84) (SI.56) (47 '7) (:)9.S6)
11.6 In all towns of the district facilities are locally available for primary and secondary level of education and also for college education at degree level. In so far as technical education is concerned, Osmanabad town has two medical colleges, one Engineering College and one Polytechnic institute. Tuljapur town has one Engineering College and Umarga has one Polytechnic institute.
TABLE 17
Schools per 10,000 population in Towns
Class, name and Civic status of
Town
(1)
IV Bhum M
IV Kalamb M
IV Murum M
IV Naldurg M
II Osmanabad M
JVParanda M
III Tuljapur M
III Umarga M
All Towns
No. per 10,000 population
Higher Secon- Junior Primary Secon- dary/ Secon-dary/ Matri- daryl Interl culation Middle PUCI
Junior College
(2) (3) (4) (5)
0.67 2.69 2.69 2.69
1.f)1 2.52 3.02 3.52
2.52 2.52 2.52 3.78
1.55 1.55 1.55 3.88
0.59 1.47 1.47 3.53
0.70 1.40 1.40 1.40
0.87 1.74 1.74 3.91 .
0.80 1.59 1.99 3.18
0.98 1.81 1.91 3.35
11.7 Table 17 indicates schools per ten thousand population in towns. On an average the ratios of schools per ten thousand population in urban areas in the district are 0.98 (Higher Secondary/PUC), 1.81 (SecondacylMatriculation), 1.91 (Junior SecondarylMiddle) and 3.35 (Primary Schools). In other words, among urbanites there is a Higher Secondary/PUC for every 10,204 persons SecondarylMatriculation School for every 5539 persons, Middle School for every 5240 persons and primary school for every 2983 persons in the district. There are Marathi, Urdu, Hindi and English medium schools in the district. 4773 girls mainly from poor families have benefited by Smt. Savitri Bai Dattak Palak Scheme in the year 1987-88.
Medical Facilities
11.8 Medical facilities of one or the other type are available in 387 (54.05%) villages out of 716 inhabited villages in the district. In case of Umarga tahsil all except two villages are enjoying the medical facilities. It is observed from tahsil wise figures of villages having medical facility that they are ranging between 23.71 percent in Bhum tahsil to 98.50 percent in Umarga tahsil, within the district, the position is the best in Umarga tahsil, where the population of village with some kind of
39
medical facility is as high as 98.50 percent (Table 12) and 99.48 per cent of its population gets the benefit of medical facilities (Table 13). The proportion of villages with Medical Facilities is above the district average (54.05Si) in Osmanabad and Paranda tahsils besides Umarga tahsil. The primary health centres, Sub- centres and dispensaries serve not only the resident population of the concerned villages but also those residing in surrounding villages. Generally these villages enjoy central location and are somewhat away from towns and tend to be large in population size.
11.9 Medical Facilities of any type specified in the village directory exists in more than five out of every ten (54.05%) villages in 1991. 329 (45.95%) out of 716 villages do not have any type of medical facility in their respective village limits. Of these as many as 226 (68.69%) villages are situated at a distance upto 5 kilometres irom the nearest place where medical facilities are available and 61 (8.54%) villages are located at a distance of 5- 10 kilometres. But in case of 42 (12.77%) villages the residents have to cover more than 10 kilometres to reach a place with some medical facility (Table 14) It is also observed that all the big sized villages (5000+) are equipped with some kind of medical facility within the village, while among small villages (below 500 population) only 27.52 percent of villages have some kind of medical facility (Table 16).
11.10 Table 18 gives the number of beds per 1000 population in the towns. On an average there are nearly three beds per thousand population in urban areas of the district. Out of 8 towns only Umarga town shows somewhat better availability of beds with 5.77 beds per 1000 population and comparatively well equipped Hospitals.
TABLEtS
Number of Beds in Medical Institution in Towns
Class, name and civic status of
Town
IV Bhum
IV Kalamb
IV Murum
IV Naldurg
II Osmanabad
IVParanda
III Tuljapur
mUmarga
All Towns
(J)
M
M
M
M
M
M
M
M
No. of beds in Medical institution per 1,000
population (2)
0.40
0.;;0
2.52
1.63
3.68
1.40
2.78
5.77
2.88
Drinking Water Facilities
11.11 Regarding drinking water facilities, it is heartening to note that such facilities are available in all the villages and towns in the district. It may be mentioned here that factors such as sufficiency or availability of water throught the year or otherwise technical opinion regarding the potability of the available water itself have not been probed into. In most of the villages, open well (662 villages) and hand pumps (574) are the main sources of drinking water, while in 175 villages water is supplied through taps. Rivers and Tanks also provide water to 86 villages (River supply) and 5 villages (tanks)in the district. It is found that 592 (82.68%) out of 716 inhabited villages have more than one type of source of drinking water supply. However there is no village in the district having single source of water supply other than well, tap and hand pump.
TABLE 18.1
Single source of water supply other than Well, Tap and Hand Pump
C.D.Block (1)
L.C.No. (2)
Name of Village Source (3) (4)
-------- Nil -------
11.12 There is an overall improvement mostly in all types of drinking water facilities since 1981. Now 8 villages out of every 10 have more than one type of source of drinking water supply as compared to 3 villages in 1981 (undivided Osmanabad district).
Postal Facilities
11.13 The post and telegraph facility is available to 248 (34.64%) villages out of 716 villages serving 60.39 percent of the rural population of the district. The number of post office is 23 for one lakh rural population of the district. Within the six tahsils of the district, the percentage of the villages having post and telegraph facility varies considerably. Osmanabad with 49.21 percent has the highest proportion, whereas Kalamb tahsil with 14.29 percent holds the last rank.
11.14 Postal facilities are not available to 468 villages. Out of these as many as 332 (70.94%) are situated at a distance of hardly 5 kilometres with
40
reference to the nearest place with postal facilities. The inhabitants of 88 (18.80%) villages have to cover a distance from 5 to 10 kilometres to avail the postal facility. People of only 48 (10.26%) villages have to cover a distance of more than 10 kilometres to avail post and telegraph facility. Among the 248 villages with facility of post and telegraph 9 villages are having less than 500 population, 107 villages are in the size class of 500-1999; 105 villages are in the size class of 2000 - 4999 and 27 villages have population of 5000 and above (Table 16). It is observed that as the population size of villages increases. There is urgent need to provide postal facility also increases. There is urgent need to provide postal facility to a large number of small and medium sized villages.
Weekly Market FQcility
11.15 Generally large villages have at least a few permanent shops wl¥ch deal with the daily necessities of the residents. Weekly markets are also held in some of the important villages. In the rural areas of Osmanabad district such markets are held in as many as 49 (6.84%) villages out of the 716 inhabited villages. The proportion of villages with weekly markets in tahsil varies between 5.04 percent in Ki:tlamb tahsil and 10.53 percent in Umarga tahsil (Table 12). Out of the 49 villages having weekly market facilities as many as 35 are at a distance between 16-50 kms from the nearest town, while the remaining 14 villages are located at a distance of less than 16 kms from the nearest town (Table 15).
11.16 Out of 49 villages where markets are held, three are in the population range of less than 500, 3 are in 500-1999, 20 are in 2000-4999 and 23 are in the population range of 5000 and above. Out of the 667 villages not having weekly markets 252 (37.78%) are located within a distance of 5 kilometres with reference to a place where such a facility is available. In case of 243 (36.43%) and 172 (25.79%) villages the distance to be covered to reach a place where the marketing facility is available 5 to 10 kilometres and more than 10 kilometres respectively.
Communication facility
11,17 If a bus stop or railway station or a navigable waterway is located within the territorial Jurisdiction of a village, it is considered to have been served by such facility even if it is a little away from the
actual settlement. The district has narrow guage fail facility from Kurduvadi to Latur via Ter Dhoki and Yedshi. However it, enjoys comparatively good system of communication facilities mainly through bus routes. There is no navigable waterway facility to the district. 584 (81.56%) villages have some type of communication facility available. The proportion of population of villages served by communication facilities is 90.65 percent of the rural population of the district. Bhum Tahsil with a tally of 100.00 percent of villages appears to be the best served tahsil as against Paranda tahsil with only 62.93 percent villages and holding the last rank.
11.18 Out of 716 villages, 132 (18.44%) villages do not have any bus stop or navigable river and there is no communjcation facility available. Of these 132 villages, the residents of 93 villages have to cover hardly 5 kilometres to reach a place with such facility, for 30 villages it is between 5 and 10 kilometres and for 9 villages it is above 10 kilometres. The availability of this facility depends upon the location of the village with reference to road. Among the 584 villages which have the availability of communication facility within their respective limits 69 villages fall in the populatwn range of less than 500,369 villages are in the range of 500-1999, 119 villages are in the range of 2000-4999 and remaining 27 villages fall in the range of 5000 and above. The population size of a village does have an impact on the availability of communication facilities with large sized villages having better communication facilities. The following table shows the number of various types of vehicles available in the district in the year 1989.
TABLE 18.2
Motor Vehicles - 1989
Item No. of Vehicles (1) (2)
1. Motor Cycles, Scooters 3,362
2. Jeeps 421
3. Taxies 2
4. Rickshaws 113
5. Private Motors for goods transport 246
6. Buses 757
7. Ambulances 2
8. School buses 1
9. Others 1,027
Total 5,931
Source: Assistant Divisional Transport officer, Aurangabad
It is noted from the above table that motor cycles and scooters are substantially higher in number compared to other motor vehicles in the district.
41
Approach Road
11.19 Roads whether 'Pucca' or 'Kachcha' are the nerve centre of a district. They act as a pull factor for a development and upliftment of the area. Roads with cement concrete, black top, Water bound macadam etc. come under pucca road and the remaining are treated as Kachcha road. The length of the roads in the district was 4287.50 kms. in 1988-89. Out of this, 1013.16 kms. and 3032.34 kms. roads are under the control of Public Works Department and Zilla Parishad respectively. The road length in the district is classified as Tar road (865.98 kms.) Water bound macadam (2815.22 kms) and others (364.30 kms.) The type of roads by length are given in the following table.
TABLE 18.3
Types of Roads by length in lana.
Outside the limit of Municipality
Type of Roads PWD Zilla Total
Parishad
(1) (2) (3) (4)
1. Surfacewise Cement Concrete Black Topped ... 712.93 153.05 865.98 Water Bound Macadam 300.23 2514.99 2815.22 Others 364.30 364.30
Total ... 1013.16 3032.34 4045.50
2. Categorywise National Highways ... 78.92 78.92 State HIghway 155.82 155.82 Other State Highway 667.70 667.70 Major DIstrict Roads 110.72 817 .. 46 928.18 Other District Roads 799.51 799.51 Village Roads 1415.37 1415.37 Other Developmental Roads
Total ... 1013.16 3032.34 4045.50
Source 1) 2) 3)
Executive Engineer, PWD Osmanabad Executive Engineer (ZP) Osmanabad All Municipal Councils of Os mana bad district
Within the
limit of
Munici-pality
(5)
10.00 52.9 65.4
113.2
24l.5
241.5
241.5
11.20 The national highway i.e. Bombay - Pune - Solapur to Naldurga, Umarga to Hyderabad, and Bombay - Pune - Solapur - to Tuljapur, Osmanabad, Yedshi, Yermala - Bid to Aurangabad pass through the district. Also some important state highways pass through this district are Vasai - Kalyan -Ahmadnagar - Bhum, state highway no.2, Nagpur -Bori '- Ardhapur - Tuljapur state highway no. 7 A; Daund - Barshi Osmanabad - Borfar - Ausa state Highway no.33; Malkapur - Solapur state highway no. 50A; Miraj - Pandharpur - Barshi - Latur state highway no.60; Deogaon - Pathri - Majalgaon -Dhoki State highway no.100, and Ausa - UmagraKasagi state highway no.lIO.
11.21 In the rural areas of the district there is an improvement in respect of pucca road facility in 1991 compared to 1981. 342 (47.77%) villages are having pucca road facility in 1991 as against 235 in 1981. In this district most of the villages are accessible and are connected either by a pucca or a kachcha approach road or both types of approach roads to main or important road. Kalamb tahsil enjoys a better position with 99.16 per cent of the villages having pucca approach road facility and it holds the first place amongst the six tahsils. On the other hand Umarga tahsil is in the most unfavourable position with only 24.81 per cent villages having this facility. It may be seen that in three other tahsils, the proportion of villages having pucca approach road facility is less than 50 percent, while Paranda tahsil has 67.24 per cent villages with approach by pucca roads (Table - 12). The road network in the rural areas obviously needs lot of improvement in this district with a large number of villages to be provided pucca approach roads.
11.22 An urban centre is favourable factor that helps a village to secure the facility of pucca approach road. Of the villages beyond 50 kilometres from Urban centres, only 17.65 percent are having the pucca road facility. For villages in the distance range of 0-5, 6-15 and 16 - 50 Kilometres, the corresponding proportions work out to 58.62 percent, 46.40 per cent 48.21 per cent respectively.
11.23 The proportion of population of the villages with pucca roads forms 59.32 per cent of the rural population of the district. When examined from this point of view, Kalamb tahsil (98.94%) takes the first place and Paranda tahsil with 80.09 per cent stands second in the list. The remaining four tahsils are below the district rural average. In
42
tahsils of Kalamb and Paranda obviously a greater proportion of large sized villages enjoy the pucca road facility. PopUlation size is an important factor directly associated with availability of pucca road facility. Thus out of 109 villages having population less than 500 only 40 (36.70%) villages have pucca roads whereas out of 27 villages with 5000 and above popUlation 23 (85.19%) have this facility.
Power Supply
11.24 The proportion of electrified villages in Osmanabad district is very impressive. All the 8 towns (100.00%) and 715 villages out of 716 i.e. 99.86 per cent are enjoying the power supply: facility. All the villages in Kalamb, Umaraga, Tuljapur, Paranda and Bhum tahsils are electrified. In the matter of electrification, proximity to urban centre is a favourable factor. In other words th~ villages which are closer to the urban centres are in a better position in respect of electrification. All 280 villages which are located at a distance of less than 16 kilometres from nearest urban centre are electrified. There is only one village from Osmanabad tahsil which does not have power supply facility and the same is located between 16-50 kms. from the nearest urban centre. The table below shows the tahsilwise distribution of villages having power supply for different purposes.
TABLE 18.4 Distribution of villages having Power Supply
District C.D. Blocks
(1)
1. Osmanabad
2. Kalamb
3. Umarga
4. Tuljapur
5. Paranda
6. Bhum
District Total
ED only (2)
1
1
2
EAG only (3)
1
1
EO only (4)
11.25 It is seen that in the district there are 2 villages which have the power supply for domestic purpose only. Electricity for all purposes is available in 573 villages and there is not a single village using power exclusively for other purposes like industrial, commercial etc. The proportion of population of the electrified villages is 99.25 per cent of the rural population of the district. From this point of view Kalamb, Umarga, Tuljapur, paranda and Bhum tahasils enjoy the most favourable position with a coverage of cent per cent villages by power supply. The proportion of rural population served by
ED.EO ED.EAG (5) (6)
44
2
1
1
91
139
EA (7)
124
74
131 124
115
5
573
No Power
(8)
1
1
Total (9)
126
119
133
125
116
97
716
electricity is below the district average in Osmanabad tahsil (96.45%).
11.26 It may be summed up from the foregoing paragraphs that in respect of availability of different types of amenities and facilities considered the larger villages have an advantage over the smaller ones. Population size and availability of amenities are directly associated with each other. The larger villages function as service centres in respect of several surrounding villages and gradually grow into small towns and attain urban status in the course of time.
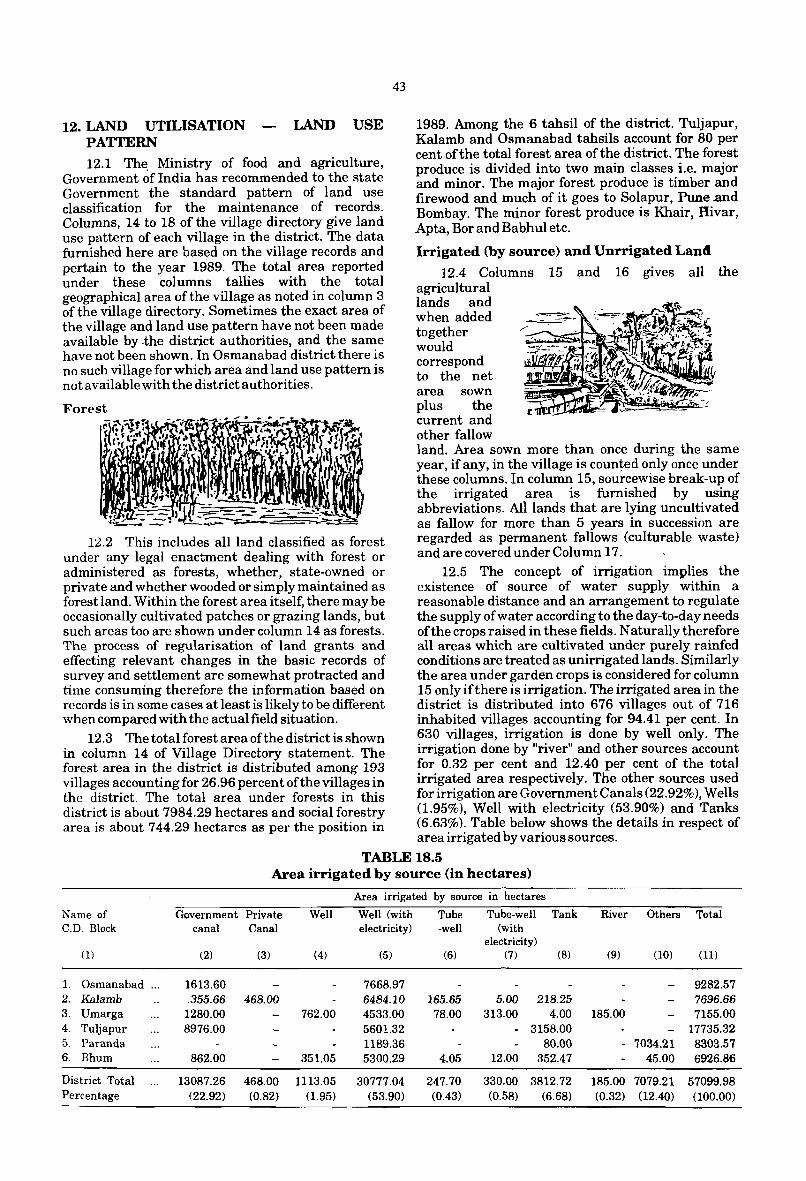
12. LAND UTILISATION PATTERN
LAND USE
12.1 The. Ministry of food and agriculture, Government of India has recommended to the state Government the standard pattern of land use classification for the maintenance of records. Columns, 14 to 18 of the village directory give land use pattern of each village in the district. The data furnished here are based on the village records and pertain to the year 1989. The total area reported under these columns tallies with the total geographical area of the village as noted in column 3 of the village directory. Sometimes the exact area of the village and land use pattern have not been made available by the district authorities, and the same have not been shown. In Osmanabad district there is no such village for which area and land use pattern is not available with the district authorities.
12.2 This includes all land classified as forest under any legal enactment dealing with forest or administered as forests, whether, state-owned or private and whether wooded or simply maintained as forest land. Within the forest area itself, there may be occasionally cultivated patches or grazing lands, but such areas too are shown under column 14 as forests. The process of regularisation of land grants and effecting relevant changes in the basic records of survey and settlement are somewhat protracted and time consuming therefore the information based on records is in some cases at least is likely to be different when compared with the actual field situation.
12.3 The total forest area of the district is shown in column 14 of Village Directory statement. The forest area in the district is distributed among 193 villages accounting for 26.96 percent of the villages in the district. The total area under forests in this district is about 7984.29 hectares and social forestry area is about 744.29 hectares as per the position in
43
1989. Among the 6 tahsil of the district. Tuljapur, Kalamb and Osmanabad tahsils account for 80 per cent of the total forest area of the district. The forest produce is divided into two main classes Le. major and minor. The major forest produce is timber and firewood and much of it goes to Solapur, Pune.and Bombay. The minor forest produce is Khair, Ilivar, Apta, Bor and Babhul etc.
J:rrigated (by source) and Unrrigated Land
12.4 Columns 15 and 16 gives all the agricultural lands and when added together would correspond to the net area sown plus the current and other fallow land. Area sown more than once during the same year, if any, in the village is counted only once under these columns. In column 15, sourcewise break-up of the irrigated area is furnished by using abbreviations. All lands that are lying uncultivated as fallow for more than 5 years in succession are regarded as permanent fallows (culturable waste) and are covered under Column 17.
12.5 The concept of irrigation implies the existence of source of water supply within a reasonable distance and an arrangement to regulate the supply of water according to the day-to-day needs of the crops raised in these fields. Naturally therefore all al"eas which are cultivated under purely rainfed conditions are treated as unirrigated lands. Similarly the area under garden crops is considered for column 15 only ifthere is irrigation. The irrigated area in the district is distributed into 676 villages out of 716 inhabited villages accounting for 94.41 per cent. In 630 villages, irrigation is done by well only. The irrigation done by "river" and other sources account for 0.32 per cent and 12.40 per cent of the total irrigated area respectively. The other sources used for irrigation are Government Canals (22.92%), Wells (1.95%), Well with electricity (53.90%) and Tanks (6.63%). Table below shows the details in respect of area irrigated by various sources.
TABLE 18.5 Area irrigated by source (in hectares)
Area irrigated by source in hectares
Name of Government Private Well Well (with Tube Tube-well Tank River Others Total C.D. Block canal Canal electricity) -well (with
electricity) (1) (2) (3) (4) (5) (6) (7) (8) (9) (10) (11)
1. Osmanabad ... 1613.60 7668.97 9282.57 2. Kalamb .355.66 468.00 6484.10 165.65 5.00 218.25 7696.66 3. Umarga 1280.00 762.00 4533.00 78.00 313.00 4.00 185.00 7155.00 4. Tuljapur 8976.00 5601.32 - 3158.00 - 17735.32 5. Paranda 1189.36 80.00 - 7034.21 8303.57 6. Bhum 862'.00 351.05 5300.29 4.05 12.00 352.47 45.00 6926.86
District Total 13087.26 468.00 1113.05 30777.04 247.70 330.00 3812.72 185.00 7079.21 57099.98 Percentage (22.92) (0.82) (1.95) (53.90) (0.43) (0.58) (6.68) (0.32) (12.40) (100.00)
12.6 Within the district cultivable area is 85.68 percent of the total area. Tahsils exceeding the district average percentage of cultivated area are Kalamb (92.16%), Osmanabad (91.58%), Tuljapur (86.62%) and Umarga· (86.48%). The remaining two tahsils are below the district average. Barely 8.61 percent of the cultivated area
44
of the district is irrigated. Tuljapur and Bhum tahsils have better proportions, (12.73 percent and 10.02 percent respectively) followed by Paranda tahsil (9.15%) which exceeds the district average. The remaining tahsils are below the district average.
TABLEl9
Distribution of villages according to Land use (in hectares)
No.of Percentage of Percentage of Name ofC.D. Block inhabited Total area cultivable area irrigated area to
villages to total area total cultivable area (1) (2) (3) (4) (~)
1. Osmanabad 126 135142.62 91.58 7.50
2. Kalamb 119 120026.03 92.16 6.96
3. Umarga 133 149659.17 86.48 5.53
4. Tuljapur 125 160812.45 86.62 12.73
5. Paranda 116 117616.76 77.19 9.15
6. Bhum 97 90594.97 76.28 10.02
District Total 716 773852.00 85.68 8.61
Note: Cultivable area = Irrigated + Unirrigated
13. BRIEF NOTE ON TOWN DmECTORY. 13.1 There are 8 towns in the district and
all are municipal towns. Three towns namely Osmanabad, Murum, and Tuljapur have been enjoying the urban status from 1901 census onwards, Kalamb, Naldurg from 1941 and remaining three towns namely Umarga, Paranda and Bhum towns are enjoying the urban status from 1951 census onwards.
13.2 over the decades, the old towns have e~erienced a varied history of growth from 1901 to 1991. In 1991 out- of eight towns; two towns i.e. Osmanabad and Umarga have population of more than twenty five thousand eacl} and other six towns have population of less than twenty five thousand eaoh. Statement I of Town Directory gives the growth rate in towns for last 9 decades as well as density and sex ratio in 1981 and 1991.
13.3 In the case of Murum, Naldurg, Osamanabd, Paranda and Tuljapur towns the nearest city with population of one lakh or more is Solapur and for Bhum, Kalamb and Umarga towns the nearest city is Latur. In the proximity to the nearest city, towns in Osmanabad districts are not located favourable being atleast 45 to 75 kms. away from the nearest city. The towns are
not linked by railways. The nearest railway station for Bhum town is Barshi (27 Kms.) for Kalamb it is Yedsi (28 Kms.) for Murum town it is Akkalkot (56 Kms.) for Naldurg town it is Solapur (45 Kms.) for Osmanabad town it is Yedsi (18 kms.) for Paranda town it is Kurduvadi (22 kms.) for Tuljapur town it is Solapur (45 kms.) and for Umarga town it is Latur (75 kms.) Thus the district is not much affected by urbanisation and urban infrastructure. An idea regarding the scale of financial transactions of the civic bodies may be had from the data presented in statement III of the Town Directory.
13.4 Data on civic amenities shows that all the 8 towns are having drainage facilities usually in the form of open surface drains, sewerage facility is also available. Except Uramrga town, other seven towns have water borne latrines though the numbers vary from town to town. The road length in the district varies from town to town. Generally more populous towns have greater road lengths.
13.5 Drinking water is supplied through taps to the inhabitants of 6 out of 8 towns, and the remaining 2 towns have tubewells for water supply. In one town, water is stored in overhead tank
while in other 4 towns there is service reservior and 3 towns have River Infiltration Gallery (IG). The fire fighting facilities are available in Osmanabad and Umarga towns and Bhum and Paranda towns can avail of this facility as and when required from Barshi town (Solapur district) which is at a distance of about 27 and 30 kilometres. Kalamb and Tuljapur towns can avail this facility from Osmanabad town which is at a distance of about 61 and 22 kilometres, and Murum and Naldurg town can avail this facility from Solapur town which is at a distance of about 80 and 45 kilometres. .All the towns of the district are electrified. Comparative figures regarding the numbers of connections to different categories of consumers may be had from statement IV. Osmanabad leads in the number of connections followed by Tuljapur.
13.6 In the state slums in class I (population 1 lakh & above) and class II towns (population 50,000-99,999) are notified by competent authorities. There is one class II town (Osmanabad) in this district having four notified slums and information in this regard is given in Table 20 and statement IV-A of town directory.
TABLE 20
Proporation of Slum Population in Town
Class, name and Proportion of the Density civic statUI slum population inslum
of the to total population (per town of the town sq. km.) m (2) (3)
II Osmanabad (M) 22.05 187500
Total 22.05 187500
13.7 Medical facilities are available in all the eight towns. Facilities of higher education at degree level are available in all the towns. Osmanabad and Umarga towns have a polytechnic institute each. There are two medical colleges located in Osmanabad town. The facilities for studying in engineering degree courses are available at Osmanabad and Tuljapur towns.
13.8 The facility of stadium is available in only one town i.e. Osmanabad while cinema theatres are available in 6 towns out of 8 towns. Osmanabad has 3, Umarga has 1 and Kalamb town has 1 auditorialdrama halls. The facility of reading rooms and public libraries is available in
45
all the eight towns of the district. Since the towns are small in size, there is no facility of working women hostel in any towns of the district but it is available in near by towns of Solapur (Solapur district) and Ambejogai (Bid district).
13.9 Each town is functioning as a marketing centre in respect of surrounding villages. Every
. town has a permanent market and weekly market is also held for the benefit of the villages as well as the town-dwellers. In all the towns, there are banking facilities. Detailed information regarding commodities imported, exported and manufactured is given in !'Jtatement VI of Town Directory.
14. INDUSTRIES
14.1 Industrially, Maharashtra is one of the advanced states in the country, but Osmanabad is one of the industrially underdeve loped district in the state. Railway links contribute in development of industries however narrow guage railway of only 30 kms passes through this district and there is practically no major manufacturing industry in the district. The existing industrial establishments are mostly very small in size. The employment in non-agricultural sector depends mainly upon the village and cottage industries.
14.2 The industrial policy of the state is based on the basic decision to encourage industries in developing and under developed areas in the district and to disperse industries from the heavily congested areas of Bombay to nearby Thane and Pune districts. In the district there are sugar factories one each in Dhoki (Osmanabad tahsil) and Naldurg (Tuljapur tahsil). One spinning mill is located in Tamalwadi (Tuljapur tahsil). MIDC has developed only one industrial estate for setting up of industries. This area is given to small scale as well as large scale industries.
14.3 The most important small scale industry in the district is gur making, having a great demand in the state. Other registered units are Oil mills, Saw mills, handloom weaving, carpentery, pot making, sugar factory, cement products, dal mills, printing and book binding. The following statement gives in detail the number of registered factories with number of workers employed at the state and district level since 1982.
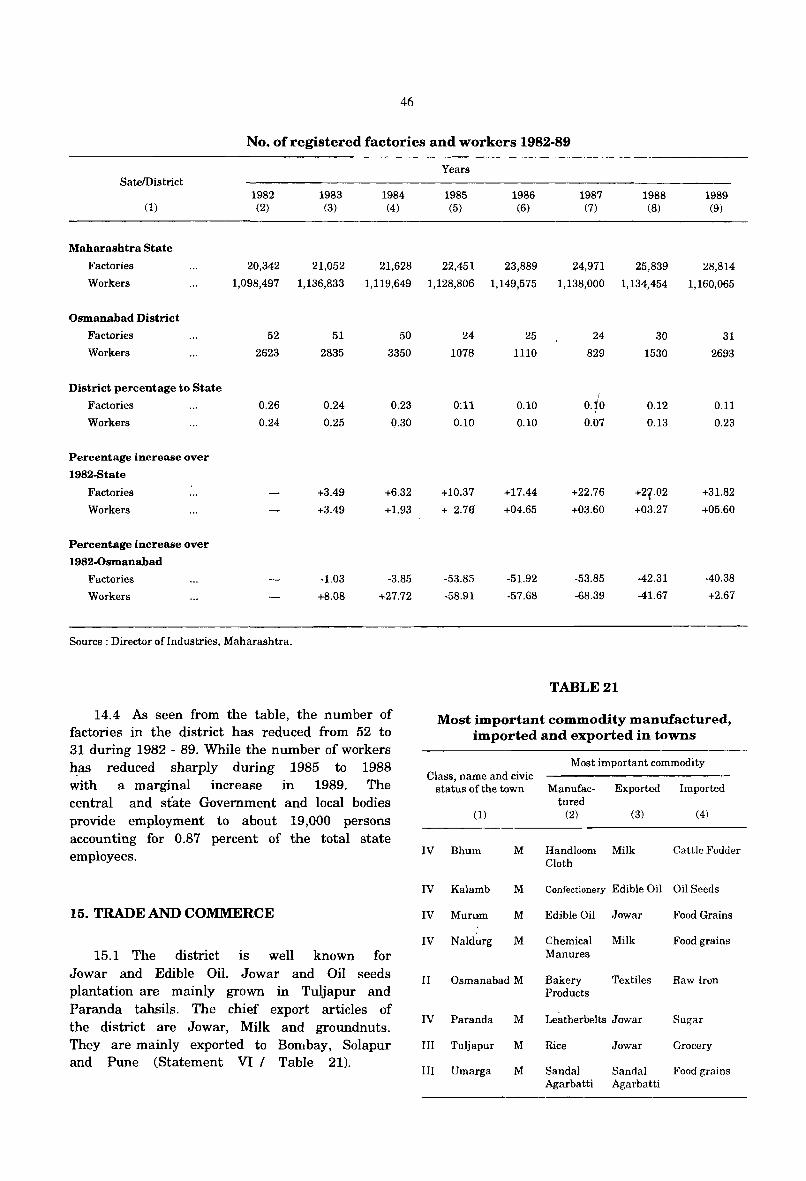
46
No. of registered factories and workers 1982-89
SatelDistrict 1982 1983 1984
(1) (2) (3) (4)
Maharashtra State
Factories 20,342 21,052 21,628
Workers 1,098,497 1,136,833 1,119,649
Osmanabad District
Factories 52 51 50
Workers 2623 2835 3350
District percentage to State
Factories 0.26 0.24 0.23
Workers 0.24 0.25 0.30
Percentage increase over
1982·State
Factories +3.49 +6.32
Workers +3.49 +1.93
Percentage increase over
1982-0smanabad
Factories -1.03 -3.85
Workers +8.08 +27.72
Source: Director ofIndustries, Maharashtra.
14.4 As seen from the table, the number of factories in the district has reduced from 52 to 31 during 1982 - 89. While the number of workers h.as reduced sharply during 1985 to 1988 with a marginal increase in 1989. The central and st'ate Government and local bodies provide employment to about 19,000 persons accounting for 0.87 percent of the total state employees.
15. TRADE AND COMMERCE
15.1 The district is well known for Jowar and Edible Oil. Jowar and Oil seeds plantation are mainly grown In Tuljapur and Paranda tahsils. The chief export articles of the district are Jowar, Milk and groundnuts. They are mainly exported to Bombay, Solapur and Pune (Statement VI I Table 21).
Years
1985 1986 1987 1988 1989 (5) (6) (7) (8) (9)
22,451 23,889 24,971 25,839 28,814
1,128,806 1,149,575 1,138,000 1,134,454 1,160,065
24 25 24 30 31
1078 1110 829 1530 2693
I
0:11 0.10 0.10 0.12 0.11
0.10 0.10 0.07 0.13 0.23
+10.37 +17.44 +22.76 +27.02 +31.82
+ 2.76 +04.65 +03.60 +03.27 +05.60
-53.85 -51.92 -53.85 -42.31 -40.38
-58.91 -57.68 -68.39 -41.67 +2.67
TABLE 21
Most important commodity manufactured, imported and exported in towns
Most important commodity Class, name and civic
status of the town Manufac- Exported Imported tured
(1) (2) (3) (4)
IV Bhum M
IV Kalamb M
IV Murum M
IV Naldurg M
II Osmanabad M
IV Paranda M
III Tuljapur M
III Umarga M
Handloom Milk Cloth
Cattle Fodder
Confectionery Edible Oil Oil Seeds
Edible Oil Jowar
Chemical Milk Manures
Bakery Products
Textiles
Le~therbelts Jowar
Rice Jowar
Sandal Sandal Agarbatti Agarbatti
Food Grains
Food grains
Raw Iron
Sugar
Grocery
Food grains
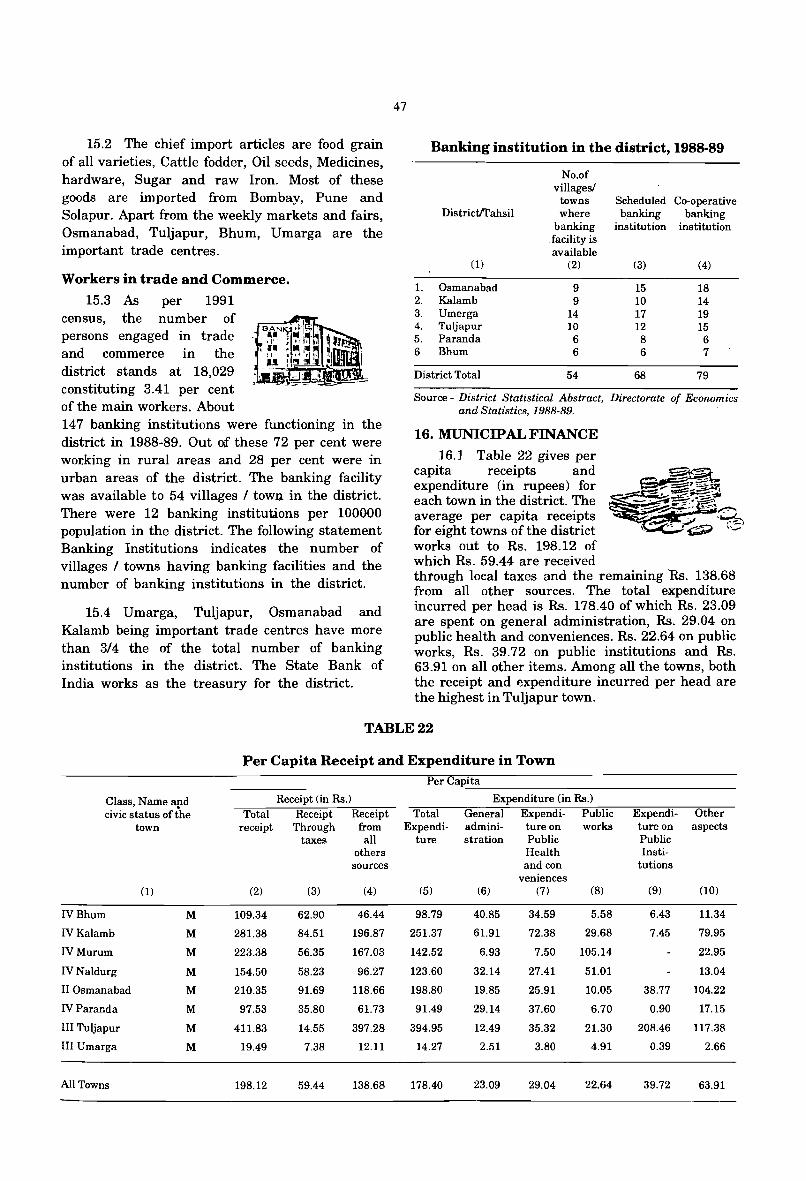
15.2 The chief import articles are food grain of all varieties, Cattle fodder, Oil seeds, Medicines, hardware, Sugar and raw Iron. Most of these goods are imported from Bombay, Pune and Solapur. Apart from the weekly markets and fairs, Osmanabad, Tuljapur, Bhum, Umarga are the important trade centres.
Workers in trade and Commerce. 15.3 As per 1991
census, the number of persons engaged in trade and commerce in the district stands at 18,029 constituting 3.41 per cent of the main workers. About 147 banking institutions. were functioning in the district in 1988-89. Out of these 72 per cent were working in rural areas and 28 per cent were in urban areas of the district. The banking facility was available to 54 villages 1 town. in the district. There were 12 banking institutions per 100000 population in the district. The following statement Banking Institutions indicates the number of villages / towns having banking facilities and the number of banking institutions in the district.
15.4 Umarga, Tuljapur, Osmanabad and Kalamb being important trade centres have more than 3/4 the of the total number of banking institutions in the district. The State Bank of India works as the treasury for the district.
47
Banking institution in the district, 1988-89
No.of villages!
towns Scheduled Co-operative Districtll'ahsil where b;mking banking
banking institution institution . facility is available
(1) (2) (3) (4)
1. Osmanabad 9 15 18 2. Kalamb 9 10 14 3. Umerga 14 17 19 4. Tuljapur 10 12 15 5. Paranda 6 8 6 6 Bhum 6 6 7
District Total 54 68 79
Source - District Statistical Abstract, Directorate of Economics and Statistics, 1988-89.
16. MUNICIPAL FINANCE
16.1 Table 22 gives per capita receipts and expenditure (in rupees) for each town in the district. The average per capita receipts for eight towns of the district works out to Rs. 198.12 of which Rs. 59.44 are received through local taxes and the remaining Rs. 138.68 from all other sources. The total expenditure incurred per head is Rs. 178.40 of which Rs. 23.09 are spent on general administration, Rs. 29.04 on public health and conveniences. Rs. 22.64 on public works, Rs. 39.72 on public institutions and Rs. 63.91 on all other items. Among all the towns, both the receipt and expenditure incurred per head are the highest in Tuljapur town.
TABLE 22
Class, N arne and civic status of the
town
(1)
IV Bhum M
IV Kalamb M
IV Murum M
IV Naldurg M
II Osmanabad M
IVParanda M
III Tuljapur M
III Umarga M
All Towns
Per Capita Receipt and Expenditure in Town Per Capita
Receipt (in Rs.) Expenditure (in Rs.)
Total Receipt Receipt Total General Expend i- Public receipt Through from Expendi- admini- ture on works
taxes all ture stration Public others Health sources and con
veniences (2) (3) (4) (5) (6) (7) (8)
109.34 62.90 46.44 98.79 40.85 34.59 5.58
281.38 84.51 196.87 251.37 61.91 72.38 29.68
223.38 56.35 167.03 142.52 6.93 7.50 105.14
154.50 58.23 96.27 123.60 32.14 27.41 51.01
210.35 91.69 118.66 198.80 19.85 25.91 10.05
97.53 35.80 61.73 91.49 29.14 37.60 6.70
411.83 14.55 397.28 394.95 12.49 35.32 21.30
19.49 7.38 12.11 14.27 2.51 3.80 4.91
198.12 59.44 138.68 178.40 23.09 29,04 22.64
Expendi- Other ture on aspects Public Insti-
tutions
(9) (10)
6.43 11.34
7.45 79.95
22.95
13.04
38.77 104.22
0.90 17.15
208.46 117.38
0.39 2.66
39.72 63.91
16.2 Total receipts of town have increased in 1991 as compared to 1981. The increase is more than two times in Osmanabad, Paranda and Bhum, more than four times in Kalamb, more than five times in' Naldurg, more than six times in Tuljapur and more than eight times in Murum towns. But it has decreased by about fifty per cent in Umarga town. The expenditure has also increased by more than two times in Paranda, more than three times in Osmanabad and Kalamb, more than five times 'in Murum and about six times in Naldurg and Tuljapur towns. It has however decreased by more than sixty per cent in Umarga town.
17. FAIRS AND PLACES OF TOURIST IMPORTANCE
Fairs 17.1 A large number of fairs are held in the
district. Most of the fairs are associated with important deities and religious festivals. So far trade is concered, fairs are complemen tary to the weekly markets. In the fairs, the, shopkeepers and traders set up temporary stalls. Large quantities of clothing, Utensils, Stationery, Sweetmeats, Coconut, "Kumkum", "haladi" etc. are brought for sale. People buy necessary articles in these fairs. Two fairs are very famous in this district. The Tulja Bhavani fair at Tulajapur, about 20 kms. away from Osmanabad district head quarters and 45 kms. from Solapur district head quarters, is held in Ashvina Sud. 1. to Ashvina Sud. 10 Le. during NAVRATRA in the month of September - October. Tulja Bhavani is not only the Goddess of Maharashtra, but she is also the KULASW AMINI of Hindu families of other states. Another fair is held at yermala in Kalamb Tahsil. That in the name of Yedeshwari Devi which starts from Chaitra Sud. 14 to Chaitra Vad. 5 i.e. in the month of January. During the period of these fairs lacs of people visit the temple from all parts of Maharashtra. The devoties believe that the Devi is most propitious and is capable of showering blessings on them. Saint, Gorobafair at Ter, fair of Ramlinga at Osmanabad tahsil and fair of Bhairavnath at Sonari Paranda tahsil are other important fairs in the district.
48
Places of Historical and Tourist Importance. 17.2 Forts, a few old temples and picnic points
in the district play an important role in shaping the socio-economic pattern of the district. Some portion of the district is hilly creating spectacular scenery and attract many people from this district and from out side the district also. The centre of attraction of this district is its natural scenery and historical places, which can be best enjoyed while passing through the district.
Kunthalgiri
17.3 Kunthalgiri is famous for Digambar panthi Jain Temwle in Bhum tahsil of Osmanabad district. There are direct buses from Solapur via Osmanabad. Thousands/of people belonging to Jain Panth from all over India visit this holy temple and holy samadhi of Jain Muni, Shanti Sagar.
Andora
17.4 The place is known for an ancient shrine of Kh.andoba. The temple held hinam" lands from Chhatrapati Sahu. The diety is held in deep veneration by the village folk and on Sunday many devotees pay visit to the temple. All the major Hindu festivals are celebrated at the temple. The temple premises is also used for solemnising marriages and other ceremonies.
17.5 Jamia Masjid located at Kate is said to have been built during the reign of Aurangzeb. The mosque is the most attractive of all places in the village Kate. This village is famous for Kamithesvar temple cincubais vihar. Situated on the western fringe of the village, the "Hemadpanthi" Shrine of Khanthesvar is held in great reverence by village folk.
Forts
17.6 Two famous forts are situated in this district. Naldurg is renowned for its fort and was built by one of the Hindu kings from Chalukyas kingdom of Kalyani. Ibrahim Adil Sah II constructed a dam across the river Bori to supply fort garrisons with water and also built the pani Mahal for his own pleasure. "Pani Mahar' is the major attraction in the fort and during the monsoon, the over flowing waters of the river pass through the palace, but the arrangement is such that it does not enter the palace. This calls for tribute to the engineering skill of the builder. The second famous historical fort at Paranda was the Capital of Nizamshahi emperor. It is said that the famous Malikmaidon Gun kept at present at Bijapur fort originally pertains to Paranda fort.
The same was shifted to Bijapur by Adilshahi commander Mura in 1632 A.D. Besides this, there is a Math of Shri Hansr9j Swami, a famous saint poet of 18th century.
Ter 17.7 Ter from the point of view of archeology.
This is the native place of saint Goroba Kumbhar. There is temple of Gora Kumbhar and thousands of pilgrims visit the temple to have darshana of "Samadhi" There is a museum of state archeological department. From the articles available in the museum it is said that there was direct trade with the Greek and Roman countries from Ter.
18 MAJOR CHARACTERISTICS OF THE DISTRICT 18.1 Osmanabad district is endowed with
three m9jor economic resources i.e. agricultural land, trade and commerce. The district is famous for Jowar and Groundnuts of good quality. Large areas of land . have been brought under this plantation in addition to Cotton, milk products and gur Edible oil is also available in the district. Fishing activites have been started in this district from 1964-65 in a limited area and from 1971 expanded in 4319 hectares of area. There are considerable fishing activities of prawns, tuna and other fish.
5·A
49
18.2 In addition to foodgrains like Jower and Groundnut, the district is famous for production of Tur. Out of total area under cereal productions Tur contribute more than 40 per cent area. Now the production of Sunflower is in significant progress in the district. Similarly, the cultivators are now taking interest in production of Ber in large quantities.
18.3 Marathi is the principal language and is the mother-tongue of more than 80 per cent of the population of the district. The staple food of the people is roti (made from Jowar) and Chatani, B9jra, Wheat and rice is used occasionally. The special dish of the people in the district is "Puranpoli". The Hindus observe a variety of fasts, feasts and festivals throughout the year. Pol a, Dasara, Diwali, Holi, Ramnavami, Hanuman Jayanti, Ganesh Utsav, Buddha Jayati, Muharram are the religious festivals observed by the people. Dasara festival is particularly notable in the district.
Contribution of the district 18.4 Osmanabad district has given many
famous saints like Gora Kumbhar from Ter Village of Osmanabad tahsil, Saint Kalyanswam{' from Domgaon village and Saint Hansaraj swami from Paranda tahsil.

PART A
VILLAGE AND TOWN DIRECTORY
SECTION I
VILLAGE DIRECTORY

SECTION I
VILLAGE DIRECfOBY
Note Explaining the Abbreviations used in the Village .Direetory .
The 'Village DirectorY" is one of the traditional compilations of the census. The format of the directory is almost the same as was prescribed in the 1981 census. It gives the list of villages, their location code numbers, their area, population, amenities such as educational, medicl;ll, communications, drinking water facilities etd. available to them and also the land use, of each village. For this, purpose, villages have been arranged tahsilwise in order of their location code numbers. The inclusion of alphabetical list of villages with 1991 census population and the map of every tahsil depicting location of villages by population size, urban·spread and important infrastructural facilities available therein will further help the readers in identifying any village in the tahsil.
'Village' is a statutory recognised unit having a definite boundary and separate land records. In case a complete village is treated as an outgrowth of urban agglomeration, data on amenities and land use for that village have not been given in the, Village Directory but shown along with the urban component. For those villages which have partly merged in an outgrowth of U .A. data pertaining to remaining part of the village is shown in the Village Directory arid for the part merged or treated as an outgrowth, the details have been given under the concerned urban agglomeration. Land use data for villages treated as Census Towns (Urban) in 1991 census can be seen in Appendix II of the Village Directory.
If a village has fully merged into another village, the location code number and name of the merged village are given both in the Village Primary Census Abstract and the Village Directory at the appropriate place. Data in respect of these two villages put
together appear against the village with which the other village bas merged.
The. ~un-inbabited· vill~es (villages with no population) have been indicated ~ lucb after furnishing details in columns 1 to 3 i.e., the location code nU:fllber, name and area 0(
the village. In addition tp all the above details, following four appendices to Village Directory . have also been included.
. Appendix It C.D.Blockwise (Rural) abstract of educational, medical and other amenities;
Appendix II, Land utililsation data for census towns;
Appendix m, C.D.Blockw:ise list ofYillages with no amenities other than drinklng water facility?
Appendix IV, C.D.Blockwise list of villages according to proportion of Scheduled CastelScheduled Tribes population.
The above four appendixes were also prepared for 1981 Distrlct Census HandboolL The latter two are expected to help the planners for planning inputs in area villages where basic infrastructure is lacking and also for evolving suitable plans for the welfare of Scheduled Castes and Scheduled Tribes.
, ,
The Village Dir~to:ry format has 18 columns and the details given under each column are as under :
, "
Column 1 gives .the location code number of each vill~ as this is n~sary for identification of the village.
Column 2 presents the name t( the village. For filling up of this column, 1981 District Census Handbook has been used as the basis. This also includes the forest and uninhabited villages.
Column 3 shows the area (in hectares) of the village as indicated by the State Revenue Department.
Column 4 gives the population and the number of households in each village, to examine the correlation between the amenities available to the population and the number of households. Figures given within brackets against total population denote the number of households in the village.
Data on amenities such as educational, medical, drinking water, post and telegraph, days of market/hat, communications etc. are shown under columns 5 to 10 of the Village Directory. In case if an amenity is not available within the referent village, a dashC- ) is shown in the column and next to it, in brackets the distance from the village in broad ranges viz., upto 5 kIns, 5·10 luns and 10 kms. to the nearest place where the facility is available has been given. This will help not only for looal area planning but in regulating the provision of goods and services as well, so as to minimise the regional inbalance in the' process of development.
Column 5 shows the number of educatinal institutions viz., primary or elementary school, junior secondary or middle school, matriCUlation or secondary school, higher secondary lintermediate/pre-university/ junior college, college, industrial school, training school, adult literacy schooVcentre and other educational institutions (sanskrit pathshala, senior basic school, makhtab etc.)
If in a village, secondary school has middle and primary classes also the same has been counted as three schools i.e., secondary, middle and primary school. In case, there are more than one institution of any type in a village their number is indicated within brackets against the prescribed abbreViation. Following abbreviations have been u~ed for presenting data on educational amenities :-
Primary of elementary school . . . . P
Junior secondary Of Middle school . M
. Matriculation or Secondary school
Higher secondarylIntermediatel
.R
. Pre-university/Junior college . . .PUC
., Coliege, Any college (graduate
54
level and above) like Arts, Science, Commerce etc. . C
Industrial school . I
Training school . . Tr.
Adult literacy class/centre . AC
Other educational institutions (sanskrit patbshala, senior basic school, Makhtab etc.) ............ ,0
Colutnn 6 provides data' on m~dical facilities available in the Village. Various types of medical institutions included and codes used for them are as follows :.
Hospital .... / . . . . . . . . . . . H ,
Maternity and child welfare centre MCW
Maternity home . . . ':
Child welfare centre
Health centre ....
Primary health centre
Primary health sub centre
.. \
Dispensary ....... .
Family planning centre
T.B.Clinic
Nursing home
Registered private practitioner
Subsidised medical practitioner
Community health worker
Others (specify) . . . . . .
.MH
.CWC
.He
.PHC
. PHS
.0
. FPC
.TB
.NR
.RP
.SMP
.CHW
.0
Column 7 gives information regarding availability of drinking water within the village. In case more than one source is available to the village the same has been in<Jj.cated. Following abbreviations have been used for indicating the source of drinking water in the village :-
Tap wa~r . T
Well water. .W
Tank water .TK
Tubewell water .TW
IIi Handpump (Borewell) . ,~ . .HP
River water .R
Fountain . . F
Canal .C
Lake. .L
Spring .S
Nallah . .N
Others (specify) .0
Infonnation not available .. NA
Column 8 provides the postal facilities such as post office, telegraph office, post and t.elegraph office and telephone connections available in the village. Following codes are adopted for indicating the information.
Post office . . PO
Telegraph office ...... . TO
Post and Telegraph office . PrO
Telephone connection . . . . Phone
Column 9 presents the information on day or days of the marketlhat held in the village. This information is based on local enquiry and generally relates to weekly or bi-weekly market. If the market is held daily, monthly or fortnightly it has been recorded accordingly. If MarketlHat is not held in villages of the concerned tahsil at all, this column has been left bank.
Column 10 gives information as to whether the village is served by any mode of public transport like bus, rail water-way and the same has been indicated as follows :-
Bus stop .BS
Railway station . RS
Navigable water-way (including river canal, back-water etc.) " .. NW
Column 11 refers to the state of roads etc. leading to the village. This is useful in determining as to whether the village is approachable both in fair and foul weather, and whether it is inaccessible only for some time in the year. The approach to village has been indicated by the following c-odes.
Pucca road (Cement concrets, Black
55
Top Water BoundlMacadam)
Kachcha road .
Foot-path ... ' .
Navigable river
Navigable canal
Navigable water-way (other than river or canal) ......... .
.PR
.KR
.FP
.NR
.Ne
.. NW
Column 12 gives the information of the nearest town and its distance in kilometres in bracket from the referent village. In case, the neatest town is located in another state, the name of the state has also been furnIshed.
Column 13 relates to the availability of power supply to the village. The various codes used for this purpose are as follows :-
Electricity for domestic purpose . ED
Electricity for agriculture .... . EAG
Electricity for other purpose like
industrial, commercial etc.
Electricity for all purposes listed aboveEA
In case the power supply is released only for specific purpose, say agriculture or other it has been stated accordingly. In case the electricity is not available to the village, a dash{-) has been mentioned in the column.
Column 14 to 18 give the details about land utilization. The land use pattern given in the Village Directory conforms to the pattern of classification of land use as recomended by the Ministry of Agriculture, Government of India. The Ministry of Agriculture has recommended the maintenance of records of land use pattern under five categories. These are as follows
1. Forests
2. Not available for cultivation -
(a) Lands put to non-agricultural uses
(b) Barren and unculturable lands
3. Other uncultivated lands excluding fallow lands :-
(a) Perement pastures and other grazing
lands
(b) Lands under miscellaneous tree crops and groves not included in the net area soon.
(c) Culturable wastes.
4. Fallow lands :.
(a) Fallow lands other than -current fallows
(b) Current fallows
5. Net area soon
Columns 14 includes all lands classed as forests under any legal enactment dealing with forests or administrerd as forests, whether owned or private, and whether wooded or maintained as potential forest l~nd. The area of crops raised in the forest and grazing lands or areas open for grazing within the forests has been included under the forest area.
Column 15 and 16 cover, all agricultural lands including the net area sown with crops and orchards or not cropped area and also current and other fallow lands. The latter would imply all lands which were taken up for cultivation, but are temporarily out of cultivation for a period of not less thim one year and not more than five years. The columns does not include gross area sown or gross cropped area. Net area sown thus represents the area sown with crops and 9rchards. Area sown more than once in the same year has been counted only once. Column 15 indicates extent of irrigated lands under various types of irrigation. The following codes in respect of the sources are adopted.
Government canal
Private canal . . .
.. GC
.PC
56
Well (Without electricity) .W
Well (With electricity) .. .WE
Tube·Well (Without electricity .TW
Tube-Well (With electricity) .TWE
Tank .TK
River .R
Lake .L
Water fall .Wf
Others (specify) .0
Total ...... .T
Column 17 gives information on culturable waste lands and inclu<;ies all lands available for cultivation whetb8r not taken up for cultivation or taken up for cultivation once but not cultivated during the preceding five years or more in succession. Such lands may be ei~her fallow or covered with shrubs and jungles \Yhich are not put to any use. These may be assessed or unassessed and may be in isolated blocks within cultivated holdings. Lands under thatching grasses, bamboo, bushes and other groves for fuel etc. which are not included under orchards or forests are included. in this category. All grazing lands, whether they are permanent pastures and meadows or not, village common and grazing lands within forest area are also included in this column.
Column 18 includes the land not available for cultivation such as barren, unculturable land and put to non-agricultural use. All bonds occupied by buildings, roads, railways, rivers, canals etc. form part of the land under non·agricultural uses. Barren and unculturable lands include mountains, rocks, deserts etc. which cannot be brought under cultivation, except at a very high cost.
Sr.
No.
(1)
57
STATEMENT
LIST OF VILLAGES FULLY MERGED IN TOWNS AND OUTGROWTH AT 1991 CENSUS
Location
Name ofViUages Code No. Merged in towns and outgrowths
1981 (2) (3) (4)
NIL----------
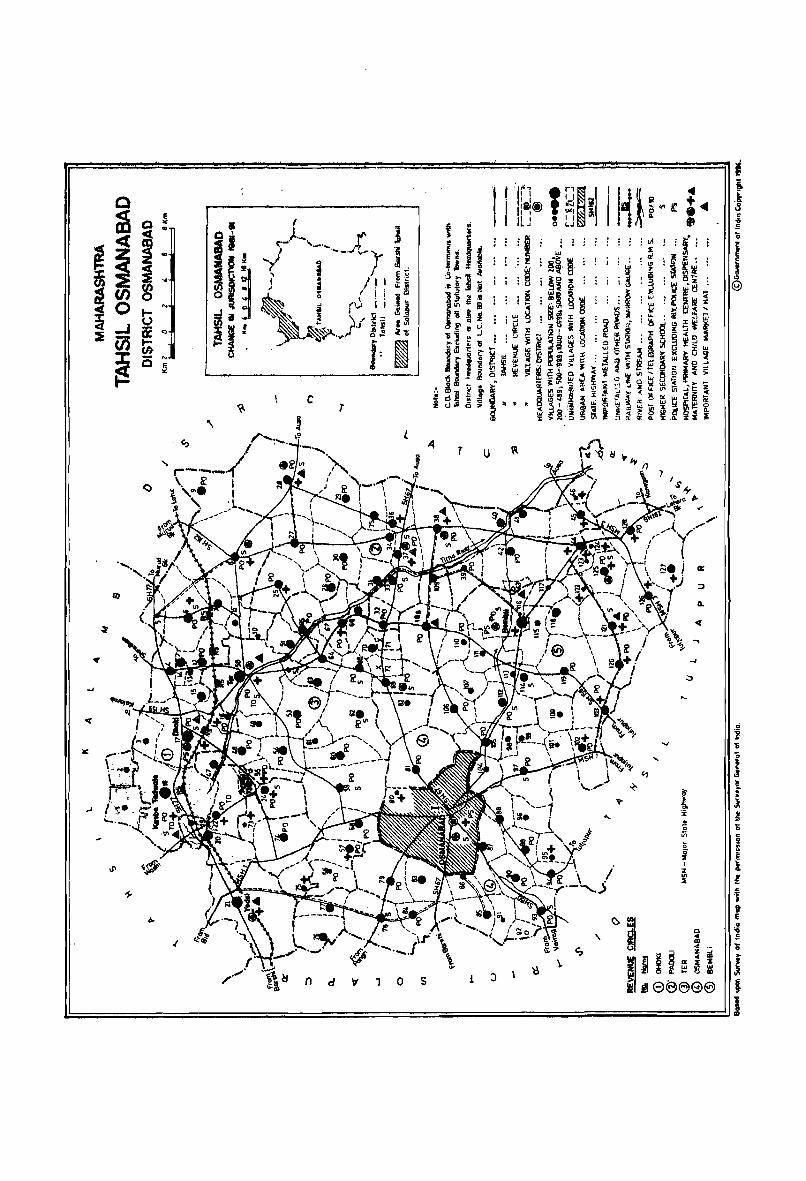
j " '5
.... "£ c c, .!
I ~ ~
'9" ! x ~ ... ~ 1!i iii
~ } I I Z
~ II)
:I
·i It
~ ~ 1 Q 'II E ,
~ 1;
- ~ ~ ... ~
~ ¥ ~ ~ ~ i j~o:~1!l ... GI \ ~
iii! !I eiBe> ee J i ::>
E
J
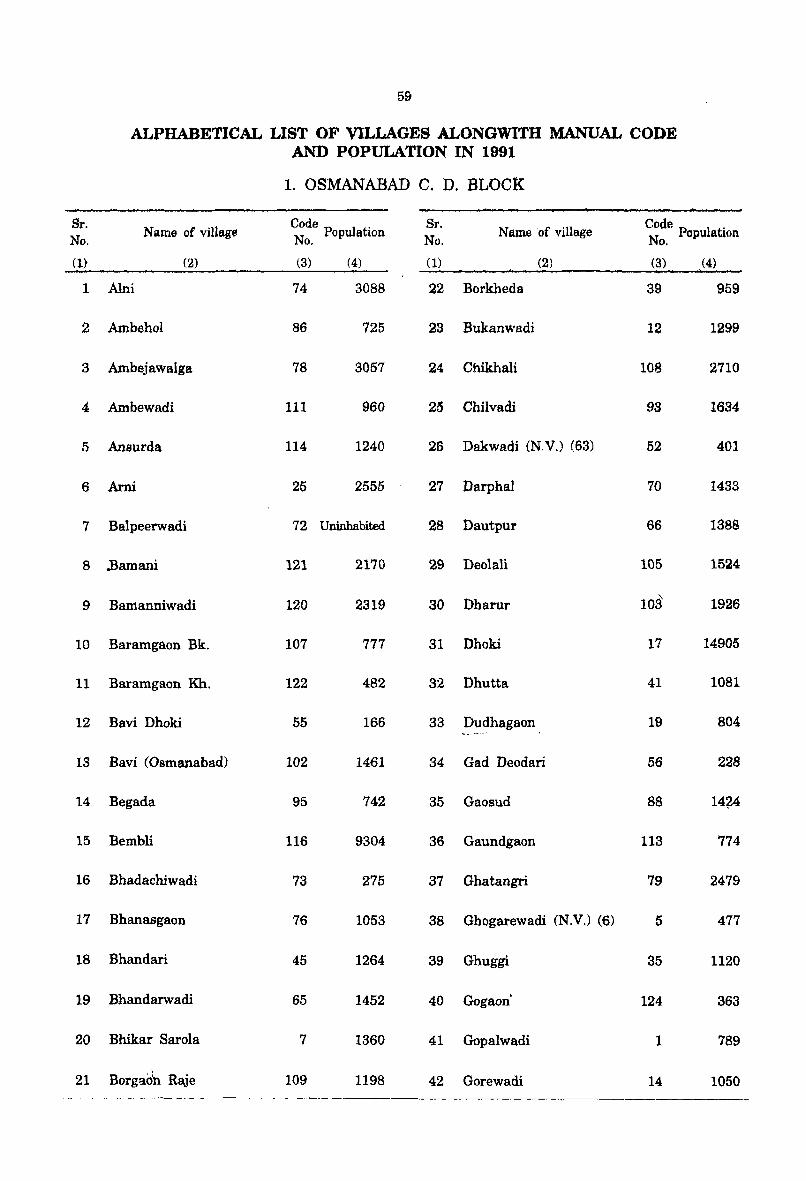
59
ALPHABETICAL LIST OF VILLAGES ALONGWITH MANUAL CODE AND POPULATION IN 1991
1. OSMANABAD C. D. BLOCK
Sr. Name of village
Code . Sr. Name of village
Code No. N PopulatlOn No. N Population o. o.
(1) (2) (3) (4) (1) (2) (3) (4)
1 Alni 74 3088 22 Borkheda 39 959
2 Ambehol 86 725 23 Bukanwadi 12 1299
3 Ambejawalga 78 3057 24 Chikhali 108 2710
4 Ambewadi 111 960 25 Chilvadi 93 1634
5 Ansurda 114 1240 26 Dakwadi (N.V.) (63) 52 401
6 Ami 25 2555 27 Darphal 70 1433
7 Balpeerwadi 72 Uninhabited 28 Dautpur 66 1388
8 .Bam ani 121 2170 29 Deolali 105 1524
9 Bamanniwadi 120 2319 30 Dharur lOa 1926
10 Baramgaon Bk. 107 777 31 Dhoki 17 14905
11 Baramgaon Rh. 122 482 32 Dhutta 41 1081
12 Bavi Dhoki 55 166 33 Dudhagaon 19 804
13 Bavi (Osmanabad) 102 1461 34 Gad Deodari 56 228
1.4 Begada 95 742 35 Gaosud 88 1474
15 Bembli 116 9304 36 Gaundgaon 113 774
16 Bhadachiwadi 73 275 37 Ghatangri 79 2479
17 Bhanasgaon 76 1053 38 Ghogarewadi (N.V.) (6) 5 477
18 Bhandari 45 1264 39 Ghuggi 35 1120
19 Bhandarwadi 65 1452 40 Gogaon' 124 363
20 Bhikar Sarola 7 1360 41 Gopalwadi 1 789
21 Borgaoh Raje 109 1198 42 Gorewadi 14 1050
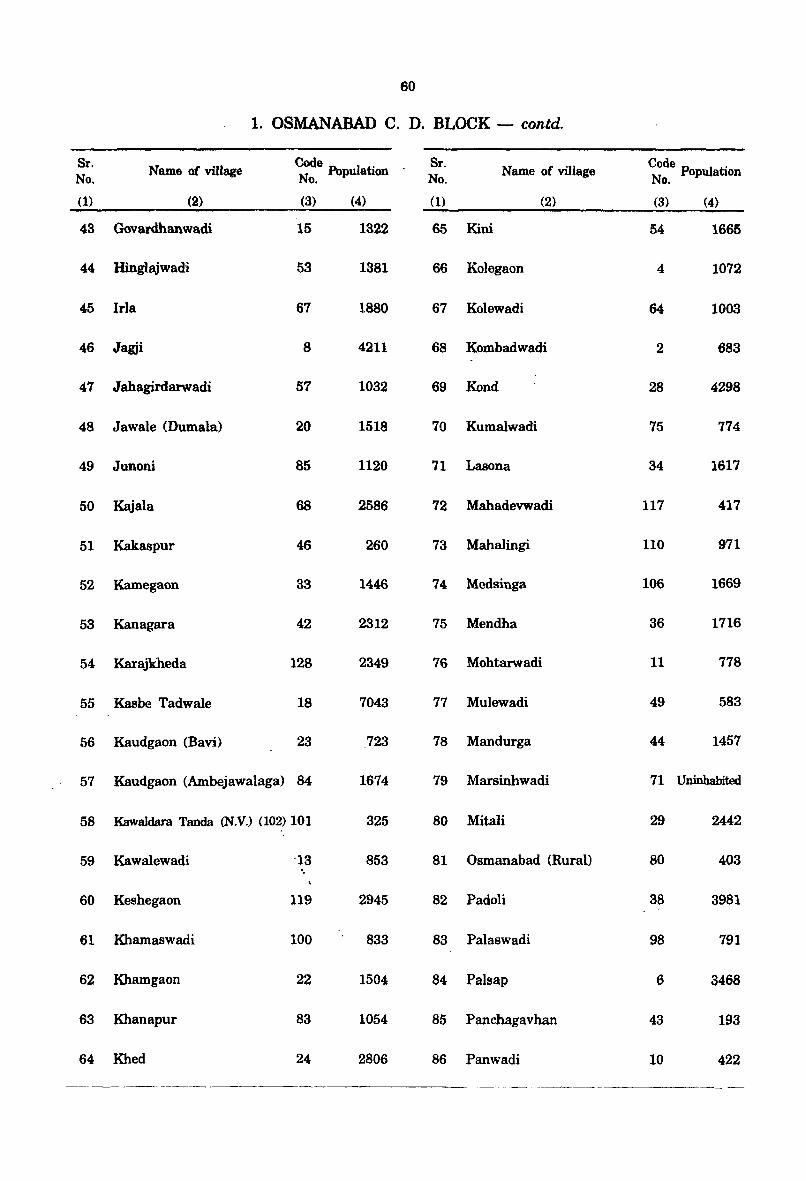
60
I, OSMANABAD C. D. BLOCK - contd,
Sr. Name of village ~e Population
Sr. Name of village
Code . No. No. N Populatlon o. o.
(1) (2) (3) (4) (1) (2) (3) (4)
43 Govardhanwadi 15 1322 65 Kini 54 1665
44 Hinglajwadi 53 1381 66 Kolegaon 4 1072
45 IrIa 67 1880 67 Kolewadi 64 1003
46 Jagji 8 4211 68 Kombadwadi 2 683
47 Jahagirdarwadi 57 1032 69 Kond 28 4298
48 Jawale (Dumala) 20 1518 70 Kumalwadi 75 774
49 Junoni 85 1120 71 Lasona 34 1617
50 Kajala 68 2586 72 Mahadevwadi 117 417
51 Kakaspur 46 260 73 Mahalingi 110 971
52 Kamegaon 33 1446 74 Medsinga 106 1669
53 Kanagara 42 2312 75 Mendha 36 1716
54 Karajkheda 128 2349 76 Mohtarwadi 11 778
55 Kasbe Tadwale 18 7043 77 Mulewadi 49 583
56 Kaudgaon (Bavi) 23 723 78 Mandurga 44 1457
57 Kaudgaon (Ambejawalaga) 84 1674 79 Marsinhwadi 71 Uninhabited
58 Kawaldara Tanda (N.V.) (102) 101 325 80 Mitali 29 2442
59 Kawalewadi -13 853 81 Osmanabad (Rural) 80 403 '.
60 Keshegaon 119 2945 82 Padoli 38 3981
61 Khamaswadi 100 833 83 Palaswadi 98 791
62 Khamgaon 22 1504 84 Palsap 6 3468
63 Khanapur 83 1054 85 Panchagavhan 43 193
64 Khed 24 2806 86 Panwadi 10 422
~------- ----
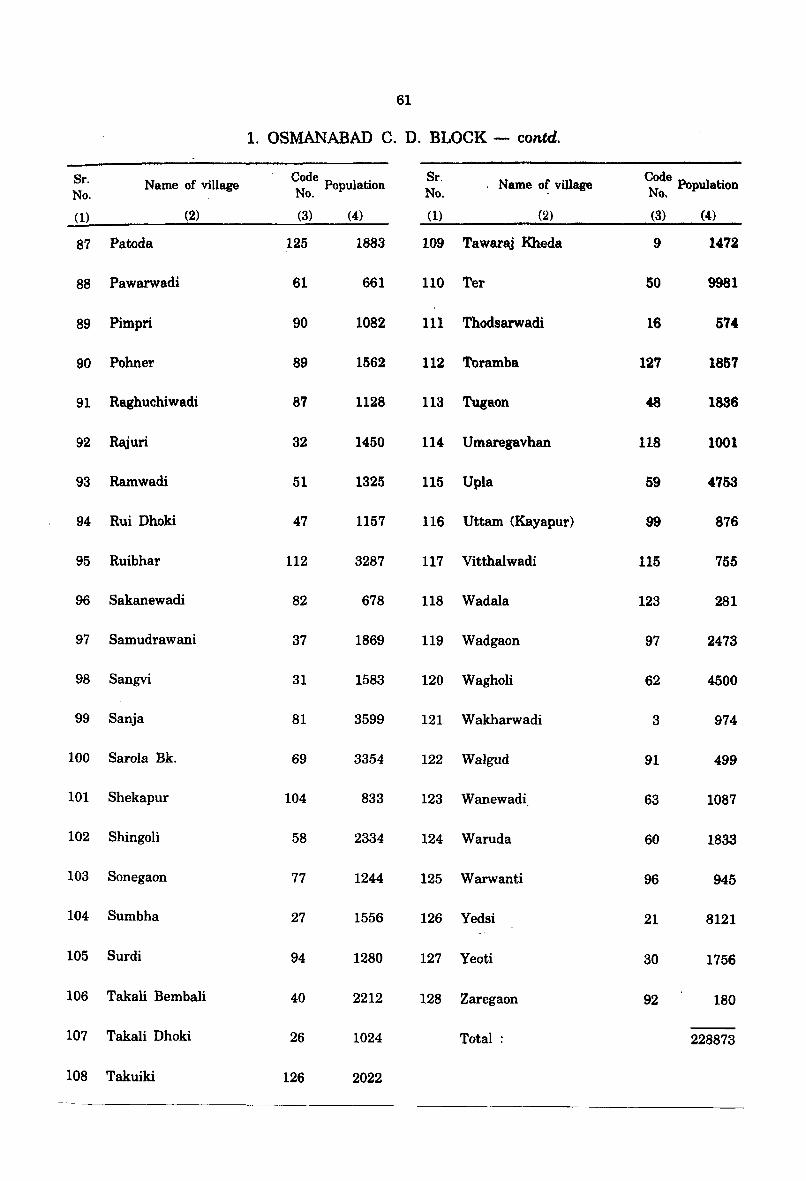
61
1. OSMANABAD C. D. BLOCK - contd.
Sr. Name of village Code . Sr. Name of village ~ode Population N Population No. No. o. o.
(1) (2) (3) (4) (1) (2) (3) (.I)
87 Patoda 125 1883 109 Tawarfij Kheda 9 1472
88 Pawarwadi 61 661 110 Ter 50 9981
89 Pimpri 90 1082 111 Thodsarwadi 16 574
90 Pohner 89 1562 112 Toramba 127 1857
91 Raghuchiwadi 87 1128 113 Tugaon 48 1836
92 Rajuri 32 1450 114 Umaregavhan 118 1001
93 Ramwadi 51 1325 115 Upla 59 4753
94 Rui Dhoki 47 1157 116 Uttam (Kayapur) 99 876
95 Ruibhar 112 3287 117 Vitthalwadi 115 755
96 Sakanewadi 82 678 118 Wadala 123 281
97 Samudrawani 37 1869 119 Wadgaon 97 2473
98 Sangvi 31 1583 120 Wagholi 62 4500
99 Sanja 81 3599 121 Wakharwadi 3 974
100 SaroIa Bk. 69 3354 122 Walgud 91 499
101 Shekapur 104 833 123 Wanewadi 63 1087
102 Shingoli 58 2334 124 Waruda 60 1833
103 Sonegaon 77 1244 125 Warwanti 96 945
104 Sumbha 27 1556 126 Yedsi 21 8121
105 Surdi 94 1280 127 Yeoti 30 1756
106 Takali Bembali 40 2212 128 Zaregaon 92 180
107 Takali Dhoki 26 1024 Total: 228873
108 Takuiki 126 2022
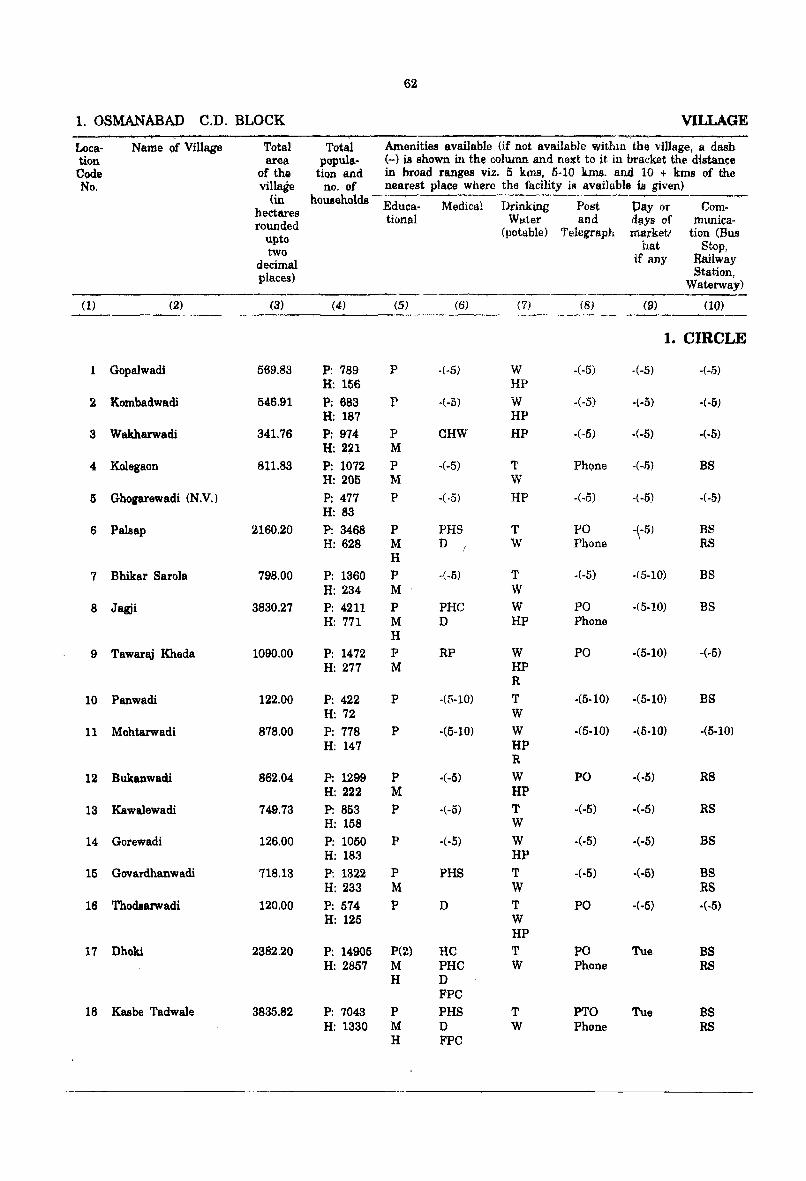
62
1. OSMANABAD C.D. BLOCK VIllAGE "'-"-Loca- Name of Village Total Total Amenities available (if not available Within the .. illage, a dash
tion area popule.- (-) is shown in the column and next to it in bracket the distance CQde of the tion and in broad ranges viz. 5 kms. 5-10 lun$. and 10 + kms of the No. village no. of nearest place where the facility 18 available is given)
(in households ~------
hectares - Educa- Medical Drinking Post Oayor Com-
rounded tiona1 WElter and allYs of munica-
upto (potable) Telegraph market! tion (Bus
two hat Stop,
decimal if any Railway
places) Station, Waterway)
---~-,-~...----------.
(1) (2) (3) (4) (5) (6) (7) (8) (9) (10) --_--"---------1. CIRCLE
1 Gopalwadi 569.83 P: 789 P -(-5) W -(-5) .(-5) -(-5)
H: 156 HP
2 Kombadwadi 546.91 P: 683 r .( -5) W -(-5) .(-5) -(-5) H: 187 HP
3 Wakharwadi 341.76 P: 974 P CHW HP -(.·5) -(-5) +5) H: 221 M
4 Kolegaon 8U.83 P: 1072 P -( -5) '1' Phone o( -15) BS H: 205 M W
5 Ghogarewadi (N.V.) P: 477 P ·(·5) HP -(-5) -(-5) -(-5)
H: 83
6 Palsap 2160.20 P: 3468 P PHS T PO -\-5) BS H: 628 1\1 D W Phone RS
H
7 Bhikar Sarola 798.00 P: 1360 P .. ( -5) T -(-5) -(5-10) BS H: 234 M W
8 Jagji 3830.27 P: 4211 P PHC W PO -(5-10) BS H: 771 M D HP Phone
H
9 Tawaraj Kheda 1090.00 P: 1472 P RP W PO -(5-10) -(-5)
H: 277 M HP R
10 Panwadi 122.00 P: 422 P ·(5-10) T -(5-10) -(5-10) BS H: 72 W
11 Mohtarwadi 878.00 P: 778 P -(5-10) W ·(5·10) -(5-10) -(5-10) H: 147 HP
R
12 Bukanwacli 862.04 P: 1299 P -(-5) W PO ·(-5) RS H: 222 M HP
13 Kawalewadi 749.73 P: 853 P 0(-5) T -(-5) -( -5) RS H: 158 W
14 Gorewadi 126.00 P: 1050 P -(-5) W -(-5) -(-5) BS H: 183 HP
15 Govardhanwadi 718.13 P: 1322 P PHS T -(-5) -(-5) BS H: 233 M W RS
16 Thodaarwadi 120.00 P: 574 P D T PO -(-5) ·(-5) H: 125 W
HP
17 Dhoki 2382.20 P: 14905 P(2) He T PO Tue BS H: 2857 1\1 PHC W Phone RS
H D FPC
18 Kasbe Tadwale 3835.82 P: 7043 P PHS T PTO Tue BS H: 1330 M D W Phone RS
H FPC
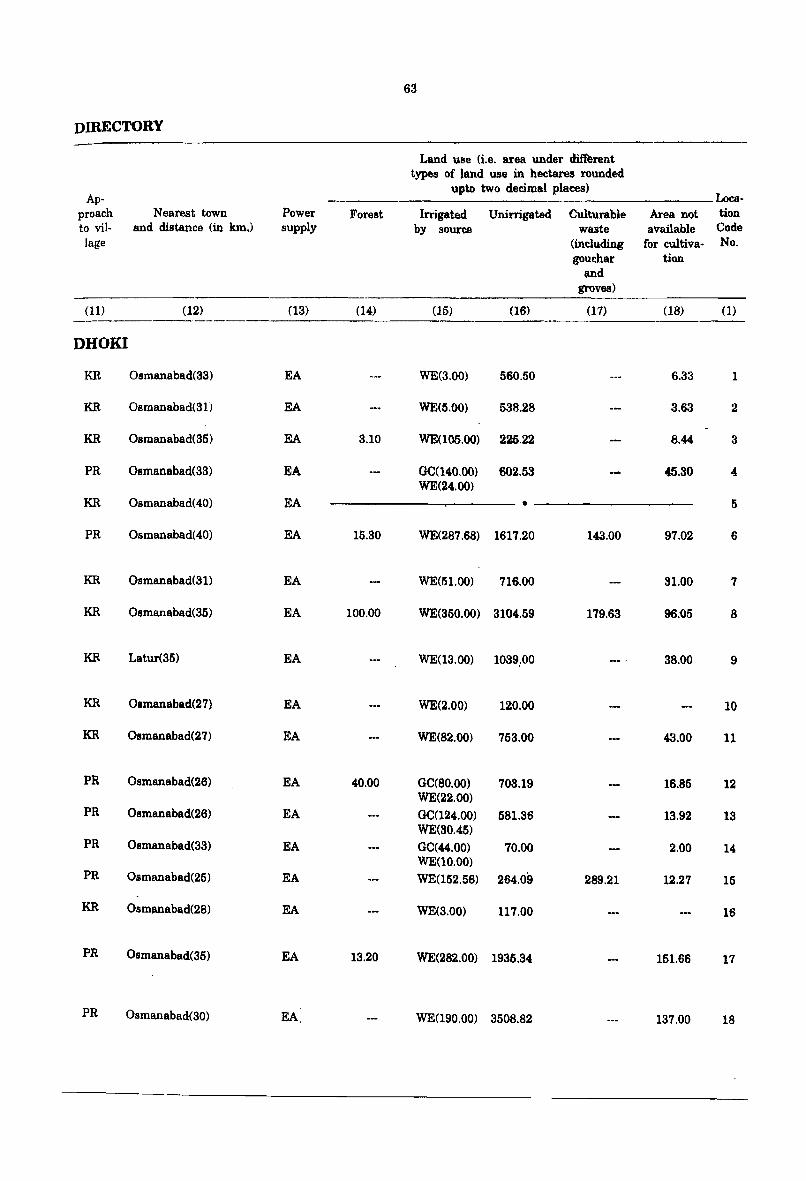
63
DffiECTORY
Land use (i.e. area under different types of land use in hectares rounded
Ap-upto two decimal places)
Loea-proach Nearest town Power Forest Irrigated Unirrigated Culturable Area not tion to vii· and distance (in km,) supply by source waste available Code lage (including for cultiva- No.
gouchar tion and
groves)
(11) (12) (13) (14) (15) (16) (17) (18) (1) . __ ._-
DHOKI
KR Osmanabad(33) EA WE(3.00) 560.50 6.33 1
KR Osmanabad(31) EA WE(5.00) 538.28 3.63 2
KR Osmanabad(35) EA 3.10 WE(l05.oo) 225.22 8.44 3
PR Osmanabad(33) EA 00(140,00) 602.53 0&5.30 " WE(24.00)
KR Osmanabad( 40) EA • 5
PR Osmanabad(40) EA 15.30 WE(287.68) 1617.20 142.00 97.02 6
KR Osmanabad(31) EA WE(51.oo) 716.00 31.00 7
KR Osmanabad(35) EA 100.00 WE(S50.oo) 3104,59 179.63 96.05 8
KR Latur(35) EA WE(13.oo) 1039:00 38.00 9
KR Osmanabad(27) EA WE(2.00) 120.00 10
KR Osmanabad(27) EA WE(82,00) 753.00 43.00 11
PR Osmanabad(26) EA 40.00 GC(80.00) 703.19 16.85 12 WE(22.00)
PR Osmanabad(26) EA 00(124.00) 581.36 13.92 13 WE(30.45)
PR Osmanabad(33) EA GC(44.00) 70.00 2.00 14 WE(10.00)
PR Osmanabad(25) EA WE(152.56) 264.09 289.21 12.27 15
KR Osmanabad(28) EA WE(3.00) 117.00 16
PR Osmanabad(35) EA 13.20 WE(282.00) 1935.34 151.66 17
PR Osmanabad(30) EA WE(190.00) 3508.82 137.00 18
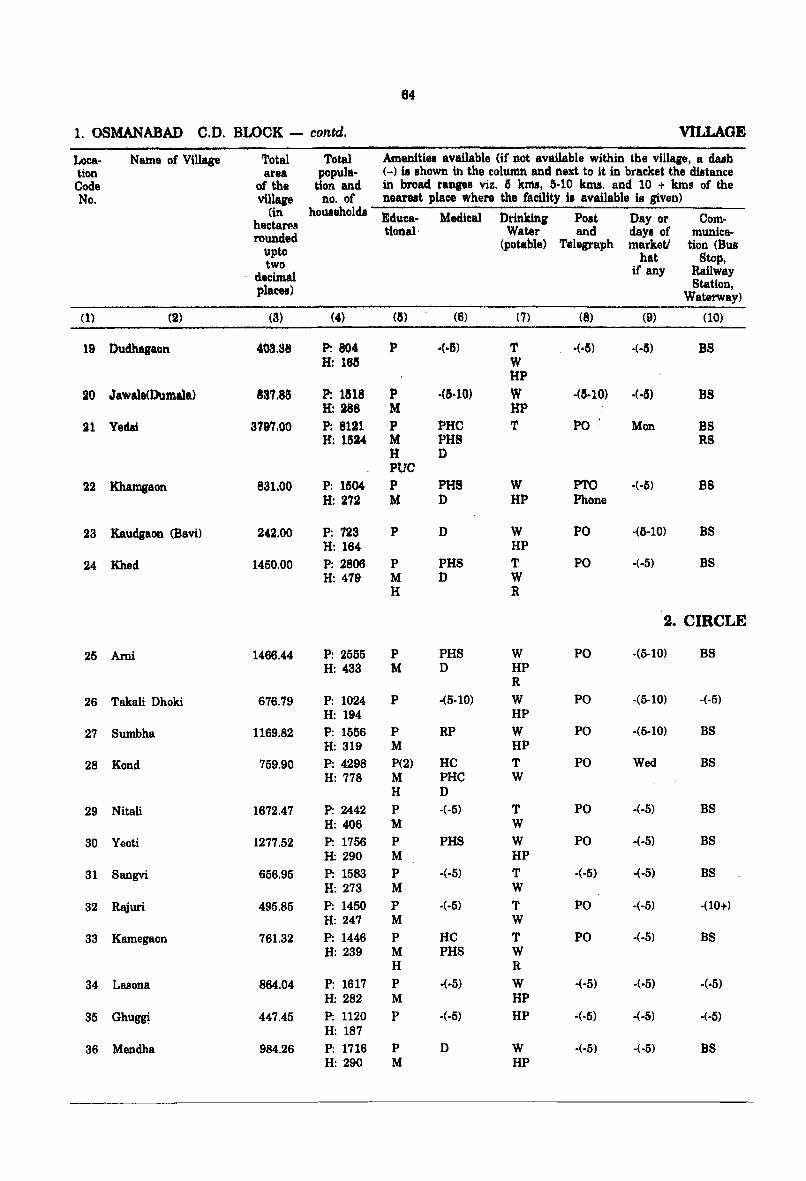
64
1. OSMANABAD C.D. BLOCK - contd. vtu.AGE
Loca- Name of Village Total Total Amenitiet available (if not available within the village, a dash tion area popula- (-) 11 Ihown in the column and next to it in bracket the diJtance
Code of the tion and in broad ranges viz. 6 lema, 5-10 kms. and 10 + luns of the No. village no. of nearut place where the facility fa available is given)
(in houteholda Educa- Medical Drinking POlt Day or Com-hectal'fls rounded
tional, Water and daYI of munica-
upto (potable) Telegrajlh marketl tion (Bus
two hat Stop,
. decimal if any Railway
placet) Station, Waterway)
(1) (2) (3) (4) (15) (6) (7) (8) (9) (10)
19 Dudhagaon 403.38 P: 804 P ·(·6) T +5) ·(·5) BS H: 1811 W
liP
20 Jawale(Dumala) 837.815 P: 1518 P ·(5·10) W -(IS· 10) ·(·5) BS H: 288 M HP
21 Yedai 3797.00 P: 8121 P PHC T PO ' Mon BS H: 1524 M PHS RS
H D PUC
22 Khamgaon 831.00 P: 1504 P PHS W PTO ·(·5) BS H: 272 M D HP Phone
23 Kaudgaon (Bavi) 242.00 P: 723 P D W PO ·(6·10) BS H: 184 HP
24 Khed 1450.00 P: 2808 P PHS T PO -(-5) BS H: 479 M D W
H R
2. CIRCLE
25 Ami 1488.44 P: 2565 P PHS W PO ·(5-10) BS H: 433 M D HP
R
26 Tak.aU Dhoki 678.79 P: 1024 P -(5-10) W PO -(5-10) -(-5) H: 194 HP
27 Sumbha 1169.82 P: 1556 P RP W PO -(5-10) BS H: 319 M HP
28 Kond 759.90 P: 4298 P(2) HC T PO Wed BS H: 778 M PHC W
H D
29 Nitali 1672.47 P: 2442 P -(-5) T PO -(-5) BS H: 406 M W
30 Yeoti 1277.52 P: 1756 P PHS W PO -(-5) BS H: 290 M HP
31 Sangvi 656.95 P: 1583 P -(-5) T -(-5) -(-5) BS H: 273 M W
32 Rajuri 495.85 P: 1450 P -(-5) T PO -(-5) -(10+) H: 247 M W
33 Kamegaon 761.32 P: 1446 P HC T PO -(-5) BS H: 239 M PHS W
H R
34 Lasona 864.04 P: 1617 P -(-5) W -(-5) -(-5) -(·5) H: 282 M HP
35 Ghuggi 447.45 P: 1120 P -(-5) HP -(-5) -(-5) -(-5) H: 187
36 Mendha 984.26 P: 1716 P D W -(-5) -(-5) BS H: 290 M HP
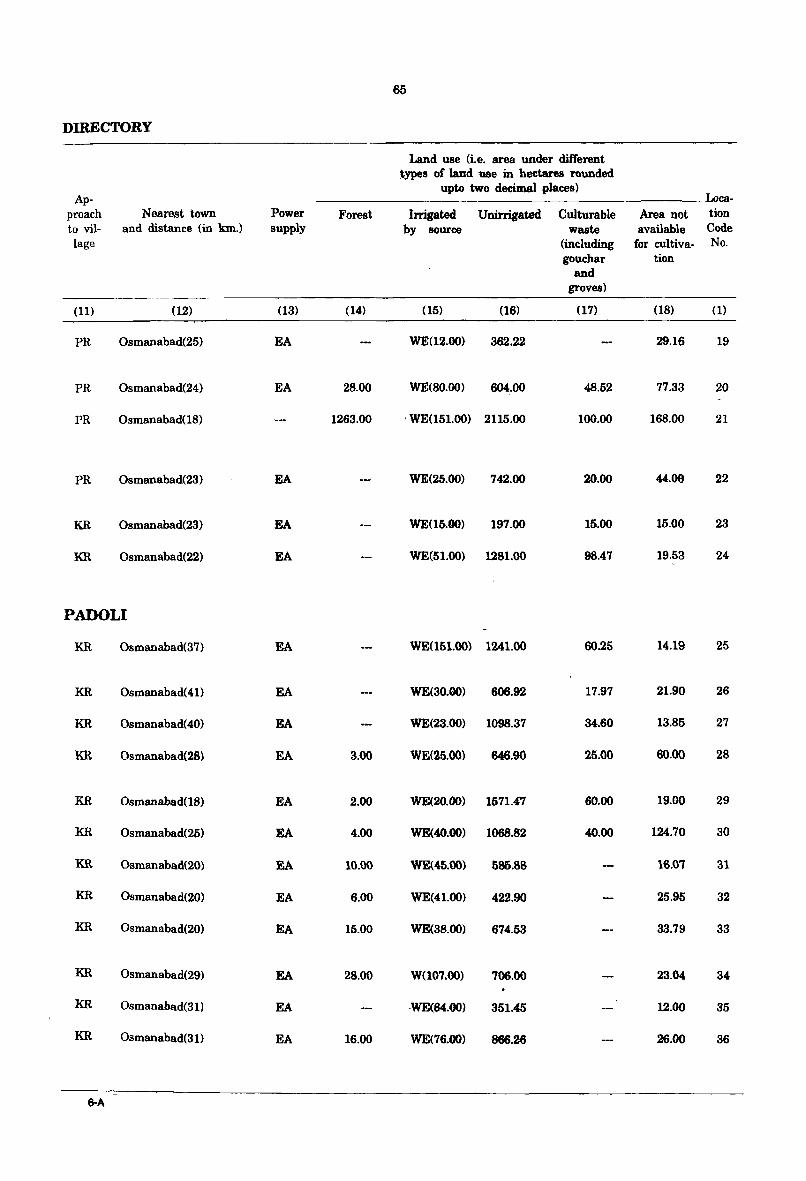
65
DIRECTORY
Land use (i.e. area under different types of land use in hectares rounded
Ap-upto two decimal places)
Laea-proach Nearest town Power Forest Irrigated Unirrigated Culturable Area not tion to vil- and distance (in kIn.) supply by source waste available Code lage (including for cultiva- No.
gouchar tion and
groves)
(11) (12) (13) (14) (15) (16) (17) (18) (1)
PR Osmanabad(25) EA WE(12.00) 362.22 29.16 19
PR Osmanabad(24) EA 28.00 WE(BO.OO) 604.00 48.52 77.33 20
PR Osmanabad(lB) 1263.00 ·WE(151.oo) 2115.00 100.00 168.00 21
PR Osmanabad(23) EA WE(25.00) 742.00 20.00 44.00 22
KR Osmanabad(23) EA WE(15.00) 197.00 15.00 15.00 23
KR Osmanabad(22) EA WE(51.oo) 1281.00 98.47 19.53 24
PADOLI
KR Osmanabad(37) EA WE(151.oo} 1241.00 60.25 14.19 25
KR Osmanabad(41) EA WE(30.00) 606.92 17.97 21.90 26
KR Osmanabad(40} EA WE(23.00) 1098.37 34.60 13.85 27
KR Osmanabad(28) EA 3.00 WE(25.00) 646.90 25.00 60.00 28
KR Osmanabad(1B) EA 2.00 WE(20.00) 1571.41 60.00 19.00 29
KR Osmanabad(25) EA 4.00 WE(40.00) 1068.82 40.00 124.70 30
KR Osmanabad(20) EA 10.00 WE(45.00) 585.88 16.07 31
KR Osmanabad(20) EA 6.00 WE(41.00) 422.90 25.95 32
KR Osmanabad(20) EA 15.00 WE(3B.OO) 674.53 33.79 33
KR Osmanabad(29) EA 2B.00 W(l07.00) 706.00 23.04 34
KR Osmanabad(31) EA -WE(84.00) 351.45 12.00 35
KR Osmanabad(31) EA 16.00 WE(76.00) 866.26 26.00 36
6-A
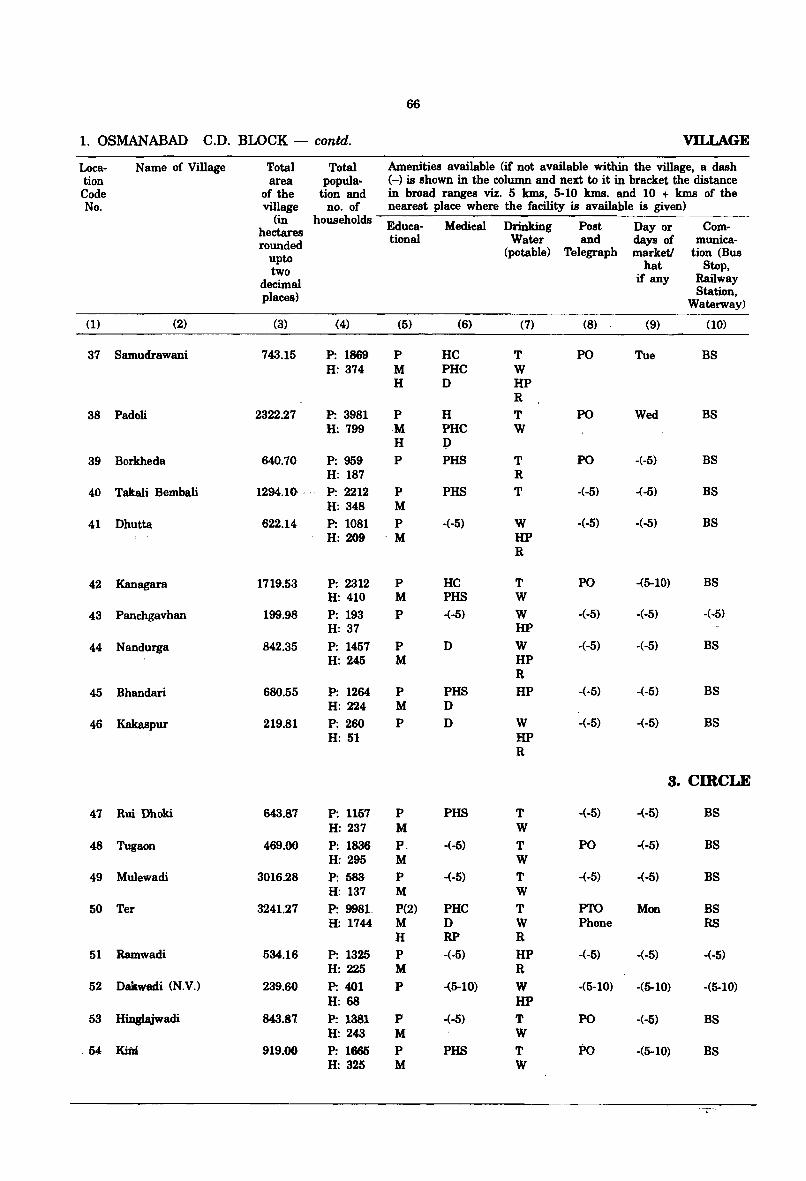
66
1. OSMANABAD C.D. BLOCK - contd. VILLAGE
Loca- Name of Village Total Total Amenities available (if not available within the village, a dash tion area popula- (-) is shown in the column and next to it in bracket the distance Code of the tion and in broad ranges viz. 5 kms, 5-10 kms. and 10 + kms of the No. village no. of nearest place where the facility is available is given)
(in households Educa- Medical Drinking Post Day or Com-hectares rounded tional Water and days of munica-
upto (potable) Telegraph market/ tion (Bus
two hat Stop,
decimal if any Railway
placell) Station, Waterway)
(1) (2) (3) (4) (5) (6) (7) (8) (9) (10)
37 Samudrawani 743.15 P: 1869 P HC T PO Tue BS H: 374 M PHC W
H D HP R
38 Padoli 2322.27 P: 3981 P H T PO Wed BS H: 799 ,M PHe W
H D
39 Borkheda 640.70 P: 959 P PHS T PO -(-5) BS H: 187 R
40 Taltali Bembali 1294.1(} , , P: 2212 P PHS T -(-5) -(-5) BS H: 348 M
41 Dhutta 622.14 P: 1081 P -(-5) W -(-5) -(-5) BS H: 209 M HP
R
42 Kanagara 1719.53 P: 2312 P HC T PO -(5-10) BS H: 410 M PHS W
43 Panehgavhan 199.98 P: 193 P -(-5) W -(-5) -(-5) -(-5) H: 37 HP
44 Nandurga 842.35 P: 1457 P D W -(-5) -(-5) BS H: 245 M HP
R 45 Bhandari 680.55 P: 1264 P PHS HP -(-5) -(-5) BS
H: 224 M D
46 Kakaspur 219.81 P: 260 P D W -(-5) -(-5) BS H: 51 HP
R
3. CIRCLE
47 Rui Dhoki 643.87 P: 1157 P PHS T -(-5) -(-5) BS H: 237 M W
48 Tugaon 469.00 P: 1836 P. -(-5) T PO -(-5) BS H: 295 M W
49 Mulewadi 3016.28 P: 583 P .(-5) T -(-5) -(-5) BS H: 137 M W
50 Ter 3241.27 P: 998L P(2) PHC T PTO Mon BS H: 1744 M D W Phone RS
H RP R 51 Ramwadi 534.16 P: 1325 P -(-5) HP -(-5) -(-5) -(-5)
H: 225 M R 52 Dakwadi (N.V.) 239.60 P: 401 P ,(5-10) W -(5-10) -(5-10) -(5-10)
H: 68 HP 53 Hinglajwadi 843.87 P: 1381 P .(-5) T PO -(-5) BS
H: 243 M W ,54 Kim 919.00 P: 1666 P PHS T PO -(5-10) BS
H: 325 M W
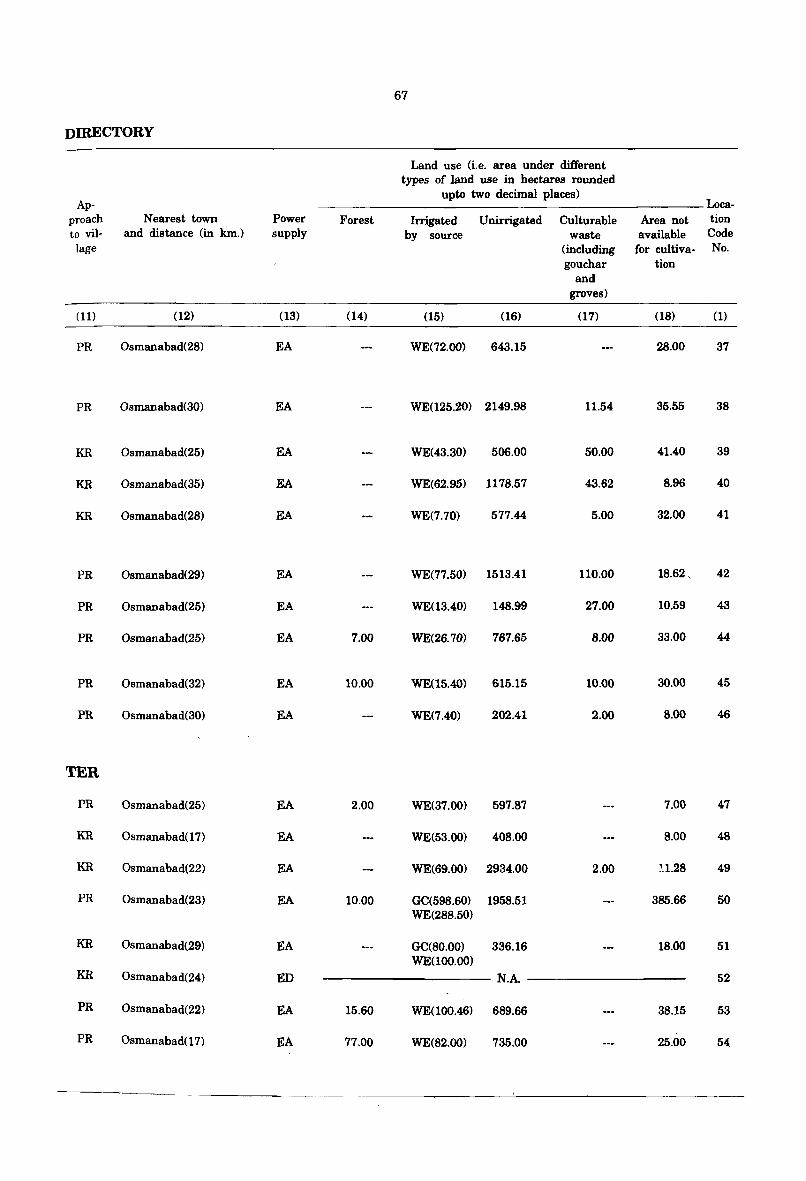
67
DIRECTORY
Land use (i.e. area under different types of land use in hectares rounded
Ap-upto two decimal places)
Loca-proach Nearest town Power Forest Irrigated Unirrigated Culturable Area not tion to viI- and distance (in km.) supply by source waste available Code lage (including for cultiva- No.
gouchar tion and
groves)
(11) (12) (13) (14) (15) (16) (17) (18) (1)
PR Osmanabad(28) EA WE(72.00) 643.15 28.00 37
PR Osmanabad(30) EA WE(125.20) 2149.98 11.54 35.55 38
KR Osmanabad(25) EA WE(43.30) 506.00 50.00 41.40 39
KR Osmanabad(35) EA WE(62.95) 1178.57 43.62 8.96 40
KR Osmanabad(28) EA WE(7.70) 577.44 5.00 32.00 41
PR Osmanabad(29) EA WE(77.50) 1513.41 110.00 18.62, 42
PR Osmanabad(25) EA WE(13.40) 148.99 27.00 10.59 43
PR Osmanabad(25) EA 7.00 WE(26.70) 767.65 8.00 33.00 44
PR Osmanabad(32) EA 10.00 WE(15.40) 615.15 10.00 30.00 45
PR Osmanabad(30) EA WE(7.40) 202.41 2.00 8.00 46
TER
PR Osmanabad(25) EA 2.00 WE(37.00) 597.87 7.00 47
KR Osmanabad( 17) EA WE(53.00) 408.00 8.00 48
KR Osmanabad(22) EA WE(69.00) 2934.00 2.00 ~.1.28 49
PR Osmanabad(23) EA 10.00 GC(598.60) 1958.51 385.66 50 WE(28S.50)
KR Osmanabad(29) EA GC(80.00) 336.16 lS.oo 51 WE(loo.OO)
KR Osmanabad(24) ED N.A 52
PR Osmanabad(22) EA 15.60 WE(100.46) 689.66 3S.15 53
PR Osmanabad(17) EA 77.00 WE(82.00) 735.00 25.00 54
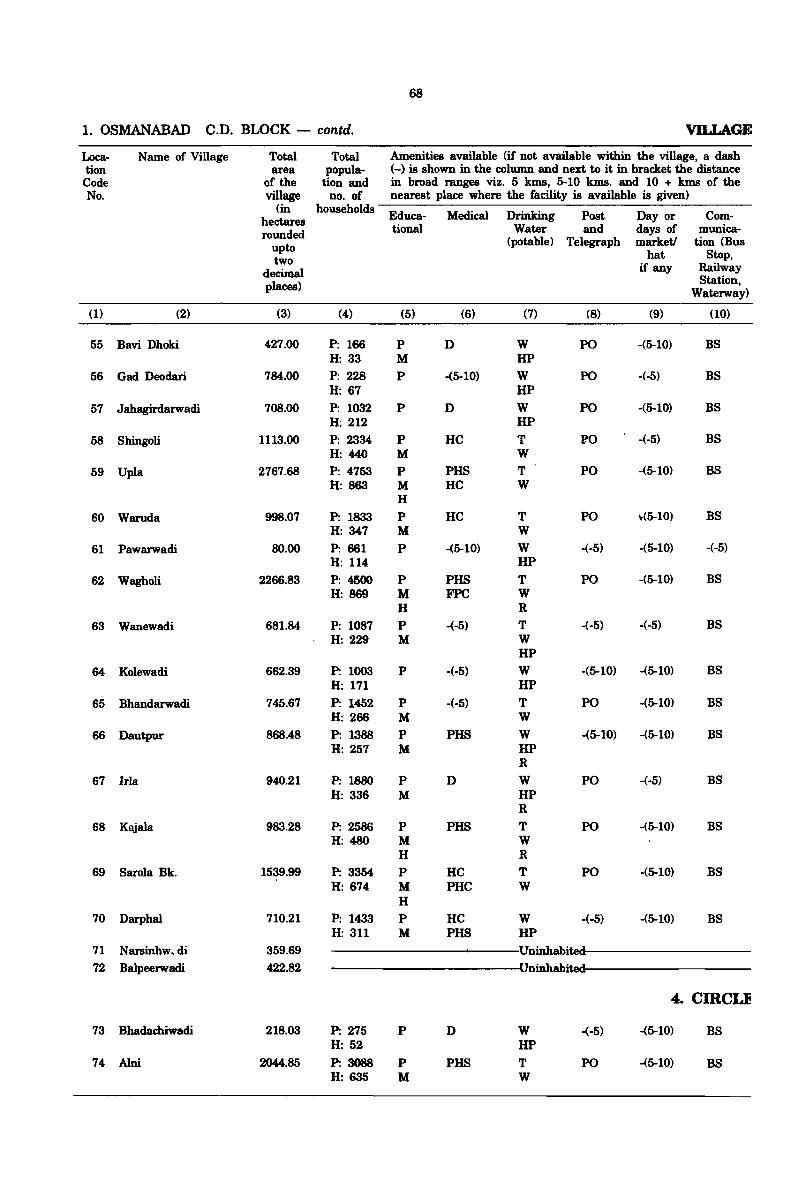
68
1. OSMANABAD C.D. BLOCK - contd. VILLAGE
Loca- Name of Village Total Total Amenities available (if not available within the village, a dash tion area popula- (-) is shown in the column and next to it in bracket the distance Code of the tion and in broad ranges viz. 5 kms, 5·10 kms. and 10 + kms of the No. village no. of nearest place where the facility is available is given)
(in households Educa· Medical Drinking Post Day or Com-hectares
rounded tional Water and days of munica-
upto (potable) Telegraph market/ tion (Bus
two hat Stop,
decimal if any Railway
places) Station, Waterway)
(1) (2) (3) (4) (5) (6) (7) (8) (9) (10)
55 Bavi Dhoki 427.00 P: 166 P D W PO -(5-10) BS H: 33 M HP
56 Gad Deodari 784.00 P: 228 P ..(5-10) W PO -(-5) BS H: 67 HP
57 Jahagirdarwadi 7OS.00 P: 1032 P D W PO -(5-10) BS H: 212 HP
58 Shingoli 1113.00 P: 2334 P HC T PO -(-5) BS H:44O M W
59 Upla 2767.68 P: 4753 P PHS T PO -(5-10) BS H: 863 M HC W
H
60 Waruda 998.07 P: 1833 P He T PO ~(5-10) BS H: 347 M W
61 Pawarwadi SO.OO P: 661 P -(5-10) W -(-5) -(5-10) -(-5) H: 114 HP
62 Wagholi 2266.83 P: 4500 P PHS T PO -(5-10) BS H: 869 M FPC W
H R
63 Wanewadi 681.84 P: 1087 P -(-5) T -(-5) -(-5) BS H: 229 M W
HP
64 Kolewadi 662.39 P: 1003 P -(-5) W -(5-10) -(5-10) BS H: 171 HP
65 Bhandarwadi 745.67 P: 1452 P -(-5) T PO -(5-10) BS H: 266 M W
66 Dautpur 868.48 P: 1388 P PHS W -(5-10) -(5-10) BS H: 257 M HP
R
67 IrIa 940.21 P: 18SO P D W PO -(-5) BS H: 336 M HP
R
68 Kajala 983.28 P: 2586 P PHS T PO -(5-10) BS H: 480 M W
H R
69 Sarola Bk. 1539.99 P: 3354 P HC T PO -(5-10) BS H: 674 M PHC W
H 70 Darphal 710.21 P: 1433 P HC W -(-5) -(5-10) BS
H: 311 M PHS HP 71 Narsinhw. di 359.69 Uninhabited 72 Balpeerwadi 422.82 Uninhabite
4. cmcu 73 Bhadaclriwadi 218.03 P: 275 P D W -(-5) ..(5-10) BS
H: 52 HP 74 Alni 2044.85 P: 3088 P PHS T PO -(5-10) BS
H:635 M W
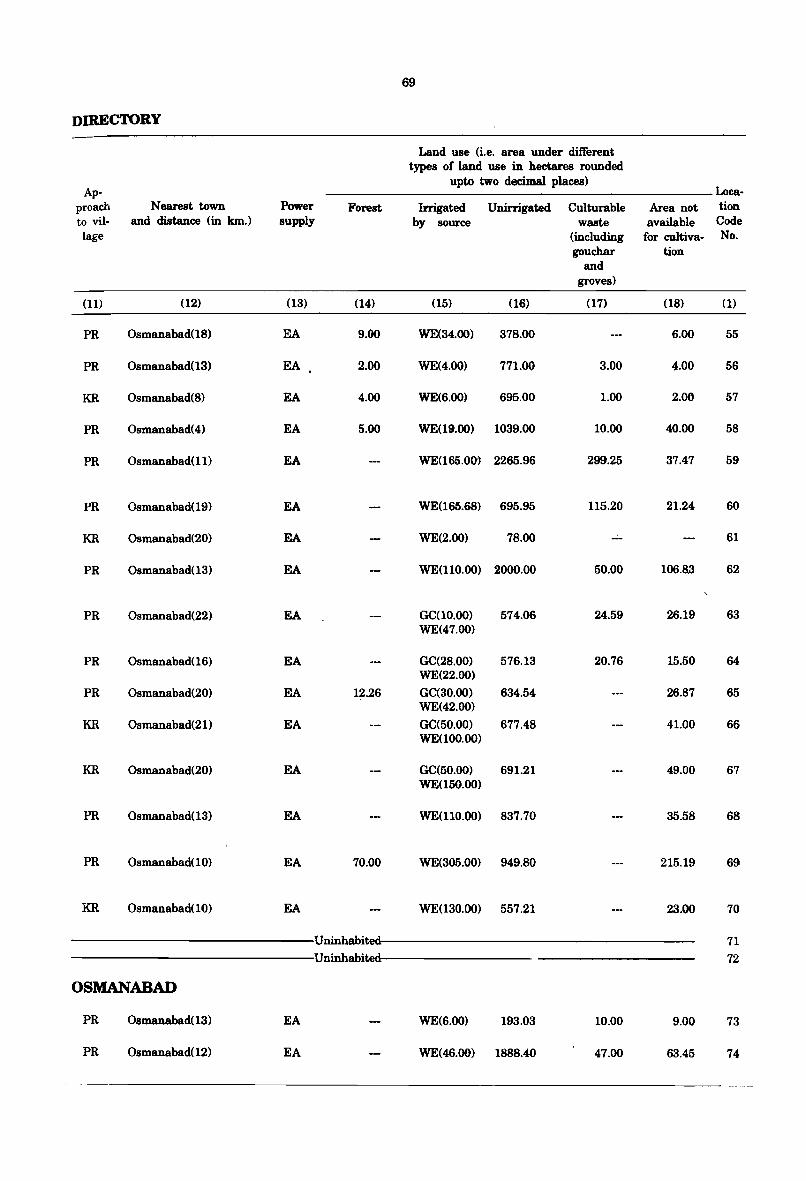
69
DIRECTORY
Land use (i.e. area under different types of land use in hectares rounded
Ap-upto two decimal places)
Loca-proach Nearest town Power Forest Irrigated Unirrigated Culturable Area not tion to vil- and distance (in km.) supply by source waste available Code lage (including for cultiva- No.
gouchar tion and
groves)
(11) (12) (13) (14) (15) (16) (17) (18) (1)
PR Osmanabad(18) EA 9.00 WE(34.00) 378.00 6.00 55
PR Osmanabad(13) EA 2.00 WE(4.oo) 771.00 3.00 4.00 56
KR Osmanabad(8) EA 4.00 WE(6.00) 695.00 1.00 2.00 57
PR Osmanabad(4) EA 5.00 WE(19.00) 1039.00 10.00 40.00 58
PR Osmanabad(ll) EA WE(165.0()) 2265.96 299.25 37.47 59
PR Osmanabad(19) EA WE(I65.68) 695.95 115.20 21.24 60
KR Osmanabad(20) EA WE(2.00) 78.00 -- 61
PR Osmanabad(13) EA WE(110.oo) 2000.00 50.00 106.8,3 62
PR Osmanabad(22). EA GC(10.oo) 574.06 24.59 26.19 63 WE(47.oo)
PR Osmanabad(16) EA GC(28.00) 576.13 20.76 15.50 64 WE(22.00)
PR Osmanabad(20) EA 12.26 GC(30.00) 634.54 26.87 65 WE(42.00)
KR Osmanabad(21) EA GC(50.00) 677.48 41.00 66 WE(loo.oo)
KR Osmanabad(20) EA GC(50.oo) 691.21 49.00 67 WE(150.00)
PR Osmanabad(13) EA WE(llO.oo) 837.70 35.58 68
PR Osmanabad(10) EA 70.00 WE(305.00) 949.80 215.19 69
KR Osmanabad(10) EA WE(130.00) 557.21 23.00 70
Uninhabit 71 Uninhabit 72
OSMANABAD
PR Osmanabad(13) EA WE(6.oo) 193.03 10.00 9.00 73
PR Osmanabad(12) EA WE(46.oo) 1888.40 47.00 63.45 74
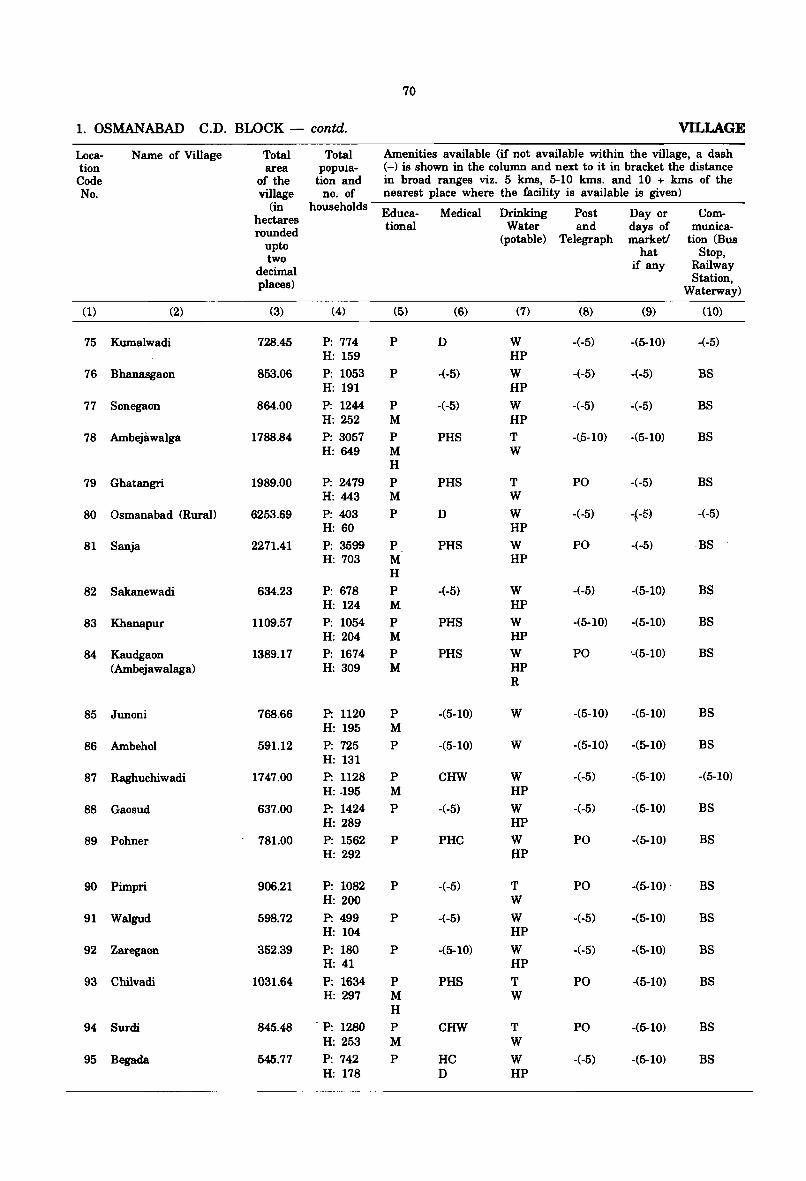
70
1. OSMANABAD C.D. BWCK - contd. VILLAGE
Loca- Name of Village Total Total Amenities available (if not available within the village, a dash tion area popwa- (-) is shown in the column and next to it in bracket the distance Code of the tion and in broad ranges viz. 5 Ions, 5-10 kIns. and 10 + kIns of the No. village no. of nearest place where the facility is available is given)
(in households Educa- Medical Drinking Post Day or Com-hectares
rounded tional Water and days of munica-
upto (potable) Telegraph marketl tion (Bus
two hat Stop,
decimal if any Railway
places) Station, Waterway)
(1) (2) (3) (4) (5) (6) (7) (8) (9) (10)
75 Kumalwadi 728.45 P: 774 P D W -(-5) -(5-10) -(-5) H: 159 HP
76 Bhanasgaon 853.06 P: 1053 P -(-5) W -(-5) -(-5) BS H: 191 HP
77 Sonegaon 864.00 P: 1244 P -(-5) W -(-5) -(-5) BS H: 252 M HP
78 Ambejawalga 1788.84 P: 3057 P PHS T -(p-10) -(5-10) BS H: 649 M W
H
79 Ghatangri 1989.00 P: 2479 P PHS T PO -(-5) BS H: 443 M W
80 Osmanabad (Rural) 6253.69 P: 403 P D W -(-5) -~-5~ -(-5) H: 60 HP
81 Sanja 2271.41 P: 3599 P PHS W PO -(-5) BS H: 703 M HP
H
82 Sakanewadi 634.23 P: 678 P -(-5) W -(-5) -(5-10) BS H: 124 M HP
83 Khanapur 1109.57 P: 1054 P PHS W -(5-10) -(5-10) BS H: 204 M HP
84 Kaudgaon 1389.17 P: 1674 P PHS W PO '-(5-10) BS (Ambejawalaga) H: 309 M HP
R
85 Junoni 768.66 P: 1120 P -(5-10) W -(5-10) -(5-10) BS H: 195 M
86 Ambehol 591.12 P: 725 P -(5-10) W -(5-10) -(5-10) BS H: 131
87 Raghuchiwadi 1747.00 P: 1128 P CHW W -(-5) -(5-10) -(5-10) H: .195 M HP
88 Gaosud 637.00 P: 1424 P -(-5) W -(-5) -(5-10) BS H: 289 HP
89 Pohner 781.00 P: 1562 P PHC W PO -(5-10) BS H: 292 HP
90 Pimpri 906.21 P: 1082 P -(-5) T PO -(5-10) . BS H: 200 W
91 Walgud 598.72 P: 499 P -(-5) W -(-5) -(5-10) BS H: 104 HP
92 Zaregaon 352.39 P: 180 P -(5-10) W -(-5) -(5-10) BS H: 41 HP
93 Chllvadi 1031.64 P: 1634 P PHS T PO -(5-10) BS H: 297 M W
H
94 Surdi 845.48 . P: 1280 P CHW T PO -(5-10) BS H: 253 M W
95 Begada 545.77 P: 742 P HC W -(-5) -(5-10) BS H: 178 D HP
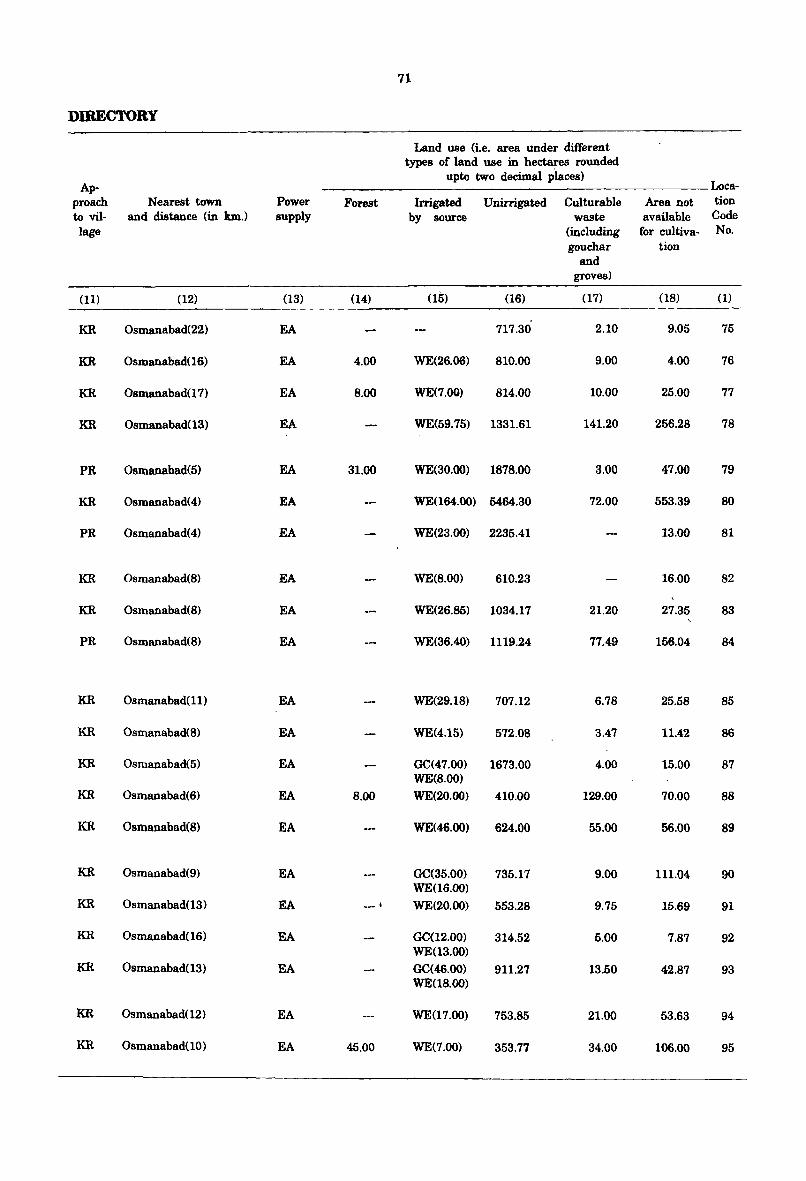
71
DIRECTORY
Land use (i.e. area under different types of land use in hectares rounded
Ap-upto two decimal places)
Loca-proach Nearest town Power Forest Irrigated Unirrigated Culturable Area not tion to viI- and distance (in km.) supply by source waste available Code lage (including for cultiva- No.
gouchar tion and
groves)
(11) (12) (13) (14) (ltn (16) (17) (18) (1)
KR Osmanabad(22) EA 717.30 2.10 9.05 75
KR Osmanabad(16) EA 4.00 WE(26.06) 810.00 9.00 4.00 76
KR Osmanabad(17) EA 8.00 WE(7.00) 814.00 10.00 25.00 77
KR Osmanabad(13) EA WE(59.75) 1331.61 141.20 256.28 78
PR Osmanabad(5) EA 31.00 WE(30.00) 1878.00 3.00 47.00 79
KR Osmanabad( 4) EA WE(l64.00) 5464.30 72.00 553.39 80
PR Osmanabad(4) EA WE(23.00) 2235.41 13.00 81
KR Osmanabad(8) EA WE(8.00) 610.23 16.00 82
KR Osmanabad(8) EA WE(26.85) 1034.17 21.20 27.35 83
PR Osmanabad(8) EA WE(36.40) 1119.24 77.49 156.04 84
KR Osmanabad(ll) EA WE(29.18) 707.12 6.78 25.58 85
KR Osmanabad(8) EA WE(4.15) 572.08 3.47 11.42 86
KR Osmanabad(5) EA GC(47.00) 1673.00 4.00 15.00 87 WE(8.00)
KR Osmanabad(6) EA 8.00 WE(20.00) 410.00 129.00 70.00 88
KR Osmanabad(8) EA WE(46.00) 624.00 55.00 56.00 89
KR Osmanabad(9) EA GC(35.00) 735.17 9.00 111.04 90 WE(l6.00)
KR Osmanabad(l3) EA __ I
WE(20.00) 553.28 9.75 15.69 91
KR Osmanabad(16) EA GC(12.00) 314.52 5.00 7.87 92 WE(13.00)
KR Osmanabad(13) EA GC(46.00) 911.27 13.50 42.87 93 WE(l8.00)
KR Osmanabad(12) EA WE(17.00) 753.85 21.00 53.63 94
KR Osmanabad(lO) EA 45.00 WE(7.00) 353.77 34.00 106.00 95
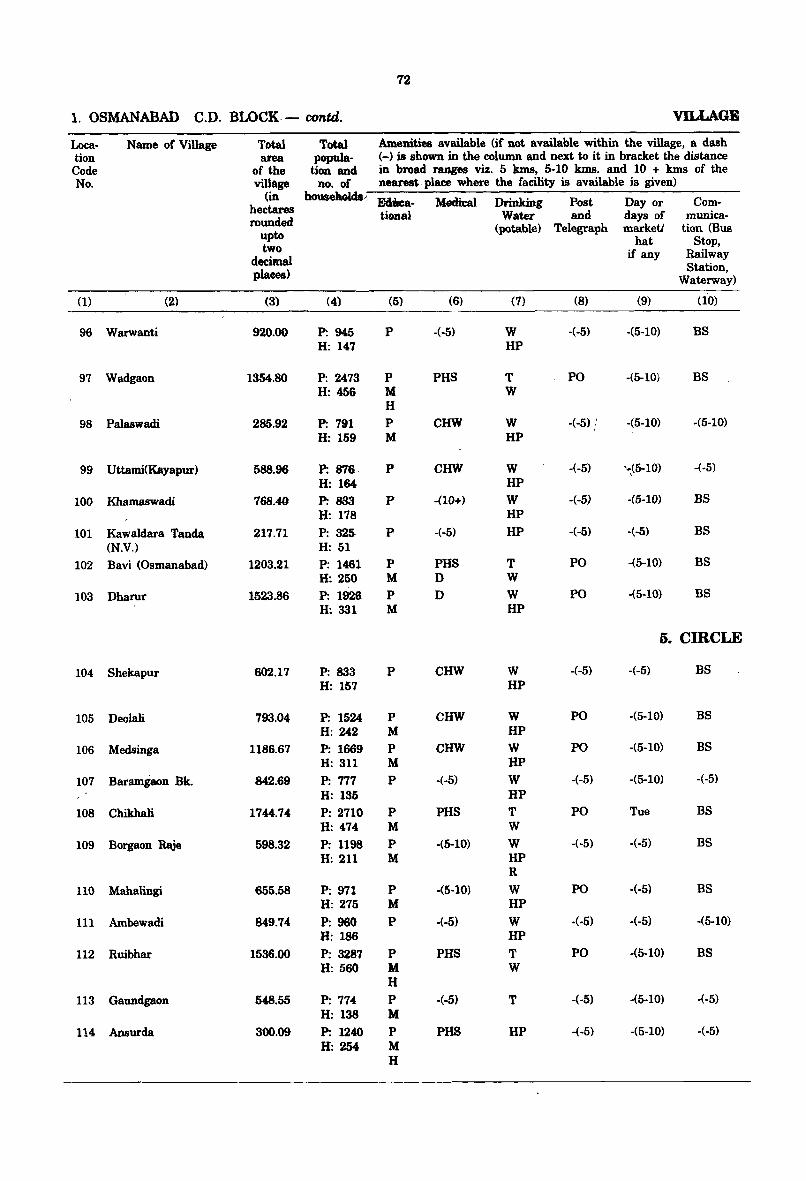
72
1. OSMANABAD C.D. BLOCK - contd. VILLAGE
Loca- Name of Village Total Total Amenities available (if not available within the village, a dash tion Mea popu1a- (-) is shown in the column and next to it in bracket the distance Code of the tion and in broad ranges viz. 5 kms, 5-10 kms. and 10 + kms of the No. village no. of nearest· place where the facility is available is given)
(in householda;, Ecl8ca- Medttal Drinking P.ast Day or Com-
hectares rounded
tional Water and days of munica-
upto (potable) Telegraph marketl tiOD (Bus
two hat Stop,
decimal if any Railway
places) Station,
Waterway)
(1) (2) (3) (4) (5) (6) (7) (8) (9) (10)
96 Warwanti 920.00 P: 945 P -(-5) W -(-5) -(5-10) BS H: 147 HP
97 Wadgaon 1354.80 P: 2473 P PHS T PO -(5-10) BS H: 45& M W
H
98 Palaswadi 285.92 P: 791 P CHW W -(-5) / -(5-10) -(5-10) , H: 159 M HP
99 Uttami(l{ayapur) 588.96 P: 876 P CHW W -(-5) -",(5-10) -(-5) H: 164 HP
100 Khamaswadi 768.40 P: 883 P -(10+) W -(-5) -(5-10) BS H: 178 HP
101 Kawaldara Tanda 217.71 P: 325 P -(-5) HP -(-5) -(-5) BS (N.V.) H: 51
102 Bavi (Osmanabad) 1203.21 P: 1461 P PHS T PO -(5-10) BS H: 250 M D W
103 Dharur 1523.86 P: 1926 P D W PO -(5-10) BS H: 331 M HP
5. CIRCLE
104 Shekapur &02.17 P: 833 P CHW W -(-5) -(-5) BS H: 157 HP
105 Deolali 793.04 P: 1524 P CHW W PO -(5-10) BS H: 242 M HP
106 Medsinga 1186.67 P: 1669 P CHW W PO -(5-10) BS H: 311 M HP
107 Baramgaon Bk. 842.69 P: 777 P -(-5) W -(-5) -(5-10) -(-5)
H: 135 HP
108 Chikhali 1744.74 P: 2710 P PHS T PO Tue BS H: 474 M W
109 Borgaon Raje 598.32 P: 1198 P -(5-10) W -(-5) -(-5) BS H: 211 M HP
R
110 Mahalingi 655.58 P: 971 P -(5-10) W PO -(-5) BS H: 275 M HP
111 Ambewadi 849.74 P: 960 P -(-5) W -(-5) -(-5) -(5-10) H: 186 HP
112 Ruibhar 1536.00 P; 3287 P PHS T PO ·(5·10) BS H: 560 M W
H
113 Gaundgaon 548.55 P: 774 P -(oS) T -(-5) ·(5-10) ·(-5) H: 138 M
114 Ansurda 300.09 P: 1240 P PHS HP -(-5) ·(5-10) ·(-5) H: 254 M
H
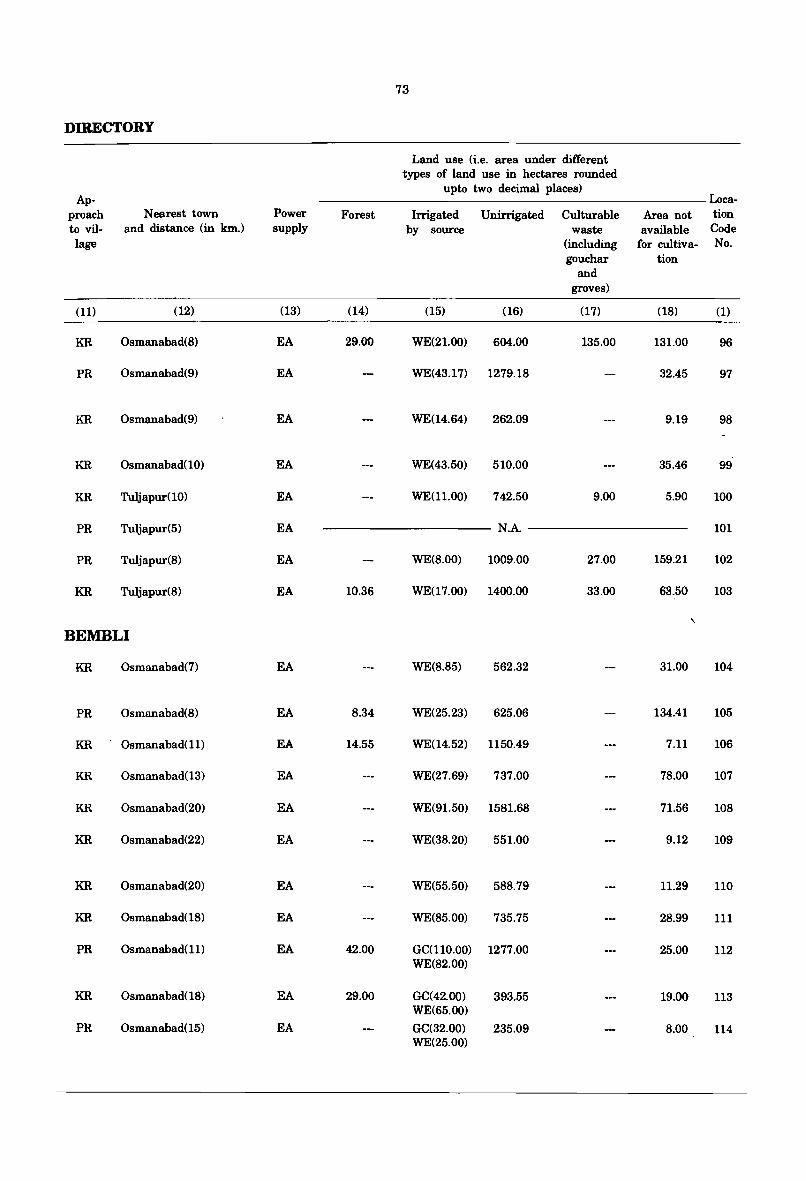
73
DIRECTORY
Land use (i.e. area under different types of land use in hectares rounded
Ap-upto two decimal places)
Loca-proach Nearest town Power Forest Irrigated Unirrigated Culturable Area not tion to vil- and distance (in km.) supply by source waste available Code lage (including for cultiva- No.
gouchar tion and
groves)
(11) (12) (13) (14) (15) (16) (17) (18) (1)
KR Osmanabad(8) EA 29.00 WE(21.00) 604.00 135.00 131.00 96
PR Osmanabad(9) EA WE(43.17) 1279.18 32.45 97
KR Osmanabad(9) EA WE(14.64) 262.09 9.19 98
KR Osmanabad(10) EA WE(43.50) 510.00 35.46 99
KR Tuljapur(10) EA WE(11.00) 742.50 9.00 5.90 100
PR Tuljapur(5) EA NA 101
PR Tuljapur(8) EA WE(8.00) 1009.00 27.00 159.21 102
KR Tuljapur(8) EA 10.36 WE(17.00) 1400.00 33.00 63.50 103
, BEMBLI
KR Osmanabad(7) EA WE(8.85) 562.32 31.00 104
PR Osmanabad(8) EA 8.34 WE(25.23) 625.06 134.41 105
KR Osmanabad(11) EA 14.55 WE(14.52) 1150.49 7.11 106
KR Osmanabad(13) EA WE(27.69) 737.00 78.00 107
KR Osmanabad(20) EA WE(91.50) 1581.68 71.56 108
KR Osmanabad(22) EA WE(38.20) 551.00 9.12 109
KR Osmanabad(20) EA WE(55.50) 588.79 11.29 110
KR Osmanabad(18) EA WE(85.00) 735.75 28.99 111
PR Osmanabad(11) EA 42.00 GC(110.00) 1277.00 25.00 112 WE(82.00)
KR Osmanabad(18) EA 29.00 GC(42.oo) 393.55 19.00 113 WE(65.00)
PR Osmanabad(15) EA GC(32.00) 235.09 8.00 114 WE(25.00)
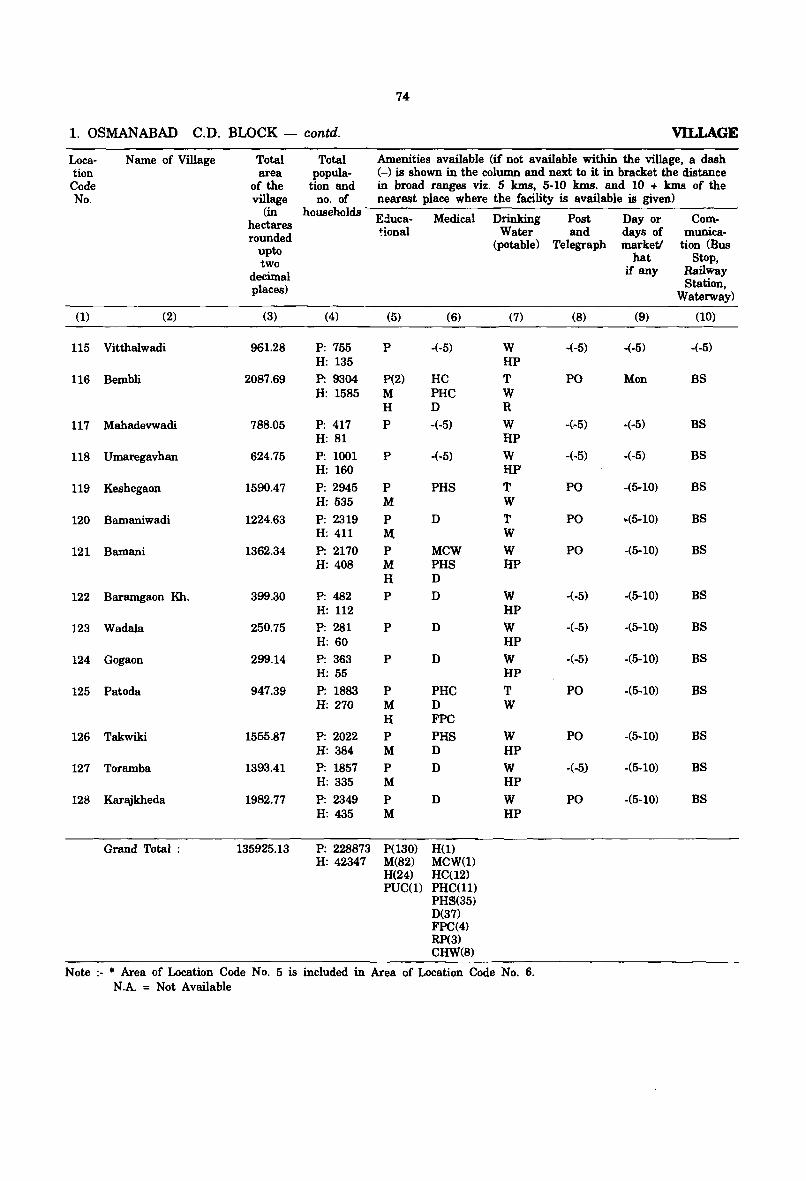
74
1. OSMANABAD C.D. BLOCK - contd. VILLAGE
Loca- Name of Village Total Total Amenities available (if not available within the village, a dash tion area popula- (-) is shown in the column and next to it in bracket the distance
Code of the tion and in broad ranges viz. 5 kms, 5-10 Ions. and 10 + kms of the No. village no. of nearest place where the facility is available is given)
(in households E:luca- Medical Drinking Post Day or Com-hectares rounded ~ional Water and days of munica-
upto (potable) Telegraph marketl tion (Bus
two hat Stop,
decimal if any Railway
places) Station, Waterway)
(1) (2) (3) (4) (5) (6) (7) (8) (9) (10)
115 Vitthalwadi 961.28 P: 755 P -(-5) W -(-5) -(-5) -(-5) H: 135 HP
116 Bembli 2087.69 P: 9304 P(2) HC T PO Mon BS H: 1585 M PHC W
H D R
117 Mahadevwadi 788.05 P: 417 P -(-5) W -(:.5) -(-5) BS H: 81 HP
118 Umaregavhan 624.75 P: 1001 P -(-5) W -(-5) -(-5) BS H: 160 HP
119 Keshegaon 1590.47 P: 2945 P PHS T PO -(5-10) BS H: 535 M W
120 Bamaniwadi 1224.63 P: 2319 P D T PO 10(5-10) BS H: 411 M W
121 Bamani 1362.34 P: 2170 P MCW W PO -(5-10) BS H: 408 M PHS SP
H D
122 Baramgaon Kh. 399.30 P: 482 P D W -(-5) -(5-10) BS H: 112 HP
]23 Wadala 250.75 P: 281 P D W -(-5) -(5-10) BS H: 60 HP
124 Gogaon 299.14 P: 363 P D W -(-5) -(5-10) BS H: 55 HP
125 Patoda 947.39 P: 1883 P PHC T PO -(5-10) BS H: 270 M D W
H FPC
126 Takwiki 1555.87 P: 2022 P PHS W PO -(5-10) BS H: 384 M D HP
127 Toramba 1393.41 P: 1857 P D W -(-5) -(5-10) BS H: 335 M HP
128 Karl\ikheda 1982.77 P: 2349 P D W PO -(5-10) BS H: 435 M HP
Grand Total : 135925.13 P: 228873 P(130) H(1) H: 42347 M(82) MCW(l)
H(24) HC(12) pucm PHC(1l)
PHS(35) D(37) FPC(4) RP(3) CHW(8)
Note :- * Area of Location Code No.5 is included in Area of Location Code No.6. N.A. = Not Available
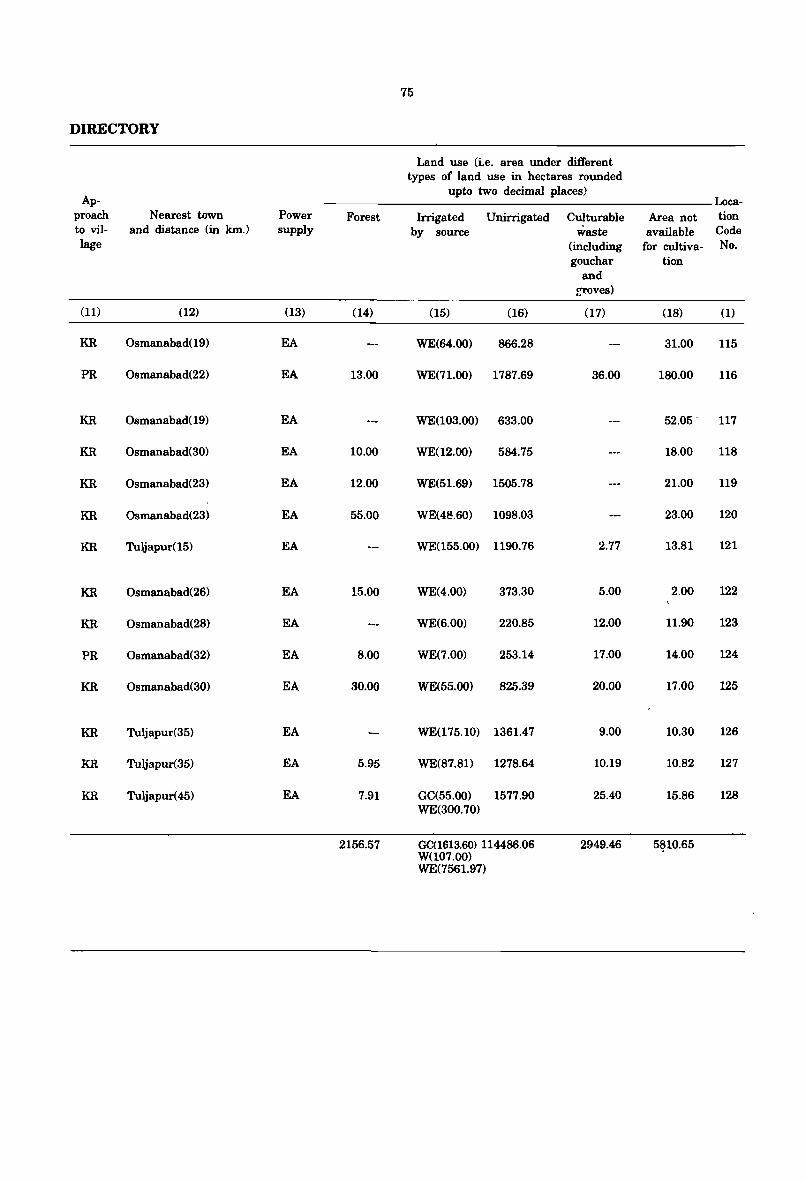
75
DIRECTORY
Land use (i.e. area under different types of land use in hectares rounded
Ap-upto two decimal places)
Loca-proach Nearest town Power Forest Irrigated Unirrigated Culturable Area not tion to vil- and distance (in km.) supply by source waste available Code lage (including for cultiva- No.
gouchar tion and ~ves)
(11) (12) (13) (14) (15) (16) (17) (18) (1)
KR Osmanabad(19) EA WE(64.00) 866.28 31.00 115
PR Osmanabad(22) EA 13.00 WE(71.00) 1787.69 36.00 180.00 116
KR Osmanabad(19) EA WE(103.00) 633.00 52.05 - 117
KR Osmanabad(30) EA 10.00 WE(12.00) 584.75 18.00 118
KR Osmanabad(23) EA 12.00 WE(51.69) 1505.78 21.00 119
KR Osmanabad(23) EA 55.00 WE(48.60) 1098.03 23.00 120
KR Tuljapur(15) EA WE(155.00) 1190.76 2.77 13.81 121
KR Osmanabad(26) EA 15.00 WE(4.00) 373.30 5.00 2.00 122
KR Osmanabad(28) EA WE(6.00) 220.85 12.00 11.90 123
PR Osmanabad(32) EA 8.00 WE(7.00) 253.14 17.00 14.00 124
KR Osmanabad(30) EA 30.00 WE(55.00) 825.39 20.00 17.00 125
KR Tuljapur(35) EA WE(175.10) 1361.47 9.00 10.30 126
KR Tuljapur(35) EA 5.95 WE(87.81) 1278.64 10.19 10.82 127
KR Tuljapur(45) EA 7.91 GC(55.00) 1577.90 25.40 15.86 128 WE(300.70)
2156.57 001613.60) 114486.06 2949.46 5810.65 W(107.00) WE(7561.97)
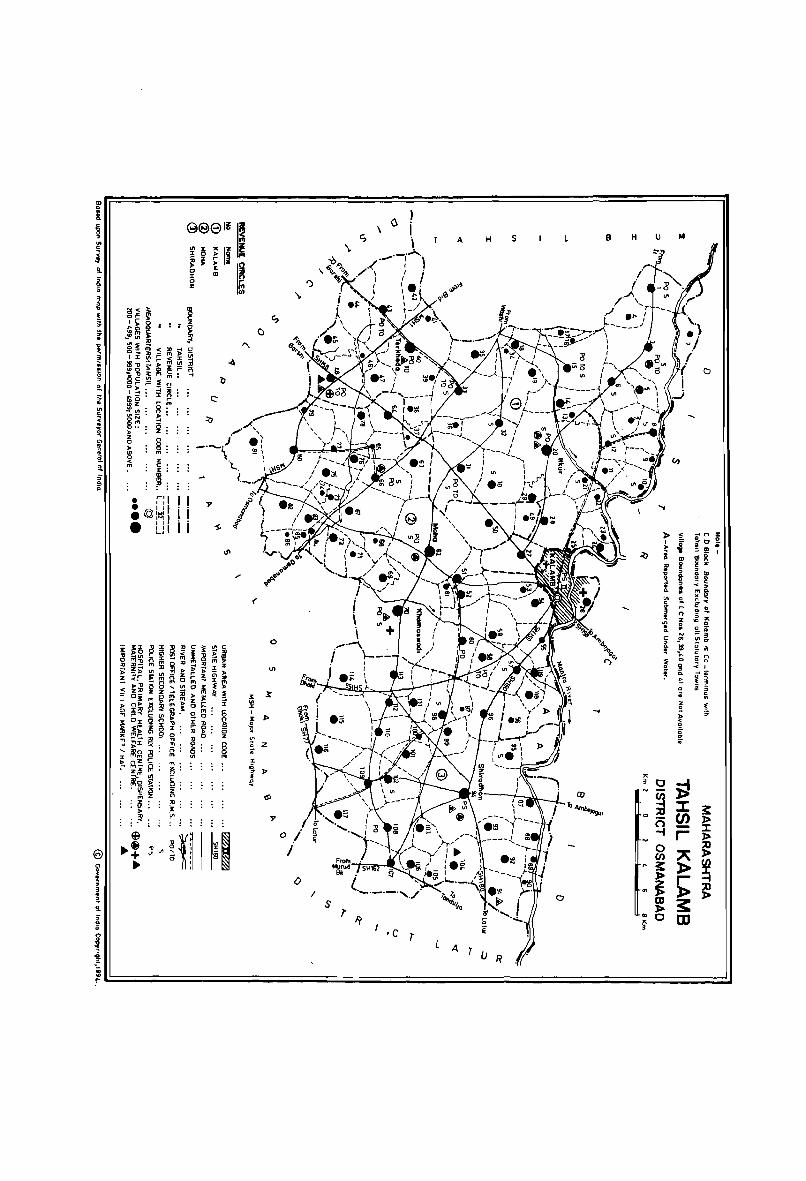
I .c T
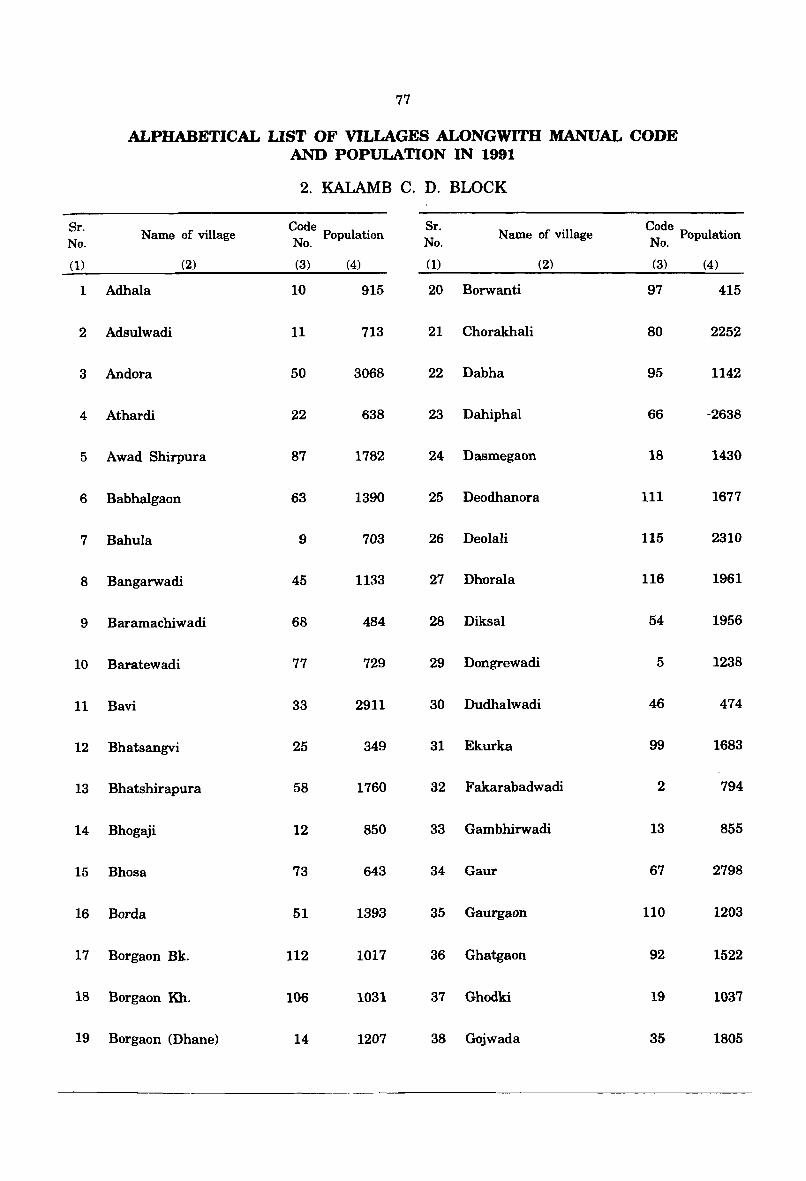
77
ALPHABETICAL LIST OF VILLAGES ALONGWITH MANUAL CODE AND POPULATION IN 1991
2. KALAMB C. D. BLOCK
Sr. Name of village Code P ul . Sr. Name of village Code .
No. N op abon No. No. Population o.
(1) (2) (3) (4) (1) (2) (3) (4)
1 Adhala 10 915 20 Borwanti 97 415
2 Adsulwadi 11 713 21 Chorakhali 80 2252
3 Andora 50 3068 22 Dabha 95 1142
4 Athardi 22 638 23 Dahiphal 66 -2638
5 Awad Shirpura 87 1782 24 Dasmegaon 18 1430
6 Babhalgaon 63 1390 25 Deodhanora 111 1677
7 Bahula 9 703 26 Deolali 115 2310
8 Bangarwadi 45 1133 27 Dhorala 116 1961
9 Baramachiwadi 68 484 28 Diksal 54 1956
10 Baratewadi 77 729 29 Dongrewadi 5 1238
11 Bavi 33 2911 30 Dudhalwadi 46 474
12 Bhatsangvi 25 349 31 Ekurka 99 1683
13 Bhatshirapura 58 1760 32 Fakarabadwadi 2 794
14 Bhogaji 12 850 33 Gambhirwadi 13 855
15 Bhosa 73 643 34 Gaur 67 2798
16 Borda 51 1393 35 Gaurgaon 110 1203
17 Borgaon Bk. 112 1017 36 Ghatgaon 92 1522
18 Borgaon Kh. 106 1031 37 Ghodki 19 1037
19 Borgaon (Dhane) 14 1207 38 Gojwada 35 1805
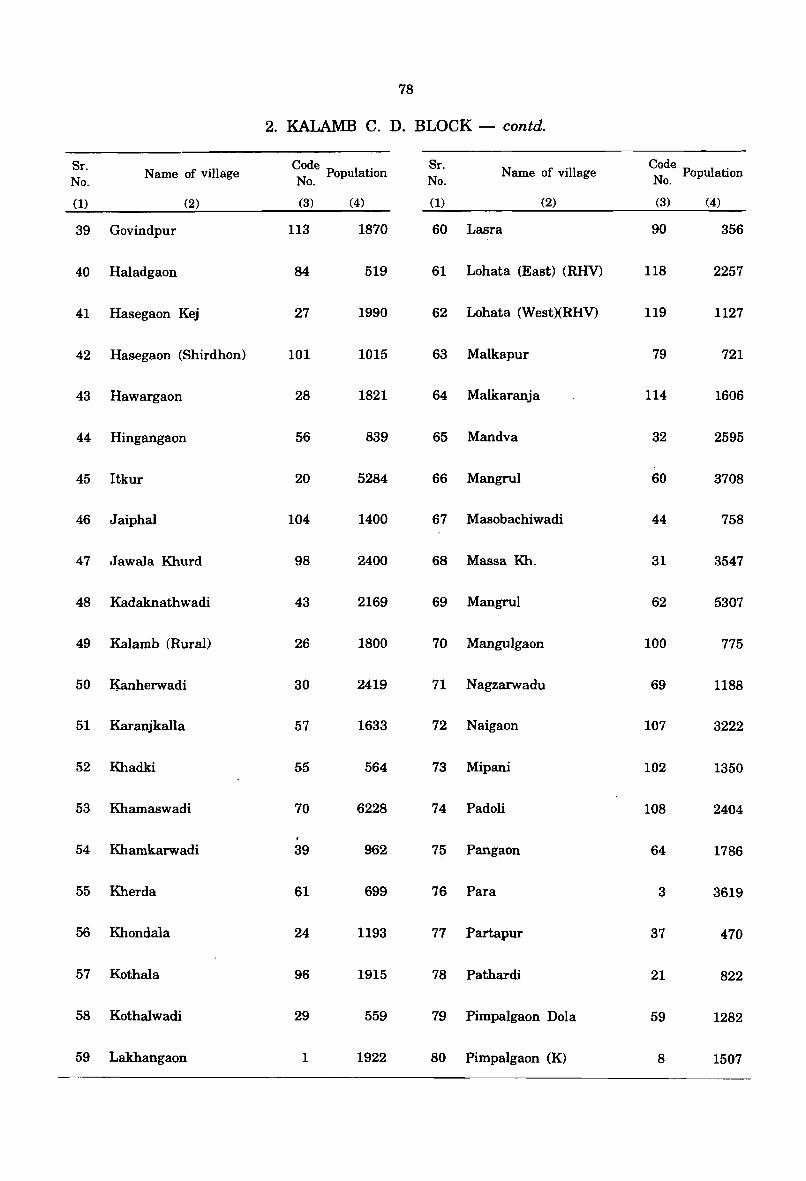
78
2. KALAMB C. D. BLOCK - contd.
Sr. Code . Sr. Name of village
Code . No.
Name of village N PopulatIon No.
N PopulatIOn o. o.
(1) (2) (3) (4) (1) (2) (3) (4)
39 Govindpur 113 1870 60 Lasra 90 356
40 Haladgaon 84 519 61 Lohata (East) (RHV) 118 2257
41 Hasegaon Kej 27 1990 62 Lohata (West)(RHV) 119 1127
42 Hasegaon (Shirdhon) 101 1015 63 Malkapur 79 721
43 Hawargaon 28 1821 64 Malkaranja 114 1606
44 Hingangaon 56 839 65 Mandva 32 2595
45 Itkur 20 5284 66 Mangrul 60 3708
46 Jaiphal 104 1400 67 Masobachiwadi 44 758
47 Jawala Khurd 98 2400 68 Massa Kh. 31 3547
48 Kadaknathwadi 43 2169 69 Mangrul 62 5307
49 Kalamb (Rural) 26 1800 70 Mangulgaon 100 775
50 ~erwadi 30 2419 71 Nagzarwadu 69 1188
51 Karanjkalla 57 1633 72 Naigaon 107 3222
52 Khadki 55 564 73 Mipani 102 1350
53 Khamaswadi 70 6228 74 Padoli 108 2404
54 Khamkarwadi 39 962 75 Pangaon 64 1786
55 Kherda 61 699 76 Para 3 3619
56 Khondala 24 1193 77 Partapur 37 470
57 Kothala 96 1915 78 Pathardi 21 822
58 Kothalwadi 29 559 79 Pimpalgaon Dola 59 1282
59 Lakhangaon 1 1922 80 Pimpalgaon (K) 8 1507
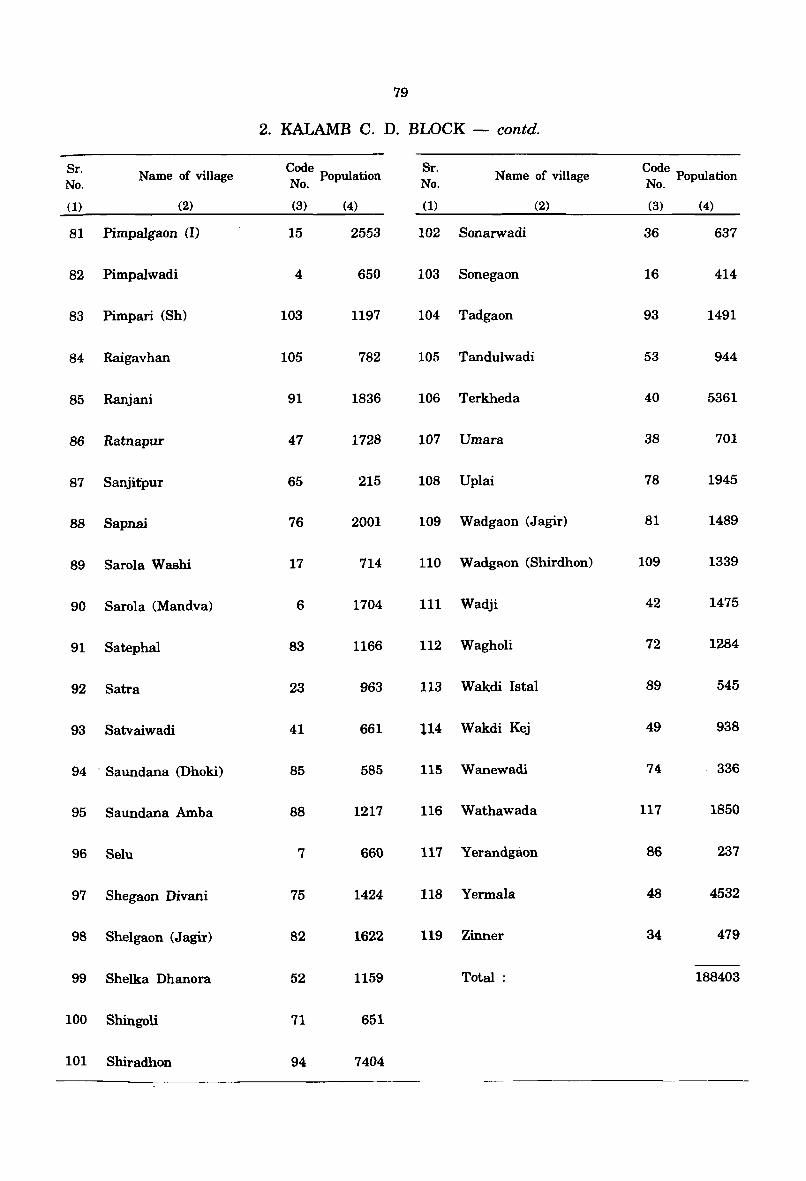
79
2. KALAMB C. D. BLOCK - contd.
Sr. Name of village Code P ul . Sr. N arne of village Code . No. N op ation No. N PopulatIOn o. o.
(1) (2) (3) (4) (1) (2) (3) (4)
81 Pimpalgaon (I) 15 2553 102 Sonarwadi 36 637
82 Pimpalwadi 4 650 103 Sonegaon 16 414
83 Pimpari (Sh) 103 1197 104 Tadgaon 93 1491
84 Raigavhan 105 782 105 Tandulwadi 53 944
85 Ranjani 91 1836 106 Terkheda 40 5391
86 Ratnapur 47 1728 107 Umara 38 701
87 Sanjitpur 65 215 108 Uplai 78 1945
88 Sapnai 76 2001 109 Wadgaon (Jagir) 81 1489
89 Sarola Washi 17 714 110 Wadgaon (Shirdhon) 109 1339
90 Sarola (Mandva) 6 1704 111 Wadji 42 1475
91 Satephal 83 1166 112 Wagholi 72 1284
92 Satra 23 963 113 Wakdi Istal 89 545
93 Satvaiwadi 41 661 114 Wakdi Kej 49 938
94 ' Saundana (Dhoki) 85 585 lUi Wanewadi 74 336
95 Saundana Amba 88 1217 116 Wathawada 117 1850
96 Selu 7 660 117 Yerandgaon 86 237
97 Shegaon Divani 75 1424 118 Yermala 48 4532
98 Shelgaon (Jagir) 82 1622 119 Zinner 34 479
99 SheIka Dhanora 52 1159 Total : 188403
100 Shingoli 71 651
101 Shiradhon 94 7404
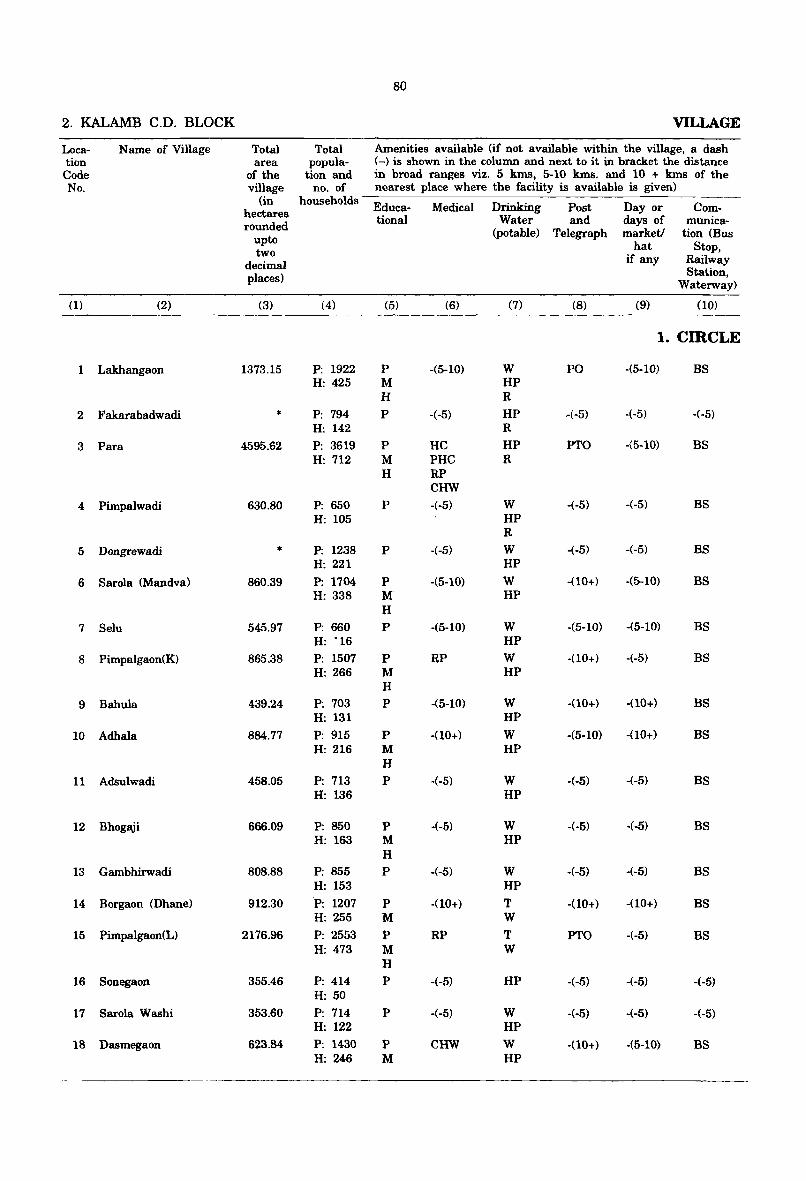
80
2. KALAMB C.D. BLOCK VILLAGE
Loca- N arne of Village Total Total Amenities available (if not available within the village, a dash tion area popula- (-) is shown in the column and next to it in bracket the distance Code of the tiOD and in broad ranges viz. 5 kms, 5-10 kms. and 10 + kms of the No. village no. of nearest place where the facility is available is given)
(in households Educa- Medical Drinking Post Day or Com-hectares rounded tional Water and days of muniea-
upto (potable) Telegraph market} tion (Bus
two hat Stop,
deeimal if any Railway
places) Station, Waterway)
(1) (2) (3) (4) (5) (6) (7) (8) (9) (10)
1. CmCLE
1 Lakhangaon 1373.15 P: 1922 P -(5-10) W PO -(5-10) BS H: 425 M HP
H R
2 Fakarabadwadi * P: 794 P -(-5) HP ~(-5) -(-5) -(-5) H: 142 R
3 Para 4595.62 P: 3619 P HC HP PTO -(5-10) BS H:712 M PHC R
H RP CHW
4 Pimpalwadi 630.80 P: 650 P -(-5) W -(-5) -(-5) BS H: 105 HP
R
5 Dongrewadi * P: 1238 P -(-5) W -(-5) -(-5) BS H: 221 HP
6 Sarola (Mandva) 860.39 P: 1704 P -(5-10) W -(10+) -(5-10) BS H: 338 M' HP
H
7 Selu 545.97 P: 660 P -(5-10) W -(5-10) -(5-10) BS H: '16 HP
8 Pimpalgaon(K) 865.38 P: 1507 P RP W -(10+) -(-5) BS H: 266 M HP
H
9 Babula 439.24 P: 703 P -(5-10) W -(10+) -(10+) BS H: 131 HP
10 Adhala 884.77 P: 915 P -(10+) W -(5-10) -(10+) BS H: 216 M HP
H
11 Adsulwadi 458.05 P: 713 P -(-5) W -(-5) -(-5) BS H: 136 HP
12 Bhogaji 666.09 P: 850 P -(-5) W -(-5) -(-5) BS H: 163 M HP
H 13 Gambhirwadi 808.88 P: 855 P -(-5) W -(-5) -(-5) BS
H: 153 HP
14 Borgaon (Dhane) 912.30 P: 1207 P -(10+) T -(10+) -(10+) BS H: 255 M W
15 Pimpalgaon(L) 2176.96 P: 2553 P RP T PTO -(-5) BS H: 473 M W
H
16 Sonegaon 355.46 P: 414 P -(-5) HP -(-5) -(-5) -(-5) H: 50
17 Sarola Washi 353.60 P: 714 P -(-5) W -(-5) -(-5) -(-5) H: 122 HP
18 Dasmegaon 623.84 P: 1430 P CHW W -(10+) -(5-10) BS H: 246 M HP
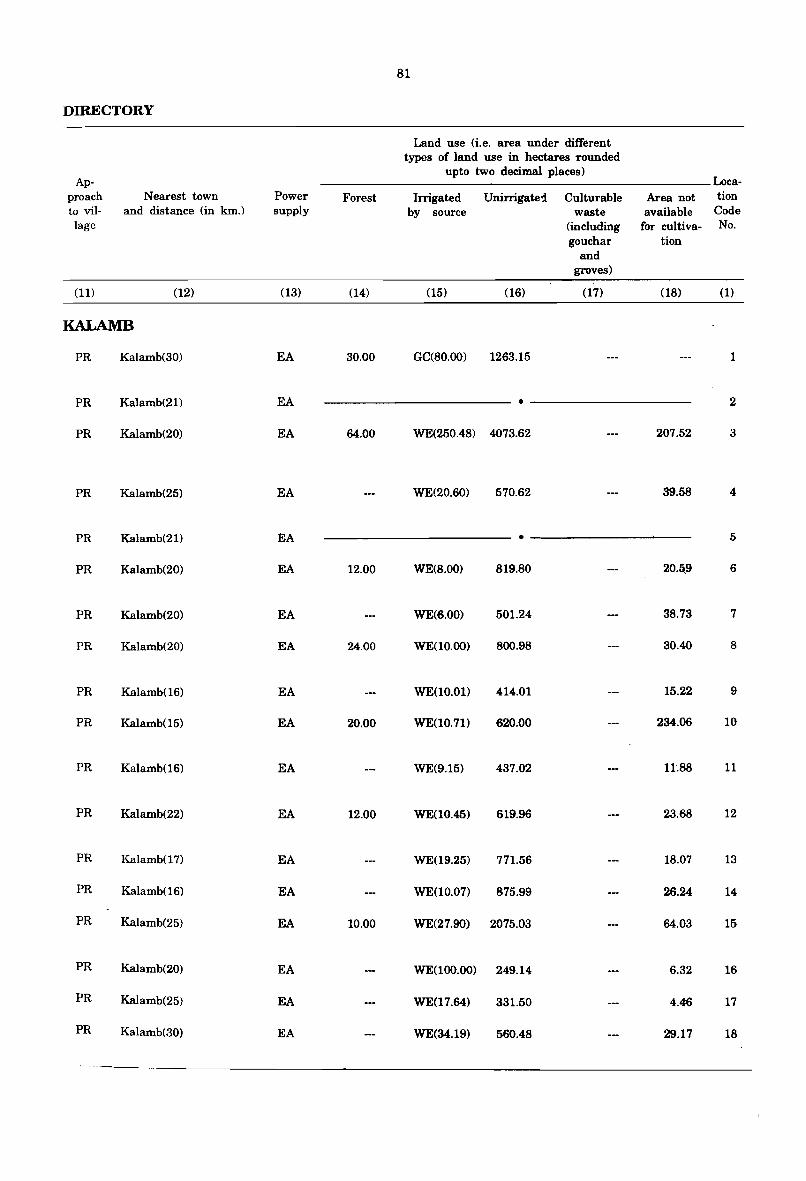
81
DIRECTORY
Land use (i.e. area under different types of land use in hectares rounded
Ap-upto two decimal places)
Loca-proach Nearest town Power Forest Irrigated Unirrigate1 Culturable Area not tion to viI- and distance (in km.) supply by source waste available Code lage (including for cultiva- No.
gouchar tion and
groves)
(11) (12) (13) (14) (15) (16) (17) (18) (1)
KALAMB
PR Kalamb(30) EA 30.00 GC(80.00) 1263.15 1
PR Kalamb(21) EA • 2
PR Kalamb(20) EA 64.00 WE(250.48) 4073.62 207.52 3
PR Kalamb(25) EA WE(20.60) 570.62 39.58 4
PR Kalamb(21) EA • 5
PR Kalamb(20) EA 12.00 WE(8.00) 819.80 20.5_9 6
PR Kalamb(20) EA WE(6.00) 501.24 38.73 7
PR Kalamb(20) EA 24.00 WE(10.00) 800.98 30.40 8
PR Kalamb(16) EA WE(10.0l) 414.01 15.22 9
PR Kalamb(15) EA 20.00 WE(10.71) 620.00 234.06 10
PR Kalamb(16) EA WE(9.15) 437.02 11.88 11
PR Kalamb(22) EA 12.00 WE(lO.45) 619.96 23.68 12
PR Kalamb(17) EA WE(19.25) 771.56 18.07 13
PR Kalamb(16) EA WE(10.07) 875.99 26.24 14
PR Kalamb(25) EA 10.00 WE(27.90) 2075.03 64.03 15
PR Kalamb(20) EA WE(100.00) 249.14 6.32 16
PR Kalamb(25) EA WE(17.64) 331.50 4.46 17
PR Kalamb(30) EA WE(34.19) 560.48 29.17 18

84
2. KALAMB C.D. BLOCK - contd. VILLA&.
Loc&- Name of Village Total Total Amenities available (if not available within the village, a dash tion area popula- (-) is shown in the column and next to it in bracket the distance Code of the tion and in broad ranges viz. 5 kms, 5-10 kms. and 10 + kms of the No. village no. of nearest place where the facility is available 'is given)
(in households Educa- Medical Drinking Post Day or Com-hectares rounded tional Water and days of munica-
upto (potable) Telegraph marketJ tion (Bus .
two hat Stop,
decimal if any Railway
places) Station, Waterway)
(1) (2) (3) (4) (5) (6) (7) (8) (9) (10)
38 Umara 512.42 P: 701 P -(-5) W -(-5) -(-5) . BS H: 147 HP
39 Khamkarwadi 579.89 P: 962 P -(-5) W. -(-5) -(-5) BS H: 172 HJ?
40 Terkheda 2515.91 P: 5361 P(3) RP T PTO Sun BS H: 1047 M R
41 Satvaiwadi 405.00 P: 661 P -(-5) W -(-5) -(-5) -(-5) H: 151 HP
42 Wadji 700.98 P: 1475 P -(-5) W -(-5)" , -(-5) BS H: 258 M HP
43 Kadaknathwadi 2525.48 P: 2169 P(2) HC T PTO -(-5) BS H: 406 M CHW W
HP
44 Masobachiwadi 989.70 P: 758 P -(-5) W -(-5) -(-5) BS H: 145 HP
45 Bangarwadi 648.60 P: 1133 P -(-5) W -(-5) -(-5) BS H: 185 HP
46 Dudhalwadi 487.21 P: 474 P -(-5) W -(-5) -(-5) -(-5) H: 92 lip
47 Ratnapur 573.68 P: 1728 P . .(-5) W -(-5) -(-5) BS H: 333 M HP
48 Yermala 1997.74 P: 4532 P(4) H T PTO Wed BS H: 841 OM MCW W Phone
AC MH HP FPC
2. CIRCLE
49 Wakdi Kej 635.24 P: 938 P -(-5) W -(-5) -(10+) BS H: 190 HP
50 Andorll. 1959.19 P: 3068 P MH W -(-5) -(-5) BS H: 601 M HP
51 Borda 581.07 P: 1393 P -(-5) W -(5-10) -(5-10) BS H: 248 HP
52 Shelka Dhanora 575.87 P: 1159 P -(-5) HP -(-5) -(-5) BS H: 234
53 Tandulwadi 821.68 P: 944 P -(-5) W -(-5) -(10+) BS H: 199 HP
54 Diksal 1027.10 P: 1956 P -(-5) W -(-5) (-5) -(-5) H: 340 M HP
C
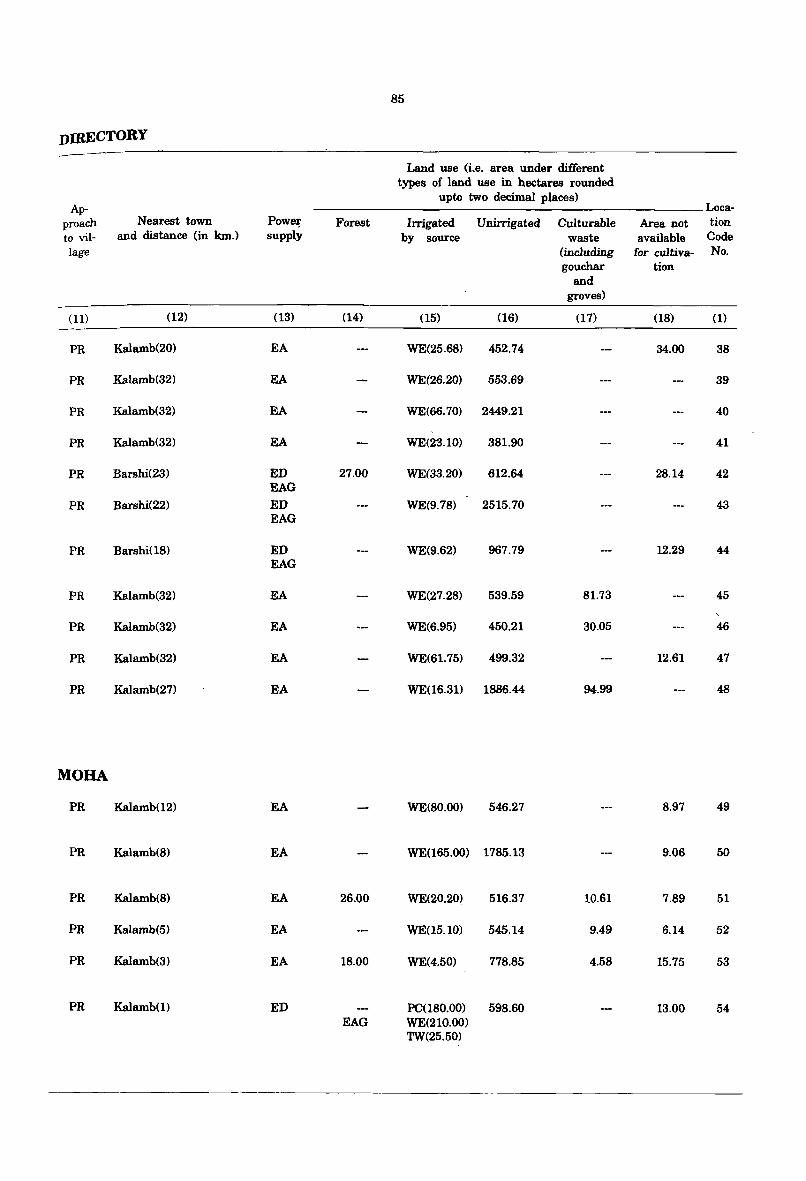
85
DIRECTORY
Land use (i.e. area under different types of land use in hectares rounded
upto two decimal places) Loca-Ap-
proach Nearest town Pow~ Forest Irrigated Unirrigated Culturable Area not tion to viI- and distance (in km.) supply by source waste available Code lage (including for cultiva- No.
gouchar tion and
groves)
(11) (12) (13) (14) (15) (16) (17) (18) (1)
PR Kalamb(20) EA WE(25.68) 452.74 34.00 38
PR Kalamb(32) EA WE(26.20) 553.69 39
PR Kalamb(32) EA WE(66.70) 2449.21 40
PR Kalamb(32) EA WE(23.10) 381.90 41
PR Barshi(23) ED 27.00 WE(33.20) 612.64 28.14 42 EAG
PR Barshi(22) ED WE(9.78) 2515.70 43 EAG
PR Barshi(18) ED WE(9.62) 967.79 12.29 44 EAG
PR Kalamb(32) EA WE(27.28) 539.59 81.73 45
PR Kalamb(32) EA WE(6.95) 450.21 30.05 46
PR Kalamb(32) EA WE(61.75) 499.32 12.61 47
PR Kalamb(27) EA WE(16.31) 1886.44 94.99 48
MOBA
PR Kalamb(12) EA WE(80.00) 546.27 8.97 49
PR Kalamb(8) EA WE(165.00) 1785.13 9.06 50
PR Kalamb(8) EA 26.00 WE(20.20) 516.37 10.61 7.89 51
PR Kalamb(5) EA WE(15.10) 545.14 9.49 6.14 52
PR Kalamb(3) EA 18.00 WE(4.50) 778.85 4.58 15.75 53
PR Kalamh(l) ED PC(180.00) 598.60 13.00 54 EAG WE(210.00)
TW(25.50)

86
2. KALAMB C.D. BLOCK - contd. VILLAGE
Loca- Name of Village Total Total Amenities available (if not available within the village, a dash tion area popula- (-) is shown in the column and next to it in bracket the distance Code of the tion and in broad ranges viz. 5 luns, 5-10 kms. and 10 + kms of the No. village no. of nearest place where the facility is available is given)
(in households Educa- Medical Drinking Post Day or Com-hectares rounded tional Water and days of munica-
upto (potable) Telegraph market) tion (Bus
two hat Stop,
decimal if any Railway
places) Station, Waterway)
(1) (2) (3) (4) (5) (6) (7) (8) (9) (10)
55 Khadki 515.00 P: 564 P -(-5) W -(-5) -(-5) -(-5) H: 112 M HP
56 Hingangaon 780.02 P: 839 P -(-5) T -(-5) -(10+) BS H:·153 W
HP R
57 Karanjkalla 1056.20 P: 1633 P MH T -(10+) :(10+) BS H: 289 M W
H HP
58 Bhatshirapura 529.69 P: 1760 P B H: 282 M HP
59 Pimpalgaon Dola 711.89 P: 1282 P -(-5) TK -(-5) -(-~ BS H: 215 M HP .
60 Mangrul 26l?7.05 P: 3708 P MH W PO -(5-10) BS H: 647 M HP Phone
61 Kherda 345.12 P: 699 P -(5-10) HP -(-5)- -(5-10) BS H: 126
62 Moha 3437.33 P: 5307 P(2) PHC W PO -(10+) BS H: 940 M HP Phone
H
63 Babhalgaon 1085.38 P: 1390 P -(-5) VI -(10+) -(10+) BS H: 329 HP
64 Pangaon 861.04 P: 1786 P PHS W -(10+) -(-5) BS H: 343 M HP
65 Sanjitpur 318.34 P: 215 P -C-5) HP -(-5) -(-5) -(-5)
H: 55
66 Dahiphal 1187.03 P: 2638 P PHC W PO -(10+) BS H: 550 M HP Phone
H
67 Gaur 1951.69 P: 2798 P -(-5) T -(10+) -(10+) BS H: 508 M W
HP
68 Baramachiwadi 445.07 P: 484 P -(-5) T -(-5) -(10+) BS H: 104 W
69 Nagzarwadi 733.93 P: 1188 P -(-5) HP -(-5) -(10+) -(-5) H: 219
70 Khamaswadi 3593.71 P: 6228 P MH T PO Wed BS H: 1092 M PHS W Phone
H D HP NH RP
71 Shingoli 219.19 P: 651 P -(-5) W -(-5) -00+) BS H: 127 HP
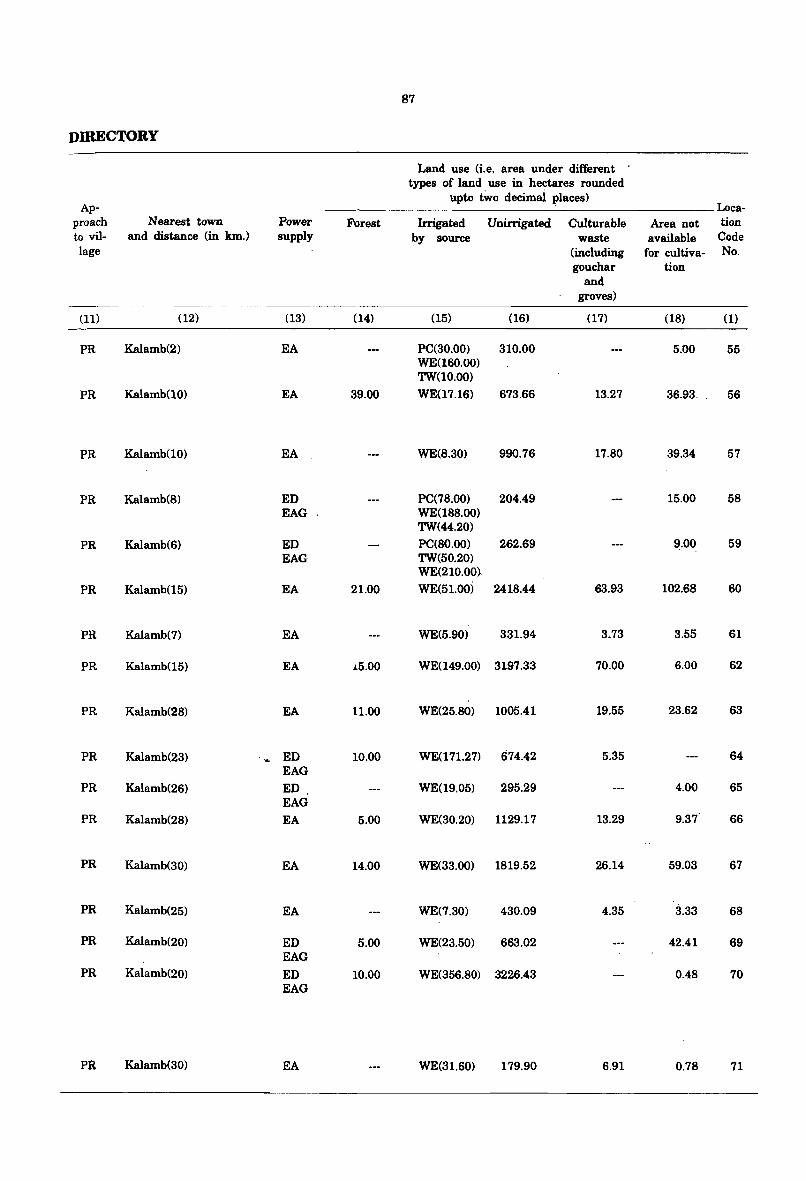
87
DIRECTORY
Land use (i.e. area under different types of land. use in hectares rounded
Ap-upto two decimal ).)laces)
Loca-proach Nearest town Power Forest Irrigated Unirrigated Culturable Area not tion to vil- and distance (in km.) supply by source waste available Code lage (including for cultiva- No.
gouchar tion and
groves)
(11) (12) (13) (14) (15) (16) (17) (18) (1)
PR Kalamb(2) EA PC(30.00) 310.00 5.00 55 WE(l60.00) TW(10.00)
PR Kalamb(10) EA 39.00 WE(17.16) 673.66 13.27 36.93. . - 56
PR Kalamb(10) EA WE(8.30) 990.76 17.80 39.34 57
PR Kalamb(8) ED PC(78.00) 204.49 15.00 58 EAG WE(188.00)
TW(44.20)
PR Kalamb(6) ED PC(80.00) 262.69 9.00 59 EAG TW(50.20)
WE(210.00)
PR Kalamb(15) EA 21.00 WE(51.00) 2418.44 63.93 102.68 60
PR Kalamb(7) EA WE(5.90) 331.94 3.73 3.55 61
PR Kalamb(15) EA i5.00 WE(149.00) 3197.33 70.00 6.00 62
PR Kalamb(28) EA 11.00 WE(25.80) 1005.41 19.55 23.62 63
PR Kalamb(23) ~ ED 10.00 WE(171.27) 674.42 5.35 64 EAG
PR Kalamb(26) ED WE(19.05) 295.29 4.00 65 EAG
PR Kalamb(28) EA 5.00 WE(30.20) 1129.17 13.29 9.37 66
PR Kalamb(30) EA 14.00 WE(33.00) 1819.52 26.14 59.03 67
PR Kalamb(25) EA WE(7.30) 4"30.09 4.35 3.33 68
PR Kalamb(20) ED 5.00 WE(23.50) 663.02 42.41 69 EAG
PR Kalamb(20) ED 10.00 WE(356.80) 3226.43 0.48 70 EAG
PR Kalamb(30) EA WE(31.60) 179.90 6.91 0.78 71
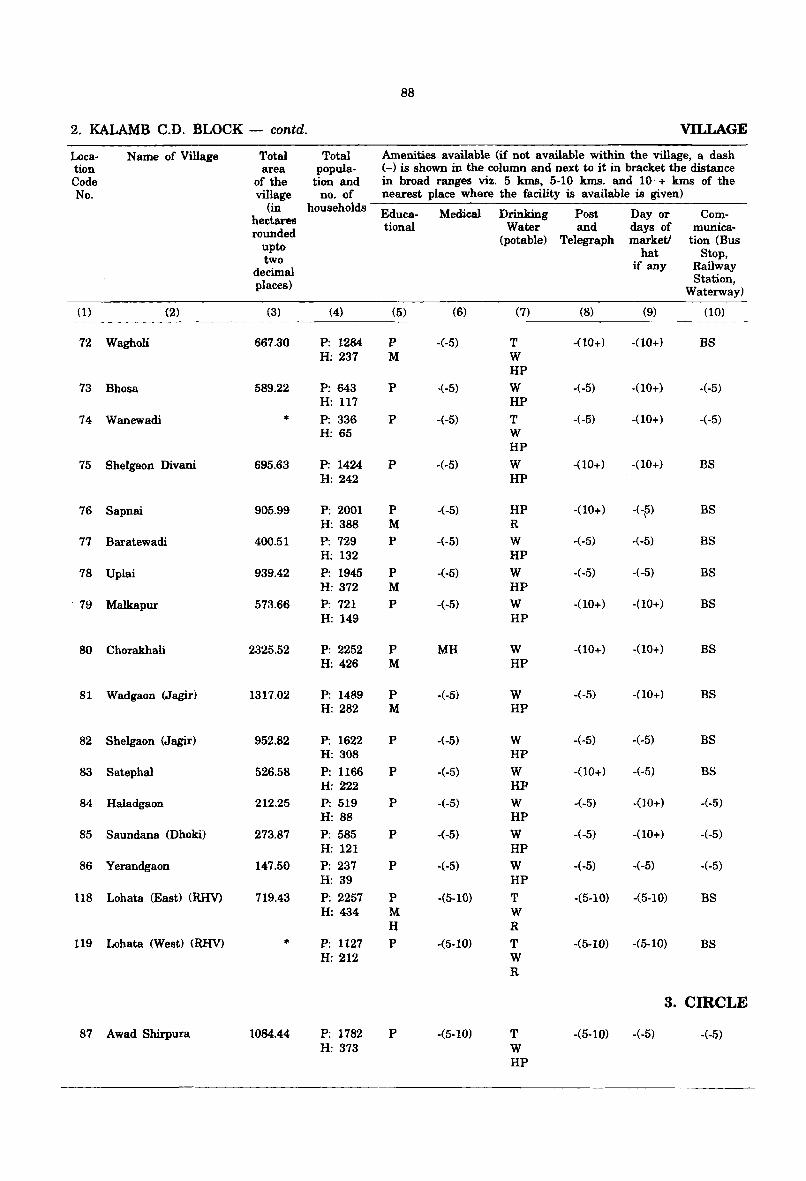
88
2. KALAMB C.D. BLOCK - contd. VILLAGE
Loca- Name of Village Total Total Amenities available (if not available within the village, a dash tion area popula- (-) is shown in the column and next to it in bracket the distance Code of the tion and in broad ranges viz. 5 kms, 5-10 kms. and 10 + luns of the No. village no. of nearest place where the facility is available is given)
(in households Educa- Medical Drinking Post Day or Com-hectares rounded tional Water and days of munica-
upto (potable) Telegraph marketl tion (Bus
two hat Stop,
decimal if any Railway
places) Station, Waterway)
(1) (2) (3) (4) (5) (6) (7) (8) (9) (10)
72 Wagholi 667.30 P: 1284 P -(-5) T -(10+) -(10+) BS H: 237 M W
HP 73 Bhosa 589.22 P: 643 P ·(-5) W -(-5) -(10+) -(-5)
H: 117 HP
74 Wanewadi * P: 336 P -(-5) T -(-5) -(10+) -(-5)
H: 65 W HP
75 Shelgaon Divani 695.63 P: 1424 P -(-5) W -(10+) -(10+) BS H: 242 HP
76 Sapnai 905.99 P: 2001 P -(-5) HP -(10+) -(-pi BS H: 388 M R
77 Baratewadi 400.51 P: 729 P -(-5) W -(-5) -(-5) BS H: 132 HP
78 Uplai 939.42 P: 1945 P -(-5) W -(-5) -(-5) BS H: 372 M HP
, 79 Malkapur 573.66 P: 721 P -(-5) W -(10+) -(10+) BS H: 149 HP
80 Chorakhali 2325.52 P: 2252 P MH W -(10+) -(10+) BS H: 426 M HP
81 Wadgaon (Jagir) 1317,02 P: 1489 P -(-5) W -(-5) -(10+) BS H: 282 M HP
82 Shelgaon (Jagir) 952.82 P: 1622 P -(-5) W -(-5) -(-5) BS H: 308 HP
83 Satephal 526.58 P: 1166 P -(-5) W -00+) -(-5) BS H: 222 HP
84 Haladgaon 212.25 P: 519 P -(-5) W -(-5) -(10+) -(-5) H: 88 HP
85 Saundana (Dhoki) 273.87 P: 585 P -(-5) W -(-5) -(10+) -(-5) H: 121 HP
86 Yerandgaon 147.50 P: 237 P -(-5) W -(-5) -(-5) -(-5) H: 39 HP
118 Lohata (East) (RHV) 719.43 P: 2257 P -(5-10) T -(5-10) -(5-10) BS H: 434 M W
H R 119 Lohata (West) (RHV) * P: 1127 P -(5-10) T -(5-10) -(5-10) BS
H: 212 W R
3. CIRCLE
87 Awad Shirpura 1084.44 P: 1782 P -(5-10) T -(5-10) -(-5) -(-5) H: 373 W
HP
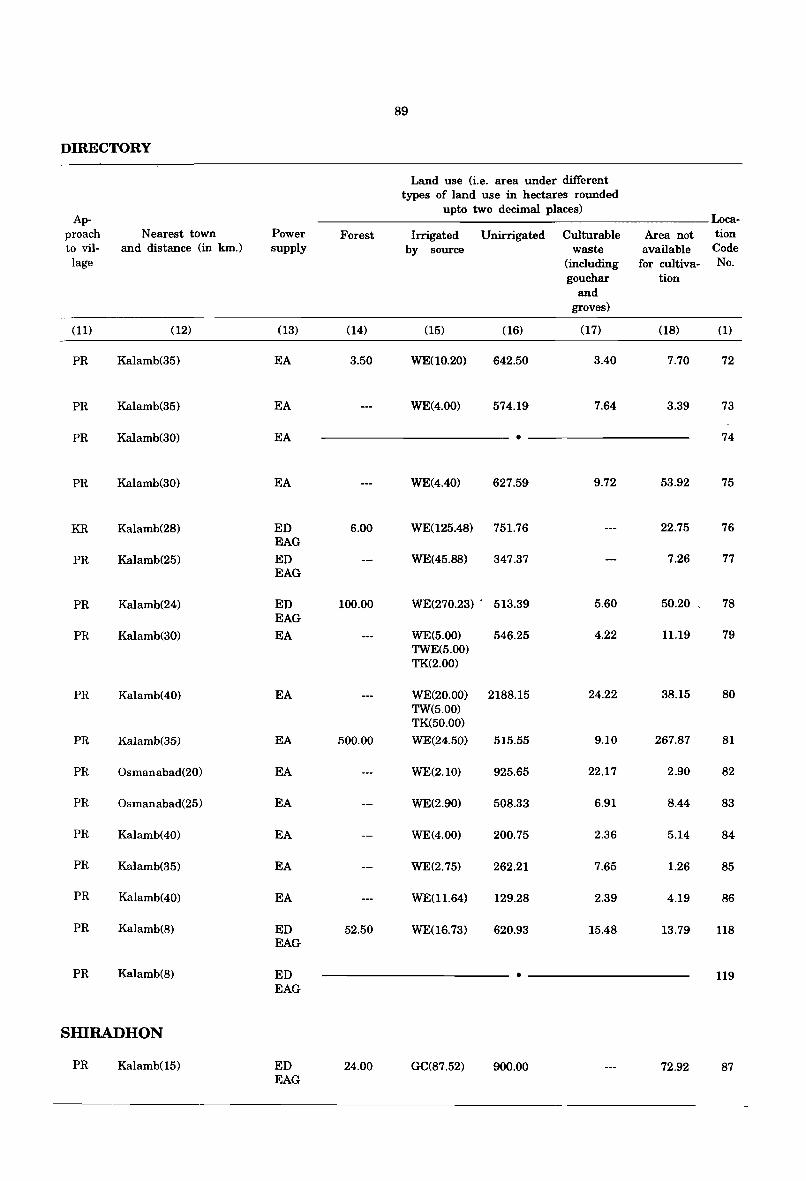
89
nffiECTORY
Land use (i.e. area under different types of land use in hectares rounded
Ap-upto two decimal places)
Loca-proach Nearest town Power Forest Irrigated Unirrigated Culturable Area not tion to vil- and distance (in km.) supply by source waste available Code lage (including for cultiva- No.
gouchar tion and
groves)
(11) (12) (13) (14) (15) (16) (17) (18) (1)
PR Kalamb(35) EA 3.50 WE(10.20) 642.50 3.40 7.70 72
PR Kalamb(35) EA WE(4.00) 574.19 7.64 3.39 73
PR Kalamb(30) EA • 74
PR Kalamb(30) EA WE(4.40) 627.59 9.72 53.92 75
KR Kalamb(28) ED 6.00 WE(125.48) 751.76 22.75 76 EAG
PR Kalamb(25) ED WE(45.88) 347.37 7.26 77 EAG
PR Kalamb(24) ED 100.00 WE{270.23) . 513.39 5.60 50.20 78 EAG
PR Kalamb(30) EA WE(5.00) 546.25 4.22 11.19 79 TWE(5.00) TK(2.00)
PR Kalamb(40) EA WE(20.00) 2188.15 24.22 38.15 80 TW(5.00) TK(50.00)
PR Kalamb(35) EA 500.00 WE(24.50) 515.55 9.10 267.87 81
PR Osmanabad(20) EA WE(2.10) 925.65 22.17 2.90 82
PR Osmanabad(25) EA WE(2.90) 508.33 6.91 8.44 83
PR Kalamb(40) EA WE(4.00) 200.75 2.36 5.14 84
PR Kalamb(35) EA WE(2.75) 262.21 7.65 1.26 85
PR Kalamb(40) EA WE(11.64) 129.28 2.39 4.19 86
PR Kalamb(8) ED 52.50 WE(16.73) 620.93 15.48 13.79 118 EAG
PR Kalamb(8) ED • 119 EAG
SHlRADHON
PR Kalamb(15) ED 24.00 GC(87.52) 900.00 72.92 87 EAG
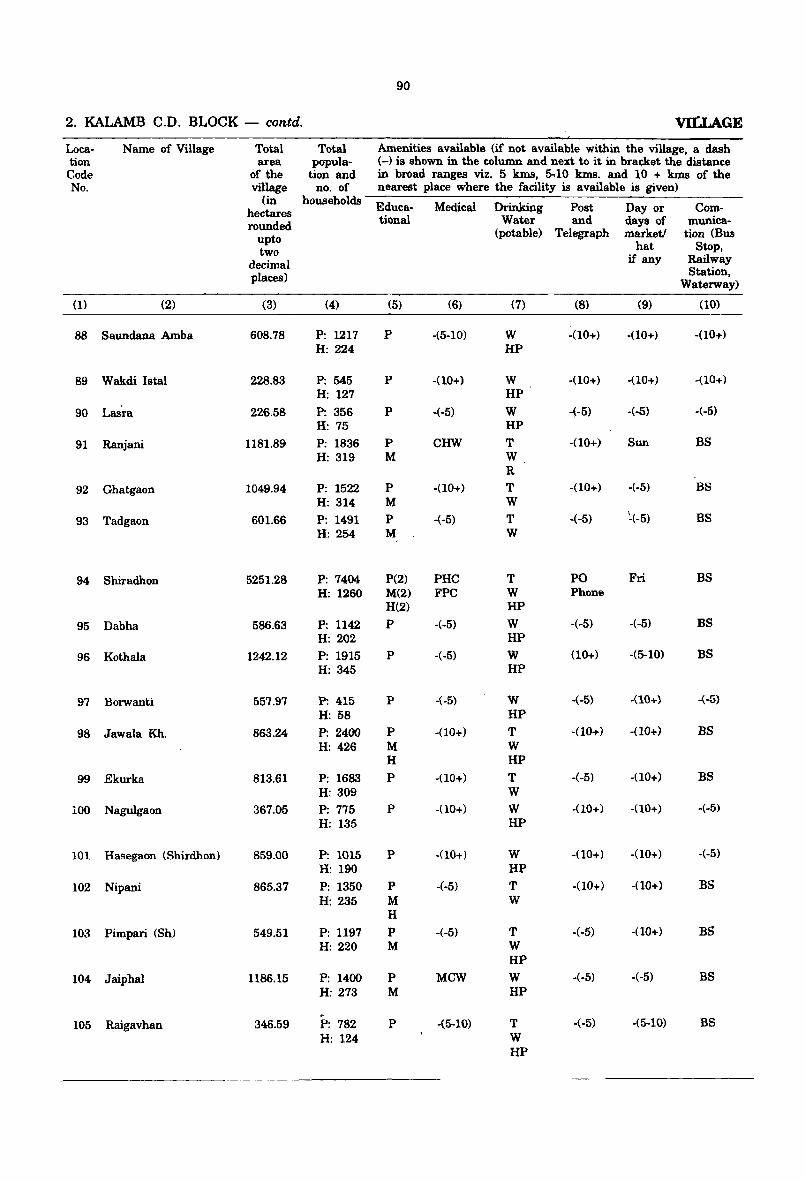
90
2. KALAMB C.D. BLOCK - contd. VILLAGE
Loca- N arne of Village Total Total Amenities available (if not available within the village, a dash tion area popula- (-) is shown in the column and next to it in bracket the distance Code of the tion and in broad ranges viz. 5 kms, 5.10 kms. and 10 + kms of the No. village no. of nearest place where the facility is available is given)
(in households Educa- Medical Drinking Post Day or Com-hectares rounded tional Water and days of munica-
upto (potable) Telegraph marketl tion (Bus
two hat Stop,
decimal if any Railway
places) Station, Waterway)
(1) (2) (3) (4) (5) (6) (7) (8) (9) (10)
88 Saundana Amba 608.78 P: 1217 P -(5-10) W -(10+) -(10+) -(10+) H: 224 HP
89 Wakdi Istal 228.83 P: 545 P -(10+) W -(10+) -(10+) -(10+) H: 127 HP
90 LaSra 226.58 P: 356 P -(-5) W -~-5) -(-5) -(-6)
H: 75 HP
91 Ranjani 1181.89 P: 1836 P CHW T -(10+) Sun BS H: 319 M W
R
92 Ghatgaon 1049.94 P: 1522 P -(10+) T -(10+) -(-5) BS H: 314 M W
93 Tadgaon 601.66 P: 1491 P -(-5) T -(-5) ~(-5) BS H: 254 M W
94 Shiradhon 5251.28 P: 7404 P(2) PHC T PO Fri BS H: 1260 M(2) FPC W Phone
H(2) HP
95 Dabha 586.63 P: 1142 P -(-5) W -(-5) -(-5) BS H: 202 HP
96 Kothala 1242.12 P: 1915 P -(-5) W (10+) -(5-10) BS H: 345 HP
97 Borwanti 557.97 P: 415 P -(-5) W -(-5) -(10+) -(-5)
H: 58 HP
98 Jawala Kh. 863.24 P: 2400 P -(10+) T -00+) -00+) BS H: 426 M W
H HP
99 Ekurka 813.61 P: 1683 P -(10+) T -(-5) -(10+) BS H: 309 W
100 Nagulgaon 367.05 P: 775 P -(10+) W -(10+) -(10+) -(·5)
H: 135 HP
101 Hasegaon (Shirdhon) 859.00 P: 1015 P -(10+) W -(10+) -(10+) -(-5) H: 190 HP
102 Nipani 865.37 P: 1350 P ·(-5) T ·(10+) -(10+) BS H: 235 M W
H
103 Pimpari (Sh) 549.51 P: 1197 P -(-5) T -(-5) -(10+) BS H: 220 M W
HP
104 Jaiphal 1186.15 P: 1400 P MCW W -(-5) -(-5) BS H: 273 M HP
,.
105 Raigavhan 346.59 P: 782 P -(5-10) T -(-5) -(5-10) BS H: 124 W
HP
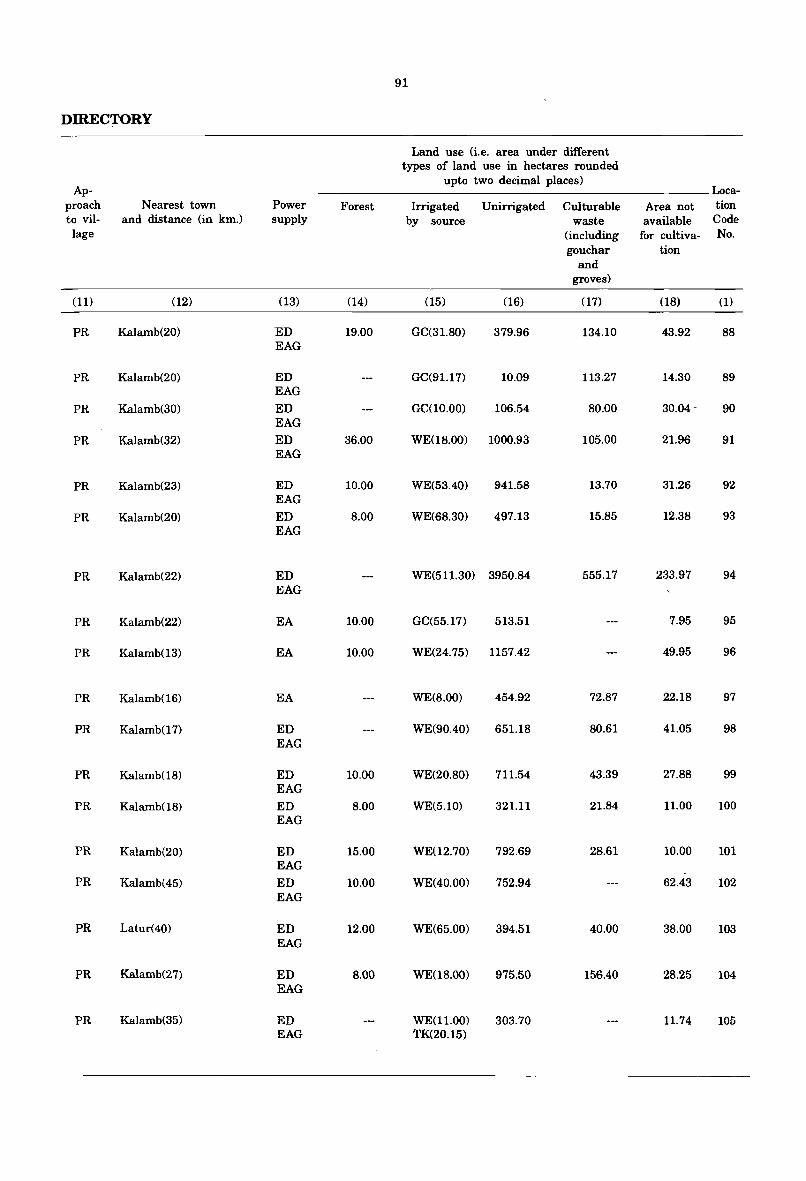
91
DIRECTORY
Land use (i.e. area under different types of land use in hectares rounded
Ap-upto two decimal places)
Loca-proach Nearest town Power Forest Irrigated Unirrigated Culturable Area not tion to vil- and distance (in km.) supply by source waste available Code lage (including for cultiva- No.
gouchar tion and
groves)
(11) (12) (13) (14) (15) (16) (17) (18) (1)
PR Kalamb(20) ED 19.00 GC(31.80) 379.96 134.10 43.92 88 EAG
PR Kalamb(20) ED GC(91.17) 10.09 113.27 14.30 89 EAG
PR Kalamb(30) ED GC(lO.OO) 106.54 80.00 30.04 - 90 EAG
PR Kalamb(32) ED 36.00 WE(l8.00) 1000.93 105.00 21.96 91 EAG
PR Kalamb(23) ED 10.00 WE(53.40) 941.58 13.70 31.26 92 EAG
PR Kalamb(20) ED 8.00 WE(68.30) 497.13 15.85 12.38 93 EAG
PR Kalamb(22) ED WE(511.30) 3950.84 555.17 233.97 94 EAG
PR Kalamb(22) EA 10.00 GC(55.17) 513.51 7.95 95
PR Kalamb(13) EA 10.00 WE(24.75) 1157.42 49.95 96
PR Kalamb(16) EA WE(8.00) 454.92 72.87 22.18 97
PR Kalamb(17) ED WE(90.40) 651.18 80.61 41.05 98 EAG
PR Kalamb(18) ED 10.00 WE(20.80) 711.54 43.39 27.88 99 EAG
PR Kalamb(18) ED 8.00 WE(5.10) 321.11 21.84 11.00 100 EAG
PR Kalamb(20) ED 15.00 WE(12.70) 792.69 28.61 10.00 101 EAG
PR Kalamb(45) ED 10.00 WE(40.00) 752.94 62.43 102 EAG
PR Latuc(40) ED 12.00 WE(65.00) 394.51 40.00 38.00 103 EAG
PR Kalamb(27) ED 8.00 WE(I8.00) 975.50 156.40 28.25 104 EAG
PR Kalamb(35) ED WE(11.00) 303.70 11.74 105 EAG TK(20.15)
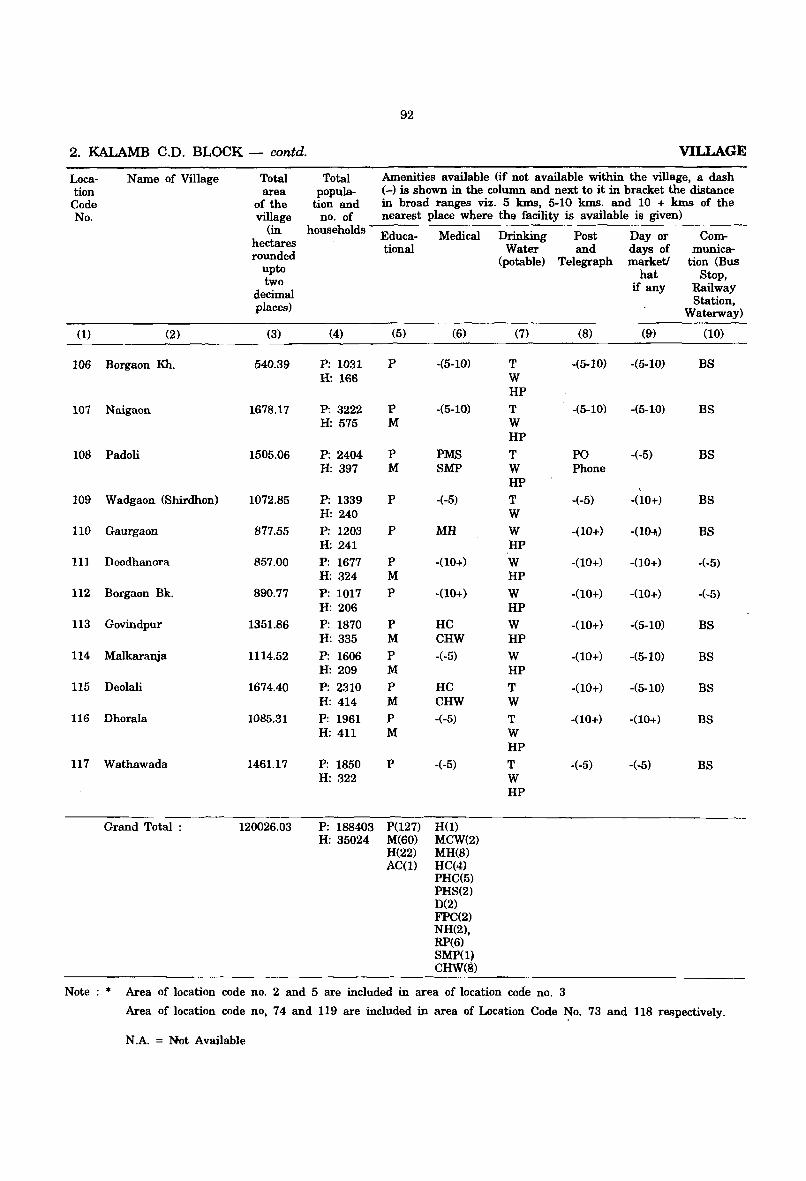
92
2. KALAMB C.D. BLOCK - contd. VILLAGE
Loca- N arne of Village Total Total Amenities available (if not available within the village, a dash tion area popula- (-) is shown in the column and next to it in bracket the distance Code of the tion and in broad ranges viz. 5 kms, 5-10 kms. and 10 + kms of the No. village no. of nearest place where the facility is available is given)
(in households Educa- Medical Drinking Post Day or Com-hectares rounded
tional Water and days of munica-
upto (potable) Telegraph marketi tion (Bus
hat Stop, two if any Railway
decimal places) Station,
Waterway)
(1) (2) (3) (4) (5) (6) (7) (8) (9) (10)
106 Borgaon Kh. 540.39 P: 1031 P -(5-10) T -(5-10) -(5-10) BS H: 166 W
HP
107 Naigaon 1678.17 P: 3222 P -(5-10) T -(5-10) -(5-10) BS H: 575 M W
HP
108 Padoli 1505.06 P: 2404 P PMS T PO -(-5) BS H: 397 M SMP W Phone
HP 109 Wadgaon (Shirdhon) 1072.85 P: 1339 P -(-5) T -(-5) -(10+) BS
H: 240 W
110 Gaurgaon 877.55 P: 1203 P MH W -(10+) -(10~) BS H: 241 HP
111 Deodhanora 857.00 P: 1677 P -(10+) W -(10+) -(10+) -(-5) H: 324 M HP
112 Borgaon Bk. 890.77 P: 1017 P -(10+) W -(10+) -(10+) -(-5) H: 206 HP
113 Govindpur 1351.86 P: 1870 P HC W -(10+) -(5-10) BS H: 335 M CHW HP
114 Malkaranja 1114.52 P: 1606 P -(-5) W -(10+) -(5-10) BS H: 209 M HP
115 Deolali 1674.40 P: 2310 P HC T -(10+) -(5-10) BS H: 414 M CHW W
116 Dhorala 1085.31 P: 1961 P -(-5) T -(10+) -(10+) BS H: 411 M W
HP 117 Wathawada 1461.17 P: 1850 P -(-5) T -(-5) -(·5) BS
H: 322 W HP
Grand Total : 120026.03 P: 188403 P(127) H(l) H: 35024 M(60) MCW(2)
H(22) MH(8) AC(l) HC(4)
PHC(5) PHS(2) D(2) FPC(2) NH(2), RP(6) SMP(l) CHW(S)
Note : * Area of location code no. 2 and 5 are included in area of location code no. 3
Area of location code no, 74 and 119 are included in area of Location Code ~o. 73 and 118 respectively.
N.A. = Not Available

DIRECTORY
Ap-proach Nearest town Power Forest to vil- and distance (in kIn.) supply lage
(11) (12) (13) (14)
PR Kalamb(40) ED EAG
PR Kalamb(50) ED 40.00 EAG
PR Latur(40) ED 32.00 EAG
PR Kalamb(50) ED 40.00 EAG
PR Kalamb(35) ED 30.00 EAG
PR Oalamb(18) ED 2.00 EAG
PR Kalamb(20) ED 30.00 EAG
PR Kalamb(18) ED 8.00 EAG
PR Kalamb(21) ED EAG
PR Kalamb(23) ED 30.00 EAG
PR Kalamb(32) ED 15.00 EAG
PR Kalamb(38) ED EAG
1522.95
93
Land use (i.e. area under different types of land use in hectares rounded
upto two decimal places)
Irrigated Unirrigated by source
(15) (16)
WE(15.00) 454.60 TK(55.10)
WE(64.75) 1522.55 TK(36.00)
WE(170.00) 1221.01
WE(50.04) 940.60 TK(25.00)
WE(35.00) 775.01
WE(23.50) 781.85
WE(19.20) 629.81
WE(72.00) 1216.59 TK(20.25)
WE(20.00) 1059.77 TK(10.50)
WE(90.00) 1516.61
WE(51.00) 1012.11
WE(40.35) 1337.38 TR(30.00)
.GC(355.66) 102915.42 PC(368.00) WE(6484.10) TK(249.00) TW(139.90)
Culturable waste
(including gouchar
and groves)
(17)
50.00
31.65
211.27
21.17
33.57
7.20
53.44
2549.34
Loca-Area not tion
available Code
for cultiva- No. tion
(18) (1)
15.69 106
14.87 107
32.05 -108
17.21 109
37.54 110
18.00 111
0.49 112
13.85 113 \
24.25 114
4.22 115
116
117
3451.17
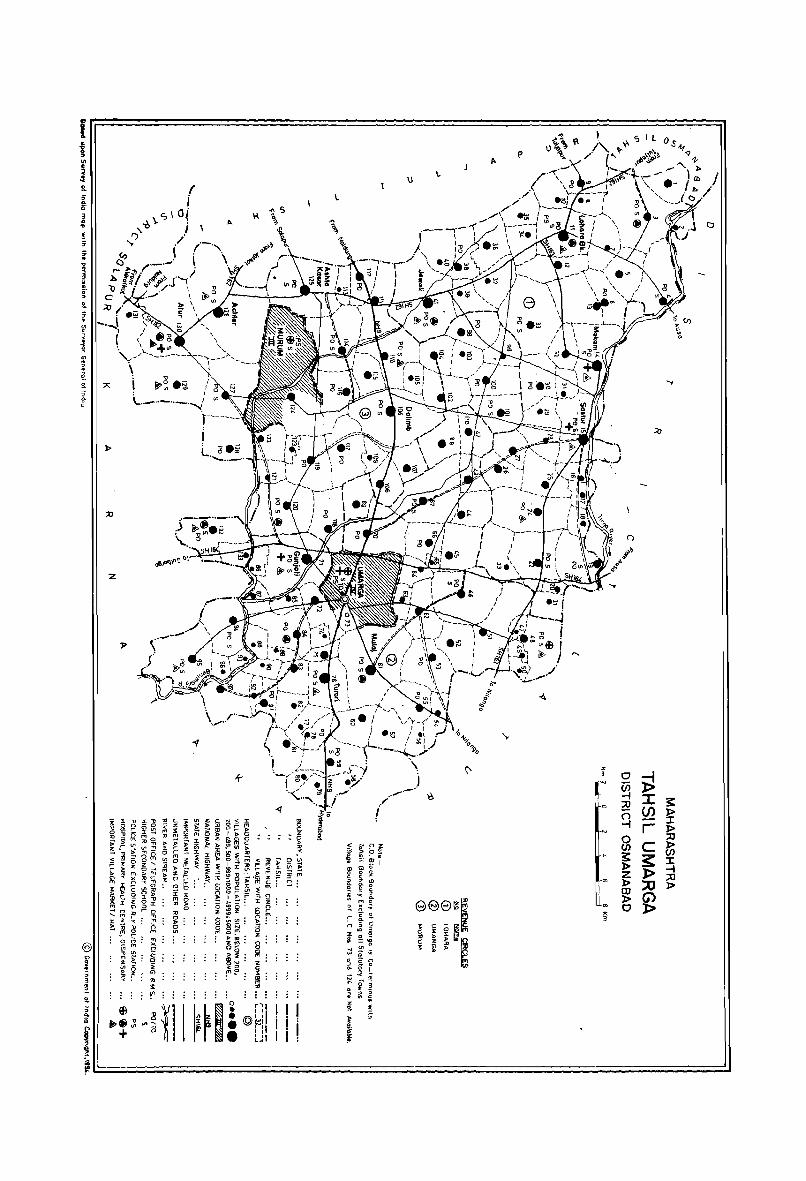
ir==============~===-~ .: !t ;;
I'
\) L
I ; ~
3 ~
-o\.c,\O(
,.,' j ...., ./ ~ ,
L
x 3
.. "-3
0 ~ ~ ::31 J: 3: () ~ ~ -f r g
l>
C :xl
3: ~ ~
l> ::t Z l> -f l> :::0
:xl !D l> l> ~ 0
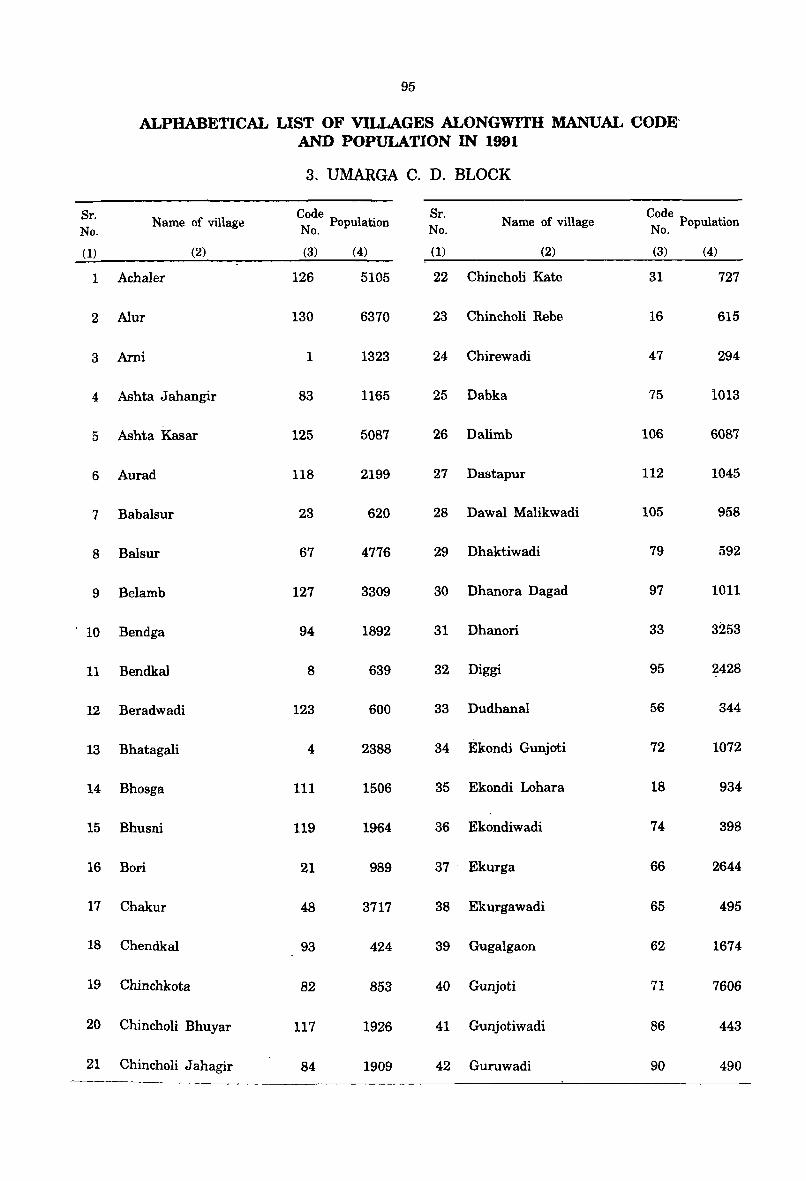
95
ALPHABETICAL LIST OF VILLAGES ALONGWITH MANUAL CODE' AND POPULATION IN 1991
3. UMARGA C. D. BLOCK
Sr. N arne of village Code Sr.
Name of village Code .
No. N Population No. N Population o. o.
(1) (2) (3) (4) (1) (2) (3) (4)
1 Achaler 126 5105 22 Chincholi Kate 31 727
2 Alur 130 6370 23 Chincholi Rebe 16 615
3 Arni 1 1323 24 Chirewadi 47 294
4 Ashta J ahangir 83 1165 25 Dabka 75 1013
5 Ashta Kasar 125 5087 26 Dalimb 106 6087
6 Aurad 118 2199 27 Dastapur 112 1045
7 Babalsur 23 620 28 Dawal Malikwadi 105 958
8 Balsur 67 4776 29 Dhaktiwadi 79 592
9 Belamb 127 3309 30 Dhanora Dagad 97 1011
10 Bendga 94 1892 31 Dhanori 33 3253
11 Bendkal 8 639 32 Diggi 95 2428
12 Beradwadi 123 600 33 Dudhanal 56 344
13 Bhatagali 4 2388 34 Ekondi Gunjoti 72 1072
14 Bhosga 111 1506 35 Ekondi Lohara 18 934
15 Bhusni 119 1964 36 Ekondiwadi 74 398
16 BOFi 21 989 37 . Ekurga 66 2644
17 Chakur 48 3717 38 Ekurgawadi 65 495
18 Chendkal 93 424 39 Gugalgaon 62 1674
19 Chinchkota 82 853 40 Gunjoti 71 7606
20 Chincholi Bhuyar 117 1926 41 Gunjotiwadi 86 443
21 Chincholi Jahagir 84 1909 42 Guruwadi 90 490
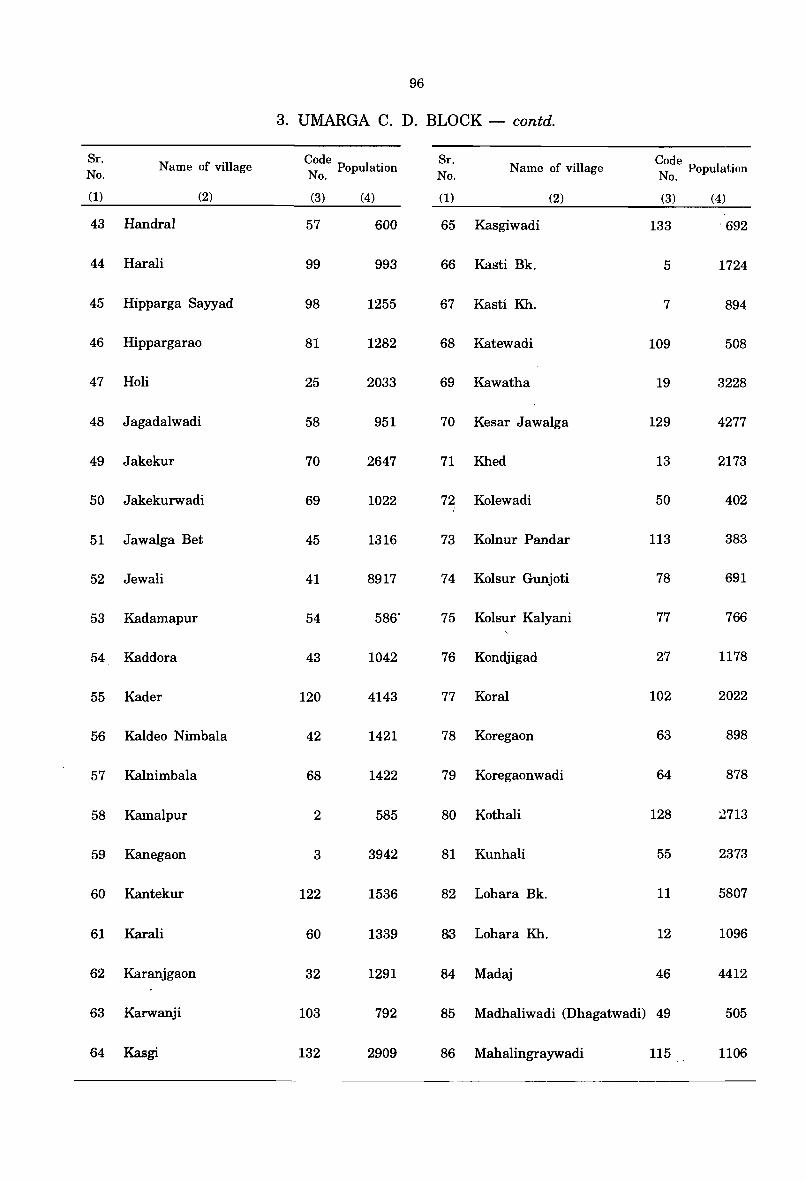
96
3. UMARGA C. D. BLOCK - contd.
Sr. Name of village Code . Sr. Code .
No. N PopulatIOn No.
Name of village N PopulatIOn o. o.
(1) (2) (3) (4) (1) (2) (3) (4)
43 Handral 57 600 65 Kasgiwadi 133 ' 692
44 Harali 99 993 66 Kasti Bk. 5 1724
45 Hipparga Sayyad 98 1255 67 Kasti Kh. 7 894
46 Hippargarao 81 1282 68 Katewadi 109 508
47 Holi 25 2033 69 Kawatha 19 3228
48 Jagadalwadi 58 951 70 Kesar Jawalga 129 4277
49 Jakekur 70 2647 71 Khed 13 2173
50 Jakekurwadi 69 1022 72 Kolewadi 50 402
51 Jawalga Bet 45 1316 73 Kolnur Pandar 113 383
52 Jewali 41 8917 74 Koisur Gunjoti 78 691
53 Kadamapur 54 586' 75 Koisur Kalyani 77 766
54 Kaddora 43 1042 76 Kondjigad 27 1178
55 Kader 120 4143 77 Koral 102 2022
56 Kaldeo Nimbala 42 1421 78 Koregaon 63 898
57 Kalnimbala 68 1422 79 Koregaonwadi 64 878
58 Kamalpur 2 585 80 Kothali 128 2713
59 Kanegaon 3 3942 81 Kunhali 55 2373
60 Kantekur 122 1536 82 Lohara Bk. 11 5807
61 Karali 60 1339 83 Lohara Kh. 12 1096
62 Karanjgaon 32 1291 84 Madaj 46 4412
63 Karwanji 103 792 85 Madhaliwadi (Dhagatwadi) 49 505
64 Kasgi 132 2909 86 Mahalingraywadi 115 1106
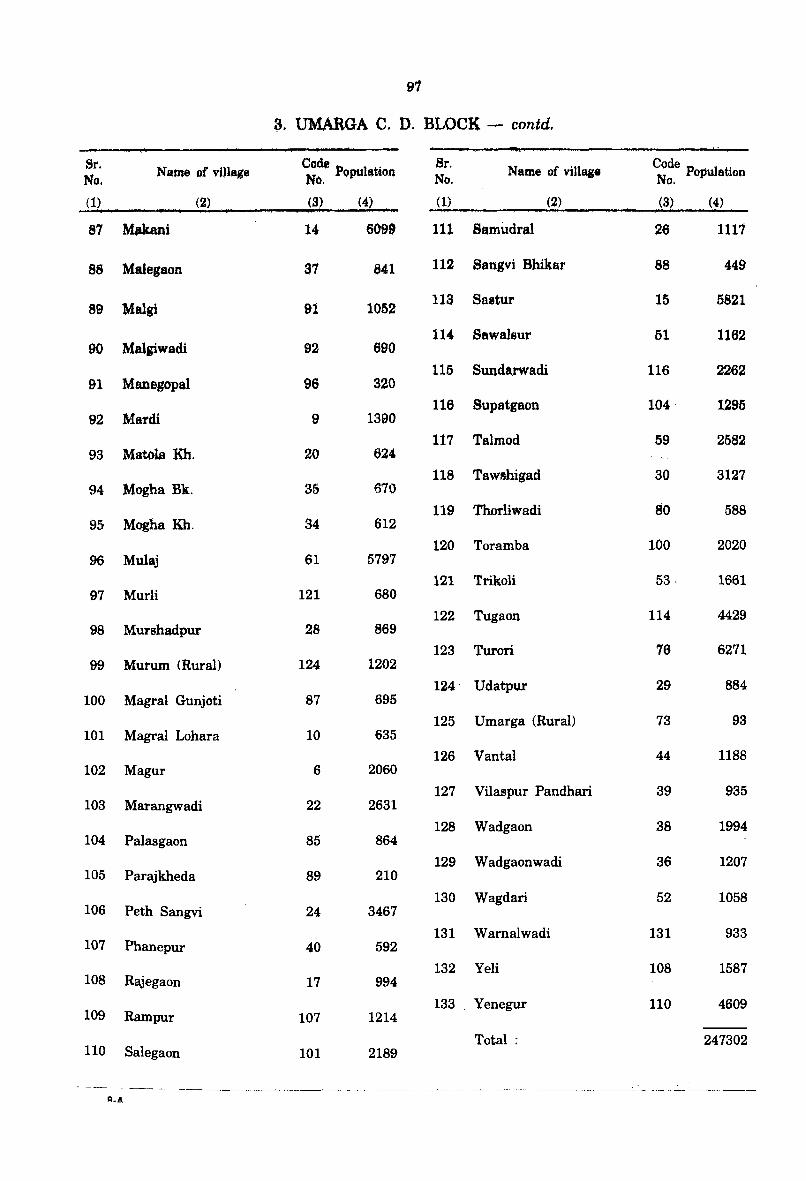
91
3. UMARGA C. D. BLOCK - contd.
Sr. Name flf vjJlage
Code . Sr. No. No. POpul.tlon Name 0{ village Code
No. N Population o.
(1) (2) (3) (4) (1) (2) (3~ (4)
87 Mllkani 14 6099 111 Samudral 26 1111
88 Malegaon 37 841 112 Sangyi Bhikar 88 449
89 Malgi 91 1052 113 Sastur 15 5821
114 Sawa1aur 51 1162 90 Malgiwadi 92 690
115 Sunda,rwadi 116 2262 91 Manegopal 96 320
92 Mardi 9 116 Supatgaon 104 1295
1390 117 Talmod 59 2582
93 Matola KIl. 20 624
94 Mogha Blt. 35 118 Tawshigad 30 3127
670
119 Thorliwadi 80 588 95 Mogha Kh. 34 612
120 Toramba 100 2020 96 Mulaj 61 5797
121 Trikoli 53, 1661 97 Murli 121 680
122 Tugaon 114 4429 98 Murshadpur 28 869
123 Turori 76 6271 99 Murum (Rural) 124 1202
124' Udatpur 29 884 100 Magral Gunjoti 87 695
125 Umarga (Rural) 73 93 101 Magral Lohara 10 635
126 Vantal 44 1188 102 Magur 6 2060
127 Vilaspur Pandhari 39 935 103 Marangwadi 22 2631
128 Wadgaon 38 1994 104 Palasgaon 85 864
129 Wadgaonwadi 36 1207 105 Parajkheda 89 210
106 Peth Sangvi 130 Wagdari 52 1058
24 3467
131 Wamalwadi 131 933 107 Phanepur 40 592
132 Yeli 108 1587 108 Rajegaon 17 994
109 Rampur 107 133 . Yenegur 110 4609
1214
110 Salegaon 101 2189 Total: 247302
A.A
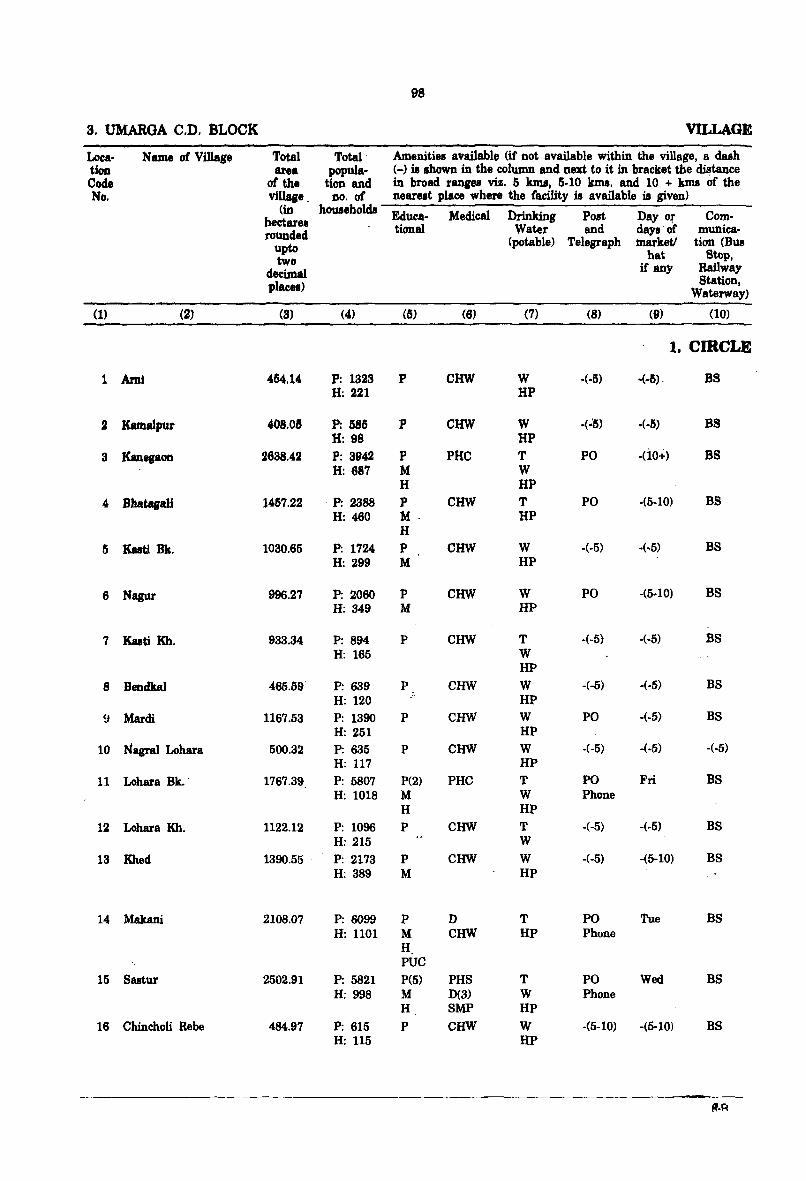
98
3. UMARGA C.D. BLOCK VILLAGE
Loca· Name of Village Total Total- Amenities aVailable (if not available within the village, a dash tion area popula- (-) is shown in the column and next to it in bracket the ~tance Code oC the tion and in broad ranges viz. 5 luns, 5-10 luns. and 10 + kms of the No. village. no. of nearest place where the facility is available is given)
(in houaeholde Educe· Medical Drinlting Po,t Day or Com· hectares founded tional Water and days'of muniea-
upto (potable) Telegraph market! tion (Bua
two hat Stop,
decimal if any Railway
place,) Station, Waterway)
(1) (2) (3) (4) (5) (6) (7) (8) (9) (10)
1. CIRCLE
1 Ami 464.14 P: 1323 P CHW W -(-5) ·(~5) - BS H: 221 HP
2 Kamalpur 408.0& P: 585 P CHW W -(~5) ·(·5) BS H: 98 HP
3 Kanag_on 2688.42 P: 3942 P PHC T PO ·do":) BS H: 687 M W
H HP
4 Bhatagali 1457.22 P: 2388 P CHW T PO -(5·10) BS H: 460 M· HP
H
5 Kuti BIt. 1030.65 P: 1724 P CHW W -(-5) -(·5) BS H: 299 M HP
6 Nagur 996.27 P: 2060 P CHW W PO -(5·10) BS H: 349 M HP
7 Kalti Kh. 933.34 P: 894 P CHW T -(-5) -(-5) BS H: 165 W
HP
8 Bendkal 465.59 P: 639 P CHW W -(-5) -(-5) BS H: 120 HP
9 Mardi 1167.53 P: 1390 P CHW W PO -(-5) BS H: 251 HP
10 Nagral Lohara 500.32 P: 635 P CHW W -(-5) -(-5) -(-5) H: 117 HP
11 Lobara Bk.· 1767.39 P: 5807 P(2) PHC T PO Fri BS H: 1018 M W Phone
H HP
12 Lobara Kh. 1122.12 P: 1096 P CHW T -(-5) -(-5) BS H: 215 W
13 Khed 1390.55 . P: 2173 P CHW W -(-5) -(5-10) BS H: 389 M HP
14 Makani 2108.07 P: 6099 P D T PO Tue BS H: 1101 M CHW HP Phone
H PUC
15 Sutur 2502.91 P: 5821 peS) PHS T PO Wed BS H: 998 M 0(3) W Phone
H SMP HP
16 Chincholi Rebe 484.97 P: 615 P CHW W -(5-10) -(5-10) BS H: 115 HP
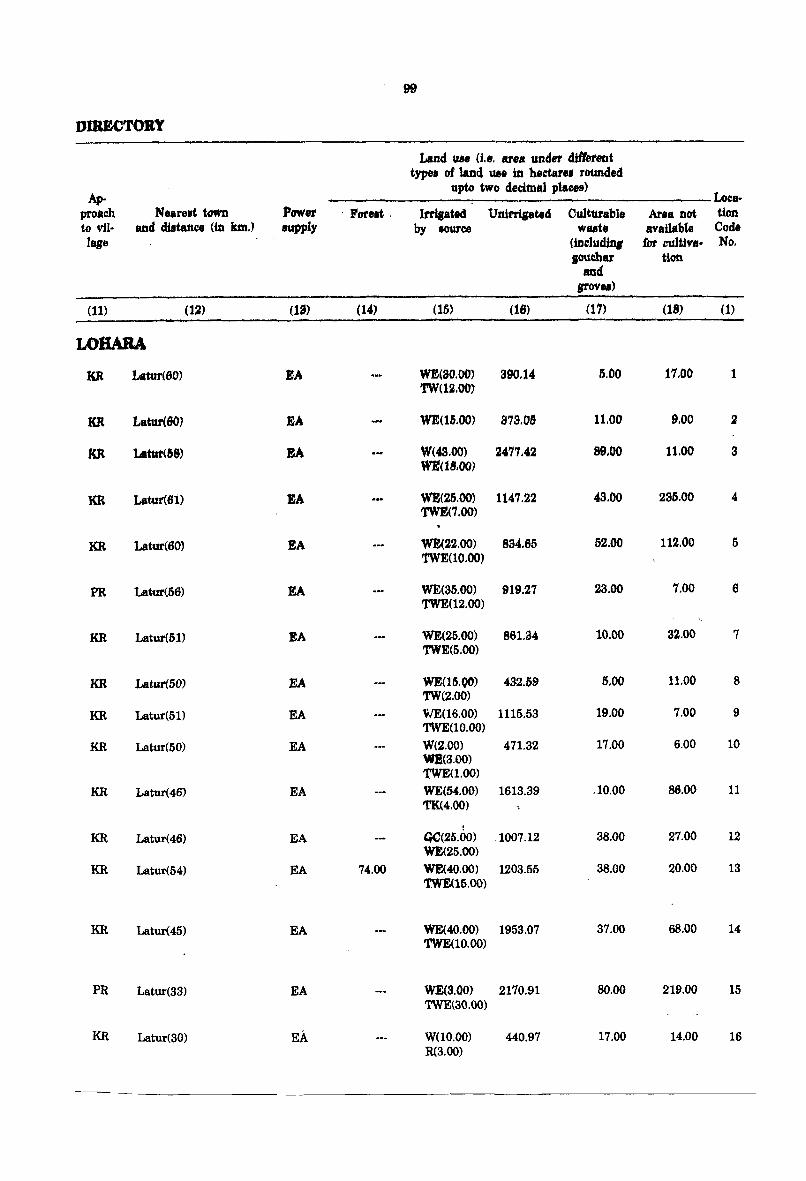
99
DlRECTOBY
Land oae (i.e. atea under diltetent types of land ute in hectare. rounde4
Ap-upto two decimal plaeea)
Loca-proach Nearest tDWn Power . Forllt . Irrigated Unirrigated Culturabl. Area not tion to viI- and dUtance (in km.J eupply by .ouree watt available Code lage (Jncludinl !Dr cu]tiva· No.
souchar tion and
grove,)
(11) (12) (13) (14) (15) (18) (11) (18) (1)
LOHARA
1m Latu1'(60) EA WE(SO.OO) 390.14 5.00 17.00 1 TW(12.00)
1m Latur(80) EA WE(15.oo) 373.08 11.00 9.00 2
KR lAttur(&8) EA W(48.00) 2477.42 89.()() 11.00 3 WE(lB.OO)
1m Latur(8i) EA WE(25.00) 1147.22 43.00 235.00 4 TWE(7.00)
1m Latur(60) EA WE(22.00) 834.65 52.00 112.00 5 TWE(lO.OO)
PR Latur(56) EA WE(35.oo) 919.27 23.00 7.00 6 TWE(12.00)
KR Latur(51) EA WE(25.00) 861.34 10.00 32.00 7 1'WE(5.00)
KR Latur(50) E.A WE(15.QO) 432.59 5.00 11.00 8 TW(2.00)
KR Latur(51) EA WE(16.00) 1115;53 19.00 7.00 9 'lWE(10.00)
KR Latur(50) EA \\'(2.00) 471.32 17.00 6.00 10 W!(3.00) 1'WE(1.00)
KR Latur(46) EA WE(S'.OO) 1613.39 .10.00 86.00 11 TK(4.00)
KR Latur(46) EA QC(25.00) .1007.12 38.00 27.00 12 WE(25.oo)
KR Latur(54) EA 74.00 WE(40.00) 1203.55 38.00 20.00 13 'tWE(16.oo)
KR Latur(45) EA WE(40.oo) 1953.07 37.00 68.00 14 'l'WE(10.oo)
PR Latur(33) EA WE(a.aO) 2170:91 SO.OO 219.00 15 TWE(30.00)
KR Latur(30) EA W(10.OO) 440.97 17.00 14.00 16 R(3.00)
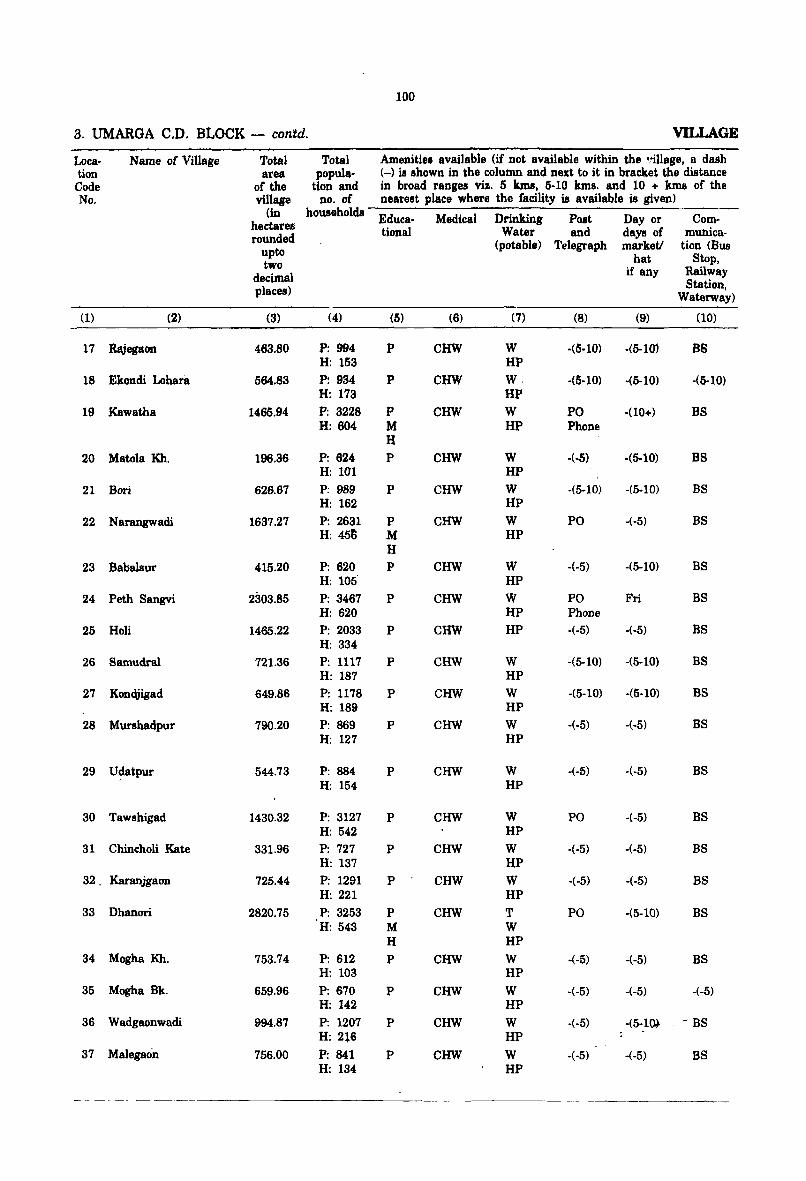
100
3. UMARGA C.D. BLOCK - contd. VILLAGE
Loea· Name of Village Total Total Amenitie. available (if not available within the ·,-i1lage. a dash tion area popula· (-) is shown in the column and next to it in bracket the distance Code of the tion and in broad ranges viz. 5 luna. 5·10 kma. and 10 + kms of the No. village no. of nearest place where the facility is available is given)
(in households Educa· Medical Drinking Post Day or Com· hectares
rounded tiona! Water and days of mUhica-
upto (potable) Telegraph marketl tion (Bus
two hat Stop,
decimal if any Railway
places) Station, Waterway)
(1) (2) (3) (4) (5) (6) (7) (8) (9) (10)
17 Rajegaon 463.80 P: 994 P CHW W ·(5·10) ·(5·10) BS H: 153 HP
18 Ekondi Lohara 564.83 P: 934 P CHW W, ·(5-10) ·(5·10) ·(5·10) H: 173 HP
19 Kawatha 1460.94 P: 3228 P CHW W PO ·(10+) BS H: 604 M HP Phone
H
20 Matola Kh. 196.36 P: 624 P CHW W ·(·5) ·(5-10) BS H: 101 HP
21 Bori 626.67 P: 989 P CHW W ·(5·10) ·(5·10) BS H: 162 Hp
22 Narangwadi 1637.27 P: 2631 P CHW W PO ·(·5) BS H: 458 .M HP
H
23 BabaIsur 415.20 P: 620 P CHW W ·(·5) ·(5·10) BS H: 105 HP
24 Peth Sangvi 2303.85 P: 3467 P CHW W PO Fri BS H: 620 HP Phone
25 Holi 1465.22 P: 2033 P CHW HP ·(·5) ·(·5) BS H: 334
26 Samudral 721.36 P: 1117 P CHW W ·(5·10) ·(5·10) BS H: 187 HP
27 Kontljigad 649.86 P: 1178 P CHW W -(5·10) ·(5·10) BS H: 189 HP
28 Murshadpur 790.20 P: 869 P CHW W ·(-5) ·(·5) BS H: 127 HP
29 U?atpur 544.73 P: 884 P CHW W ·(·5) -(-5) BS H: 154 HP
30 Tawshigad 1430.32 P: 3127 P CHW W PO ·(-5) BS H: 542 HP
31 Chincholi Kate 331.96 P: 727 P CHW W ·(·5) -(·5) BS H: 137 HP
32. Karanjgaon 725.44 P: 1291 P CHW W -(-5) ·(-5) BS H: 221 HP
33 Dhanori 2820.75 P: 3253 P CHW T PO ·(5·10) BS H: 543 M W
H HP 34 Mogha Kh. 753.74 P: 612 P CHW W ·(-5) ·(-5) BS
H: 103 HP
35 Mogha Bk. 659.96 P: 670 P CHW W ·(·5) -(·5) ·(-5) H: 142 HP
36 Wadgaonwadi 994.87 P: 1207 P CHW W ·(·5) ·(5·10) . - BS H: 216 HP
37 Malegaon 756.00 P: 841 P CHW W ·(-5) ·(-5) BS H: 134 HP
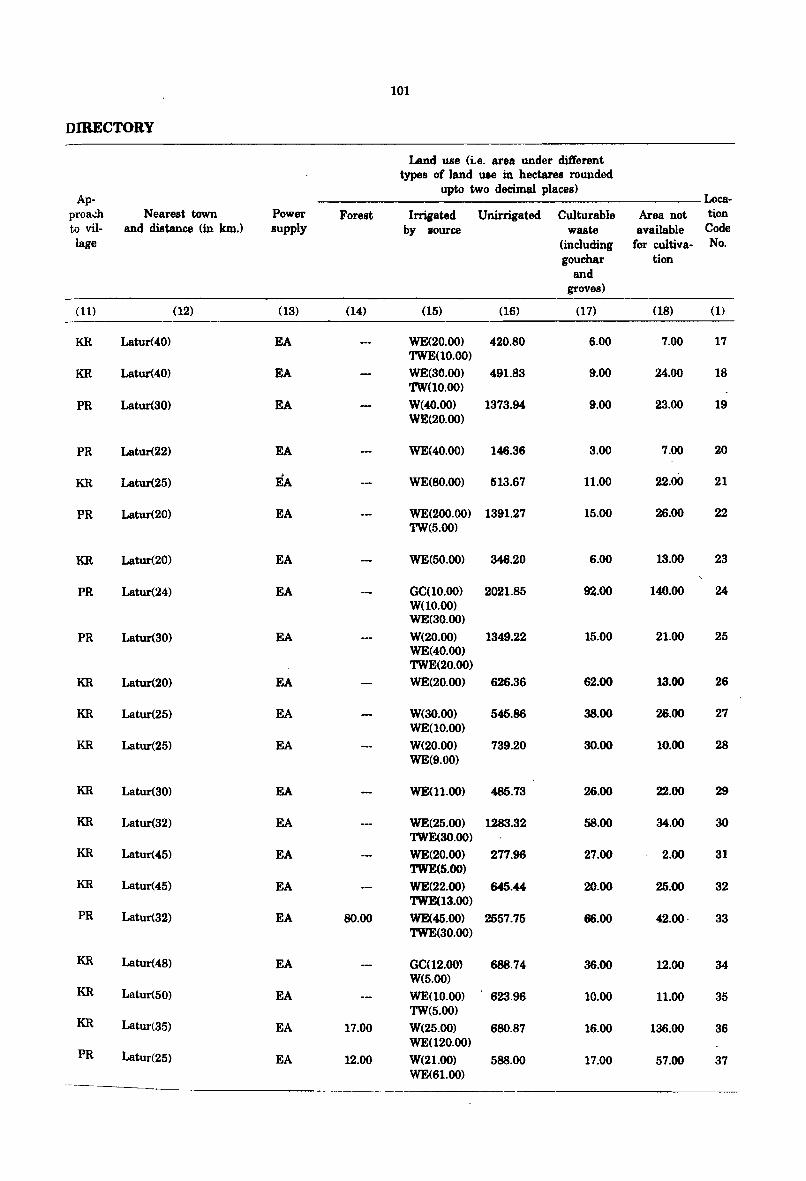
101
DIRECTORY
Land use (i.e. area under different types of land use in hectares rounded
Ap-upto two decimal places)
Loca-proa..:h Nearest town Power Forest Irrigated Unirrigated Culturable Area not tion to viI- and distance (in km.) supply by source waste available Code lage (including for cultiva- No.
gouchar tion and
groves)
(11) (12) (13) (14) (15) (16) (17) (18) (1)
KR Latur(40) EA WE(20.00) 420.80 6.00 7.00 17 TWE(10.00)
KR Latur(40) EA WE(30.00) 491.83 9.00 24.00 18 TW(10.oo)
PR Latur(30) EA W(40.OO) 1373.94 9.00 23.00 19 WE(20.oo)
PR Latur(22) EA WE(40.oo) 146.36 3.00 7.00 20
KR Latur(25) EA WE{SO.OO) 513.67 11.00 22.00 21
PR Latur(20) EA WE(200.00) 1391.27 15.00 26.00 22 TW(5.00)
KR Latur(20) EA WE(50.00) 346.20 6.00 13.00 23
PR Latur(24) EA GC(10.oo) 2021.85 92.00 140.00 24 W(10.OO) WE(30.oo)
PR Latur(30) EA W(20.OO) 1349.22 15.00 21.00 25 WE(40.00) TWE(20.oo)
KR Latur(20) EA WE(20.oo) 626.36 62.00 13.00 26
KR Latur(25) EA W(30.OO) 545.86 38.00 26.00 27 WE(10.oo)
KR Latur(25) EA W(20.00) 739.20 30.00 10.00 28 WE(9.00)
KR Latur(30) EA WE(11.()()) 485.73 26.00 22.00 29
KR Latur(32) EA WE(25.oo) 1283.32 58.00 34.00 30 TWE(30.oo)
KR Latur(45) EA WE(20.oo) 277.96 27.00 2.00 31 TWE(5.00)
KR Latur(45) EA WE(22.00) 645.44 20.00 25.00 32 TWE(13.oo)
PR Latur(32) EA 80.00 WE(45.oo) 2557.75 66.00 42.00· 33 TWE(30.oo)
KR Latur(48) EA GC(12.00) 688.74 36.00 12.00 34 W(5.oo)
KR Latur(50) EA WE(10.oo) 623.96 10.00 11.00 35 TW(5.00)
KR Latur(35) EA 17.00 W(25.OO) 680.87 16.00 136.00 36 WE(120.00)
PR Latur(25) EA 12.00 W(21.00) 588.00 17.00 57.00 37 WE(61.00)
----__
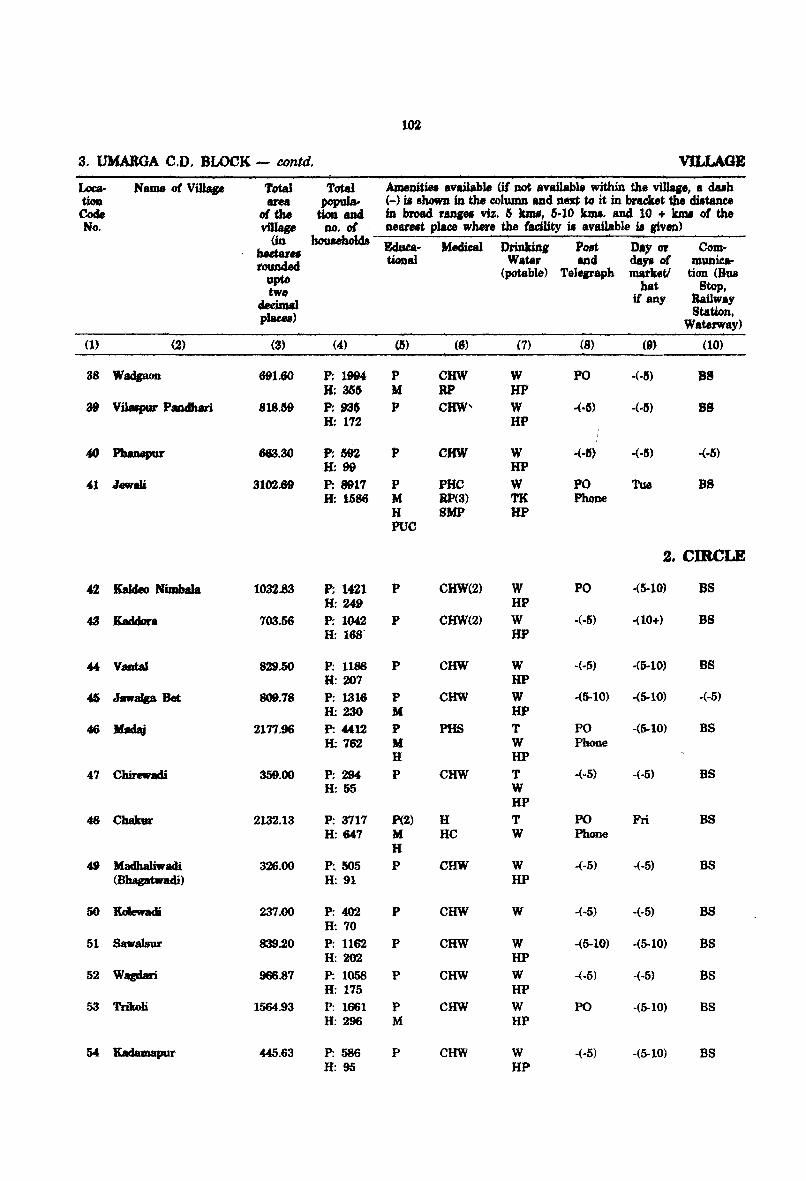
102
3. UMARGA C.D, BLOCK - C()ntd, VILLAGE
Loc:a. NaJQ 0{ ViUap Total Total AJnezritiN available (if not availablt within the villaa'e, a duh tioD area popuJa. (-) if shown in the column and nest to it in bracket the diJtance Code o{tIM tioll aud in broad faDPI viz. 5 kmf, 6-10 kmt. and 10 + kmt of the No. village no. 0{ Deat .. t place where the iadlity it available ia given)
(in houMhol4s Eduu- Medical Drinkir1a' p".t Dt, or Com-bedar .. toundAtd tiona! Water and ciay, 0{ munica·
upto (potable) Teltjraph marketl tion (aua
two hat Stop, Ueimal if any Railway
pJaca) Station, Waterway)
(1) (2) (3) (4) (6) (6) (7) (8) (9) (10)
38 Wadgaon 691.60 P; 1994- P CHW W PO ·(·5) as H; 366 M RP HP
39 Vilatpur Paodbari 818.S9 P; 936 P CHW" W ,(·6) ·(·5) B8 H; 172 HP
40 PbeDepur 663.30 P; 592 P CHW W .(.5) .(·6) .(·5)
H: 99 HP
41 Jewali 3102.69 P; 8917 P PRe W PO rue BS H: 1586 M RP(3) 'l'K Phone
H SMP HP PUC
2. CIRCLE
42 KaJdeo Nimbtia 1032.83 P; 1421 P CHW(2) W PO ·(5-10) SS H: 249 HP
43 Kaddora 703.56 P: 1042 P CHW(2) W ·(·5) ·(10+) DS H: 168" HP
'" Vantal 829.50 P; 1188 P CHW W -(-5) ·(5-10) BS H: 'JJ)7 HP
46 JawaJga Bet 809.18 P; 1316 P CHW W ,(5·10) ,(5-10) -(-5)
H: 230 M HP
46 MaLV 2177.96 P: 4412 P PHS T PO -(5-10) BS H: 162 'M W Phone
H HP
47 Chirewadi 359.00 P; 294 P CHW T -(·5) -(·5) BS H: 55 W
HP 48 CbaItur 2132.13 P: 3717 P(2) H T PO Fri BS
H: 647 M HC W Phone H
49 Madbaliwadi 326.00 P~ 505 P CHW W .(-5) ·(·5) BS (Bbagatwacli) H: 91 HP
50 Ko1ewadi 237.00 P: 402 P CHW W -(·5) -(-5) BS H: 70
51 Sawalsur 839.20 P: 1162 P CHW W -(5-10) -(5-10) BS H: 202 HP
52 Wagdari 966.87 P: 1058 P CHW W -(-5) -(-5) BS H: 175 HP
53 'I'riJwIi 1564.93 P: 1661 P CHW W PO -(5-10) BS H: 296 M HP
54 Kadamapur «5.63 P: 586 P CHW W -(-5) -(5-10) BS H: 95 HP
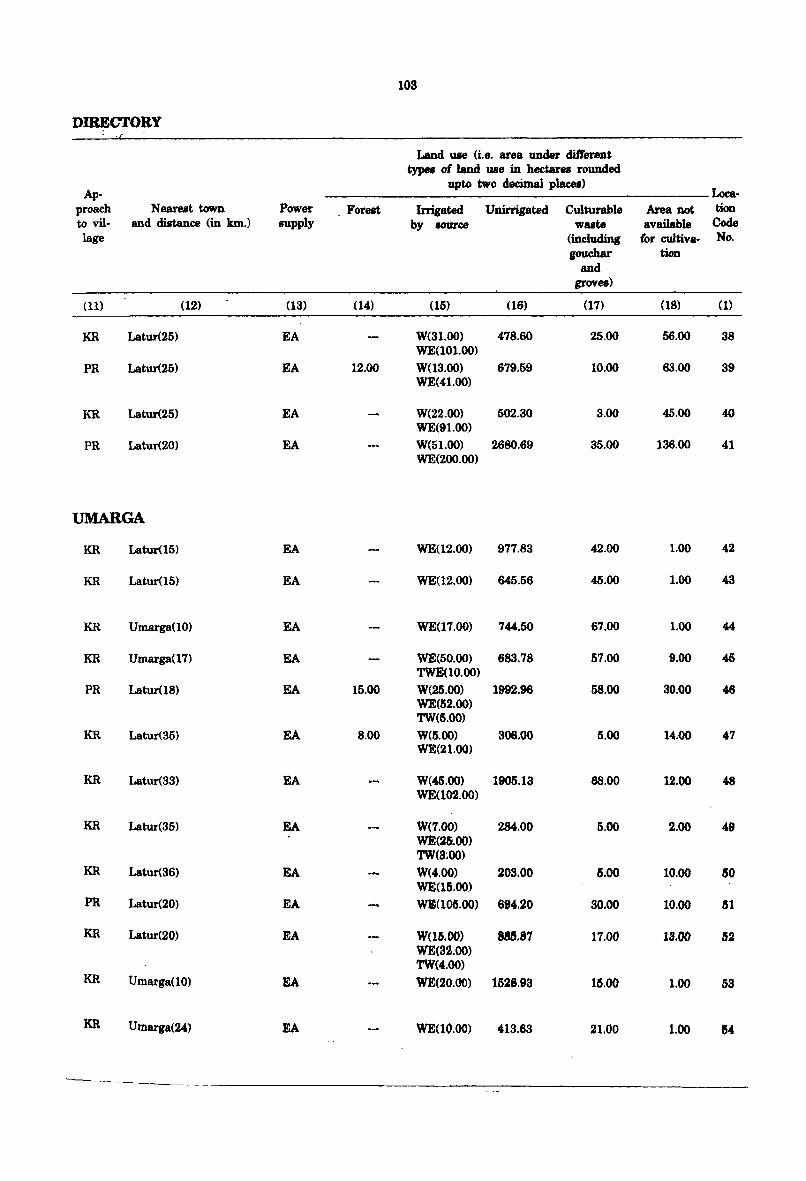
103
DIRECTORY
Land 118e (i.e. area under different typea of land 1188 in hectar. rounded
Ap-upto two decimal places)
Loca-proach Near.t town Power Forest Irrigated Uninigated Culturable Area not tioo to vil- and distance (in km.) supply by IOUrce wute available Code lage (including for cultiva- No.
gouchar tion and
grov.)
(11) (12) (13) (14) (15) (16) (17) (18) (1)
KR Latur(25) EA W(31.00) 478.60 25.00 56.00 38 WE(101.00)
PR Latur(25) EA 12.00 W(l3.00) 679.59 10.00 68.00 39 WE(41.00)
KR Latur(25) EA W(22.00) 502.30 3.00 45.00 40 WE(91.00)
PR Latur(20) EA W(Sl.00) 2680.69 3S.00 136.00 41 WE(200.00)
UMARGA
KR Latur(IS) EA WE(12.00) 977.83 42.00 1.00 42
KR Latur(15) EA WE(12.00) 645.56 45.00 1.00 43
KR Umarga(10) EA WE(17.00) 744.50 67.00 1.00 44
KR Umarga(17) EA WE(50.00) 683.78 57.00 9.00 45 TWE(lO.OO)
PR Latur(18) EA 15.00 W(25.00) 1992.96 58.00 30.00 46 WE(52.00) TW(5.00)
KR Latur(36) EA 8.00 W(5.00) 306.00 5.00 14.00 47 WE(21.00)
KR Latur(33) EA W(45.00) 1905.13 68.00 12.00 48 WE(I02.00)
KR Latur(35) EA W(7.00) 284.00 5.00 2.00 49 WE(26.00) TW(3;OO)
KR Latur(36) EA W(4.00) 203.00 6.00 10.00 50 WE(l';'OO)
PR Latur(20) EA WE(1015.00) 694.20 30.00 10.00 51
KR Latur(20) EA W(l!.OO) 888.87 17.00 18.00 52 WE(32.00) TW(4.00)
KR Umarga(10) EA WE(20.00) 1528.93 15.00 1.00 53
KR Umarga(24) EA WEUO.OO) 413.63 21.00 1.00 &4
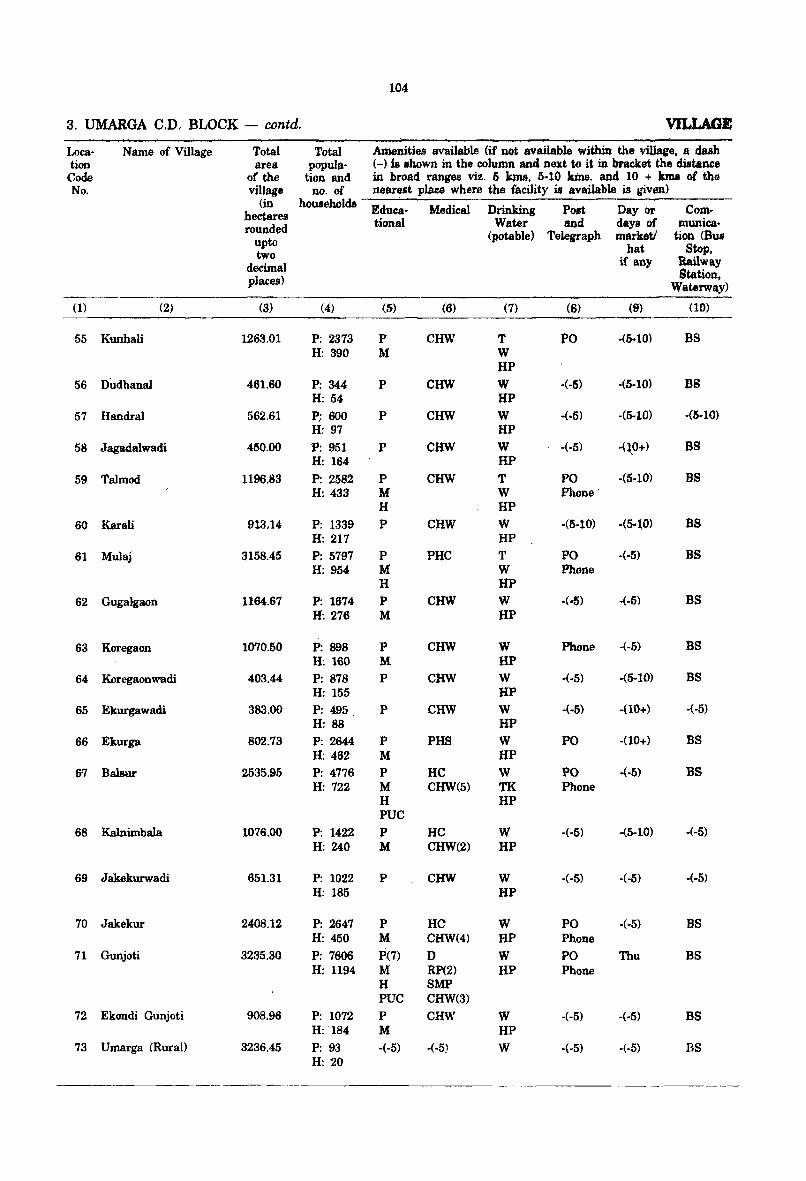
lO4
3. UMARGA C.D. BLOCK - contd. VlLLAGB
Loca- Name of Village Total Total Amenities available (if not available within the village, a dash tion area populjl- (-) is .hown in the column and next to it in bracket the distance
Code of the tion and in broad ranges viz. 6 kms, 5·10 kins. and 10 + kma of the No. village no. of nearest place wher.e the facility is available is given)
(in households Eduea· Medical Drinking Po.t Day or Com-hectares rounded tional Water and days of mumca·
upto (potable) Telerraph marketl tion (Bus
two hat Stop,
decimal if any Railway
places) Station, Waterway)
(1) (2) (3) (4) (5) (6) (7) (8) (9) (10)
55 Kunhali 1263.01 P; 2373 P CHW T PO .(5-10) BS H: 390 M W
HP
56 Dudhanal 461.60 P: 344 P CHW W -(-5) -(5-10) DB H: 54 HP
57 Handral 562.61 P; 600 P CHW W ·(·5) -(5-10) ·(5·10) H: 97 HP
58 Jagadalwadi 450,00 P: 951 P CHW W ·(·5) .qO+) BS H: 164 HP
59 TaImod 1196.83 P: 2582 P caw T PO ·(5·10) BS H: 433 M W Phone'
H HP
60 Karali 913.14 P: 1339 P CHW W ·(5·10) -(5-10) BS H: 217 HP
61 Mulaj 3158.45 P; 5797 P PHC T PO ·(·5) BS H; 954- M W Phone
H HP
62 Gugalgaon 1164.67 P: 1674 P CHW W ·(·5) .(.5) BS H: 276 M HP
63 Koregaon 1070.50 P: 898 P CHW W Phone -(·5) BS H: 160 M HP
64 Koregaonwadi 403.44 P: 878 P CHW W -(·5) .(5-10) BS H: 155 HP
65 Ekurgawadi 383.00 P: 495 P CHW W .(.5) .(10+) -(-5)
H; 88 HP
66 Ekurga 802.73 P: 2644 P PHS W PO -(10+) BS H: 462 M HP
&7 Balsur 2535.95 P: 4776 P HC W PO ,(·5) BS H: 722 M CHW(5) TK Phone
H HP PUC
68 Kalnimbala 1076.00 P: 1422 P HC W -(-5) ·(5-10) -(·5) H: 240 M CHW(2) HP
69 Jakekurwadi 651.31 P: 1022 P CHW W -(·5) -(·5) ·(·5) H: 185 HP
70 Jakekur 2408.12 P: 2647 P HC W PO -(-5) BS H: 450 M CHW(4) HP Phone
71 Gunjoti 3235.30 P: 7606 P(7) D W PO Thu BS H: 1194 M RP(2) HP Phone
H SMP PUC CHW(3)
72 Ekondi Gunjoti 908.96 P: 1072 P caw W -(-5) -(·5) BS H: 184 M HP
73 Umarga (Rural) 3236.45 P: 93 -(-5) -(-5) W -(-5) -(-5) BS H: 20
---
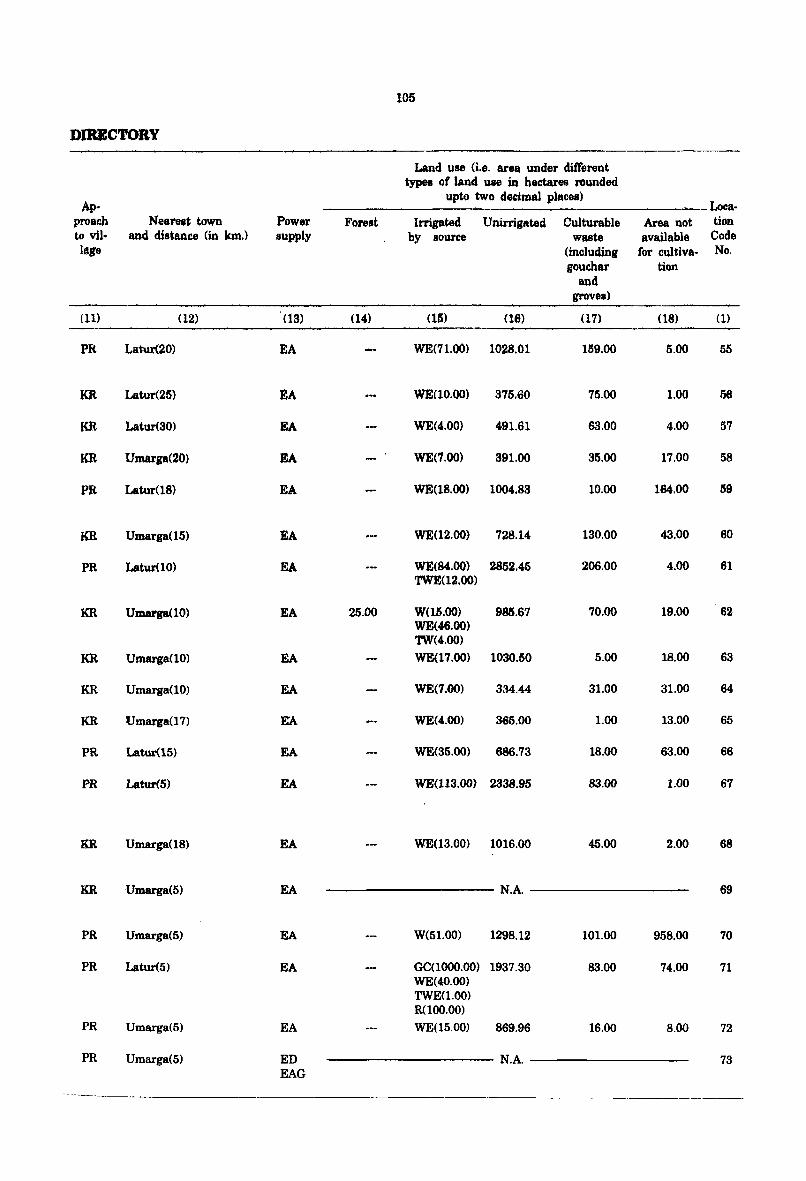
105
DIRECTORY
Land use (i.e. area under diff'erent types Qf land UIIe in hectares rounded
).p-upto two decimal places)
1ooa-preach Neare.t town Power Forest Irrigated Uninigated Culturable Area not tion to viI- and distance (in km.) supply by source waste available Code la,e (including for cultiva- No.
gouchar tion and
grovel)
(11) (12) (13) (14) (115) (16) (17) (18) (1)
PR Latur(20) EA WE(71.00> 1028.01 159.00 5.00 55
KR Latur(25) EA WE(lO.oo) 375.60 75.00 1.00 56
KR Latur(30) EA WE(4.00) 491.61 63.00 4.00 57
KR Umarga(20) EA WE(7.oo) 391.00 35.00 17.00 58
PR Latur(18) EA WE(18.00) 1004.83 10.00 184.00 59
1m Umarga(15) EA WE(12.oo) 728.14 130.00 43.00 80
PR Latur(10) EA WE(84.00) 2852.45 206.00 4.00 61 TWE(12.oo)
1m Umarga(lO) EA 25.00 W(1.5.OO) 985.67 70.00 19.00 62 WE(<&6.00) 'lW(4.oo)
KR Umarga(10) EA WE< 17.00) 1030.50 5.00 18.00 63
KR Umarga(10) EA WE(7.00) 334.44 31.00 31.00 64
KR Umarga(17) E'A WE(4.00) 365.00 1.00 13.00 65
PR Latur(15) EA WE(35.oo) 686.73 18.00 63.00 66
PR Latur(5) EA WE(113.oo) 2338.95 83.00 1.00 67
KR Umarga(18) EA WE(13.oo) 1016.00 45.00 2.00 68
KR Umarga(5) EA N.A. 69
PR Umarga(5) EA W{51.00) 1298.12 101.00 958.00 70
PR Latur(5) EA GC{1000.oo) 1937.30 83.00 74.00 71 WE{40.00) TWE(1.00) R(100.00)
PR Umarga(5) EA WE{15.00) 869.96 16.00 8.00 72
PR Umarga(5) ED N.A. 73 EAG
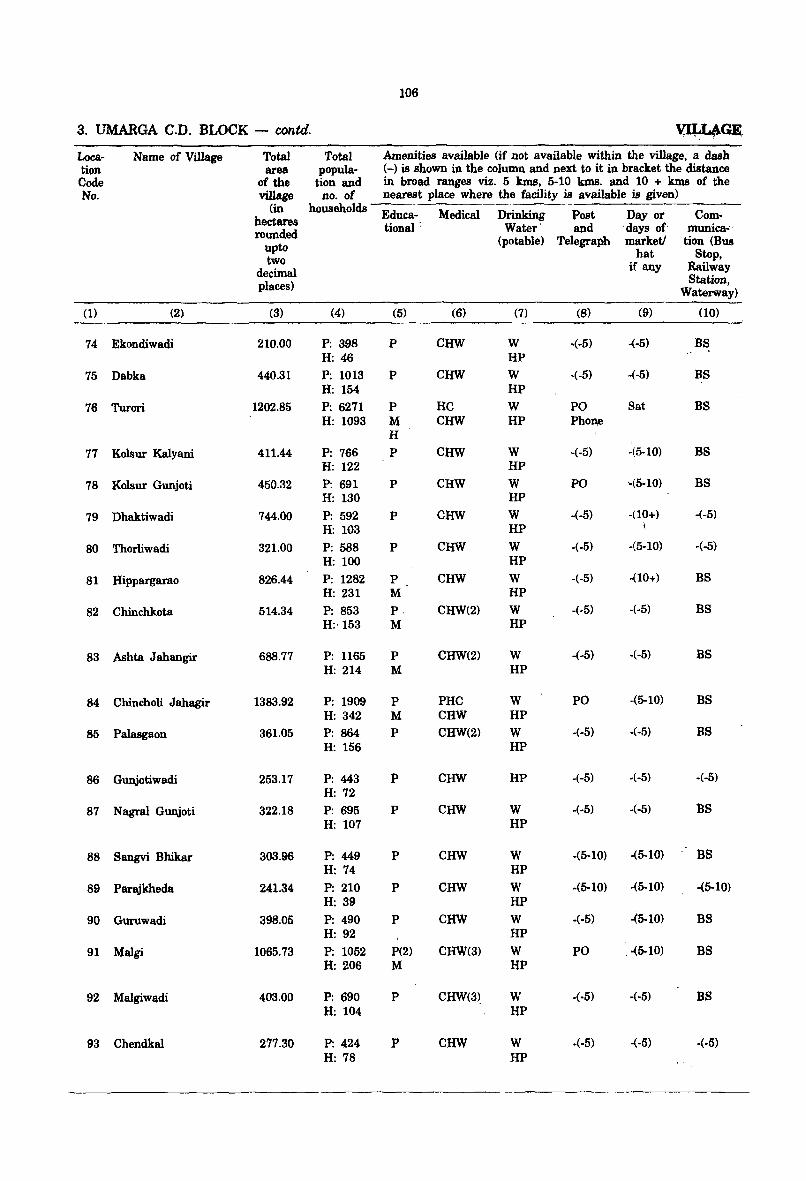
106
3. UMARGA C.D. BLOCK - contd. ~GE..
Loca- Name of Village Total Total Amenities available (if not available within the village, a dash tion area popula- (-) is shown in the column and next to it in bracket the distance Code of the tion and in broad ranges viz. 5 kms, 5-10 kms. and 10 + kms of the No. village no. of nearest place where the facility is available is given)
(in households Educa- Medical Drinking Post Day or Com-hectares rounded
tional: Water· and ·days of munica..;·
upto (potable) Telegraph market! tion (Bus
two hat Stop,
decimal if any Railway
places) Station, Waterway)
(1) (2) (3) (4) (5) (6) (7) (8) (9) (10)
74 Ekondiwadi 210.00 P: 398 P caw W ·(·5) -(-5) B~ H: 46 HP
75 Dabka 440.31 P: 1013 P caw W ·(·5) -(-5) BS H: 154 HP
76 Turori 1202.85 P: 6271 P HC W PO Sat BS H: 1093 M CHW HP Phon,e
H
77 Kolsur Kalyani 411.44 P: 766 P CHW W -(-5) -(5-10) BS H: 122 HP
78 Kolsur Gunjoti 450.32 P: 691 P CHW W PO -.(5-10) BS H: 130 HP
79 Dhaktiwadi 744.00 P: 592 P CHW W -(-5) -(10+) -(-5) H: 103 HP \
80 Thorliwadi 321.00 P: 588 P CHW W -(-5) -(5-10) ·(-5) H: 100 HP
81 Hippargarao 826.44 P: 1282 P CHW W ·(-5) ·(10+) BS H: 231 M HP
82 Chinchkota 514.34 P: 853 P CHW(2) W -(-5) -(-5) BS H:'153 M HP
83 Ashta Jahangir 688.77 P: 1165 P CHW(2) W -(-5) -(·5) BS H: 214 M HP
84 Chincholi Jahagir 1383.92 P: 1909 P PHC W PO ·(5-10) BS H: 342 M CHW HP
85 Palasgaon 361.05 P: 864 P CHW(2) W .(·5) ·(-5) BS H: 156 HP
86 Gunjotiwadi 253.17 P: 443 P CHW HP .(·5) -(·5) ·(·5) H: 72
87 N agral Gunjoti 322.18 P: 695 P CHW W ·(·5) -(-5) :as H: 107 HP
88 Sangvi Bhikar 303.96 P: 449 P CHW W -(5-10) -(5-10) BS H: 74 HP
89 Parajkheda 241.34 P: 210 P CHW W ·(5·10) ·(5·10) -(5-10) H: 39 HP
90 Guruwadi 398.05 P: 490 P CHW W -(·5) -(5·10) BS H: 92 HP
91 Malgi 1065.73 P: 1052 P(2) CHW(3) W PO .• (5·10) BS H: 206 M HP
92 Malgiwadi 403.00 P: 690 P CHW(3). W .(·5) ·(·5) BS H: 104 HP
93 Chendkal 277.30 P: 424 P CHW W .(-5) ·(-5) ·(·5)
H: 78 HP
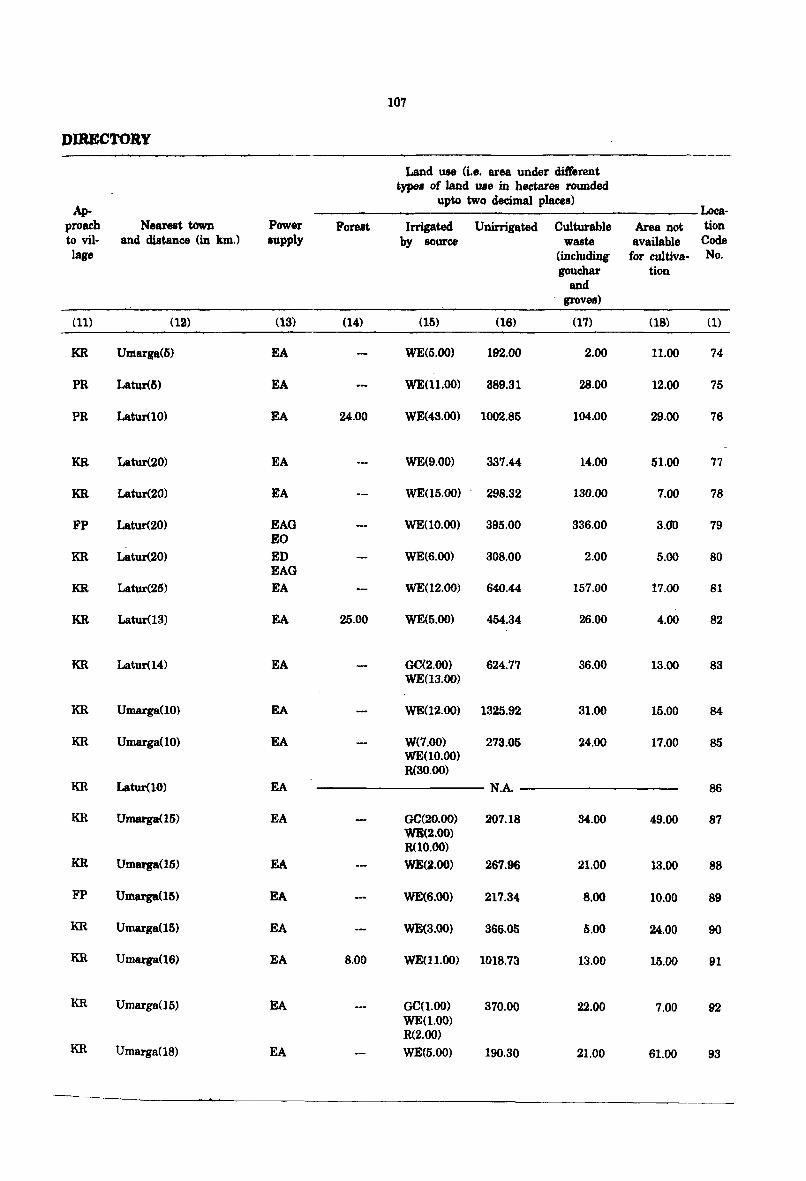
107
DIRECTORY
Land ute (i.e. area under different type. of land uae in hectares rounded
Ap-upto two decimal places)
Loca· proaeh Nearest town Power Forest Irrigated Unirrigated Culturable Area not tion to viI- and distance (in km.) supply by source waste available Code lage (including for cultiva- No.
gouchar tion and
- groves)
(11) (12) (13) (14) (15) (16) (17) (18) (l)
KR Umarga(S) EA WE(5.oo) 192.00 2.00 11.00 74
PR Latur(ll) EA WE(ll.OO) 389.31 28.00 12.00 75
PR Latur(10) EA 24.00 WE<43.00) 1002.85 104.00 29.00 76
KR Latur(20) EA WE(9.00) 337.44 14.00 51.00 77
KR Latur(20) EA WE(l5.00) 298.32 130.00 7.00 78
FP Latur(20) EAG WE(10.oo) 395.00 336.00 3.00 79 EO
KR Latur(20) ED WE(6.oo) 308.00 2.00 5.00 80 EAG
KR Latur(25) EA WE(12.oo) 640.44 157.00 17.00 81
KR Latur(13) EA 25.00 WE<5.oo) 454.34 26.00 4.00 82
KR Latur(14) EA OC(2.00) 624.77 36.00 13.00 83 WE(lS.00)
KR Umarga(10) EA WE(12.00) 1325.92 31.00 15.00 84
KR Umarga(10) EA W(7.OO) 273.05 24.00 17.00 85 WE(lO.OO) Re30.00)
KR Latur(10) EA N.A 86
KR Umarga(15) EA OC(20.00) 207.18 34.00 49.00 87 WE(2.00) ReIO.OO)
KR Umarga(15) EA WE(2.00) 267.96 21.00 13.00 88
FP Umarga(15) EA WE(6.00) 217.34 8.00 10.00 89
KR Umarga(15) EA WE(3.00) 366.05 5.00 24.00 90
KR Umarga(16) EA 8.00 WE(ll.OO) 1018.73 13.00 15.00 91
KR Umarga(15) EA 00(1.00) 370.00 22.00 7.00 92 WE(1.00) R(2.oo)
KR Umarga(18) EA WE(5.00) 190.30 21.00 61.00 93
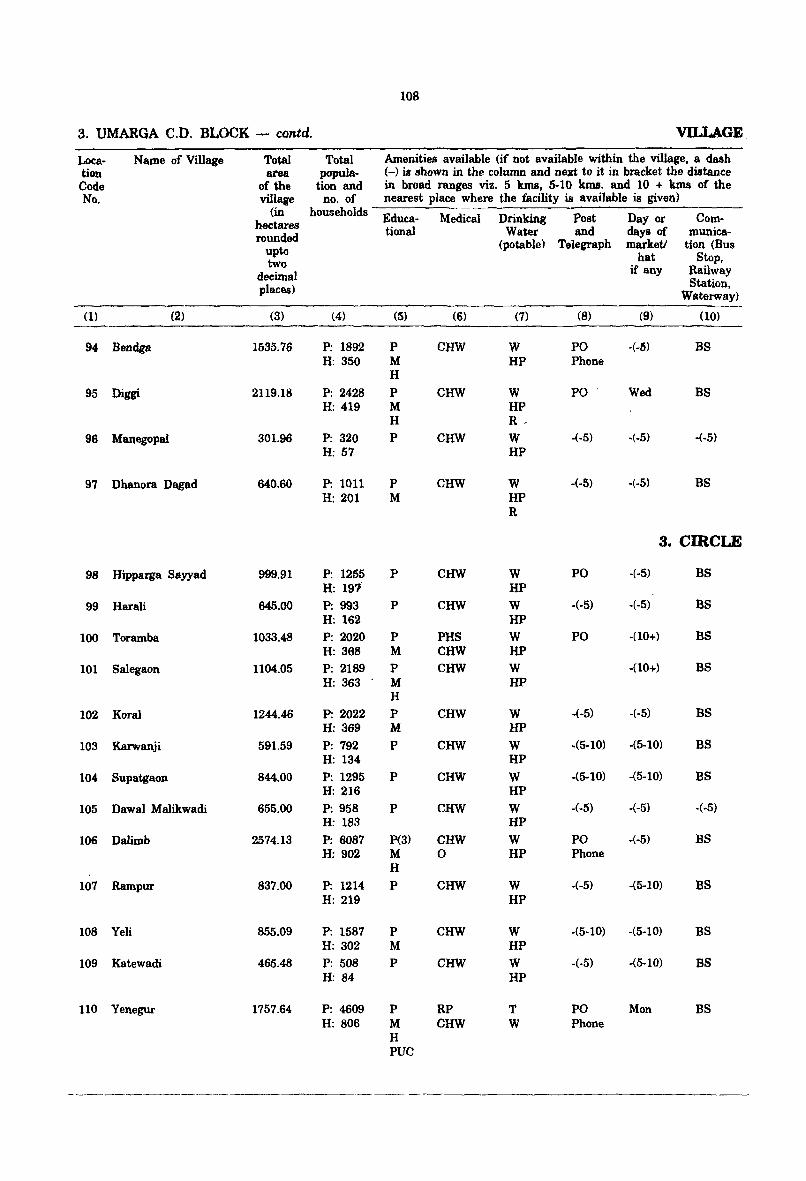
108
3. UMARGA C.D. BLOCK - contd. VILLAGE.
Lota- Name of Village Total Total Amenities available (if not available within the village, a dash lion area popula- (-) is shown in the colwnn and next to it in bracket the distance Code of the tion and in broad ranges viz. 5 kms, 5-10 kms. and 10 + kIDs of the No. village no. of nearest place where the facility is available is given)
(in households Educa- Medical Drinking Post Day or Com-hectares rounded tional Water and days of munica-
upto (potable) Telegraph marketl tion (Bus
two hat Stop,
decimal if any Railway
places) Station, Waterway)
(l) (2) (3) (4) (5) (6) (7) (8) (9) (10)
94 Bendga 1535.76 P; 1892 P CHW W PO -(-5) BS H: 350 M HP Phone
H
95 Diggi 2119.18 P: 2428 P CHW W PO Wed BS H: 419 M HP
H R. 96 Manegopal 301.96 P: 320 P CHW W -(-5) -(-5) -(-5)
H: 57 HP
97 Dhanora Dagad 640.60 P: 1011 P CHW W -(-5) -(-5) BS H: 201 M HP
R
3. CIRCLE
98 Hipparga Sayyad 999.91 P: 1255 P CHW W PO -(-5) BS H: 197 HP
99 Harali 645.00 P: 993 P CHW W -(-5) -(-5) BS H: 162 HP
100 Toramba 1033.48 P: 2020 P PHS W PO -(10+) BS H: 368 M CHW HP
101 Salegaon 1104.05 P: 2189 P CHW W -(10+) BS H: 363 M HP
H
102 Koral 1244.46 P: 2022 P CHW W -(-5) -(-5) BS H: 369 M HP
103 Karwanji 591.59 P: 792 P CHW W .(5·10) -(5-10) BS H: 134 HP
104 Supatgaon 844.00 P: 1295 P CHW W .(5-10) -(5-10) BS H: 216 HP
105 Dawal Malikwadi 655.00 P: 958 P CHW W -(-5) -(-5) +5) H: 183 HP
106 Dalimb 2574.13 P: 6087 P(3) CHW W PO -(-5) BS H: 902 M 0 HP Phone
H
107 Rampur 837.00 P: 1214 P CHW W -(-5) -(5-10) BS H: 219 HP
108 Yeli 855.09 P: 1587 P CHW W -(5-10) -(5-10) BS H: 302 M HP
109 Katewadi 465.48 P: 508 P CHW W -(·5) -(5-10) BS H: 84 HP
110 Yenegur 1757.64 P: 4609 P RP T PO Mon BS H: 806 M CHW W Phone
H PUC
---~~-------

109
DIRECTORY
Land use (i.e. area under diffilrent types of land use in hectares rounded
Ap-upto two decimal places)
Loca-proach Nearest town Power Forest Irrigated Unirrlgated Culturable Area not tion to vil- and dist.ance (in km.) supply by source waste available Code Iage (including for cultiva- No.
gouchar tion and
groves)
(11) (12) (13) (14) (15) (16) (17) (18) (1)
KR Latur(l5). EA W(15.0Q) 1392.76 19.00 9f.00 94 WE(5.00) R(10.oo)
KR Latur(20) EA W(5.00) 2017.18 10.00 82.00 95 WE(5.oo)
FP Umarga(20) EA WE(2.oo) 258.96 6.00 35.00 96
KR Latur(20) EA TWE(10.oo) 583.60 17.00 30.00 97
MURUM
KR Latur(40) EA WE(12.oo} 954.91 26.00 7.00 98
, KR Latur(35) EA WE(lO.OO) 598.00 8.00 29.00 99
KR Latur(35} EA WE(l5.oo) 980.48 31.00 7.00 100
KR Latur(30) EA 1.00 WE(20.00) 1030.05 9.00 44.00 101
KR Latur(10) EA WE(9.00) 1202.46 2.00 31.00 102
KR Latur(35) EA WE(10.00) 552.59 11.00 18.00 103
KR Latur(20) EA WE(12.00) 816.00 9.00 7.00 104
KR Murum(16) EA WE(l4.oo) 626.00 9.00 6.00 105
PR Latur(l2) EA WE(l02.oo) 2393.13 5.00 74.00 106
KR Umarga(lO) EA WE(31.00) 764.00 2.00 40.00 107
PR Latur(10) EA WE (1 10.00) 708.09 12.00 25.00 108
KR Murum(10) --EA WE(50.00) 410.48 4.00 1.00 109
PR Latur(16) EA WE(18.00) 1668.64 44.00 27.00 110
- ~-----------.------
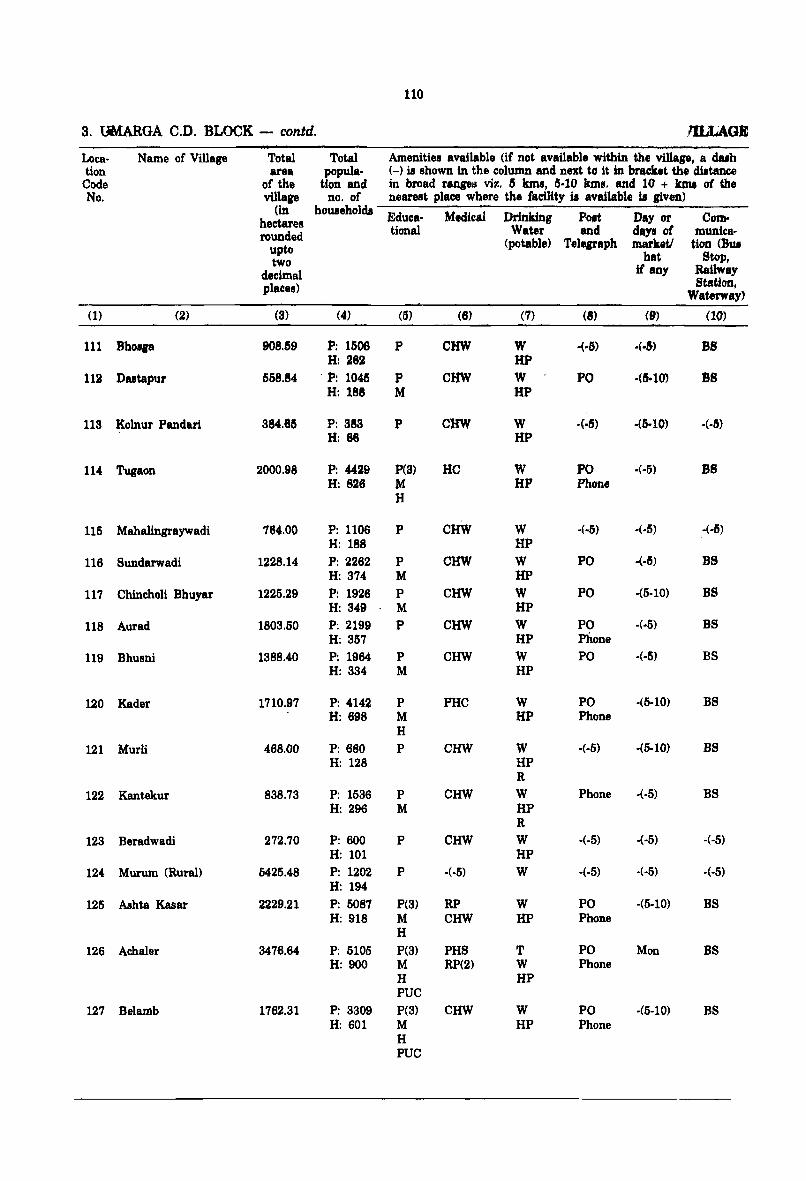
110
3. UMARGA C.D. BLOCK - contd. /lLLAGE
Loca- Name of Village Total Total Amenitiea available (if not available within the village, a duh tion area popula- (-) is shown in the column and next to it in bracket the dittance
Code of the tion and in broad ranges viz. 15 luna, 5·10 lems. and 10 + June of the No. village no. of neareat place where the facUity is available is liven)
(in households Educa- Medical Drinking Po.t Day or Com-hectares rounded tional Water and day. of munica-
upto (potable) Telegraph marketl tion (BUI
two hat Stop,
decimal if any Railway
places) Station, Waterway)
(1) (2) (3) (4) (5) (6) (7) (8) (9) (10)
111 BhOlp 908.159 P: 1506· P CHW W -(.6) .(.&) BS H: 282 Hf
112 Dutapur 558.84 ' P: 10415 P CHW W PO -(6-10) BS H: 188 M HP
113 Kolnur Pandari 384.85 P: 388 P caw W -(·15) ·(15-10) -(-5) H: 86 HP
114 Tugaon 2000.98 P: 4429 peS) HC W PO -(-5) BS H: 828 M HP Phone
H
115 Mabalingraywadi 764.00 P: 1106 P caw w -(-6) -(-5) +5) H: 188 HP
116 Sundarwadi 1228.14 P: 2262 P caw W PO -(-5) BS H: 374 M HP
117 Chincholi Bhuyar 1225.29 P: 1926 P caw W PO ·(5-10) BS H: 349 M HP
118 Aurad 1803.50 P: 2199 P CHW W PO ·(·5) BS H: 357 HP Phone
119 Bhusni 1388.40 P: 1964 P CHW W PO -(-5) BS H: 334 M HP
120 Kader 1710.97 P: 4142 P PHC W PO -(5-10) BS H: 698 M HP Phone
H
121 Murli 468.00 P: 680 P CHW W -(-tj) ·(5-10) BS H: 128 HP
R
122 Kantekur 838.73 P: 1536 P CHW W Phone -(-5) BS H: 296 M HP
R
123 Beradwadi 272.70 P: 600 P CHW W -(-5) ·(-5) -(-5)
H: 101 HP
124 Murum (Rural) 5425.48 P: 1202 P -(-5) W -(-5) -(-5) -(-5) H: 194
125 Ashta Kasar 2229.21 P: 5087 P(3) RP W PO -(5-10) BS H: 918 M CHW HP Phone
H
126 Achaler 3476.64 P: 5105 P(3) PHS T PO Mon BS H: 900 M RP(2) W Phone
H HP PUC
127 Belamb 1762.31 P: 3309 P(3) CHW W PO -(5-10) BS H: 601 M HP Phone
H PUC
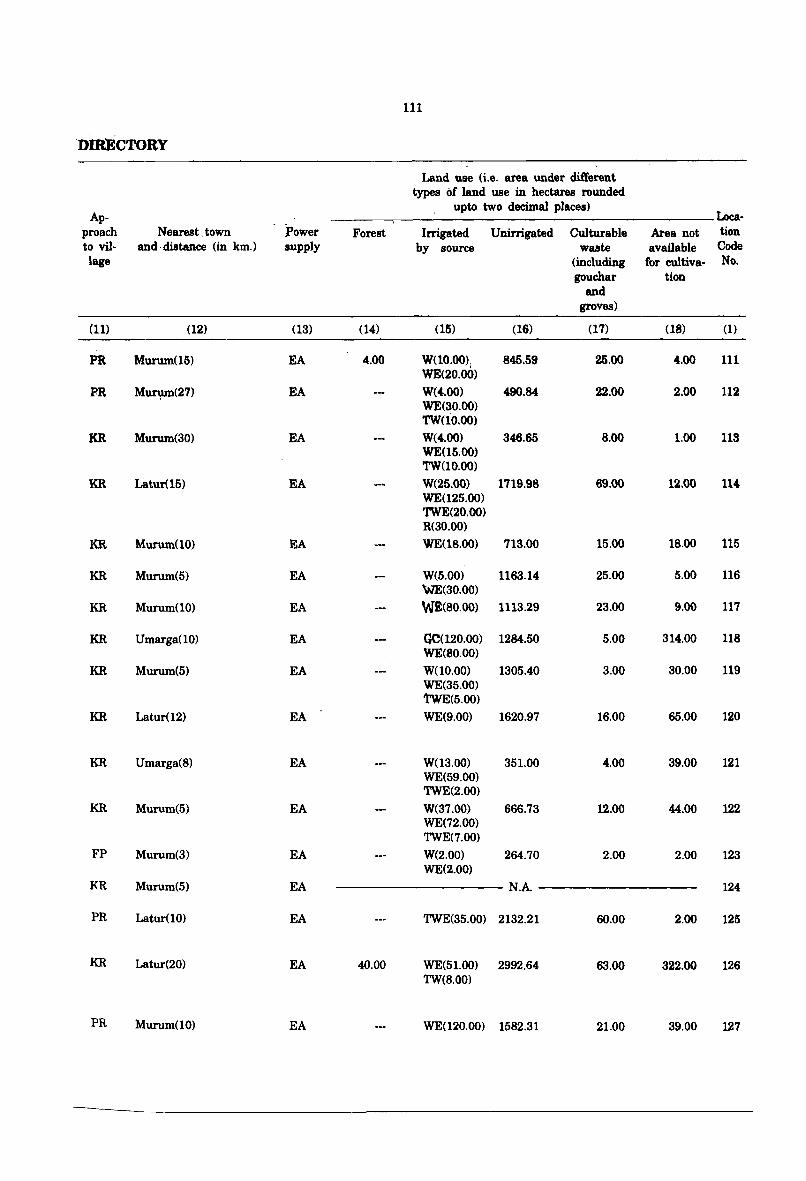
111
DmECTORY
Land use (i.e. area under different types of land use in hectares rounded
Ap-upto two decimal places)
Loca-proach Nearest. town Power Forest Irrigated Unirrigated Culturable Area not tion to viI- and . distance (in km.) supply by source waste available Code lage (including for cultiva- No.
gouchar tion and
groves)
(11) (12) (13) (14) (15) (16) (17) (18) (1)
PR Murum(15) EA 4.00 W(10.OO). WE(20.00)
845.59 25.00 4.00 111
PR MUfl:UJl(27) EA W(4.OO) 490.84 22.00 2.00 112 WE(30.00) TW(lO.oo)
KR Murum(30) EA W(4.00) 346.65 8.00 1.00 113 WE(l5.00) TW(10.oo)
KR Latur(15) EA W(25.OO) 1719.98 69.00 12.00 114 WE(l25.oo) TWE(20.oo) R(30.00)
KR Murum(10) EA WE(18.oo) 713.00 15.00 18.00 115
KR Murum(5) EA W(5.00) 1163.14 25.00 5.00 116 WE(30.00)
KR Murum(10) EA WE(80.00) 1113.29 23.00 9.00 117
KR Umarga(10) EA OC(120.oo) 1284.50 5.00 314.00 118 WE(SO.OO)
KR Murum(5) EA W(10.00) 1305.40 3.00 30.00 119 WE(35.00) 1'WE(5.00)
KR Latur(12) EA WE(9.00) 1620.97 16.00 65.00 120
KR Umarga(8) EA W(13.OO) 351.00 4.00 39.00 121 WE(59.00) TWE(2.00)
KR Murum(5) EA W(37.00) 666.73 12.00 44.00 122 WE(72.00) TWE(7.00)
FP Murum(3) EA W(2.00) 264.70 2.00 2.00 123 WE(2.00)
KR Murum(5) EA N.A 124
PR Latur(10) EA TWE(35.00) 2132.21 60.00 2.00 125
KR Latur(20) EA 40.00 WE(51.00) 2992.64 63.00 322.00 126 TW(8.00)
PR Murum(10) EA WE(120.00) 1582.31 21.00 39.00 127
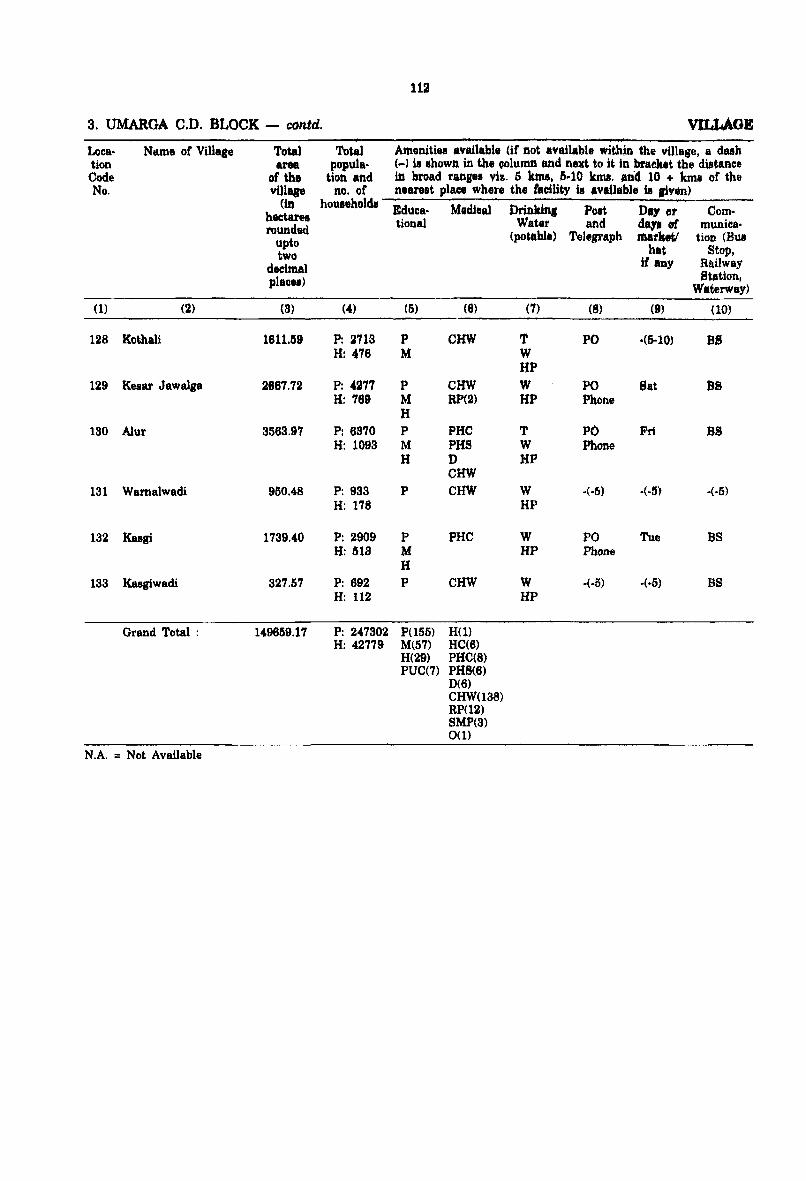
112
3. UMARGA C.D. BLOCK - contd. VILLAGE
Loca- NaIn' of Village Total Totll Atnenitiea available (if not available withia the village, a daah tion area popula· (-) is .hOWD in the oolumn lind next to it in bracket the distance Code of the tion and in broad ranges viz. 5 luna, IHO kma. ati4 10 + kIn. of the No. vill .. no. of nlarest place where the '.dUty is available is sivlin)
(in hOUleholda J!lduca· Medical Orinldnt POit Day or Com· h.ctaree
rounded tiona) Water and day. of munica·
upto (potabl.) TeleJ'l'aph rnarket/ tion (Bua
two hat Stop,
deebnal if any Railway
placN) Station, Waterway)
(1) (2) (3) (4) (5) (8) (7) (8) (9) (10)
128 Kothali 1811.1S9 P: 2718 P CHW T PO ·(5-10) 88 H: 478 M W
IfP 129 Kesar Jawalga 2887.72 P: 4~'77 P CHW W PO Sat 88
H: 789 M RP(2) HP Phone H
130 Alur 3583.97 P: 6870 P PHC T PO Frl BS H: 1093 M PHS W Phone
H D liP CHW
131 Wamalwadi 950.48 P: 933 P CHW W ·(·5) .(-1)) ·(-5) H: 178 HP
132 Kasgi 1739.40 P: 2909 P PHC W PO Tue BS H: 513 M HP Phone
H
133 Kasgiwadi 327.57 P: 892 P CHW W +5) -(-5) BS H: 112 HP
Grand Total : 149859.17 P: 247302 P(55) H(1) H: 42779 M(57) HC(6)
H(29) PHC(S) PUC(7) PHS(6)
D(6) CHW(138) RP(12) SMP(3) 0(1)
N.A. = Not Available
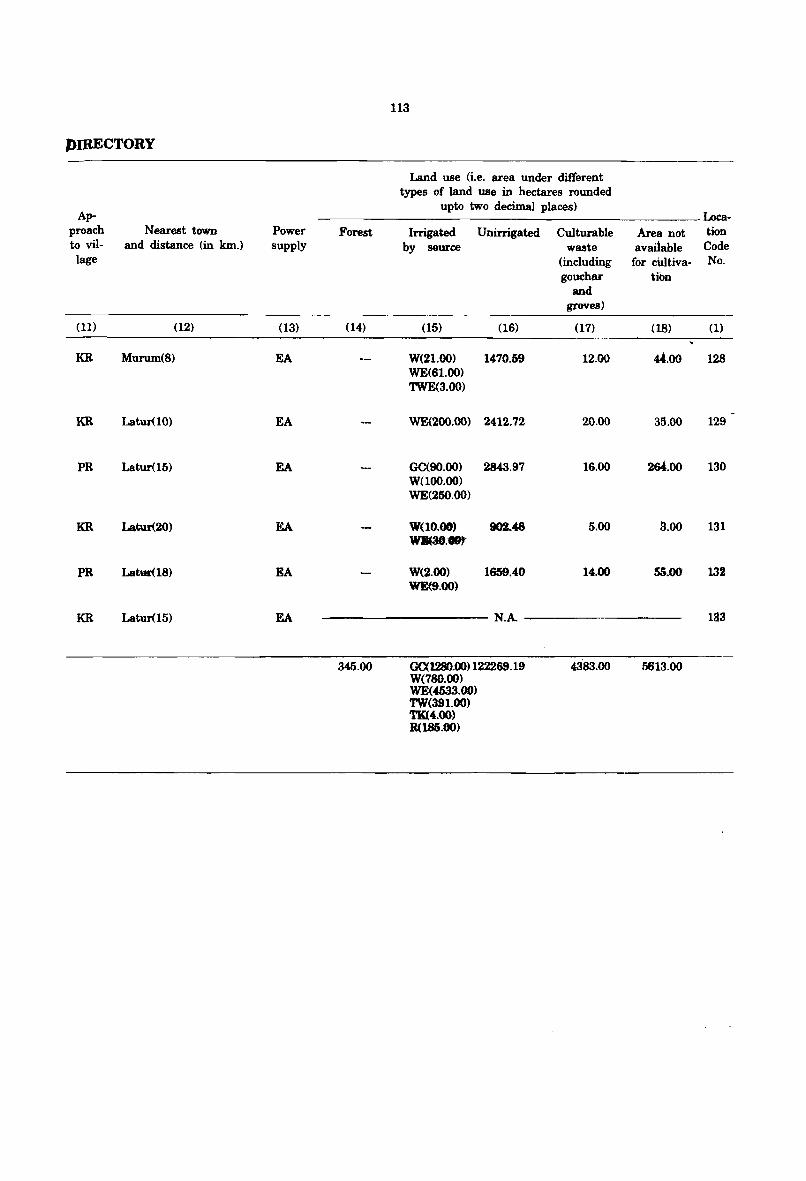
113
J)IRECTORY
Land use (i.e. area under different types of land use in hectares rounded
Ap-upto two decimal places)
Loca-proach Nearest town Power Forest Irrigated Unirrigated Culturable Area not tion to viI- and distance (in km.) supply by source waste available Code lage (including for cultiva- No.
gouc:har tibn and
groves)
(11) (12) (13) (14) (15) (16) (17) (18) (1)
KR Murum(8) EA W(21.00) 1470.59 12.00 «.00 128 WE(61.00) 'IWE(3.00)
KR Latur(10) EA WE(200.00) 2412.72 20.00 35.00 129
PR Latur(15) EA 0090.00) 2843.97 16.00 264.00 130 W(100.OO) WE(250.oo)
KR Latur(20) EA W(10.00) 902.48 5.00 3.00 131
~.-PR Latur(18) EA W{2.00) 1659.40 14.00 M.OO 132
WE(9.00)
KR Latur(15) EA N.A 133
345.00 001280.00) 122269.19 4383.00 5613.00 W(780.00) WE(4533.00) TW(391.00) TK(4.00) R(185.00)
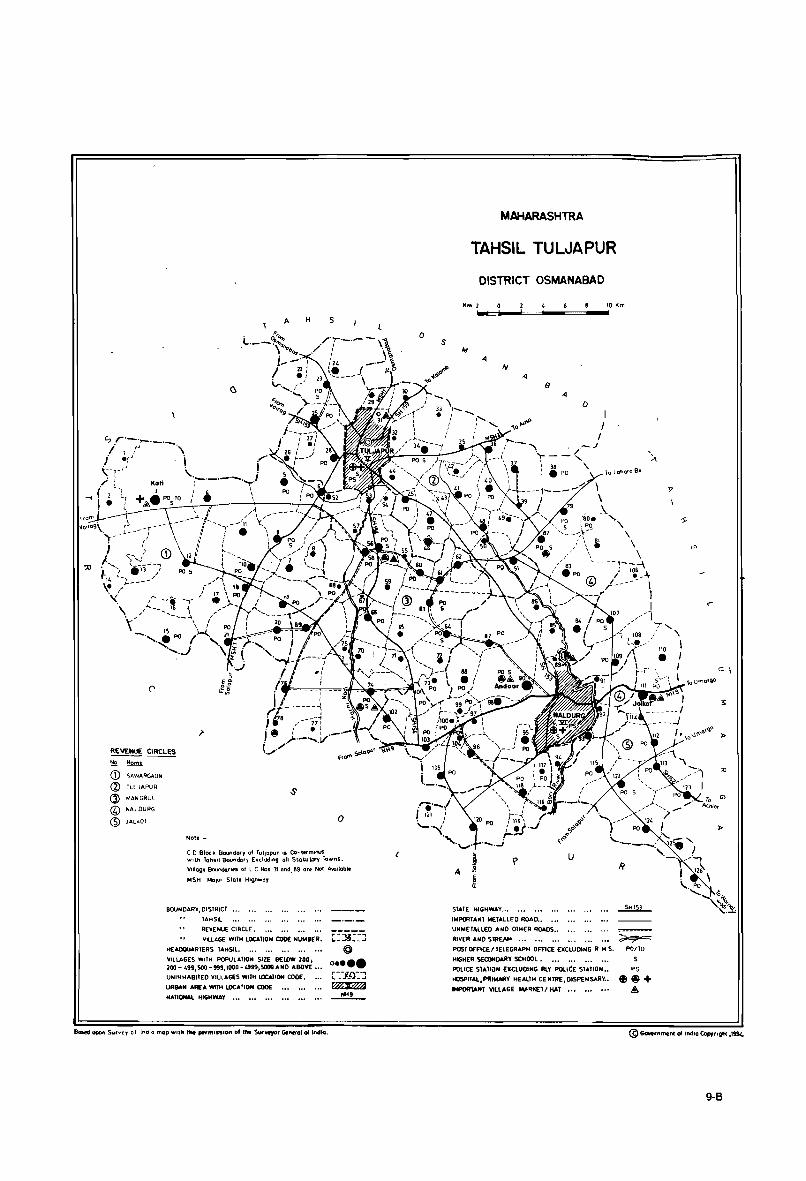
A H s
~~ !!!I. ~
CD SAWARGAON
Q) TUl)APUR
(j) MANGRUl
@ NAlOURG
® jAl)l.QT
s
o Noh! _
CO Block Boundary of TulJQPUr IS Co-t«mIRUS Wtt.h TahsIl 9otJndor~ E.c1uttlng 011 St..oLuIDrV Towns.
VIUage Bouf'ldo.r .. s of LeNos 31 and _ 89 Qrt Not Avollobie
M5H - Mapr Siote HIghway
BOUNOARY,OISTRICT ••• '"
TAHSil
REVENUE CIRCLE.
Vlll.t.GE WITH LOCATION CODE NUMBER.
HEADQUARtERS TAHSIl. ••• ••• ••• ••• • ••
VILLAGES WITH POPULATION SIZE BElOW 200 I 200-L99,SOO-999.IOOO-W9.5000AHO ABOVE •••
UNU4HABlTEO VIUAG(S WITH I.OCAlION CODE.
URBAN oAR['" WITH lOCATION CODE
NATlOtMl HtGHWAY ••• ••• ••• "0 •••
C:3J::J @
0 ••••
[:-_{l}:] ~ __!!!2_
Based upon Surv('y of Indio mop wllh , ... ",rmlUloII 01 IhI S.".veyor Genttat 01 India.
a s
MAHARASHTRA
TAHSIL TULJAPUR
DISTRICT OSMANABAD
Km 2 10 Km -=_..1::::=::10_=_ ...
A
SlATE HIGHWAY •••
IMPORTANT MEtAllED ROAD ••
UN METALLED .AND OTHER ROADS ••
RIYER AND SlREAM ••• ••• .,.
o
u
I I
I
POST OFfiCE I TELEGRAPH OFFICE EXCLUDING R MS.
HIGHER SECIlHOARY SCHOOL. ••• ••• ••• • •• POllet: STATION EXCLUDING RLY POLI~E ST .. II0N ••
t«JSPITAl,PttIMARY HEAlTH CENTRE, DISPENSARY ••
IMPORTANT VICLAGE .... _T I HAT ••• ••• • ••
CO\
»
@Government 01 IndlQ Copyright ,1994.
9-6
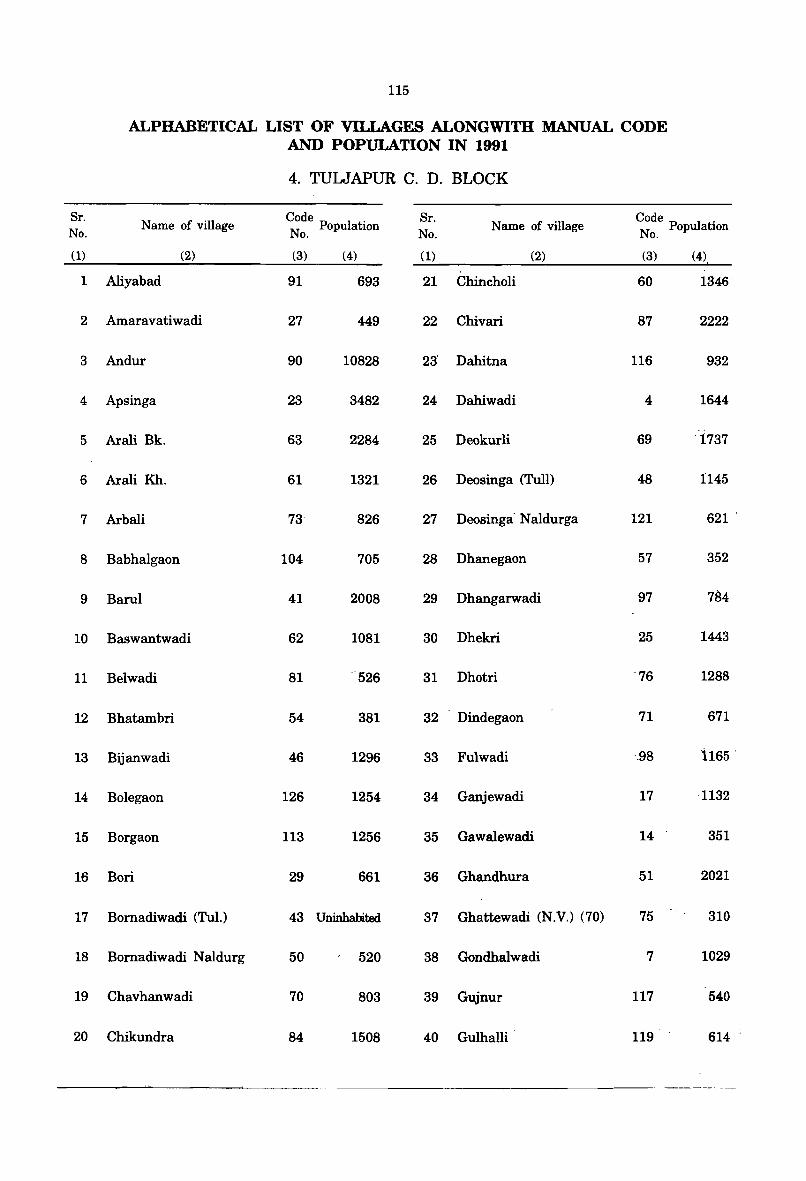
115
ALPHABETICAL LIST OF VILLAGES ALONGWITH MANUAL CODE AND POPULATION IN 1991
4. TULJAPUR C. D. BLOCK
Sr. Name of village
Code . Sr. Name of village
Code . No. N PopulatIOn
No. N Population o. o.
(1) (2) (3) (4) (1) (2) (3) (4)
1 Aliyabad 91 693 21 Chincholi 60 1346
2 Amaravatiwadi 27 449 22 Chivari 87 2222
3 Andur 90 10828 23 Dahitna 116 932
4 Apsinga 23 3482 24 Dahiwadi 4 1644
5 Arali Bk. 63 2284 25 Deokurli 69 1737
6 Arali Kh. 61 1321 26 Deosinga (Tull) 48 1145
7 Arbali 73 826 27 Deosinga- N aldurga 121 621 -
8 Babhalgaon 104 705 28 Dhanegaon 57 352
9 Barul 41 2008 29 Dhangarwadi 97 784
10 Baswantwadi 62 1081 30 Dhekri 25 1443
11 Belwadi 81 --526 31 Dhotri '76 1288
12 Bhatambri 54 381 32 Dindegaon 71 671
13 Bijanwadi 46 1296 33 Fulwadi -,98 1165 '
14 Bolegaon 126 1254 34 Ganjewadi 17 -1132
15 Borgaon 113 1256 35 Gawalewadi 14 351
16 Bori 29 661 36 Ghandhura 51 2021
17 Bomadiwadi (Tul.) 43 Uninhabited 37 Ghattewadi (N.V.) (70) 75 310
18 Bom-adiwadi N aldurg 50 520 38 Gondhalwadi 7 1029
19 Chavhanwadi 70 803 39 Gujnur 117 540
20 Chikundra 84 1508 40 Gulhalli 119 614
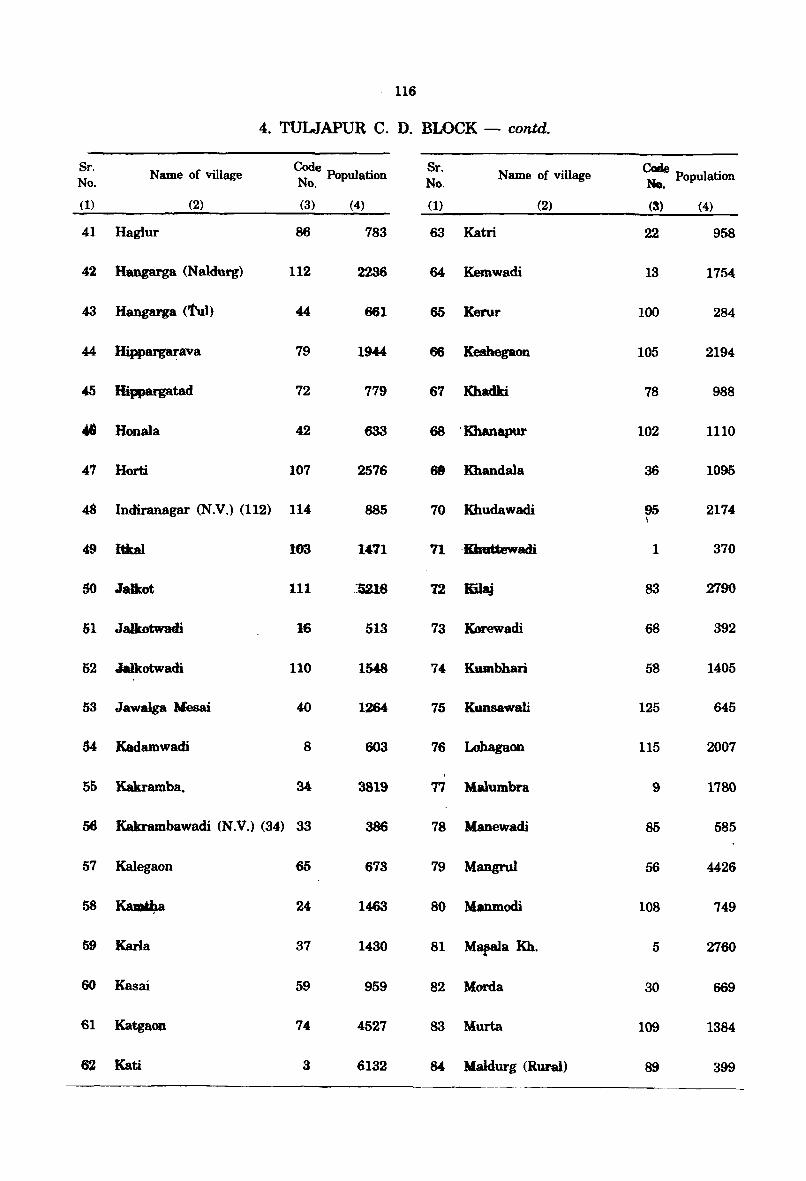
116
4. TUWAPUR C. D. BLOCK - contd.
Sr. Name of village ~e Population Sr.
Name of village c: Population No. o. No.
(1) (2) (3) (4) (1) (2) (3) (4)
41 Haglur 86 783 63 Katri 22 958
42 Hanprga (Naldurg) 112 2236 64 Kemwadi 13 1754
43 Hangarga (Tul) 44 661 65 Kerur 100 284
44 Hippargarava 79 1944 66 Keshegaon 105 2194
45 Hippargatad 72 779 67 Khadki 78 988
41 Honala 42 633 68 'Khanapur 102 1110
47 Horti 107 2576 68 Khandala 36 1095
48 Indiranagar <N.V,> (112) 114 885 70 Khudawadi 95 2174 \
49 Itkal 183 1·t71 71 -Ktmttewadi 1 370
50 .Ia1kot 111 -1S218 12 ~ 83 2790
51 Jalkotwadi 16 513 73 KDrewadi 68 392
52 Jalkotwadi 110 1548 74 Kumbhari 58 1405
53 JawaJga Mesai 40 1264 75 Kunsawali 125 645
54 Kadamwadi 8 603 76 Lohagaon 115 2007
55 Kakramba. 34 3819 77 Malumbra 9 1780
56 Kakrambawadi (N.V.) (34) 33 386 78 Manewadi 85 585
57 Kalegaon 65 673 79 Mangrul 56 4426
58 KamtJ,a 24 1463 80 Manmodi 108 749
59 Karla 37 1430 81 Mapala Kh. 5 2760
60 Kasai 59 959 82 Morda 30 669
61 Katgaon 74 4527 83 Murta 109 1384
62 Kati 3 6132 84 Maldurg (Rural) 89 399
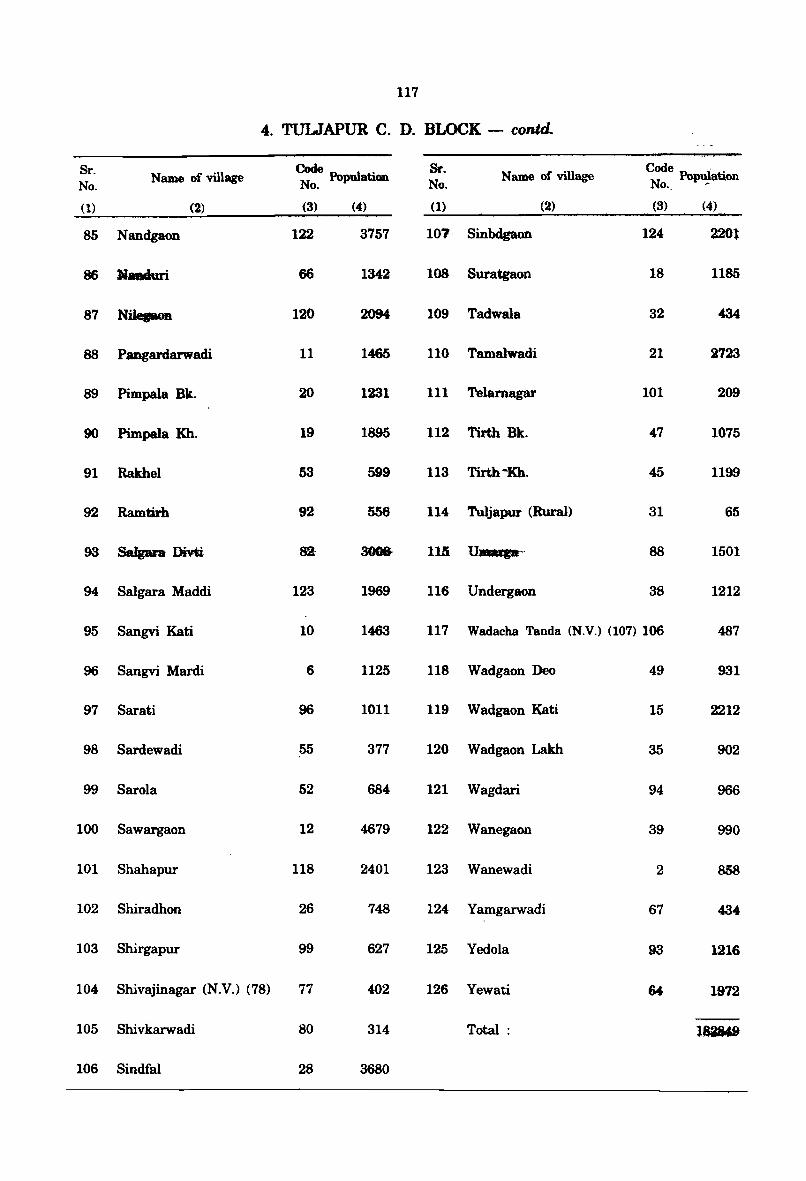
117
4. TULJAPUR C. D. BLOCK - contd.
Sr. Name of village ~ Population
Sr. Name of village c:e
Population No. o. No. 0., -
(1) (2) (3) (4) (1) (2) (3) (4)
85 Nandgaon 122 3757 107, Sinbdgaon 124 220l
86 Jiaaduri 66 1342 lOB Suratgaon 18 1185
87 Nilepoa 120 2094 109 Tadwala 32 434
88 Pangardarwadi 11 1465 llO Tamalwadi 21 2'123
89 Pimpala Bk. 20 1231 111 Telamagar 101 209
90 Pimpala Kh. 19 1895 112 Tirth Bk. 47 1075
91 RaIthel 53 599 113 Tirth~Kh. 45 1199
92 Ramtirh 92 556 114 Tuljapur (Rural) 31 65
93 SaIgam Divti sa aooa 115. IJ.. ... -" 88 1501
94 Salgara Maddi 123 1969 116 Undergaon 38 1212
95 Sangvi Kati 10 1463 117 Wadaeha Tanda (N.V.) (107) 106 487
96 Sangvi Mardi 6 ll25 118 Wadgaon Deo 49 931
97 Sarati 96 1011 119 Wadgaon Kati 15 2212
98 Sardewadi 55 377 120 Wadgaon Lakh 35 902 ,
99 Sarola 52 684 121 Wagdari 94 966
100 Sawargaon 12 4679 122 Wanegaon 39 990
101 Shahapur 118 2401 123 Wanewadi 2 858
102 Shiradhon 26 748 124 Yamgarwadi 67 434
103 Shirgapur 99 627 125 Yedola 93 1216
104 Shivajinagar (N.V.) (78) 77 402 126 Yewati 64 1972
105 Shivkarwadi 80 314 Total : 1$1&t.9
106 Sindfal 28 3680
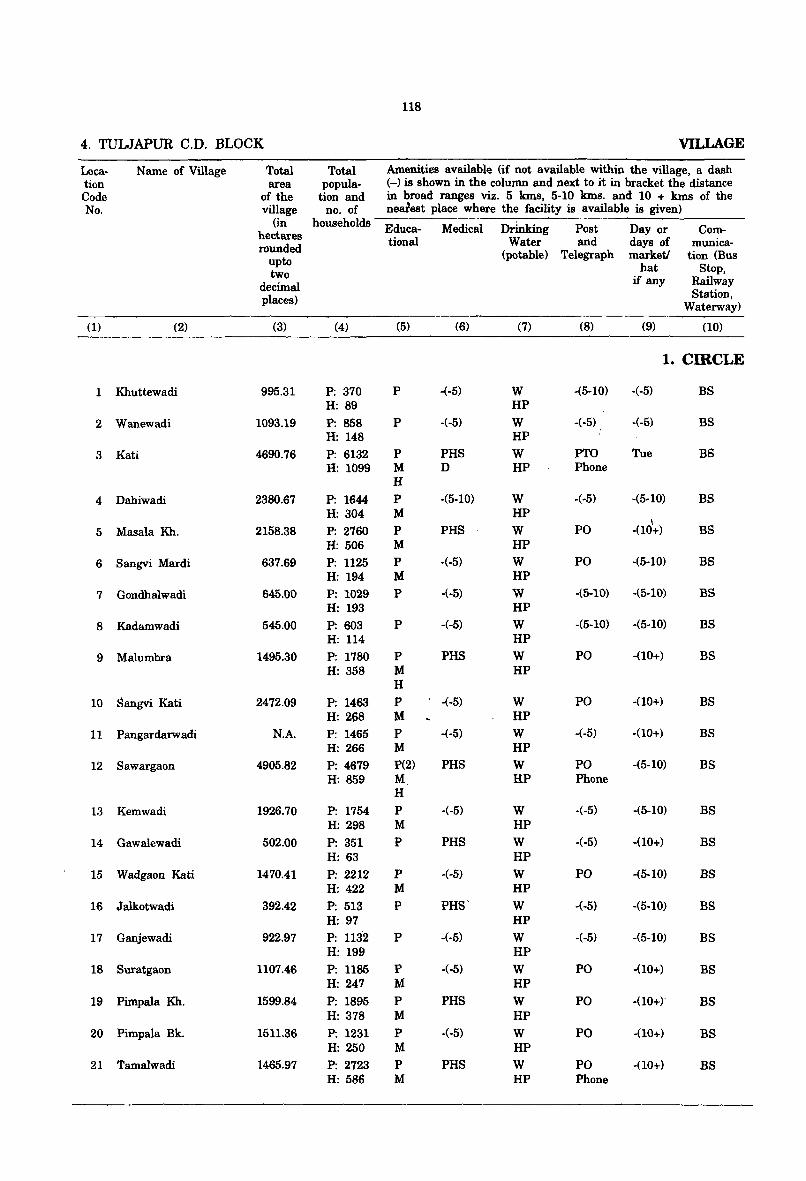
118
4. TULJAPUR C.D. BLOCK VILLAGE
Loca- Name of Village Total Total Amenities available (if not available within the village, a dash tion area popula- (-) is shown in the column and next to it in bracket the distance Code of the tion and in broad ranges viz. 5 kms, 5-10 kms. and 10 + kms of the No. village no. of neldest place where the facility is available is given)
(in households Educa- Medical Drinking Post Day or Com-hectares rounded tional Water and days of munica-
upto (potable) Telegraph market! tion (Bus
two hat Stop,
decimal if any Railway
places) Station, Waterway)
(1) (2) (3) (4) (5) (6) (7) (8) (9) (10)
1. CIRCLE
1 Khuttewadi 995.31 P: 370 P -(-5) W -(5-10) -(-5) BS H: 89 HP
2 Wanewadi 1093.19 P: 858 P -(-5) W -(-5) .. -(-5) BS H: 148 HP
3 Kati 4690.76 P: 6132 P PHS W PTO Tue BS H: 1099 M D HP Phone
H
4 Dahiwadi 2380.67 P: 1644 P -(5-10) W -(-5) -(5-10) BS H: 304 M HP
\ 5 Masala Kh. 2158.38 P: 2760 P PHS W PO -(10+) BS
H: 506 M HP
6 Sangvi Mardi 637.69 P: 1125 P -(-5) W PO -(5-10) BS H: 194 M HP
7 Gondhalwadi 645.00 P: 1029 P -(-5) W -(5-10) -(5-10) BS H: 193 HP
8 Kadamwadi 545.00 P: 603 P -(-5) W -(5-10) -(5-10) BS H: 114 HP
9 Malumbra 1495.30 P: 1780 P PHS W PO -(10+) BS H: 358 M HP
H
10 Sangvi Kati 2472.09 P: 1463 P -(-5) W PO -(10+) BS H: 268 M HP
11 Pangardarwadi N.A. P: 1465 P -(-5) W -(-5) -(10+) BS H: 266 M HP
12 Sawargaon 4905.82 P: 4679 P(2) PHS W PO -(5-10) BS H: 859 M HP Phone
H
13 Kemwadi 1926.70 P: 1754 P -(-5) W -(-5) -(5-10) BS H: 298 M HP
14 Gawalewadi 502.00 P: 351 P PHS W -(-5) -(10+) BS H: 63 HP
15 Wadgaon Kati 1470.41 P: 2212 P -(-5) W PO -(5-10) BS H: 422 M HP
16 Jalkotwadi 392.42 P: 513 P PHS' W -(-5) -(5-10) BS H: 97 HP
17 Ganjewadi 922.97 P: 1132 P -(-5) W -(-5) -(5-10) BS H: 199 HP
18 Suratgaon 1107.46 P: 1185 P -(-5) W PO -(10+) BS H: 247 M HP
19 Pimpala Kh. 1599.84 P: 1895 P PHS W PO -(10+)' BS H: 378 M HP
20 Pimpala Bk. 1511.36 P: 1231 P -(-5) W PO -(10+) BS H: 250 M HP
21 Tamalwadi 1465.97 P: 2723 P PHS W PO -(10+) BS H: 586 M HP Phone
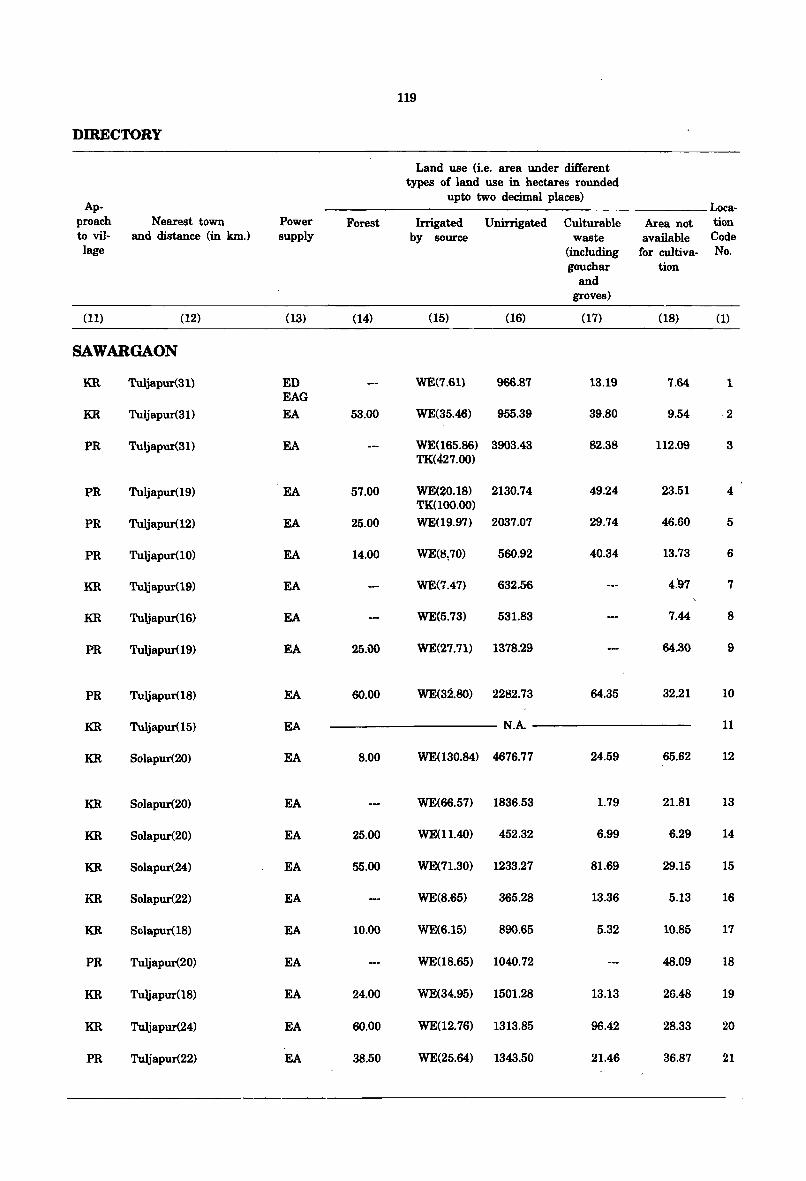
119
DmECTORY
Land use (i.e. area under different types of land use in hectares rounded
Ap-upto two decimal places)
Loca-proach Nearest town Power Forest Irrigated Unirrigated Culturable Area not tion to vil- and distance (in km.) supply by source waste available Code lage (including for cultiva- No.
gouchar tion and
groves)
(11) (12) (13) (14) (15) (16) (17) (18) (1)
SAWARGAON
KR Tuljapur(31) ED WE(7.61) 966.87 13.19 7.64 1 EAG
K.R Tuljapur(31) EA 53.00 WE(35.46) 955.39 39.80 9.54 -2
PR Tuljapur(31) EA WE(165.86) TK(427.00)
3903.43 82.38 112.09 3
PR Tuljapur(19) EA 57.00 WE(20.18) 2130.74 49.24 23.51 4 TK(l00.00)
PR Tuljapur(12) EA 25.00 WE(19.97) 2037.07 29.74 46.60 5
PR Tuljapur(10) EA 14.00 WE(8:70) 560.92 40.34 13.73 6
KR Tuljapur(19) EA WE(7.47) 632.56 4.97 7
KR Tuljapur(16) EA WE(5.73) 531.83 7.44 8
PR Tuljapur(19) EA 25.00 WE(27.71) 1378.29 64.30 9
PR Tuljapur(18) EA 60.00 WE(32.80) 2282.73 64.35 32.21 10
KR Tuljapur(15) EA N.A. 11
KR Solapur(20) EA 8.00 WE(130.84) 4676.77 24.59 65.62 12
KR Solapur(20) EA WE(66.57) 1836.53 1.79 21.81 13
K.R Solapur(20) EA 25.00 WE(ll.40) 452.32 6.99 6.29 14
K.R Solapur(24) EA 55.00 WE(71.30) 1233.27 81.69 29.15 15
K.R Solapur(22) EA WE(8.65) 365.28 13.36 5.13 16
K.R Solapur(18) EA 10.00 WE(6.15) 890.65 5.32 10.85 17
PR Tuljapur(20) EA WE(18.65) 1040.72 48.09 18
KR Tuljapur(18) EA 24.00 WE(34.95) 1501.28 13.13 26.48 19
KR Tuljapur(24) EA 60.00 WE(12.76) 1313.85 96.42 28.33 20
PR Tuljapur(22) EA 38.50 WE(25.64) 1343.50 21.46 36.87 21
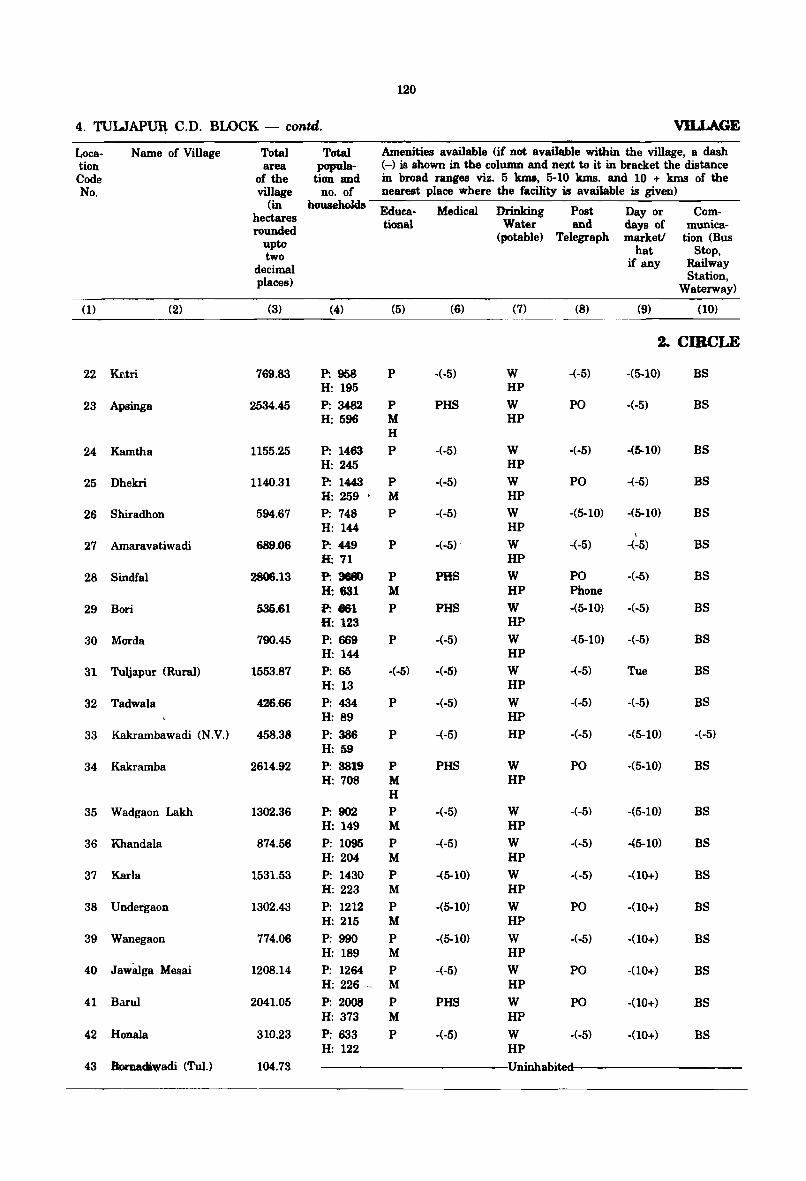
120
4. TULJAP~ C.D. BLOCK - cantil. VILLAGE
Loca- Name of Village Total Total Amenities available (if not available within the village, a dash tion area popula- (-) is shown in the column and next to it in bracket the distance Code of the tion and in broad ranges viz. 5 kma, 5-10 kms. and 10 + kms of the No. village no. of nearest place where the facility is available is given)
(in households Educa- Medical Drinking Post nay or Com-hectares rounded tional Water and days of munica-
upto (potable) Telegraph marketl tion (Bus
two hat Stop,
decimal if any Railway
places) Station, Waterway)
(1) (2) (3) (4) (5) (6) (7) (8) (9) (10)
2. CIRCLE
22 ~tri 769.83 P: 968 P -(-5) W -(-5) -(5-10) BS H: 195 HP
23 Apsinga 2534.45 P: 3482 P PHS W PO -(-5) BS H: 596 M HP
H
24 Kamtha 1155.25 P: 1463 P -(·5) W ·(·5) -(5-10) BS H: 245 HP
25 Dhekri 1140.31 P: 1443 P ·(-5) W PO ·(·5) BS H: 259 M HP
26 Shiradhon 594.67 P: 748 P ·(·5) W -(5-10) ·(5-10) BS H: 144 HP
\
27 Amaravatiwadi 689.06 P: 449 P -(-5) .' W ·(-5) -(·5) BS H: 71 HP
28 Sindfal 2806.13 P: 3680 P PHS W PO ·(·5) BS H: 631 M HP Phone
29 Bori 535.61 P: 861 P PHS W ·(5-10) ·(·5) BS H: 123 HP
30 Morda 790.45 P: 669 P -(-5) W ·(5·10) ·(-5) BS H: 144 HP
31 Tuljapur (Rural) 1553.87 P: 65 ·(·5) ·(-5) W -(-5) Tue BS H: 13 HP
32 Tadwala 426.66 P: 434 P -(·5) W ·(·5) ·(·5) BS H: 89 HP
33 Kakrambawadi (N.V.) 458.38 P: 386 P ·(·5) HP ·(·5) ·(5-10) ·(-5) H: 59
34 Kakramba 2614.92 P: 3819 P PHS W PO ·(5·10) BS H: 708 M HP
H
35 Wadgaon Lakh 1302.36 P: 902 P -(·5) W ·(·5) ·(5·10) BS H: 149 M HP
36 Khandala 874.56 P: 1095 P ·(·5) W ·(·5) ..(5-10) BS H: 204 M HP
37 Karla 1531.53 P: 1430 P -(5·10) W ·(·5) ·(10+) BS H: 223 M HP
38 Undetgaon 1302.43 P: 1212 P ·(5-10) W PO ·(10+) BS H: 215 M HP
39 Wanegaon 774.06 P: 990 P ·(5-10) W -(·5) ·(10+) BS H: 189 M HP
40 JawaIga Mesai 1208.14 P: 1264 P -(-5) W PO ··(10+) BS H: 226 -, M HP
41 Barul 2041.05 P: 2008 P PHS W PO ·(10+) BS H: 373 M HP
42 Honala 310.23 P: 633 P .(-5) W ·(·5) -(10+) BS H: 122 HP
43 Bonladiwadi (Tul.) 104.73 Uninhabited
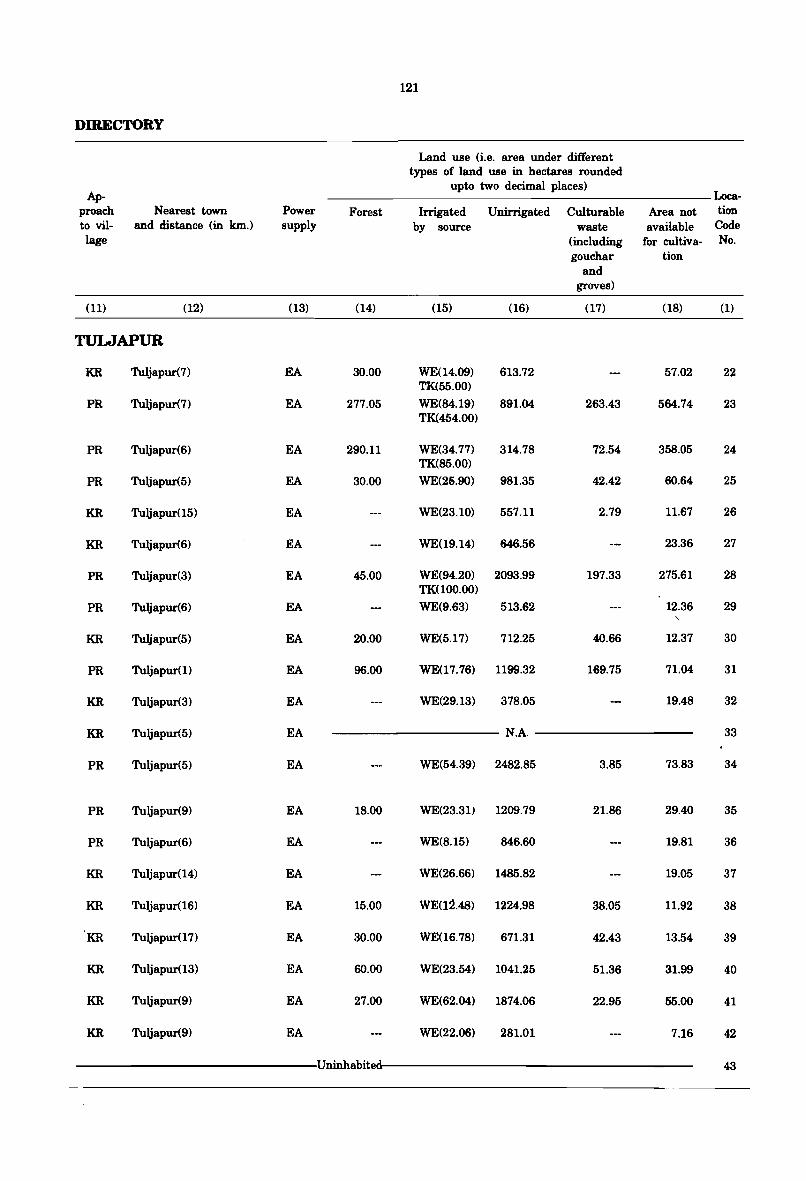
121
DmECTORY
Land use (i.e. area under different types of land use in hectares rounded
Ap-upto two decimal places)
Loea-proach Nearest town Power Forest Irrigated Unirrigated Culturable Area not tion to viI- and distance (in km.) supply by source waste available Code lage (including for cultiva- No.
gouchar tion and
groves)
(11) (12) (13) (14) (15) (16) (17) (18) (1)
TULJAPUR
KR Tuljapur(7) EA 30.00 WE(14.09) 613.72 57.02 22 TK(55.00)
PR Tuljapur(7) EA 277.05 WE(84.19) 891.04 263.43 564.74 23 00454.00)
PR Tuljapur(6) EA 290.11 WE(34.77) 314.78 72.54 358.05 24 TK(85.00)
PR Tuljapur(5) EA 30.00 WE(26.90) 981.35 42.42 60.64 25
KR Tuljapur(15) EA WE(23.10) 557.11 2.79 11.67 26
KR Tuljapur(6) EA WE(19.14) 646.56 23.36 27
PR Tuljapur(3) EA 45.00 WE(94.20) 2093.99 197.33 275.61 28 TK(1oo.oo)
PR Tuljapur(6) EA WE(9.63) 513.62 12.36 29 , KR Tuljapur(5) EA 20.00 WE(5.17) 712.25 40.66 12.37 30
PR Tuljapur(l) EA 96.00 WE(17.76) 1199.32 169.75 71.04 31
KR Tuljapur(3) EA WE(29.13) 378.05 19.48 32
KR Tuljapur(5) EA N.A. 33
PR Tuljapur(5) EA WE(54.39) 2482.85 3.85 73.83 34
PR Tuljapur(9) EA 18.00 WE(23.31) 1209.79 21.86 29.40 35
PR Tuljapur(6) EA WE(8.15) 846.60 19.81 36
KR Tuljapur(14) EA WE(26.66) 1485.82 19.05 37
KR Tuljapur(16) EA 15.00 WE(I~.48) 1224.98 38.05 11.92 38
KR Tuljapur(17) EA 30.00 WE(16.78) 671.31 42.43 13.54 39
KR Tuljapur(13) EA 60.00 WE(23.54) 1041.25 51.36 31.99 40
KR Tuljapur(9) EA 27.00 WE(62.04) 1874.06 22.95 55.00 41
KR Tuljapur(9) EA WE(22.06) 281.01 7.16 42
Uninhabite 43
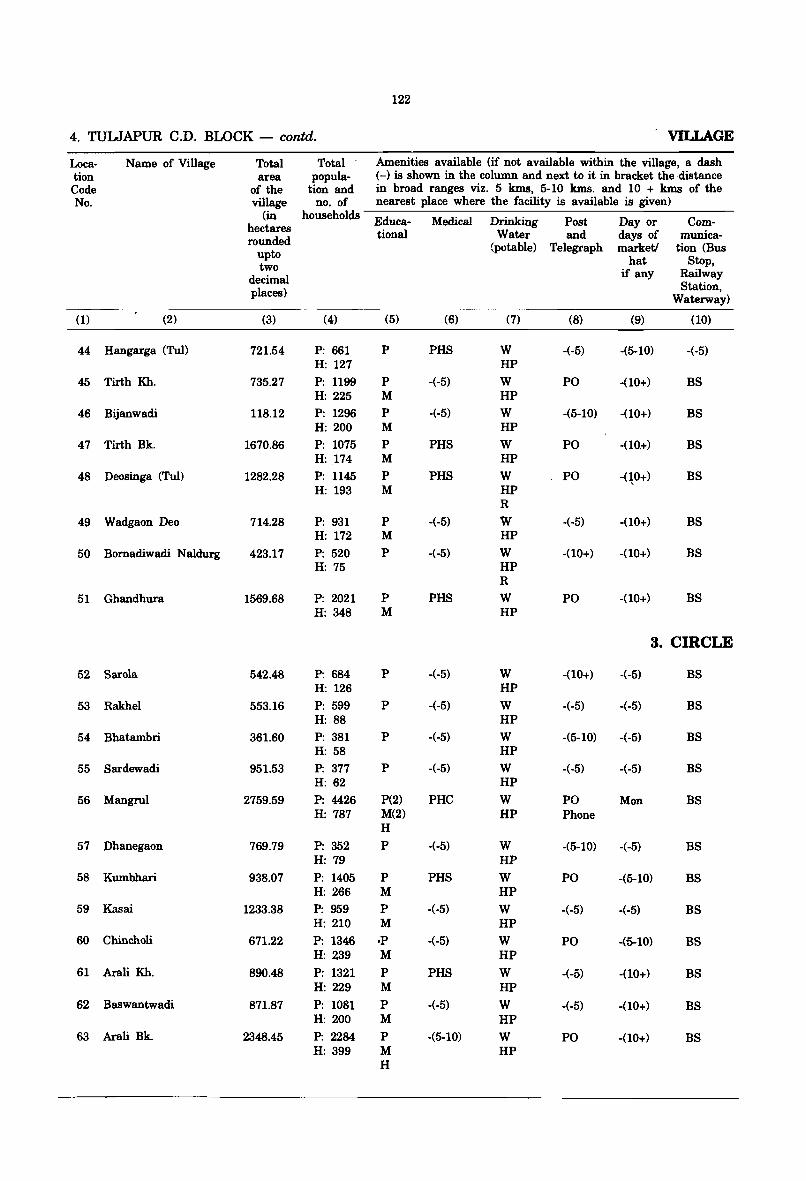
122
4. TULJAPUR C.D. BLOCK - contd. VILLAGE
Loca- Name of Village Total Total Amenities available (if not available within the village, a dash tion area popula- (-) is shown in the column and next to it in bracket the distance Code of the tion and in broad ranges viz. 5 kms, 5-10 kms. and 10 + kms of the No. village no. of nearest place where the facility is available is given)
(in households Educa- Medical Drinking Post Day or Com-hectares rounded tional Water and days of munica-
upto {potable) Telegraph market/ tion (Bus
two hat Stop,
decimal if any Railway
places) Station, Waterway)
(1) (2) (3) (4) (5) (6) (7) (8) (9) (10)
44 Hangarga (Tul) 721.54 P: 661 P PHS W -(-5) -(5-10) -(-5) H: 127 HP
45 Tirth Kh. 735.27 P: 1199 P -(-5) W PO -(10+) BS H: 225 M HP
46 Bijanwadi 118.12 P: 1296 P -(-5) W -(5-10) -(10+) BS H: 200 M HP
47 Tirth Bk. 1670.86 P: 1075 P PHS W PO -(10,+) BS H: .174 M HP
48 Deosinga (Tul) 1282.28 P: 1145 P PHS W PO -qO+) BS H: 193 M HP
R
49 Wadgaon Deo 714.28 P: 931 P -(-5) W -(-5) -(10+) BS H: 172 M HP
50 Bomadiwadi Naldurg 423.17 P: 520 P -(-5) W -(10+) -(10+) BS H: 75 HP
R
51 Ghandhura 1569.68 P: 2021 P PHS W PO -(10+) BS H: 348 M HP
3. CIRCLE
52 Sarola 542.48 P: 684 P -(-5) W -(10+) -(-5) BS H: 126 HP
53 Rakhel 553.16 P: 599 P -(-5) W -(-5) -(-5) BS H: 88 HP
54 Bhatambri 361.60 P: 381 P -(-5) W -(5-10) -(-5) BS H: 58 HP
55 Sardewadi 951.53 P: 377 P -(-5) W -(-5) -(-5) BS H: 62 HP
56 Mangrul 2759.59 P: 4426 P(2) PHC W PO Mon BS H: 787 M(2) HP Phone
H
57 Dhanegaon 769.79 P: 352 P -(-5) W -(5-10) -(-5) BS H: 79 HP
58 Kumbhari 938.07 P: 1405 P PHS W PO -(5-10) BS H: 266 M HP
59 Kasai 1233.38 P: 959 P -(-5) W -(-5) -(-5) BS H: 210 M HP
60 Chincholi 671.22 P: 1346 .p -(-5) W PO -(5-10) BS H: 239 M HP
61 Arali Kh. 890.48 P: 1321 P PHS W -(-5) -(10+) BS H: 229 M HP
62 Baswantwadi 871.87 P: 1081 P -(-5) W -(-5) -(10+) BS H: 200 M HP
63 Arali Bk. 2348.45 P: 2284 P -(5-10) W PO -(10+) BS H: 399 M HP
H
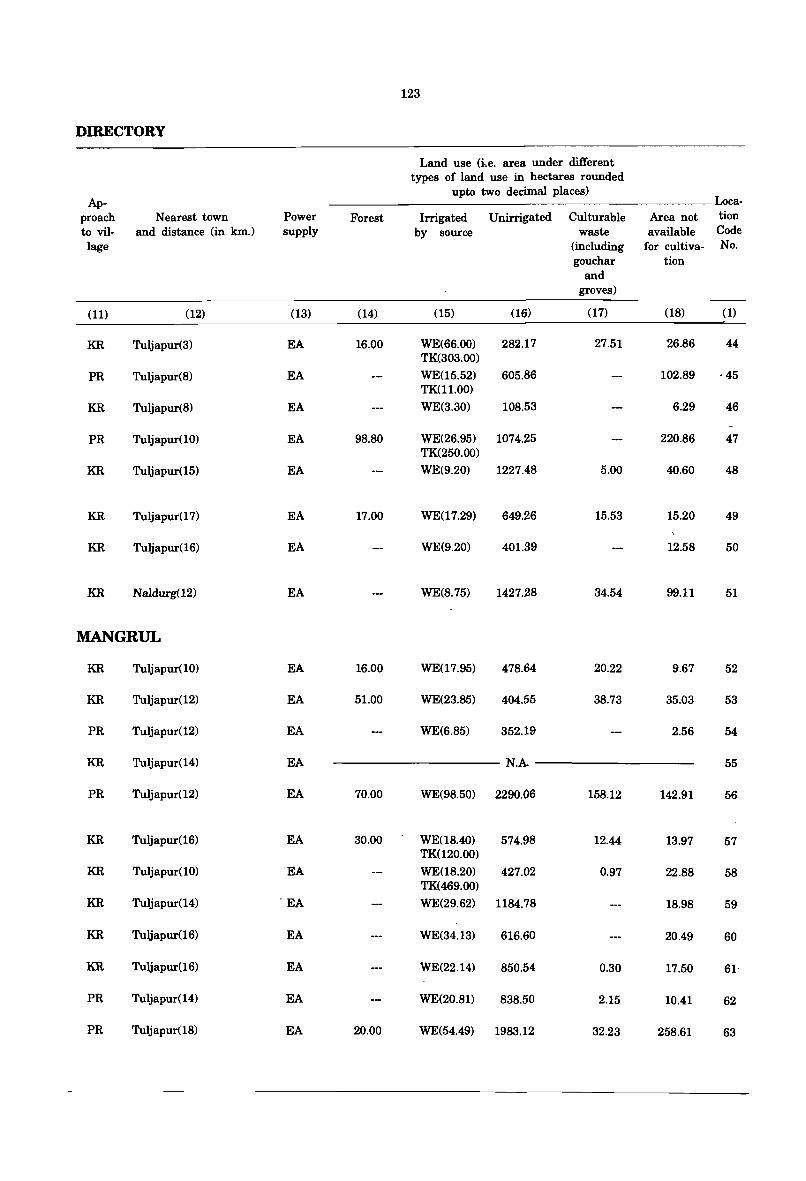
123
DmECTORY
Land use (i.e. area under different types of land use in hectares rounded
Ap-upto two decimal places)
Loca-proach Nearest town Power Forest Irrigated Unirrigated Culturable Area not tion to vil- and distance (in km.) supply by source waste available Code lage (including for cultiva- No.
gouchar tion and
groves)
(11) (12) (13) (14) (15) (16) (17) (18) (1)
KR Tuljapur(3) EA 16.00 WE(66.00) 282.17 27.51 26.86 44 TK(303.00)
PR Tuljapur(8) EA WE(15.52) 605.86 102.89 ·45 TK(I1.00)
KR Tuljapur(8) EA WE(3.30) 108.53 6.29 46
PR Tuljapur(10) EA 98.80 WE(26.95) 1074.25 220.86 47 TK(250.00)
KR Tuljapur(15) EA WE(9.20) 1227.48 5.00 40.60 48
KR Tuljapur(17) EA 17.00 WE(17.29) 649.26 15.53 15.20 49
KR Tuljapur(16) EA WE(9.20) 401.39 12.58 50
KR Naldurg(12) EA WE(8.75) 1427.28 34.54 99.11 51
MANGRUL
KR Tuljapur(10) EA 16.00 WE(17.95) 478.64 20.22 9.67 52
KR Tuljapur(12) EA 51.00 WE(23.85) 404.55 38.73 35.03 53
PR Tuljapur(12) EA WE(6.85) 352.19 2.56 54
KR Tuljapur(14) EA N.A. 55
PR Tuljapur(12) EA 70.00 WE(98.50) 2290.06 158.12 142.91 56
KR Tuljapur(16) EA 30.00 WE(18.4O) 574.98 12.44 13.97 57 TK(120.00)
KR Tuljapur(10) EA WE(18.20) 427.02 0.97 22.88 58 TK(469.00)
KR Tuljapur(14) - EA WE(29.62) 1184.78 18.98 59
KR Tuljapur(16) EA WE(34.13) 616.60 20.49 60
KR Tuljapur(l6) EA WE(22.14) 850.54 0.30 17.50 61·
PR Tuljapur(14) EA WE(20.81) 838.50 2.15 10.41 62
PR Tuljapur(18) EA 20.00 WE(54.49) 1983.12 32.23 258.61 63
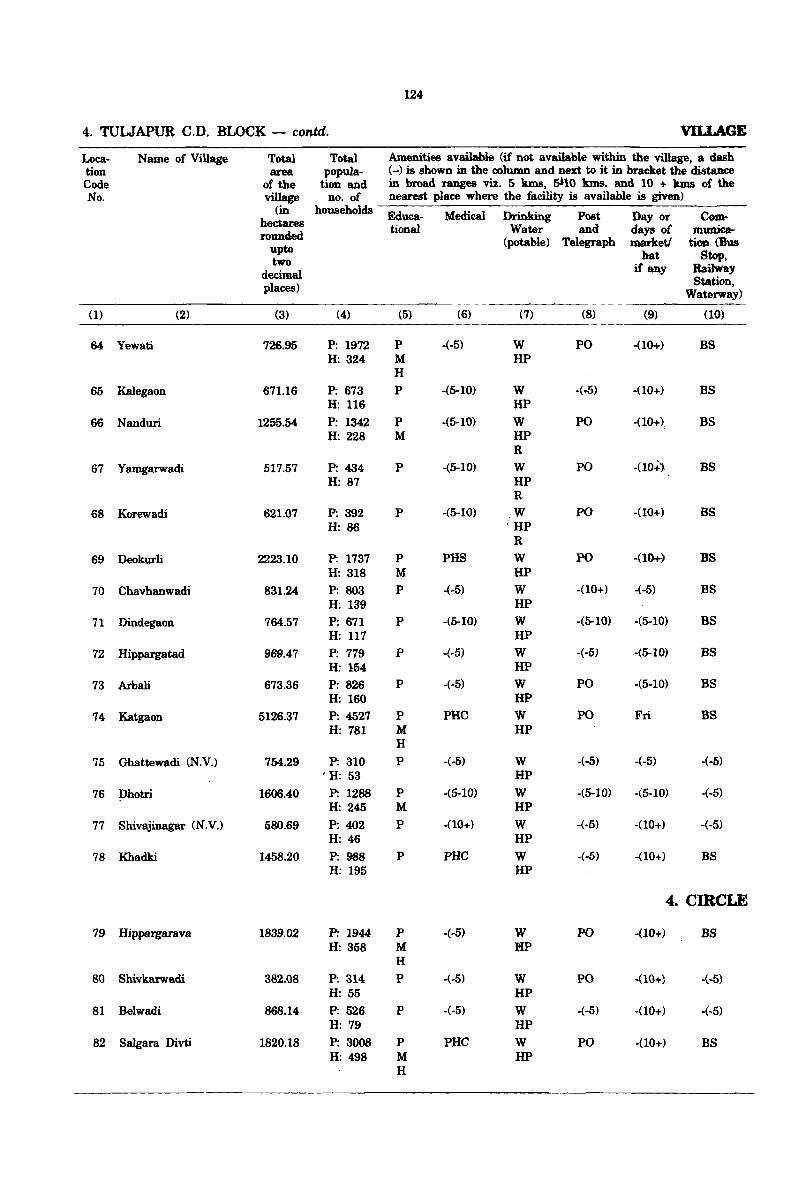
124
4. TULJAPUR C.D. BLOCK - contd. VIJ..LAGE
Loea- Name of Village Total TI)tal Amenities available (if not available within the village, a dash tion area popula- (-) is shown in the column and next to it in braeket the distaAce Code of the tion and in broad ranges viz. 5 kms, fS!10 kms. and 10 + kms of the No. village no. of nearest place where the facility is available is given)
(in households Educa- Medical Drinking Post nay or Com-hectares
rounded tional Water and days of munica-
upto (potable) Telegraph marketl tion (Bus
two hat Stop,
decimal if any Railway
places) Station, Waterway)
(1) (2) (3) (4) (5) (6) (7) (8) (9) (10)
64 Yewati 726.95 P: 1972 P -(-5) W PO -(10+) BS H: 324 M HP
H
65 Kalegaon 671.16 P: 673 P -(5-10) W -(.5) -(10+) BS H: 116 HP
66 Nanduri 1255.54 P: 1342 P -(5-10) W PO -(10+), BS H: 228 M HP
R
67 Yarngarwadi 517.57 P: 434 P -(5-10) W PO -00+) BS H: 87 HP
R
68 Korewadi 621.07 P: 392 P -(5-10) W PO -(10+) BS H: 86 i HP
R
69 Deokurli 2223.10 P: 1737 P PHS W PO -(lo.H BS H: 318 M HP
70 Chavhanwadi 831.24 P: 803 P -(-5) W -(10+) -(-5) BS H: 139 HP
71 Dindegaon 764.57 P: 671 P -(5-10) W -(5-10) -(5-10) BS H: 117 HP
72 Hippargatad 969.47 P: 779 P -(-5) W -(-5) -(5-10) BS H: 154 HP
73 Arbali 673.36 P: 826 P -(-5) W PO -(5-10) BS H: 160 HP
74 Katgaon 5126.37 P: 4527 P PRC W PO Fri BS H: 781 M HP
H
75 Ghattewadi (N.V.) 754.29 P: 310 P -(-5) W -(-5) -(-5) -(-5) 'H: 53 HP
76 Dbotri 1606.40 P: 1288 P -(5-10) W -(5-10) -(5-10) -(-5) H: 245 M HP
77 Shivajinagar (N.V.) 580.69 P: 402 P -(10+) W -(-5) -(10+) -(-5) H: 46 HP
78 Khadki 1458.20 P: 988 P PHC W -(-5) -(10+) BS H: 195 HP
4. CmCLE
79 Hippargarava 1839.02 P: 1944 P -(-5) W PO -(10+) BS H: 358 M SP
H
80 Shivkarwadi 382.08 P: 314 P -(.5) W PO -(10+) -(-5) H: 55 HP
81 Belwadi 868.14 P: 526 P -(-5) W -(-5) -(10+) -(-5) H: 79 HP
82 Salgara Divti 1820.18 P: 3008 P PHC W PO -(10+) BS H: 498 M HP
H
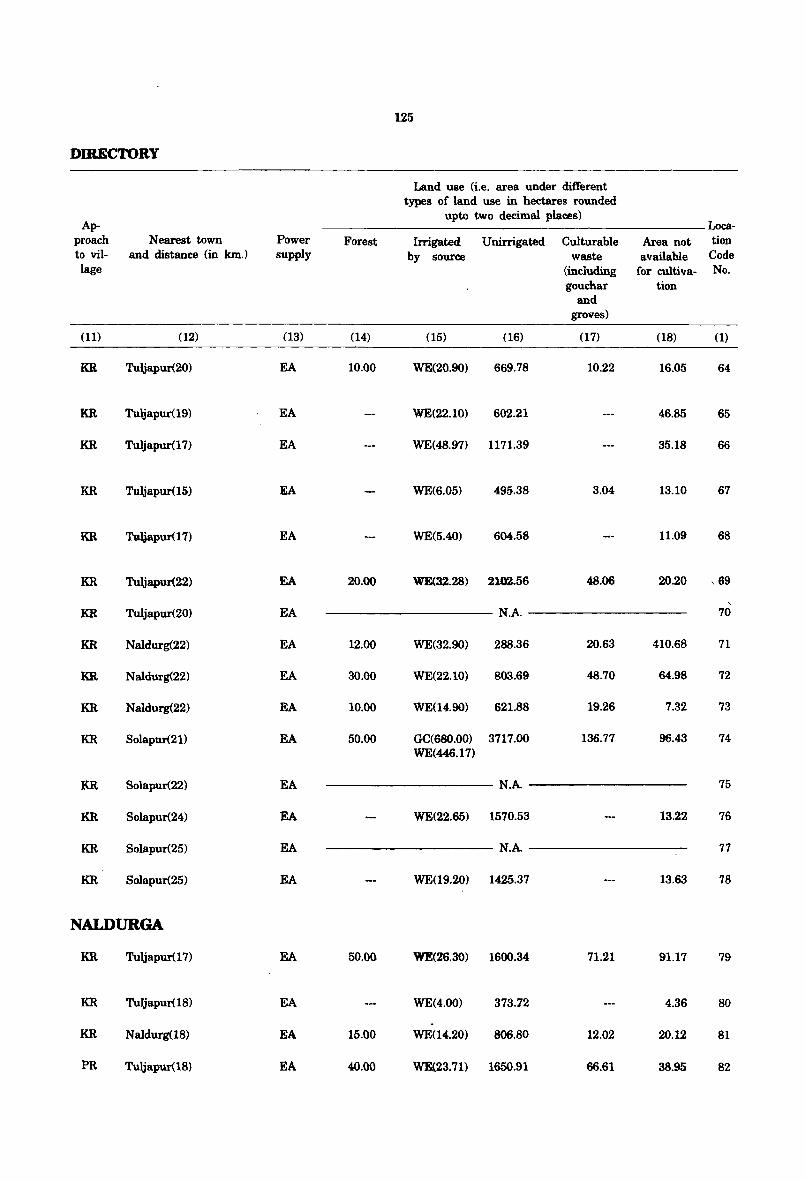
125
DIRECTORY
Land use (i.e. area under different types of land use in hectares rounded
Ap-upto two decimal places)
Loca-proach Nearest town Power Forest Irrigated Unirrigated Culturable Area not tiOD to vil- and distance (in km.) supply by source waste available Code lage (including for cultiva- No.
gouchar tiOD and
groves)
(11) (12) (13) (14) (15) (16) (17) (18) (1)
KR Tuljapur(20) EA 10.00 WE(20.90) 669.78 10.22 16.05 64
KR Tuljapur(19) EA WE(22.10) 602.21 46.85 65
KR Tuljapur(17) EA WE(48.97) 1171.39 35.18 66
KR Tuljapur(l5) EA WE(6.05) 495.38 3.04 13.10 67
KR 'lUljapur(17) EA WE(5.40) 604.58 11.09 68
K.R Tuljapur(22) EA 20.00 WE(32.28) 2102.56 48.06 20.20 ,69
, KR Tuljapur(20) EA N.A. 70
K.R Naldurg(22) EA 12.00 WE(32.90) 288.36 20.63 410.68 71
K.R Naldurg(22) EA 30.00 WE(22.10) 803.69 48.70 64.98 72
KR Naldurg(22) EA 10.00 WE(14.90) 621.88 19.26 7.32 73
KR Solapur(21) EA 50.00 GC(680.00) 3717.00 136.77 96.43 74 WE(446.17)
KR Solapur(22) EA N.A. 75
KR Solapur(24) EA WE(22.65) 1570..53 13.22 76
KR Solapur(25) EA N.A. 77
KR Solapur(25) EA WE(19.20) 1425.37 13.63 78
NALDURGA
KR Tuljapur(17) EA 50..00. WE(26.30) 1600.34 71.21 91.17 79
KR Tuljapur(18) EA WE(4.00) 373.72 4.36 80
KR Naldurg(18) EA 15.0.0. WE(14.20) 806.80. 12.0.2 20..12 81
PR Tuljapur(18) EA 40.00 WE(23.71) 1650.91 66.61 38.95 82
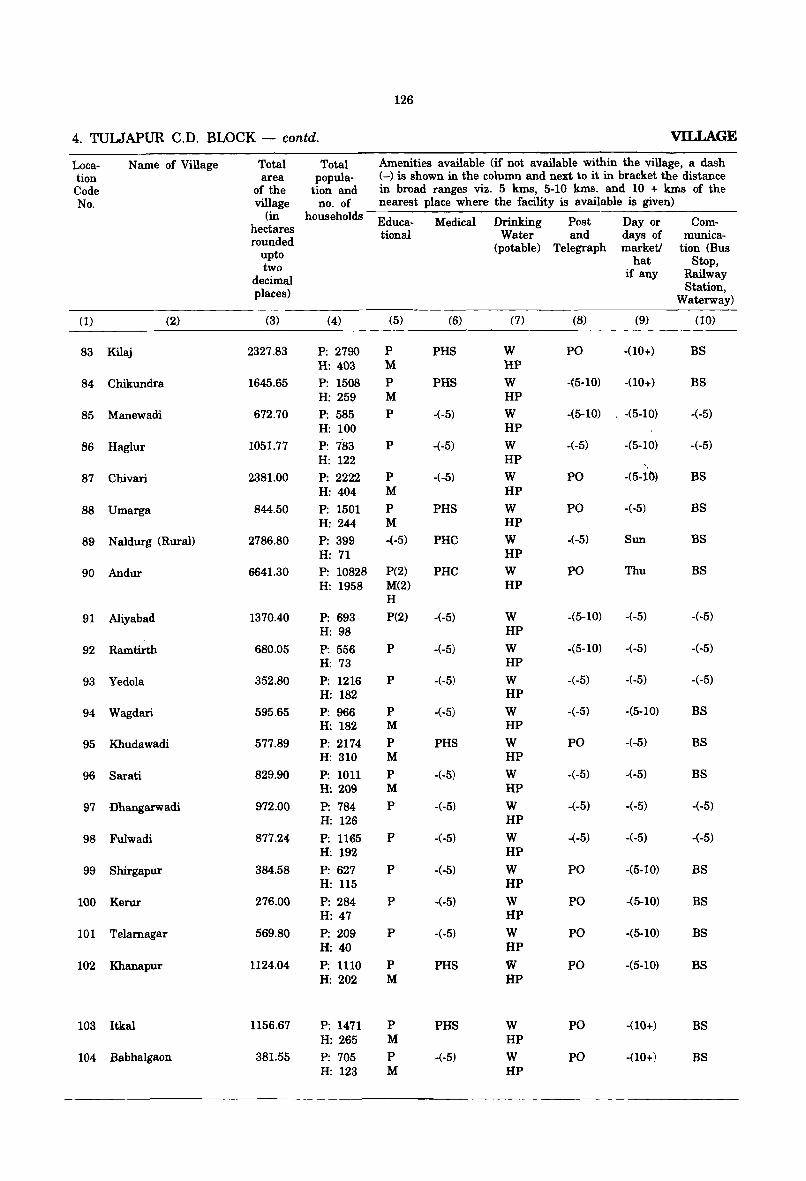
126
4. TULJAPUR C.D. BLOCK - contd. VILLAGE
Loca- Name of Village Total Total Amenities available (if not available within the village, a dash tion area popula- (-) is shown in the column and next to it in bracket the distance Code of the tion and in broad ranges viz. 5 kms, 5-10 kms. and 10 + kms of the No. village no. of nearest place where- the facility is available is given)
(in households Educa- Medical Drinking Post Day or' Com-hectares rounded tional Water and days of munica-
upto (potable) Telegraph marketl tion (Bus
two hat Stop,
decimal if any Railway
places) Station, Waterway)
(1) (2) (3) (4) (5) (6) (7) (8) (9) (10)
83 Kilaj 2327.83 P: 2790 P PHS W PO -(10+) BS H: 403 M HP
84 Chikundra 1645.65 P: 1508 P PHS W -(5-10) -(10+) BS H: 259 M HP
85 Manewadi 672.70 P: 585 P -(-5) W -(5-10) -(5-10) -(-5) H: 100 HP
86 Haglur 1051.77 P: i83 P -(-5) W -(-5) -(5-10) -(-5) H: 122 HP
87 Chivari 2381.00 P: 2222 P -(-5) W PO -(5-10) BS H: 404 M HP
88 Umarga 844.50 P: 1501 P PHS W PO -(-5) BS H: 244 M HP
89 N aldurg (Rural) 2786.80 P: 399 ..(-5) PHC W -(-5) Sun BS H: 71 HP
90 Andur 6641.30 P: 10828 P(2) PHC W PO Thu BS H: 1958 M(2) HP
H
91 Aliyabad 1370.40 P: 693 P(2) -(-5) W -(5-10) -(-5) -(-5) H: 98 HP
92 Ramtirth 680.05 P: 556 P -(-5) W -(5-10) -(-5) -(-5) H: 73 HP
93 Yedola 352.80 P: 1216 P -(-5) W -(-5) -(-5) -(-5) H: 182 HP
94 Wagdari 595.65 P: 966 P -(-5) W -(-5) -(5-10) BS H: 182 M HP
95 Khudawadi 577.89 P: 2174 P PHS W PO -(-5) BS H: 310 M HP
96 Sarati 829.90 P: 1011 P -(-5) W -(-5) -(-5) BS H: 209 M HP
97 Dhangarwadi 972.00 P: 784 P -(-5) W -(-5) -(-5) -(-5) H: 126 HP
98 Fulwadi 877.24 P: 1165 P -(-5) W -(-5) -(-5) ..(-5) H: 192 HP
99 Shirgapur 384.58 P: 627 P -(-5) W PO -(5-10) BS H: 115 HP
100 Kerur 276.00 P: 284 P -(-5) W PO -(5-10) BS H: 47 HP
101 Telamagar 569.80 P: 209 P -(-5) W PO -(5-10) BS H: 40 HP
102 Khanapur 1124.04 P: 1110 P PHS W PO -(5-10) BS H: 202 M HP
103 Itkal 1156.67 P: 1471 P PHS W PO -(10+) BS H: 265 M HP
104 Babhalgaon 381.55 P: 705 P -(-5) W PO -(10+) BS H: 123 M HP
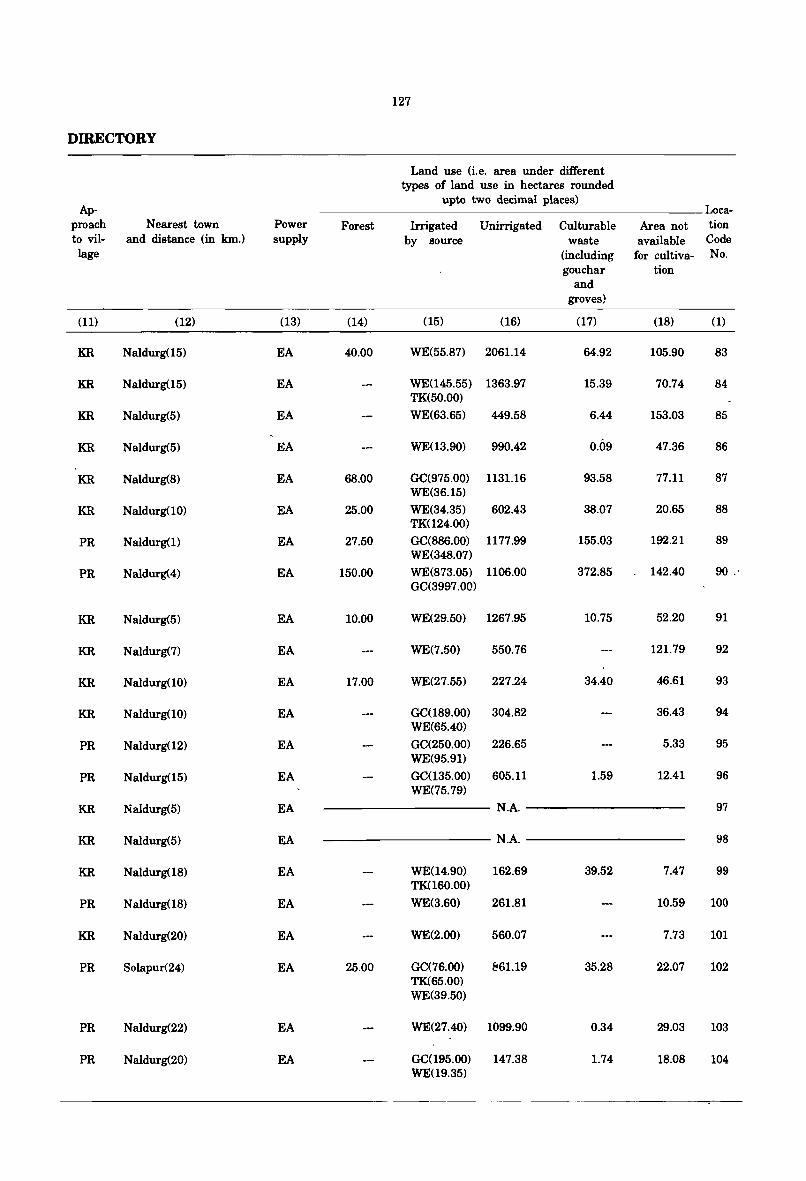
127
DIRECTORY
Land use (i.e. area under different types of land use in hectares rounded
Ap-upto two decimal places)
Loca-proach Nearest town Power Forest Irrigated Unirrigated Culturable Area not tion to vil- and distance (in km.) supply by source waste available Code lage (including for cultiva- No.
gouchar tion and
groves)
(11) (12) (13) (14) (15) (16) (17) (18) (1)
KR Naldurg(15) EA 40.00 WE(55.87) 2061.14 64.92 105.90 83
KR Naldurg(15) EA WE(145.55) 1363.97 15.39 70.74 84 TK(50.00)
KR Naldurg(5) EA WE(63.65) 449.58 6.44 153.03 85
KR Naldurg(5) EA WE(13.90) 990.42 0.09 47.36 86
KR Naldurg(8) EA 68.00 GC(975.00) 1131.16 93.58 77.11 87 WE(36.15)
KR Naldurg(10) EA 25.00 WE(34.35) 602.43 38.07 20.65 88 TK(124.00)
PR Naldurg(l) EA 27.50 GC(886.00) 1177.99 155.03 192.21 89 WE(348.07)
PR Naldurg(4) EA 150.00 WE(873.05) 1106.00 372.85 142.40 90. GC(3997.00)
KR Naldurg(5) EA 10.00 WE(29.50) 1267.95 10.75 52.20 91
KR Naldurg(7) EA WE(7.50) 550.76 121.79 92
KR Naldurg(10) EA 17.00 WE(27.55) 227.24 34.40 46.61 93
KR Naldurg(10) EA GC(189.00) 304.82 36.43 94 WE(65.40)
PR Naldurg(12) EA GC(250.00) 226.65 5.33 95 WE(95.91)
PR Naldurg(15) EA GC(135.00) 605.11 1.59 12.41 96 WE(75.79)
KR Naldurg(5) EA N.A. 97
KR Naldurg(5) EA N.A. 98
KR Naldurg(18) EA WE(14.90) 162.69 39.52 7.47 99 TK(160.00)
PR Naldurg(18) EA WE(3.60) 261.81 10.59 100
KR Naldurg(20) EA WE(2.00) 560.07 7.73 101
PR Solapur(24) EA 25.00 GC(76.00) 861.19 35.28 22.07 102 TK(65.00) WE(39.50)
PR Naldurg(22) EA WE(27.40) 1099.90 0.34 29.03 103
PR Naldurg(20) EA GC(195.00) 147.38 1.74 18.08 104 WE(19.35)
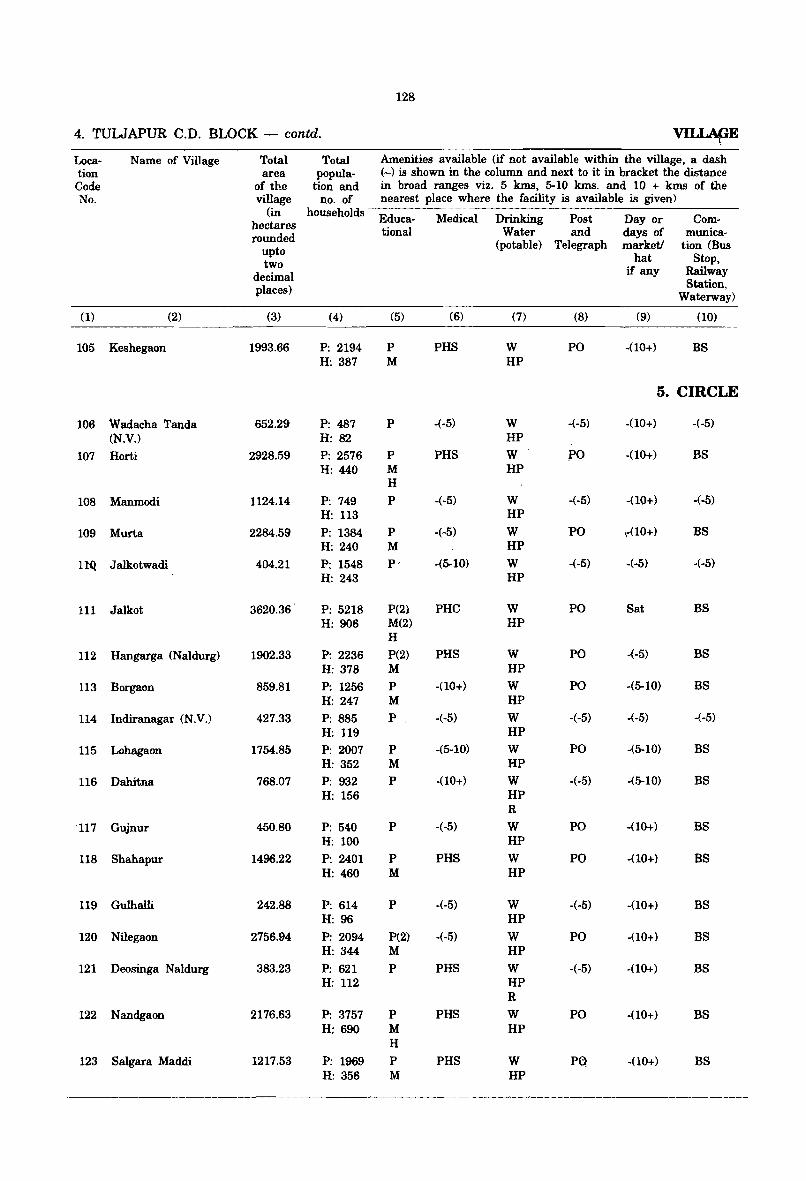
128
4. TULJAPUR C.D. BLOCK - contd. VlLLApE Loca· Name of Village Total Total Amenities available (if not available within the village, a dash tion area popula· (-) is shown in the column and next to it in bracket the distance Code of the tion and in broad ranges viz. 5 kms, 5-10 kms. and 10 + kms of the No. village no. of nearest place where the facility is available is given)
(in households Educa- Medical Drinking Post Day or Com-hectares rounded tional Water and days of munica-
upto (potable) Telegraph market! tion (Bus
two hat Stop,
decimal if any Railway
places) Station, Waterway)
(1) (2) (3) (4) (5) (6) (7) (8) (9) (10)
105 Keshegaon 1993.66 P: 2194 P PHS W PO -(10+) BS H: 387 M HP
5. CIRCLE
106 Wadacha Tanda 652.29 P: 487 P ·(-5) W ·(-5) -(10+) -(-5) (N.V.) H: 82 HP
107 Horti 2928.59 P: 2576 P PHS W fO -(10+} BS H: 440 M HP
H
108 Manmodi 1124.14 P: 749 P -(-5) W -(-5) -(10+) -(-5) H: 113 HP
109 Murta 2284.59 P: 1384 P -(-5) W PO \-(10+) BS H: 240 M HP
llQ Jalkotwadi 404.21 P: 1548 P' -(5-10) W -(-5) .(-5) -(-5) H: 243 HP
111 Jalkot 3620.36 P: 5218 P(2) PHC W PO Sat BS H: 906 M(2) HP
H
112 Hangarga (Naldurg) 1902.33 P: 2236 P(2) PHS W PO -(-5) BS H: 378 M HP
113 Borgaon 859.81 P: 1256 P -(10+) W PO -(5-10) BS H: 247 M HP
114 Indiranagar (N.V.) 427.33 P: 885 P -(-5) W -(-5) -(-5) -(-5) H: 119 HP
115 Lohagaon 1754.85 P: 2007 P -(5-10) W PO -(5-10) BS H: 352 M HP
116 Dahitna 768.07 P: 932 P -(10+) W -(-5} -(5-10} BS H: 156 HP
R
117 Gujnur 450.80 P: 540 P -(-5) W PO -(10+) BS H: 100 HP
118 Shahapur 1496.22 P: 2401 P PHS W PO -(10+) BS H: 460 M HP
119 Gulhalli 242.88 P: 614 P -(-5) W -(-5) -(10+) BS H: 96 HP
120 Nilegaon 2756.94 P: 2094 P(2) -(-5) W PO -(10+) BS H: 344 M HP
121 Deosinga Naldurg 383.23 P: 621 P PHS W -(-5) -(10+) BS H:112 HP
R
122 Nandgaon 2176.63 P: 3757 P PHS W PO -(10+) BS H: 690 M HP
H
123 Salgara Maddi 1217.53 P: 1969 P PHS W PO -(10+) BS H: 356 M HP
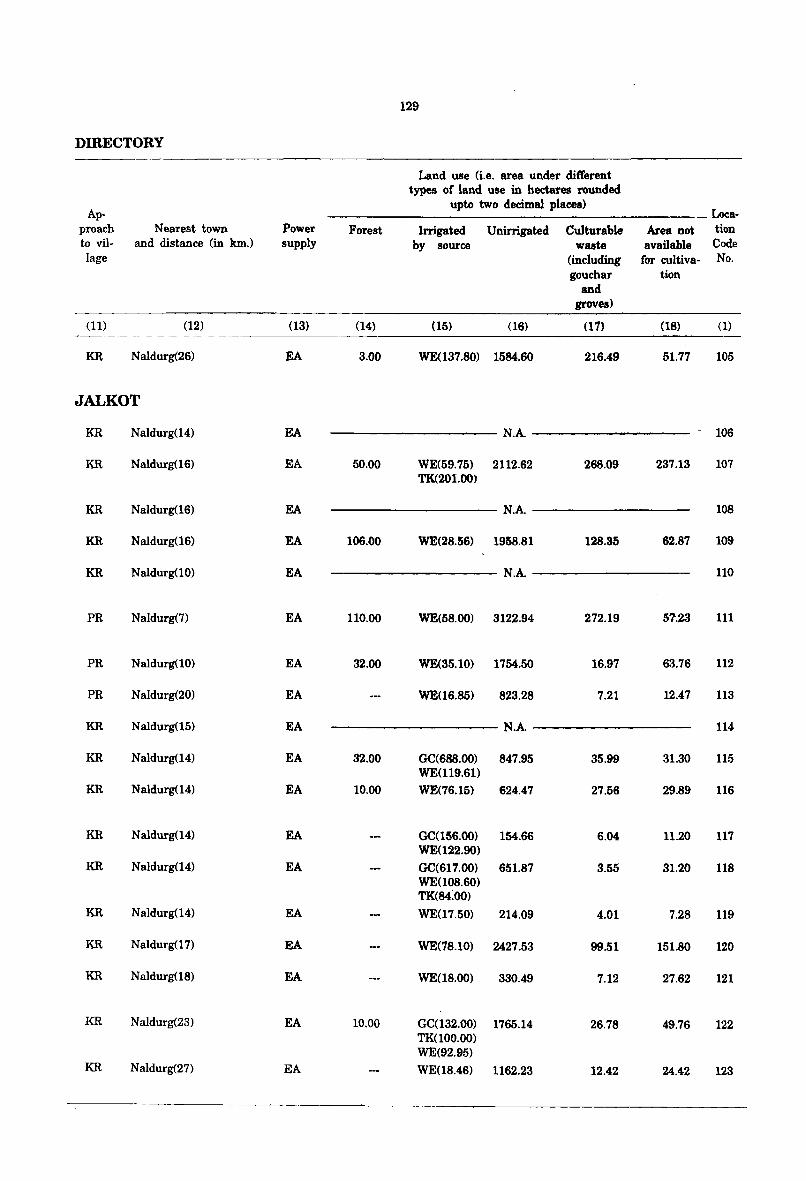
129
DIRECTORY
Land use (i.e. area under different types of land use in hectares rounded
Ap-upto two decimal places)
Loea-proach Nearest town Power Forest Irrigated Unirrigated Culturable Area Dot tion to viI- and distance (in km.) supply by source waste available Code lage (including for cultiva- No.
gouchar tion and
groves)
(11) (12) (13) (14) (15) (16) (17) (IS) (1)
KR Naldurg(26) EA 3.00 WE(137.S0) 1584.60 216.49 51.77 105
JALKOT
KR Naldurg(14) EA N.A - 106
KR Naldurg(16) EA 50.00 WE(59.75) 2112.62 268.09 237.13 107 TK(201.00}
KR Naldurg(16) EA N.A lOS
KR Naldurg(16) EA 106.00 WE(28.56) 1958.81 128.35 62.87 109
KR Naldurg(10) EA N.A 110
PR Naldurg(7) EA 110.00 WE(58.00) 3122.94 272.19 51.23 111
PR Naldurg(10) EA 32.00 WE(35.10) 1754.50 16.97 63.76 112
PR Naldurg(20) EA WE(16.85) 823.28 7.21 12.47 113
KR Naldurg(15) EA N.A 114
KR Naldurg(14) EA 32.00 GC(688.00) 847.95 35.99 31.30 115 WE(n9.61)
KR Naldurg(14) EA 10.00 WE(76.15) 624.47 27.56 29.89 116
KR Naldurg(14) EA GC(156.00) 154.66 6.04 11.20 117 WE(122.90)
KR Naldurg(14) EA GC(617.00) 651.S7 3.55 31.20 118 WE(10S.60) TK(84:00)
KR Naldurg(14) EA WE(17.50) 214.09 4.01 7.28 119
KR Naldurg(17) EA WE(78.10) 2427.53 99.51 151.S0 120
KR Naldurg(18) EA WE(18.00) 330.49 7.12 27.62 121
KR Naldurg(23) EA 10.00 GC(132.00) 1765.14 26.78 49.76 122 TK(100.00) WE(92.95)
KR Naldurg(27) EA WE(18.46) 1162.23 12.42 24.42 123
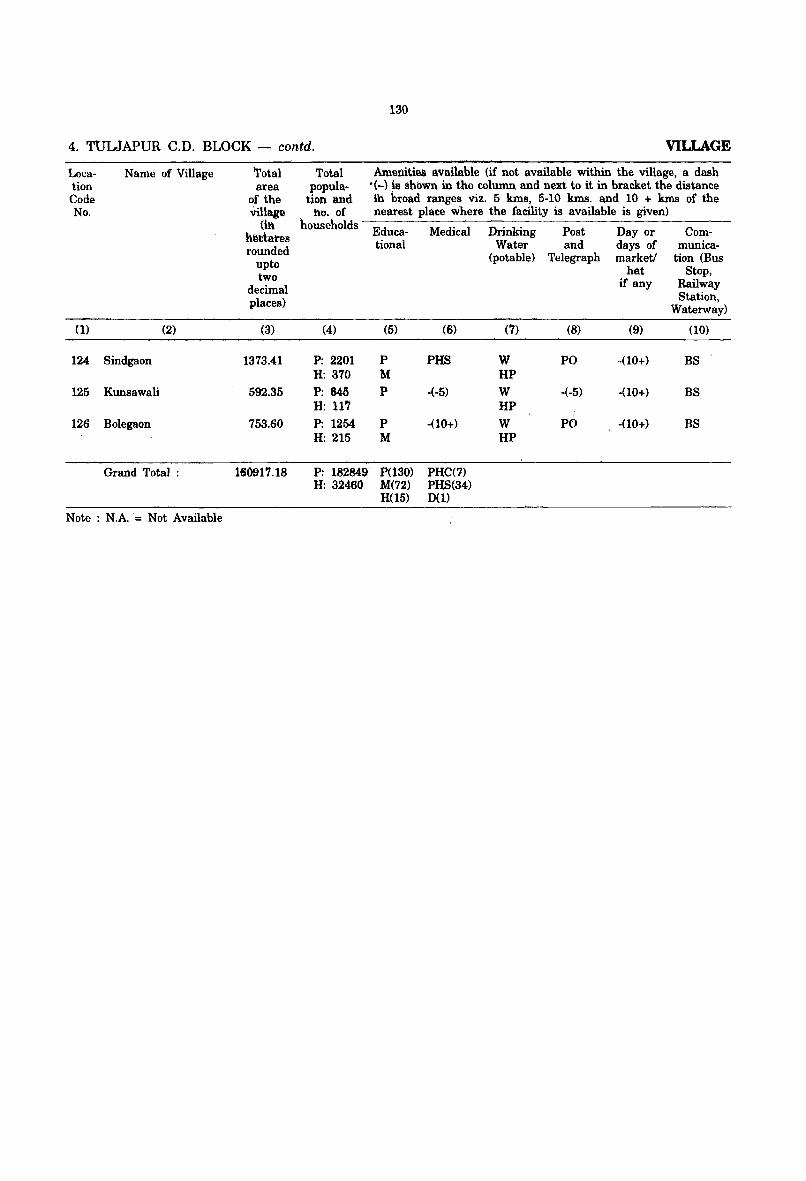
130
4. TULJAPUR C.D. BLOCK - contd. VILLAGE
Location Code No.
(1)
124
125
126
Name of Village
(2)
Sindgaon
Kunsawali
Bolegaon
Grand Total :
Note: N.A. = Not Available
Total area
of the Village
(in h~tiates rounded
upto two
decimal places)
(3)
1373.41
592.35
753.60
160917.18
Total Amenities available (if not available within the village, a dash popula- .(-) is shown in the column and next to it in bracket the distance
tion IUld iIi hroad ranges viz. 5 kms, 5-10 kms. and 10 + kms of the fin. of nearest place where the facility is available is given)
households ---,,_;::_--------'--------=-------Educa- Medical Drinking Post Day or Com-
(4)
P: 2201 H: 370 P: 845 H: 117 P: 1254 H: 215
P: 182849 H: 32460
tional Water and days of
(5) (6)
P PHS M P -(-5)
P -(10+) M
P(130) PHe(7) M(72) PHS(34) H(15) D(1)
(potable) Telegraph marketl hat
if any
(7) (8) (9)
W PO -(10+) HP W -(-5) -(10+) HP
i W PO -(10+) HP
munication (Bus
Stop. Railway Station,
Waterway)
(10)
BS
BS
BS
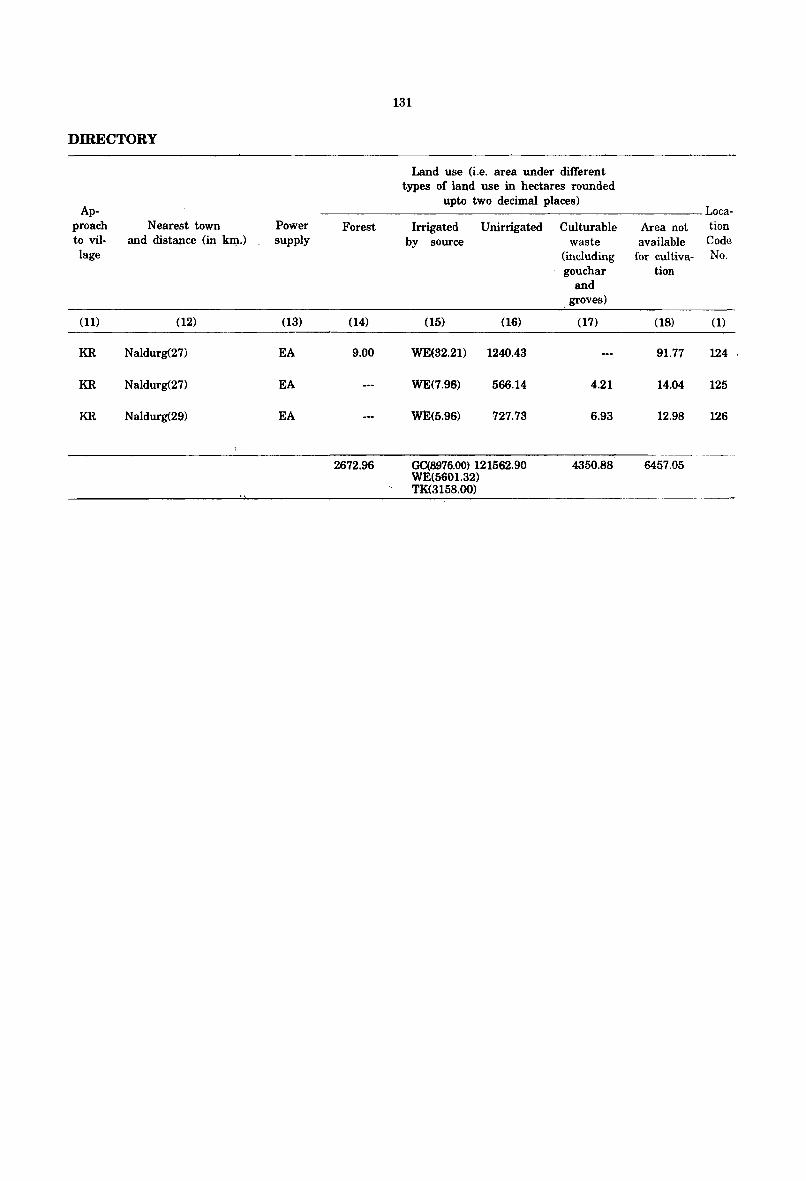
131
DIRECTORY
Land use (i.e. area under different types of land use in hectares rounded
Ap-upto two decimal places)
Loca-proach Nearest town Power Forest Irrigated Unirrigated Culturable Area not tion to vil- and distance (ill knt·) supply by source waste available Code lage (including for cultiva- No.
gouchar tion and
groves)
(11) (12) (13) (14) (15) (16) (17) (18) (1)
KR Naldurg(27) EA 9.00 WE(32.21) 1240.43 91.77 124
KR Naldurg(27) EA WE(7.96) 566.14 4.21 14.04 125
KR Naldurg(29) EA WE(5.96) '127.73 6.93 12.98 126
2672.96 GC(8976.00) 121562.90 4350.88 6457.05 WE(5601.32) TK(3158.00)

c:, \) ,
'\ C. ,
'\ '(-. ......... , I .......
/' j
"" ~ I>-
'1'\
~ c 3
·_·"...·_·_·V·.......::, ,. "
o
(/I
....
,... ~~--; ;
R£V£NUE CRCLES .tla tmml <D ANAl.A
CD J~A~A ® FARANDA
BOUNDARY. DISTRICT ... ... _._._
" TA"'SI~.. ... _._._ .. RE'IENUE CIRC~E... ... ____ _
.. VILLAGE WITH LOCATION CODE NUt.1BER .. C":Q:::; HEADQUARTERS: lAHSI~... • @ VILLAGES WITH POPULATION SIZE. BELOW 200; 200- 4991500-999; 1000 - 4999, SOOO AND ABOVE
UNINHABtlED VILLAGES WIlH LOCAtiON CODE ...
URBAN AREA WITH LOCATION CODE ..
r-----' L_Jl~_-,
.. , Wl¢.Y,g
&o-d upon ~n>IY of IndIa map WIth the permISSion of the Surveyor General of IndiO
G A
5
R ./. -MAHARASHTRA
TAHSIL PARANDA ~I DISTRICT OSMANABAO
1:> Km2 4 81(m .... I I
H
(I
Noltl-
CO. Blotk Boundary of Porondo IS Co-te,mlnus with TahSil Boundary Excluding all Statutory Town •.
Village Boundary of ~ C. No. 90 IS Not AYallable.
STATE HIGHWAY
IMPORTANT ME.TALLED ROAD ...
UNMETALLED AND OtHER ROADS ...
RIVER A NO STREAM ..
WATER FEATURES ..
5HI61
... ~ ~ ~
POSTOFFICEI TELEGRAPH OFFICE EXCLUDING RoM.S,.. POIlO
HIGHER SECONDARY SCHOOL.. S
~~~~~~:/'~~~I~~~~L~;~i~~N~I~~~~RY, ~.H'" IMPORTANT VILLAGE MARKET I HAT ... &.
© Government of Ind,o CoPVroghl.1994.
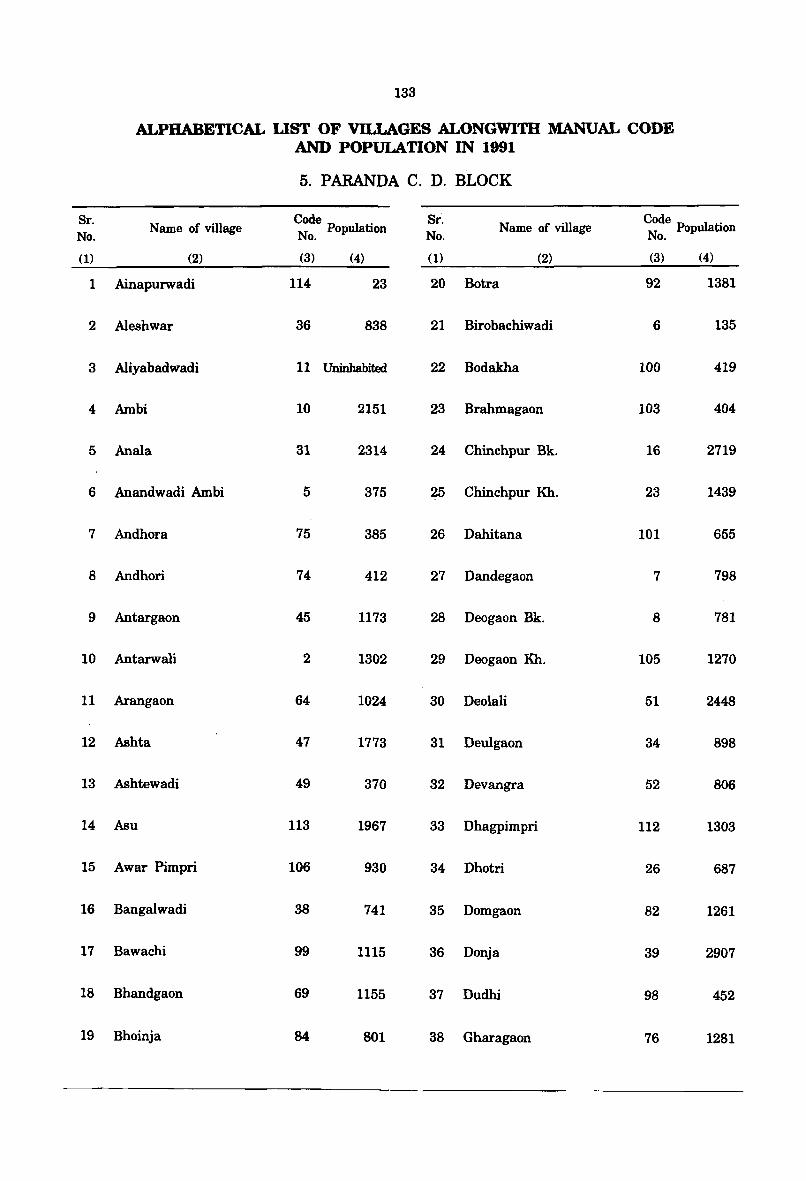
133
ALPHABETICAL LIST OF VILLAGES ALONGWITH MANUAL CODE AND POPULATION IN 1991
5. PARANDA C. D. BLOCK
Sr. Name of village Code P ul . Sr. Name of village Code P ul .
No. N op abon No. N op ation o. o.
(1) (2) (3) (4) (1) (2) (3) (4)
1 Ainapurwadi 114 23 20 Botra 92 1381
2 Aleshwar 36 838 21 Birobachiwadi 6 135
3 Aliyabadwadi 11 Uninhabited 22 Bodakha 100 419
4 Ambi 10 2151 23 Brahmagaon 103 404
5 Anala 31 2314 24 Chinchpur Bk. 16 2719
6 Anandwadi Ambi 5 375 25 Chinchpur Kh. 23 1439
7 Andhora 75 385 26 Dahitana 101 655
8 Andhori 74 412 27 Dandegaon 7 798
9 Antargaon 45 1173 28 Deogaon Bk. 8 781
10 Antarwali 2 1302 29 Deogaon Kh. 105 1270
11 Arangaon 64 1024 30 Deolali 51 2448
12 Ashta 47 1773 31 Deulgaon 34 898
13 Ashtewadi 49 370 32 Devangra 52 806
14 Asu 113 1967 33 Dhagpimpri 112 1303
15 Awar Pimpri 106 930 34 Dhotri 26 687
16 Bangalwadi 38 741 35 Domgaon 82 1261
17 Bawachi 99 1115 36 Donja 39 2907
18 Bhandgaon 69 1155 37 Dudhi 98 452
19 Bhoinja 84 801 38 Gharagaon 76 1281
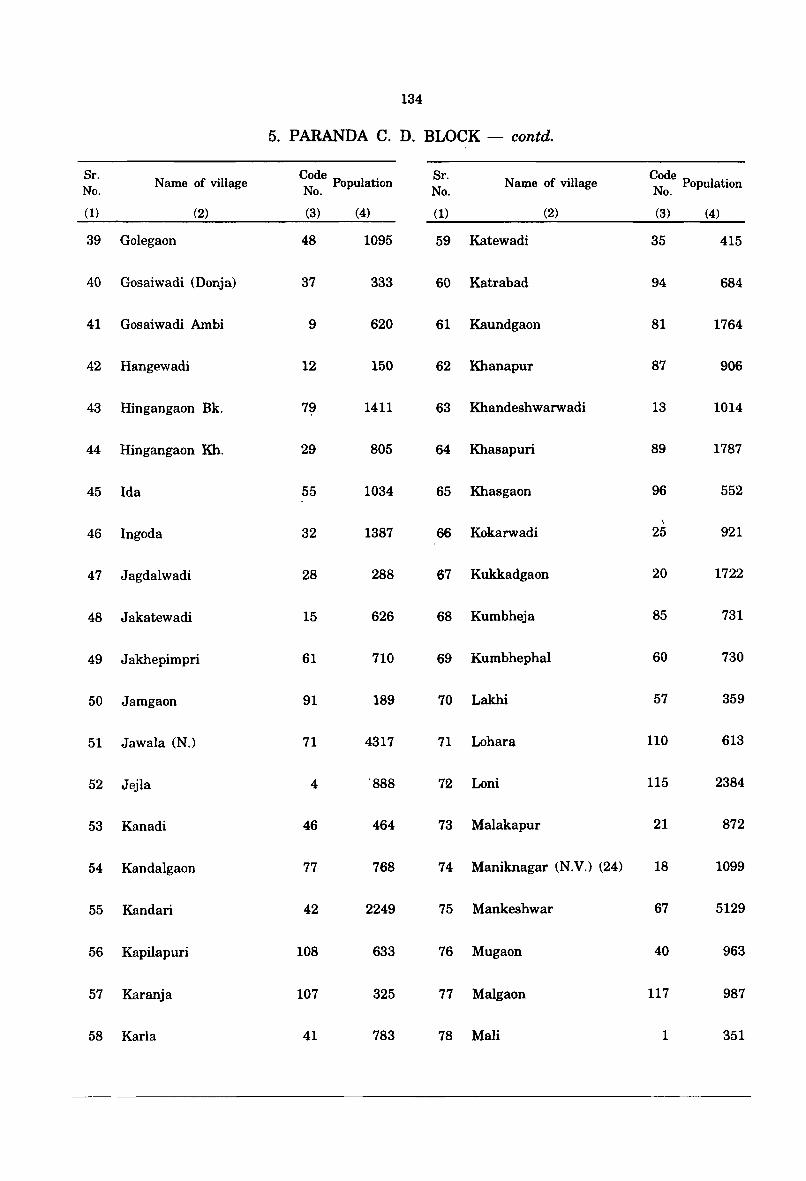
134
5. PARANDA C. D. BLOCK - contd.
Sr. Name of village
Code . Sr. Name of village
Code . No.
N Population No.
N PopulatIOn o. o.
(1) (2) (3) (4) (1) (2) (3) (4)
39 Golegaon 48 1095 59 Katewadi 35 415
40 Gosaiwadi (Donja) 37 333 60 Katrabad 94 684
41 Gosaiwadi Ambi 9 620 61 Kaundgaon 81 1764
42 Hangewadi 12 150 62 Khanapur 87 906
43 Hingangaon Bk. 79 1411 63 Khandeshwarwadi 13 1014
44 Hingangaon Kh. 29 805 64 Khasapuri 89 1787
45 Ida 55 1034 65 Khasgaon 96 552
\
46 Ingoda 32 1387 66 Kokarwadi 25 921
47 Jagdalwadi 28 288 67 Kukkadgaon 20 1722
48 Jakatewadi 15 626 68 Kumbheja 85 731
49 Jakhepimpri 61 710 69 Kumbhephal 60 730
50 Jamgaon 91 189 70 Lakhi 57 359
51 Jawala (N.) 71 4317 71 Lohars 110 613
52 Jejla 4 '888 72 Loni 115 2384
53 Kanadi 46 464 73 Malakapur 21 872
54 Kandalgaon 77 768 74 Maniknagar (N.V.) (24) 18 1099
55 Kandari 42 2249 75 Mankeshwar 67 5129
56 Kapilapuri 108 633 76 Mugaon 40 963
57 Karanja 107 325 77 Malgaon 117 987
58 Karla 41 783 78 Mali 1 351
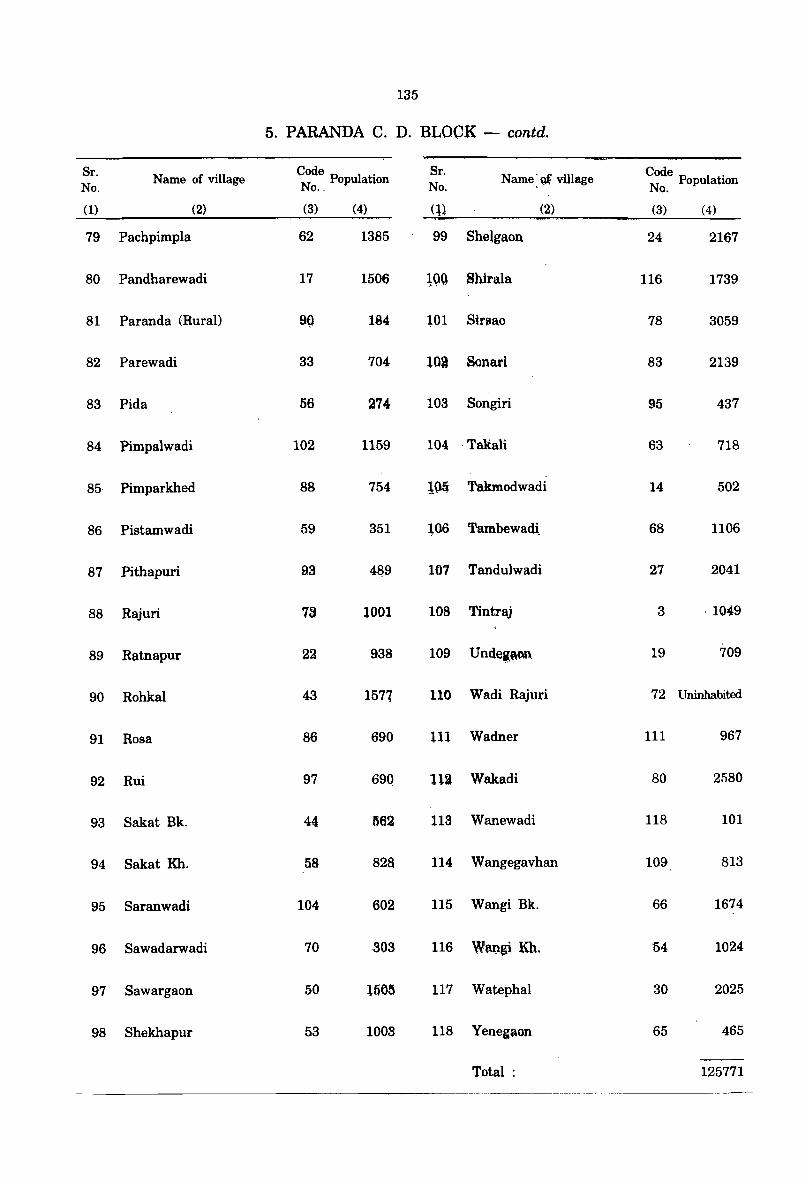
135
5. PARANDA C. D. BLOCK ~ contd.
Sr. Name of village Code P ul . Sr.
Name: Qf village Code Pl' No. No." op atlon No. N opu atlon o.
(1) (2) (3) (4) (l), (2) (3) (4)
79 Pachpimpla 62 1385 99 Shelgaon 24 2167
80 Pandharewadi 17 1506 lQQ ShiraI a 116 1739
81 Paranda (Rural) 9@ 184 lOl Sinlao 78 3059
82 Parewadi 33 704 lOa Sonad 83 2139
83 Pida 56 274 103 Songiri 95 437
84 Pimpalwadi 102 1159 104 ' Takali 63 718
85 Pimparkhed 88 754 lOti Takmodwadi 14 502
86 Pistamwadi 59 351 ~06 Tambewad~ 68 1106
87 Pithapuri 93 4a9 107 Tandulwadi 27 2041
88 Rajuri 73 1001 108 Tintraj 3 ·1049
89 Ratnapur 22 938 109 UndeiftM 19 709
90 Rohkal 43 1577 110 Wadi Rajuri 72 Uninhabited
91 Rosa 86 690 111 Wadner 111 967
92 Rui 97 69Q ni Wakadi 80 2580
93 Sakat Bk. 44 1562 113 Wanewadi 118 101
94 Sakat Kh. 58 828 114 Wangegavhan 109 813
95 Saranwadi 104 602 115 Wangi Bk. 66 1674
96 Sawadarwadi 70 ,303 116 W~gj Kh. "54 1024
97 Sawargaon 50 1565 117 Watephal 30 2025
98 Shekhapur 53 1003 118 Yenegaon 65 465
Total: 125771
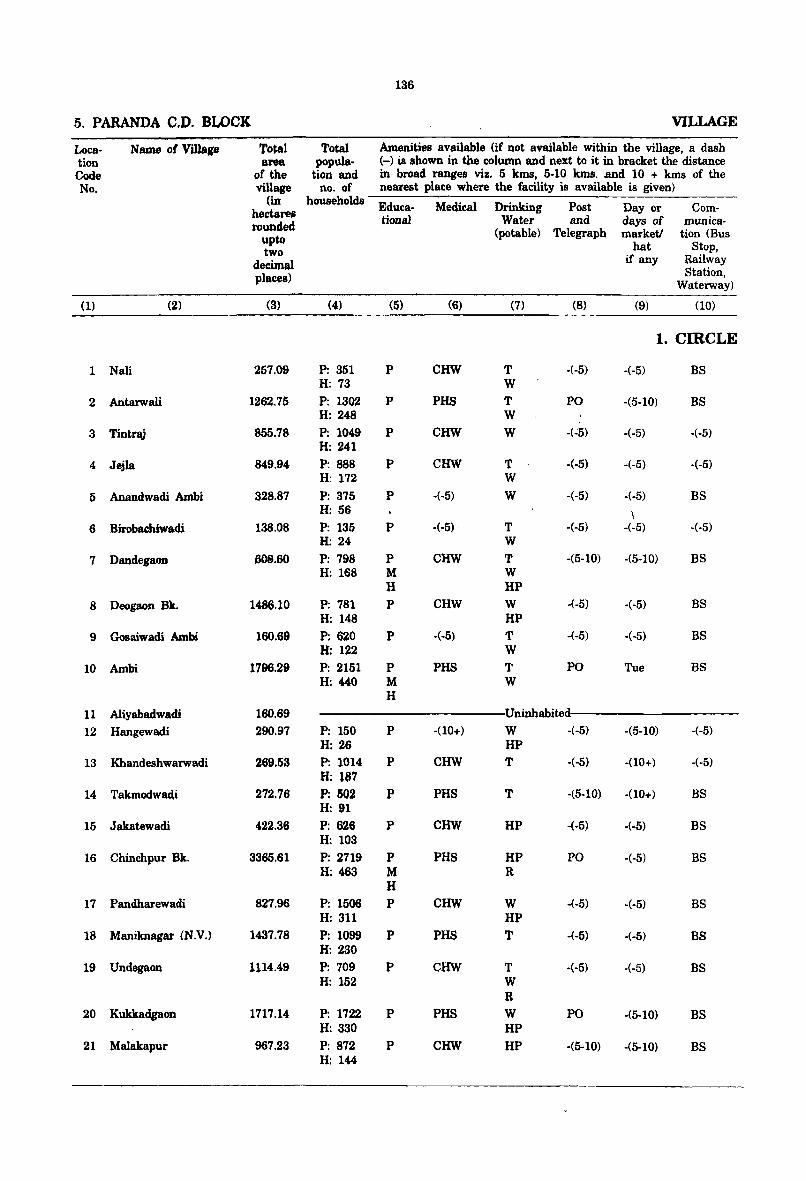
136
5. PARANDA C.D. BWCK VILLAGE
Loea- Name of Villa,. 'l'o~l Total Amenities available (if not available within the village, a dash tion area popula- (-) is shown in the column and next to it in bracket the distance Code of the tion and in broad ranges viz. 5 kms, 5-10 luns. and 10 + luns of the No. village no. of nearest place where the facility is available is given)
(in households Educa- Medical Drinking Post Day or Com-bectarell rounded
tiona) Water and days of munica-
upto (potable) Telegraph marketl tion (Bus
two hat Stop,
decimal if any Railway
places) Station, Waterway)
(1) (2) (3) (4) (5) (6) (7) (8) (9) (10)
1. CIRCLE
1 Nali 257.09 P: 351 P CHW T -(-5) -(-5) BS H: 73 W
2 Antarwali 1262.75 P: 1302 P PHS T PO -(5-10) BS H: 248 W
3 TintriV 855.78 P: 1049 P CHW W -(..'5) -(-5) -(-5) H: 241
4 Jejla 849.94 P: 888 P CHW T -(-5) -(-5) -(-5) H: 172 W
5 Anandwadi Ambi 328.87 P: 375 P -(-5) W -(-5) -(-5) BS H: 56 \
6 Birobaehiwadi 138.08 P: 135 P -(-5) .. T -(-5) -(-5) -(-5) H: 24 W
7 Dandegaon 608.60 p: 798 P CHW T -(5-10) -(5-10) BS H: 168 M W
H HP
8 Deogaon Bk. 1486.10 P: 781 P CHW W -(-5) -(-5) BS H: 148 HP
9 Gosaiwadi Ambi 160.69 P: 620 P -(-5) T -(-5) -(-5) BS H: 122 W
10 Ambi 1796.29 P: 2151 P PHS T PO Tue BS H: 440 M W
H
11 Aliyabadwadi 160.69 Uninhabited
12 Hangewadi 290.97 P: 150 P -(10+) W -(-5) -(5-10) -(-5) H: 26 HP
13 Khandeshwarwadi 269.53 P: 1014 P CHW T -(-5) -(10+) -( -5)
H: 187 14 Takmodwadi 272.76 P: 502 P PHS T -(5-10) -(10+) BS
H: 91
15 Jakatewadi 422.36 P; 626 P CHW HP -(-5) -(-5) BS H: 103
16 Chinchpur Bk. 3365.61 P: 2719 P PHS HP PO -(-5) BS H: 463 M R
H 17 Pandharewadi 827.96 P: 1506 P CHW W -(-5) -(-5) BS
H: 311 HP 18 Maniknagar (N.V.) 1437.78 P: 1099 P PHS T -(-5) -(-5) BS
H: 230
19 Undegaon 1114.49 P: 709 P CHW T -(-5) -(-5) BS H: 152 W
R 20 Kukkadgaon 1717.14 P: 1722 P PHS W PO -(5-10) BS
H: 330 HP
21 Malakapur 967.23 P: 872 P CHW HP -(5-10) -(5-10) BS H: 144
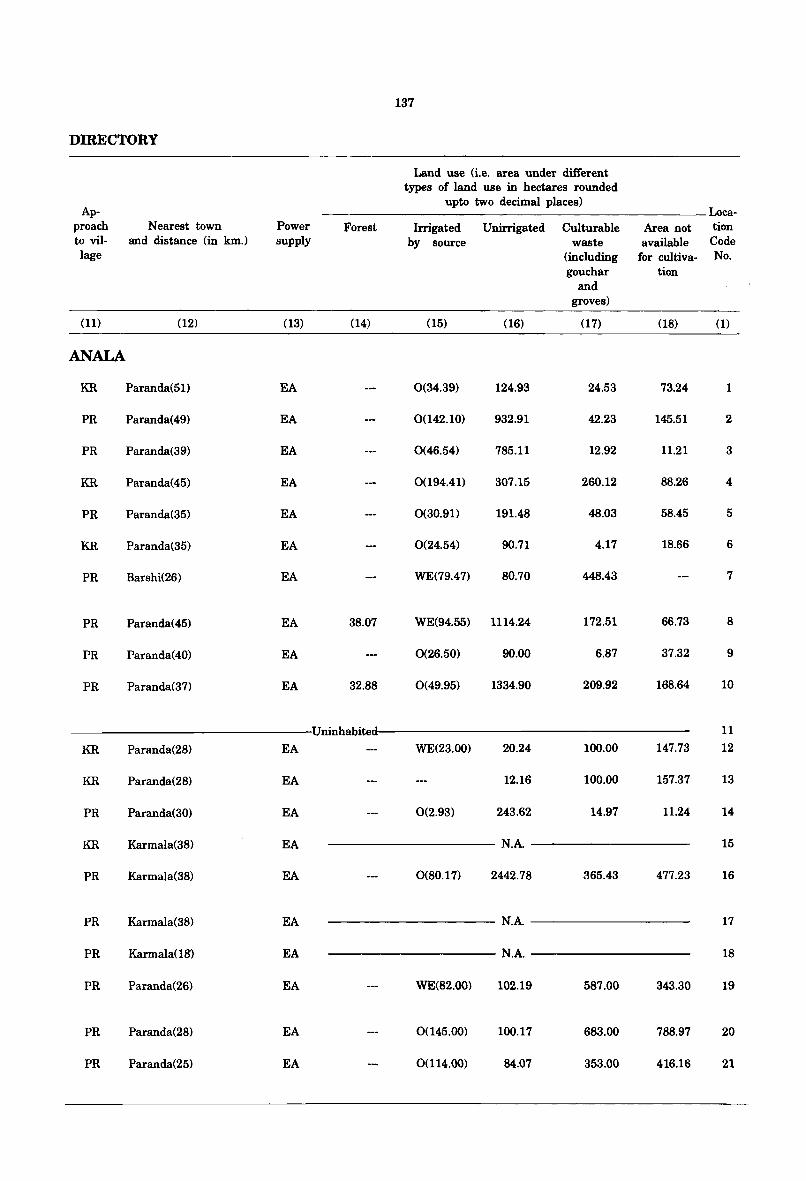
137
DffiECTORY
Land use (i.e. area under different types of land use in hectares rounded
Ap-upto two decimal places)
Loca-proach Nearest town Power Forest Irrigated Unirrigated Culturable Area not tion to vil- and distance (in km.) supply by source waste available Code lage (including for cultiva- No.
gouchar tion and
groves)
(11) (12) (13) (14) (15) (16) (17) (18) (1)
ANALA
KR Paranda(51) EA 0(34.39) 124.93 24.53 73.24 1
PR Paranda(49) EA 0(142.10) 932.91 42.23 145.51 2
PR Paranda(39) EA 0(46.54) 785.11 12.92 11.21 3
KR Paranda(45) EA 0(194.41) 307.15 260.12 88.26 4
PR Paranda(35) EA 0(30.91) 191.48 48.03 58.45 5
KR Paranda(35) EA 0(24.54) 90.71 4.17 18.66 6
PR Barshi(26) EA WE(79.47) 80.70 448.43 7
PR Paranda(45) EA 38.07 WE(94.55) 1114.24 172.51 66.73 8
PR Paranda(40) EA 0(26.50) 90.00 6.87 37.32 9
PR Paranda(37) EA 32.88 0(49.95) 1334.90 209.92 168.64 10
Uninhabite 11
KR Paranda(28) EA WE(23.00) 20.24 100.00 147.73 12
KR Paranda(28) EA 12.16 100.00 157.37 13
PR Paranda(30) EA 0(2.93) 243.62 14.97 11.24 14
KR Karmala(38) EA N.A 15
PR Karmala(38) EA 0(80.17) 2442.78 365.43 477.23 16
PR Karmala(38) EA N.A 17
PR Karmala(18) EA N.A 18
PR Paranda(26) EA WE(82.00) 102.19 587.00 343.30 19
PR Paranda(28) EA 0(145.00) 100.17 683.00 788.97 20
PR Paranda(25) EA 0(114.00) 84.07 353.00 416.16 21
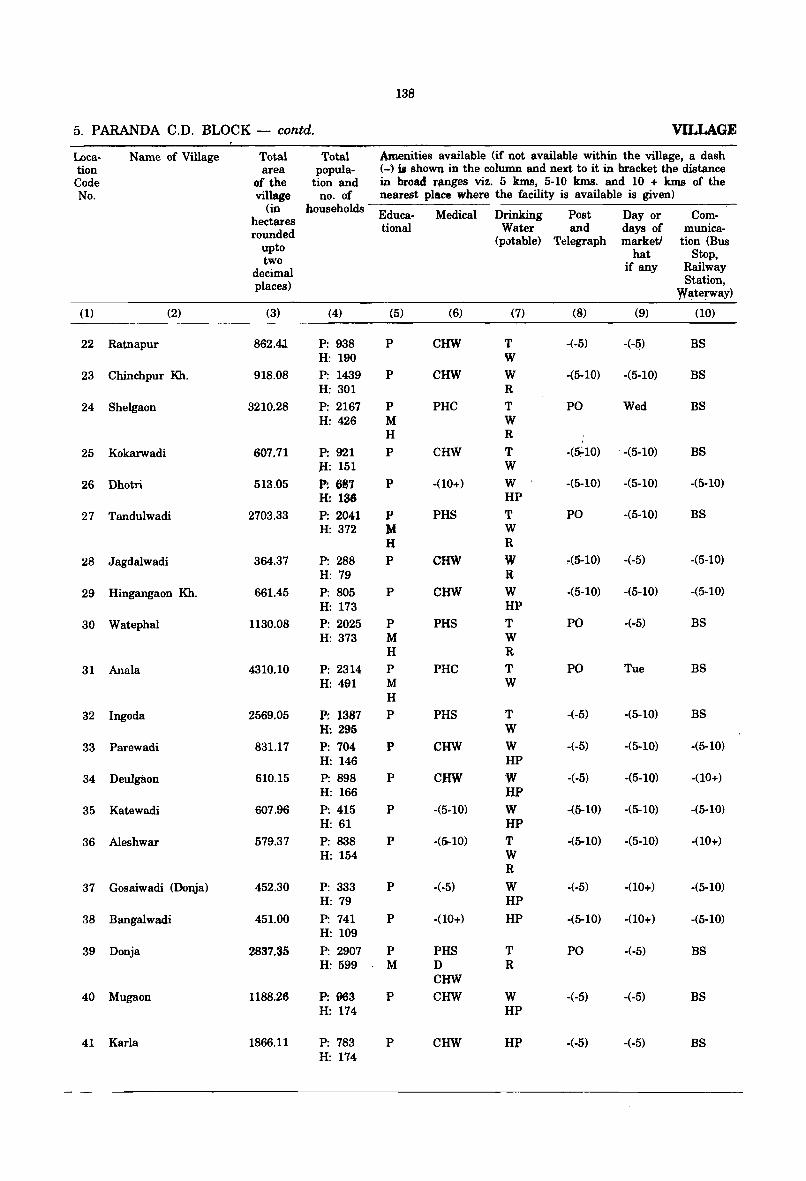
138
5. PARANDA C.D. BLOCK - contd. VILLAGE
Loca- Name of Village Total Total Amenities available (if not available within the village, a dash tion area popula- (-) u shown in the column and next to it in bracket the distance Code of the tion and in broad nmges viz. 5 kms, 5-10 kms. and 10 + kms of the No. village no. of nearest place where the facility is available is given)
(in households Educa- Medical Drinking Post Day or Com-hectares rounded tional Water and days of munica-
upto (potable) Telegraph marketl tion (Bus
two hat Stop,
decimal if any Railway
places) Station, Waterway)
(1) (2) (3) (4) (5) (6) (7) (8) (9) (10)
22 Ratnapur 862.4J. P: 938 P CHW T -(·5) +f!) BS H: 190 W
23 Chinchpur Kh. 918.08 P: 1439 P CHW W -(5·10) ·(5-10) BS H: 301 R
24 Shelgaon 3210.28 P: 2167 P PHC T PO Wed BS H: 426 M W
H R
25 Kokarwadi 607.71 P: 921 P CHW T ·(5;-10) , ·(5-10) BS 1I: 151 W
26 Dhotri 513.05 P: 681 P -(10+) W ·(5-10) ·(5-10) -(5·10) H: 136 HP
27 Tandulwadi 2703.33 P: 2041 P PHS T PO ·(5·10) BS H: 372 M W
H R
:.!8 Jagdalwadi 364.37 P: 288 P CHW W ~(5-10) ·(·5) -(5-10) H: 79 R
29 Hingangaon Kh. 661.45 P: 805 P CHW W ·(5·10) -(5-10) -(5·10) H: 173 HP
30 Watephal 1130.08 P: 2025 P PHS T PO ·(-5) BS H: 373 M W
H R
31 Anala 4310.10 P: 2314 P PHC T PO Tue BS H: 491 M W
H
32 Ingoda 2569.05 P; 1387 P PHS T ·(·5) ·(5-10) BS H: 295 W
33 Parewadi 831.17 P: 704 P CHW W -(-5) -(5-10) ·(5-10) H: 146 HP
34 Deulgaon 610.15 P: 898 P CHW W -(·5) ·(5·10) ·(10+) H: 166 HP
35 Katewadi 607.96 P: 415 P ·(5·10) W ·(5-10) ·(5-10) -(5·10) H: 61 HP
36 Aleshwar 579.37 P: 838 P ·(5-10) T ·(5-10) ·(5·10) -(10+) H: 154 W
R
37 Gosaiwadi (Donja) 452.30 P: 333 P ·(·5) W ·(·5) ·(10+) ·(5-10) H: 79 HP
38 Bangalwadi 451.00 P: 741 P ·(10+) HP ·(5-10) -(10+) -(5-10) H: 109
39 Donja 2837.35 P: 2907 P PHS T PO ·(·5) BS H: 599 M D R
CHW
40 Mugaon 1188.26 P: 963 P CHW W -(-5) ·(·5) BS H: 174 HP
41 Karla 1866.11 P: 783 P CHW HP ·(·5) -(·5) BS H: 174
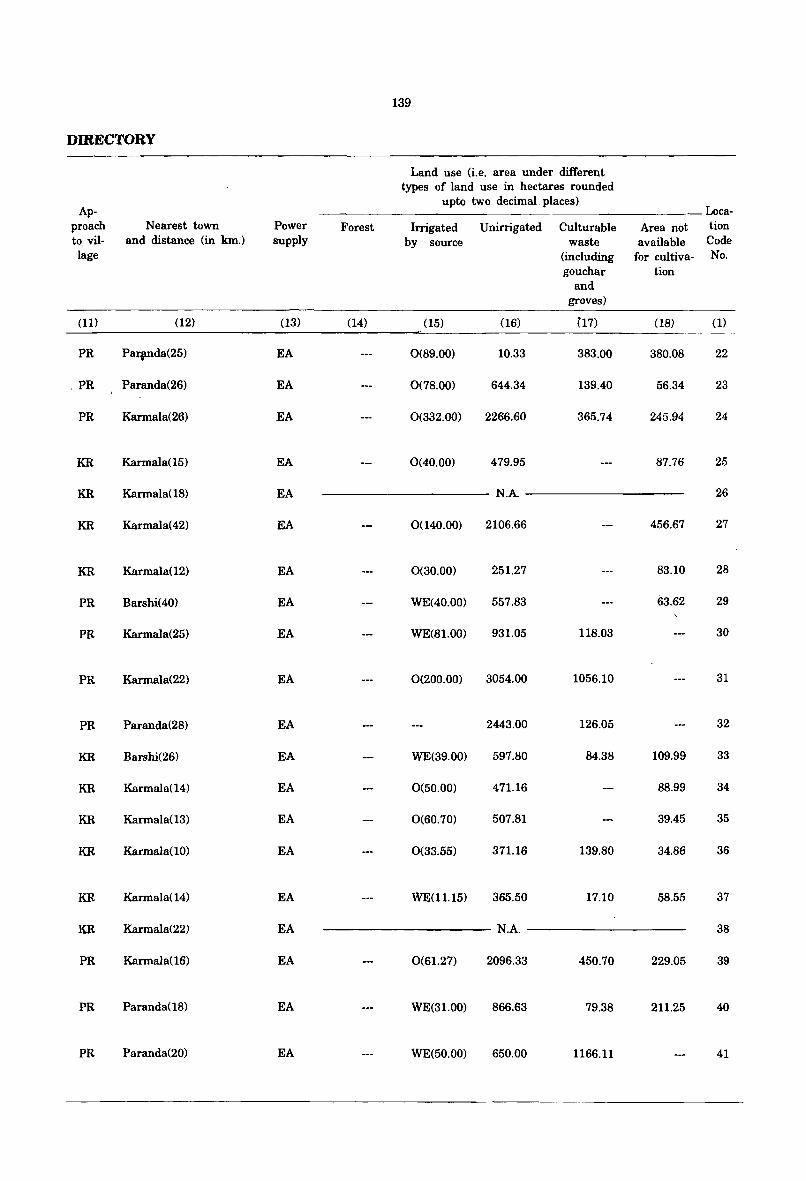
139
DIRECTORY
Land use (i.e. area under different types of land use in hectares rounded
Ap-upto two decimal. places)
Loca-proach Nearest town Power Forest Irrigated Unirrigated Culturable Area not tion to viI- and distance (in km.) supply by source waste available Code lage (including for cultiva- No.
gouchar tion and
groves)
(11) (12) (13) (14) (15) (16) {17) (18) (l)
PR Par~da(25) EA 0(89.00) 10.33 383.00 380.08 22
. PR Paranda(26) EA 0(78.00) 644.34 139.40 56.34 23
PR Karmala(26) EA 0(332.00) 2266.60 365.74 245.94 24
KR Karmala(15) EA 0(40.00) 479.95 87.76 25
KR Karmala(18) ~A N.A. 26
KR Karmala(42) EA 0(140.00) 2106.66 456.67 27
KR Karmala( 12) EA 0(30.00) 251.27 83.10 28
PR Barshi(40) EA WE(40.00) 557.83 63.62 29
PR Karmala(25) EA WE(Sl.00) 931.05 118.03 30
PR Karmala(22) EA 0(200.00) 3054.00 1056.10 31
PR Paranda(28) EA 2443.00 126.05 32
KR Barshi(26) EA WE(39.00) 597.80 84.38 109.99 33
KR Karmala(14) EA 0(50.00) 471.16 88.99 34
KR Karmala(13) EA 0(60.70) 507.81 39.45 35
KR Karmala(10) EA 0(33.55) 371.16 139.80 34.86 36
KR Karmala(14) EA WE(11.15) 365.50 17.10 58.55 37
KR Karmala(22) EA N.A. 38
PR Karmala(16) EA 0(61.27) 2096.33 450.70 229.05 39
PR Paranda(18) EA WE(31.DO) 866.63 79.38 211.25 40
PR Paranda(20) EA WE(50.00) 650.00 1166.11 41
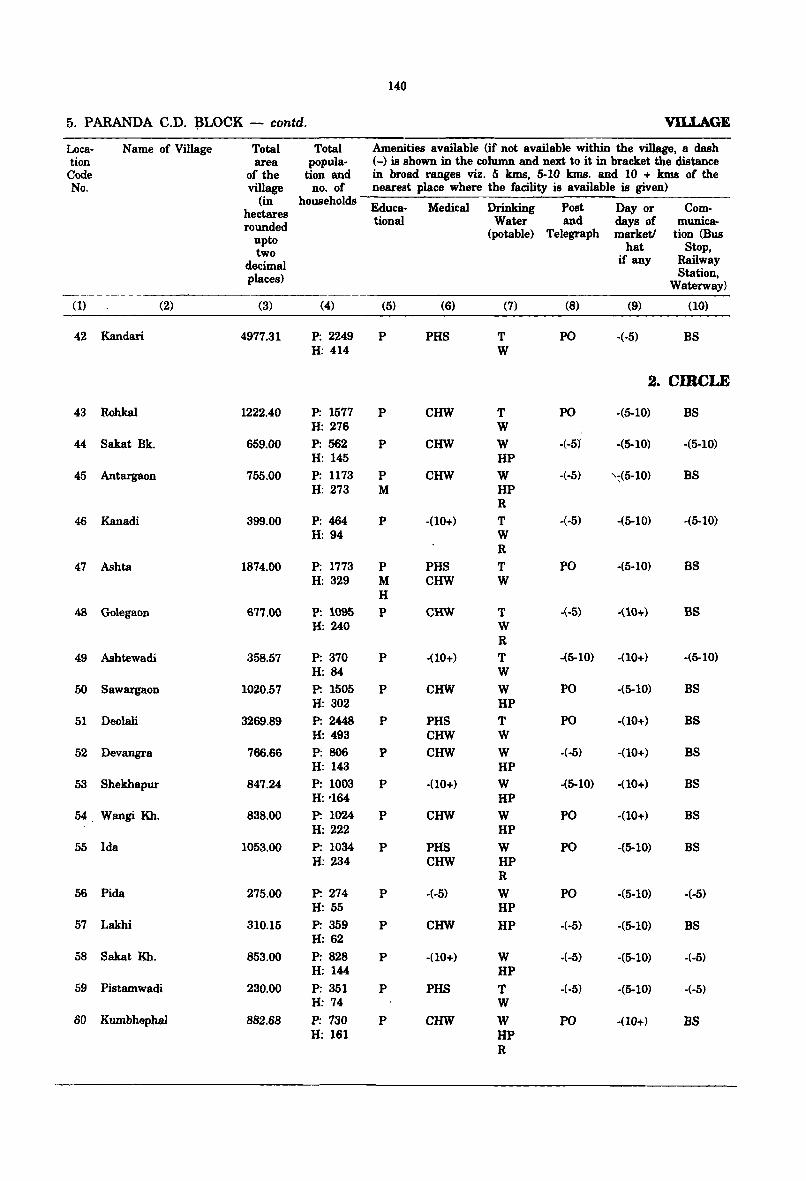
140
5. PARANDA C.D. ~LOCK - contd. VILLAGE
Loca- Name of Village Total Total Amenities available (if not available within the village, a dash tion area popula· (-) is shown in the column and next to it in bracket the distance
Code of the tion and in broad ranges viz. 5 kms, 5·10 kms. and 10 + kms of the No. village no. of nearest place where the facility is available is given)
(in households Educa· Medical Drinking Post Day or Com-hectares
rounded tional Water and days of munica·
upto (potable) Telegraph marketl tion (Bus
two hat Stop,
decimal if any Railway
places) Station, Waterway}
(1) (2) (3) (4) (5) (6) (7) (8) (9) (10)
42 Kandari 4977.31 P: 2249 P PHS T PO -(·5) BS H: 414 W
2. CIRCLE
43 Robkal 1222.40 P: 1577 P CHW T PO ·(5-10) BS H: 276 W
44 Sakat Bk. 659.00 P: 562 P CHW W ·(·5j ~(5-10) ·(5·10) H: 145 HP
45 Antargaon 755.00 P: 1173 P CHW W ·(·5) '~(5·10) BS H: 273 M HP
R
46 Kanadi 399.00 P: 464 P -(10+) T ·(·5) ·(5-lO) ·(5-10) H: 94 W
R 47 Ashta 1874.00 P: 1773 P PHS T PO ·(5·10) BS
H: 329 M CHW W H
48 Golegaon 677.00 P: 1095 P CHW T -(·5) ·(10+) BS H: 240 W
R 49 Ashtewadi 358.57 P: 370 P -(10+) T -(5-10) -(10+) -(5-10)
H: 84 W 50 Sawargaon 1020.57 P: 1505 P CHW W PO -(5-10) BS
H: 302 HP 51 Deolali 3269.89 P: 2448 P PHS T PO ·(10+) BS
H: 493 CHW W 52 Devangra 766.66 P: 806 P CHW W ·(·5) ·(10+) BS
H: 143 HP 53 Shekbapur 847.24 P: 1003 P ·(10+) W ·(5-10) ·(10+) BS
H: '164 HP 54 Wangi Kh. 838.00 P: 1024 P CHW W PO ·(10+) BS
H: 222 HP 55 Ida 1053.00 P: 1034 P PHS W PO ·(5-10) BS
H: 234 CHW HP R
56 Pida 275.00 P: 274 P ·(·5) W PO ·(5·10) ·(-5) H: 55 HP
57 Lakhi 310.15 P: 359 P CHW HP -(-5) ·(5-10) BS H: 62
58 Sakat Kh. 853.00 P: 828 P ·(10+) W ·(·5) ·(5-10) ·(·5) H: 144 HP
59 Pistamwadi 230.00 P: 351 P PHS T ·(-5) ·(5-10) ·(·5) H: 74 W
60 Kumbhephal 882.68 P: 730 P CHW W PO ·(10+) BS H: 161 HP
R
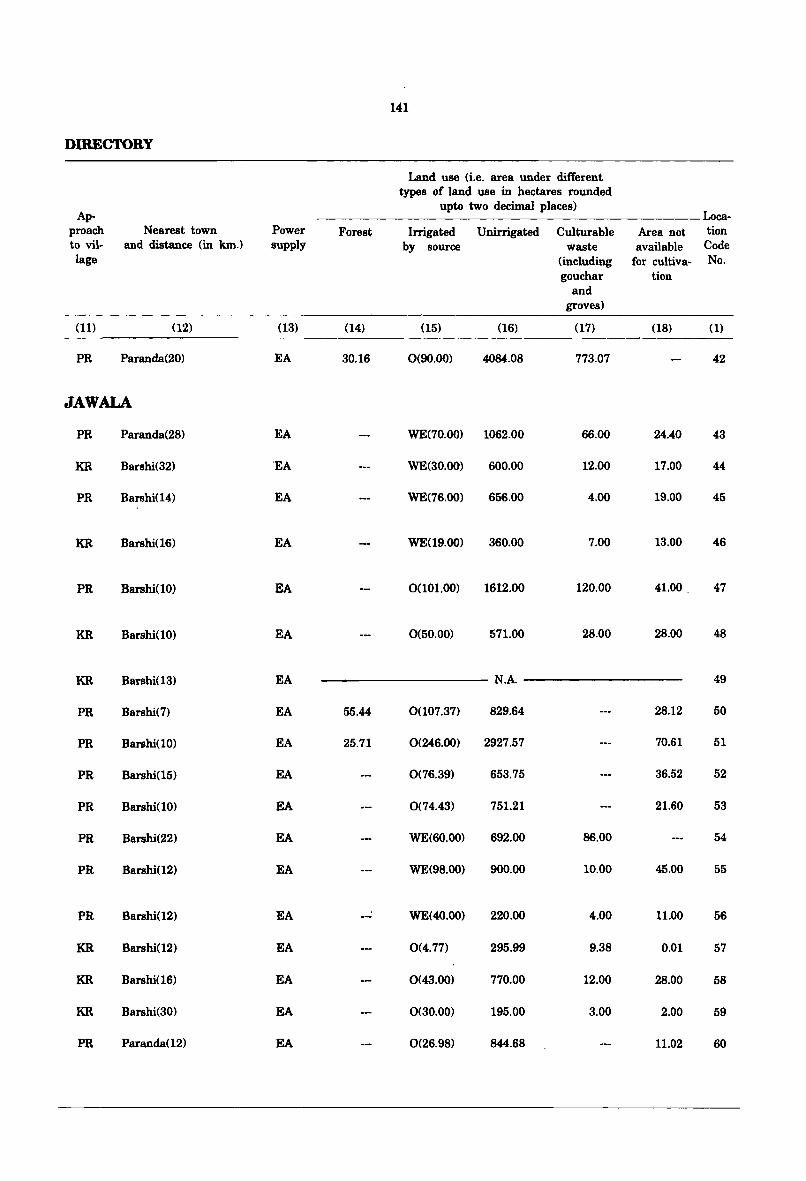
141
DIRECTORY
Land use (i.e. area under different types of land use in hectares rounded
Ap-upto two decimal places)
Loca-proach Nearest town Power Forest Irrigated Unirrigated Culturable Area not tion to vil- and distance (in km.) supply by source waste available Code lage (including for cultiva- No.
gouchar tion and
groves)
(11) (12) (13) (14) (15) (16) (17) (18) (1)
PR Paranda(20) EA 30.16 0(90.00) 4084.08 773.07 42
JAWALA
PR Paranda(28) EA WE(70.00) 1062.00 66.00 24.40 43
KR Barshi(32) 'EA WE(30.00) 600.00 12.00 17.00 44
PR Barshi(14) EA WE(76.00) 656.00 4.00 19.00 45
KR Barshi(16) EA WE(19.00) 360.00 7.00 13.00 46
PR Barshi(10) EA 0(101.00) 1612.00 120.00 41.00, 47
KR Barshi(10) EA 0(50.00) 571.00 28.00 28.00 48
KR Barshi(13) EA N.A. 49
PR Barshi(7) EA 55.44 0(107.37) 829.64 28.12 50
PR Barshi(10) EA 25.71 0(246.00) 2927.57 70.61 51
PR Barshi(15) EA 0(76.39) 653.75 36.52 52
PR Barshi(10) EA 0(74.43) 751.21 21.60 53
PR Barshi(22) EA WE(60.00) 692.00 86.00 54
PR Barshi(12) EA WE(98.00) 900.00 10.00 45.00 55
PR Barshi(12) EA ,
WE(40.00) 220.00 4.00 11.00 56
KR Barshi(12) EA 0(4.77) 295.99 9.38 0.01 57
KR Barshi(16) EA 0(43.00) 770.00 12.00 28.00 58
KR Barshi(30) EA 0(30.00) 195.00 3.00 2.00 59
PR Paranda(12) EA 0(26.98) 844.68 11.02 60
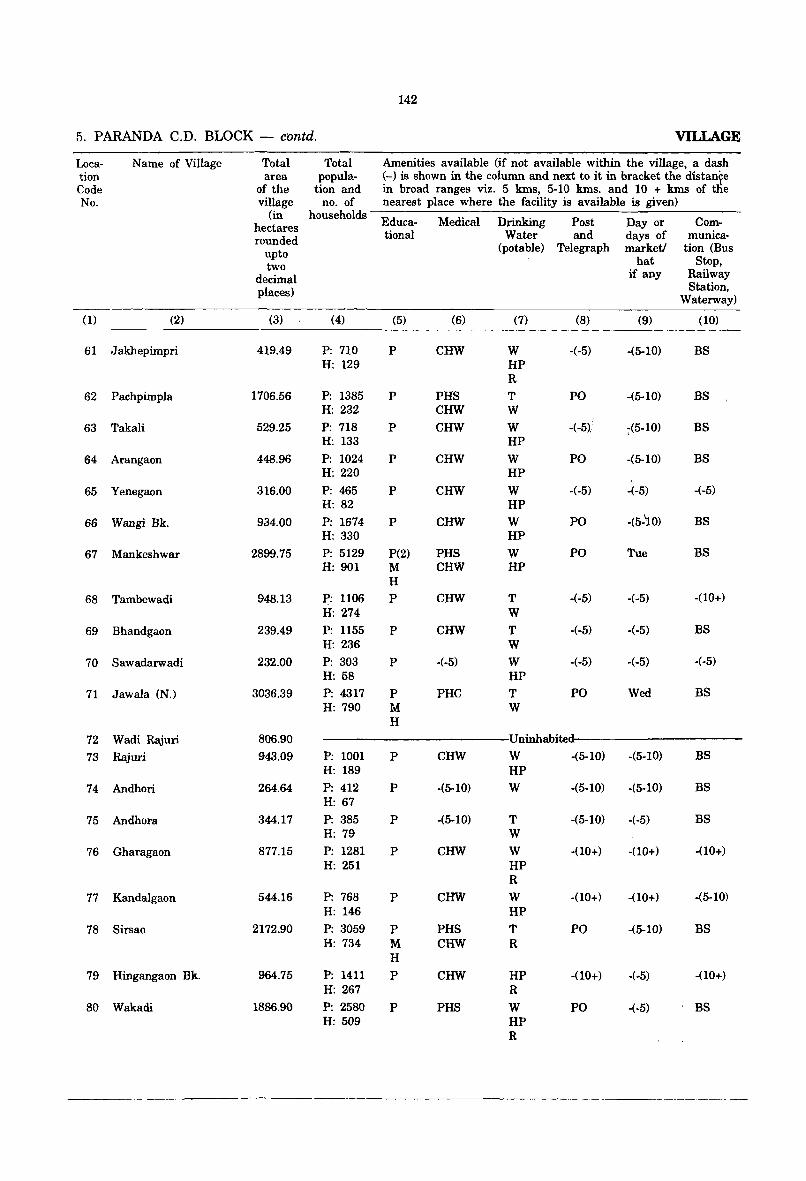
142
5. PARANDA C.D. BLOCK - crmtd. VILLAGE
Loca- Name of Village Total Total Amenities available (if not available within the village, a dash tion area popula- (-) is shown in the column and next to it in bracket the distan~e Code of the tion and in broad ranges viz. 5 luns, 5-10 luns. and 10 + luns of tlie No. village no. of nearest place where the facility is available is given)
(in households Educa- Medical Drinking Post Day or Com-hectares
rounded tional Water and days of munica-
upto (potable) Telegraph marketl tion (Bus
two hat Stop,
decimal if any Railway
places) Station, Waterway)
(1) (2) (3) (4) (5) (6) (7) (8) (9) (10)
61 Jakhepimpri 419.49 P: 710 P CHW W -(-5) -(5-10) BS H: 129 HP
R
62 Pachpimpla 1706.56 P: 1385 P PHS T PO -(5-10) BS H: 232 CHW W
63 Takali 529.25 P: 718 P CHW W -( -5)/ ~(5-10) BS H: 133 HP
64 Arangaon 448.96 P: 1024 P CHW W PO -(5-10) BS H: 220 HP
65 Yenegaon 316.00 P: 465 P CHW W -(-5) -(-5) -(-5)
H: 82 HP
66 Wangi Bk. 934.00 P: 1674 P CHW W PO -(5-10) BS H: 330 HP
67 Mankeshwar 2899.75 P: 5129 P(2) PHS W PO Tue BS H: 901 M CHW HP
H
68 Tambewadi 948.13 J>: 1106 P CHW T -(-5) -(-5) -00+) H: 274 W
69 Bhandgaon 239.49 P: 1155 P CHW T -(-5) -(-5) BS H: 236 W
70 Sawadarwadi 232.00 P: 303 P -(-5) W -(-5) -(-5) -(-5) H: 58 HP
71 Jawala (N.) 3036.39 P: 4317 P PHC T PO Wed BS H: 790 M W
H
72 Wadi Rajuri 806.90 Uninhabite
73 Rajuri 943.09 P: 1001 P CHW W -(5-10) -(5-10) BS H: 189 HP
74 Andhori 264.64 P: 412 P -(5-10) W -(5-10) -(5-10) BS H: 67
75 Andhora 344.17 P: 385 P -(5-10) T -(5-10) -(-5) BS H: 79 W
76 Gharagaon 877.15 P: 1281 P CHW W -(10+) -(10+) -(10+) H: 251 HP
R
77 Kandalgaon 544.16 P: 768 P CHW W -(10+) -(10+) -(5-10) H: 146 HP
78 Sirsao 2172.90 P: 3059 P PHS T PO -(5-10) BS H: 734 M CHW R
H
79 Hingangaon Bk. 964.75 P: 1411 P CHW HP -(10+) -(-5) -(10+) H: 267 R
80 Wakadi 1886.90 P: 2580 P PHS W PO -(-5) BS H: 509 HP
R
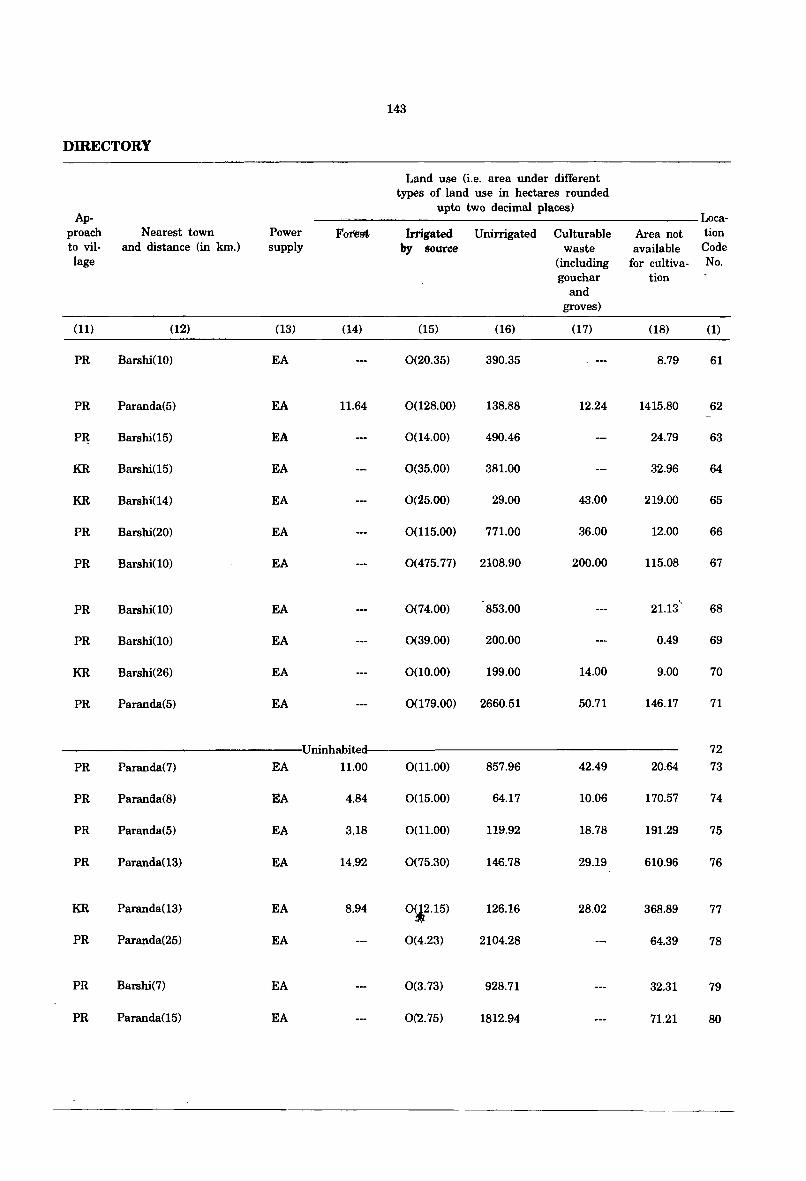
143
DIRECTORY
Land use (i.e. area under different types of land use in hectares rounded
Ap-upto two decimal places)
Loca-proach Nearest town Power Fote'fIt Irrigated Unirrigated Culturable Area not tion to vil- and distance (in krn.) supply by source waste available Code lage (including for cultiva- No.
gouchar tion and
groves)
(11) (12) (13) (14) (15) (16) (17) (18) (1)
PR Barshi(lO) EA 0(20.35) 390.35 8.79 61
PR Paranda(5) EA 11.64 0(128.00) 138.88 12.24 1415.80 62
PR Barshi(15) EA 0(14.00) 490.46 24.79 63
KR Barshi(15) EA 0(35.00) 381.00 32.96 64
KR Barshi(14) EA 0(25.00) 29.00 43.00 219.00 65
PR Barshi(20) EA 0(115.00) 771.00 36.00 12.00 66
PR Barshi(10) EA 0(475.77) 2108.90 200.00 115.08 67
, PR Barshi(10) EA 0(74.00) 853.00 21.13 68
PR Barshi(10) EA 0(39.00) 200.00 0.49 69
KR Barshi(26) EA 0(10.00) 199.00 14.00 9.00 70
PR Paranda(5) EA 0(179.00) 2660.51 50.71 146.17 71
Uninhabite 72
PR Paranda(7) EA 11.00 0(11.00) 857.96 42.49 20.64 73
PR Paranda(8) EA 4.84 0(15.00) 64.17 10.06 170.57 74
PR Paranda(5) EA 3.18 0(11.00) 119.92 18.78 191.29 75
PR Paranda(13) EA 14.92 0(75.30) 146.78 29.19 610.96 76
KR Paranda(13) EA 8.94 0~2.15) 126.16 28.02 368.89 77
PR Paranda(25) EA 0(4.23) 2104.28 64.39 78
PR Barshi(7) EA 0(3.73) 928.71 32.31 79
PR Paranda(15) EA 0(2.75) 1812.94 71.21 80
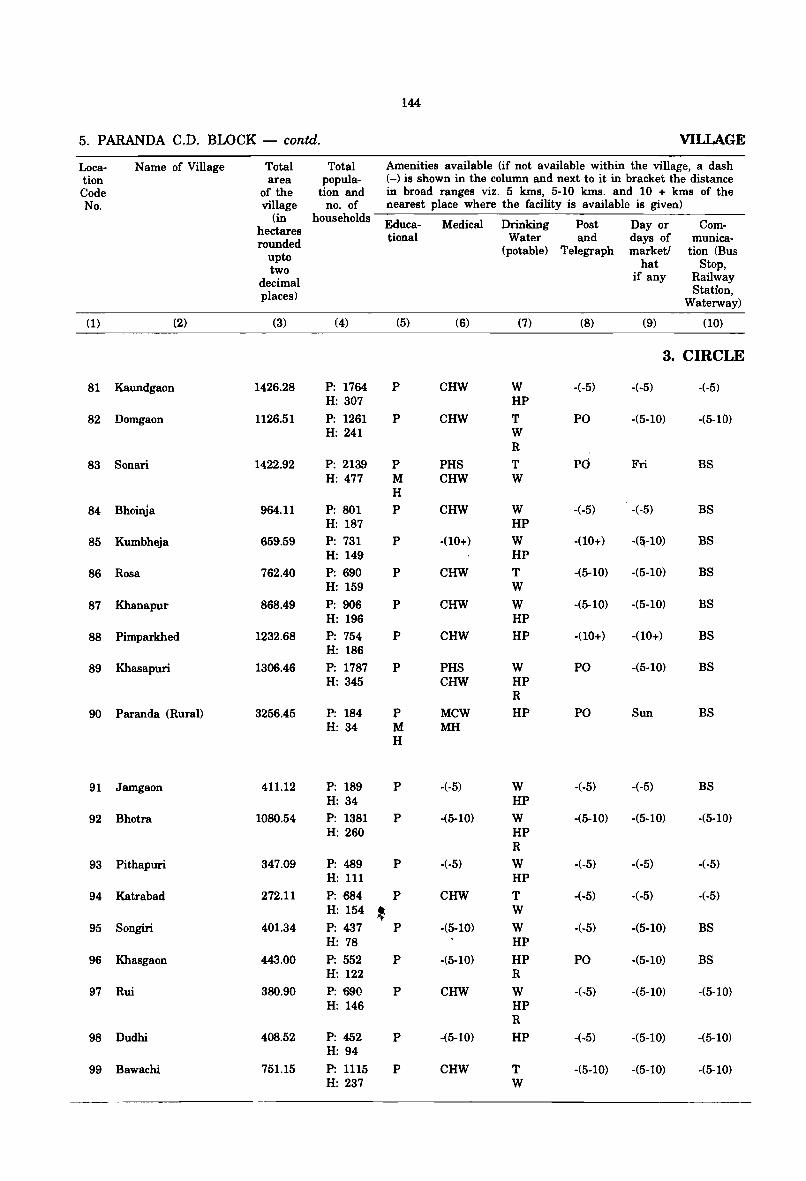
144
5. PARANDA C.D. BLOCK - contd. VILLAGE
Loca- Name of Village Total Total Amenities available (if not available within the village, a dash tion area popula- (-) is shown in the column and next to it in bracket the distance Code of the tion and in broad ranges viz. 5 kms, 5-10 kms. and 10 + kms of the No. village no. of nearest place where the facility is available is given)
(in households Educa- Medical Drinking Post Day or Com-hectares rounded tional Water and days of munica-
upto (potable) Telegraph market1 tion (Bus
two hat Stop,
decimal if any Railway
places) Stat jon, Waterway)
(1) (2) (3) (4) (5) (6) (7) (8) (9) (10)
3. CIRCLE
81 Kaundgaon 1426.28 P: 1764 P CHW W -(-5) -(-5) -(-5) H: 307 HP
82 Domgaon 1126.51 P: 1261 P CHW T PO -(5-10) -(5-10) H: 241 W
R
83 Sonari 1422.92 P: 2139 P PHS T PO Fri BS H: 477 M CHW W
H
84 Bhoinja 964.11 P: 801 P CHW W -(-5) -(-5) BS H: 187 HP
85 Kumbheja 659.59 P: 731 P -(10+) W -(10+) -(&-10) BS H: 149 HP
86 Rosa 762.40 P: 690 P CHW T -(5-10) -(5-10) BS H: 159 W
87 Khanapur 868.49 P: 906 P CHW W -(5-10) -(5-10) BS H: 196 HP
88 Pimparkhed 1232.68 P: 754 P CHW HP -(10+) -(10+) BS H: 186
89 Khasapuri 1306.46 P: 1787 P PHS W PO -(5-10) BS H: 345 CHW HP
R
90 Paranda (Rural) 3256.45 P: 184 P MCW HP PO Sun BS H: 34 M MH
H
91 Jamgaon 411.12 P: 189 P -(-5) W -(-5) -(-5) BS H: 34 HP
92 Bhotra lOBO. 54 P: 1381 P -(5-10) W -(5-10) -(5-10) -(5-10) H: 260 HP
R
93 Pithapuri 347.09 P: 489 P -(-5) W -(·5) -(-5) -(-5) H: 111 HP
94 Katrabad 272.11 P: 684 P CHW T -(·5) -(-5) -(·5) H: 154 t W
95 Songiri 401.34 P: 437 P -(5-10) W -(·5) -(5-10) BS H: 78 HP
96 Khasgaon 443.00 P: 552 P -(5-10) HP PO ·(5·10) BS H: 122 R
97 Rui 380.90 P: 690 P CHW W -(·5) ·(5-10) ·(5·10) H: 146 HP
R
98 Dudhi 408.52 P: 452 P -(5-10) HP -(·5) ·(5-10) -(5-10) H: 94
99 Bawachi 751.15 P: 1115 P CHW T -(5-10) -(5·10) ·(5-10) H: 237 W

145
DIRECTORY
Land use (i.e. area under different types of land use in hectares rounded
Ap-upto two decimal places)
Loca-proach Nearest town Power Forest Irrigated Unirrigated Culturable Area not tion to viI· and distance (in km.) supply by source waste available Code lage (including for cultiva- No.
gouchar tion and
groves)
(11) (12) (13) (14) (15) (16) (17) (18) (1)
PARANDA
PR Paranda(20) EA WE(132.00) 1197.80 96.48 81
KR Paranda(7) EA WE(13.35) 964.20 88.96 82 TK(60.00)
PR Paranda(10) EA 0(5~.20) 1301.51 0.82 68.39 83
PR Paranda(8) EA 0(41.00) 838.40 84.71 84
PR Paranda(10) EA WE(35.55) 603.40 20.64 85
PR Paranda(8) EA WE(10.05) 584.00 168.35 86
PR Barshi(30) EA WE(45.12) 813.92 9.45 87
PR Barshi(31) EA 0(10.00) 1195.06 27.62 88
PR Paranda(9) EA 0(132.00) 935.00 37.00 202.46 89
PR Barshi(20) EA 0(60.35) 3116.10 80.00 90
PR Paranda(2) EA WE(9.00) 344.00 38.12 91 TK(20.oo)
KR Barshi(30) EA WE(20.12) 965.89 94.53 92
KR Paranda(4) EA 0(50.00) 231.00 66.09 93
PR Paranda(4) EA 0(90.00) 132.06 50.11 94
PR Paranda(5) EA 0(264.00) 111.34 20.00 6.00 95
PR Paranda(7) EA 0(108.00) 256.00 79.00 96
KR Paranda(Q) EA 0(168.00) 188.00 18.00 6.90 97
KR Paranda(6) EA 0(87.00 1 255.00 63.00 3.52 98
PR Paranda(7) EA 0(131.00) 531.00 76.00 13.15 99
--H-A
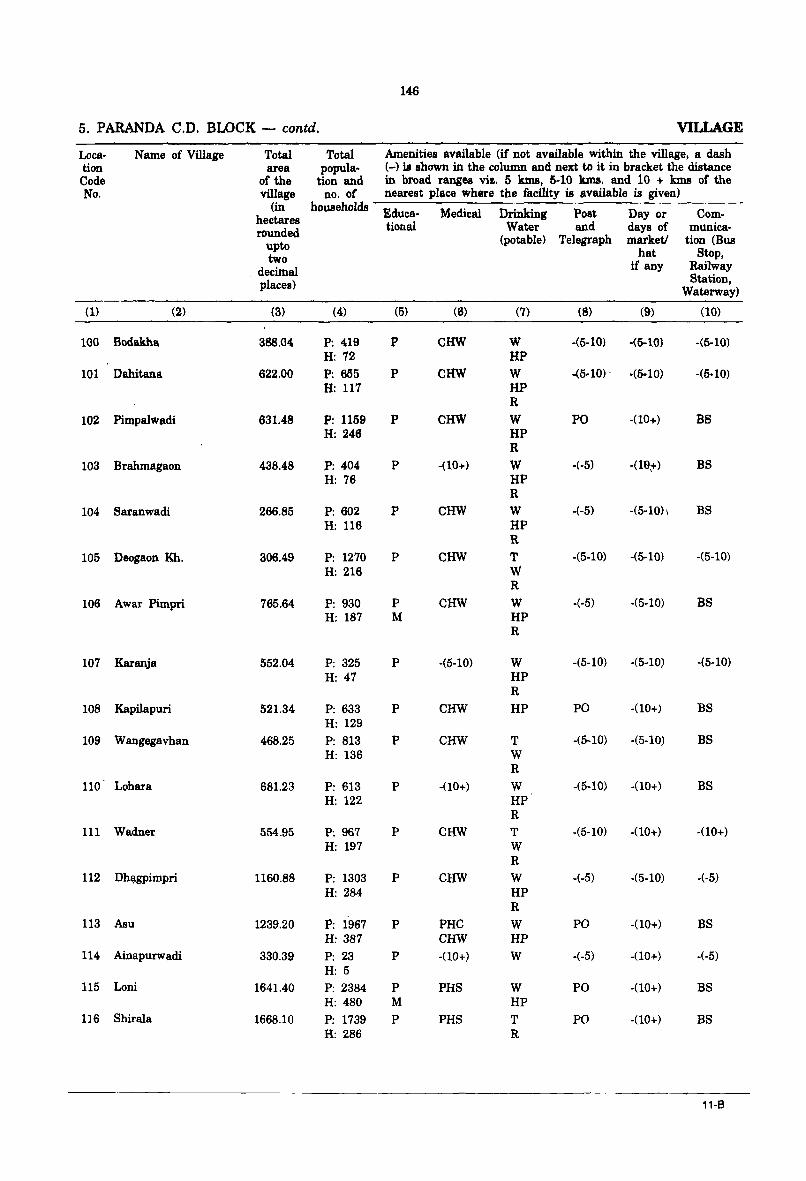
146
5. PARANDA C.D. BWCK - contd. VILLAGE
Loca- Name of Village Total Total Amenities available (if not available within the village, a dash tion area popula- (-) is shown in the column and next to it in bracket the distance Code of the tion and in broad ranges viz. 5 kma, 5-10 kms. and 10 + kms of the No. village no. of nearest place where the facility is available is given)
(in households Educa- Medical Drinking Post Day or Com-hectares rounded tional Water and days of munica-
upto (potable) Telegraph marketi tion (Bus
two hat Stop,
. decimal if any Railway
places) Station, Waterway)
(1) (2) (3) (4) (5) (6) (7) (8) (9) (10)
100 Bodakha 388.04 P: 419 P CHW W -(5-10) -(5-10) -(5-10) H: 72 HP
101 Dahitana 622.00 P: 655 P CHW W -(5·10) . -(5·10) -(5-10) H: 117 HP
R 102 Pimpalwadi 631.48 P: 1159 P CHW W PO -(10+) BS
H: 246 HP R
103 Brahmagaon 438.48 P: 404 P -(10+) W -(·5) ·CU1;+-) BS H: 76 HP
R 104 Saranwadi 266.85 P: 602 P caw W -(-5) -(5-10) \ BS
H: 116 HP R
105 Deogaon Kh. 306.49 P: 1270 P CHW T -(5-10) -(5·10) -(5-10) H: 216 W
R
106 Awar Pimpri 765.64 P: 930 P CHW W -(-5) -(5-10) BS H: 187 M HP
R
107 Karanja 552.04 P: 325 P -(5-10) W -(5-10) ·(5-10) -(5-10) H: 47 HP
R 108 Kapilapuri 521.34 P: 633 P CHW HP PO -(10+) BS
H: 129
109 Wangegavhan 468.25 P: 813 P CHW T -(5·10) ·(5-10) BS H: 136 W
R
110 Lohara 681.23 P: 613 P -(10+) W -(5·10) ·(10+) BS H: 122 HP
R III Wadner 554.95 P: 967 P CHW T -(5-10) -(10+) -(10+)
H: 197 W R
112 Dh~gpimpri 1160.88 P: 1303 P CHW W -(-5) -(5·10) -(-5)
H: 284 HP R
113 Asu 1239.20 P: 1967 P PHC W PO -(10+) BS H: 387 CHW HP
114 Ainapurwadi 330.39 P: 23 P -(10+) W -(-5) -(10+) -(-5)
H: 5 115 Low 1641.40 P: 2384 P PHS W PO -(10+) BS
H: 480 M HP 116 Shirala 1668.10 P: 1739 P PHS T PO -(10+) BS
H: 286 R
11-8
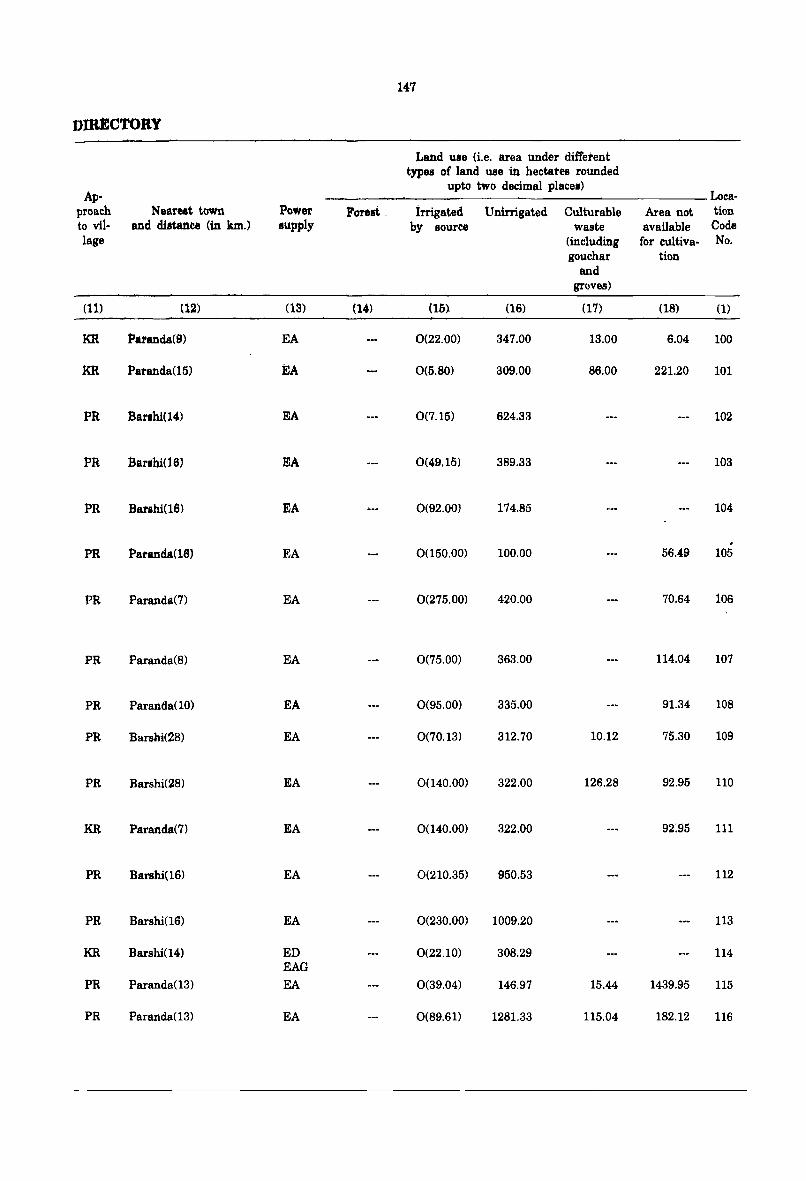
147
vIRICTORY
Land use (i.e. area under different types of land use in hectates rounded
Ap· upto two decimal places)
Loca-proach Nearest town Power Forest. lrrigated Unirrigated Culturable Area not tion to vil- and distance (in km.) supply by Bource waste available Code lage (including for cultiva- No.
gouchar tiOD and
groves)
(11) (12) (13) (14) (15} (16) (17) (18) (1)
KR Paranda(9) EA 0(22.00) 347.00 13.00 6.04 100
KR Paranda(i5} EA 0(5.80) 309.00 86.00 221.20 101
PIt Banhi(14) EA 0(7.15) 624.33 102
PR Bar.bi(16) EA 0(49.15) 389.33 103
PR Batahi(16) EA 0(92.00) 174.S5 104
, PR Paranda(16) EA 0(150.00) 100.00 56,49 105
PR Paranda(7) EA 0(275.00) 420.00 70.64 106
PR Paranda(S) EA 0(75.00) 363.00 114.04 107
PR Paranda(10) EA 0(95.00) 335.00 91.34 108
PR Barshi(28) EA 0(70.13) 312.70 10.12 75.30 109
PR Barshi(2S) EA 0(140.00) 322.00 126.28 92.95 110
KR Paranda(7) EA 0(140.00) 322.00 92·.95 111
PR Barshi(16) EA 0(210.35) 950.53 112
PR Barshi(16) EA 0(230.00) 1009.20 113
KR Barshi(14) ED 0(22.10) 308.29 114 EAG
PR Paranda(13) EA 0(39.04) 146.97 15.44 1439.95 115
PR Paranda(13) EA 0(89.61) 1281.33 115.04 182.12 116
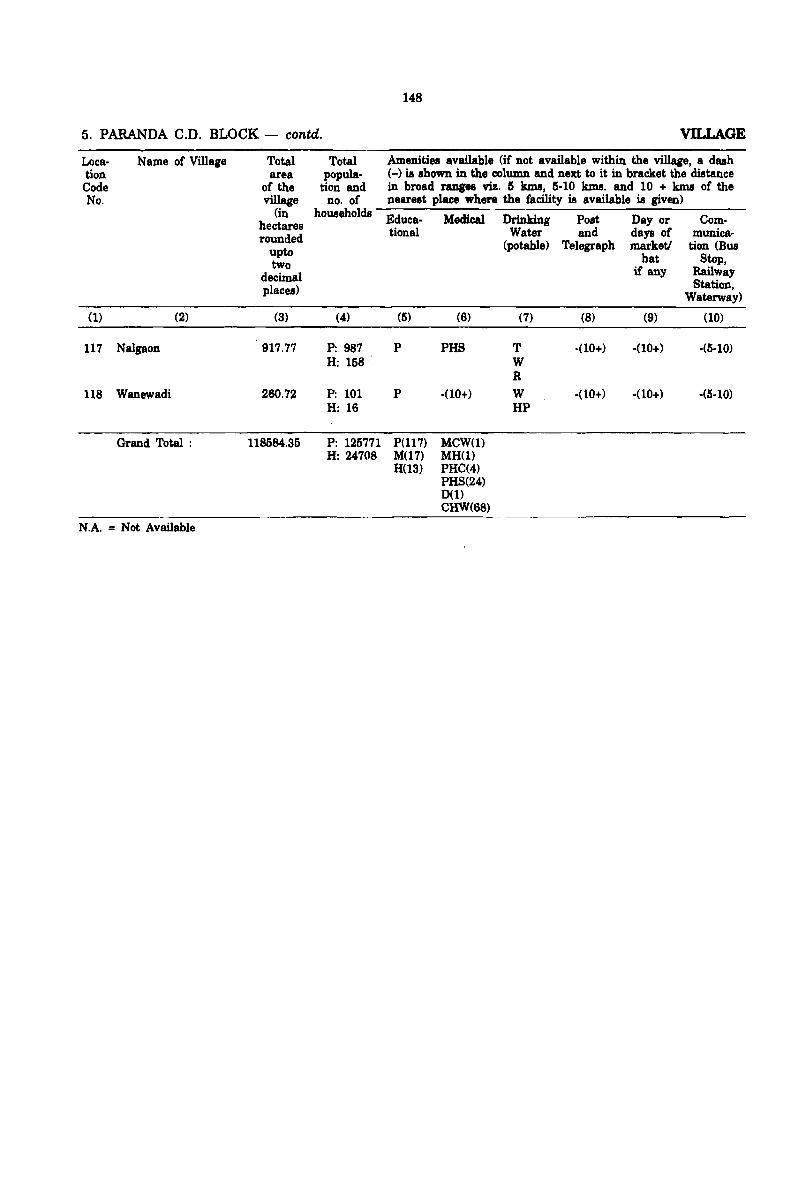
148
5. PARANDA C.D. BLOCK - contd. VILLAGE
Location Code No.
(1)
117
118
Name of Village
(2)
Nalgaon
Wanewadi
Grand Total :
N.A. = Not Available
Total area
of the village
(in hectares rounded
upto two
decimal places)
(3)
917.77
260.72
118584.35
Total Amenities available (if not available within the village, a dash popula- (-) is shown in the column and next to it in bracket the distance
tion and in broad rangea viz. 5 luna, 5-10 luna. and 10 + kms of the no. of nearest place where the facility is available is given)
households ----=-----------:.-.------=---------
(4)
P: 987 H: 158
P: 101 H: 16
P: 125771 H: 24708
Educa- Medical Drinking Post Day or Com-tional Water and days of
(5) (6)
P PHS
P -(10+)
P(U7) MCW(l) M(17) MH(1) H(13) PHC(4)
PHS(24) D(1) CHW(68)
(potable) Telegraph marketJ hat
if any
(7) (8) (9)
T -(10+) -(10+) W R
W -(10+) -(10+) HP
munication (Bus
Stop, Railway Station,
Waterway)
(10)
-(5-10)
-(5-10)
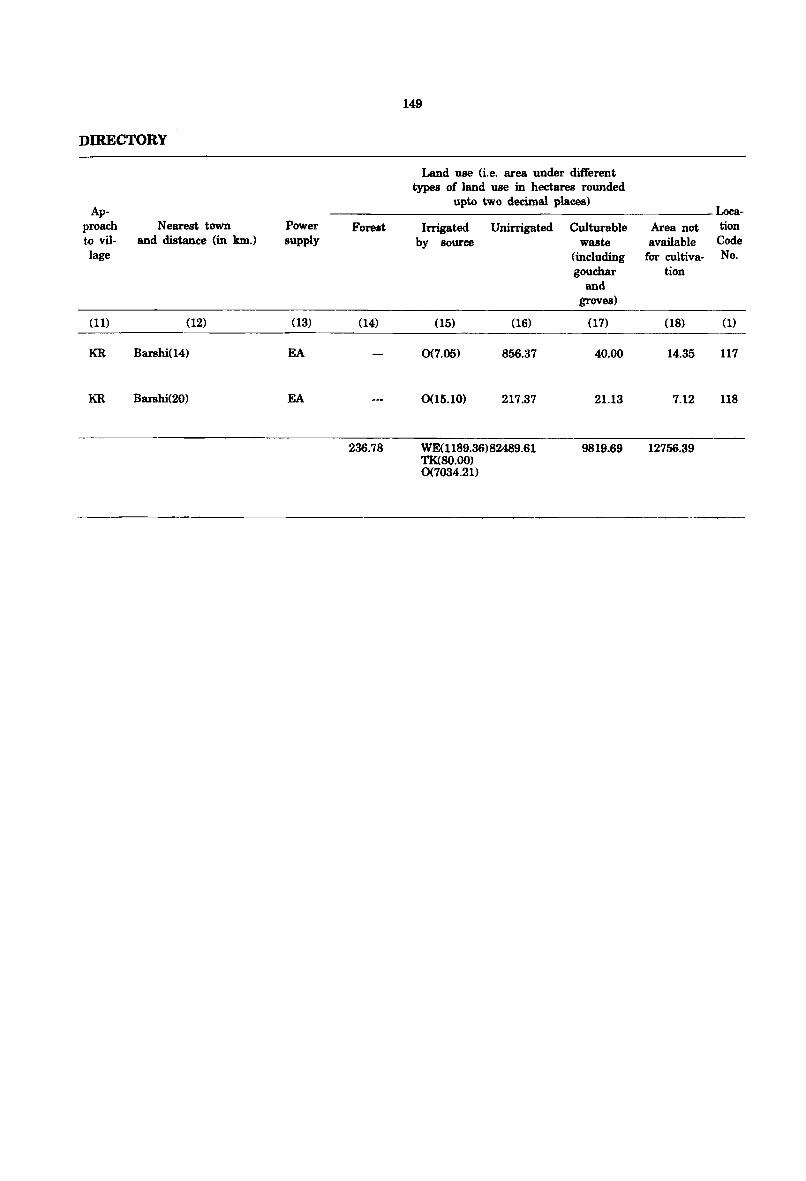
149
DffiECTORY
Land use (i.e. area under different types of land use in hectares rounded
Ap-upto two decimal places)
Loca-proach Nearest town Power FOrelt Irrigated Unirrigated Culturable Area not tion to viI- and distance (in km.) supply by source waste available Code lage (including for cultiva- No.
gouchar tion and
groves)
(11) (12) (13) (14) (15) (16) (17) (18) (1)
KR Barshi(14) EA 0(7.05) 856.37 40.00 14.35 117
KR Barshi(20) EA ()(15.10) 217.37 21.13 7.12 118
236.78 \VE{1189.36)82489.61 9819.69 12756.39 TK(BO.OO) 0(7034.21)

~~ ~ ~
CD IT
CD PARGAON ......
(J) WASHI
@ BHUM
® WALWAD
~~ <:;)~
~'?-'If:r~
V'" 4-'
" '" , ()
.....
~
,,/' :e
VI
A Note:-
C·O- Block Boundary of Bhum i. Co·t.rminus with Tahsil Boundary Excluding all Statutory Towns.
VlIlage Bound<lry 01 t.e.No.74 I. Not A,VQllable.
MSH -Major State Highway
9OUNOARY.0ISTRICl
" TAHSIL
~~ 0
N o A
" REVENUE CIRCLE... ,.. '" •.• .t. ___ _ .. VILLAGE WITH LOCATION CODE NUMBER .. ~=:::i1:-::::'~
HEADQUARTERS: TAHSIL.. @ VILLAGES WITH POPULATION SIZE: BELOW 200, • 200-499,500-99911000-4999,5000 ANO ABOVE ... 0 •••
UNINHABITED VILLAGES WITH LOCATION CODE :=':-j§:C_-J URBAN AREA WITH LOCATION CODE ... 11,;' 1ZllI::a
Based upon Survey of IndiO mop With the permiSSion of the Surv@yor General of India
S r
MAHARASHTFtA
TAHSIL BHUM DISTRICT OSMANABAD
R Km 2 i 'kill I ... C r
11 /
()
(I)
~
4
~
" ~
"I
STATE Hl;HWAY ... SHI,I
IMPORTANT METALLED ROAD ...
UNMETALLED AND OlHER ROADS .. -. __ =_a. RIVER AHD STREAM.. • .. ~ ., -=::. POST OFFICE/TELEGRAPH OFFICE E)(CWOI HG R.M.S. .. POIlO
HIGHER SECONDARY SCHOOL ... S
POLICE STATION EXCLUDING RLY. POLICE STATION'. PS
HOSPIT.t.L, PRIMARY HEALTH CEHTRE. DISPENSARY. MATERNITY AND CHILD WELF.t.RE CENTRE
IMPORTANT VILLAGE MARKET I H.t.T.
©Governmenlof Inella Copyright,19t4:
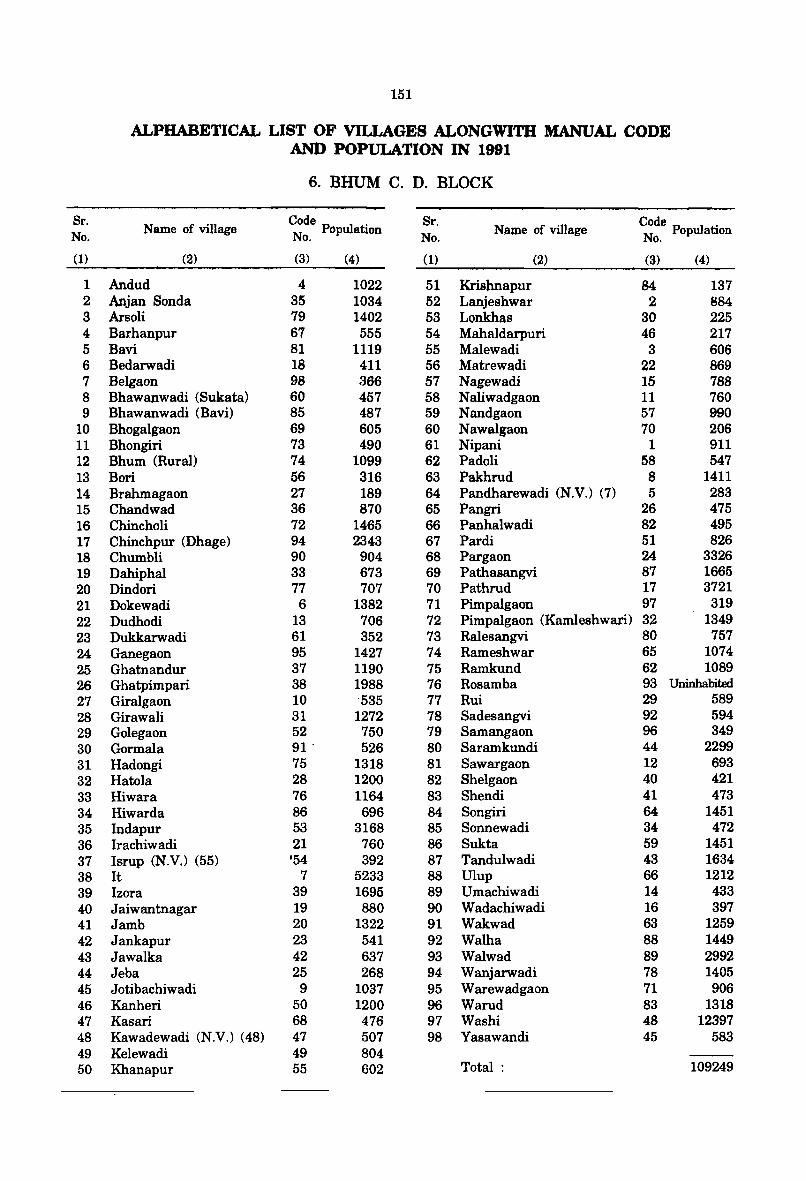
151
ALPHABETICAL LIST OF VILLAGES ALONGWlTB MANUAL CODE AND POPULATION IN 1991
6. BHUM C. D. BLOCK
Sr. Name of village
Code Sr. Code . No. N Population No.
Name of village N Population o. o.
(1) (2) (3) (4) (1) (2) (3) (4)
1 Andud 4 1022 51 Krishnapur 84 137 2 Anjan Sonda 35 1034 52 Lanjeshwar 2 884 3 Arsoli 79 1402 53 Lonkhas 30 225 4 Barhanpur 67 555 54 Mahaldarpuri 46 217 5 Bavi 81 1119 55 Malewadi 3 606 6 Bedarwadi 18 411 56 Matrewadi 22 869 7 Belgaon 98 366 57 Nagewadi 15 788 8 Bhawanwadi (Sukata) 60 457 58 Naliwadgaon 11 760 9 Bhawanwadi (Bavi) 85 487 59 Nandgaon 57 990
10 Bhogalgaon 69 605 60 Nawalgaon 70 266 11 Bhongiri 73 490 61 Nipani 1 911 12 Bhum (Rural) 74 1099 62 Padoli 58 547 13 Bori 56 316 63 Pakhrud 8 1411 14 Brahmagaon 27 189 64 Pandharewadi (N.V.) (7) 5 283 15 Chandwad 36 870 65 Pangri 26 475 16 Chincholi 72 1465 66 Panhalwadi 82 495 17 Chinchpur (Dhage) 94 2343 67 Pardi 51 826 18 Chumbli 90 904 68 Pargaon 24 3326 19 Dahiphal 33 673 69 Pathasangvi 87 1665 20 Dindori 77 707 70 Pathrud 17 3721 21 Dokewadi 6 1382 71 Pimpalgaon 97 319 22 Dudhodi 13 706 72 Pimpalgaon (Kamleshwari) 32 1349 23 Dukkarwadi 61 352 73 Ralesangvi 80 757 24 Ganegaon 95 1427 74 Rameshwar 65 1074 25 Ghatnandur 37 1190 75 Ramkund 62 1089 26 Ghatpimpari 38 1988 76 Rosamba 93 Uninhabited
27 Giralgaon 10 -535 77 Rui 29 589 28 Girawali 31 1272 78 Sadesangvi 92 594 29 Golegaon 52 750 79 Samangaon 96 349 30 Gormala 91 . 526 80 Saramkundi 44 2299 31 Hadongi 75 1318 81 Sawargaon 12 693 32 Hatala 28 1200 82 Shelgaon 40 421 33 Hiwara 76 1164 83 Shendi 41 473 34 Hiwarda 86 696 84 Songiri 64 1451 35 Indapur 53 3168 85 Sonnewadi 34 472 36 Irachiwadi 21 760 86 Sukta 59 1451 37 Isrup (N.V.) (55) '54 392 87 Tandulwadi 43 1634 38 It 7 5233 88 Ulup 66 1212 39 Izora 39 1695 89 Umachiwadi 14 433 40 Jaiwantnagar 19 880 90 Wadachiwadi 16 397 41 Jamb 20 1322 91 Wakwad 63 1259 42 Jankapur 23 541 92 Walha 88 1449 43 Jawalka 42 637 93 Walwad 89 2992 44 Jeba 25 268 94 Wanjarwadi 78 1405 45 Jotibachiwadi 9 1037 95 Warewadgaon 71 906 46 Kanheri 50 1200 96 Warud 83 1318 47 Kasari 68 476 97 Washi 48 12397 48 Kawadewadi (N.V.) (48) 47 507 98 Yasawandi 45 583 49 Kelewadi 49 804 50 Khanapur 55 602 Total : 109249
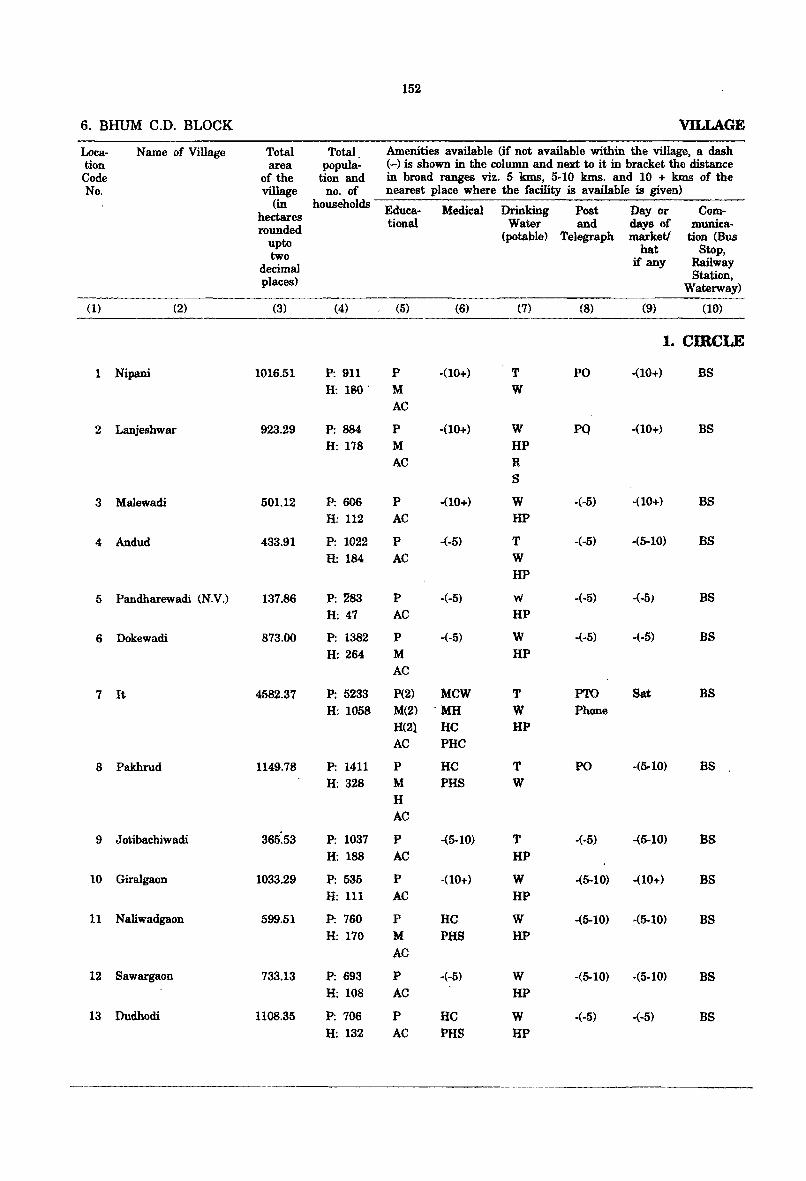
152
6. BHUM C.D. BLOCK VILLAGE
Loca- Name of Village Total Total Amenities available (if not available within the village, a dash tion area popula: (-) is shown in the column and next to it in bracket the distance Code of the tion and in broad ranges viz. 5 kms, 5-10 kms. and 10 + kms of the No. village no. of nearest place where the facility is available is given)
(in households Educa- Medical Drinking Post Day or Com-hectares rounded tiona! Water and days of munica-
upto (potable) Telegraph marketi tion (Bus
two hat Stop,
decimal if any Railway
places) Station, Waterway)
(1) (2) (3) (4) (5) (6) (7) (8) (9) (10)
1. CIRCLE
1 Nipani 1016.51 P: 911 P -(10+) T PO -(10+) BS H: 180· M W
AC
2 Lanjeshwar 923.29 P: 884 P -(10+) W PO -(10+) BS H: 178 M HP
AC R S
3 Malewadi 501.12 P: 606 P -(10+) W -(oS) -(10+) BS H:112 AC HP
4 Andud 433.91 P: 1022 P -(-5) T -(-5) -(5-10) BS H: 184 AC W
HP
5 Pandharewadi (N.V.) 137.86 P: 283 P -(-5) W -(-5) -(-5) BS H: 47 AC HP
6 Dokewadi 873.00 P: 1382 P -(-5) W -(·5) -(-5) BS H: 264 M HP
AC
7 It 4582.37 P: 5233 P(2) MCW T PTO Sat BS H: 1058 M(2) ·MH W Phone
H{21 HC HP AC PHC
8 Pakhrud 1149.78 P: 1411 P HC T PO -(5-10) BS H: 328 M PHS W
H AC
9 Jotibachiwadi 365.53 P: 1037 P -(5-10) T -(-5) -(5-10) BS H: 188 AC HP
10 Giralgaon 1033.29 P: 535 P -(10+) W ·(5-10) -(10+) BS H: 111 AC HP
11 Naliwadgaon 599.51 P: 760 P HC W -(5-10) -(5-10) BS H: 170 M PHS HP
AC
12 Sawargaon 733.13 P: 693 P -(-5) W -(5-10) -(5-10) BS H: 108 AC HP
13 Dudhodi 11OB.35 P: 706 P He w -(-5) -(-5) BS H: 132 AC PHS HP
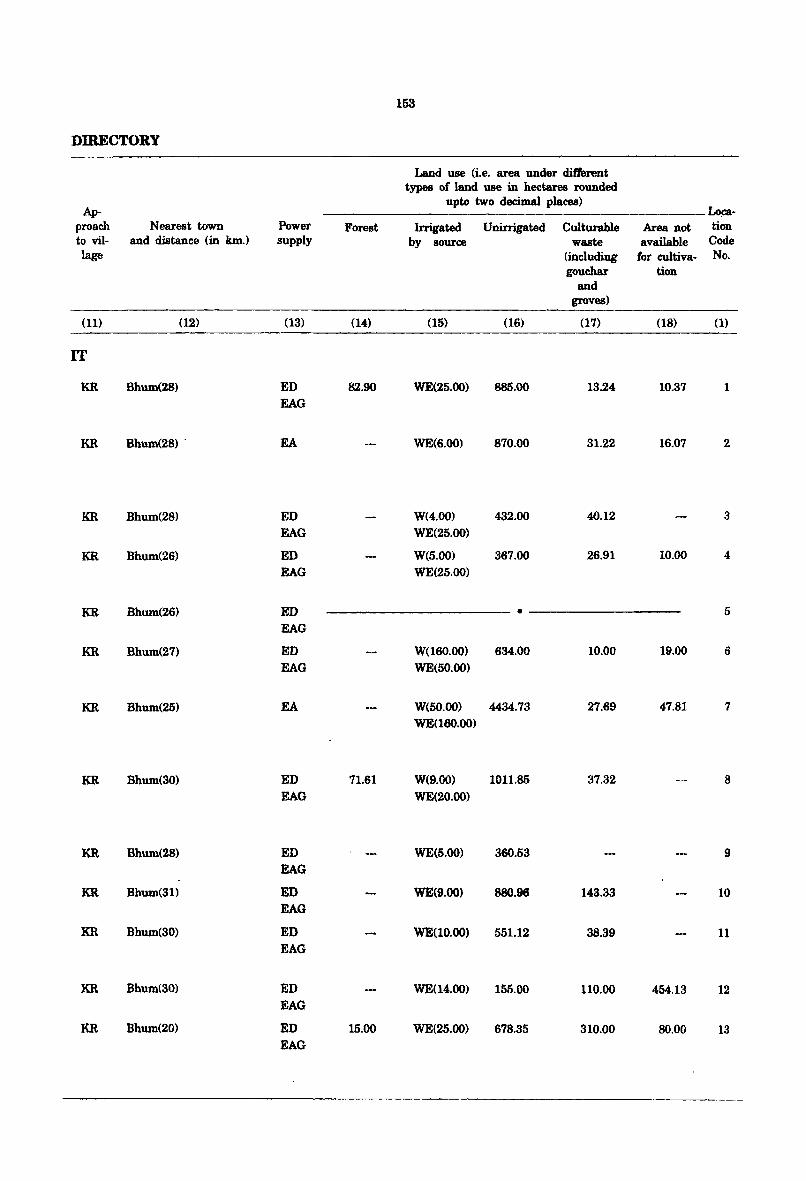
DmECTORY
Ap-proach Nearest town to vil· and distance (in km.) }age
(11) (12)
IT
KR Bhum(28)
KR Bhum(28) .
KR Bhum(28)
KR Bhum(26)
KR Bhum(26)
KR Bhum(27)
KR Bhum(25)
KR Bhum(30)
KR Bhum(28)
KR Bhum(31)
KR Bhum(3D)
KR Bhum(30)
KR Bhum(20)
Power supply
(13)
ED
EAG
EA
ED EAG
ED EAG
ED EAG
ED
EAG
EA
ED
EAG
ED
EAG
ED EAG
ED EAG
ED EAG
ED EAG
Forest
(14)
82.90
11.61
15.00
153
Land use (i.e. area under di1ferent types of land use in hectares rounded
upto two decimal places) ~.
Irrigated Unirrigated Culturable Area not tion by source waste available Code
(including for cultiva- No. gouchar tion
and groves)
(15) (16) (17) (18) (1)
WE{25.(0) 885.00 13.24 10.37 1
WE(6.00) 870.00 31.22 16.07 2
W(4.00) 432.00 40.12 3 WE(25.00)
W(5.00} 367.00 26.91 10.00 4
WE(25.00)
• 5
W(160.00) 634.00 10.00 19.00 6 WE(50.00)
W(50.00) 4434.73 27.69 47.81 7 WE(I60.00)
W(9.00) 1011.85 37.32 8 WE(20.00)
WE(5.00) 360.53 9
WE(9.00) 880.96 143.33 10
WE(lD.DO) 551.12 38.39 11
WE(14.00) 155.00 110.00 454.13 12
WE(25.00) 678.35 310.00 SO.OO 13
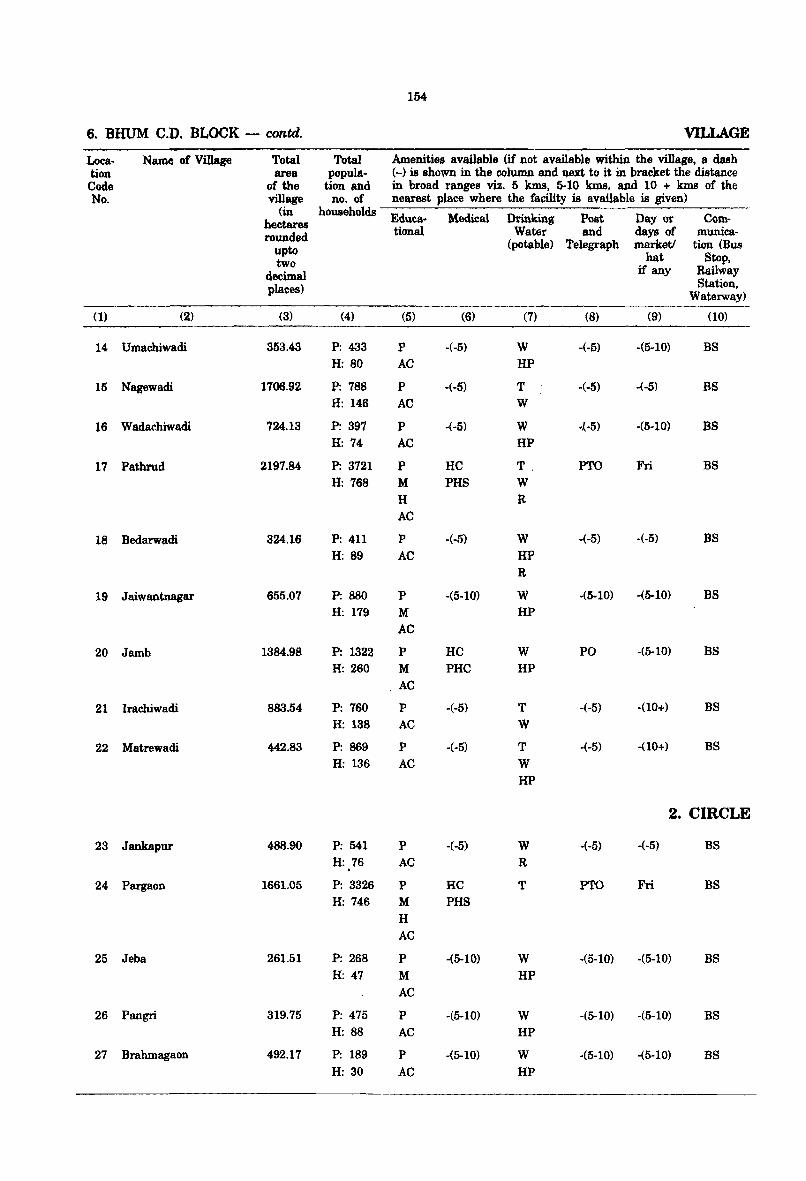
154
6. BHUM C.D. BLOCK - contd. VILLAGE
Loca· Name of Village Total Total Amenities available (if not available within the village, a dash tion area popula- (-) is shown in the column and Q.ext to it in bracket the distance Code of the tion and in broad ranges viz. 5 lons, 5·10 kms. IUld 10 + kms of the No. village no. of nearest place where the facility is available is given)
(in households Educa- Medical Drinking Post Day or Com-hectares
rounded tional Water and days <Jf munica-
upto (potable) Telegraph market! tion (Bus
two hat Stop,
decimal if any RaUway
places) Station, Waterway)
(1) (2) (3) (4) (5) (6) (7) (8) (9) (10)
14 Umaehiwadi 353.43 P: 433 P ·(-5) W -(-5) ·(5-10) BS H: 80 AC HP
15 Nagewadi 1706.92 P: 788 P -(-5) T ·(·5) -(.5) BS H: 146 AC W
16 Wadachiwadi 724.13 P: 397 P ·(·5) W ·(-5) -(5-10) BS H: 74 AC HP
17 Pathrud 2197.84 P: 3721 P HC T, PTO Fri BS H: 768 M PHS W
H R AC
18 Bedarwadi 324.16 P: 411 P -(-5) W -(-5) -(-5) BS
H: 89 AC HP R
19 Jaiwantuagar 655.07 P: 880 P ·(5·10) W ·(5-10) -(5-10) BS
H: 179 M HP
AC
20 Jamb 1384.98 P: 1322 P HC W PO -(5-10) BS
H: 260 M PHC HP
, AC
21 Irachiwadi 883.54 P: 760 P -(-5) T -(-5) -(10+) BS
H: 138 AC W
22 Matrewadi 442.83 P: 869 P ·(-5) T .(-5) -(10+) BS
H: 136 AC W HP
2. CIRCLE
23 Jankapur 488.90 P: 541 P -(-5) W -(-5) -(-5) BS H: 76 AC R .
24 Pargaon 1661.05 P: 3326 P HC T PTO Fri BS H: 746 M PHS
H AC
25 Jeba 261.51 P: 268 P -(5-10) W -(5-10) -(5-10) BS H: 47 M HP
AC
26 Pangri 319.75 P: 475 P -(5-10) W -(5-10) -(5-10) BS H: 88 AC HP
27 Brahmagaon 492.17 P: 189 P ·(5-10) W -(5·10) -(5-10) BS H: 30 AC HP
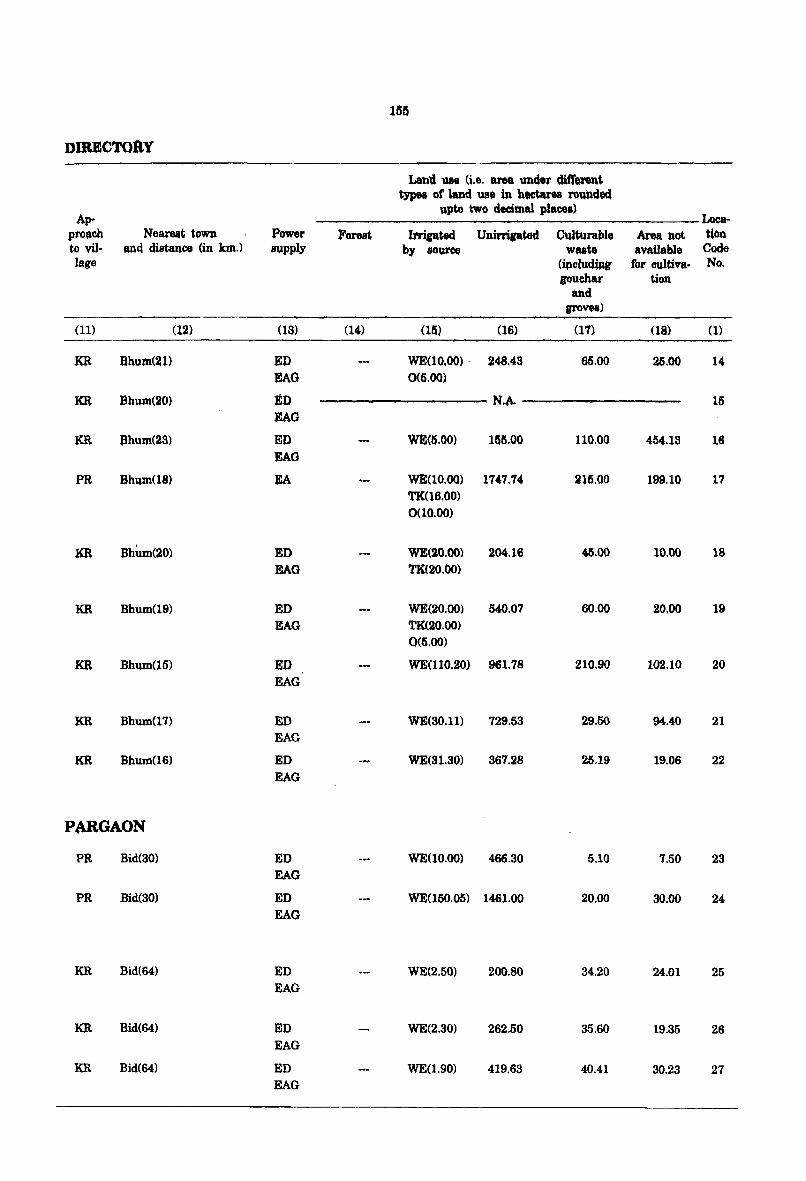
DIRECTOl\V
Ap-proach Neareilt tc)~ to viI- an~ distance (in kin.) Jage
(11) (12)
KR ahum(~l)
KR Bhum(20)
KR ahum(23)
PR Bhum(18)
KR BhUm(20)
KR Bhum(19)
KR Bhum(15)
KR Bhum(17)
KR Bhum(16)
PARGAON
PR Bid(30)
PR Bid(30)
KR Bid(64)
KR Bid(64)
KR Bid(64)
Power supply
(13)
gp EAG
ED EAG
EO EAG
EA
ED EAG
ED EAG
ED EAG
ED EAG
ED EAG
ED EAG
ED EAG
ED EAG
ED EAG
ED EAG
Forest
(14)
l!5rs
Land un O.e. area llnder dift'Ql'8nt ~a of land us., in hectues rounded
upto tw~ deeilnal places) Loca-
Il'rifI'tt«l Unirripted Culturallle Area bot tion by source W!l8te avldlable Code
(itlcludmg for ouItiva- No. gouchar tion
and groves)
(15) (16) (17) (18) (l)
WE(10,OO) . 248.43 65.00 25.00 14 0(5.00)
N.A. 15
WE(5.00) usa.oo 110.00 454.13 16
WE(10.oo) 1747.74 215.00 199.10 17 TK(16.00)
0(10.00)
WE(20.00) 204.16 45.00 10.00 18 TK(20.oo)
WE(20.oo) 540.07 60.00 20.00 19 TK(20.oo)
0<5.00)
m(IlO.aO} 961.78 210.90 102.10 20
WE(30.11) 729.53 29.50 94.40 21
WE(Sl.30) 367.28 25.19 19.06 22
WE(IO.OO) 466.30 5.10 7.50 23
WE(15O.05) 1461.00 20.00 30.00 24
WE(2.50) 200.80 34.20 24.01 25
WE(2.30) 262.50 35.60 19.35 26
WE(1.90) 419.63 40.41 30.2S 27
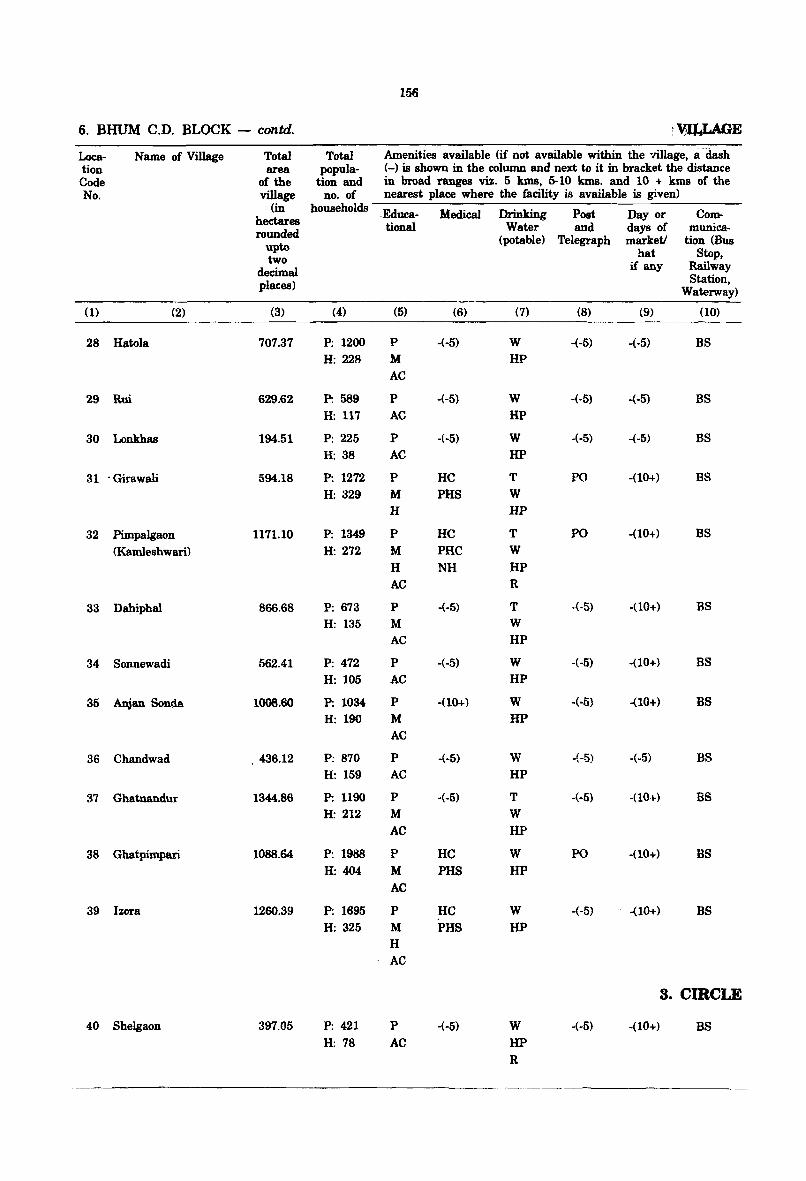
156
6. BHUM C.D. BLOCK - contd. :mLAGE
Loca- Name of Village Total Total Amenities available (if not available within the ·/illage, a -dash tion area popula- (-) is shown in the column and next to it in bracket the distance Code of the tion and in broad ranges viz. 5 kms, 5-10 kms. and 10 + kms of the No. village no. of nearest place where the facility is available is given)
(in households -Educa- Medical Drinking Post Day or Com-hectares rounded tional Water and days of munica-
upto (potable) Telegraph market/ tion (Bus
two hat Stop,
decimal if any Railway
places) Station, Waterway)
(l) (2) (3) (4) (5) (6) (7) (8) (9) (10)
28 Hatola 707.37 P: 1200 P -(-5) W -(-5) -(-5) BS H: 228 M HP
AC
29 Rui 629.62 P: 589 P -(-5) W -(-5) -(-5) BS H: 117 AC HP
30 Lonkhas 194.51 P: 225 P -(-5) W -(-5) -(-5) BS
H: 38 AC HP
31 . Girawali 594.18 P: 1272 P HC T PO -(10+) BS
H: 329 M PHS W
H HP
32 Pimpalgaon 1171.10 P: 1349 P HC T PO .(10+) BS
(Kamleshwari) H: 272 M PHC W
H NH HP AC R
33 Dahiphal 866.68 P: 673 P -(-5) T -(-5) .(10+) BS
H: 135 M W AC HP
34 Sonnewadi 562.41 P: 472 P -(-5) W -(-5) -(10+) BS
H: 105 AC HP
35 An,jan Sonda 1008.60 P: 1034 P -(10+) W -(-5) .(10+) BS
H: 190 M HP AC
36 Chandwad 436.12 P: 870 P -(-5) W -(-5) -(-5) BS H: 159 AC HP
37 Ghatnandur 1344.86 P: 1190 P -(-5) T -(-5) -(10+) BS H: 212 M W
AC HP
38 Ghatpimpari 1088.64 P: 1988 P He w PO -(10+) BS H: 404 M PHS HP
AC
39 bora 1260.39 P: 1695 P HC W -(-5) .(10+) BS H: 325 M PHS HP
H AC
3. CmCLE
40 Shelgaon 397.05 P: 421 P -(-5) W -(-5) -(10+) BS H: 78 AC HP
R
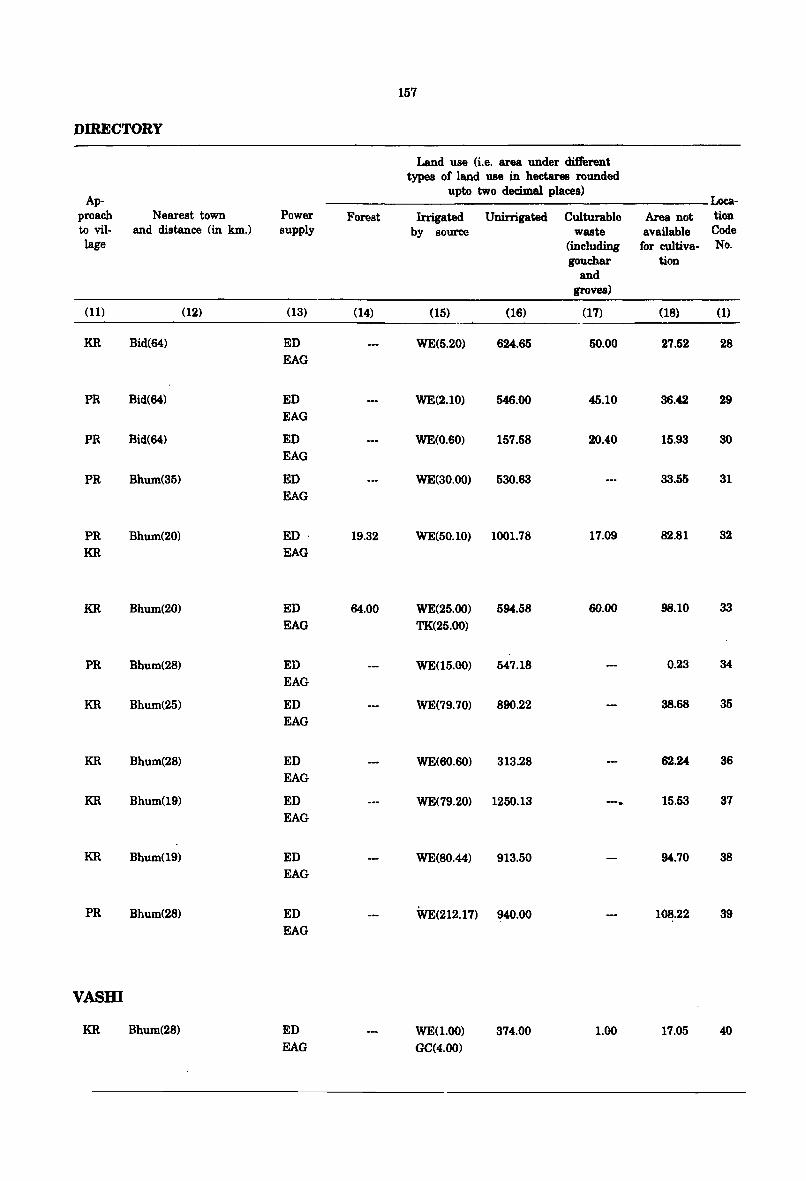
DIRECTORY
Ap-proach Nearest town to vil- and distance (in km.) lage
(11) (12)
KR Bid(64)
PR Bid(64)
PR Bid(64)
PR Bhum(35)
PR Bhum(20)
KR
KR Bhum(20)
PR Bhum(28)
KR Bhum(25)
KR Bhum(28)
KR Bhum(19)
KR Bhum(19)
PR Bhum(28)
VASBI
KR Bhum(28)
Power supply
(13)
ED
EAG
ED
EAG
ED
EAG
ED EAG
ED .
EAG
ED
EAG
ED
EAG
ED EAG
ED
EAG
ED
EAG
ED EAG
ED
EAG
ED
EAG
Forest
(14)
19.32
64.00
157
Land use (i.e. ~ under different types of land use in hectares rounded
upto two decimal places)
Irrigated by source
(15)
WE(5.20)
WE(2.10)
WE(0.60)
WE(30.00)
WE(50.10)
WE(25.00)
TK(25.00)
WE(15.00)
WE(79.70)
WE(60.60)
WE(79.20)
WE(80.44)
WE(212.17)
WE(1.00)
GC(4.00)
Unirrigated
(16)
624.65
546.00
157.58
530.63
1001.78
594.58
547.18
890.22
313.28
1250.13
913.50
940.00
374.00
Culturable waste
(including gouchar
and groves)
(17)
50.00
45.10
20.40
17.09
60.00
--.
1.00
Loca-Area not tion available Code
for cultiva- No. tion
(18) (1)
27.52 28
36.42 29
15.93 30
33.55 31
82.81 32
98.10 33
0.23 34
38.68 35
62.24 36
15.53 37
94.70 38
108.22 39
17.05 40

1158
6. BRUM C.D. BLOCK - contd. VlLLAOB
Loca- Name of Villag. Total toW Amenltid available (if not available within the village. a duh tion area ·popUla· (-) iI shown in the Mlumh dd n .. lt to it in bracket the diltance Code of the tiob lI1d in bl't)ad ranaes vilt. 15 knui, 6·10 kma. and 10 + luna of the No. villII' no. of neareat place where the facUity is available ill giVeJ1)
(in hbuaeholdB Eduea- Medical Drit1kin, Polt Dat or Com-hectarea rounded tiona! Water M.d days of munica·
upto (potable) Telelfaph market! tiol1 (Bul
two hat Stop, decimal if any lUilway
pl"cea) Station, Waterway)
(1) (2) (3) (4) (5) (8) (7) (8) (9) (10)
41 Shendi 392.52 ~: 473 P He W +5) .(10+) BS H: 98 AC PHS HP
(,2 Jawalka 707.04 P: 637 P ·(·5) W ·(-5) -(-5) BS H: 12. AC UP
, 43 Tandulwadi 1424.01 P: 1634 P -(-5) W .(..'5) -(-5) BS
H: 308 M HP AC
44 Saramkundi 1652.22 P: 2299 P liC W PO .(5·10) BS H:430 M PHS HP
H AC
45 Ya8a~andi 970.00 P: 1i83 P -(.5) W ·(-5) -(10+) as H: 118 AC HP
46 Mahaldarpuri 165.25 P: 217 P ·(·5) W -(-5) ·(5-10) BS H: 43 AC tiP
R
47 Kawadewadi (N.V.) 421.73 P: 507 P -(-5) W -(.5) -(-5) BS H: 84 AC HP
48 Washi 5303.01 P: 12397 P(2) H T PrO Sun BS H: 2365 M(2) MCW W
H(2) MH PUC HC C PHC AC PHS
FPC TB NH RP
49 Kelewadi 754.29 P: 804 P ·(·5) W -(-5) -(.5) BS H: 128 AC HP
50 Kanheri 1360.72 P: 1200 P ·(5-10) W -(5-10) -(5·10) BS H: 228 M HP
AC
51 Pardi 740.63 P: 826 P -(10+) T -(-5) -(10+) . BS H: 170 M W
AC HP
52 Golegaon 491.83 P: 750 P -(10+) W -(·5) -(10+) . BS H: 138 M HP
AC
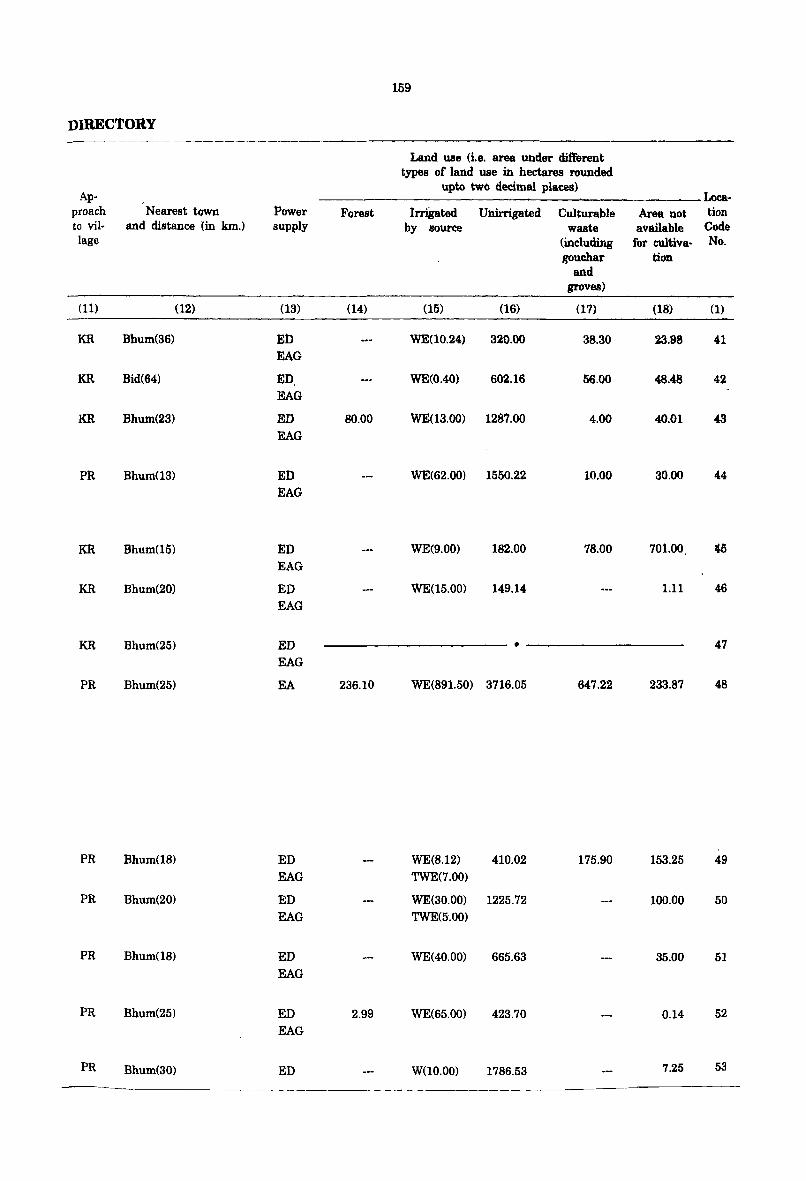
159
DIRECTORY
Land use (i.e. area under different types of land use in hectares rounded
Ap· upto two decimal places)
Loca· proach Nearest town Power Forest IrriBated Unirrigated Culturable Area not tion to viI· and distance (in km.) supply by source waste a\Ta.ilable Code lage (ineiuding for cultiva· No.
gouehar tion and
groves)
(11) (12) (13) (14) (15) (16) (17) (18) (1)
KR Bhum(36) ED WE(10.24) 320.00 38.30 23.98 41 EAG
KR Bid(64) ED WE(0.40) 602.16 56.00 48.48 42 EAG
KR Bhum(23) ED 80.00 WE(13.00) 12a7.00 4.00 40.01 43
EAG
PR Bhum(13) ED WE(62.00) 1550.22 10.00 30.00 44
EAG
KR Bhum(15) ED WE(9.00) 182.00 78.00 701.00 45 EAG
KR Bhum(20) ED WE(15.00) 149.14 1.11 46
EAG
KR Bhum(25) ED • 47
EAG
PR Bhum(25) EA 236.10 WE(891.50) 3716.05 647.22 233.87 48
PR Bhum(18) ED WE(B.12) 410.02 175.90 153.25 49 EAG TWE(7.00)
PR Bhum(20) ED WE(30.00) 1225.72 100.00 50 EAG TWE(5.00)
PR Bhum(18) ED WE(40.00) 665.63 35.00 51 EAG
PR Bhum(25) ED 2.99 WE(65.00) 423.70 0.14 52
EAG
PR Bhum(30) ED W(10.00) 1786.53 7.25 53
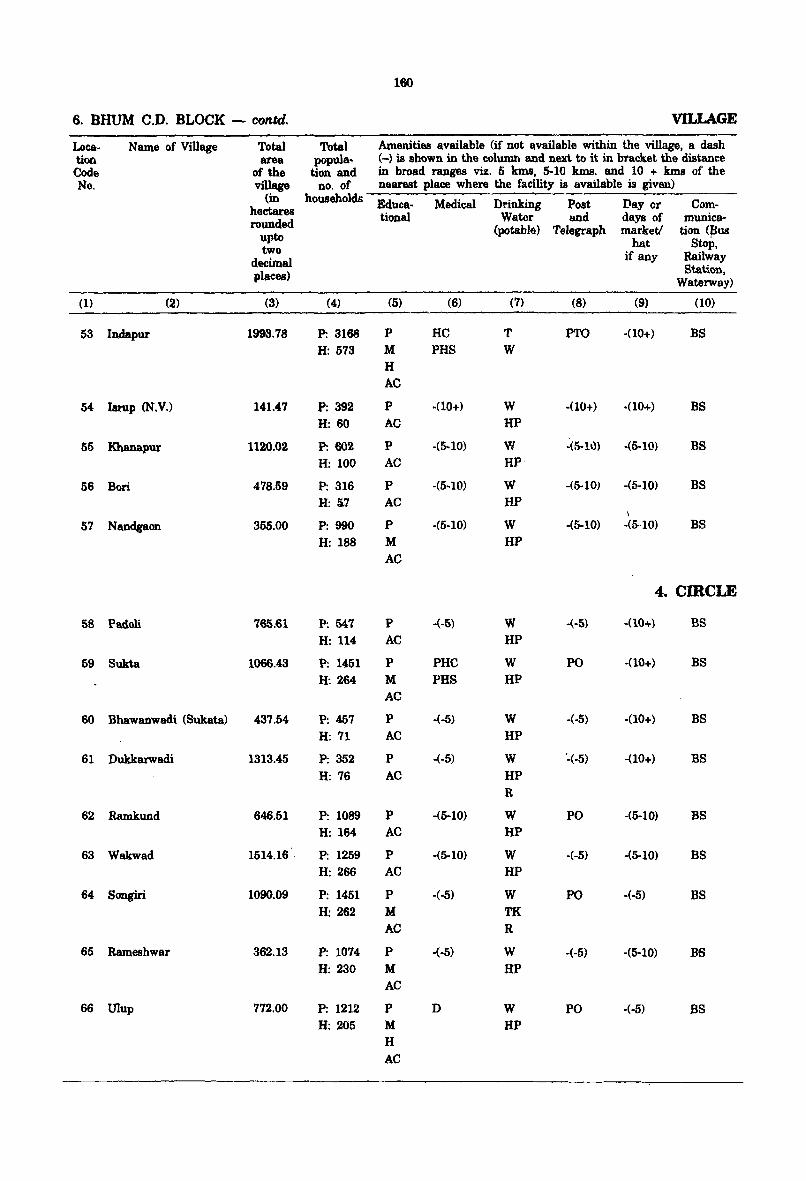
160
6. BHUM C.D. BLOCK - contd. VILLAGE
Loea- Name of Village Total Total Amenities available (if not available within the village, a dash tion area popula. (-) is shown in the column and next to it in bracket the distance Code of the tion and in broad ranges viz. 5 kms, 5-10 kms. and 10 + kms of the No. village no. of nearest place where the facility is available is given)
(in households Educa- Medical Drinking Post Day or Com-hectares rounded tional Water and days of munica-
upto (potable) Telegraph market! tion <Bus
two hat Stop,
decimal if any Railway
places) Station, Waterway)
(1) (2) (3) (4) (5) (6) (7) (8) (9) (10)
53 Indapur 1993.78 P: 3168 P HC T PTO -(10+) BS H: 573 M PHS W
H AC
54 IstOp (N.V.) 141.47 P: 392 P ·(10+) W ·(10+) -(10+) BS H: 60 AC HP
55 Khanapur 1120.02 P: 602 P -(5-10) W -(li-lo) -(5-10) BS
H: 100 AC HP
56 Bori 478.59 P: 316 P -(5·10) W -(5·10) ·(5-10) BS
H: fi,7 AC HP \
57 Nandgaon 355.00 P: 990 P ·(5·10) W ·(5-10) -(5-10) BS
H: 188 M HP
AC
4. CIRCLE
58 Padoli 765.61 P: 547 P .(-5) W -(-5) ·(10+) BS
H: 114 AC HP
59 Sukta 1066.43 P: 1451 P PHC W PO -(10+) BS
H: 264 M PHS HP AC
60 Bhawanwadi (Subta) 437.54 P: 457 P -(-5) W -(-5) -(10+) BS
H: 71 AC HP
61 Dukkarwadi 1313.45 P: 352 P -(-5) W '-(-5) -(10+) BS
H: 76 AC HP
R
62 Ramkund 646.51 P: 1089 P -(5-10) W PO -(5-10) BS H: 164 AC HP
63 Wakwad 1514.16. P: 1259 P -(5-10) W -(-5) -(5-10) BS H: 266 AC HP
64 Songiri 1090.09 P: 1451 P -(-5) W PO -(-5) BS H: 262 M TK
AC R
65 Rameshwar 362.13 P: 1074 P -(-5) W ·(·5) ·(5-10) BS H: 230 M HP
AC
66 Ulup 772.00 P: 1212 P D W PO -(·5) BS H: 205 M HP
H
AC
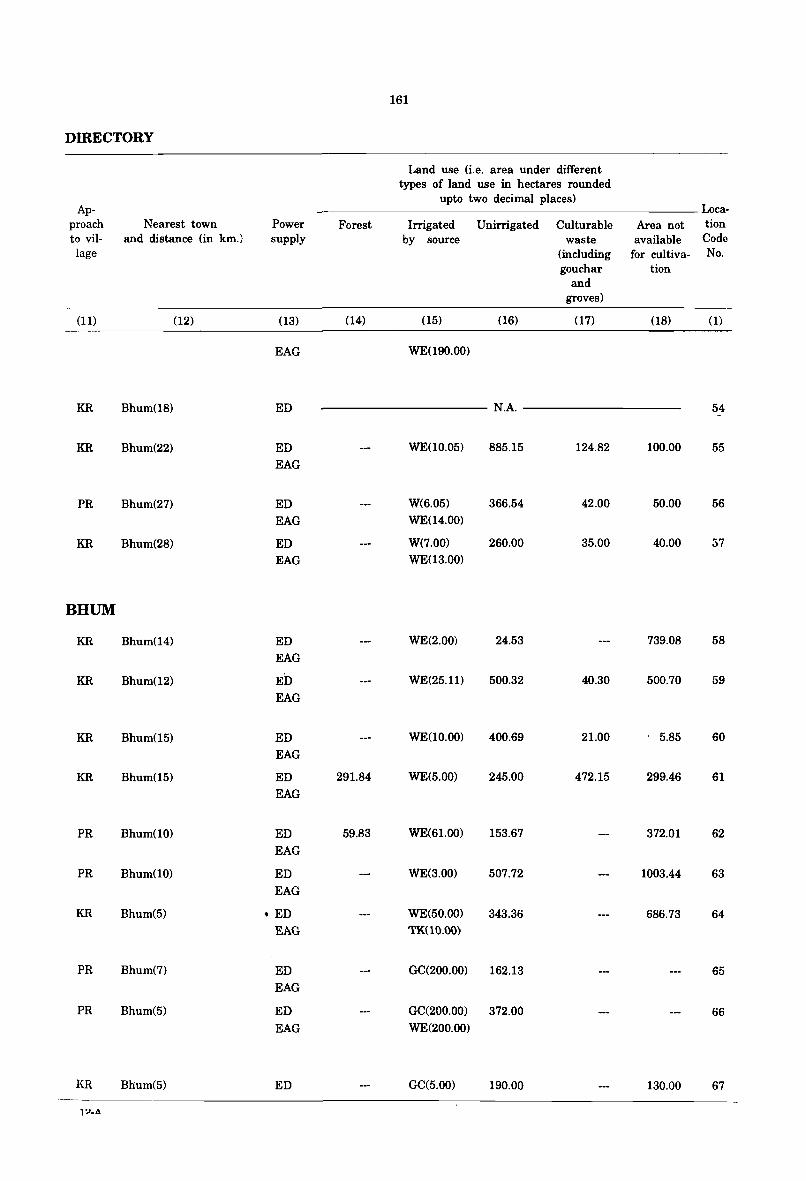
nffiECTORY
Ap-proach Nearest town Power to vil- and distance (in km.) supply lage
(11) (12) (13)
EAG
KR Bhum(18) ED
KR Bhum(22) ED EAG
PR Bhum(27) ED EAG
KR Bhum(28) ED EAG
BHUM
KR Bhum(14) ED
EAG
KR Bhum(12) ED EAG
KR Bhum(15) ED
EAG
KR Bhum(15) ED EAG
PR Bhum(10) ED
EAG
PR Bhum(10) ED
EAG
KR Bhum(5) • ED
EAG
PR Bhum(7) ED
EAG
PR Bhum(5) ED
EAG
KR Bh:um(5) ED
1 :>_A
161
Land use (i.e. area under different types of land use in hectares rounded
upto two decimal places) _______________________ Loca-
Forest Irrigated Unirrigated by source
(14) (15) (16)
WE(190.00)
N.A.
WE(10.05) 885.15
W(6.05) 366.54 WE(14.00)
W(7.00) 260.00 WE(13.00)
WE(2.00) 24.53
WE(25.11) 500.32
WE(10.00) 400.69
291.84 WE(5.00) 245.00
59.83 WE(61.00) 153.67
WE(3.00) 507.72
WE(50.00) 343.36 TK(10.00)
GC(200.00) 162.13
GC(200.00) 372.00 WE(200.00)
GC(5.00) 190.00
Culturable waste
(including gouchar
and groves)
(17)
124.82
42.00
35.00
40.30
21.00
472.15
Area not tion available Code
for cultiva- No. tion
(18) (1)
54 -
100.00 55
50.00 56
40.00 37
739.08 58
500.70 59
. 5.85 60
299.46 61
372.01 62
1003.44 63
686.73 64
65
66
130.00 67
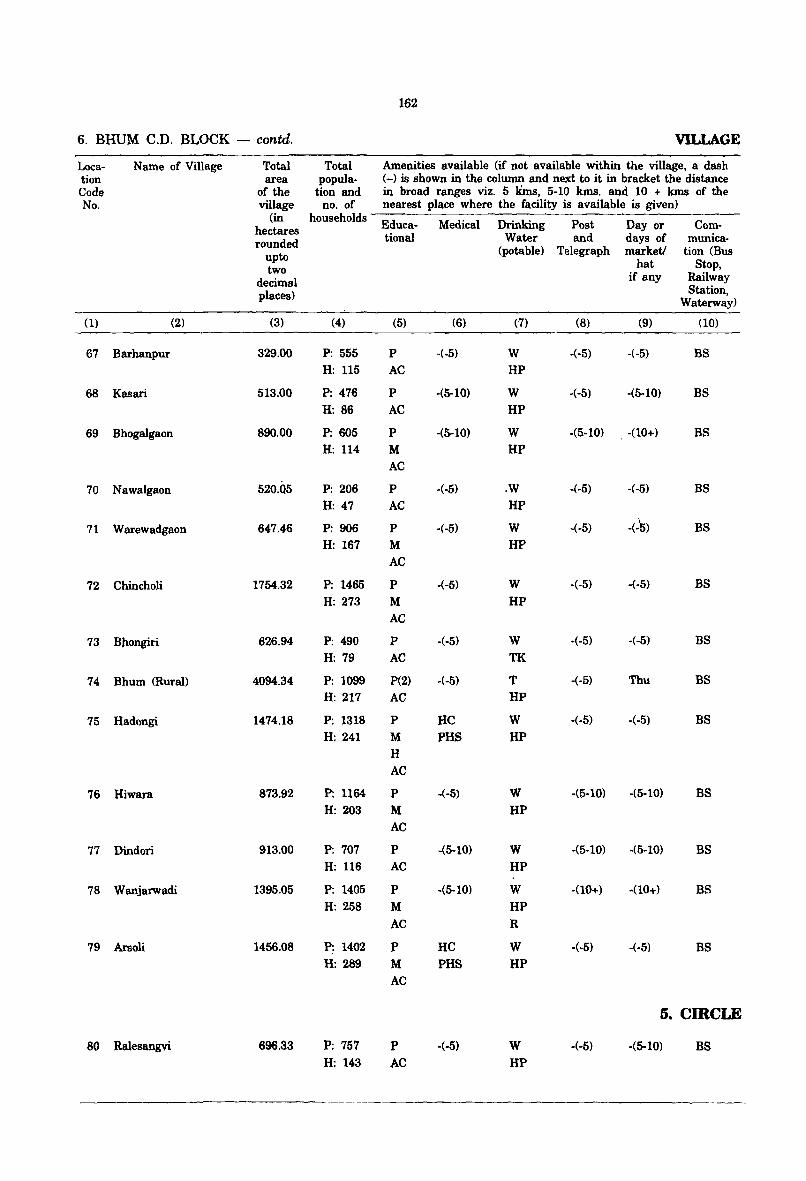
162
6. BHUM C.D. BLOCK - contd. VILLAGE
Laca- Name of Village Total Total Amenities available (if not available within the village, a dash tion area popula- (-) is shown in the column and next to it in bracket the distance Code of the tion and in broad ranges viz. 5 kmS, 5-10 luns. and 10 + kms of the No. village no. of nearest place where the facility is available is given)
(in households Educa- Medical Drinking Post Day or Com-hectares rounded tional Water and days of munica-
upto (potable) Telegraph market! tion (Bus
two hat Stop,
decimal if any Railway
places) Station, Waterway)
(1) (2) (3) (4) (5) (6) (7) (8) (9) (10)
67 Barhanpur 329.00 P: 555 P -(-5) W -(-5) -(-5) BS H:1l5 AC HP
68 Kasari 513.00 P: 476 P -(5-10) W -(-5) -(5--10) BS H: 86 AC HP
69 Bhogalgaon 890.00 P: 605 P -(5-10) W -(5,10) -(10+) BS H: 114 M HP
AC
70 Nawalgaon 520.Q5 P: 206 P -(-5) .W ·(-5) ·(-5) BS H: 47 AC HP
71 Warewadgaon 647.46 P: 906 P -(-5) W -(-5) +5) BS H: 167 M HP
AC
72 Chincholi 1754.32 P: 1465 P -(-5) W ·(-5) -(-5) BS H: 273 M HP
AC
73 Bllongiri 626.94 P: 490 P -(-5) W -(-5) -(-5) BS H: 79 AC TK
74 Bhum (Rural) 4094.34 P: 1099 P(2) -(-5) T -(-5) Thu BS H: 217 AC HP
75 Hadongi 1474.18 P: 1318 P He W -(-5) -(-5) BS H: 241 M PHS HP
H AC
76 Hiwara 873.92 P: 1164 P -(-5) W -(5-10) -(5-10) BS H: 203 M HP
AC
77 Dindori 913.00 P: 707 P -(5-10) W -(5-10) -(5-10) BS H:1l6 AC HP
78 Wanjarwadi 1395.05 P: 1405 P ·(5-10) W -(10+) -(10+) BS H: 258 M HP
AC R
79 Arsoli 1456.08 P: 1402 P HC W -(·5) -(-5) BS H: 289 M PHS HP
AC
5. CIRCLE
80 Ralesangvi 696.33 P: 757 P -(·5) W -(-5) ·(5-10) BS H: 143 AC HP
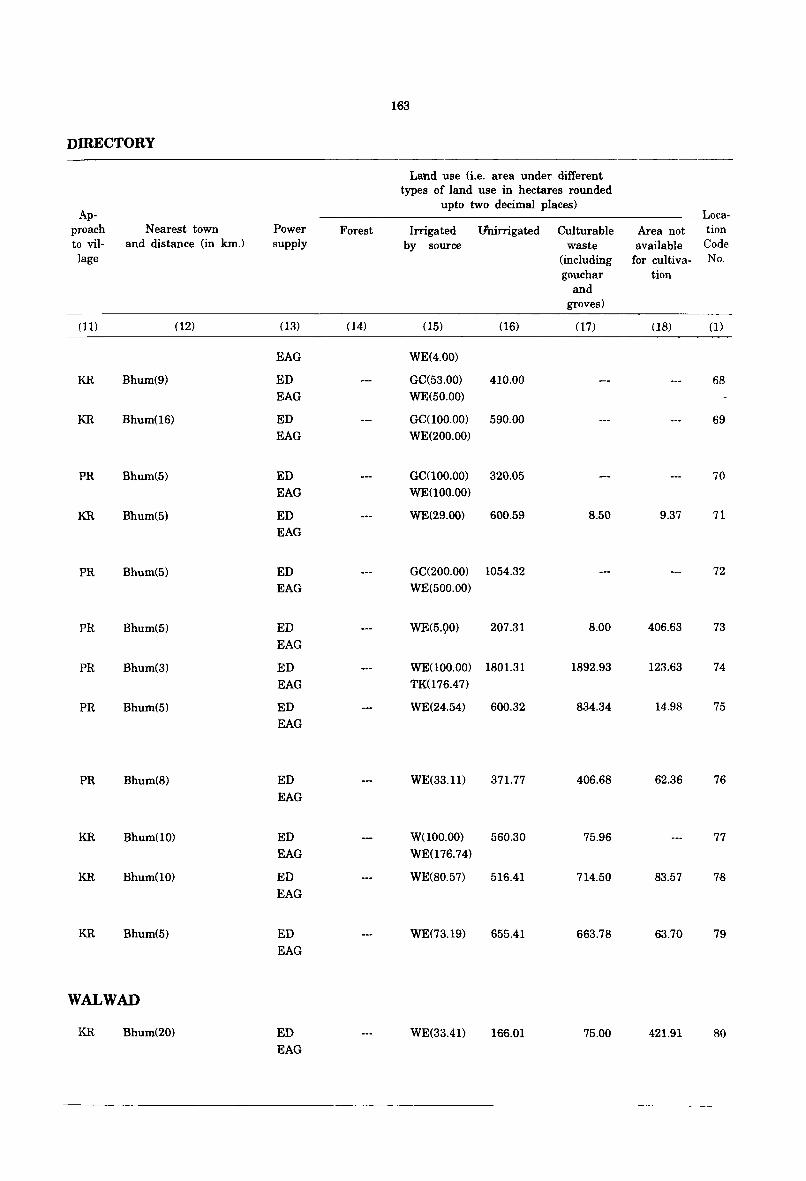
163
DIRECTORY
Land use (i.e. area under different types of land use in hectares rounded
Ap-upto two decimal places)
Loca-proach Nearest town Power Forest Irrigated U'nirrigated Culturable Area not tion to vil- and distance (in km.) supply by source waste available Code lage (including for cultiva- No.
gouchar tion and
groves)
(11) (12) (13) (14) (15) (16) (17) (18) (1)
EAG WE(4.00)
KR Bhum(9) ED GC(53.00) 410.00 68 EAG WE(50.00)
KR Bhum(16) ED GC(100.00) 590.00 69 EAG WE(200.00)
PR Bhum(5) ED GC(100.00) 320.05 70
EAG WE(100.00)
KR Bhum(5) ED WE(29.00) 600.59 8.50 9.37 71 EAG
PR Bhum(5) ED GC(200.00) 1054.32 72
EAG WE(500.00)
PR Bhum(5) ED WE(5.QO) 207.31 8.00 406.63 73
EAG
PR Bhum(3) ED WE(100.00) 1801.31 1892.93 123.63 74
EAG TK(176.47)
PR Bhum(5) ED WE(24.54) 600.32 834.34 14.98 75
EAG
PR Bhum(8) ED WE(33.H) 371.77 406.68 62.36 76
EAG
KR Bhum(10) ED W(100.00) 560.30 75.96 77
EAG WE(176.74)
KR Bhum(10) ED WE(80.57) 516.41 714.50 83.57 7£
EAG
KR Bhum(5) ED WE(73.19) 655.41 663.78 63.70 79
EAG
WALWAD
KR Bhum(20) ED WE(33.41) 166.01 75.00 421.91 80 EAG
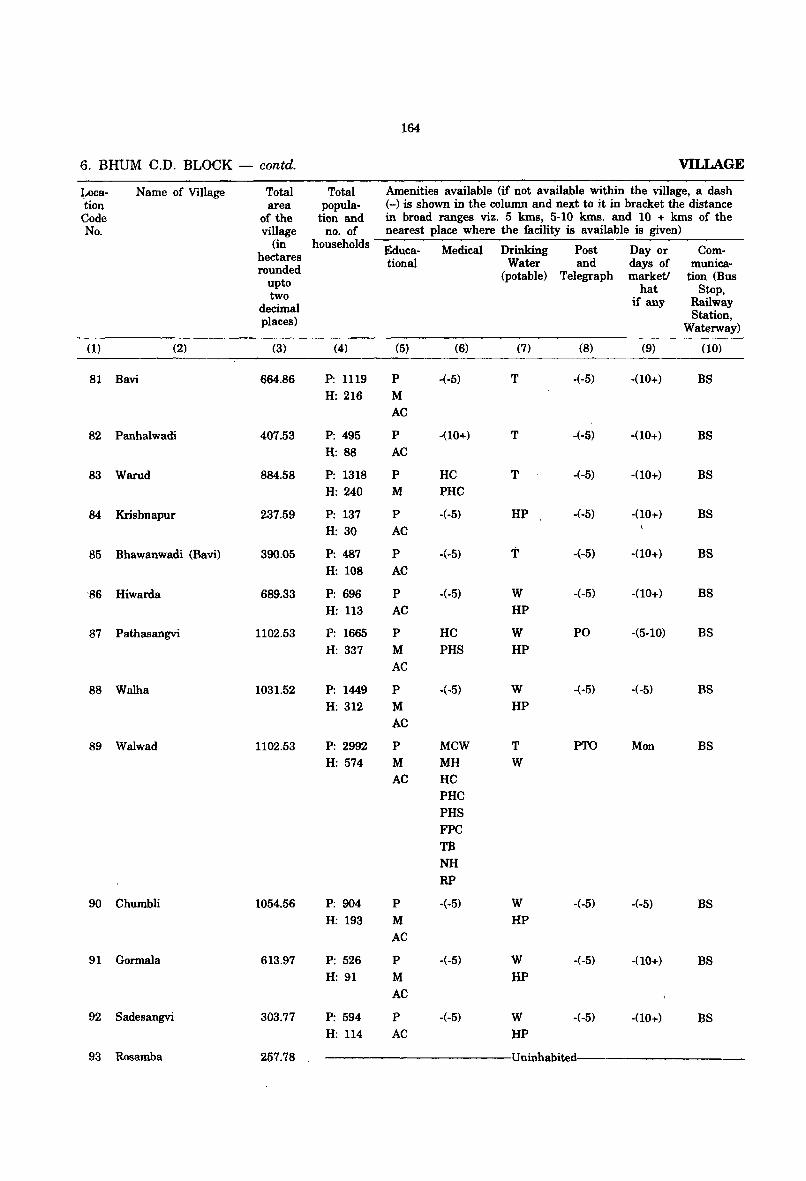
164
6. BHUM C.D. BLOCK - contd. VILLAGE
~oca- Name of Village Total Total Amenities available (if not available within the village, a dash tion area popula- (-) is shown in the column and next to it in bracket the distance
Code of the tion and in broad ranges viz. 5 kms, 5-10 kms. and 10 + kms of the No. village no. of nearest place where the facility is available is given)
(in households Educa- Medical Drinking Post Day or Com-hectares rounded tional Water and days of munica-
upto (potable) Telegraph marketl tion (Bus
two hat Stop,
decimal if any Railway
places) Station, Waterway)
(1) (2) (3) (4) (5) (6) (7) (8) (9) (10)
81 Bavi 664.86 P: 1119 P ·(·5) T ·(·5) ·(10+) BS H: 216 M
AC
82 Panhalwadi 407.53 P: 495 P -(10 .... ) T -(-5) -(10+) BS H: 88 AC
83 Warud 884.58 P: 1318 P HC T -(-5) -(10+) BS H: 240 M PHC
84 Krishnapur 237.59 P: 137 P -(-5) HP -(-5) -(10+) BS
H: 30 AC
85 Bhawanwadi (Bavi) 390.05 P: 487 P -(·5) T -(-5) -(10+) BS
H: 108 AC
'86 Hiwarda 689.33 P: 696 P ·(-5) W -(-5) ·(10+) BS H: 113 AC HP
87 Pathasangvi 1102.53 P: 1665 P HC W PO -(5·10) BS H: 337 M PHS HP
AC
88 Walha 1031.52 P: 1449 P -(-5) W -(-5) -(-5) BS H: 312 M HP
AC
89 Walwad 1102.53 P: 2992 P MCW T PTO Mon BS H: 574 M MH W
AC HC PHC PHS FPC TB NH RP
90 Chumbli 1054.56 P: 904 P -(-5) W -(-5) -(-5) BS H: 193 M HP
AC
91 Gormala 613.97 P: 526 P -(-5) W -(·5) -(10+) BS H: 91 M HP
AC
92 Sadesangvi 303.77 P: 594 P -(-5) W -(-5) ·(10+) BS H: 114 AC HP
93 Rosamba 257.78 Uninhabited
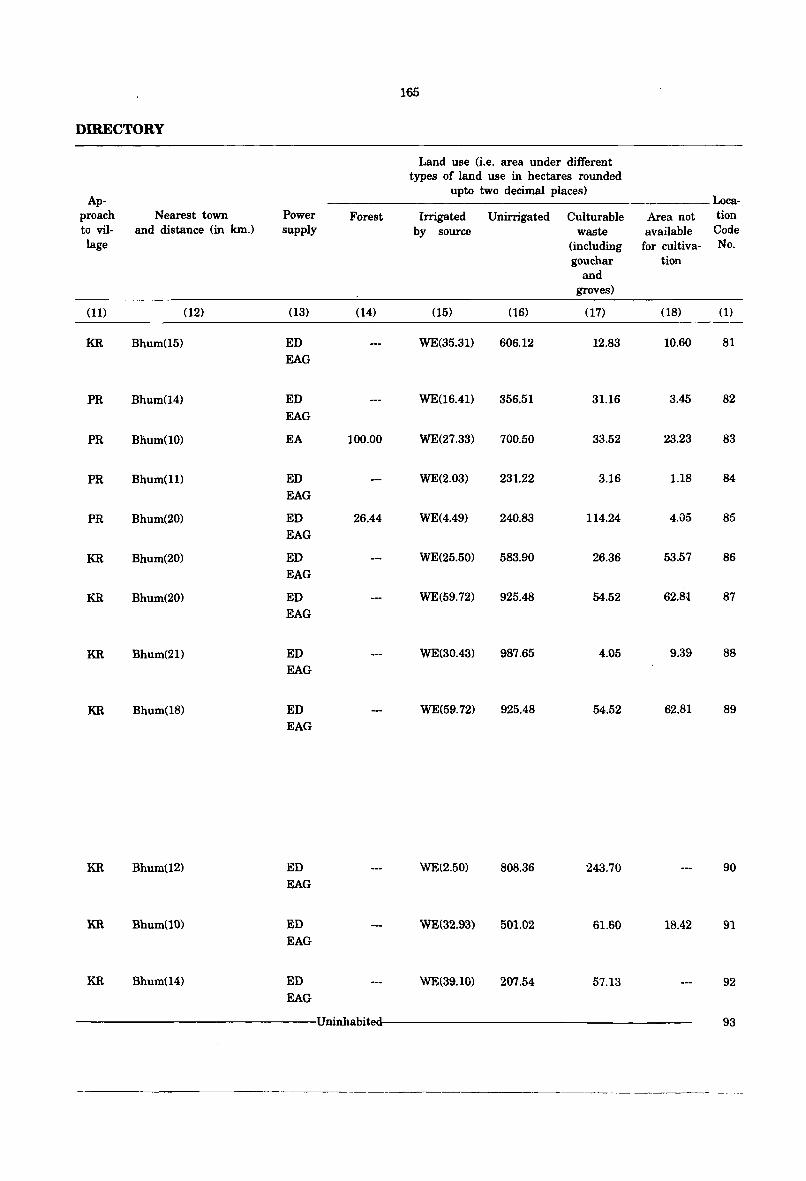
165
DIRECTORY
Land use (i.e. area under different types of land use in hectares rounded
Ap-upto two decimal places)
Loca-proach Nearest town Power Forest Irrigated Unirrigated Culturable Area not tion to vil- and distance (in km.) supply by source waste available Code lage (including for cultiva- No.
gouchar tion and
groves)
(11) (12) (13) (14) (15) (16) (17) (18) (1)
KR Bhum(15) ED WE(35.31) 606.12 12.83 10.60 81 EAG
PR Bhum(14) ED WE(16.41) 356.51 31.16 3.45 82
EAG
PR Bhum(10) EA 100.00 WE(27.33) 700.50 33.52 23.23 83
PR Bhum(11) ED WE(2.03) 231.22 3.16 1.18 84
EAG
PR Bhum(20) ED 26.44 WE(4.49) 240.83 114.24 4.05 85 EAG
KR Bhum(20) ED WE(25.50) 583.90 26.36 53.57 86
EAG
KR Bhum(20) ED WE(59.72) 925.48 54.52 62.8i 87 EAG
KR Bhum(21) ED WE(30.43) 987.65 4.05 9.39 88 EAG
KR Bhum(18) ED WE(59.72) 925.48 54.52 62.81 89 EAG
KR Bhum(12) ED WE(2.50) 80B.36 243.70 90 EAG
KR Bhum(10) ED WE(32.93) 501.02 61.60 1B.42 91 EAG
KR Bhum(14) ED WE(39.10) 207.54 57.13 92 EAG
Uninhabite 93
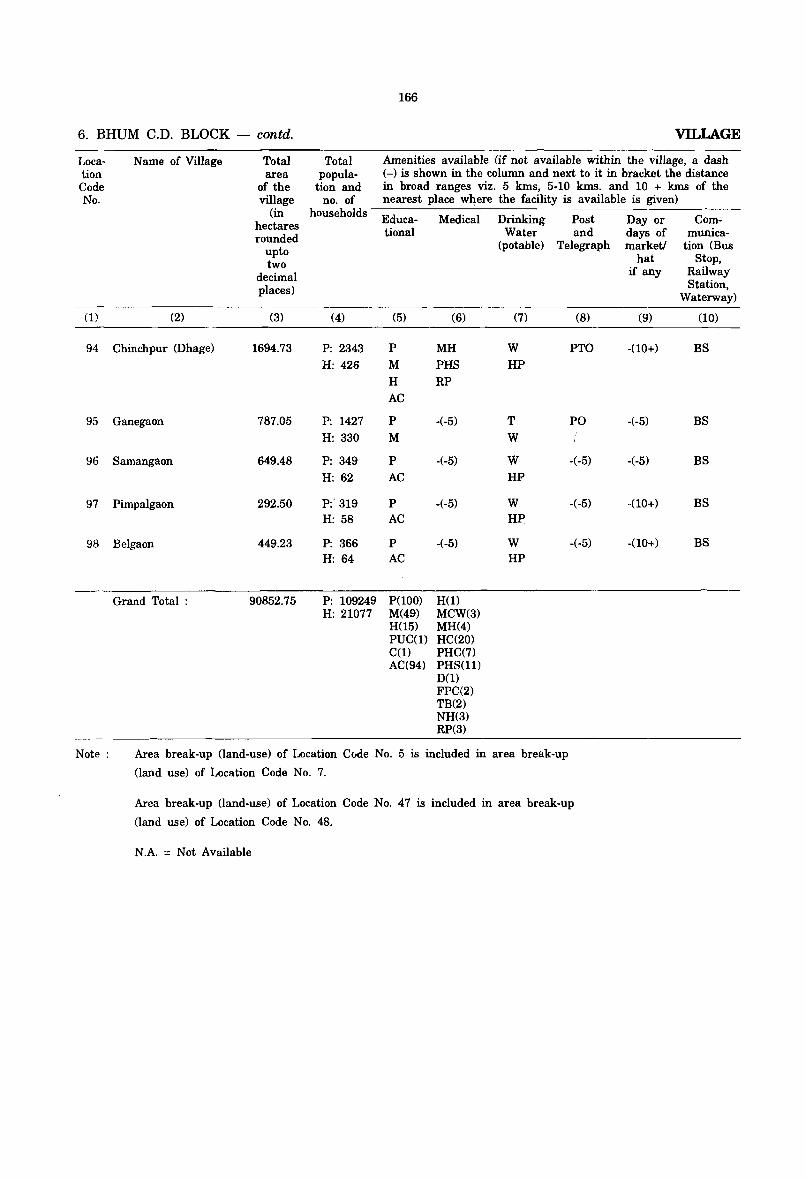
166
6. BHUM C.D. BLOCK - contd. VILLAGE
Loca-tion Code No.
(1)
94
95
96
97
98
Note:
Name of Village Total Total Amenities available (if not available within the village, a dash area popula- (-) is shown in the column and next to it in bracket the distance
of the tion and in broad ranges viz. 5 luns, 5-10 kms. and 10 + luns of the village no. of nearest place w4ere the facility is available is given)
(in households Educa- Medical Drinking Post hectares tional Water and rounded upto (potable) Telegraph
two decimal places)
(2) (3)
Chinchpur (Dhage) 1694.73
Ganegaon 787.05
Samangaon 649.48
Pimpalgaon 292.50
Belgaon 449.23
Grand Total : 90852.75
(4)
P: 2343 H: 426
P: 1427 H: 330
P: 349 H: 62
P:·319 H: 58
P: 366 H: 64
P: 109249 H: 21077
(5)
P M H AC
P M
P AC
P AC
P AC
P(100) M(49) H(5) PUCO) CO) AC(94)
(6)
MH PHS RP
-(-5)
-(-5)
-(-5)
-(-5)
H(I) MCW(3) MH(4) HC(20) PHC(7) PHS(ll) DO) FPC(2) TB(2) NH(3) RP(3)
(7)
W HP
T W
W HP
W HP:
W HP
Area break-up (land-use) of Location C!Jde No. 5 is included in area break-up
(land use) of Location Code No.7.
(8)
PTO
PO
-(-5)
-(-5)
-(-5)
Area break-up (land-use) of Location Code No. 47 is included in area break-up
(land use) of Location Code No. 48.
N.A. = Not Available
Day or days of market!
hat if any
(9)
-00+)
-(-5)
-(-5)
-00+)
-00+)
Com-munica-
tion (Bus Stop,
Railway Station,
Waterway)
(10)
BS
BS
BS
BS
BS
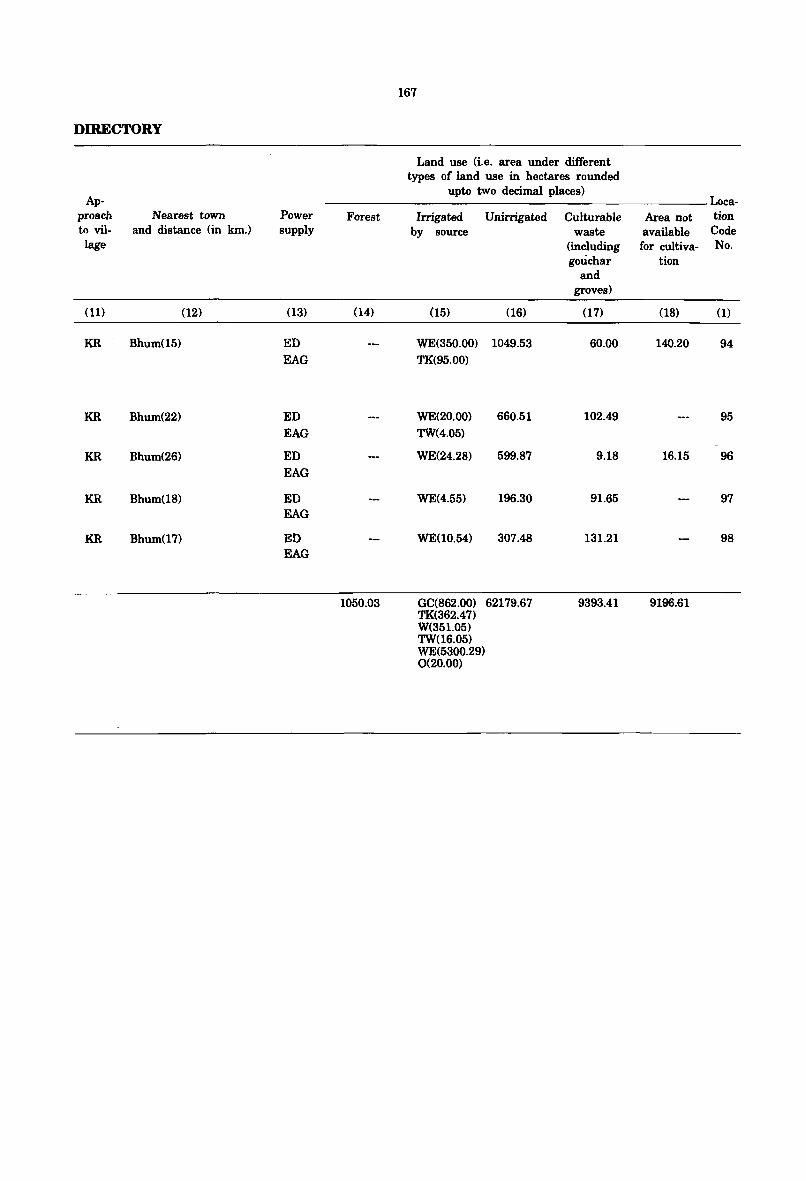
167
DIRECTORY
Land use (i.e. area under different types of land use in hectares rounded
Ap-upto two decimal places)
Loca-proach Nearest town Power Forest Irrigated Unirrigated Culturable Area not tion to viI- and distance (in kIn.) supply by source waste available Code
lage (including for cultiva- No. gouchar tion
and groves)
(11) (12) (13) (14) (15) (16) (17) (18) (1)
KR Bhum(15) ED WE(350.00) 1049.53 60.00 140.20 94 EAG TK(95.00)
KR Bhum(22) ED WE(20.00) 660.51 102.49 95 EAG TW(4.05)
KR Bhum(26) ED WE(24.28) 599.87 9.18 16.15 96 EAG
KR Bhum(18) ED WE(4.55) 196.30 91.65 97 EAG
KR Bhum(17) ED WE(10.54) 307.48 131.21 98 EAG
1050.03 GC(862.00) 62179.67 9393.41 9196.61 TK(362.47) W(35 1.05) TW(16.05) WE(5300.29) 0(20.00)
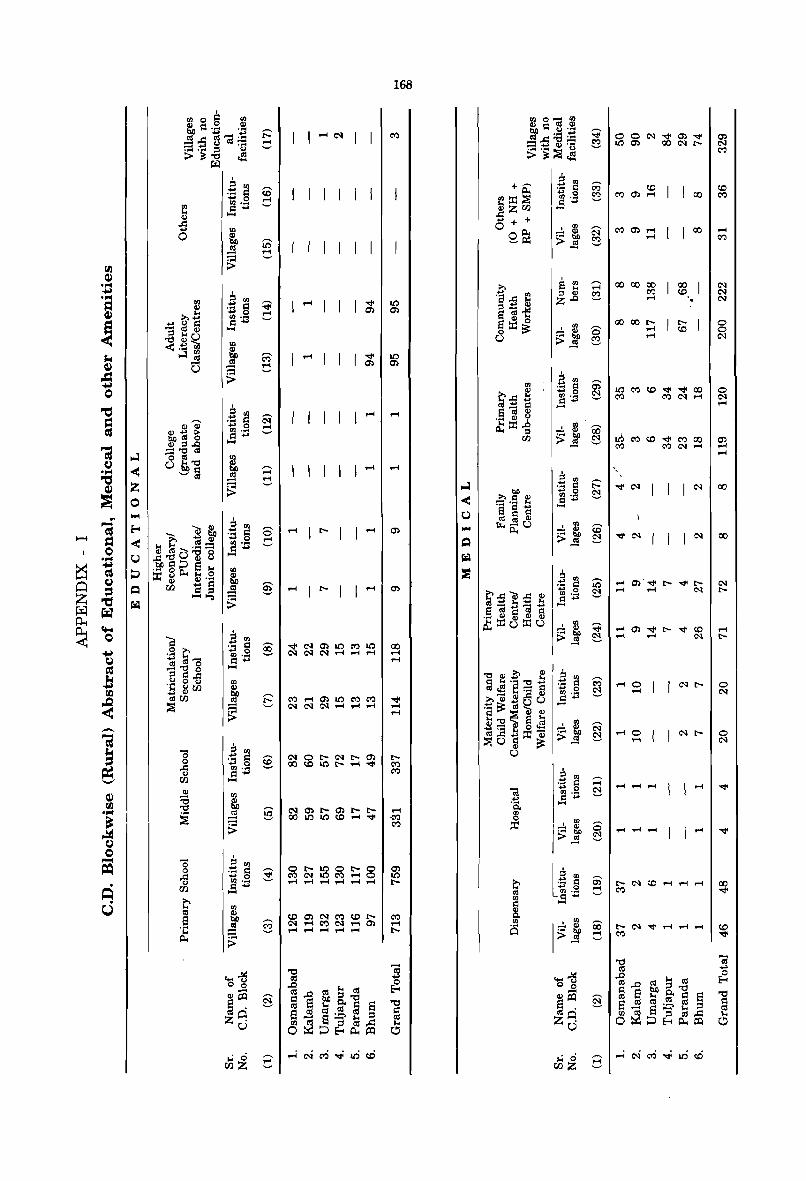
~
-< z o ...
= Ul .~ = .... 0 Ul· ... 1:: .... ....
I
.B Ul :;l § Ul .... 1:: .... .....
.... ~ o 0
e~ "'0 Z· o
'0 r}5z
I ..... C'I I
I ~ I ~
I ~ I ~
I~
I~
8 ..... ~
168
...
'0 r}5z
00001:~ ~
100
1 00
~I ' . ~I
~ .-4..... I I .....
~.-4"'" 11.-4
o o C'l
00
00
~ r:-
o C'l

~
"t:i ~ i:f;
~
I=: Cl 0
I r ...... ~
~ Cl Z ~ ~
~
"'obO :>.
Ij,·Jh~. ~~ "' .... ~ ~i' ~.s'E""
CIl CIl d CIl
S 0 ~ ::S~o ~ '" ....
0 ~ + llz .... 0+
!"B
"a = '" 0
'"' CIl .e: ~
S' d:! "I:j a lI:
1 Eo<
~ ~
'0 Jiz
c;-::!
~ I(J
~ ..... .....
;::; ~
~
0; I:--~ .....
ex> I:--~ I:--
t::: I ~
G I(J
~ ..... .....
169
-.t' ~ ~ 0 ..... C'I ..... 0 ~ 0 0) 0) ..... ..... ..... I(J
1 ..... .....
1 1
C'I -.t'~ I:-- 0 ~ ..... CI'J ..... <Xl
0) ~ I(J I:-- 0 -.t' 0) C'I C'I ~ <Xl I:--..... ..... I(J
C'I ..... I I
C'I I(J
CXl <Xl -.t' CXl 0) C'I 0 C'I C'I 0) <Xl ~ ..... ..... ..... ~
CIl
~ .... :is c;-o~ z .; e 0.. >
~ '" 00
~ r:sl CIl
~ :is
~ '" :; e ~
CIl :Co '" '"' :>.
...... bO~ '" ..... .s: co is: e "'~
00 z z 0
~ :>'''' 0 CCI g
8
~ ~ ..... ~~. e
00 ~ ::s 0 0
:g P- O; ~~ ::!
~ ex>
~ ~
"I:j
~ § t:::
t f ::!
i ~ ]§ ~ $
~f ::! ~
~ Eo< 00
~ 0 to t ~
..... I I I 1 1
1(J00Cl'JI(J~t-C'I ..... Cl'JC'I ..... o) .........................
I 1 1 I I I
<Xl I I I 1 1
O)-.t'C'lI:--Cl'JI:--0)0) ..... 01:--0) ..........
..... IC'I 1 I I
~ C'I \ ..... \ .....
Cl'JI:--~-.t' I I C'I
II:-- I I I~
.....
I(J ..... t-
<Xl
C'I <Xl I(J
CI'J
I:--
0 -.t'
~ .....
10 <Xl .....
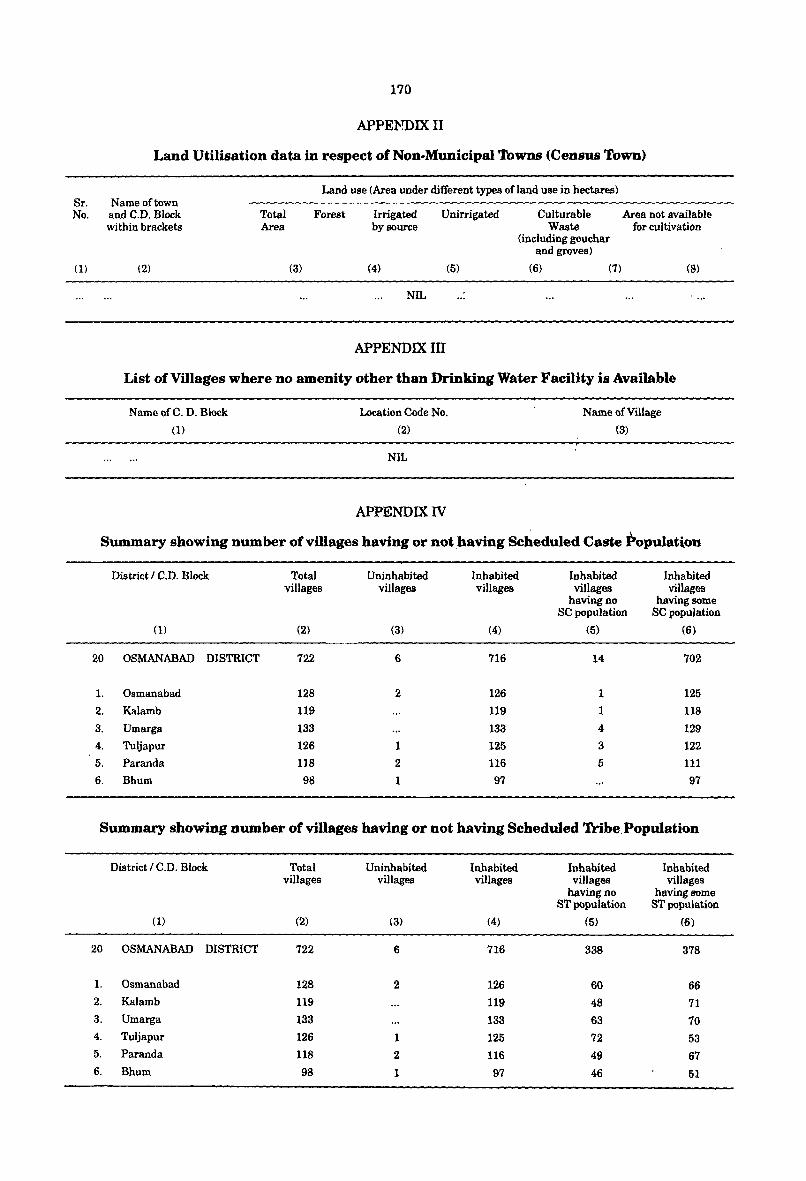
170
APPEl-mIX II
Land Utilisation data in respect of Non.Municipal Towns (Census Town)
Sr. Name of town No. and C.D. Block
within brackets
(1) (2)
Land use (Area under different types ofland use in hectares)
Total Forest Irrigated Unirrigated Culturable Area not available Area by source Waste for cultivation
(including gouchar and groves)
(3) (4) (5) (6) (7) (8)
NIL
APPENDIX III
List of Villages where no amenity other than Drinking Water Facility is Available
NameofC. D. Block
(1)
Location Code No.
(2)
NIL
APPENDIX IV
Name ofViUage
(3)
Summary showing number of villages having or not having Scheduled Caste itopulat(on
District I C.D. Block Total Uninhabited Inhabited Inhabited Inhabited villages villages villages villages villages
having no having some SC population SC population
(1) (2) (3) (4) (5) (6)
20 OSMANABAD DISTRICT 722 6 716 14 702
l. Osmanabad 128 2 126 1 125 2. Kalamb 119 119 1 118
3. Umarga 133 133 4 129 4. Tuljapur 126 1 125 3 122 5. Paranda 118 2 116 5 III
6. Bhum 98 1 97 97
Summary showing number of villages having or not having Scheduled Tribe.Population
District I C.D. Block Total Uninhabited Inhabited Inhabited Inhabited villages villages villages villages villages
having no having some ST population ST PQpulation
(1) (2) (3) (4) (5) (6)
20 OSMANABAD DISTRICT 722 6 716 338 378
1. Osmanabad 128 2 126 60 66 2. Kalamb 119 119 48 71 3. Umarga 133 133 63 70 4. Tuljapur 126 1 125 72 53 5. Paranda 118 2 116 49 67 6. Bhum 98 1 97 46 51
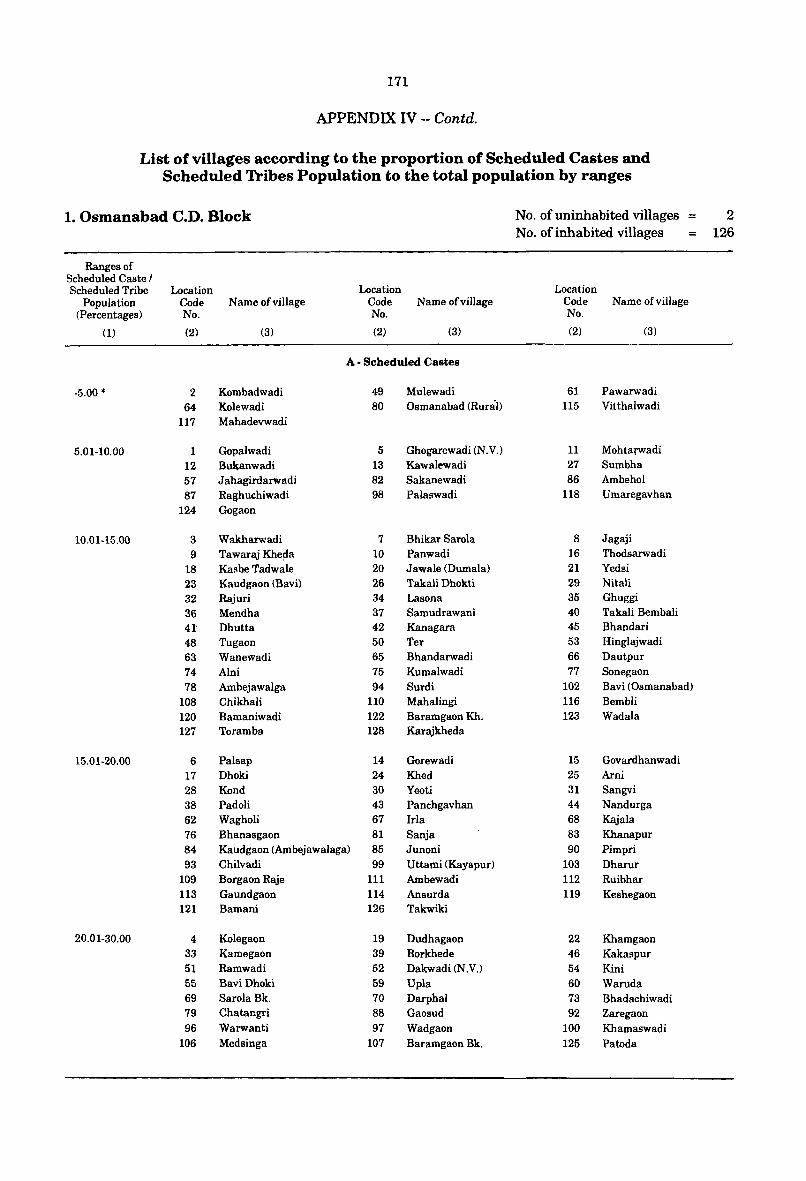
171
APPENDIX IV -- Contd.
List of villages according to the proportion of Scheduled Castes and Scheduled Tribes Population to the total population by ranges
1. Osmanabad C.D. Block No. of uninhabited villages = 2 No. of inhabited villages = 126
Ranges of Scheduled Caste I Scheduled Tribe Location Location Location
Population Code Name of viII age Code Name of village Code Name of viII age (Percentages) No. No. No.
m (2) (3) (2) (3) (2) (3)
A • Scheduled Castes
-5.00 * 2 Kombadwadi 49 Mulewadi 61 Pawarwadi 64 Kolewadi 80 Osmanabad (Runil) 115 Vitthalwadi
117 Mahadevwadi
5.01-10.00 1 Gopalwadi 5 Ghogarewadi (N.V.) 11 Mohtarwadi 12 Bukanwadi 13 Kawalewadi 27 Sumbha 57 J ahagirdarwadi 82 Sakanewadi 86 Ambehol 87 Raghuchiwadi 98 Palaswadi 118 Umaregavhan
124 Gogaon
10.01-15.00 3 Wakharwadi 7 Bhikar Sarola 8 Jagaji 9 Tawaraj Khe~a 10 Panwadi 16 Thodsarwadi
18 Kasbe Tadwale 20 Jawale (Dum ala) 21 Yedsi 23 Kaudgaon (Bavi) 26 Takali Dhokti 29 Nitali 32 Raj uri 34 Lasona 35 Ghuggi 36 Mendha 37 Samudrawani 40 Takali Bembali 41" Dhutta 42 Kanagara 45 Bhandari 48 Tugaon 50 Ter 53 Hinglajwadi 63 Wanewadi 65 Bhandarwadi 66 Dautpur 74 Alni 75 Kumalwadi 77 Sonegaon 78 Ambejawalga 94 Surdi 102 Bavi (Osmanabad)
108 Chikhali 110 Mahalingi 116 Bembli 120 Bamaniwadi 122 Baramgaon Kh. 123 Wadala 127 Toramba 128 Karajkheda
15.01-20.00 6 Palsap 14 Gorewadi 15 Govardhanwadi 17 Dhoki 24 Khed 25 Arni 28 Kond 30 Yeoti 31 Sangvi 38 Padoli 43 Panchgavhan 44 Nandurga 62 Wagholi 67 Irla 68 Kajala 76 Bhanasgaon 81 Sanja 83 Khanapur 84 Kaudgaon (Ambejawalaga) 85 Junoni 90 Pimpri 93 Chilvadi 99 Uttami (Kayapur) 103 Dharur
109 Borgaon Raje 111 Ambewadi 112 Ruibhar 113 Gaundgaon 114 Ansurda 119 Keshegaon 121 Bamani 126 Takwiki
20.01-30.00 4 Kolegaon 19 Dudhagaon 22 Khamgaon 33 Kamegaon 39 Borkhede 46 Kakaspur 51 Ramwadi 52 Dakwadi (N.V.) 54 Kini 55 Bavi Dhoki 59 Upla 60 Waruda 69 SarolaBk. 70 Darphal 73 Bhadachiwadi 79 Chatangri 88 Gaosud 92 Zaregaon 96 Warwanti 97 Wadgaon 100 Khamaswadi
106 Medsinga 107 Baramgaon Bk. 125 Patoda
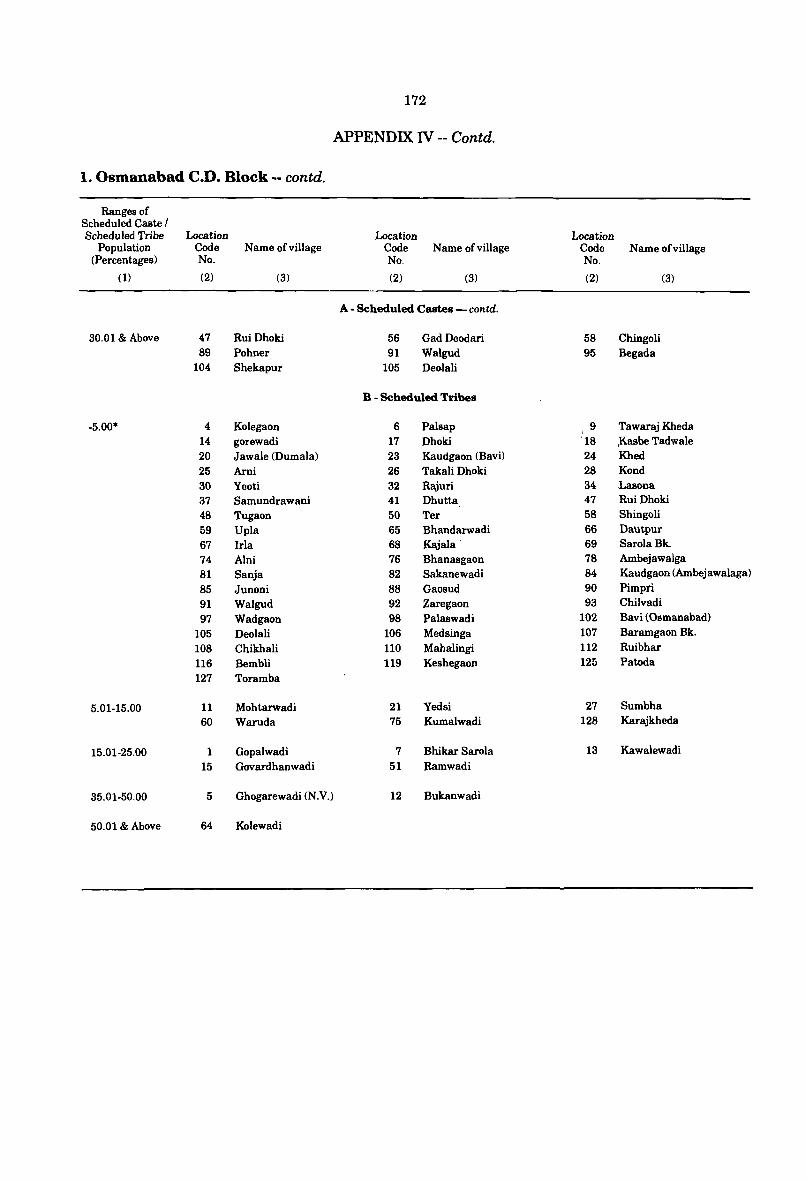
172
APPENDIX IV -- Contd.
1. Osmanabad C.D. Block -- contd.
Ranges of Scheduled Caste I Scheduled Tribe Location Location Location
Population Code Name of village Code Name ofvilJage Code Name ofvilJage (Percentages) No. No. No.
(1) (2) (3) (2) (3) (2) (3)
A· Scheduled Castes - contd.
30.01 & Above 47 RuiDhoki 56 Gad Deodari 58 Chingoli 89 Pohner 91 Walgud 95 Begada
104 Shekapur 105 Deolali
B • Scheduled Tribes
-5.00* 4 Kolegaon 6 Palsap 9 Tawaraj Kheda 14 gorewadi 17 Dhoki
118 ,!{ashe Tadwale
20 Jawale (Dumala) 23 Kaudgaon (Bavi) 24 Khed 25 Ami 26 Takali Dhoki 28 Kond 30 Yeoti 32 Rajuri 34 Lasona 37 Samundrawani 41 Dhutta 47 Rui Dhoki 48 Tugaon 50 Ter 58 Shingoli 59 Upla 65 Bhandarwadi 66 Dautpur 67 IrIa 68 Rajala 69 Saroia Bk. 74 Alni 76 Bhanasgaon 78 Ambejawalga
81 Sanja 82 Sakanewadi 84 Kaudgaon (Amhejawalaga)
85 Junoni 88 Gaosud 90 Pimpri
91 Walgud 92 Zaregaon 93 Chilvadi
97 Wadgaon 98 Palaswadi 102 Bavi (Osmanabad)
105 Deolali 106 Medsinga 107 Baramgaon Bk.
108 Chikhali 110 Mahalingi 112 Ruibhar
116 Bembli 119 Keshegaon 125 Patoda
127 Toramba
5.01-15.00 11 Mohtarwadi 21 Yedsi 27 Sumbha 60 Waruda 75 Kumalwadi 128 Karajkheda
15.01-25.00 1 Gopalwadi 7 Bhikar Sarola 13 Kawalewadi
15 Govardhanwadi 51 Ramwadi
35.01-50.00 5 Ghogarewadi (N.V.) 12 Bukanwadi
50.01 & Above 64 Kolewadi
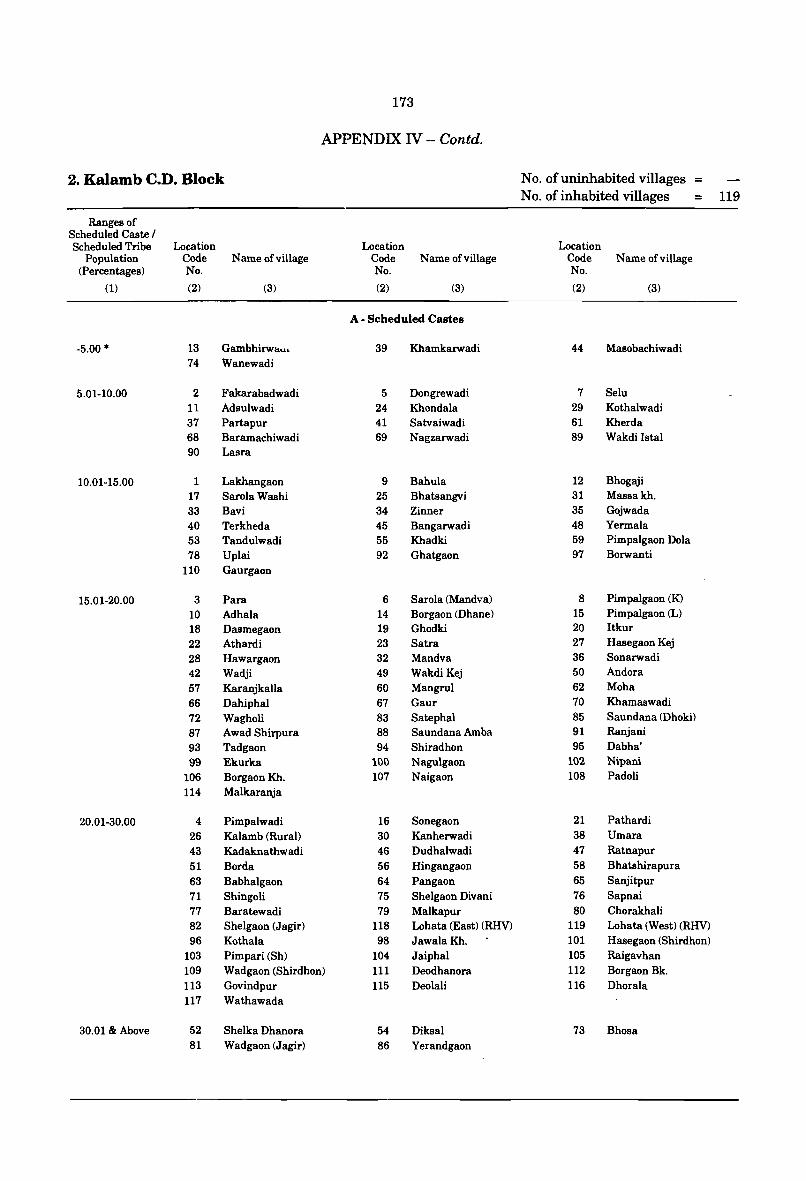
173
APPENDIX N -- Contd.
2. Kalamb C.D. Block No. of uninhabited villages = No. of inhabited villages = 119
Ranges of Scheduled Caste / Scheduled Tribe Location Location Location
Population Code Name of village Code Name of village Code Name of village (Percentages) No. No. No.
(1) (2) (3) (2) (3) (2) (3)
A - Scheduled Castes
-5.00 * 13 Gambhirwa ..... 39 Khamkarwadi 44 Masobachiwadi 74 Wanewadi
5.01-10.00 2 Fakarabadwadi 5 Dongrewadi 7 Selu 11 Adsulwadi 24 Khondala 29 Kothalwadi 37 Partapur 41 Satvaiwadi 61 Kherda 68 Baramachiwadi 69 Nagzarwadi 89 Wakdi Istal 90 Lasra
10.01-15.00 1 Lakhangaon 9 Bahula 12 Bhogaji 17 Sarola Washi 25 Bhatsangvi 31 Massakh. 33 Bavi 34 Zinner 35 Gojwada 40 Terkheda 45 Bangarwadi 48 Yermala 53 Tandulwadi 55 Khadki 59 Pimpalgaon Dola 78 Uplai 92 Ghatgaon 97 Borwanti
110 Gaurgaon
15.01-20.00 3 Para 6 Sarola (Mandva) 8 Pimpalgaon (K)
10 Adhala 14 Borgaon (Dhane) 15 Pimpalgaon (L) 18 Dasmegaon 19 Ghodki 20 Itkur 22 Athardi 23 Satra 27 Hasegaon Kej 28 Hawargaon 32 Mandva 36 Sonarwadi 42 Wadji 49 Wakdi Kej 50 Andora
57 Karanjkalla 60 Mangrul 62 Moha
66 Dahiphal 67 Gaur 70 Khamaswadi 72 Wagholi 83 Satephal 85 Saundana (Dhoki) 87 Awad Shirpura 88 Saundana Amba 91 Ranjani 93 Tadgaon 94 Shiradhon 95 Dabha'
99 Ekurka 100 Nagulgaon 102 Nipani
106 BorgaonKh. 107 Naigaon 108 Padoli
114 Malkaranja
20.01-30.00 4 Pimpalwadi 16 Sonegaon 21 Pathardi 26 Kalamb (Rural) 30 Kanherwadi 38 Umara 43 Kadaknathwadi 46 Dudhalwadi 47 Ratnapur 51 Borda 56 Hingangaon 58 Bhatshirapura 63 Babhalgaon 64 Pangaon 65 Sanjitpur 71 Shingoli 75 Shelgaon Divani 76 Sapnai 77 Baratewadi 79 Malkapur 80 Chorakhali 82 Shelgaon (Jagir) 118 Lohata (East) (RHV) 119 Lohata (West) (RHV) 96 Kothala 98 JawalaKh. 101 Hasegaon (Shirdhon)
103 Pimpari (Sh) 104 Jaiphal 105 Raigavhan 109 Wadgaon (Shirdhon) 111 Deodhanora 112 Borgaon Bk. 113 Govindpur 115 Deolali 116 Dhorala 117 Wathawada
30.01 & Above 52 Sheik a Dhanora 54 Diksal 73 Bhosa 81 Wadgaon (Jagir) 86 Yerandgaon
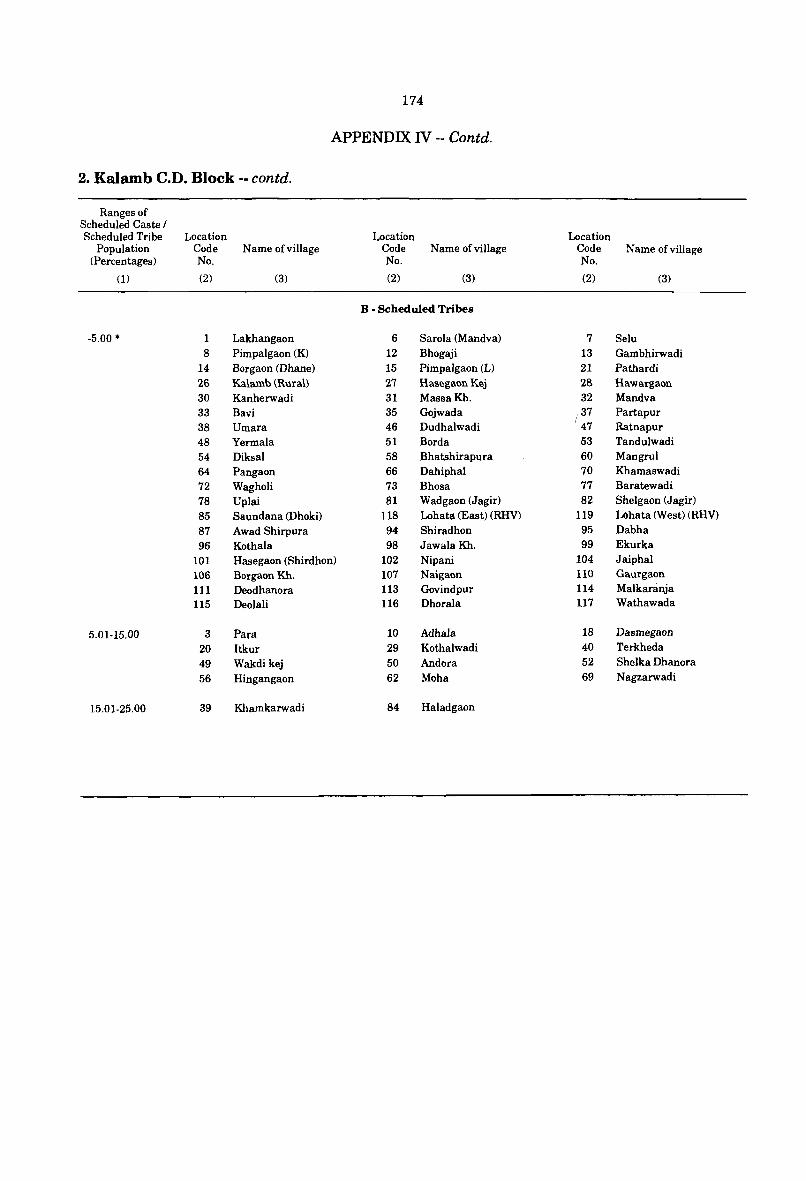
174
APPENDIX IV -- Contd.
2. Kalamb C.D. Block .• contd.
Ranges of Scheduled Caste / Scheduled Tribe Location Location Location
Population Code Name of village Code Name of village Code Name of village (Percentages) No. No. No.
(1) (2) (3) (2) (3) (2) (3)
B - Scheduled Tribes
-5.00 * 1 Lakhangaon 6 Sarola (Mandva) 7 Selu 8 Pimpalgaon (K) 12 Bhogaji 13 Gambhirwadi
14 Borgaon (Dhane) 15 Pimpalgaon (L) 21 Pathardi 26 Kalamb (Rural) 27 Hasegaon Kej 28 Hawargaon 30 Kanherwadi 31 MassaKh. 32 Mandva 33 Bavi 35 Gojwada .37 Partapur
; 38 Umara 46 Dudhalwadi 47 Ratnapur 48 Yermala 51 Borda 53 Tandulwadi 54 Diksal 58 Bhatshirapura 60 Mangrul 64 Pangaon 66 Dahiphal 70 Khamaswadi 72 Wagholi 73 Bhosa 77 Baratewadi 78 Uplai 81 Wadgaon (Jagir) 82 Shelgaon (Jagir) 85 Saundana (Dhoki) 118 Lohata (East) (RHV) 119 Lohata (West) (RHV)
87 Awad Shirpura 94 Shiradhon 95 Dabha 96 Kothala 98 JawalaKh. 99 Ekurka
101 Hasegaon (Shirdhon) 102 Nipani 104 Jaiphal 106 Borgaon Kh. 107 Naigaon 110 Gaurgaon 111 Deodhanora 113 Govindpur 114 Malkaranja 115 Deolali 116 Dhorala 117 Wathawada
5.01-15.00 3 Para 10 Adhala 18 Dasmegaon
20 Itkur 29 Kothalwadi 40 Terkheda
49 Wakdi kej 50 Andora 52 Shelka Dhanora
56 Hingangaon 62 Moha 69 Nagzarwadi
15.01-25.00 39 Khamkarwadi 84 Haladgaon
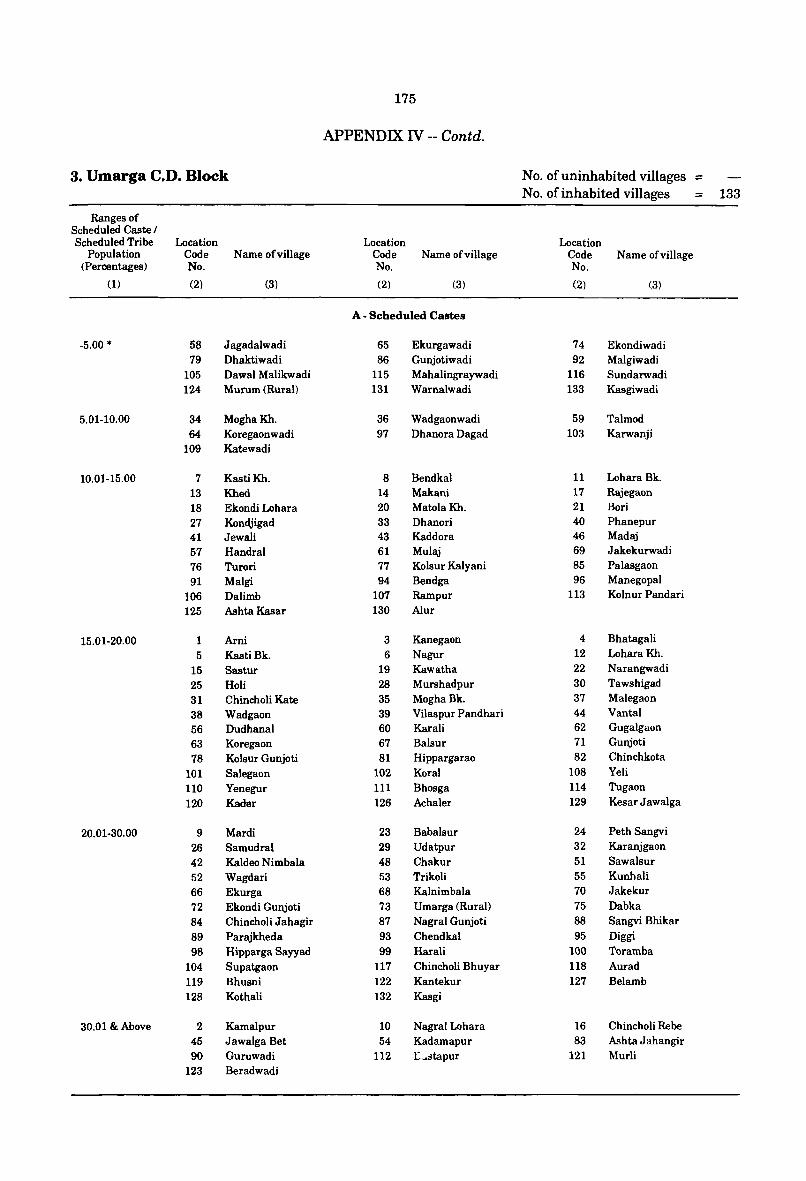
175
APPENDIX IV -- Contd.
3. Umarga C.D. Block No. of uninhabited villages ;:
No. of inhabited villages = 133
Ranges of Scheduled Caste / Scheduled Tribe Location Location Location
Population Code Name of village Code Name of village Code Name of village (Percentages) No. No. No.
(1) (2) (3) (2) (3) (2) (3)
A· Scheduled Castes
-5.00 * 5a Jagadalwadi 65 Ekurgawadi 74 Ekondiwadi 79 Dhaktiwadi 86 Gunjotiwadi 92 Malgiwadi
105 Dawal Malikwadi 115 Mahalingraywadi 116 Sundarwadi 124 Murum (Rural) 131 Warnalwadi 133 Kasgiwadi
5.01-10.00 34 MoghaKh. 36 Wadgaonwadi 59 Talmod 64 Koregaonwadi 97 Dhanora Dagad 103 Karwanji
109 Katewadi
10.01-15.00 7 KastiKh. 8 Bendkal 11 LoharaBk. 13 Khed 14 Makani 17 Rajegaon 18 Ekondi Lohara 20 MatolaKh. 21 Bon 27 Kondjigad 33 Dhanori 40 Phanepur 41 Jewali 43 Kaddora 46 Madaj
57 Handral 61 Mulaj 69 Jakekurwadi
76 Turon 77 Kolsur Kalyani 85 Palasgaon
91 Malgi 94 Bendga 96 Manegopal
106 Dalimb 107 Rampur 113 Kolnur Pandari
125 AshtaKasar 130 Alur
15.01-20.00 1 Arni 3 Kanegaon 4 Bhatagali
5 KastiBk. 6 Nagur 12 LoharaKh.
15 Sastur 19 Kawatha 22 Narangwadi
25 Holi 28 Murshadpur 30 Tawshigad
31 Chincholi Kate 35 MoghaBk. 37 Malegaon
38 Wadgaon 39 Vilaspur Pandhari 44 Vantal
56 Dudhanal 60 Karali 62 Gugalgaon
63 Koregaon 67 Balsur 71 Gunjoti
78 Koisur Gunjoti 81 Hippargarao 82 Chinchkota
101 Salegaon 102 Koral 108 Yeli
110 Yenegur 111 Bhosga 114 Tugaon
120 Kader 126 Achaler 129 Kesar Jawalga
20.01-30.00 9 Mardi 23 Babalsur 24 Peth Sangvi
26 Samudral 29 Udatpur 32 Karanjgaon
42 Kaldeo Nimbala 48 Chakur 51 Sawalsur
52 Wagdari 53 Trikoli 55 Kunhali 66 Ekurga 68 Kalnimbala 70 Jakekur
72 Ekondi Gunjoti 73 Umarga (Rural) 75 Dabka 84 Chincholi Jahagir 87 Nagral Gunjoti 88 Sangvi Bhikar
89 Parajkheda 93 Chendkal 95 Diggi
98 Hipparga Sayyad 99 Harali 100 Toramba 104 Supatgaon 117 Chincholi Bhuyar 118 Aurad 119 Bhusni 122 Kantekur 127 Belamb 128 Kothali 132 Kasgi
30.01 & Above 2 Kamalpur 10 Nagral Lohara 16 Chincholi Rebe 45 JawalgaBet 54 Kadamapur 83 Ashta Jahangir 90 Guruwadi 112 L~:ltapur 121 Murli
123 Beradwadi
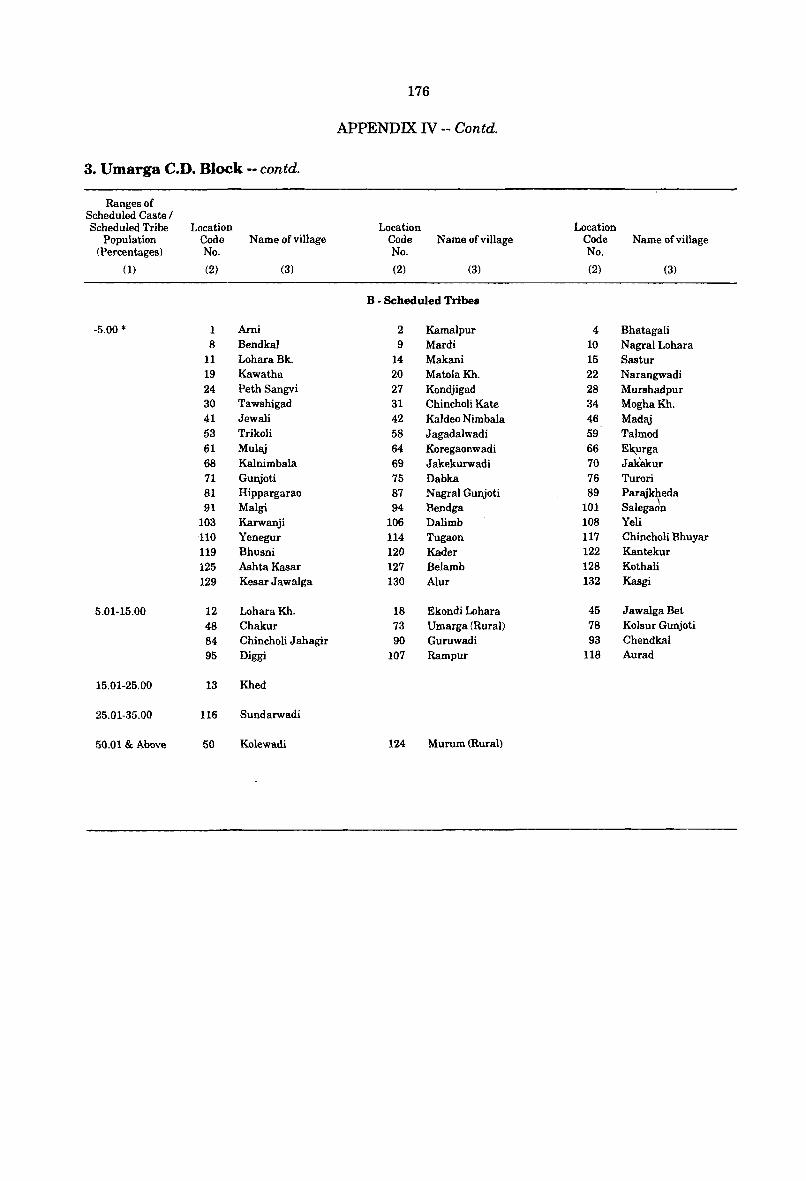
176
APPENDIX IV -- Contd.
3. Umarga C.D. Block .. contd.
Ranges of Scheduled Caste I Scheduled Tribe Location Location Location
Population Code Name of village Code Name of village Code Name of village (Percentages) No. No. No.
m (2) (3) (2) (3) (2) (3)
B • Scheduled Tribes
-5.00 * 1 Arni 2 Kamalpur 4 Bhatagali 8 Bendkal 9 Mardi 10 Nagral Lohara
11 LoharaBk. 14 Makani 15 Sastur 19 Kawatha 20 MatolaKh. 22 Narangwadi 24 Peth Sangvi 27 Kondjigad 28 Murshadpur 30 Tawshigad 31 Chincholi Kate 34 MoghaKh. 41 Jewali 42 Kaldeo Nimbala 46 Madaj 53 Trikoli 58 Jagadalwadi 59 Talmod 61 Mulaj 64 Koregaonwadi 66 Ek_urga 68 Kalnimbala 69 J akekurwadi 70 Jak'ekur 71 Gunjoti 75 Dabka 76 Turori 81 Hippargarao 87 Nagral Gunjoti 89 Paraj~eda 91 Malgi 94 Bendga 101 Salegaon
103 Karwanji 106 Dalimb 108 Yeli 110 Yenegur 114 Tugaon 117 Chincholi Bhuyar 119 Bhusni 120 Kader 122 Kantekur 125 AshtaKasar 127 Belamb 128 Kothali 129 Kesar Jawalga 130 Alur 132 Kasgi
5.01-15.00 12 LoharaKh. 18 Ekondi Lohara 45 JawalgaBet 48 Chakur 73 Umarga (Rural) 78 Koisur Gunjoti 84 Chincholi Jahagir 90 Guruwadi 93 Chendkal 95 Diggi 107 Rampur 118 Aurad
15.01-25.00 13 Khed
25.01-35.00 116 Sundarwadi
50.01 & Above 50 Kolewadi 124 Murum (Rural)
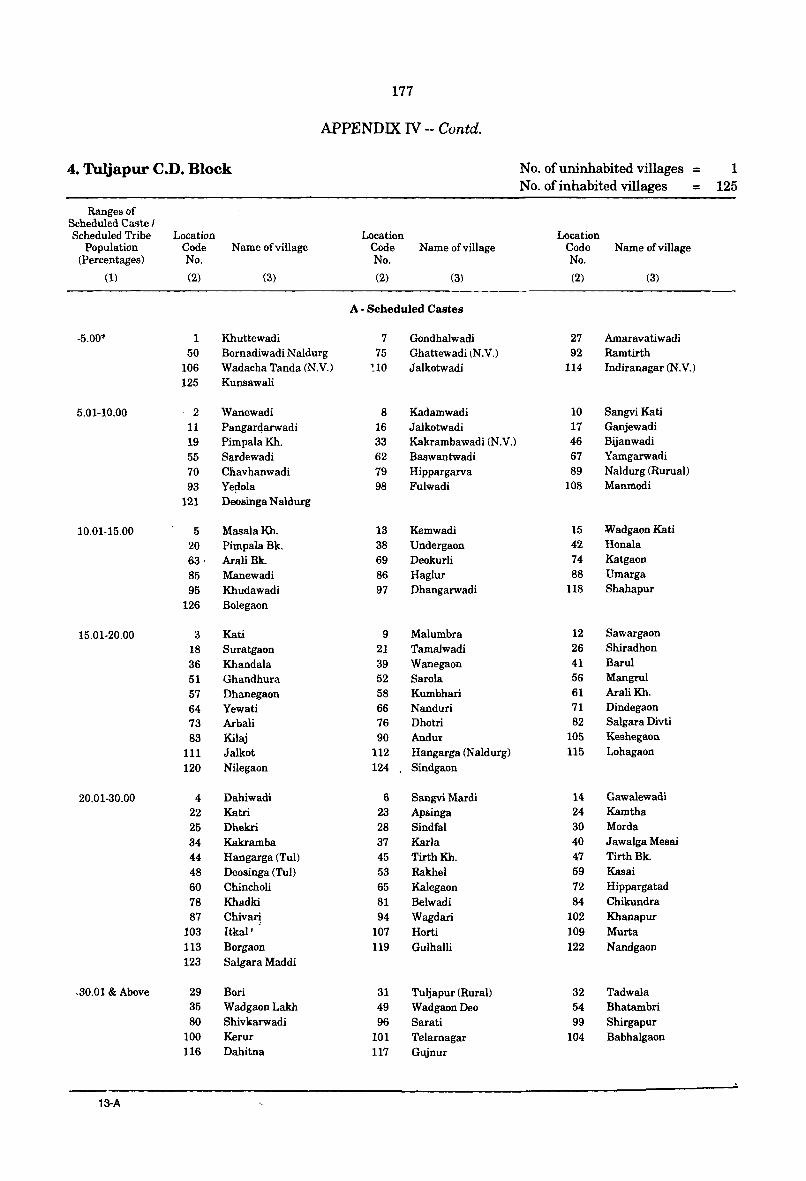
177
APPENDIX N -- Contd.
4. Tuljapur C.D. Block No. of uninhabited villages = 1 No. of inhabited villages = 125
Ranges of Scheduled Caste J Scheduled Tribe Location Location Location
Population Code Name of village Code Name of village Code Name of village (Percentages) No. No. No.
(1) (2) (3) (2) (3) (2) (3)
A· Scheduled Castes
-5.00* 1 Khuttewadi 7 Gondhalwadi 27 Amaravatiwadi 50 Bornadiwadi N aldurg 75 Ghattewadi (N.V.) 92 Ramtirth
106 Wadacha Tanda (N.V.) ~10 Jalkotwadi 114 Indiranagar (N.V.) 125 Kunsawali
5.01-10.00 2 Wanewadi 8 Kadamwadi 10 Sangvi Kati 11 Pangarqarwadi 16 Jalkotwadi 17 Ganjewadi 19 PimpalaKh. 33 Kakrambawadi (N.V.) 46 Bijanwadi 55 Slilrdewadi 62 Baswantwadi 67 Yamgarwadi 70 Chavhanwadi 79 Hippargarva 89 Naldurg (Rurual) 93 Ye~ola 98 Fulwadi 108 Manmodi
121 Doosinga Naldurg
10.01-15.00 5 MasalaKh. 13 Kemwadi 15 Wadgaon Kati
20 PimpalaBk. 38 Undergaon 42 Ronala
63· AraliBk. 69 Deokurli 74 Katgaon
85 Manewadi 86 Haglur 88 Umarga
95 Khudawadi 97 Dhangarwadi 118 Shahapur
126 Bolegaon
15.01-20.00 3 Kati 9 Malumbra 12 Sawargaon
18 Suratgaon 21 Tamalwadi 26 Shiradhon
36 Khandala 39 Wanegaon 41 Barul
51 Ghandhura 52 Sarola 56 Mangrul
57 Dhanegaon 58 Kumbhari 61 AraliKh.
64 Yewati 66 Nanduri 71 Dindegaon
73 Arbali 76 Dhotri 82 Salgara Divti
83 Kilaj 90 Andur 105 Keshegaon
111 Jalkot 112 Hangarga (Naldurg) 115 Lohagaon
120 Nilegaon 124 Sindgaon
20.01-30.00 4 Dahiwadi 6 Sangvi Mardi 14 Gawalewadi 22 Katri 23 Apsinga 24 Kamtha. 25 Dhekri 28 Sindfal 30 Morda 34 Kakramba 37 Karla 40 Ja.walga Mesai 44 Hangarga (Tu!) 45 TirthKh. 47 Tirth Bk. 48 Deosinga (Tu}) 53 Rakhel 59 Kasai 60 Chincholi 65 Kalegaon 72 Hippargatad 78 Khadki 81 Belwadi 84 Chikundra 87 ChivaI} 94 Wagdari 102 Khanapur
103 Itkal' 107 Horti 109 Murta 113 Borgaon 119 Gulhalli 122 Nandgaon 123 Salgara Maddi
.30.01 & Above 29 Bori 31 Tuljapur (Rural) 32 Tadwala 35 Wadgaon Lakh 49 WadgaonDeo 54 Bhatambri 80 Shivkarwadi 96 Sarati 99 Shirgapur
100 Kerur 101 Telarnagar 104 Babhalgaon 116 Dahitna 117 Gujnur
13-A
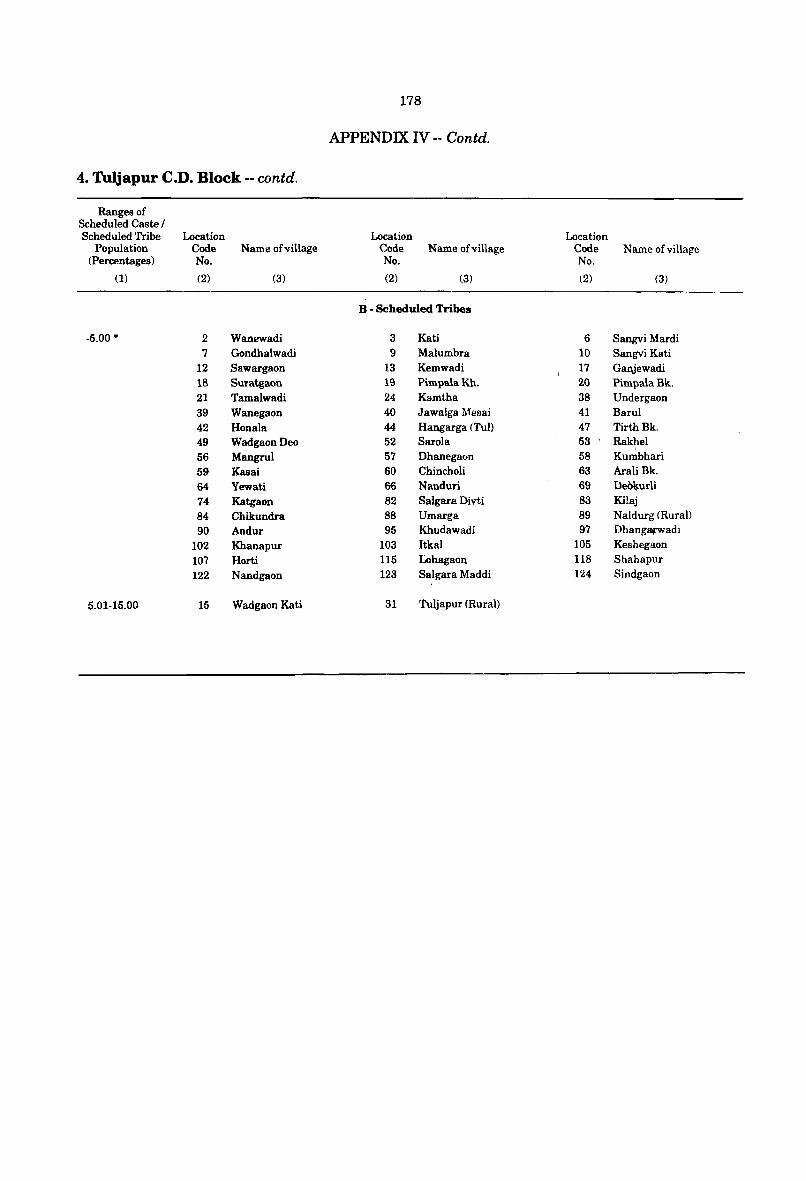
178
APPENDIX IV ~- Contd.
4. Tuljapur C.D. Block •• contd.
Ranges of Scheduled Caste / Scheduled 'l'ribe Location Location Location
Population Code Name of village Code Name of village Code Name of village (Percentages) No. No. No.
(1) (2) (3) (2) (3) (2) (3)
B • Scheduled Tribes
-5.00 * 2 Wanewadi 3 Kati 6 Sangvi Mardi 7 Gondhalwadi 9 Malumbra 10 Sangvi Kati
12 Sawargaon 13 Kemwadi 17 Ganjewadi 18 Suratgaon 19 PimpalaKh. 20 Pimpa\aBk. 21 Tamalwadi 24 Kamtha 38 Undergaon 39 Wanegaon 40 Jawalga Mesai 41 Barul 42 Honala 44 Hangarga (Tul) 47 Tirth Bk. 49 WadgaonDeo 52 Sarola 53 ' Rakhel 56 Mangrul 57 Dhanegaon 58 Ku~bhari 59 Kasai 60 Chincholi 63 Arali Bk. 64 Yewati 66 Nanduri 69 DeO\turli 74 Katgaon 82 Salgara Divti 83 Kilaj 84 Chikundra 88 Umarga 89 Naldurg (Rural) 90 Andur 95 Khudawadi 97 Dhangarwadi
102 Khanapur 103 Itkal 105 Keshegaon 107 Horti 115 Lohagaon 118 Shahapur
122 Nandgaon 123 Salgara Maddi 124 Sindgaon
5.01-15.00 15 Wadgaon Kati 31 Tuljapur (Rural)
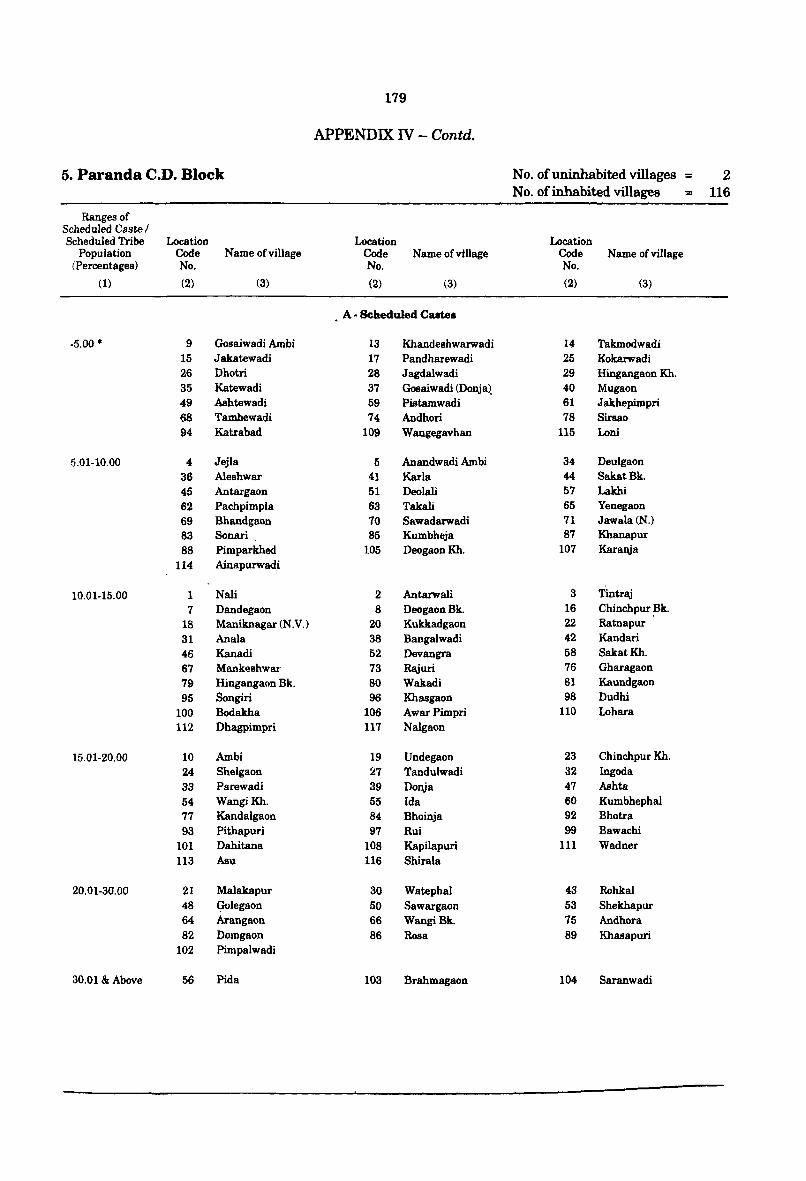
179
APPENDIX IV -- Contd.
5. Paranda C.D. Block No. of uninhabited villages = 2 No. of inhabited villages = 116
Ranges of Scheduled Caste / Scheduled Tribe Location Location Location
Population Code Name of village Code Name of village Code Name of village (Percentages) No. No. No.
(1) (2) (3) (2) (3) (2) (3)
A· Scheduled Caste.
·5.00 * 9 Gosaiwadi Ambi 13 Khandeshwarwadi 14 Takmodwadi 15 Jakatewadi 17 Pandharewadi 25 Kokarwadi 26 Dhotri 28 Jagdalwadi 29 Hingangaon Kil. 35 Katewadi 37 Gosaiwadi (Donja~ 40 Mugaon 49 Asbtewadi 59 Pistamwadi 61 Jakhepimpri 68 Tamhewadi 74 Andhori 78 Sirsao 94 Katrabad 109 Wangegavhan 115 Loni
5.01·10.00 4 Jejla 5 Anandwadi Ambi 34 Deulgaon 36 Aleshwar 41 Karla 44 SakatBk. 45 Antargaon 51 Deolali 57 Lakhi 62 Pachpimpla 63 Takali 65 Yenegaon 69 Bhandgaon 70 Sawadarwadi 71 Jawala(N.) 83 Sonari 85 Kumbheja 87 Khanapur
88 Pimparkhed 105 DeogaonKh. 107 Karanja
114 Ainapurwadi
10.01-15.00 1 Nali 2 Antarwali 3 Tintrlij
7 Dandegaon 8 DeogaonBk. 16 Chinchpur :Bk. 18 Maniknagar (N.V.) 20 Kukkadgaon 22 Ratnapur
31 Anala 38 Bangalwadi 42 Kandari 46 Kanadi 52 Devangra 58 SakatKh.
67 Mankeshwar 73 Rajuri 76 Gharagaon
79 Hingangaon Bk. 80 Wakadi 81 Kaundgaon
95 Songiri 96 Khasgaon 98 Dudhi
100 Bodakha 106 AwarPimpri 110 Lohara 112 Dhagpimpri 117 Nalgaon
15.01-20.00 10 Ambi 19 Undegaon 23 Chinchpur Kh. 24 Shelgaon 27 Tandulwadi 32 Ingoda
33 Parewadi 39 Donja 47 Ashta 54 WangiKh. 55 Ida 60 Kumbhephal 77 Kandalgaon 84 Bhoinja 92 Bhotra 93 Pithapuri 97 Rui 99 Bawachi
101 Dahitana 108 Kapilapuri 111 Wadner 113 Asu 116 Shirala
20.01·30.00 21 Malakapur 30 Watephal 43 Rohkal 48 Qolegaon 50 Sawargaon 53 Shekhapur 64 Arangaon 66 WangiBk. 75 Andhora 82 Domgaon 86 Rosa 89 Khasapuri
102 Pimpalwadi
30.01 & Above 56 Pida 103 Brahmagaon 104 Saranwadi

180
APPENDIX IV -- Contd.
5. Paranda C.D. Block - contd.
Ranges of Scheduled Caste I Scheduled Tribe Location Location Location
Population Code Name of village Code Name of village Code Name of village (Percentages) No. No. No.
(l) (2) (3) (2) (3) (2) (3)
B - Scheduled Tribes
-5.00 * 2 Antarwali 3 Tintraj 4 Jejla 7 Dandegaon 13 Khandeshwarwadi 14 Takmodwadi
15 Jakatewadi 16 Chinchpur Bk. 17 Pandharewadi 21 Malakapur 22 Ratnapur 26 Dhotri 27 Tandulwadi 28 Jagdalwadi 30 Watephal 31 Anala 32 Ingoda 34 Deulgaon 35 Katewadi 36 Aleshwar 38 Bangalwadi 39 Donja 40 Mugaon 41 Karla 43 Robkal '44 SakatBk. 45 AntargaoD 46 Kanadi 51 Deolali 54 W~giKh. 55 Ida 59 Pistamwadi 60 Kumbhephal 61 Jakhepimpri 62 Pachpimpla 63 Takali 66 WangiBk. 67 Mankeshwar 71 Jawalal(N.) 73 Rajuri 76 Gharagaon 77 Kandalgaon 78 Sirsao 79 Hingangaon Bk. 80 Wakadi 86 Rosa 87 Khanapur 89 Khasapuri 92 Bhotra 93 Pithapuri 94 Katrabad 95 Songiri 96 Khasgaon 98 Dudhi 99 Bawachi 104 Saranwadi 105 DeogaonKh.
106 AwarPimpri 108 Kapilapuri 111 Wadner 113 Asu 115 Loni 117 Nalgaon
5.01-15.00 19 Undegaon 33 Parewadi 48 Golegaon
35.01-50.00 12 Hangewadi
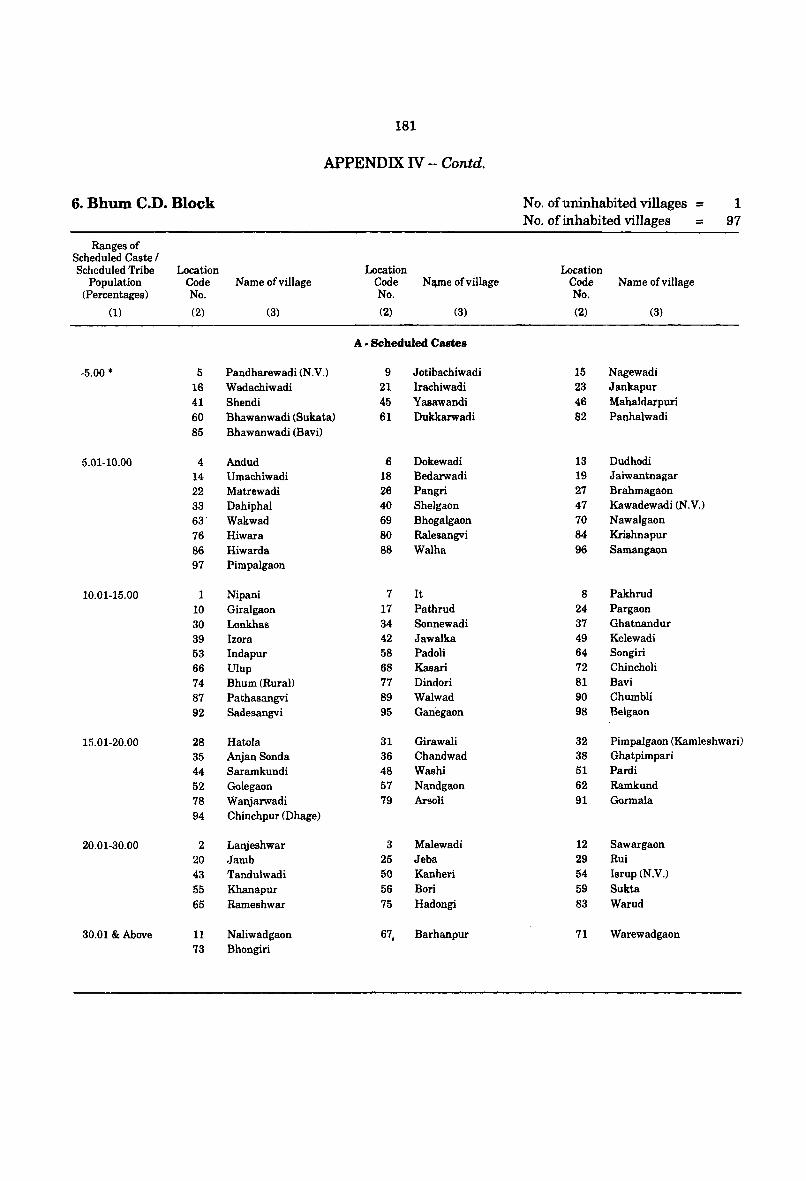
181
APPENDIX IV -- Contd.
6. Bhum C.D. Block No. of uninhabited villages = 1 No. of inhabited villages = 97
Ranges of Scheduled Caste / Scheduled Tribe Location Location Location
Population Code Name of viII age Code N~e of village Code Name of village (Percentages) No. No. No.
(1) (2) (3) (2) (3) (2) (3)
A. Scheduled Caste.
-5.00 * 5 Pandharewadi (N.V.) 9 Jotibachiwadi 15 Nagewadi 16 Wadachiwadi 21 Irachiwadi 23 Jankapur 41 Shendi 45 Yasawandi 46 Mahaldarpuri 60 Bhawanwadi (Sukata) 61 Dukkarwadi 82 Panhalwadi 85 Bhawanwadi (Bavi)
5.01-10.00 4 Andud 6 Dokewadi 13 Dudhodi 14 Umachiwadi 18 Bedarwadi 19 Jaiwantnagar 22 Matrewadi 26 Pangri 27 Brahmagaon 33 Dahiphal 40 Shelgaon 47 Kawadewadi (N.V.) 63' Wakwad 69 Bhogalgaon 70 Nawalgaon 76 Hiwara 80 Ralesangvi 84 Krishnapur 86 Hiwarda 88 Walha 96 Samangaon 97 Pimpalgaon
10.01-15.00 1 Nipani 7 It 8 Pakhrud 10 Giralgaon 17 Pathrud 24 Pargaon 30 Lonkhas 34 Sonnewadi 37 Ghatnandur 39 Izora 42 Jawalka 49 Kelewadi 53 Indapur 58 Padoli 64 Songiri 66 Ulup 68 Kasari 72 Chincholi 74 Bhum(RuraD 77 Dindori 81 Bavi 87 Pathasangvi 89 Walwad 90 Chumbli 92 Sadesangvi 95 Ganegaon 98 Belgaon
15.01-20.00 28 Hatola 31 Girawali 32 Pimpalgaon (Kamleshwari) 35 AnjanSonda 36 Chandwad 38 Ghatpimpari 44 Saramkundi 48 Washi 51 Pardi 52 Golegaon 57 Nandgaon 62 Ramkund 78 Wanjarwadi 79 Arsoli 91 Gormala 94 Chinchpur (Dhage)
20.01-30.00 2 Lanjeshwar 3 Malewadi 12 Sawargaon 20 Jamb 25 Jeba 29 Rui 43 Tandulwadi 50 Kanheri 54 Isrup (N.V.) 55 Khanapur 56 Bori 59 Sukta 65 Rameshwar 75 Hadongi 83 Warud
30.01 & Above 11 Naliwadgaon 67, Barhanpur 71 Warewadgaon 73 Bhongiri
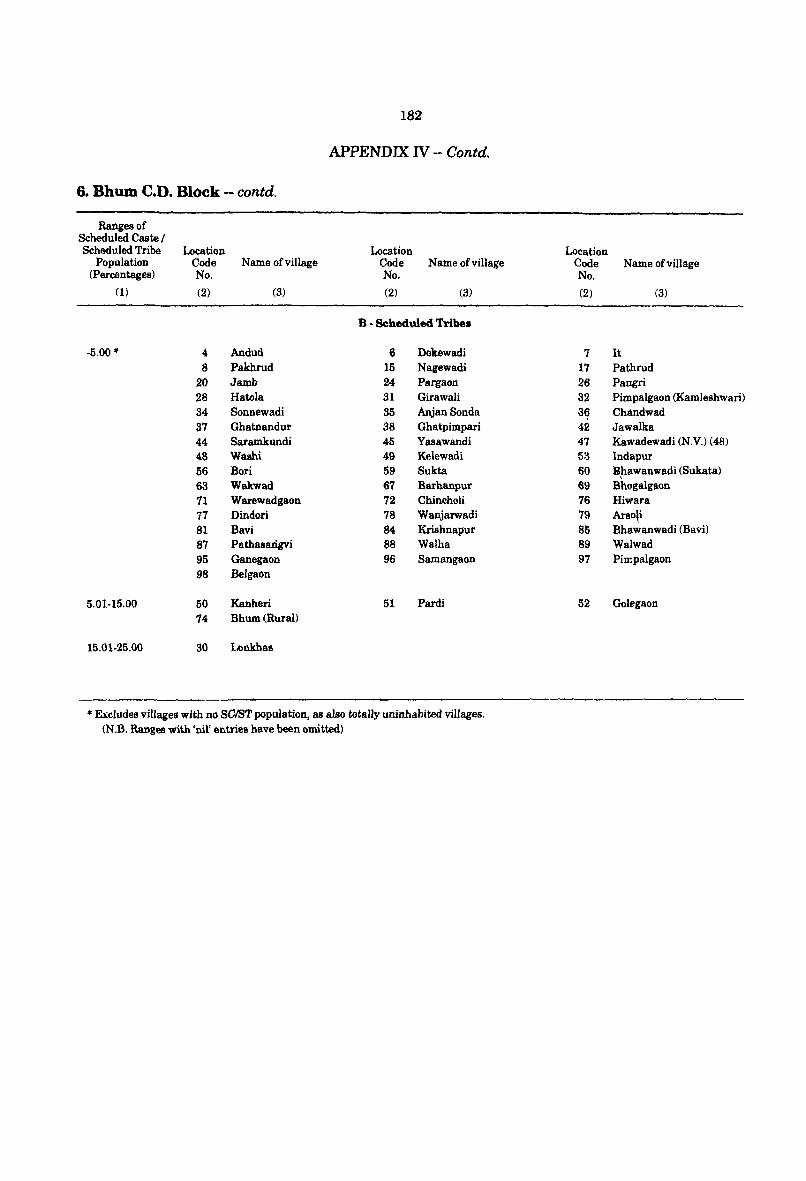
182
APPENDIX IV -~ Contd.
6. Bhum C.D. Block .. contd.
Ranges of Scheduled Caste I Scheduled Tribe Location Location
Population Code Name ofvillage Code Name of village (Percentages) No. No.
(1) (2) (3) (2) (3)
B • Scheduled Tribe.
-5.00 " 4 Andud 6 Dokewadi 8 Pakhrud 15 Nagewadi
20 Jamb 24 Pargaon 28 Hatola 31 Girawali 34 Sonnewadi 35 AnjanSonda 37 Ghatnandur 38 Ghatpimpari 44 Saramkundi 45 Yasawandi 48 Waahl 49 Kelewadi 56 Bori 59 Sukta 63 Wakwad 67 Barhanpur 71 Warewadgaon 72 Chincholi 77 Dindori 78 Wanjarwadi 81 Bavi 84 Krishnapur 87 Pathaaarigvi 88 Walha 95 Ganegaon 96 Samangaon 98 Belgaon
5.01-15.00 50 Kanheri 51 Pardi 74 Bhum (Rural)
15.01-25.00 SO l.onkhas
* Excludes villages with no SCIST population, as also totally uninhabited villages. (N.B. Ranges with 'nil' entries have been omitted)
Location Code Name of village No.
(2) (3)
7 It 17 Pathrud 26 Pangri 32 Pimpalgaon (Kamleshwari) 36 Chandwad d Jawalka 47 KRwadewadi (N.V.) (48) 53 Indapur 60 B_hawanwadi (Sukata) 69 Bhogalgaon 76 Hiwara 79 Arso\i 85 Bhawanwadi (Bavi) 89 Walwad 97 Pimpalgaon
52 Golegaon
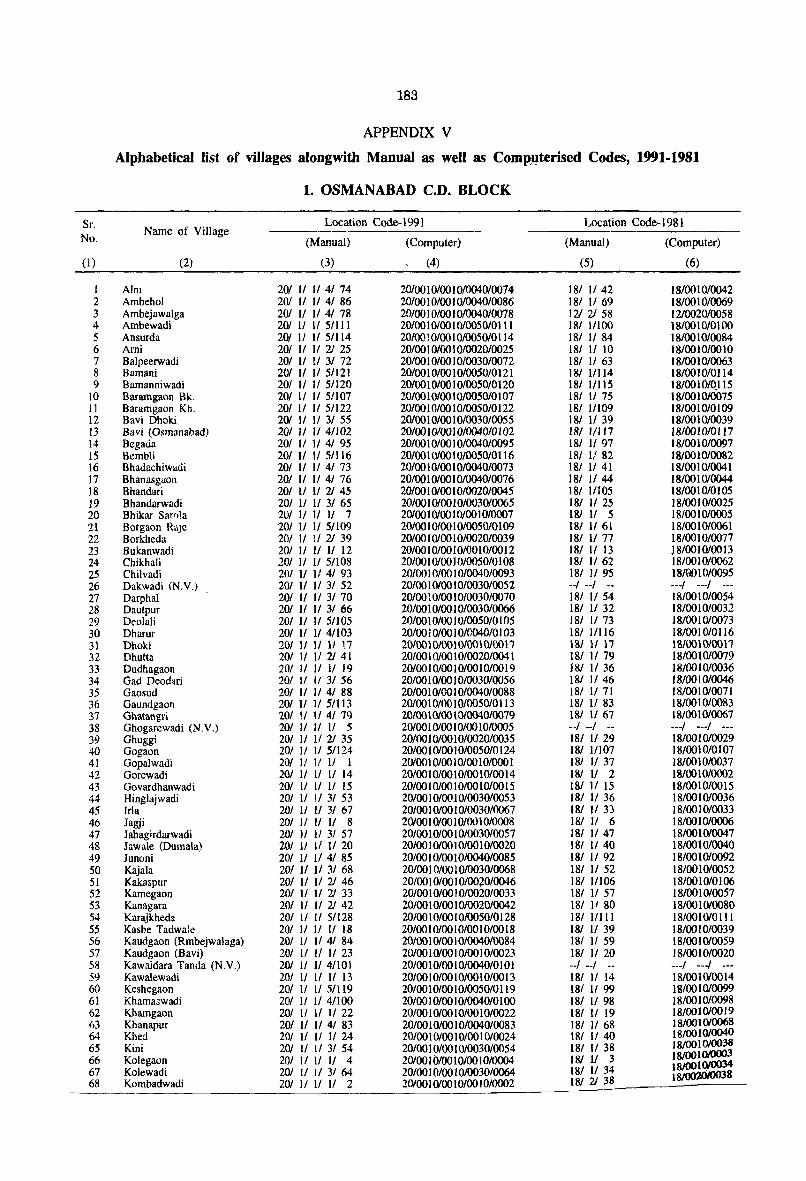
183
APPENDIX V
Alphabetical list of villages alongwith Manual as well as Comppterised Codes, 1991·1981
1. OSMANABAD C.D. BLOCK
Sr. Name of Village
Location Code-1991 Location Code-1981 No. (Manual) (Computer) (Manual) (Computer)
(I) (2) (3) (4) (5) (6)
I AIm 20/ II 11 41 74 20/00 I 0/00 I 0/0040/0074 18/ 11 42 18/0010/0042 2 Ambehol 20/ 11 II 41 86 20/00 I 0100 1 0/0040/0086 18/ II 69 18/00 1 010069 3 Ambejawalga 201 1/ 11 41 78 20/00 10100 1 0/0040/0078 121 2/ 58 1210020/0058 4 Ambewadi 201 11 115/111 20/001 0100 101005010} \} 18/ 11100 18/001010100 5 Ansurda 201 11 11 51114 20/00! 0100 1 0/0050/0 114 181 II 84 18/0010/0084 6 Ami 20/ 11 11 2J 25 20/00 1010010/0020/0025 181 11 10 18/0010/0010 7 Balpeerwadi 20/ II II 3/ 72 20/00 10/00 1 0/0030/0072 18/ 1/ 63 18/00 1 0/0063 8 Bamani 20/ 11 II 51121 20/00 1 0/00 1 0/0050/01 21 181 11114 18/001010114 9 Bamanniwadi 201 11 11 51120 20/001010010/0050/0120 181 11115 18/001l)/Q_115
10 Baramgaon Bk. 201 11 1/ 51107 20/00 10100 1 0/0050/0 1 07 181 11 75 18/00 1 010075 11 Baramgaon Kh. 201 II 11 51122 20/001010010/0050/0122 181 11109 18/00 1 0101 09 12 Bavi Dhoki 201 II II 31 55 20100 I 0/00 I 0/003010055 181 11 39 18/0010/0039 13 Bavi (Osmanabad) 20/ 1/ 11 41102 20/001010010/0040/0102 18/ IIll7 18/0010/0117 14 Begada 20/ 11 11 41 95 20/0010100 10/0040/0095 18/ 11 97 18/00 1 010097 15 Bembli 201 II II 51116 20/00 1 0100 1 010050/0 116 181 1/ 82 18/0010/0082 16 Bhadachiwadi 201 II 11 41 73 20/00 I 0100 1 0/0040/0073 181 1/41 18/0010/0041 17 Bhanasgaon 20/ 1/ II 4/ 76 20/001010010/0040/0076 18/ 1/ 44 18/0010/0044 18 Bhandari 20/ 11 11 2J 45 20/0010/00 10/002010045 181 11105 18/00 10/0 105 19 Bhandarwadi 20/ II 11 31 65 20/00 1 0100 I 0/0030/0065 181 II 25 18100 10/0025 20 Bhikar Sarnla 201 11 11 11 7 20100 10100 1 0100 1 0/0007 18/ 11 5 1810010/0005 21 Botgaon RaJe 201 If 11 5/109 20/00 1 0(00 I 0/0050/0 1 09 181 11 61 18/0010/0061 22 Borkheda 201 II 11 21 39 20/00 10100 I 0/0020/0039 181 1/ 77 18/0010/0077 23 Bukanwadi 201 II 11 11 12 20/00 1 0100 1 0/00 I 0/00 12 181 II 13 )8/001010013 24 Chikhali 201 11 II 5/l 08 20/00 10100 1 0/0050/0 1 08 181 II 62 18/00 1 010062 25 Chilvadi 20/ 11 1/ 41 93 20/00 1 0100 1 0/0040/0093 18/ 1/ 95 18/001010095 26 Dakwadi (N.V.) 201 1/ 11 31 52 20/00 1 0100 1 010030/0052 --I --I -- ---I ---I ---27 Darphai 201 11 11 31 70 20/00 1 0100 I 0/0030/0070 181 11 54 18/00 1010054 28 Dautpur 201 11 II 3/ 66 20/00 1 0100 1 0/0030/0066 181 11 32 18/001010032 29 Deolali 20/ II II 51105 20/00 I 0/00 I 0/0050/0 I 05 181 11 73 18/00 1010073 30 Dharur 201 II II 41103 20/00 I 0100 I 0/0040/0 103 181 1I116 18/001 010 II 6 31 Dhoki 201 1/ 11 1/ 17 20/0010/00 10/001 0100 17 181 11 17 18/0010/0011 32 Dhutta 201 II 11 21 41 20/00 I 0100 10/0020/0041 181 11 79 18/00 1 010079 33 Dudhagaon 201 1/ 11 l! 19 20/00 I 0100 I 0/0010/00 19 181 II 36 18/00 I 0/0036 34 Gad Deodari 201 l/ 11 31 56 20/00 1 0/00 10/0030/0056 181 11 46 18/00 J 010046 35 Gaosud 20/ 11 II 41 88 20/00 10/00 I 0/0040/0088 18/ II 71 18/00 1 010071 36 Gaundgaon 201 11 11 51113 20/0010/0010/0050/0113 lSI 11 83 18/00 10/0083 37 Ghatangri 201 1I II 41 79 2OfOO \ 0100 1010040/0079 181 \/ 67 181001010067 38 Ghogarewadi (N.V.) 201 11 11 II 5 20100 1 0100 10/00 1010005 --I --I -- ---I ---I ---39 Ghuggi 201 11 II 21 35 20/0010100 1 0/0020/0035 181 II 29 18/00 10/0029 40 Gogaon 201 1/ 11 51124 20/00 I 0100 I 0/0050/0124 18/ IIJ07 18/0010/0107 41 Gopalwadi 201 1/ 11 1/ 1 201001010010/0010/0001 18/ 11 37 18/001010037 42 Gorewadi 201 II 11 II 14 20/00 1 0100 1 0/001 0/00 14 181 11 2 18/00 1 010002 43 Govardhanwadi 201 11 II II 15 20/00 I 0100 1 0/00 10100 IS 18/ 11 15 i8/00 10100 IS 44 Hinglajwadi 20/ II 1/ 31 53 20/0010100 1 0/0030/0053 181 II 36 18/001010036 45 Irla 20/ 11 1/ 3/ 67 20/00 10100! 0/0030/0067 18/ 11 33 18/001010033 46 Jagji 201 II II II 8 2010010100 1 0/00 I 0/0008 18/ II 6 18/00 1 010006 47 J ahagirdarwadi 201 II II 31 57 20/00 10100 1 0/0030/0057 181 11 47 18/001010047 48 lawale (Dumala) 201 11 II 11 20 20/0010100 1 0100 1 0/0020 181 11 40 18/0010/0040 49 Junoni 20/ 11 II 41 85 20/00 10100 I 0/0040/0085 181 II 92 18/0010/0092 50 Kajala 201 II 11 31 68 20/00 I 0100 1 0/0030/0068 181 II 52 18/001010052 51 Kakaspur 20/ 11 11 21 46 20/00 1 0100 1 0/0070/0046 181 1/106 18/001010106 52 Kamegaon 201 11 11 21 33 20/0010100 10/0020/0033 181 II 57 18/001010057 53 Kanagara 201 11 11 21 42 20/00 1 0100 1 0/0010/0042 181 11 80 18/00 1 010080 54 Karajkheda 201 11 II 51128 20/00 I 0100 I 0/0050/0 128 181 l/1l1 18/001010111 55 Kasbe Tadwale 20/ 11 II II 18 20/00 10/00 I 0/00 I 0/00 18 18/ II 39 18/00 1010039 56 Kaudgaon (Rmbejwalaga) 201 II 11 41 84 20/0010100 I 0/0040/0084 181 11 59 18/001010059 57 Kaudgaon (Bavi) 20/ II II II 23 20/00 1 0/00 10100 I 0/0023 18/ 11 20 18/00 10/0020 58 Kawaldara Tanda (N.V.) 201 11 11 41101 20/0010100 1 0/0040/01 0 I --I --I -- ---1 ---/ ---59 Kawalewadi 201 11 II II 13 20/00 1 0100 1 0/00 1 0/00 13 181 II 14 18/0010/0014 60 Keshegaon 20/ II 11 51119 20/0010/0010/0050/0119 181 II 99 18/00 I 010099 61 Khamaswadi 201 11 II 411 00 20/00 I 0100 I 0/0040/0 I 00 181 11 98 18/00 1 010098 62 Khamgaon 201 1I II 11 22 20/00 1 0100 10100 1 0/0022 181 If 19 18/001010019 63 Khanapur 20/ 11 II 41 83 20/00 1 0100 I 010040/0083 181 11 68 18/001010068 64 Khed 201 11 11 11 24 20/00 1 0100 10100 1 010024 181 11 40 18/001010040 65 Kini 201 II 11 3f 54 20/00 I 0100 I 0/0030/0054 181 II 38 18/001010038
66 Kolegaon 20/ 1/ 11 1/ 4 20100 10100 I 0100 1 010004 18/ 11 3 1810010J0003 181001 M)034
67 Kolewadi 20/ II 1/ 31 64 20/00 1 0100 I 0/0030/0064 18/ 11 34 18/(J()2M)038 68 Kombadwadi 20/ JI 1/ II 2 20100 10100 1 0/00 1 010002 181 'l) 38
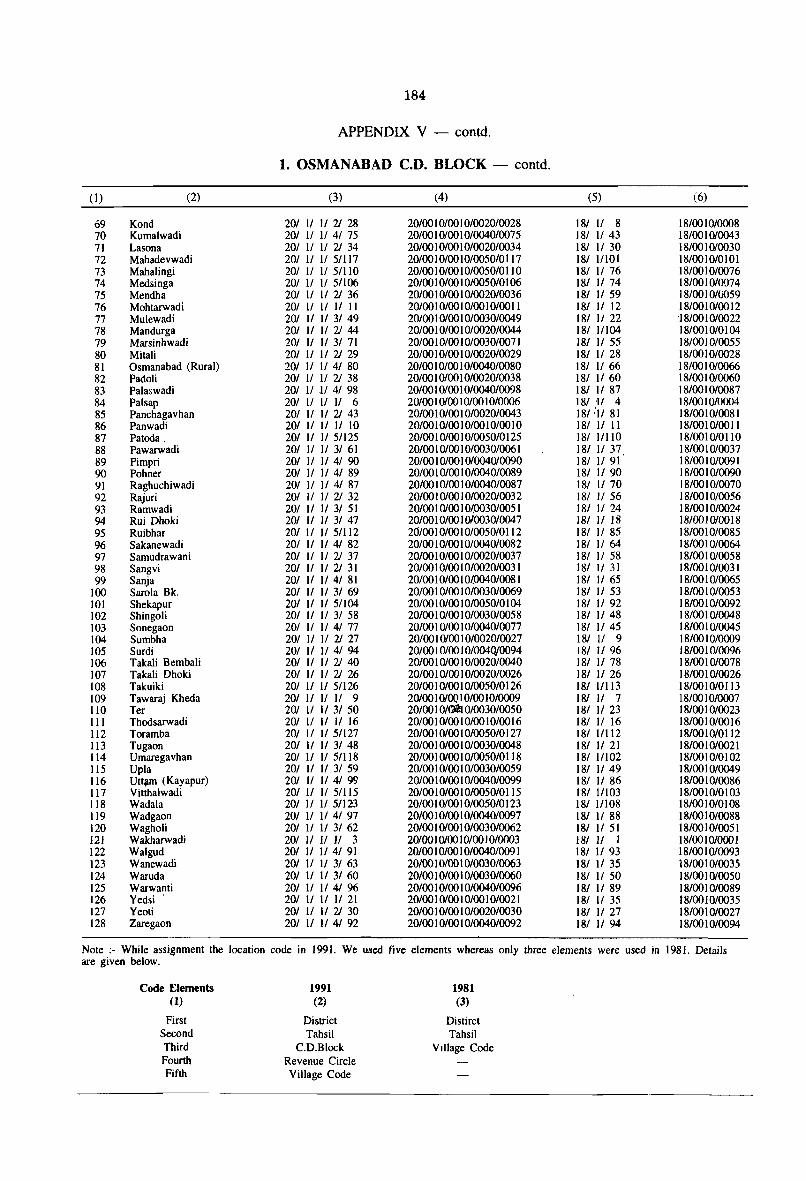
184
APPENDIX V - contd.
1. OSMANABAD C.D. BLOCK - contd.
(I) (2) (3) (4) (5) (6)
69 Kond 201 11 11 21 28 20100 I 0100 I 01002010028 181 II 8 18/00 I 010008 70 Kumalwadi 201 II II 41 75 20100 I 0100 I 0/004010075 181 II 43 18/0010/0043 71 Lasona 201 II II 21 34 20100 I 0100 I 01002010034 181 11 30 18/00 1010030 72 Mahadevwadi 201 II II 51117 20100 I 0100 10/005010 117 18/ 11101 18/0010/0101 73 Mahalingi 201 II II 51110 20100 I 0100 I 01005010 11 0 181 11 76 18/00 I 010076 74 Medsinga 201 II 11 51106 20100 I 0100 I 01005010 I 06 181 II 74 18/00 1010074 75 Mendha 201 II 11 21 36 20100 I 0100 I 01002010036 181 II 59 18/00 1010059 76 Mohtarwadi 201 II II II II 20100 10100 I 0100 I 0100 II 181 II 12 18/001010012 77 Mu1ewadi 201 II II 31 49 20100 10100 I 010030/0049 181 II 22 '18/00 1010022 78 Mandurga 201 II II 21 44 20100 I 0100 I 010020/0044 181 11104 18/00 I 0101 04 79 Marsinhwadi 201 11 11 31 71 20100 10/00 I 0/0030/0071 181 11 55 18/00 10/0055 80 Mitali 201 II 11 21 29 20/00 I 0100 I 010020/0029 181 1/28 18/00 I 010028 81 Osmanabad (Rural) 201 II 11 41 80 20/00 I 0100 I 0/004010080 181 11 66 18/00 10/0066 82 Padoli 201 II II 21 38 20100 I 0100 I 0100201003 8 181 II 60 18/00 10/0060 83 Pa1aswadi 201 II .II 41 98 20100 1 0100 I 0/0040/0098 181 11 87 18/001010087 84 Pal sap 201 11 II II 6 20100 I 0100 10100 1010006 181 11 4 18/00 I 010004 85 Panchagavhan 201 II II 21 43 20100 I 0100 I 010020/0043 18/,'11 81 111/0010/0081 86 Panwadi 201 II II II 10 20100 I 0100 I 0100 I 0100 I 0 181 II 11 18/001010011 87 Patoda. 201 II II 51125 20100 I 0100 I 01005010 125 181 11110 18/001010110 88 Pawarwadi 201 II II 31 61 20100 1 0100 I 010030/0061 181 II 37 18/0010/0037 89 Pimpri 201 II 11 41 90 20100 I 0100 I 0/004010090 181 11 91 18/00 I 010091 90 Pohner 201 II 11 41 89 20100 10100 I 0/0040/0089 181 II 90 18/00 I 010090 91 Raghuchiwadi 201 II II 41 87 20100 I 0100 I 0/0040/0087 181 11 70 18/00 I 010070 92 Rajuri 201 II II 21 32 20100 10100 I 01002010032 181 II 56 18/00 I 0/0056 93 Ramwadi 201 II II 31 51 20100 I 0/00 I 01,003010051 181 II 24 18/00 1010024 94 Rui Dhoki 20/ II 1/ 3/ 47 20/00 1 0100 10/0030/0047 181 II 18 18/00 10100 18 95 Ruibhar 201 II II 51112 20/00 I 0100 10/005010 112 181 II 85 18/00 I 010085 96 Sakanewadi 201 II II 41 82 20100 I 0100 I 0/004010082 181 II 64 18/00 I 010064 97 Samudrawani 201 II II 21 37 20100 I 0100 I 010020/0037 181 11 58 18/00 1010058 98 Sangvi 201 II 11 21 31 20100 I 0100 1 0/0020/0031 181 II 31 18/00 1010031 99 Sanja 201 II II 41 81 20100 I 0100 1 01.004010081 181 II 65 18/00 I 010065
100 Saro1a Bk. 201 II II 31 69 20100 10100 I 010030/0069 181 II 53 18/0010/0053 101 Shekapur 201 II II 51104 20100 I 0100 I 01005010 I 04 181 II 92 18/00 I 010092 102 Shingoli 201 II II 31 58 20100 I 0100 I 01003010058 181 11 48 18/0010/0048 103 Sonegaon 201 II II 41 77 20100 10100 I at004010077 181 II 45 18100 I 010045 104 Sumbha 201 II II 21 27 20100 10100 I 01002010027 181 II 9 18/00 1 010009 105 Surdi 201 11 II 41 94 201001 0/00 I 0l004QV0094 181 II 96 18/00 I 010096 106 Takali Bembali 201 II II 21 40 20100 I 0/00 I 010020/0040 181 11 78 18/00 1010078 107 Takali Dhoki 201 II 11 21 26 20100 I 0100 I 01002010026 181 11 26 18/00 I 010026 108 Takuiki 201 II II 51126 20100 10100 I 01005010 126 181 11113 18/001010113 109 Tawaraj Kheda 201 11 II II 9 20/00 I 0/00 1 0/00 I 0/0009 181 11 7 18/00 I 010007 110 Ter 201 II II 31 50 20100 I 0/()flI 01003010050 181 II 23 18/00 I 010023 III Thodsarwadi 201 11 II II 16 20100 I 0/00 I 0100 I 0100 16 181 II 16 18/001010016 1I2 Toramba 201 II II 51127 20100 10100 I 01005010 127 181 11112 18/001010112 1I3 Tugaon 201 II II 31 48 20100 10100 I 01003010048 181 11 21 18/00 I 010021 114 Umaregavhan 201 II II 51118 20100 I 0/00 I 01005010 118 181 11102 18/001010102 1I5 Upla 201 II II 31 59 20100 10100 I 01003010059 181 1/49 18/0010/0049 1I6 Utt~ (Kayapur) 201 II II 41 99 20100 I 0/00 I 010040/0099 181 II 86 18/00 1 010086 117 Vittha1wadi 201 II II 51115 20100 I 0100 I 01005010 115 181 11103 18/001010103 118 Wada1a 201 II II 51123 20100 10100 1 01005010 123 181 11108 18/00 1010 108 1I9 Wadgaon 201 II II 41 97 20100 1 0100 1 0/0040/0097 181 II 88 18/00 I 010088 120 Wagholi 201 11 II 31 62 20100 10100 I 010030/0062 181 II 51 18/00 I 010051 121 Wakharwadi 201 11 11 II 3 20/00 10100 10100 I 0/0003 181 II 1 18/0010/0001 122 Walgud 201 11 11 41 91 20/00 10100 1 0/0040/0091 181 11 93 18/0010/0093 123 Wanewadi 201 11 11 31 63 20100 10100 1 010030/0063 181 11 35 18/00 1010035 124 Waruda 201 II II 31 60 20100 1 0100 1 01003010060 181 11 50 18/001010050 125 Warwanti 201 II II 4/ 96 20100 10100 1 0/004010096 181 11 89 18/00 1010089 126 Yedsi . 201 II II II 21 20100 10100 I 0100 I 010021 181 II 35 t 8100 1010035 127 Yeoti 201 II II 21 30 20100 I 0100 I 01002010030 181 II 27 18/001010027 128 Zaregaon 201 II II 4/ 92 20/00 I 0100 I 0/0040/0092 181 II 94 18/00 I 010094
Note :- While assignment the location code in 1991. We used five elements whereas only three elements were used in 1981. Details are given below.
Code Elements 1991 1981 (1) (2) (3)
First District Distirct Second Tahsil Tahsil Third C.D.B1ock VIllage Code Fourth Revenue Circle Fifth Village Code

185
APPENDIX V - contd.
2. KALAMB C.D. BLOCK
Sr. Location Code-1991 LocatiofJ Code-1981
No. Name of Village
(Computer) (Manual) (Computer) (Manual)
(I) (2) (3) (4) (5) (6)
I Adhala 201 21 21 1/ 10 201002010020100 I 0100 I 0 181 21 10 18/0020100 I 0 2 Adsu1wadi 201 21 21 II II 201002010020100 10100 II 181 21 22 18/002010022 3 Andora 20/ 21 2/ 21 50 201002010020/002010050 181 21 64 18/0020/0064 4 Athardi 201 21 21 II 22 201002010020100 1010022 181 21 II 18/002010011 5 Awad Shirpura 201 21 21 31 87 2010020/00201003010087 181 21 36 18/0020/0036 6 Babhalgaon 201 21 21 21 63 20/0020/0020/0020/0063 181 21 62 18/0020/0062 7 Bahu1a 201 21 21 II 9 201002010020/00 I 0/0009 181 ')j 9 18/0020/0009 8 Bangarwadi 20/ 21 2/ 1/ 45 20/0020/0020/00 I 0/0045 18/ 21103 18/0020/0 103 9 Baramachiwadi 20/ 21 21 21 68· 20/002010020/0020/0068 181 2/ 92 18/0020/0092
10 Baratewadi 20/ 21 21 21 77 20/0020/0020/002010077 181 21107 18/0020/0 107 II Bavi 201 21 2/ 1/ 33 20/002010020100 I 0/003 3 181 21 54 18/0020/0054 12 Bhatsangvi 20/ 21 21 II 25 20/002010020/00 I 010025 181 21 27 18/0020/0027 13 Bhatshirapura 20/ 2/ 2/ 21 58 20/0020/0020/0020/0058 18/2/47 18/0020/0047 14 BhogaJi 201 21 21 II 12 20/002010020/00 10/00 12 181 21 13 18/0020100 13 15 Bhosa 20/ 21 2/ 2/ 73 20/0020/00201002010073 181 21110 1.8/002010110 16 Borda 20/ 21 2/ 2/ 51 20/0020/0020/0020/0051 181 21 50 18/0020/0050 17 Borgao;] Bk. 201 21 21 31112 20/0020/0020/003010112 181 21 86 18/002010086 18 Borgaon Kh. 201 21 21 31106 201002010020/0030/0 I 06 I S/ 2/ 79 18/0020/0079 19 Borgaon (Dhane) 20/ 21 21 1/ 14 20/0020/0020/00 10/00 14 18/2/ 14 18/0020/00 14 20 Borwanli 20/ 2/ 2/ 3/ 97 20/002010020/0030/0097 18/ 21 69 18/0020/0069 21 Chorakhali 201 21 21 21 80 20/0020/0020/002010080 18/ 21119 18/0020/0119 22 Dabha 201 21 2/ 31 95 20/0020/0020/0030/0095 18/2/44 18/0020/0044 23 Dahiphal 201 21 21 21 66 20/002010020/0020/0066 181 21 94 18/0020/0094 24 Dasmegaon 20/ 21 2/ II 18 20/0020/0020100 I 0100 18 18/ 21 18 18/0020/00 18 25 Deodhanora 201 21 2/ 3/1 I I 20/002010020/0030/0111 18/2/ 85 18/~0/0085 26 Deolal! 20/ 2/ 2/ 3/115 20/0020/0020/0030/0 I 15 18/ 21 87 18/00 0/0087 27 Dhorala 20/ 2/ 21 31116 20/0020/0020/0030/0116 181 21 83 18/0020/0083 28 Diksal 201 21 21 21 54 20/0020/0020/002010054 181 21 30 18/0020/0030 29 Dongrewadt 20/ 21 21 II 5 20/0020/0020/00 I 010005 181 21 5 18/002010005 30 Dudhalwadi 201 21 21 II 46 20/0020/0020100 10/0046 181 21102 18/002010 I 02 31 Ekurka 201·21 21 31 99 20/002010020/0030/0099 181 21 71 18/0020/0071 32 Fakarabadwadi 201 21 21 II 2 2010020/0020/00 I 0/0002 181 21 4 18/002010004 33 Gambhirwadt 2012121 II 13 20/0020/0020/00 I 0100 13 181 21 20 18/0020/0020 34 Gaur 201 2/ 2/ 2/ 67 2010V201002010020/0067 18/2/93 18/002010093 35 Gaurgaon 201 '].1 2/ 311 JO 20/0020/00201003010 110 181 21 84 18/0020/0084 36 Ghatgaon 201 2/ 2/ 31 92 20/0020/0020/0030/0092 181 21 41 18/0020/0041 37 Ghodki 201 21 21 1/ 19 20/0020/0020/00 1 0100 19 181 21 19 18/0020/00 19 38 Gojwada 201 21 21 II 35 20/0020/0020/00 I 010035 181 21 56 18/002010056 39 Govindpur 201 21 21 31113 20/002010020/0030/0113 181 21 89 18/0020/0089 40 Haladgaon 201 21 21 21 84 20/0020(0020/0020/0084 181 2/114 18/0020/0114 41 Hasegaon Kej 201 21 21 II 27 20/002010020/00 I 010027 181 21 28 18/0020/0028 42 Hasegaon (Shirdhon) 201 21 21 31101 20/0020/0020/0030/0 I 0 I 18/ 2/ 73 18/0020/0073 43 Hawargaon 201 21 21 II 28 20/0020/0020/00 10/0028 181 21 24 18/0020/0024 44 Hingangaon 201 21 21 21 56 20/0020/0020/0020/0056 181 21 45 18/0020/0045 45 ltkur 201 21 21 II 20 20/002010020/00 10/0020 181 21 21 18/002010021 46 Jaiphal 201 21 21 3/104 20/0020/0020/003010 I 04 181 21 77 18/0020/0077 47 Jawala Khurd 201 21 21 31 98 20/0020/0020/0030/0098 181 21 68 18/0020/0068 48 Kadaknathwadi 201 21 2/ II 43 20/0020/0020/0010/0043 181 21 99 18/0020/0099 49 Kalamb (Rural) 201 21 21 II 26 20/002010020/00 10/0026 18/2/121 18/0020/0121 50 Kanherwadi 20/ 21 21 II 30 20/0020/0020/00 I 010030 181 2/ 52 18/0020/0052 51 Karanjkalla 201 21 21 21 57 20/0020/0020/0020/0057 181 21 46 18/0020/0046 52 Khadki 201 21 21 21 55 20/0020/0020/0020/0055 18/2/31 18/0020/0031 53 Khamaswadi 201 21 21 21 70 20/0020/0020/0020/0070 181 21 91 18/0020/0091 54 Khamkarwadi 201 2/ 21 11 39 20/0020/0020/00 I 010039 181 2/ 59 18/002010059 55 Kherda 20/ 21 21 21 61 20/0020/0020/002010061 181 21 66 18/0020/0066 56 Khondala 201 21 21 1/ 24 20/0020/0020/00 I 010024 181 21 26 18/002010026 57 Kothala 201 21 21 3/ 96 20/0020/002010030/0096 181 21 70 18/002010070 58 Kothalwadi 201 21 21 II 29 20/0020/0020/00 10/0029 181 21 23 18/0020/0023 59 Lakhangaon 201 21 21 II 1 20/002010020/00 I 01000 I 181 21 I 18/0020/000 I 60 Lasra 201 21 21 3/ 90 20/0020/0020/0030/0090 181 21 39 18/0020/0039 61 Lohata (East) (RHV) 201 21 2/ 21118 20/0020/0020/0020/0118 --I --I .. ---I ---I _.-62 Lohata (West)(RHV) 201 21 21 21119 20/0020/0020/0020/0119 --I --I -- ---I ---I ---63 Malkapur 201 21 21 21 79 20/0020/0020/0020/0079 181 21106 18/0020/0 106 64 Malkaranja 201 21 21 31114 20/0020/002010030/0114 181 21 88 18/0020/0088 65 Mandva 201 21 21 II 32 20/0020/0020/00 I 010032 I~I 21 53 I 8/002010053 66 Hangrul 20{ 21 21 21 60 20/0020/0020/002010060 18/ 21 67 18/0020/0067 67 Masobachiwadi 20{ 21 21 II 44 20/0020/0020/00 I 010044 18/ 21101 18/0020/0 101
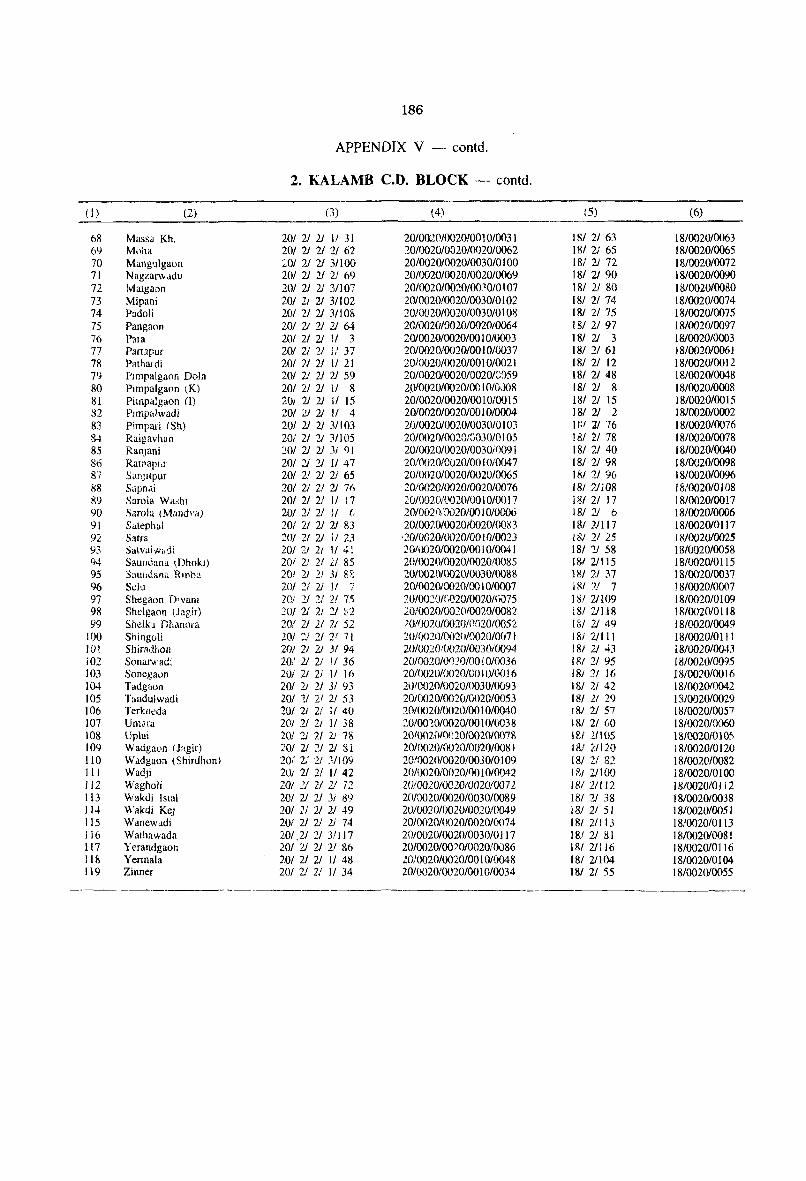
186
APPENDIX V -. contd.
2. KALAMB C.D. BLOCK - contd.
(I) (2) (3) (4) (5) (6)
68 Massa Kh. 20/ 2/ 21 1/ 31 20/0020/0020/0010/0031 181 2/ 63 18/0020/0063 69 M\lha 201 21 2/ 21 62 20/0020/0020/0020/0062 181 2/ 65 18/0020/0065 70 Mangulgaon 20/ 21 21 311 00 20/0020/0020/0030/0 I 00 18l 21 72 18/002010072 71 NagzamJdu 201 2/ 21 2! 69 20/0020/002010020/0069 181 21 90 18/0020/0090 72 Maigaon 201 21 21 311 07 20/0020/0020/00.10/0 I 07 18/ 21 80 18/0020/0080 73 Mipani 20/ 21 21 31102 20/0020/0020/0030/0 I 02 181 21 74 18/0020/0074 74 Padoli 201 21 2/ :Ill 08 20/0020/0020/0030101 08 181 21 75 18/0020/0075 75 Pangaon 201 2J 21 21 64 20/0020/0020/0020/0064 18/2/97 181002010097 76 PaJa 201 2/ 2/ II 3 201002Q/0020/00 10/0003 181 '}j 3 18/0020/0003 77 Partapur 201 21 2/ l/ 37 20/0020/0020/001010037 181 21 6] J 81(0201006) 78 Pathmdi 20/ ]./ 21 II 2] 20/0020/0020/00 1010021 181 2/ 12 18/0020/00 12 79 Ylmpalgaon Dola 201 2J 21 21 59 20/0020/0020/0020/8()59 181 21 48 18/0020/0048 80 Plmpalgaon (K) 20/ 2/ 2/ 11 8 20/0020/0020/00 I 0/G'J08 181 21 8 18/002010008 81 Pilfipalgaon (I) 201 2/ 2/ II 15 20/0020/002010010/0015 181 21 15 18/0020/00 15 82 PJrnpltlwadi 20/ 21 2J II 4 201002010020100 10/0004 181 21 2 1810020/0002 83 Pimpari (Sh) 201 21 21 3/103 20/0020/0020/0030/0 I 03 UU 21 76 18/0020/0076 84 Raigavhan 20/ 21 2J 3/105 20/0020/oo201G030/0 105 !81 21 78 18/0020/0078 85 RanJUni 201 2/ 2/ JI 91 20/0020/0020/0030iOO91 181 21 40 J 8/0020/0040 86 RawapW' 20/ 21 21 If 47 20/D020/C020/00 I 010047 18! 21 98 18/0020/0098 87 SanJltpur 201 2.1 21 21 65 20/0020/0020/0020/0065 181 21 96 18/002010096 88 SapnJ.i 201 2/ 21 21 7(, 20/0020/0020/002010076 18/ 7)108 18/0020/0108 89 Sarola Wa;hl 201 21 2/ II 17 2(J/I)020/0020/00 1 0/0017 18/21 17 18/0020/00 17 90 Saw!:! (Mand\'/i) 201 2/ 2J II (, 20/0020/0020IQO I 0/0006 181 2/ 6 18/002010006 91 Satephal 201 2/ 2/ 21 83 20/0020/002010020/0083 18/2.1117 18/002010117 92 Satra 201 2/ 2J Jl 23 '20/(J020/0020100 1010023 lSI 21 25 J 8J0020/0025 93 Satvaiwadi 20/21 21 11 4! 2011)020/0020/00 10/0041 181 :'1 58 18/0020/0058 94 Saumiana tDhokl) 201 21 21 21 85 2G/t1020/(1020/0020l0085 181 2/115 18/002010115 95 S3lwdana Rn,h:; 201 21 21 31 8\; 20/0020/0020/0030/0088 18/ 21 37 1810020/0037 96 Sclu 201 21 21 II -, 201002010020100 I 0/0007 1 RI ?J 7 18/0020/0007 1
97 Shegaon D1V<lm Le! 21 :.J 21 7<; 20/00:~ 0/G020/00 ?O/G\) 7 5 181 21109 18/0020/0109 98 Shclgaon (Jagir) 201 2/ 21 2/ g2 20/0020/0020/0020/0082 18/21118 18/0020/0118 99 Shelb llhanora 201 21 21 21 52 ?O!OO2(J/OO20f(l()20/0052 181 21 49 18/002010049
100 Shingoli 201 J 21 2' 71 :W/fi02I)/OO2{JfOO20/0071 18/2/111 18/002010111 WI Shiradhon 2()t 21 21 .V 94 20/U()20llJ{)201003010094 181 21 43 181002010043 i02 Sonarwad: 20/ 21 21 II 36 20/00201()I}?O/OO! 010036 !RI 21 95 18/0020/00:)5 103 Sonegaoll 20/ 2J 21 JI J(, 20/0020/0020/001010016 181 2/ 16 18/0020100 16 104 Tadgaon 201 2J 2/ 31 93 20/0020/002010030/0093 181 2/ 42 18/002010042 105 Tandulwadi 20/ 'i) 21 21 53 20/0020/0020/002010053 181 21 29 I S/0020/0029 106 Terkncda 201 21 2/ i/ 40 20/002010020100 I 0100.10 J 81 21 57 18/0020/0057 107 UmJra 201 2/ 2/ II 38 20/00:0/00201001010038 18! 21 60 18/0020/0060 108 IJplai 201 '2J 21 2J 78 20/002{\1()\) 20/0020/0078 181 mos 18/0020/010:' 109 Wadgal1n (Jagir) 201 2/ '21 21 :3 i 20/0020/0020/0020/008 I J8! 2/120 1810020/0120 110 Wadgaon (Shirdhon) 20t 2: 2f VI09 2010020/0020/0030/0 I 09 181 21 82 18/002010082 II I WadJi 201 2/ 2/ II 42 2010020/0020/0010/0042 1 gl 2/100 i 8/002010 I 00 lIZ Wagholi ZO/ ]J 2! 21 72 20(0020/00 20100201007 Z 181 21112 18/002010 J 12 113 Wakdi ISlal 201 2/ 21 3i 89 20/0020/00201003010089 181 21 38 18/0020/0038 114 Wakdi Ke) 20/ 21 21 21 49 2lJ/OOZOIOO20/0020/0049 181 2/ 51 18/002010051 115 Wanewadi 201 21 21 21 74 20/0020/0020/0020/0074 181 21l 13 ! 8/0020/0113 li6 Wathawada 20/.212/3/117 20/0020/0020/0030/01 J 7 18! 2/ 81 18/0020/0081 117 Yl'randgaol1 lOI 'jj 21 21 86 20/0020/00)01002010086 181 21116 18/0020/0116 118 Yermala 201 21 21 11 48 20/0020/0020/00 I 010048 181 21104 18/0020/0 104 ! 19 Zinner 20/ 21 21 II 34 20/0020/0020/0010/0034 18/21 55 18/002010055
--------_.
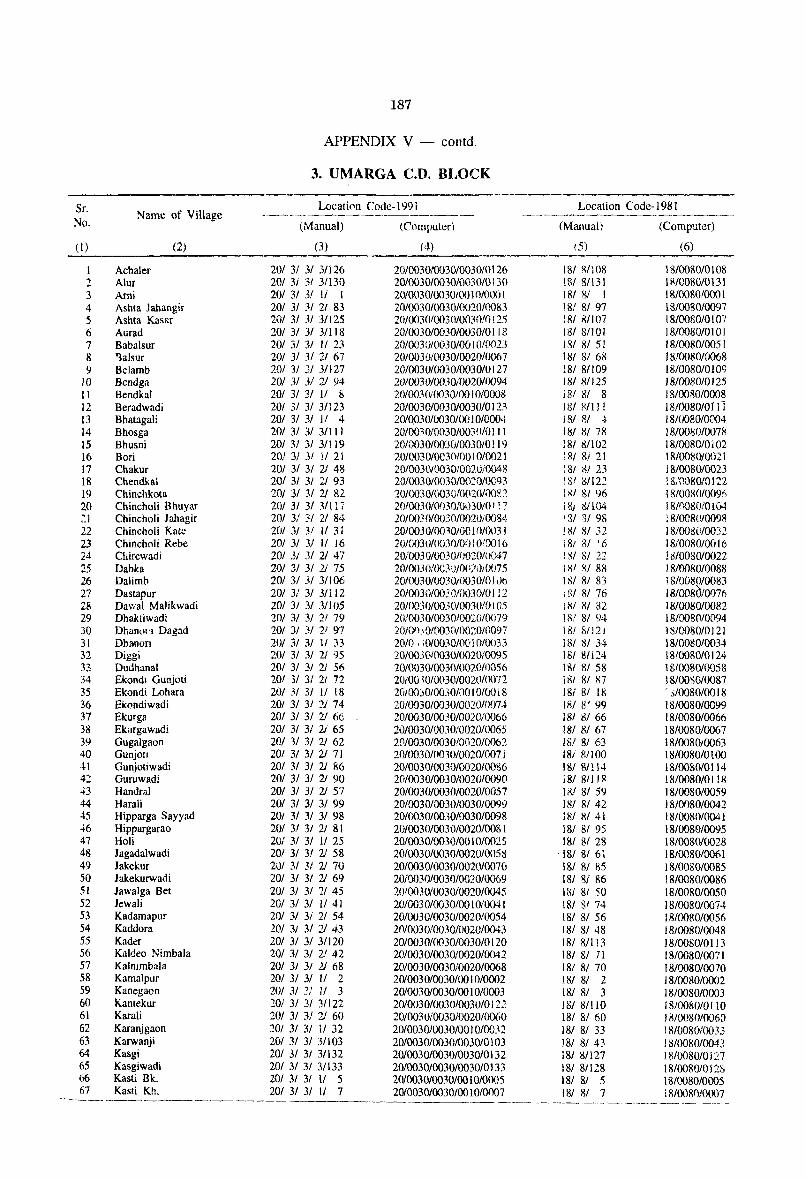
187
APPENDIX V - contd.
3. UMARGA CD. BLOCK
------Sr. Locatino Codc-) 991 Location Codc-1981
Name of Village ----.~ ----- ------No. (Manual) (Computer) (Manuai) (Computer)
(I) (2) (3) (4) (5) (6)
Achaler 201 3/ 31 31126 20/003010030/0030/0126 181 R/108 \ 8/0080/0108 2 Alur 201 3/ 31 31130 20/0030/0030/0030/0 (30 IRI 31131 \ R/0080/013 \ 3 Ami 201 31 31 Ii 1 201003010030100 I 0/000 I 181 8i I \ 810080/000 1 4 Ashta Jahangir 201 31 31 21 83 20/oo30/0030/0U20/0083 181 81 97 18/0080/0097 5 Ashta Kasar 201 31 31 31125 20/0030/0030/0030!O! 25 181 81107 18/0080101 07 6 Aurad 201 31 31 3/118 20/0030/003010030/0118 18/8/101 J 8/008010 I 0 I 7 Babalsur 201 3/ 31 II 23 20/003010030/00 I o/oon 181 8/ 51 18/0080/0051 8 '1alsur 201 3/ 3/ 21 67 20/003i)/OO30/0020/0067 181 8/ 68 18/0080/0068 9 Belamb 201 31 31 31127 20/0030/0030/0030/0127 181 81109 18/0080/0109
JO Bendga 20/ 3/ 31 21 94 2010030/0030/0020/0094 18/ 81125 18/008010125 II Bendkal 201 31 31 1/ 8 20/0030/(.l030/00 1 010008 181 81 8 J 8/00S0/D008 12 Beradwadi 201 31 31 31123 20/0030/003010030!0 123 Jill !<Il J I 181008010111 13 Bhatagali 20/ 3/ 31 11 4 20/0Q30/0030/0() J 01000-1 18/ 81 ~ J 810080/0004 14 Bhosga 201 31 31 31111 20/0030/0030/003n1011 J 181 81 78 18/008010078 15 Bhusni 201 31 3/ 311 J9 20/0030/(0)O!0030/0 119 181 81102 18/0080/01 02 16 Bori 20/ 31 31 II 21 20/0030/0030100 I 010021 181 81 21 18/00S0/0021 17 Chakur 201 31 31 2/ 48 20/0030/()0301002iJ10048 18/ -r,! 23 18/0080/0023 18 Chendkal 20/ 31 3/ 21 93 20/0030/0030/0020/0093 1818/12.2 18;'0080/0122 19 Chinchkota 201 31 3f 2/ 82 20/0030/003()/OOZO/i)08 :'\ 1~1 81 96 18/0080/0096 20 Chincholi Bhuyar 201 31 31 ~/117 20tOmO/0030/0()30/0 I ! 7 lSi ~/I04 18/0080/0104 ::1 Chincholi lahagir 201 3/ 31 21 84 20/003()IOO30/002010084 131 )3/ 98 : 8/008U/009R 22 Chincholi Kate 201 3/ 31 II 31 20100JO/OO,OtOC 1 {l/003 J 18/ 81 32 18/0080/0032 23 Chincholi Rebe 201 31 )/ II 16 20/0030/( mO/o:) 10100 16 181 81 '6 18/0080/0016 24 Chirewadi 20/ 3/ 31 21 .. rl 20/0030/0030f()020/()047 1 Sf 81 22 lll/0080/0022 25 Dabka 201 31 31 2J 75 20/003 0/00;\ O/OO:'ii/0075 J XI )1,1 88 1810080/0088 26 Dalimh 201 31 .i/ 31106 20/0030/0030,0030/0 J vb ] S/ 81 83 ! 810080/0083 27 Dastapur 201 3/ 3/ 3/112 20/0030/0030/0030/0112 ;;;'/ SI 76 18/008010076 Z8 Dawal Malikwadi 201 31 31 3/1 05 20/o030/0030/0030i0 I 05 J81 81 32 18/0080/0082 29 Dhakliwadi 201 31 31 21 79 20/0030/0030/00::0/0079 JRI 81 94 18/008010094 30 Dhan\ll"l Dagad 201 31 31 2/ 97 20/()fl··O/OOJ()jI)O:~01('.{)97 18l 8/121 J 8/00S0/0 121 31 Dbanofl 201 31 31 II 33 20m , ;O/OO:~O/()OI 010033 181 8/ 34- 18/0080/0034 32 Diggi 201 31 31 21 '15 20/003()IOO30/00Z0/0095 181 81124 18/00S0/0 124 33 Dudhanal 201 31 31 21 56 20/0030/00301002010056 18! 81 58 1810080/0058 34 Ekondl Gunjoti 201 31 31 21 72 2010010/003010020/0072 lSI 81 87 J 810030/0087 35 Ekondi Loham 201 _V 31 II 18 2G/OOjOl0030/001 0100 18 181 81 III - ..;10080/0018 36 Ekondiwadi 201 31 31 '!J 74 20/003010030/002010074 181 ll' 99 18/0080/0099 37 Ekurga 201 31 31 2/ 66 20/0030/0030/0020/0066 181 81 66 18/0080/0066 38 Ekurgawadi 201 31 31 2i 65 20/oo30/(){)30:0020/0065 18/ 81 67 18/0080/0067 39 Gugalgaon 20/ 31 31 21 62 20/0030/0030/002010062 IS! 81 63 18/0080/0063 40 Gunjotl 201 31 31 21 71 20/0030/0030/0020/0071 18i 1'.1100 18/0080/0 I 00 41 Gunjotiwadi 201 31 31 21 86 20/0030/0030/0020/0086 Jill 81114 18/008010114 42 Guruwadi 201 31 3/ 21 90 2010030/0030/0020/0090 181 811 J fI 18/0080/0 I 18 43 Handral 201 31 31 2/ 57 20/0030/0030/0020/0057 Ix! 81 59 18/0080/0059 44 Harali 201 31 31 31 99 20/0030/0030/0030/0099 181 81 42 J 81008010042 45 Hipparga Sayyad 201 31 31 31 98 20/0030/0030/0030/0098 181 81 41 18/0080/0041 46 Hippargarao 201 31 31 21 81 20/0030/0030/0020/0081 181 81 95 18/0080/0095 47 Holi 20: 31 31 II 25 20/0030/0030/00 10/0025 181 81 28 18/0080/0028 48 Jagadalwadi 201 31 31 2/ 58 20/0030/0030/oo20/(}(158 ·181 81 61 18/0080/0061 49 Jakekur 201 31 3/ 2/ 70 20/0030/0030/0020/0070 181 81 85 18/0080/0085 50 Jakekurwadi 201 31 31 21 69 20/0030/0030/0020/0069 181 81 86 \ 81008010086 51 lawalga Bet 201 31 31 21 45 20f(l()30/0030/0020/0045 181 SI 50 18/0080/0050 52 lewali 201 31 31 II 41 20/0030/0030/0010/0041 181 Sf 74 18f0080/007 .. ~ 53 Kadamapuf 201 31 3; 21 54 20/0030/0030/0020/0054 181 81 56 18/0080/0056 54 Kaddora 20/ 31 31 '21 43 20/0030/0030/0020/0043 18/ '31 48 J 81008010048 55 Kader 20/ 3/ 31 31120 20/0030/0030/0030/0120 181 81l J3 18/008010113 56 Kllldeo Nimbala 201 3/ 31 21 42 20/0030/0030100201004 2 181 81 71 18/0080/0071 57 Kalmmbala 20/ 31 31 11 68 20/0030/003010020/0068 181 81 70 18/008010070 58 KamaJpuf 201 3/ 31 11 2 2010030/0030/00 J 0/0002 181 81 2 18/0080/0002 59 Kanegaon 201 31 3! 11 3 20/0030/0030/00 1 0/0003 181 81 3 18/008010003 60 Kantekur 201 31 31 31122 20/0030/0030/0030/0122 181 81110 18/0080/0110 61 Karali 201 31 3/ 21 60 20/0030i0030/0020/0060 181 81 60 18/0080/0060 62 Karanjgaon 101 31 31 II 32 20/0030/0030/00 J 010032 181 81 33 18/0080/0033 63 Karwanji 201 31 31 311 03 20/0030/0030/00JO/O I 03 181 81 43 J 8100801004:0 64 Kasgi 201 31 31 3/132 2010030/0030/0030/0132 181 8/127 18/0080/0 i 27 65 Kasgiwadi 201 31 31 31133 20/0030/0030/0030/0 J 33 181 81128 18/008010 J 28 66 Kasli Bk. 201 31 31 II 5 201003010030/00 1010005 181 81 5 18/0080/0005 67 Kasli Kh. 201 31 31 II 7 201003010030100 1 0/0007 181 81 7 i 8/0080looo7
-------~------------------------ ----------- ------- ----~------ _----- ----- - "_---
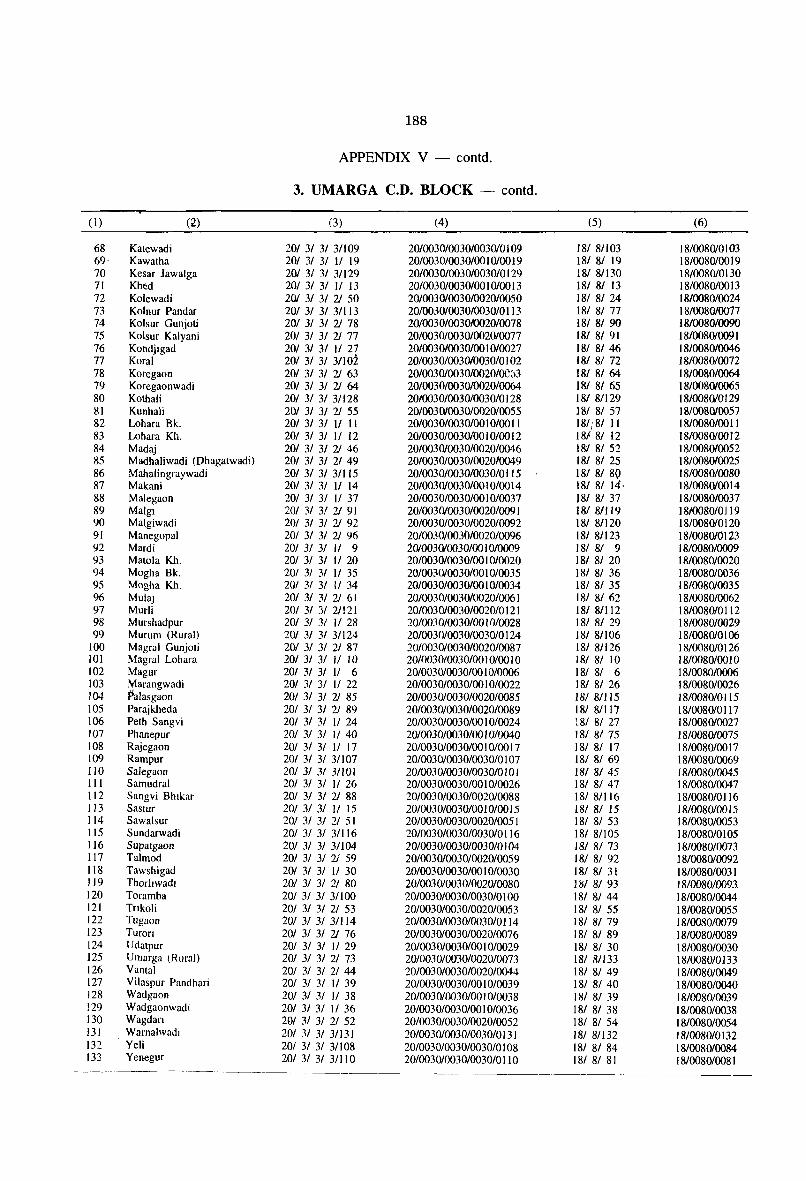
188
APPENDIX V - contd.
3. UMARGA C.D. BLOCK - contd.
(1) (2) (3) (4) (5) (6)
68 Katewadi 201 31 31 31109 20/0030/0030/003010 I 09 181 81103 18/008010103 69· Kawatha 201 31 31 II 19 20/003010030100 I 0100 19 181 81 19 18/0080/00 19 70 Kesar Jawalga 201 31 31 31129 20/0030/0030/0030/0129 181 81130 18/0080/0130 71 Khed 201 31 31 11 13 20/0030/0030/00 I 0100 13 181 81 13 18/0080/0013 72 Kolewadi 201 31 31 21 50 20/0030/0030/0020/0050 181 81 24 1810080/0024 73 Kolnur Pandar 201 31 31 31113 20/0030/00301003010113 181 81 77 18/008010077 74 Koisur Gunjoti 201 31 31 21 78 2010030/003010020/0078 181 81 90 18/008010090 75 Koisur Kalyani 201 31 31 21 77 20/0030/00301002010077 181 8/ 91 18/0080/0091 76 Kondjigad 201 31 31 II 27 201003010030/00 I 0/0027 181 81 46 18/008010046 77 Koral 201 31 31 31102 20/0030/003010030/0 I 02 181 81 72 18/0080/0072 78 Koregaon 201 31 31 21 63 20/oo30/oo30/oo20/OCJ3 181 81 64 18/0080/0064 79 Koregaonwadi 201 31 31 21 64 20/0030/00301002010064 181 8/ 65 18/008010065 80 Kothali 201 31 31 31128 2010030/00301003010128 181 81129 18/oo801<J129 81 Kunhali 201 31 31 21 55 20/003010030/0020/0055 181 81 57 18/008010057 82 Lohara Bk. 201 31 31 II II 20/0030/0030100 I 0100 11 18//81 II 1810080/0011 83 Lohara Kh. 201 31 31 II 12 20/0030/003010010100 12 18t 81 12 18/0080/00 12 84 Madaj 201 31 31 21 46 20/0030/003010020/0046 lsi 81 52 18/008010052 85 Madha1iwadi (Dhagatwadi) 201 31 31 21 49 20/0030/0030/002010049 181 81 25 18/008010025 86 Mahalingraywadi 201 31 31 31115 20/oo30/oo30fOO30/0115 181 81 8Q 18/0080/0080 87 Makani 201 31 31 II 14 20/003010030/00 10100 14 181 81 14, 18/008010014 88 Malegaon 201 31 31 II 37 20/0030/0030/00 I 0/0037 181 81 37 18/0080/0037 89 Malgl 201 31 31 21 91 20/00301003010020/0091 181 8/Il9 1810080/0119 90 Malgiwadi 201 31 31 21 92 20/0030/0030/0020/0092 181 81120 18/008010120 91 Manegopal 201 31 31 21 96 20/oo30/003(J/0020/oo96 181 81123 18/008010123 92 Mardi 201 31 31 JI 9 201003010030100 I 010009 181 8/ 9 18/008010009 93 Matola Kh. 201 31 31 II 20 20/0030/0030/00 I 0/0020 18/ 81 20 18/0080/0020 94 Mogha Bk. 201 31 31 11 35 20/00301003010010/0035 181 81 36 18/0080/0036 95 Mogha Kh. 201 3f 31 II 34 20/0030/0030100 I 010034 181 81 35 18/0080/0035 96 MulaJ 201 31 31 21 61 20/0030/003010020/0061 181 81 62 18/0080/0062 97 MurH 201 31 31 21121 20/003010030/0020/0121 181 81112 18/0080/0112 98 Murshadpur 201 31 31 II 28 20/0030/0030/00 10/0028 181 81 29 18/0080/0029 99 Murum (Rural) 201 31 31 31124 20/0030/0030/0030/0124 181 81106 18/0080/0 106
100 Magral Gunjoti 201 31 31 21 87 20/0030/0030/0020/0087 181 8fl26 J 8/0080/0126 101 Magral Loham 201 31 31 II 10 20/003010030100 10100 10 181 81 10 18/0080100 10 102 Magur 201 31 31 II 6 20/003010030/00 I Oro006 181 81 6 18/0080/0006 103 Marangwadi 201 31 31 II 22 20/0030/0030/00 I 010022 181 8/ 26 18/0080/0026 104 F'alasgaon 201 31 31 21 85 20/0030/0030/002010085 181 8/1 15 18/0080/0115 105 Parajkheda 20/ 3/ 3/ 21 89 20/0030/003010020/0089 181 811 17 18/0080/0 I 17 106 Peth SangYi 201 31 31 II 24 20/0030/0030/00 I 010024 181 81 27 18/0080/0027 107 Phanepur 20/ 31 31 II 40 20/0030/0030/00 I 010040 181 81 75 18/008010075 108 Rajegaon 201 31 31 II 17 20/0030/0030/00 10100 I 7 181 81 17 18/0080100 17 109 Rampur 201 31 31 3/1 07 20/0030/00301003010 I 07 181 81 69 18/0080/0069 110 Salegaon 201 31 31 31101 20/003010030/00301010 1 181 8/45 18/0080/0045 III Samudral 201 31 31 II 26 20/0030/0030/00 I 010026 181 81 47 18/0080/0047 112 SangYi Bhlkar 201 31 31 21 88 20/0030/0030/0020/0088 181 81116 18/0080/0116 113 Sastur 201 31 31 II 15 20/0030/0030/00 I 0100 15 18/ 81 15 18/0080/0015 114 Sawalsur 201 31 31 21 51 20/0030/0030/0020/0051 181 81 53 18/0080/0053 115 Sundarwadi 201 31 31 31116 20/0030/0030/0030/0116 181 8/105 18/0080/0 I 05 116 Supatgaon 201 31 31 311 04 20/0030/00301003010 I 04 181 81 73 18/0080/0073 117 Talmod 201 31 3/ 21 59 20/0030/0030/0020/0059 18/ 81 92 18/0080/0092 118 Tawshigad 201 31 31 1/ 30 20/0030/0030100 I 010030 181 8/ 31 J 81008010031 J19 Thorhwadl 201 31 31 21 80 20/0030/0030/0020/0080 181 81 93 J 81008010093. 120 Toramba 201 31 31 311 00 20/0030/0030/0030/0 I 00 181 81 44 18/0080/0044 121 Tnkoli 201 31 31 21 53 20/0030/0030/0020/0053 181 81 55 18/0080/0055 122 Tugaon 201 31 31 3/114 20/003010030/0030101 14 181 81 79 18/0080/0079 123 Turon 201 31 31 21 76 20/0030/0030/0020/0076 181 81 89 18/0080/0089 124 Udatpur 201 31 31 II 29 20/0030/0030/00 I 010029 181 81 30 18/0080/0030 125 Umarga (Rural) 201 31 3/ 21 73 20/0030/0030/002010073 181 8/133 18/0080/0133 126 Vanta1 201 31 31 21 44 20/0030/0030/0020/0044 181 81 49 18/0080/0049 127 ViJaspur Pandhari 201 31 31 II 39 20/0030/0030100 I 010039 181 81 40 18/0080/0040 128 Wadgaon 201 31 31 II 38 2010030/003010010/0038 181 81 39 18/0080/0039 129 Wadgaonwadi 201 3f 3f If 36 20/0030/0030100 10/0036 181 81 38 18/0080/0038 130 Wagdan 201 31 31 21 52 20/0030/0030/0020/0052 181 81 54 18/0080/0054 131 Warnalwadl 201 31 31 3113 1 20/0030/0030/003010131 181 81132 18/008010132 132 Yeli 201 31 31 311 08 20/0030/0030/0030/0 I 08 181 81 84 18/008010084 133 Yenegur 201 31 31 311 10 20/003010030/0030/0110 181 8/ 81 18/0080/0081
------
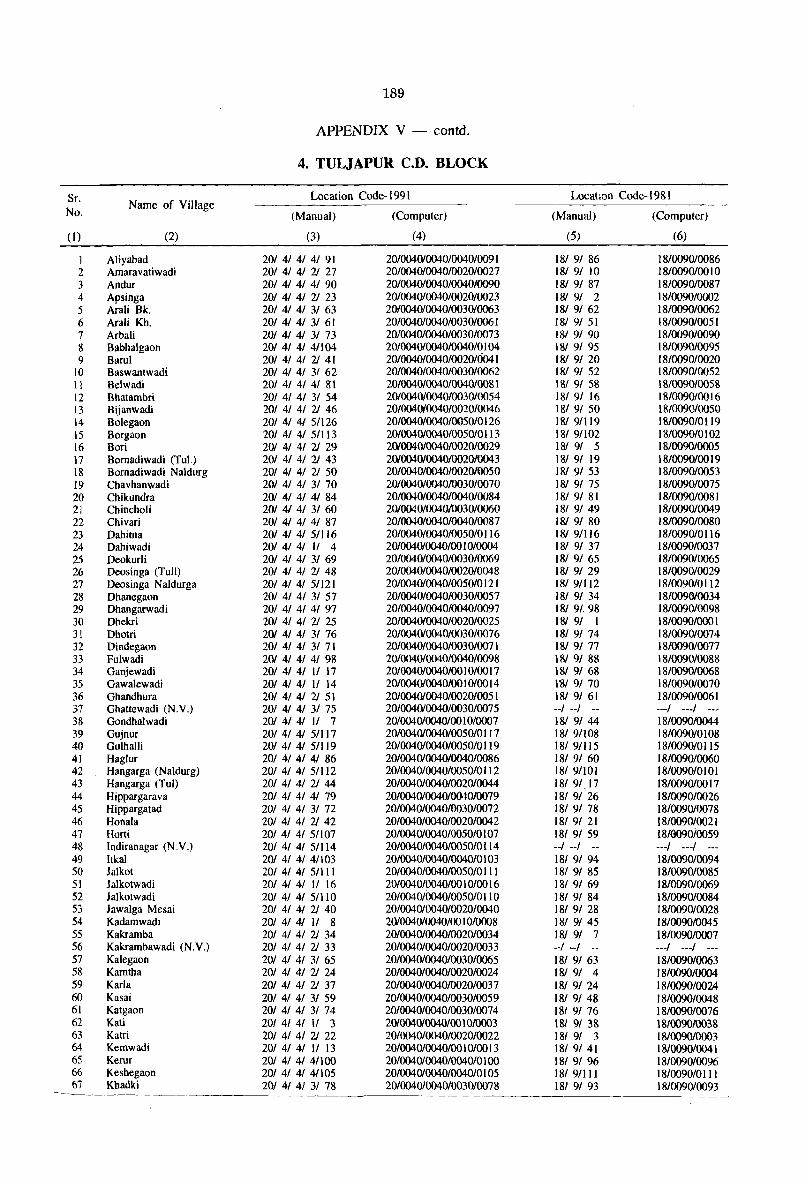
189
APPENDIX V - contd.
4. TULJAPUR C.D. BLOCK
Sf. Location Code- I 991 Location Code- I 981
No. Name of Village
(Computer) (Manual) (Computer) (Manual)
(1) (2) (3) (4) (5) (6)
I Aliyabad 201 41 41 41 91 20/004010040/0040/0091 181 91 86 18/0090/0086 2 Amara vatiwadi 20/ 4/ 4/ 21 27 20/0040/0040/0020/0027 18/ 9/ 10 18/0090/00 1 0 3 Andur 201 4/ 41 4/ 90 2010040/004010040I0090 181 91 87 18/0090/0087 4 Apsinga 20/ 41 41 21 23 20/004010040/002010023 181 9/ 2 18/0090/0002 5 Arali Bk. 201 41 41 31 63 2010040/0040/003010063 181 91 62 18/0090/0062 6 Ara1i Kh. 201 41 41 31 61 20/0040/0040/0030/0061 18/ 91 51 18/009010051 7 Arbali 201 4/ 41 31 73 20/00401004010030/0073 181 91 90 18/009010090 8 Babhalgaon 201 41 41 4/104 20/0040/0040/0040/0 I 04 181 91 95 18/0090/0095 9 Barul 201 41 41 21 41 20/0040/004010020/6041 181 91 20 18/0090/0020
10 Baswantwadi 201 41 41 31 62 20/0040/0040/0030/0062 181 91 52 18/0090/0052 11 Be\wadi 201 41 41 41 81 20/0040/0040/004010081 181 91 58 18/009010058 12 Bhatambri 201 4/ 41 31 54 201004010040/0030/0054 181 91 16 1810090100 16 13 Bijanwadi 201 41 41 21 46 20/0040(0040/0020/0046 181 91 50 18/0090/00SQ 14 Bolegaon 201 41 4/ 51126 20/0040/0040/0050/0126 181 91119 18/0090/0119 15 Borgaon 201 41 41 51113 20/004010040/0050/0113 181 91102 18/0090/0 102 16 Bori 201 41 41 21 29 2010040100401002010029 181 9/ 5 18J0090/0005 17 Bomadiwadi (Tu!.) 201 41 41 21 43 201004010040/002010043 181 91 19 18/0090100 19 18 Bornadiwadi Naldurg 20/ 41 41 2J 50 20/0040/00401002010050 18/ 91 53 18/0090/0053 19 Chavhanwadi 201 4/ 4/ 3/ 70 20/00401004010030/0070 181 91 75 18/009010075 20 Chikundra 201 41 41 41 84 20/0040/0040/0040/0084 18/ 91 81 18/0090/0081 21 Chincholi 20/ 4/ 41 31 60 2010040/00401003010060 18/ 91 49 18/0090/0049 22 Chivari 201 4/ 41 4/ 87 20/004010040/0040/0087 181 9/ 80 18/0090/0080 23 Dahitna 201 4/ 4/ 5/116 20/0040/0040/0050/0 I 16 181 91116 18/009010116 24 Dahiwadi 201 41 41 II 4 20/004010040100 I 010004 181 91 37 18/0090/0037 25 Deokurli 201 41 41 31 69 20/0040/0040/0030/0069 18/ 91 65 18/0090/0065 26 Deosinga (Tull) 20/ 41 4/ 21 48 20/0040/0040/0020/0048 18/ 9/ 29 18/0090/0029 27 Deosinga Naldurga 20/41 4/ 51121 20/0040/0040/005010121 181 9/112 18/0090/0112 28 Dllanegaon 201 41 4/ 31 57 20/0040/0040/0030/0057 18/ 91 34 18/009610034 29 Dhangarwadi 201 41 41 41 97 20/0040/0040/0040/0097 181 9/.98 18/0090/0098 30 Dhekri 20/ 41 41 21 25 20/004010040/0020/0025 181 9/ I 18/00901000 I 31 Dhotri 201 41 4/ 31 76 20/004010040/0030/0076 181 9/ 74 18/0090/0074 32 Dindegaon 201 41 41 31 71 20/0040/0040/0030/0071 18/ 91 77 18/009010077 33 Fulwadi 201 41 41 41 98 20/0040/0040/004010098 181 91 88 18/0090/0088 34 Ganjewadi 201 4/ 41 II 17 20/0040/0040100 I 0100 17 181 91 68 18/009010068 35 Gawalewadi 201 41 41 II 14 2010040/0040100 10100 14 1111 9/ 70 18/0090/0070 36 Ghandhura 201 41 41 21 51 20/004010040/0020/0051 181 91 61 18/0090/0061 37 Ghattewadi (N.V.) 20/ 4/ 4/ 31 75 20/004010040/0030/0075 --I --I -- ---I ---I ---38 Gondhalwadi 20/ 4/ 41 II 7 20/004010040/00 I 010007 181 91 44 18/009010044 39 Gujnur 201 41 41 51117 20/004010040/0050/0117 181 91108 18/0090/0 I 08 40 Gulhalli 20/ 41 41 5/119 20/0040/0040/005010119 181 9/115 18/0090/0115 41 Haglur 201 41 41 4/ 86 20/00401004010040/0086 181 91 60 18/0090/0060 42 Hangarga (Naldurg) 20/ 41 4/ 5/112 20/0040/0040/0050/0112 181 91101 18/0090/0 I 0 1 43 Hangarga (Tul) 201 4/ 41 2/ 44 20/0040/0040/0020/0044 181 9/.17 18/0090/00 17 44 Hippargarava 20/ 41 41 41 79 20/0040/0040/004010079 181 91 26 18/0090/0026 45 Hippargatad 201 4/ 41 31 72 20/0040/004010030/0072 181 91 78 18/0090/0078 46 Honala 201 41 41 21 42 20/0040/0040/0020/0042 18f 91 21 18/0090/0021 4? Horti 201 41 4t 5t10? 20/0040/0040/0050/0107 18t 9t 59 18/0090{0059 48 Indiranagar (N.V.) 20t 41 41 5/114 20/0040/0040/005010114 --I --I -- ---I ---I ---49 ltkal 201 41 41 4/103 20/0040/0040/0040/0103 18t 91 94 18/0090/0094 50 Jalkot 201 41 41 51111 20/0040/0040/0050/0 III 181 91 85 18/009010085 51 Jalkotwadi 201 41 41 II 16 20/0040/0040/00 10/00 16 18t 91 69 18/009010069 52 lalkotwadi 201 4/ 41 51110 20/0040/0040/005010 110 181 91 84 18/0090/0084 53 Jawalga Mesai 201 41 41 21 40 20/0040/0040/0020/0040 181 91 28 18/0090/0028 54 Kadamwadi 201 41 41 II 8 201004010040/00 I 0/0008 181 91 45 18/009010045 55 Kakramba 201 4/ 41 21 34 20/0040/0040/002010034 181 91 7 IS/0090/0007 56 Kakrambawadi (N.V.) 201 41 41 21 33 20/004010040/0020/0033 --I --I -- ---I ---I ---57 Kalegaon 201 41 41 31 65 20/0040/0040/0030/0065 181 91 63 18/0090/0063 58 Kamtha 20/ 4/ 41 21 24 20/0040/0040/0020/0024 lSI 91 4 18/0090/0004 59 Karla 201 41 41 21 37 20/0040/0040/0020/0037 181 91 24 18/009010024 60 Kasai 201 41 41 31 59 20/0040/0040/0030/0059 181 91 48 18/009010048 61 Katgaon 201 41 4/ 31 74 20/0040t0040/oo30tOO?4 181 91 76 18/0090/0076 62 Kati 20t 4t 4t It 3 201004010040/00 1 0/0003 18/ 91 38 181009010038 63 Katri 201 41 41 21 22 20/0040/0040/0020/0022 lSI 91 3 18/009010003 64 Kemwadi 201 41 41 II 13 20/0040/0040/00 I 0100 13 1St 91 41 18/0090/0041 65 Kerur 201 41 41 411 00 20/0040/0040/004010 I 00 18t 91 96 18/0090/0096 66 Keshegaon 201 41 41 411 05 20/0040/0040/0040/0 105 1St 91111 18/0090/0111 67 Khadki 201 41 41 31 78 20/004010040/0030/0078 181 91 93 18/0090/0093
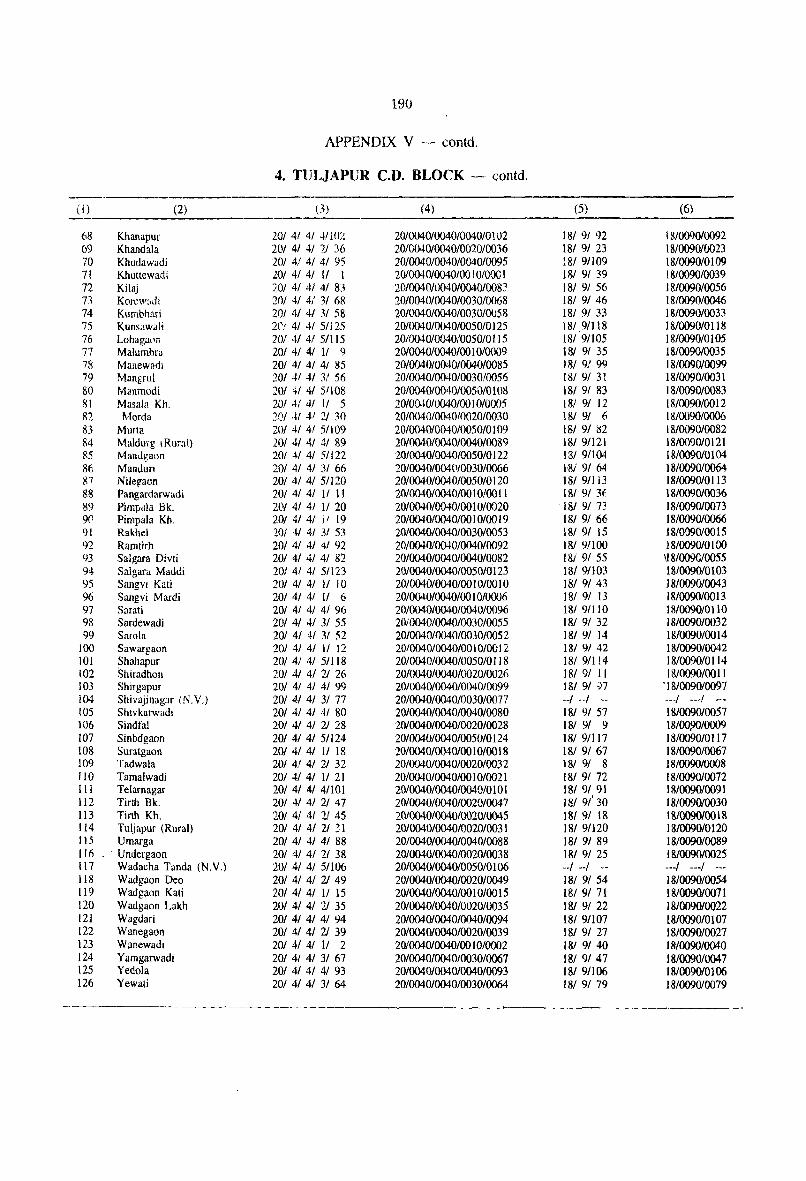
190
APPENDIX V -- contd.
4. TUl,JAPUR C.D. BI,QCK - contd.
(I) (2) (}» (4) (5) (6)
68 Khanapur 20/ 41 41 4/1 02 20/0040/004010040fO 102 181 91 92 18/0090/0092 69 Khandala 201 41 41 ?) 36 20/0040/0040/0020/0036 18/ 91 23 18/009010023 70 Khudawadi 201 4/ 41 41 95 20/0040/0040/004010095 18! 9/l09 18/0090/0 I 09 71 Khuttewadi 201 41 41 If I 2010040/0040/00 I 01000 I 181 91 39 18/009010039 72 Kilaj 201 41 4/ 41 83 20/0040/004010040/008: 18/ 91 56 18/0090/0056 73 KoreW:H.h 201 4/ 4/ 3/ 68 20/0040/0040/oo3010l168 181 9/ 46 18/009010046 74 Kumbhari 20/ 41 41 31 58 20/0040/004010030/0058 181 91 33 18/009010033 75 KunsJwilli 2l'! 41 41 SIl25 20/0040/0040/0050/0125 18/91118 18/0090/0118 76 Lohagaon 201 'll 41 51115 20/0040/0040/0050/0115 181 91105 18/0090/0 105 ~7 /, Malumbra 201 41 41 11 9 20/0040/0040100 10/0009 181 91 35 18/0090/0035 78 Manewadl 20/ 41 41 41 85 20/0040/0040/0040/0085 181 9/ 99 18/009010099 79 Mangrul 201 41 41 31 56 20/0040/004010030/0056 18/ 91 3! 18/0090/0031 80 Manmodi 201 4f 41 51108 20/0040/0040/0050/0108 181 91 R3 J 81009010083 81 Masala Kh. 201 4/ 41 II 5 20/0040/0040/00 I 010005 18/ 91 12 18/0090100 12 82 rvlorda ::.01 ,U 41 21 ~O 20/0040/004010020/0030 181 9/ 6 18/0090/0006 83 Murta 201 41 41 5f! 09 20/0040/0040/0050/0109 181 91 ~2 18/0090/0082 84 Maldurg tRural.) 20/ 41 41 41 89 20/0040/004010040/0089 181 91121 18/0090/0121 85 Man,lgaon 201 4f 41 Sfl22 20/0040/0040/0050/0122 181 91104 18/009010104 86 Mantiuft 201 41 41 31 66 20/0040/0040/003010066 l8i 9/ 64 18/0090/0064 87 Nilegaon 20/41 41 51120 20/0040/004010050/0120 18/9/1 J3 18/0090/0113 88 Pangardarwadi 201 4f 41 1/ 11 20/0040/0040/0010/00 11 181 91 3t 18/0090/0036 89 Pimpdla Bk. 201 41 41 11 20 20/0040/0040/00 10/0020 181 91 73 18/009010073 9(1 Pimpala Kh. 20/ 41 4/ ]' 19 20/0040/0040/00 1 0/00 19 181 91 66 18/0090/0066 91 Rakhel 20I 4/ 41 31 53 20/0040/0040/0030/0053 181 91 15 i 810090/00 15 92 Ramtirh 20/ 41 41 41 92 20/0040/0040/0040/0092 18/9/100 18/0090/0 I 00 93 Salgara Divti 201 41 41 41 82 20/0040/0040/0040/0082 181 91 55 \18/009010055 94 Salgara Maddi 201 41 41 51123 20/0040/004010050/0123 181 91103 18/0090/0103 95 Sangvl Kati 201 41 41 II 10 20/0040/0040/00 10100 10 181 91 43 18/0090/0043 96 Sangvi Mardi 201 41 41 II 6 20/0040/0040/00 1 010006 181 91 13 18/009010013 97 Sarati 201 41 41 41 96 20/0040/00401004010096 18/9/110 18/0090/0110 98 Sardewadi 201 4/ 41 3/ 55 20;0040/0040/0030/0055 181 91 32 1810090/0032 99 Sarola 201 41 4f 3f 52 20/0040f0040/0030/0052 181 91 14 18/0090100 14
100 Sawargaon 201 41 41 II 12 20/0040/0040100 I 0100 12 181 91 42 18/0090/0042 101 Shahapur 201 4/ 4/ 51118 20/0040/004010050/0118 181 9/114 18/0090/0114 102 Shiradholl 201 41 41 21 26 20/0040f0040/0020f0026 181 91 II 18/0090/00 11 103 Shirgapur 201 41 41 41 99 20/0040/0040/0040/0099 181 91 :.)7 '18/0090/0097 104 Shivajinagar (N. V.) 201 41 41 31 77 20/0040/0040/0030/0077 --I --I -- ---I ---I .--lOS ShlVkatwadl 201 41 41 41 80 20/0040/0040/0040/0080 181 91 57 18/009010057 106 Sindfal 201 41 41 21 28 20/0040/0040/0020/0028 18/ 91 9 18/OO~/OOO9 107 Sinbdgaon 201 41 41 51124 20/0040/0040/005010 124 18/ 9/117 I 8/0090{0 1 17 108 Suratgaon 201 41 41 1/ 18 20/0040/0040/00 1 0100 18 181 91 67 18/0090/0067 109 Tadwala 201 41 41 21 32 20/0040/0040/0020/0032 181 9/ 8 18/009010008 flO Tamalwadi 201 41 41 II 21 20/0040/0040/0010/0021 181 9f 72 18/009010072 III Telarnagar 20/ 41 41 41101 20/0040/0040/0040/0101 181 91 91 18/009010091 112 Tirth Bk. 201 41 41 21 47 20/0040/0040/0020/0047 181 9/30 18/009010030 113 Tirth Kh. 201 4f 4f 21 45 20/0040/0040/0020/0045 181 91 18 18/0090100 18 114 Tuljapur (Rural) 20/4/41 21 31 20/0040/004010020/0031 181 91120 18/0090/0120 115 Umarga 201 4/ 41 41 88 20/0040/0040/0040/0088 181 91 89 18/009010089 116 . ' Undergaon 201 41 4f 21 38 20f0040f0040f0020/0038 181 91 25 18/0090/0025 \\7 Wadacha Tunda (N.V.) 201 41 41 511 06 20/0040/0040/0050/0106 --I --I -- ---I ---I ---118 Wadgaon Deo 20{ 41 41 21 49 20/0040/0040/002010049 18/ 91 54 18/0090/0054 119 Wadgaon Kati 201 41 4f II 15 20/0040/0040/0010100 15 181 91 71 18/009010071 120 Wadgaon Lakh 20/ 41 41 21 35 20/0040/0040/0020/0035 181 91 22 18/0090/0022 121 Wagdari 201 41 41 41 94 20/0040/0040/004010094 181 9/107 18/0090/0107 122 Wanegaon 201 41 41 21 39 20/0040/0040/0020/0039 18/91 27 18/0090/0027 123 Wanewadl 201 41 41 II 2 20/0040/0040/00 I 010002 181 91 40 1810090/0040 124 Yamgarwadi 201 4f 41 31 67 20/0040/0040f0030/0067 181 91 47 18/0090/0047 125 Yedola 201 41 41 41 93 20/0040/0040/004010093 181 91106 18/0090/0106 126 Yewati 201 41 41 31 64 20/0040/0040/0030/0064 18/ 9/ 79 18/0090/0079
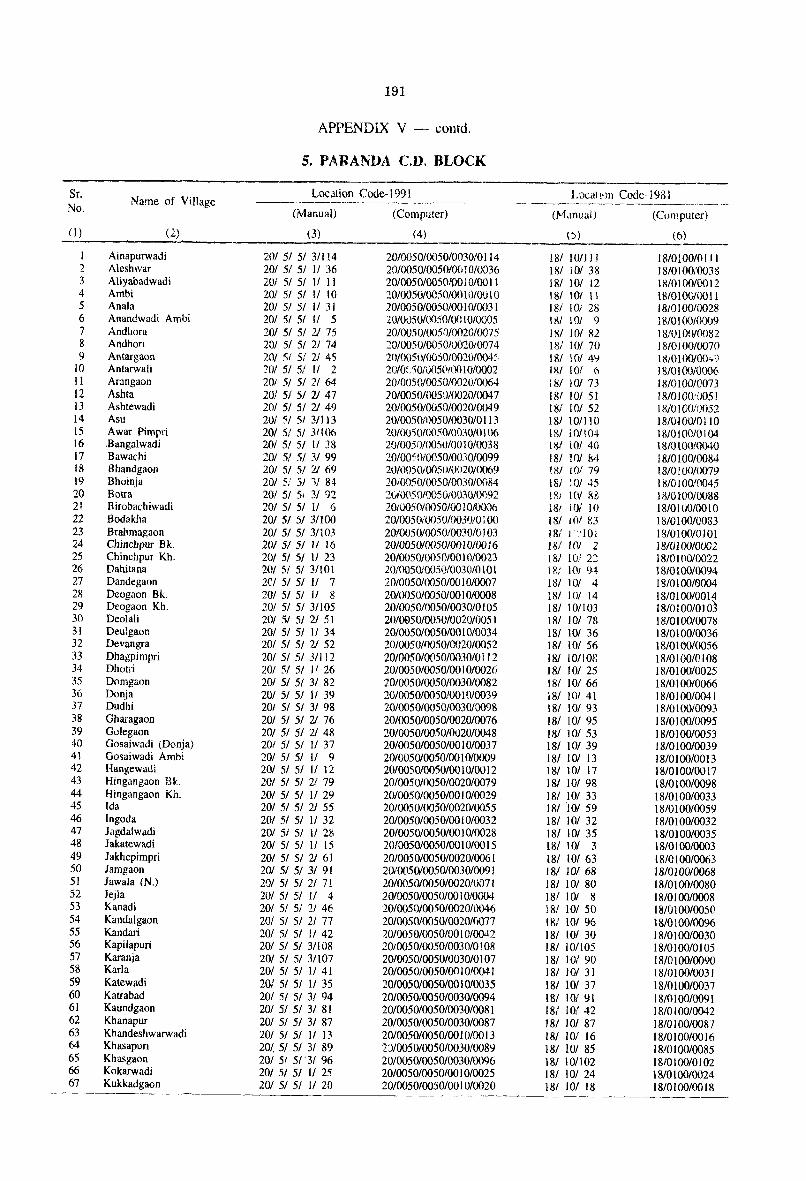
191
APPENDIX V - comd.
5. PARAN])A C.D. BLOCK
-------Sr.
Name of Village Localion Code- J 991 Loca\l')!l Codc-1981
No. ------------------- --- ---~----------------~--- ---(Manual) (Computer) (l'1Jnual) (Computer)
(1) (2.) (3) (4) (» (6) -----,_._-Ainapurwadi 201 51 51 31114 20/0050/0050/0030/0114 18/ lOll I I 18/0100/01 J 1
2 Aleshwar 201 5/ 51 II 36 20/0050/0050100! 010036 18/ 101 38 J 8/0 J 00/0038 3 Aliyabadwadi 201 5/ 5/ 11 II 20/0050/0050/0010100 11 lS/ 101 12 18/0100/0012 4 Ambi 20/ 51 51 II 10 20/0050/0050/0010100 I 0 UM lOt II 18/0 I ()()/OO II 5 Anala 20/ 51 51 II 31 20/0050/0050100 1 0/0031 181 101 28 18/0100/0028 6 Anandwadi Ambi 201 SI 51 II 5 20/0050/0050/00 10/0005 181 101 9 18/0 100/0009 7 Andhora 20/ 51 5/ 2/ 75 20/005010050/0020/0075 18/ 10/ S2 18J()!OO/0082 8 Andhon 201 51 51 21 74 20/0050/0050/002010074 18/ 10/ 70 J 8/0100/0070 9 Antargaon 7.01 :.r Sf 21 4<; 20/0050/005010020/004 '5 1 SI 101 4') IMHOO/OO,,':)
iO Antarwali '201 51 51 II 2 20/0;' 'i0/OO5(l/OO 10/0002 181 101 6 18/01 OOiOO06 11 Arangaon 201 51 5/ 21 64 2010050/00501002010064 Ill/ lOl 73 18/0100/0073 12 Ashta 201 51 5/ 21 47 10/0050/0050/0020/0047 181 101 51 1 RIO 100.' 005 I 13 Ashtewadi 201 51 51 21 49 20/0050/0050/002010049 181 101 52 18/010010052 14 Asu 20/ 51 51 31113 20/0050/1)050/0030/0113 18/ lOIll0 18/0100/0110 15 Awar Pimpri 20{ 51 51 3/106 20/0050(()050/0030/0 I 06 181 iOll04 18/0 I 00/0 I 04 16 .Bangalwadi 201 5i 51 II J8 20f0050/005U/OO 1 0/0038 IS! IOf 40 U~/O lOO/(lG40 17 Bawachi 20/ 51 51 31 99 20/00~0i()()50/00_iO/0099 181 Inl 84 18/0 I OO/OOIl4 18 Bhandgaon 201 5/ 51 2f 69 20/0050i0050!OO20/0069 181 101 79 18/0100/0079 19 Bhoinja 201 51 51 "if 84 2010050/0050/0030/0084 18/ 101 ·~5 18/0100/0045 20 Botra 20/ 51 51 31 92 20;\}(\SO/OOSO/OO30/0092 181 101 1\8 I 810 l'OOl0088 21 B irobachiwadi 201 51 51 it {) 201005010050100! 010006 181 101 10 IS/OIOO/OOIO 22 Bodak11a 20/ 5/ 5/ 31100 20/0050i0050/0030/0100 18/ 101 P,3 18/0 I 0010083 23 Brahtnagaon 20/ 5/ 5/ 3/!O3 201005010050/003010 103 18/ 1"'/101 18/0100/0101 24 Chinchpur Bk. 201 5/ 5/ 1/ 16 20/0050/0050/00 1 0/00 16 181 10/ 2 18/0100/0002 25 Chinchpur Kh, 201 51 51 1/ 23 20/0050/0050/0010/0023 18/ 101 22 18/0100/0022 26 Dahitana 201 51 51 31101 20/0050/005010030/0 I 0 I 18: 10l 94 18/0tOO/0094 27 Dandegaon 201 5/ 51 11 7 20/0050/0050/00 1 0/0007 lSI 101 4 18/0100/0004 28 Deogaon Bk, 201 51 51 II 8 201l)05010050/00 1 0/0008 181 10/ 14 18/0100/0014 29 Deogaon Kh. 201 51 51 31105 20/0050/0050/0030/0 I 05 181 101103 18/0100/010} 30 Deolali 201 51 51 21 51 20/005010050/0020/0051 18/ 101 78 18/0100/0078 31 Deulgaon 201 51 5f 11 34 20/0050/0050/00 1 010034 181 101 36 18/0100/0036 32 Devangra 201 51 51 21 52 20/(05011)050/0020/0052 181 101 56 18/0 I (')0/0056 33 Dhagpimpri 201 51 5/ 31112 20/0050/005010030/0 I J 2 18/ 10IJ08 18/0100/0108 34 Dhotri 20/ 51 5/ J 1 26 20/0050/0050/00 I 010026 18/ 101 25 18/0100/0025 35 Domgaon 201 5/ 51 31 82 20/00501005010030/0082 18! 101 66 18/01 00/0066 36 Donja 201 51 51 11 39 20/0050/0050/00 10/0039 181 101 41 IS/O 100/0041 37 Dudhi 201 51 51 31 98 20/0050/0050/0030/009S 181 101 93 18/01 00/0093 38 Gharagaon 201 51 51 21 76 20/oo50!0050/0020/0076 181 101 95 18/0100/0095 39 GuJegaon 201 51 5/ 2/ 48 20/0050/005010020/0048 181 JOI 53 18/0 JOO/0053 40 Gosaiwadi (Donja) 201 5/ 5/ II 37 20/0050/0050/00 I 0/003 7 181 101 39 18/0100/0039 41 Gosaiwadi Ambi 201 51 51 II 9 20/0050/0050/00 I 010009 181 101 13 18/010010013 42 Hangewadi 201 51 5/ II 12 20/0050/0050100 1 0100 12 181 101 17 IS/O I 00/00 17 43 Hingangaon Bk, 201 51 51 21 79 20/0050/0050/002010079 181 101 98 18/0100/0098 44 Hingangaon Kh, 201 51 5/ II 29 20/0050/0050/0010/0029 181 101 33 18/0100/0033 45 Ida 201 51 5/ 21 55 20/0050/0050/002010055 18/ '10/ 59 18/0100/0059 46 Ingoda 201 51 51 II 32 20/0050/0050100 I 010032 18/ 10/ 32 IS/0100/0032 47 Jagdalwadi 20/ 51 51 11 28 20/0050/0050/00 10/0028 IS/ 101 35 18/0100/0035 4S lakatewadi 201 51 51 II 15 20/0050/0050/00 I O/OG 15 18/ 101 3 18/0 100/0003 49 Jakhepimpri 201 51 51 21 61 20/0050/0050/0020/0061 181 101 63 18/0100f0063 50 Jamgaon 201 51 51 3/ 91 20/005010050/0030/0091 18/ 101 68 1810100/0068 51 Jawala (N.) 20/ 51 51 21 7! 20/005010050/0020/0071 181 101 80 18/0100/0080 52 Jejla 201 51 51 II 4 20/0050/0050/00 I 010004 181 101 8 18/01 0010008 53 Kanadi 201 5f 51 21 46 20/0050/0050/00201l}O46 181 101 50 18/01 00/0050 54 Kandalgaon 201 51 51 21 77 20/0050/0050/0020/0077 11$1 101 96 18/0! 0010096 55 Kandari 201 5/ 51 II 42 20/0050/0050/00101004 2 181 101 30 I S/O 100/0030 56 Kapilapuri 201 51 51 3/108 20/0050/0050/0030/0 I 08 181 101105 18/0100/0105 57 Karanja 201 51 51 3/1 07 20/0050/0050/0030f() I 07 18/ 10/ 90 18/0 I 00/0090 58 Karla 201 51 51 1/ 41 20/0050/0050/00 I 010041 181 101 31 18/0100/0031 59 Katewadi 20/ 51 51 II 35 20iOOSO/OOSO/00 I 010035 181 101 37 18/0100/0037 60 Katrabad 201 51 51 31 94 20/0050/0050/0030/0094 181 10/ 91 18/0 I 00/0091 61 Kaundgaon 201 51 51 31 SI 20/0050/0050/003010081 18/ 10/ 42 IS/O I 00/0042 62 Khanapur 201 51 5/ 31 87 20/0050/0050/0030/0087 181 101 87 18/0 I 00/008 7 63 Khandeshwarwadi 201 51 51 1/ 13 20/0050/0050/00 I 0/00 13 18/ 101 16 18/0100/00 16 64 Khasapun 20/. 51 51 31 89 2:)/0050/0050/0030/0089 18/ 101 85 18/0100/0085 65 Khasgaon 201 51 51' 31 96 20/0050/00501003010096 181 IO/J02 18/0100/0102 66 Kokarwadi 201 51 51 11 25 20/0050/0050/00 I 0/0025 181 101 24 18/0100/0024 67 Kukkadgaon 20/ 51 5/ 1/ 20 20/0050/0050/00 I 0/0020 181 101 18 18/0100100 18
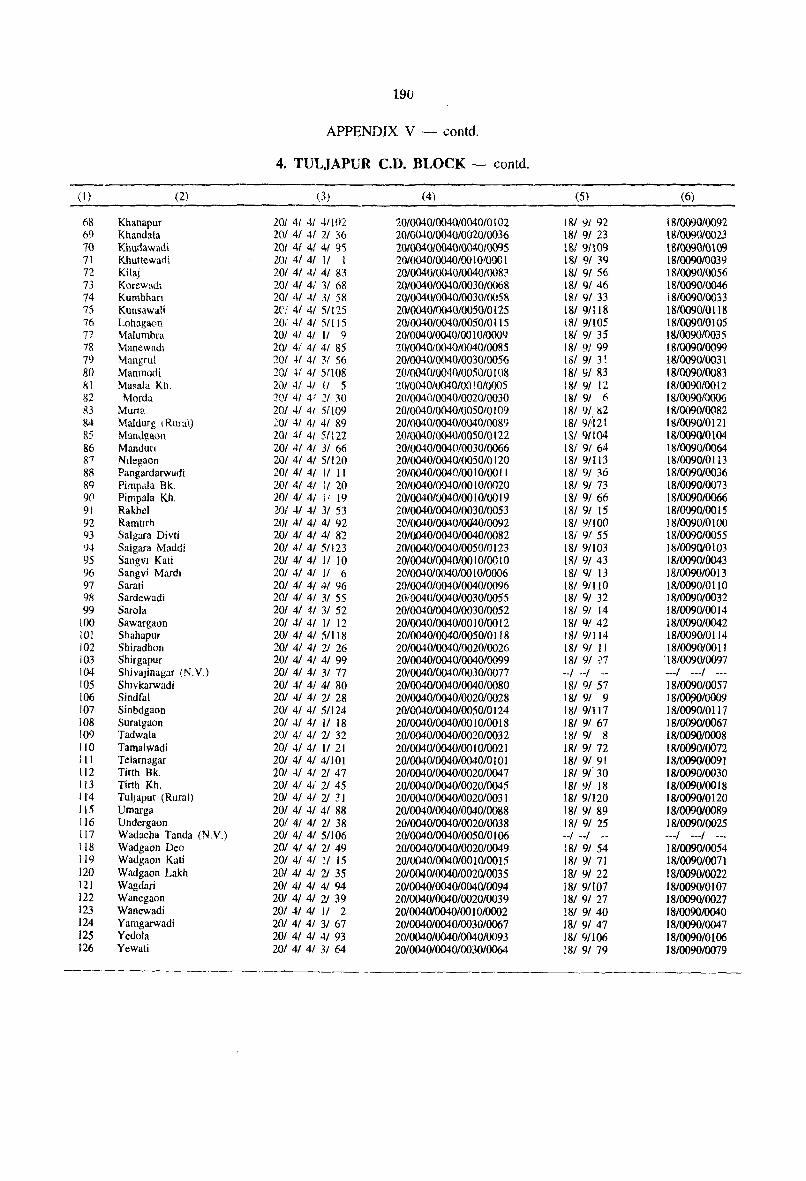
19U
APPENDIX V - contd,
4. TULJAPUR C.D. BLOCK - contd,
(I) (2) 0) (4) (5) (6)
68 Khanapur 201 41 4/ 4/102 20/004010040/0040/0102 181 91 92 18/0090/0092 69 Khandala 201 41 41 21 36 20/0040/0040/0020/0036 181 91 23 18/009010023 10 Khudawadi 20{ 4f 41 41 95 20/0040/004010040/0095 1St 91109 \ Sf0090fO \ 09 71 Khuttewadi 20/ 41 41 II I 20/0040/0040/00 1 0/000 1 lSI 91 39 18/0090/0039 72 Kilaj 201 41 41 41 83 20/0040/0040/0040/oo8? 181 91 56 18/0090/0056 73 KOreWl\dl 201 41 4/ 31 68 20/0040/0040/oo30/()(168 181 91 46 18/0090/0046 74 Kumbhan 201 41 41 31 58 20/0040/0040/0030/0058 181 91 33 18/0090/0033 75 Kunsiiwali 2ei 41 41 5/125 20/0040/0040/0050/0125 18! 9/118 18/0090/0118 76 Lohagaon 201 41 41 51115 20/0040/0040/005010 t 15 lSI 91105 18/0090/0105 77 Malumhra 20r 41 41 !I 9 20/0040/0040/00 10/0009 181 91 35 1 Sf 0090/003 5 78 Manewadl 201 41 41 4f 85 20/004010040/Q040/oo85 181 9/ 99 IS/009010099 79 Mangrul 'lor .tl 41 3/ 56 20/0040/0040f0030/0056 18191 3! 18f0Q90f0031 80 Manmodi '201 ~{ 41 51! 08 20/0040/0040/0050/0108 181 91 83 18/0090/0083 iii Masala Kh. 201 4/ 41 1/ 5 20/0040/0040/00 I 0101){)5 181 91 12 18/009010012 82 ~/[()rda '?(Y 41 4.' 21 :10 20/0040/0040f0020/0030 lSI 91 6 IS/OO90/OOO6 83 Murta 201 4/ 41 Sf 109 20/0040/0040/0050/0 109 181 91, liZ 18/0090/0082 84 Maldllrg \ Rural) 201 41 41 41 89 20/0040/004010040/0089 lSI 9/Ut 18/0090/0121 85 Man<igaol\ 20t :'1 4{ 5/lH 20/0040/0040(005010 122 1St 9(104 18/009010 t 04 86 Manuuft 201 4/ 41 31 66 20/004010040{0030/0066 18t 9/ 64 IS/0090/0064 87 Nilegaon 201 41 41 51120 20/0040/0040/0050/0120 lSI 9/113 lS/009010113 88 Pangardarwadi 201 41 4/ 11 II 20/0040/0040/00 1 0100 II IS! 9! 36 IS/009010036 89 PimpJ!a Bk. 201 41 41 II 20 20/0040/0040/00 I 010020 18f 9! 73 18/009010073 90 Pimpala Kh. 201 41 4/ ], 19 20/0040/0040/00 1 0100 19 181 9/ 66 18/0090/0066 91 Rakhel 20l 41 41 31 53 20/0040/0040/0030/0053 181 91 15 18/0090/0015 92 Ramttrh 201 41 41 41 92 20/0040f0040/0()40!0092 lSI 91100 18/0090/0100 93 Salgara Divti 201 41 41 41 8'2 20/0040/0040/0040/0082 181 91 55 IS/OO90/0055 94 Salgara Maddi 201 41 41 51123 20/0040/0040/0050/0123 lSI 9/103 18/009010103 95 Sangvl Kati 201 41 4/ J 1 I 0 20/0040/0040/00 1 0100 I 0 181 91 43 18/0090/0043 96 Sangvi Mardi 201 41 41 1/ 6 20/0040/0040/00 lO/OOO6 l81 91 13 18/0090/00 13 97 Sarati 201 41 41 41 96 20/004010040/004010096 lSI 9/I!O 18/0090/0110 98 Sardewadi 201 41 41 31 55 20i0040/0040/0030/0055 [81 91 32 18/0090/0032 99 Sarola 201 41 41 31 52 20/0040/0040/0030/0052 181 91 14 18/0090100 14
100 Sawargaon 201 41 41 II 12 20/0040/0040100 I 0100 12 181 9! 42 18/0090/0042 101 Shahapur 201 41 41 51118 20/0040/0040/0050/0118 181 91114 18/0090/0114 102 ShiradhoJl 20/ 4/ 41 21 26 20/0040/0040/0020/0026 18/9111 18/0090/00 1 J 103 Shirgapur 20/ 41 41 4/ 99 20/0040/00401004010099 18/ 91 07 '18/009010097 104 Shivajinagar (N.V.) 20/ 41 41 31 77 20/0040/0040/0030/0077 --I --I -- ---I ---I ---lOS ShlVkarwadi 201 41 41 41 SO 20/0040/004010040/0080 181 91 57 18/0090/0057 106 Sindfal 201 41 41 21 28 20/0040/0040/0020/0028 181 91 9 18/009010009 107 Sinbdgaon 20/ 41 41 5/124 20/0040/0040/0050/0124 18/9/117 18/0090/0117 108 Suratgaon 201 41 4/ II IS 20/0040/0040/00 1 0100 18 18/ 91 67 IS/OO90/0067 109 Tadwa[a 20/ 41 41 21 32 20/0040/0040/002010032 181 91 8 18/0090/0008 110 Tamalwadi 20/ 4/ 41 II 21 20/0040/0040/00 I 010021 181 9/ 72 18/0090/0072 111 Telarnagar 201 41 41 41101 20/0040/0040/0040/0101 181 91 91 18/0090/0091 112 Tirth Bk. 201 41 41 21 47 20/0040/0040/0020/0047 18/9/30 18/0090/0030 113 Tirth Kh. 20/ 4/ 41 21 45 20/0040/0040/0020/0045 181 9/ 18 18/0090/0018 114 Tuljapur (Rural) 20/4/41 21 :1 20/0040/0040/0020/0031 181 91120 18/009010120 115 Umarga 201 41 41 41 88 20/0040/004010040/0088 lSI 9/ 89 18/009010089 116 Undergaon 201 41 41 21 38 20/0040/0040/0020/0038 IS/ 9/ 25 18/0090/0025 117 Wadacha Tanda (N.V.) 20/ 41 41 511 06 20/0040/0040/0050/0 I 06 --I --I -- ---I ---I ---118 Wadgaon Deo 20/ 41 4/ 21 49 20/0040/0040/0020/0049 18/ 91 54 18/009010054 119 Wadgaon Kati 201 41 41 II IS 20/0040/0040/00 10100 15 18/ 91 71 18/0090/007} 120 Wadgaon Lakh 201 41 4/ 21 35 20/0040/0040/002010035 181 9/ 22 18/0090/0022 121 Wagdari 201 41 4/ 41 94 20/0040/0040/004010094 18/ 91107 18/0090/0107 122 Wanegaon 201 41 41 21 39 20/0040/0040/0020/0039 181 91 27 18/0090/0027 123 Wanewadi 201 41 41 11 2 20/004010040/00 1 010002 18/ 9/ 40 1 &10090/0040 124 Yamgarwadi 20/ 41 41 31 67 20/0040/0040/0030/0067 18/9/47 18/0090/0047 125 Yedola 201 41 41 41 93 20/0040/0040/004010093 181 91106 18/0090/0106 126 Yewati 20/ 41 41 31 64 20/0040/0040/0030/0064 181 91 79 18/0090/0079
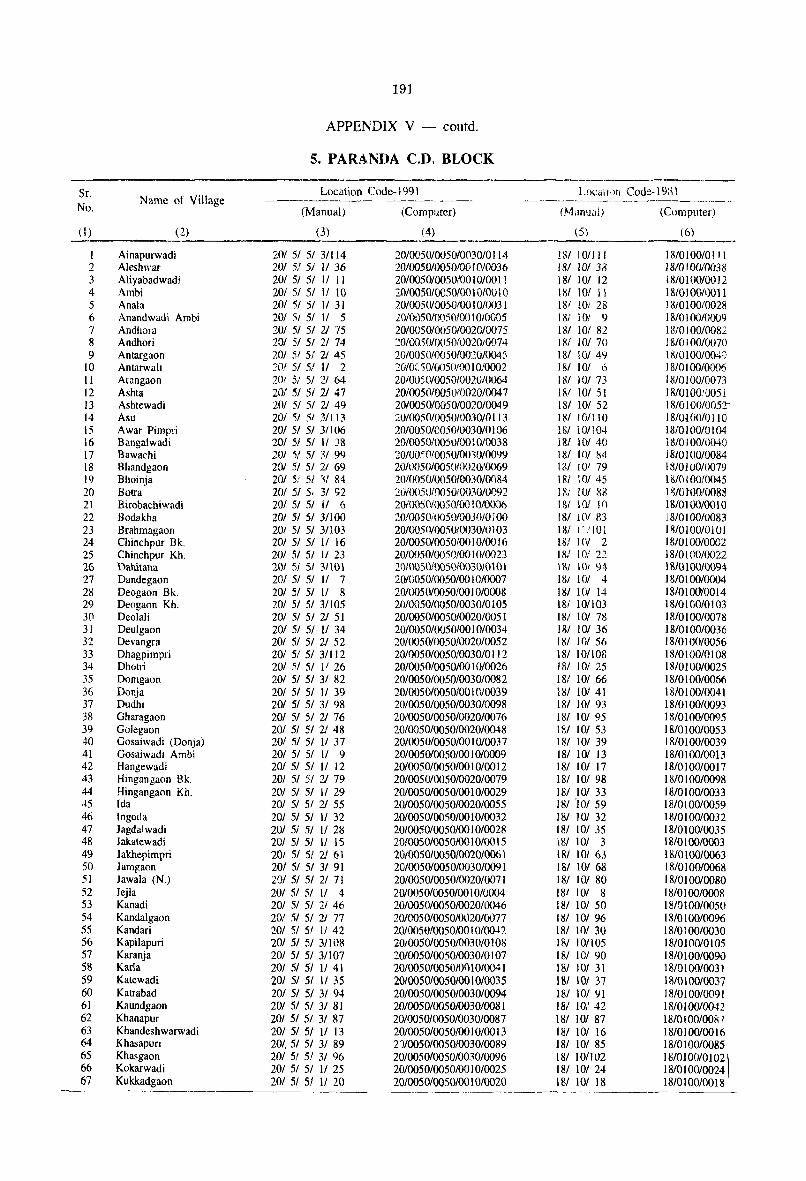
191
APPENDIX V - contd.
5. PARANDA C.D. BLOCK
Sr. Name of Village
Location Code- i 991 Locall'lll Code-19:31 ------ ------ -~--- ---- -------------------~--------
No. (Manual) (Computer) (Manual) (Cumputer)
(1) (1) (3) (4) t5) (6)
Ainapurwadi 201 51 51 31114 20/0050/005010(l30/0 114 181 101111 18/0100/0111 2 Aleshwar 20/ 5/ 5/ 1/ 36 20/0050/0050/00! 010036 181 101 33 ) 810' 00/0038 3 Aliyabadwadi 201 51 51 11 11 20/0050/0050100 J 0/00 1 I 18! 10/ 12 18/0100/0012 4 Ambi 20i 51 51 II 10 201005010050(00 1 0/00 1 0 181 101 1\ 18/0100/0011 5 Anala 201 51 51 II 31 20/005010050/00 I 010031 181 IOf 28 18/0100/0028 6 Anandwad\ Ambi 201 51 51 II 5 10/0tlSO/0050100 I Ol0G05 18/ 101 9 18/01 00/0009 7 Andllora 201 51 5/ 21 75 20/0050/0050/0020/0075 181 10/ 82 18/0100/0082 8 Andhori 20/ 5/ 51 2/ 74 20/0050/0050/1)020/0074 18/ 10/ 70 J 8/0100/0070 9 Antargaon 7.01 51 Sf 2J 45 20/0050/0050/0020/004 5 18! 10/49 1810100/004:,1
10 Antarwah '201 5/ 51 If 2 '20/0;' 50l0050rOO 1 010002 ) 81 101 6 1810 1 00/0006 11 Arangaon 20t 51 5/ 21 64 20/0050/0050/0020/0064 1M 10/73 IS/o 10010073 12 Ashta 201 51 5/ 2J 47 20/005010050/0020/004 7 18! 101 51 18/0100:0051 13 Asbtewadi 201 51 5/ 21 49 2010050/0050/0020/004 9 18/ 10/ 52 18/0100/0052"' 14 Asu 201 ~I 51 31113 20/0050/005010030/0113 181 10/110 18/0WO/OIIO 15 Awar Pimpri 201 51 51 311 06 20/0050/CD50/0030/0 106 18/ iO/l04 I8l0J 00/0 I 04 16 Bangalwadi 201 5f 51 It J8 20/oo50iOO5u/OO J 010038 1&1 \OJ 40 1 ~/O 1 00/0040 17 Bawachi 20/ 51 51 31 99 20/00,<;Oi0050!OO10/oo99 18/ WI 84 18/0100/0084 18 Bhandgaon 201 51 51 21 69 20/0050/005(1/0020/0069 181 101 79 18/0100/0079 19 Bhoinja 201 5/ 51 1/ 84 201(J050/oo5010030/0084 181 101 45 11:\10100/0045 20 Borra 201 51 5· 31 92 :W;Q05UlO050ffJ{)30/o092 1)(/ 10/ 8E I i!lO tOO/0088 21 Birobachiwadi 201 5/ 5/ it {, 20I{J050f{)050/00 1 0/c!{,,,16 181 10i In 18/01 00100 10 22 Bodakha 201 51 51 31100 20100 SQ,'(,)()50/0030!O: 00 181 j(ll 83 18/0100/0083 23 Brahmagaon 201 5/ 5/ 31103 20/005010050!0030/0 103 18/ J' ,'101 18/0IOOIOlUi 24 Chinchpur Bk. 201 51 51 11 16 20/005010050/0010100 16 18/ 101 2 18/0100/0002 25 Chinchpur Kh. 20t 51 51 II 23 20/0050/0050100 I 010023 18/ 10/ 22 18/0100/0022 16 Dahitana 201 Sf 51 31101 2()/ooSOi00501003010 10 \ 1 'ill 10/ 94 IS/() 1 00/0094 27 Dandegaon 201 5/ 5/ II 7 20/0050/0050/00 I 0/0007 181 101 4 18/0100/0004 2l! Deogaon Bk. 201 5/ 5/ 1/ 8 20/1l050/oo50/00 1010008 18/ 101 14 18/01(X)t00l4 29 Deogaon Kh. 20! 51 51 3/105 20/0050/0050f0030/0 I 05 18i 101103 18/0 I OO/OJ 03 30 Deolali 20/ 51 51 2J 51 20/0050/oo50f0020/0051 181 101 78 18/0 I 0010078 31 Deulgaon 20/ 51 51 II 34 20/0050/0050fOO I 0/0034 18/ 10/ 36 18/0100/0036 32 Devangra 201 51 51 21 52 20/oo5010050fOO20/0052 18/ 101 56 18/0 J c)O/0056 33 Dhagpimpri 201 51 5/ 3/112 20/0050/0050/0030/0112 lSI 101108 18/0100/0108 34 Dhotl'i 201 51 5/ I' 26 20/00S0/0050/00 10/0026 18/ 101 25 18/0 100/0025 35 Domgaon 201 5/ 51 31 82 20/00501005010030/0082 18! 101 66 lS/O 1 0010066 36 Donja 20/ 5/ 51 11 39 20/0050/0050/00 I 0/0039 181 101 41 18/0100/0041 37 Dudhl 201 51 51 3/ 98 20/0050/0050/0030/0098 181 101 93 18/0100/0093 38 Gharagaon 20/ 5/ 5/ 2J 76 20/0050/005010020/0076 18/ 10/ 95 IS/0 I 00/0095 39 GoJegaon 201 51 51 21 48 20/0050/0050/0020/0048 181 101 53 18/0100/0053 40 Gosaiwadi (Donja) 201 51 5/ 1/ 37 20/0050/0050/00 I 01003 7 181 10/ 39 18/0100/0039 41 Gosaiwadl Ambi 201 51 5/ II 9 20/005010050/00 I 010009 181 101 13 18/0100/0013 42 Hangewadi 20/ 5/ 51 II 12 20/0050/0050/00 I 0/00 12 IS/ 10/ 17 18/0100100 17 43 Hingangaon Bk. 20/ 51 5/ 21 79 20/0050/0050/002010079 IS/ 10/ 98 18/0 I 00/0098 44 Hingangaon Kh. 20/ 5/ 5/ II 29 20/0050/0050/00 1 010029 18/ 101 33 18/0 I 00/0033 45 Ida 20/ 51 51 21 55 20/0050/0050/0020/0055 181 '10/ 59 IS/O 100/0059 46 lngolla 201 51 51 11 32 20/0050/0050/00 1 010032 18/ 101 32 18/OJ 00/0032 47 lagdalwadi 201 51 5/ 1/ 28 20/0050/0050/00 I 0/0028 18/ 10/ 35 18/0100/0035 48 lakatewadi 201 51 51 II 15 20!0050/oo50/00 1 0/00 15 18/ 101 3 18/0100/0003 49 Jakhepimpri 201 51 51 21 61 20/0050/0050/0020/0061 181 101 63 18/0100/0063 50 lamgaon 201 5/ 5/ 31 91 20/0050/0050/003010091 18/ 10/ 68 18/0100/0068 51 Jawala (N.) 20/ 51 5/ 21 71 20/0050/005010020/0071 181 10/ 80 18/0100/00g0 52 Jejla 201 5/ 5/ II 4 201005010050/00 i 010004 181 10/ 8 18/0100/0008 53 Kanadi 201 51 51 21 46 20/oo50/0050/oo20/()()46 181 10/ 50 18/0 I 00/0050 54 Kandalgaon 20/ 5/ 5/ 21 77 20/0050/0050/0i.)20/0077 181 10/ 96 18/0 I 00/0096 55 Kandari 201 51 51 1I 42 20/0050/0050/00 I O{QO.l2 181 101 30 18/0100/0030 56 KapiJapuri 201 51 51 311 08 20,0050/0050/0030/0 I 08 18/ 101105 18/0100/0105 57 Karanja 201 5/ 5/ 3/1 07 20/0050/0050/0030/0 I 07 181 101 90 18/0 I 00/0090 58 Karla 201 5/ 5/ 1/ 41 20/0050f0050/00 1 010041 181 )01 31 18/0 I 00/0031 59 Katewadi 201 5/ 51 11 35 20/0050/0050/00 1 010035 181 101 37 18/0100/0037 60 Katrabad 201 5/ 5/ 31 94 20/0050/0050/0030/0094 18/ 101 91 18/0 100/0091 61 Kaundgaon 20/ 5/ 5/ 31 81 20/0050/0050/0030/0081 18/ 10/ 42 18/0 I 0010042 62 Khanapur 20/ 51 51 3/ 87 20/0050/0050/0030/0087 18/ 10/ 87 18/0100/0087 63 Khandeshwarwadi 20/ 51 5/ 1/ 13 20/0050/0050/00 1 0100 13 18/ 101 16 18/0100100 16 64 Khasapun 20/, SI 5/ 31 89 2')/0050/0050/0030/0089 18/ 10/ 85 18/0100/0085 65 Khasgaon 20/ 51 51 3/ 96 20/0050/005010030/0096 181 101102 18/0J 00/0102 \ 66 Kokarwadi 201 51 5/ 1/ 25 20/0050/0050/00 J 0/0025 18/ 10/ 24 18/0 100/0024 67 Kulckadgaon 20/ 51 51 11 20 20/0050/0050/0010/0020 18/ 101 18 18/0100100 18
------
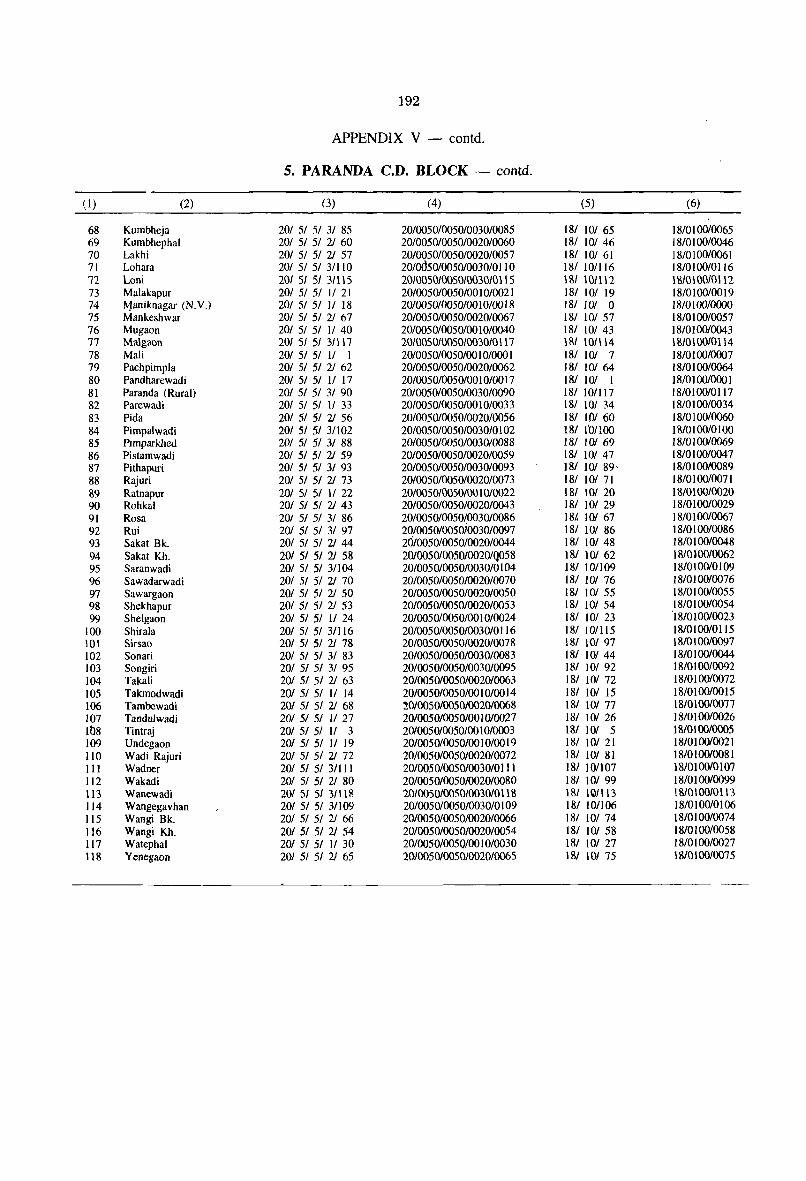
192
APPENDIX V - contd.
5. PARANDA C.D. BLOCK - contd.
(I) (2) (3) (4) (5) (6)
68 Kumbheja 20/ 5/ 5/ 3/ 85 20/0050/0050/0030/0085 18/ 10/ 65 18/0 I 00/0065 69 Kumbhephal 20/ 5/ 5/ 21 60 20/0050/0050/0020/0060 18/ 10/ 46 18/0 I 00/0046 70 Lakhi 20/ 5/ 5/ 21 57 20/0050/0050/0020/0057 18/ 10/61 18/0 I 00/0061 71 Lohara 20/ 5/ 5/ 3/110 20/0050/0050/00JO/0110 18/ 101116 18/0100/0116 72 Loni 201 5/ 51 3111 5 20/0050/0050/003010115 181 10/112 18/01 0010112 73 Malakapur 20/ 5/ 5/ 1/ 21 20/0050/0050100 I 0/0021 18/ 10/ 19 I S/OI 00/00 19 74 l\1aniknagar (N.V.) 20/ 5/ 5/ II 18 20/0050/0050/0010/0018 18/ 101 0 18/0 100/0000 75 Mankeshwar 20/ 5/ 5/ 21 67 20/0050/0050/0020/0067 IS/ 101 57 18/0100/0057 76 Mugaon 20/ 51 5/ 1/ 40 20/0050/0050/00 I 0/0040 18/ 10/ 43 I S/O I 00/0043 77 Ma\gaon 201 51 51 31117 20/0050/0050/0030/0 \ 17 181 101\14 18/01 0010114 78 Mali 20/ 5/ 5/ 1/ I 20/0050/0050/00 I 01000 I 18/ 10/ 7 18/0 I 0010007 79 Pachpimpla 20/ 51 51 21 62 20/0050/005010020/0062 18/ 10/ 64 18/0100/0064 80 Pandharewadi 20/ 5/ 5/ 1/ 17 20/0050/0050100 I 0/00 17 18/ 10/ I 18/0 100/000 I 81 Paranda (Rural) 201 51 5/ 3/ 90 20/00501005010030/0090 18/ 101117 18/0100/0117 82 Parewadi 201 51 51 11 33 2010050/0050/0010/0033 lSI 101 34 IS/01 0010034 83 Pida 201 51 51 21 56 20/005010050/0020/0056 181 10/ 60 18/0 I 00/0060 S4 Pimpa1wadi 201 51 51 311 02 20/0050/0050/003010 I 02 181 1'0/100 1810100/0100 85 Plmparkhed 20/ 5/ 5/ 3/ 88 20/0050/0050/003010088 18/ 10/ 69 18/0100/0069 86 Pistamwadi 20/ 51 51 21 59 20/005010050/0020/0059 18/ 10/ 47 18/0 I 00/0047 87 Pithapuri 201 51 5/ 31 93 20/0050/00501003010093 18/ 10/ 89· 18/0 I 0010089 88 Rajuri 20/ 5/ 5/ 21 73 2010050/0050/0020/0073 181 101 71 18/0 I 0010071 89 Ratnapur 201 51 51 II 22 20/005010050/00 I 010022 181 101 20 18/0100/0020 90 Rohka1 201 51 51 21 43 20/005010050/0020/0043 IS/ 101 29 18/0 I 0010029
91 Rosa 201 51 5/ 31 86 20/0050/0050/0030/0086 18!. 10/ 67 18/0 I 0010067 92 Rui 20/ 51 5/ 31 97 201005010050;0030/0097 181 10/ 86 18/0 I 00/0086 93 Sakat Sk. 201 5/ 51 21 44 20/005010050/0020/0044 181 101 48 IS/O 1 0010048 94 Sakat Kh. 201 51 51 21 58 201oo5010050/0020/Q058 181 101 62 18/010010062 95 Saranwadi 20/ 51 5/ 31104 20/0050/00501003010 I 04 18/ 101109 18/0100/0109 96 Sawadarwadi 20/ 51 5/ 21 70 20/005010050/0020/0070 18/ 10/ 76 18/0100/0076
97 Sawargaon 20/ 5/ 5/ 21 50 20100501005010020/0050 181 101 55 18/0 I 0010055 98 Shekhapur 201 5/ 51 21 53 20/005010050/002010053 181 101 54 18/0100/0054 99 She1gaon 20/ 51 51 1/ 24 20/0050100501001010024 181 101 23 18/0 I 00/0023
100 Shirala 20/ 51 51 31116 2010050/00501003010116 18/ 101115 18/0100/0115 101 Sirsao 201 51 51 21 78 20/0050/0050/002010078 181 101 97 18/0100/0097 102 Sonari 201 5/ 51 31 83 20/0050/0050/0030/0083 18/ 101 44 18/0 100/0044 103 Songiri 201 5/ 51 31 95 20/0050/005010030/0095 181 101 92 18/0100/0092 104 Takali 20/ 51 51 21 63 20/0050/0050/0020/0063 18/ 101 72 18/01 0010072 105 Takmodwadi 201 51 51 1/ 14 20/0050/0050/00 1 0100 14 181 101 15 18/0100/0015 106 Tambewadi 201 51 51 21 6S ,,0/0050/0050/002010068 181 101 77 18/0 I 0010077 107 Tandulwadi 20/ 5/ 5/ 1/ 27 20/0050/0050/0010/0027 18/ 101 26 181010010026 ItJ8 Tintraj 201 51 51 11 3 20/0050/0050/00 I 010003 lSI 101 5 IS/O 100/0005 109 Undegaon 20/ 51 51 11 19 20/0050/0050/00 I 0100 19 IS/ 101 21 18/0 I 0010021 110 Wadi Rajuri 20/ 51 51 21 72 20/005010050/0020/0072 18/ 101 81 18/0 I 0010081 III Wadner 20/ 5/ 5/ 311 II 20/0050/0050/0030/0111 18/ 10/107 18/0100/0107 112 Wakadi 20/ 5/ 51 2/ 80 20/0050/0050/0020/0080 IS/ 101 99 18/0100/0099 113 Wanewadi 201 5/ 51 3111S 20/0050/0050/0030/0118 18/1Q/I13 18/0\ 0010 113 114 Wangegavhan 20/ 5/ 5/ 3/1 09 20/0050/0050/0030/0 I 09 18/ 101106 18/0100/0106 115 Wangi Sk. 20/ 5/ 5/ 21 66 20/0050/0050/0020/0066 18/ 101 74 18/0100/0074
116 Wangi Kh. 20/ 5/ 5/ 21 54 20/0050/0050/0020/0054 IS/ 10/ 58 18/0 I 00/0058 117 Watephal 20/ 5/ 5/ 1/ 30 20/0050/0050/00 I 0/0030 18/ 10/ 27 18/0100/0027 118 Yenegaon 201 51 51 21 65 20/005010050/002010065 lSI 101 75 18/010010075
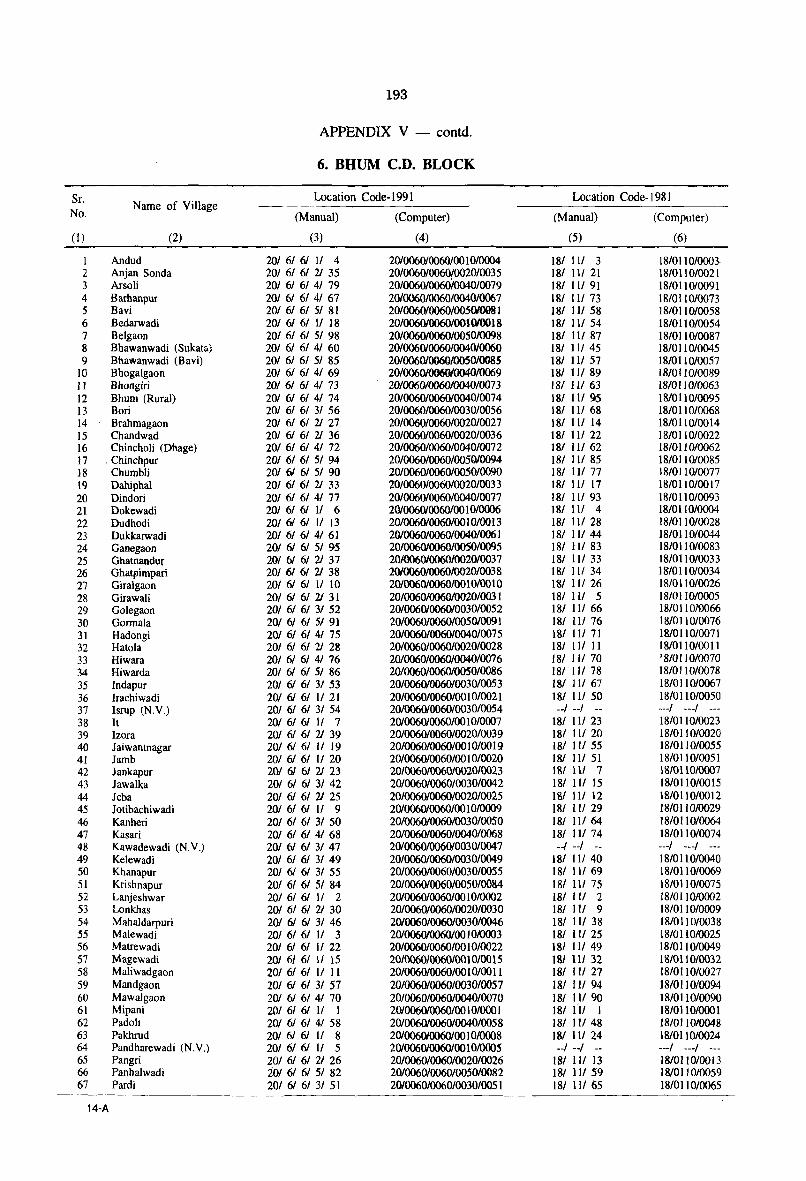
193
APPENDIX V - contd.
6. BHUM C.D. BLOCK
Sr. Name of Village
Location Code-1991 Location Code-1981
No. (Manual) (Computer) (Manual) (Computer)
(1) (2) (3) (4) (5) (6)
I Andud 201 61 6/ II 4 201006010060/00 I 0/0004 181 III 3 18/0110/0003-2 Anjan Sonda 201 61 61 21 35 20/006010060(0020/0035 181 III 21 18/0110/0021 3 Arsoli 201 61 61 41 79 201006010060/0040/0079 181 III 91 18/0110/0091 4 Barhanpur 201 61 61 41 67 2010060/0060/0040/0067 18111/73 18/0110/0073 5 Bavi 201 61 61 51 81 20/0060/0060/005MJ081 181 11/ 58 J 8/0110/0058 6 Bedarwadi 201 6/ 61 II 18 201006010060/001010018 181 III 54 18/0110/0054 7 Belgaon 201 61 61 51 98 20/006010060/005010098 181 III 87 18/0110/0087 8 Bhawanwadi (Sukat&) 201 61 61 41 60 20/006010060/004010060 181 III 45 18/0110/0045 9 Bhawanwadi (Bavi) 201 61 61 51 85 20/0060100601005010085 181 III 57 18/0110/0057
10 Bhogalgaon 201 61 61 41 69 20/006010060/004()/0069 181 1I/ 89 18/0110/0089 II Bhongiri 20/ 6/ 6/ 4/ 73 20/00601006010040/0073 181 III 63 181011010063 12 Bhum (Rural) 201 6/ 61 41 74 20/006010060/0040/0074 18/ III 95 18/0 II 010095 13 Bori 201 61 61 31 56 20/0060/0060/0030/0056 181 11/68 18/0110/0068 14 Brahmagaon 201 61 61 21 27 20/006010060/002010027 181 III 14 18/0110/0014 15 Chandwad 201 6/ 61 21 36 20/006010060/0020/0036 181 1JI 22 18/0 II 010022 16 Chincholi (Dhage) 201 61 61 41 72 20/0060/00601004010072 181 III 62 18/01I 010062 17 . Chinchpur 201 61 61 51 94 20/0060/0060/005010094 181 III 85 18/0110/0085 18 Chumbli 20J 61 61 5J 90 20JOO6010060J0050J0090 181 11I 77 18/0110/0077 19 Dahiphal 201 61 61 21 33 2010060/0060/0020/0033 181 III 17 18/0110/0017 20 Dindori 201 61 61 41 77 20/006010060/004010077 181 111 93 18/0110/0093 21 Dokewadi 201 61 6/ II 6 201006010060/00 1 0/0006 181 III 4 1810110/0004 22 Dudhodi 201 61 61 II 13 20/006010060/0010100 13 181 III 28 18/0 110/0028 23 Dukkarwadi 201 61 61 41 61 201006010060/0040/0061 181 11/ 44 18/0110/0044 24 Ganegaon 201 6/ 6/ 51 95 201006010060/0050/0095 181 III 83 18/0110/0083 25 Ghatnandur 2Q/ 6/ 61 21 37 20l0060I0060I002010037 181 III 33 18/0110/0033 26 Ghatpimpari 201 6/ 61 21 38 20100601006010020/0038 181 111 34 181011 0/0034 27 Giralgaon 201 6/ 61 II 10 20/0060/0060/0010/0010 181 111 26 18/0 i 10/0026 28 Girawali 201 6/ 61 21 31 20/0060/006010020/0031 181 III 5 18/011010005 29 Golegaon 201 61 61 31 52 20/006010060/0030/0052 181 11/66 18/011010066 30 Gormala 201 61 61 51 91 20/0060/0060/005010091 181 III 76 18/0110/0076 31 Hadongi 201 61 61 41 75 20/0060/00601004010075 181 11/71 18/0110/0071 32 Hatola 201 61 61 21 28 20/0060/006010020/0028 181 III 11 18/0110/0011 33 Hiwara 201 61 61 41 76 20/0060/0060/0040/0076 181 111 70 J 810 II 0/0070 34 Hiwarda 201 61 61 51 86 20/0060/006010050/0086 18/11178 18/011010078 35 lndapur 201 61 61 31 53 20/006010060/0030/0053 181 III 67 18/0110/0067 36 lrachiwadi 201 6/ 61 II 21 20/006010060/00 1 010021 181 111 50 18/0 II 010050 37 Isrup (N.V.) 201 61 61 31 54 20/0060/0060/0030/0054 --I --I -- ---I ---I ---38 It 201 61 6/ II 7 201006010060/00 1 0/0007 181 III 23 18/011010023 39 Izora 201 61 61 21 39 20/0060/0060/0020/0039 181 111 20 18/0110/0020 40 Jaiwantnagar 201 6/ 61 II 19 20/0060/0060/00 I 0100 19 181 1lI 55 18/0110/0055 41 Jamb 201 61 61 1/ 20 20/006010060/00 10/0020 181 1lI 51 18/0 II 010051 42 Jankapur 201 61 61 21 23 20/0060/0060/002010023 181 III 7 18/0110/0007 43 Jawa1ka 201 61 61 31 42 20/0060/0060/0030/0042 181 III 15 18/0110/0015 44 Jeba 201 61 61 21 25 20/006010060/002010025 181 III 12 18/0110/0012 45 lotibachiwadi 201 61 6/ 11 9 201006010060/00 1010009 181 111 29 18/0110/0029 46 Kanheri 201 61 61 31 50 20/006010060/0030/0050 181 111 64 18/0 II 010064 47 Kasari 201 61 61 41 68 20/0060/0060/004010068 181 111 74 18/011010074 48 Kawadewadi (N.V.) 201 6/ 61 31 47 20/0060/0060/0030/0047 --I --I -- ---I ---I ---49 Kelewadi 201 61 61 31 49 20/0060/006010030/0049 181 III 40 18/0110/0040 50 Khanapur 201 6/ 61 31 55 20/0060/0060/0030/0055 181 11/69 18/0110/0069 51 Krishnapur 201 6/ 61 51 84 20/0060/00601005010084 181 111 75 18/01 1010075 52 Lanjeshwar 201 61 6/ II 2 201006010060/00 1010002 181 III 2 1810110/0002 53 Lonkhas 201 61 61 21 30 20/0060/0060/0020/0030 181 ll! 9 18/0110/0009 54 Mahaldarpuri 201 6/ 61 31 46 2010060/0060/003010046 181 ll/ 38 18/0 l! 010038 55 Malewadi 201 61 61 11 3 201006010060/00 I 010003 181 III 25 18/011010025 56 Matrewadi 201 61 61 II 22 20/0060/0060/00 1 010022 181 ll/ 49 18/0110/0049 57 Magewadi 201 61 61 II 15 20/006010060/00 1 0100 15 181 111 32 18/011010032 58 Maliwadgaon 201 61 61 II II 20/0060/0060/00 I 0100 II 181 III 27 18/0110/0027 59 Mandgaon 201 6/ 61 31 57 20/006010060/0030/0057 18/ III 94 18/0 110/0094 60 Mawalgaon 201 6/ 61 41 70 20/006010060/0040/0070 181 11/90 18/011010090 61 Mipani 201 61 6/ 11 I 201006010060/00 I 0/000 I 181 I'll I 1810110/0001 62 Padoh 201 6/ 61 4/ 58 20/006010060/0040/0058 181 IJI 48 18/011010048 63 Pakhrud 201 61 6/ II 8 201006~0060/00 10/0008 181 111 24 18/011010024 64 Pandharewadi (N.V.) 201 61 6/ II 5 201006<VOO60/00 1 0/0005 --I --I -- ---I ---I ---65 Pangri 201 61 61 21 26 20/0060/0060/0020/0026 18/ III 13 18/011010013 66 Panhalwadi 201 61 61 51 82 201006010060/005010082 181 1lI 59 1810 11010059 67 Pardi 201 61 61 31 51 2010060/0060/0030/0051 181 111 65 18/011 010065
14-A
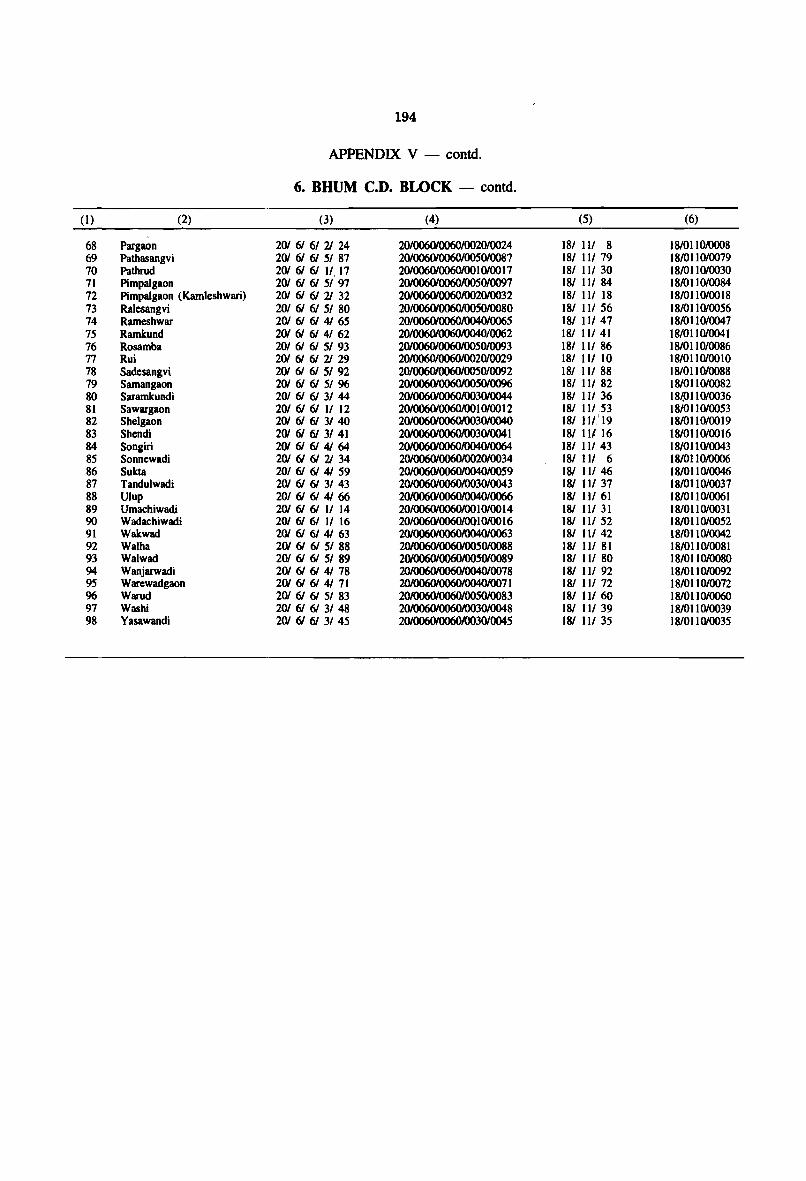
194
APPENDIX V - contd.
6. DHUM C.D. BLOCK - contd.
(1) (2) (3) (4) (5) (6)
6S Pargaon 201 61 61 21 24 20/0060/006010020/0024 lSI III S 181011010008 69 Patbasangvi 201 61 61 51 S7 2010060/0060/005010087 lSI 111 79 IS/0I10/0079 70 Patbrud 201 61 61 II 17 201006010060/00 I 010017 181 111 30 18/0 II 010030 71 Pimpalgaon 201 61 61 5/ 97 2010060/006010050/0097 181 1lI 84 18/0 II 010084 72 Pimpalgaon (Kamleshwari) 201 61 61 21 32 2010060100601002010032 181 111 18 IS/OII010018 73 Ralesangvi 201 61 61 51 80 20/006010060/005010080 lSI 111 56 18/011010056 74 Rameshwar 201 61 61 41 65 201006010060l0040I0065 lSI 111 47 18/0 II 010047 75 Ramkund 20/ 61 61 41 62 20I0060I00601004010062 lSI 11/ 41 181011010041 76 Rosamba 201 61 61 51 93 201006010060I005010093 lSI 1lI 86 IS/O II 0/00S6 77 Rui 201 61 61 21 29 20/0060/0060/0020/0029 181 III 10 IS/OII010010 78 Sadesangvi 201 61 61 51 92 2010060I0060I005010092 lSI III 88 IS/OII0100S8 79 Samangaon 201 6/ 61 51 96 2010060/0060/005010096 181 III 82 IS/0110l0082 80 Saramkundi 201 6/ 61 31 44 20/0060/00601003010044 lSI 111 36 181,0 II 010036 81 Sawargaon 201 6/ 61 II 12 20/0060/006010010/0012 181 III .53 ISIOII010053 82 Shelgaon 201 6/ 6/ 31 40 201006010060I003010040 181 111/19 181011010019 S3 Shendi 201 61 61 31 41 201006010060/003010041 181 111 16 IS/OII010016 84 Songiri 201 6/ 61 41 64 201006010060l0040I0064 181 1lI 43 18/011010043 S5 Sonnewadi 201 6/ 61 21 34 201006010060I0020I0034 lSI III 6 18/011010006 86 Sukta 201 6/ 61 41 59 2010060/0060l0040l0059 181 111 46 18/011010046 87 Tandulwadi 201 61 61 31 43 2010060/0060/0030/0043 181 III 37 18/011010037 88 Ulup 201 61 61 41 66 20l0060I00601004010066 181 111 61 18/011010061 89 Umachiwadi 201 6/ 61 II 14 20/006010060/0010/0014 181 111 31 18/011010031 90 Wadachiwadi 201 6/ 61 11 16 20/006010060JOQI010016 181 III 52 18/0 II 010052 91 Wakwad 201 6/ 61 41 63 20/096010060I0040/0063 181 1lI 42 18/011010042 92 Walha 201 6/ 61 51 88 20/0060/0060/0050/0088 lSI III 81 18/011 OI00SI 93 Walwad 201 61 61 51 89 201006010060/005010089 lSI III 80 18/0 II 010080 94 Wanjarwadi 201 61 61 41 78 2010060I0060I0040I0078 lSI 111 92 18/011010092 95 Warewadgaon 201 61 61 41 71 20I0060I0060l0040/0071 181 III 72 18/011010072 96 Warud 201 6/ 61 51 S3 20/0060/0060I005010083 lSI III 60 18/011010060 97 Washi 201 6/ 61 31 48 20I0060I0060I003010048 lSI 111 39 IS/OII010039 98 Yasawandi 201 6/ 61 31 45 20l0060I0060I003010045 181 III 35 18/011010035
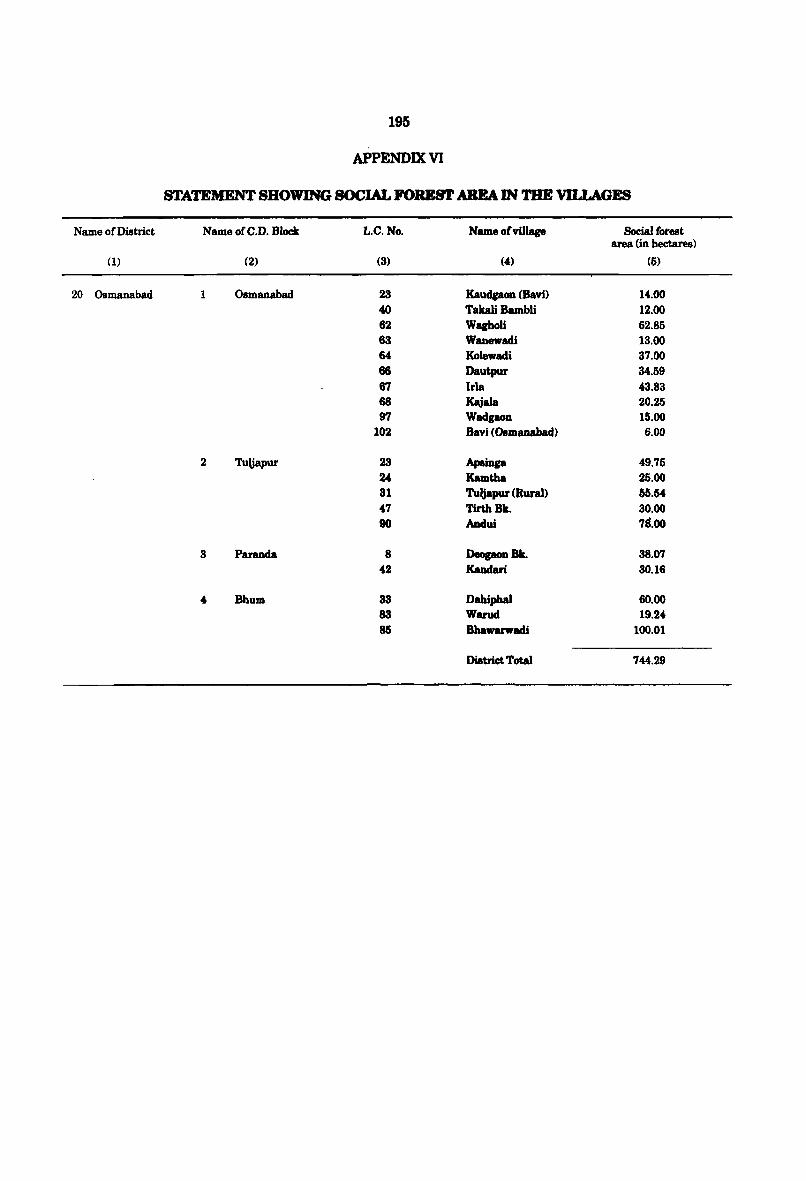
195
APPENDIX VI
STATEMENT SHOWING SOCIAL FOREST A.REAIN THE VILLAGES
Name ofDistriet Name ofC.D. Block L.C.No. Name olvillage Social lorest area (in hectares)
(1) (2) (3) (4) (6)
20 Osmanabad 1 Osmanabad 23 KaUdgaOll (Bavi) 14.00 40 Takali Bambli 12.00 62 Wagholi 62.85 63 Wanewadi 13.00 64 Kolewadi 37.00 66 Dautpur 34.59 67 Irla 43.83 68 KlQala 20.25 97 Wadgaon 15.00
102 Bavi (Osmanabad) 6.00
2 Tuljapur 23 Apainga 49.75 24 Kamtha 25.00 31 Tuljapur (Rural) 55.54 47 Tirth BlL 30.00 90 Aodui 78.00
3 Paranda 8 DeoponBlL 38.07 42 Kandari 30.16
4 Bhum 33 Dahiphal 60.00 83 Warud 19.24 85 Bhawarwadi 100.01
Dietrict Total 744.29
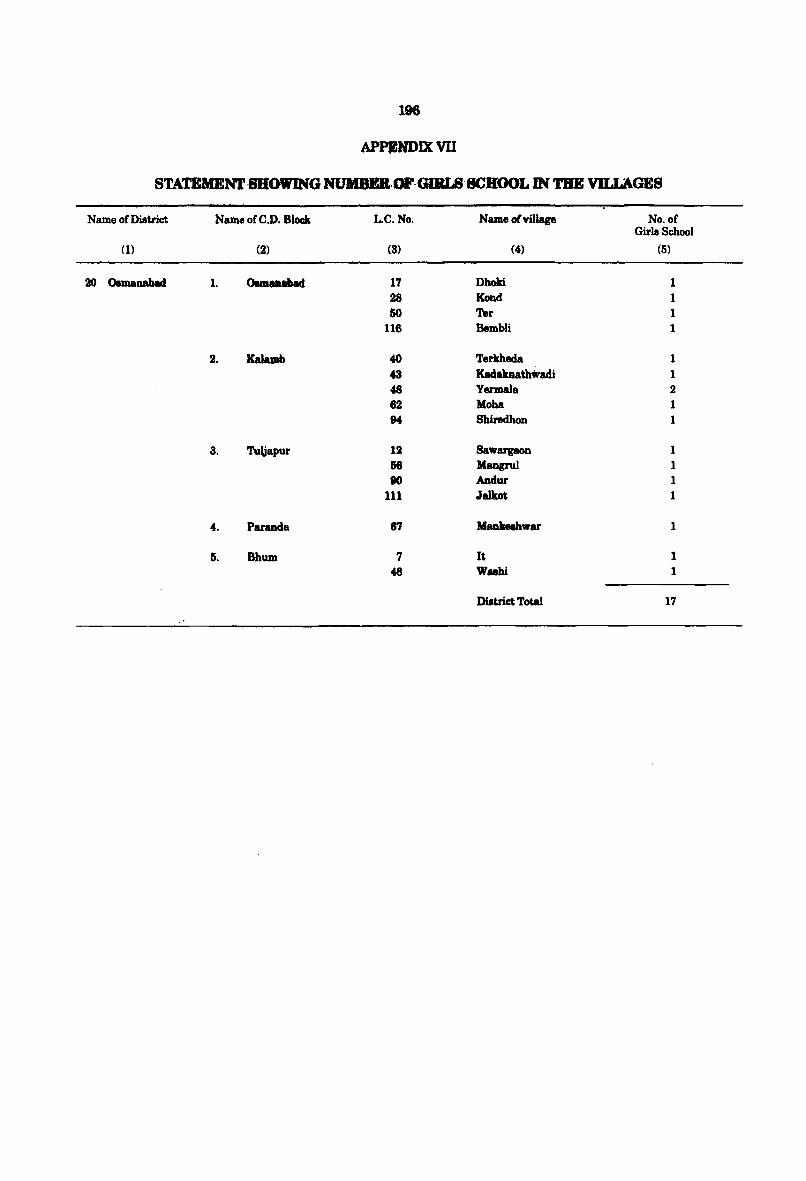
196
APPJN'DIX VII
Name or District Name orC.D. Block L.C.No. Name ohiUage No. or Girls School
(1) (2) (3) (4) (5)
20 Ouraanabad 1. 17 Dhoki 1 28 KoDd 1 60 Ter 1
116 Bembli 1
2. Kaluab 40 Terkheda 1 43 Klutabath"adi 1 48 Yermala 2 82 Moha 1 94 Shiredhon 1
3. Tu\japur 12 Sawargaon 1 &6 Maogrul 1 80 Andur 1
111 Jalkcn 1
4. Paranda 67 MaUeahwar 1
5. Bhum 7 It 1 48 Wahl 1
District Total 17
SECTION II
TOWN DIRECTORY

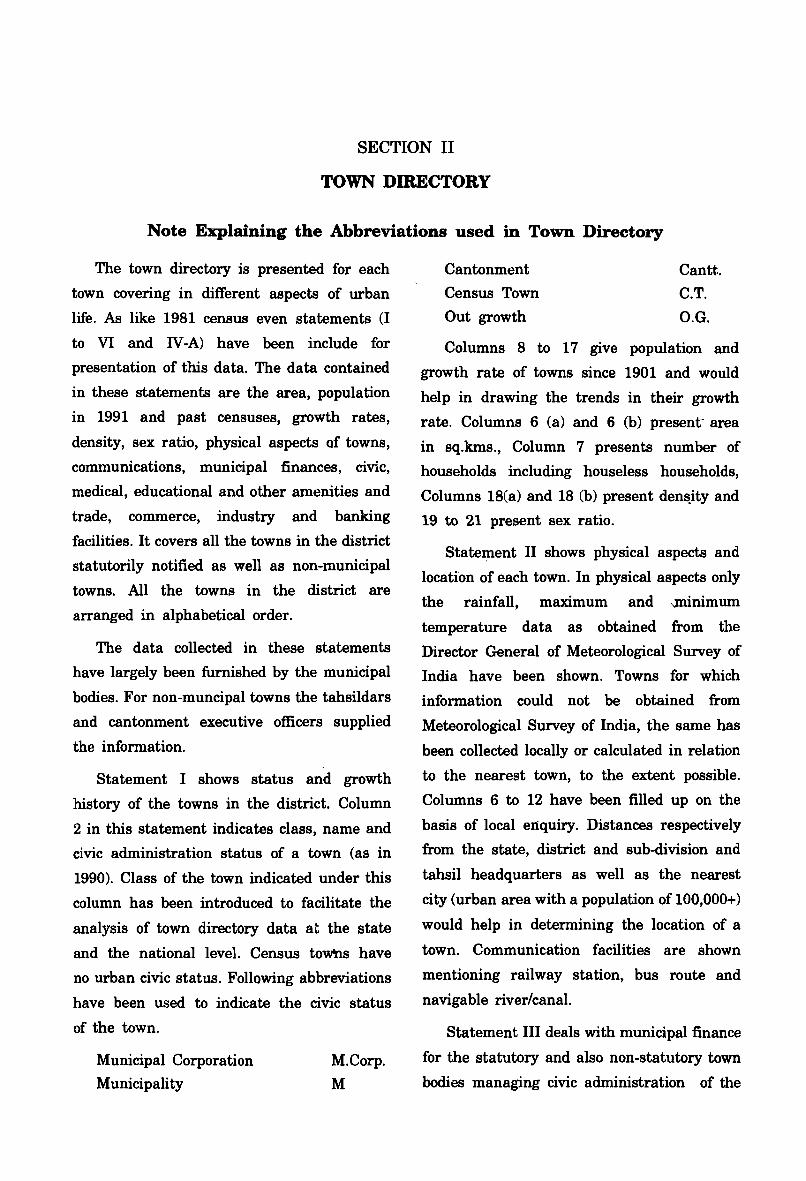
SECTION II
TOWN DIRECTORY
Note Explaining the Abbreviations used in Town Directory
The town directory is presented for each
town covering in different aspects of urban
life. As like 1981 census even statements (I
to VI and IV-A) have been include for
presentation of this data. The data contained
in these statements are the area, population
in 1991 and past censuses, growth rates,
density, sex ratio, physical aspects of towns,
communications, municipal finances, civic,
medical, educational and other amenities and
trade, commerce, industry and banking
facilities. It covers all the towns in the district
statutorily notified as well as non-municipal
towns. All the towns in the district are
arranged in alphabetical order.
The data collected in these statements
have largely been furnished by the municipal
bodies. For non-muncipal towns the tahsildars
and cantonment executive officers supplied
the information.
Statement I shows status and growth
history of the towns in the district. Column
2 in this statement indicates class, name and
civic administration status of a town (as in
1990). Class of the town indicated under this
column has been introduced to facilitate the
analysis of town directory data at the state
and the national level. Census toWns have
no urban civic status. Following abbreviations
have been used to indicate the civic status
of the town.
Municipal Corporation
Municipality
M.Corp.
M
Cantonment
Census Town
Out growth
Cantt.
C.T.
O.G.
Columns 8 to 17 give population and
growth rate of towns since 1901 and would
help in drawing the trends in their growth
rate. Columns 6 (a) and 6 (b) present- area
in sq.kms., Column 7 presents number of
households including houseless households,
Columns 18(a) and 18 (b) present den~ity and
19 to 21 present sex ratio.
Statement II shows physical aspects and
location of each town. In physical aspects only
the rainfall, maximum and -JIlinimum
temperature data as obtained from the
Director General of Meteorological Survey of
India have been shown. Towns for which
information could not be obtained from
Meteorological Survey of India, the same has
been collected locally or calculated in relation
to the nearest town, to the extent possible.
Columns 6 to 12 have been filled up on the
basis of local enquiry. Distances respectively
from the state, district and sub-division and
tahsil headquarters as well as the nearest
city (urban area with a population of 100,000+)
would help in determining the location of a
town. Communication facilities are shown
mentioning railway station, bus route and
navigable river/canal.
Statement III deals with municipal finance
for the statutory and also non-statutory town
bodies managing civic administration of the
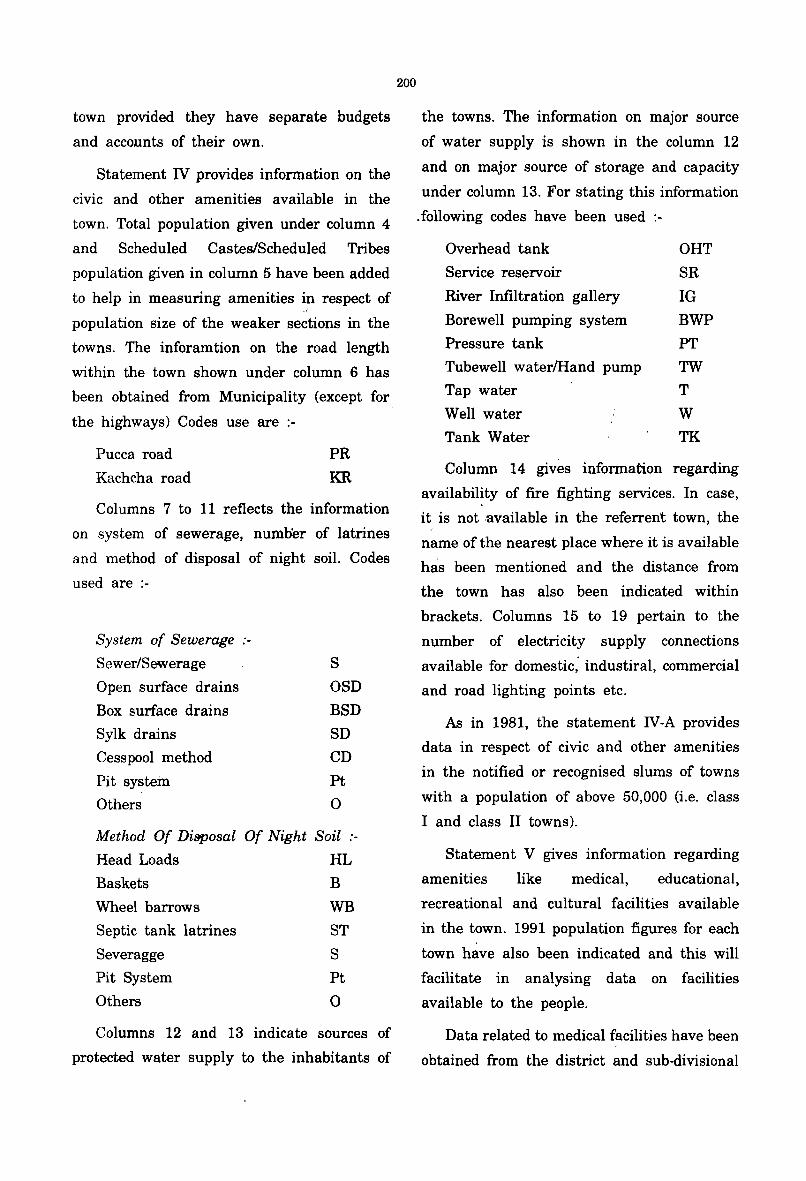
town provided they have separate budgets
and accounts of their own.
Statement IV provides information on the
civic and other amenities available in the
town. Total population given under column 4
and Scheduled Castes/Scheduled Tribes
population given in column 5 have been added
to help in measuring amenities in respect of ~ ,
population size of the weaker sections in the
towns. The inforamtion on the road length
within the town shown under column 6 has
been obtained from Municipality (except for
the highways) Codes use are :-
Pucca road
Kachcha road
PR
KR
Columns 7 to 11 reflects the information
on system of sewerage, number of latrines
and method of disposal of night soil. Codes
used are :-
System of Sewerage :-
Sewer/Sewerage S
Open surface drains OSD
Box surface drains BSD
Sylk drains SD
Cesspool method CD
Pit systein Pt
Others 0
Method Of Disposal Of Night Soil
Head Loads HL
Baskets B
Wheel barrows
Septic tank latrines
Severagge
Pit System
Others
WB
ST
S
Pt
o Columns 12 and 13 indicate sources of
protected water supply to the inhabitants of
200
the towns. The information on major source
of water supply is shown in the column 12
and on major source of storage and capacity
under column 13. For stating this information
. following codes have been used
Overhead tank OHT
Service reservoir SR
River Infiltration gallery IG
Borewell pumping system BWP
Pressure tank PT
Tubewell waterlHand pump TW
Tap water T
Well water W
Tank Water TK
Column 14 gives information regarding
availability of fire fighting services. In case,
it is not available in the referrent town, the
name of the nearest place where it is available
has been mentioned and the distance from
the town has also been indicated within
brackets. Columns 15 to 19 pertain to the
number of electricity supply connections
available for domestic; industiral, commercial
and road lighting points etc.
AB in 1981, the statement IV-A provides
data in respect of civic and other amenities
in the notified or recognised slums of towns
with a population of above 50,000 (i.e. class
I and class II towns).
Statement V gives information regarding
amenities like medical, educational,
recreational and cultural facilities available
in the town. 1991 population figures for each
town have also been indicated and this will
facilitate in analysing data on facilities
available to the people.
Data related to medical facilities have been
obtained from the district and sub-divisional
medical officiers and shown under columns 4
and 5. All types of medical institutions
whether allopathic, ayurvedic, unani or
homoeopathic have been covered and indicated
using the Following codes
Hospital
Dispensary
Health Centre!
Primary Health Sub-Centre!
Primay Health unit etc.
Family Planning Centre
T.B. Clinic
Nursing Home
Others
H
D
HC
FPC
TB
NH
o
If the medical institution is Ayurvedic,
Unani or Homoeopathic the same is indicated
In bracket by providing the following
additional codes
Ayurvedic
Unani
Homoeopathic
A
U
Hom
In case, more than one institution of any
type is available, the exact number is shown
within the brackets.
The information on educational faciltiies
(column 6 ) is exhibited as per following codes
Arts only A
Science only S
Commerce only C
Arts and Science only AS
Arts and Commerce only AC
Combined for all categories ASC
Arts, Science and Commerce
Law L
University U
Others 0
Column 10 pertains to the number of
201
recognized shorthand, typewriting and
vocational training institutes' (grouped as
others) which include Applied ArtJPainting
college, Pharmacy college, B.Ed. college,
Teacher's training school, Music/I)ncing
institute, Nursing school etc. The following
codes are used
Shorthand
Typewriting
Shorthand and Typewriting
Others
SH
Type
Sh.Type
o
Column 15 shows the information in
resepct of Adult literacy classes!Centres etc.
Similary in view of the spurt in the.
employment of women in towns, information
on number of working women's hostels and
seats available therein has been given under
column 16. This data would help in
formulating plans for opening new hostels in
order to meet the problems of the single
working woman. ,
Columns 17 to 20 shows recreational and
cultural facilities available in the town. These
include stadia, cinemas,
auditorialdramalcommunity halls, public
libraries indicated as 'PL' and reading rooms
indicated as 'RR'
Statement VI presents information in
respect of trade, commerce, industry and
banking services in the town. Columns 3 to
11 indicate three most important commodities
imported exported and manufactured in the
town. Information on number of banks
available in the town. Information on number
of banks available in the town appears under
column 12. Columns 13 and 14 show number
of agricultural and non-agricultural credit
societies respectively in each town.
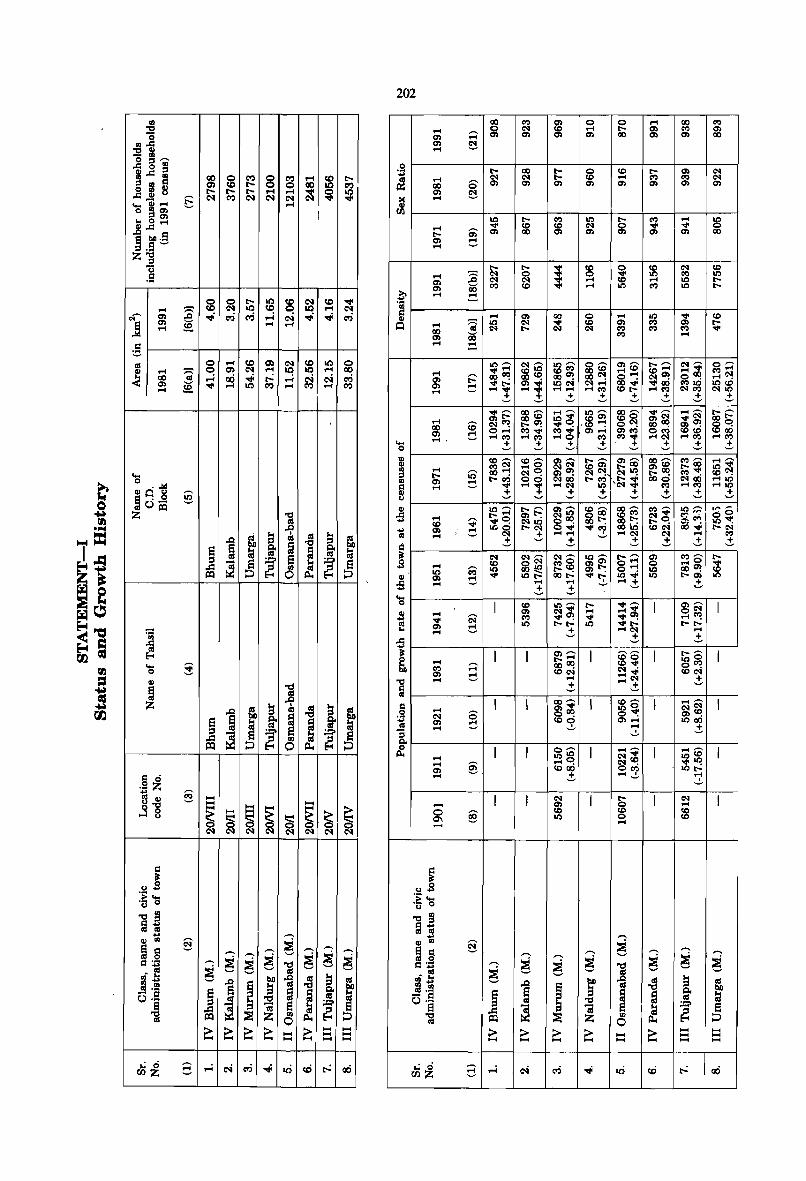
202
<1.1
::s! 0 00 '" ~ 0 0 .... 00 '" .... ;::< a! (:<I .... I:'- en C"I) en
en en en en 00 en en 00 <I.I.J::
::s!3l 0::s""'" .J:: 0 <1.1 3l.J:: ::s
00 ~ ~ 8 ~ ~ CD t--::s = a Q) t-- 0 00 10 ~ ..8_!!2l t-- t-- t-- ~ .-I "'" ~ ~ '"' ~ ~ ~ ~ ~ ~ .... GI .... t:. .-I ogjen .. oen
1l.J:: .... a b.D.S ::s.S ~
en ~ .... 0
I:'- ~ co ! 00 0 I:'- en (:<I .... (:<I ~ co .... '" '" (:<I 00 6 en en en en en en en en en ~
J ....
10 I:'- ~ 10 I:'- '" .... 10 .... 0) "'" co ~ ~ "'" "'" 0 I:'- en 00 en en en 00 en d ....
z~ .S
0 0 t-- 10 CD ~ CD "'" .... :;:::;: CD ~ 10 f"! 0 10 ~ ~ or en
~ ..; C'I) C'I) ~ ci ..; ..; C'I)
B en ~ .-I ....
~ t-- I:'- ; co 0 co (:<I co .... (:<I 0 0 "'" 10 '" 10
en (:<I (:<I .... co .... 10 I:'-en CiS' C"I) co "'" .... 10 C"I) 10 I:'-
.€ .... =. <1.1 d .... en 00 0 .... 10 "'" co GI ~ .... :;:::;: 10 (:<I ~ co en C"I) en I:'-
00 lIS (:<I t-- (:<I '" '" '" "'" en CiS' '" .... ~
.... =. <II 0 ~ CD Q) ~ CD 10 0
~ .... :;:::;: 0 en ~ ~ 10 10 .-I 00 00 <II ,....j cci ..; ~ ,....j ci c-1 C'I) en ?e "'" .-I 10 ~ .-I ~ .-I ~ ....
10 ,...... (:<IG 00""'" 0""'" en ,...... 1:'-'""' (:<I ,...... o~
""' .... co'" 00 co .... co co .... .... "'" "' .... .... r: oo~ COco 000l oo~ o'""! (:<IOl oCC! .... ~ en 00. en d ""'t-- ~!
lOC'I (:<I .... 00"'" ""'00 "'10 lOCO .... .... "'" .......... ..... '" 101:'- .... '" (:<I", (:<110 ,;!:, ,;!:, ,;!:, ,;!:, ,;!:, ,;!:, ,;!:,
"'" '""' 00 ~ ..... ,...... 10""'" 00 '"' "'" '""' ..... ,...... t-- ~
..... en I:'- 00 co 00"'" 10 en COO en (:<I "",(:<I 001:'-00 CD C'I~ I:'-~ "",C! 1<0 "'"! o~ 00CC! enOl 0C! en d
0 ..... "',"'" "'''''' , en ..... en", 0'" coco co 00 ...... .... '" .... '" ..... 0 '" , C"I)"", .... (:<1 .... '" .... '" .... ,;!:, ,;!:, ,;!:, ,;!:, ,;!:, ,;!:, ,;!:, ,;!:, 0
.... 0 • ..14
GI ~ 8 § ~o-Z ~ 'd <II
~ ~ .Jil
<II
~ ..c <II
~ ~ 'd e e e- ~ <II a ::s
~ ~ ?: ;.!:(I
~ ..s:: rn <II ~ ~ 0 Il.
til co ,...... co ,...... en'""' I:'- ,...... en ,...... 00 '""' '" ,...... .... '"' Q) ",(:<I ..... 0 (:<1(:<1 co en 1:'-00 en co t-- OO IO~ til ..... it.) oo'""! (:<I~ enOl (:<I~ (:<I~ I:'-CC! "'~ ::s I:'- co.
til en d 1:'-", 00 (:<100 1:'-", ,~~ 000 (:<100 ..... 10
d .... "'" ..... "'" ..... (:<I 10 '" ..... '" .... 10
~ ,;!:, ,;!:, + ,;!:, ,;!:, + ,;!:, + ._, '-' ._.
GI 10""'" t-- '""' en$ 10""'" 00 ,...... '" ,...... 10""'" .~ 6 1
oS .... 1:'- .... en~ (:<100 ~~ co'" (:<I"'" g~1 ~~ co :;j< "",C! (:<110 8""" gs~ I:'-C! .... en d 100 t--(:<I ~~ co (:<I 00"'" t--C'I
<II ..... (:<I ,;!:, ......... .....(:<1 (:<I ..... C"I)
Q ,;!:, ,;!:, ,;!:, ,;!:, ,;!:, ,;!:,
~ (:<I (:<I ,...... C'I""'" 00""'" t--""'" ~ "',...... t--..... 10 0(:<1 ",0 en en '0 .... .... 0 "'" 10 ~ 10 oo~ t--~ en~ o'""! 10 000l co
Q) en d "'" 001:'- 00 I:'- "I:t'~ 10"'" 10 I:'-en 10
oS .... .... .... .... ,;!:, .!-,;!:, ,;!:, ....
-. ; ~ .... ~ 0 GI 'd ~ <II
Z
~ .Jil .g ~ 1 :., CIS lIS
e ; ~ J ~ .E ~ ~ ;.!:(I ;.!:(I
~ ~ rn ~ !Xl 0
d . o 0 :JjZ § 5 GI ....
,3'8 ..... :::::: ~ ~
.... ~ ~ ~ a a a
~ ~ ~ ~ ~ ~ ~ ~
0 I co 00'""' t-- ""',...... I en""'" I ~
.... en C'I"'" .... .... -a. 0(:<1
: c.1 C"I) "",Ol ;-,; ""'. ....'" d 10 1:'-1:'- ""'I:'- 1:'-1:'-.. .... ,;!:, ....(:<1 .....
oS ,;!:, ,;!:,
! I I en'""' I coo I I:'- ,...... I .... 1:'- .... 10 0 ,...... 00CC! co"'" o~
'" ..... (:<I • en d
10(:<1 .... "'" co (:<I
1 .... .... .... (:<1 ,;!:,
,;!:, ,;!:,
d I I 00""'" I co ~ I .... ~ I .... en"'" 10° (:<1(:<1 0 6 oCC! o~ en~
~ C'I en ::::! (C)~ en .... 1000 ..... ~ ,;!:,
Q,
& I I 0""'" I .... ,......
I ~~ I .... 1010 (:<I"'" .... ~ ....0 (:<I~ en S 1000 0", 101:'-.... ,;!:, .... -!,_
~
I I C'I I I:'- I (:<I I - en 0 .... ~ § CD co co
10 0 10 - ....
d ~ u.s
:~ 't;
d ~ u.s os: ~
°D 0
]~ i GI <1.1 §
~ § ,...... " ,...... '""' '""' '""' '-'
~ ~ d~ '""' )1 ~ ~ "g ~ .f ~ ~ .......
..c
~ ~ ] CIS ~ lIS
~ ·s j ~ 1 e- ~ (..) .... ~ a ~ ; ;.!:(I e -g IXl ::e Il. ~ 0
"0 !(j ~3
'""' Q) til § ~ ~ g '""' i '""' '""' = .. ~ '""' ~ ~ ~ -g ~ ~
~ '-'
rn..,.
'S ~ ~ .g ~ ~ ~ ·S § ~ ~ ~
Q.
(..) ·s CIS "0 lIS
~ ::s iii e ~ ;.!:(I e ..s:: ~ "0 IXl ~ Z til 0 <II 0
~ > > ~ ..... ~ .... .... .... .... .... .... ..... ..... .... > ~ ~ ~ .... > .... .... .... ..... ..... .... .... .... .....
~~ ;::< ,....; c-1 C'I) ..; oci cO ~ cci ,.; c:i ooz 2 ,....; c-1 C"I) ..; to cO ~ cci
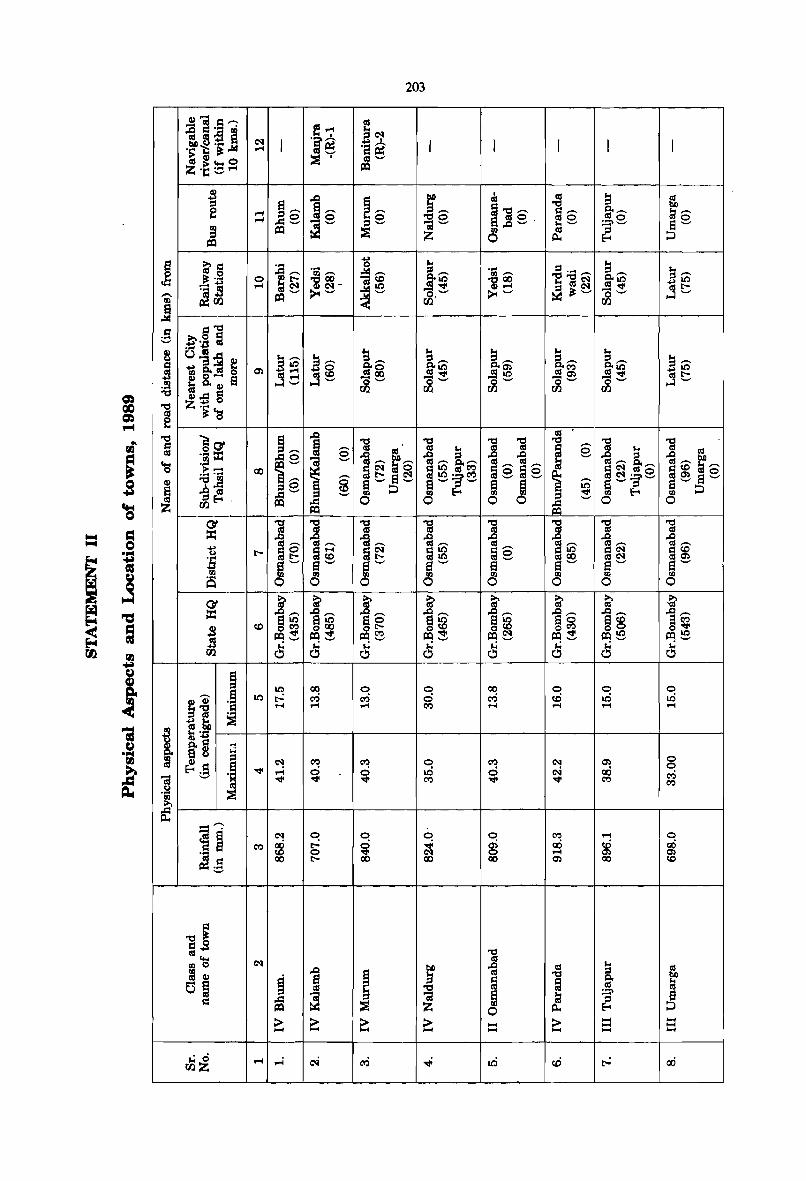
203
=
]j '0 co ...
C'I co
~ III 0 bI) ~ C!S
~ ; Qj
~ 'S ~ !3 '0
o~ !:IS '0 a a C!S
~ tU a tii ;.:::;>
~ t:: .= ::s ~ ~ Z III Il.. E-t 0 > > ~ > > - ..... ..... - ..... - ..... ..... - ..... ..... .....
~~ r-I ~ C'i cw; ~ to cO ~ 00
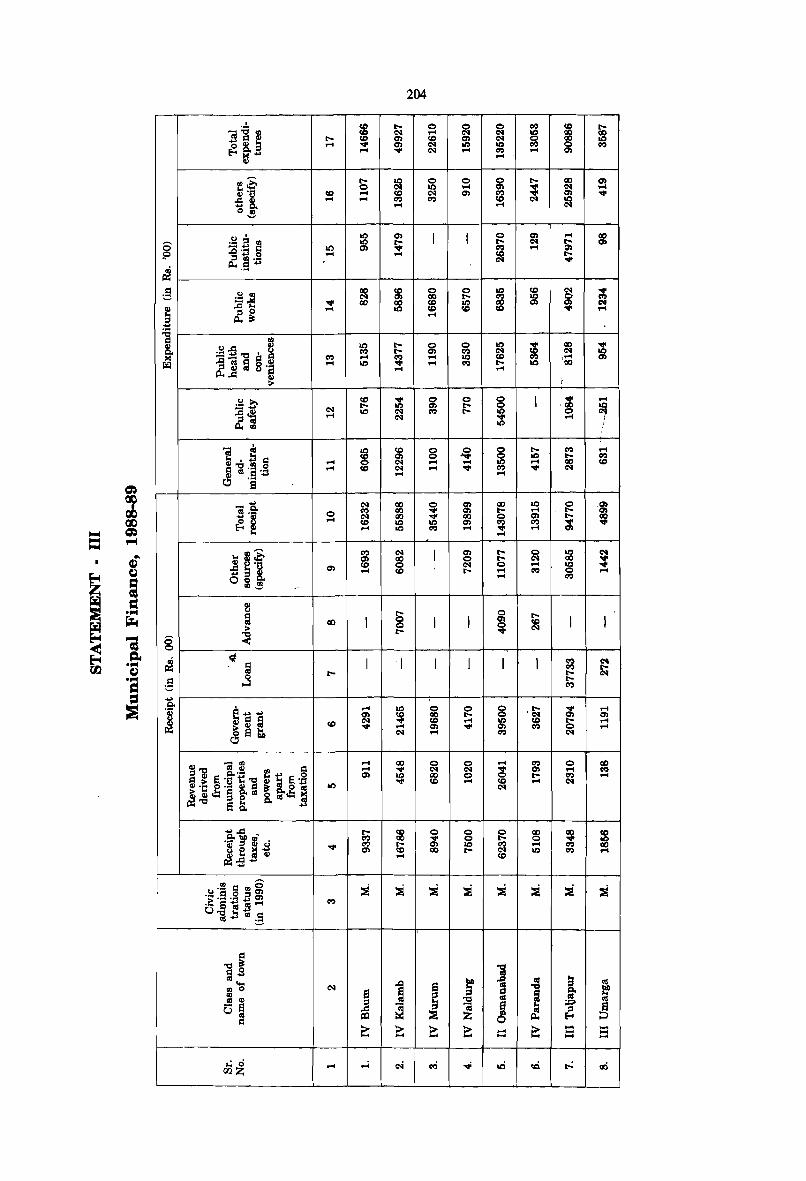
g
c:<I ....
.... ....
o ....
I
204
~ , ,
~ ~------------------~----+---~~--~~--+---~~--~----+---~~--~
!
....
.... .... a>
o .... .~
--- -:::
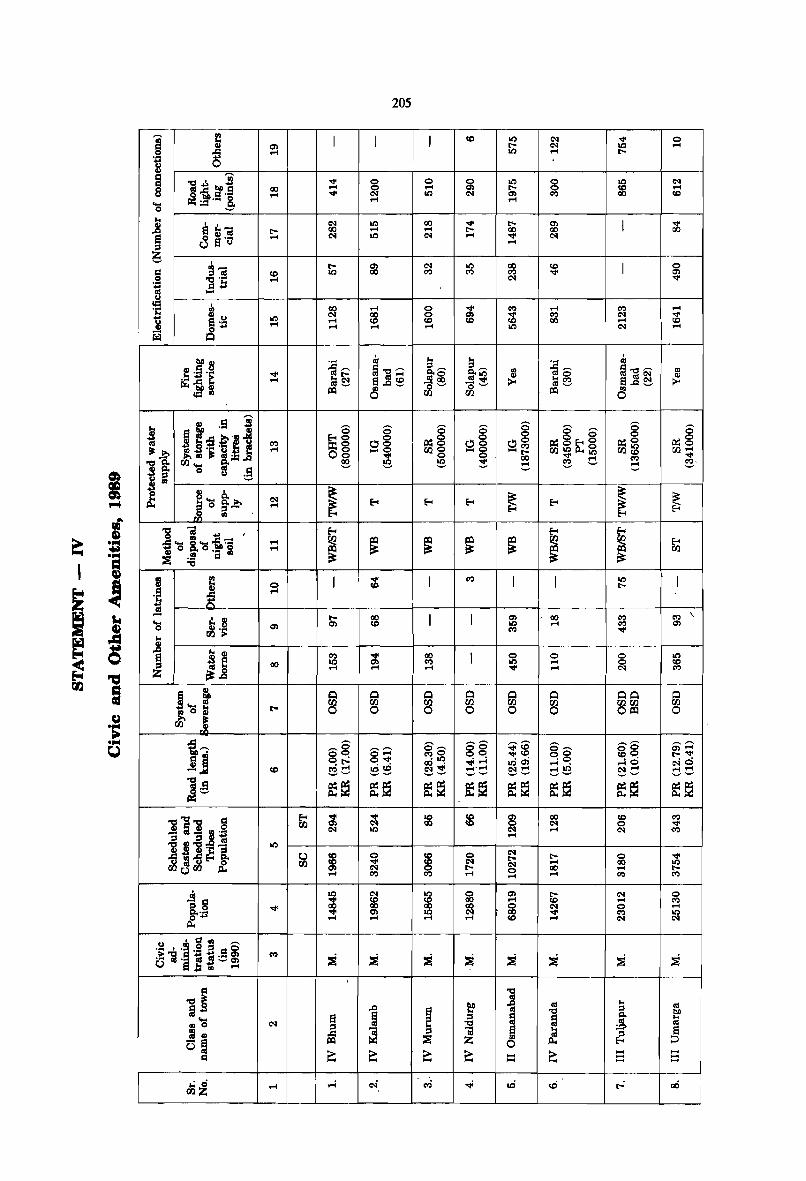
t .... ...,a ....
J ~ 1 -s .... o
a':'''iiI o CIl .... o EI ..,
CD ....
IX) ....
I(.) ....
I(.) .... I(.)
.... IX) (Q ....
205
o .... I(.)
IX) .... C"I
o o (Q ....
~ o
,.-. 0"-' 00 ·0 .....
.... 1(.) ~~
IX) C"I ....
t.... IX) ....
o IX) .... C'I)
.... .... ....
o ....
~ o
(IS
J .... .... -
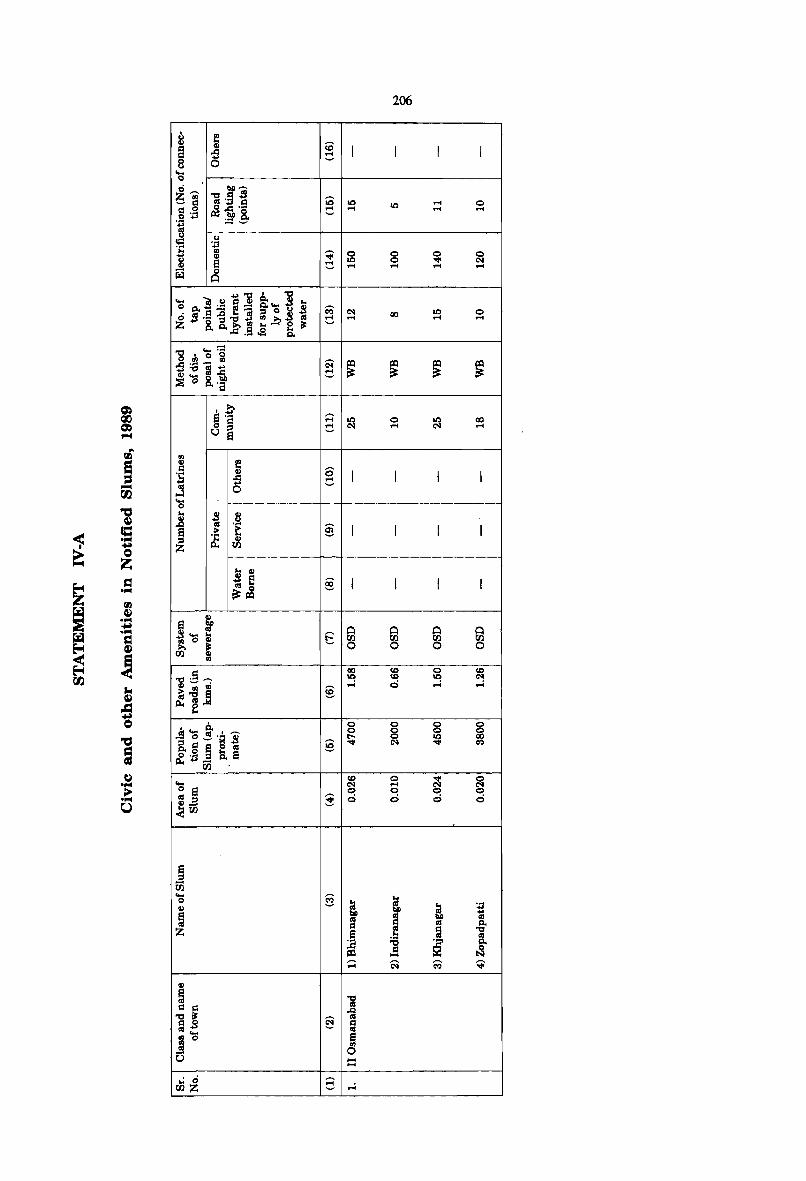
206
c:. f QI CD ~ QI
I I I I oS .... 8 0
~ ... 0
Q~ 1o.Q~
~~ -g .~ ~ G 10 It:) ... 0
§:3 ~..c:.'" d .... .... ... .~ ~~ q:: .~ . 1: ... ...
~ 0 0 0 0 ] QI e It:) 0 "" C'I d ... .... .... .... r:.:t 0
~
... )C)~'iQ. ]~ o CI. .... .... CI.... C) .B Ci5' c - - =' 0 C'I co It:) 0 o'l-g~, ... :...Bas d ... .... .... Z CI.:.. ... ~ .... Ojj:
..c: .51 oS ~
] c-::= • 0 0
o£~a;! ~ ~ ~ ~ ~ QI ....... '€b d ~ 0 8. ....
I:l
0) rt) 0) 1""4
• .to ,..... ~ .§ .... It:) 0 It:) co
C C'I ... C'I .... o a ..
fIl
9 -00
:8 f 1:1 <5 .1:: QI I I I I ..c: C ... ... j 0 ...
"0 ~
1 cc: .... ~
~ Q
Z
~ = .... fIl
~ ~ .... ~
IiI;l .... $:I
~ ~
~ E-4 00
t ~ "0
~
0 .. .B 8 .! as
l § I I I I e ~ ::s Z
.. QI
.B S 00 I I I I ~t8 ~
a ~ as ~ ~ ~ ~ ~'O .. E QI 00 00 00 00
II jj: 0 0 0 0 QI ...
'"CI~-; co co 0 CD It:) CD It:) C'I
~ ...... § ... 0 ... ...
<1111] ll. 0
~
f c..... ~ 0 0 0 g 0 0 0 .! 0 ~ .~ :s t- o It:) co [de oas § "" C'I "" CQ
,f:3,E ~e 00
Q .... :;.. .... 0
... CD 0 "" 0 C'I .... C'I C'I
o a 0 0 0 0 gl,E ~ 0 0 0 0 <00
e ::s as ... § t 0 ~ :;3 QI ~ ~ Io.Q ... as <II I:l as Q.
Z ~ '1:1
j .~ <II '1:1 ~
CI.
II:l I:l ~ .... ;:::; ~ Ci5' ~
QI
~ -g 1:1 1:1 ..Q
]~ § as ~ .... m ! 0
u 0 .... .... . 0
r13z a ...
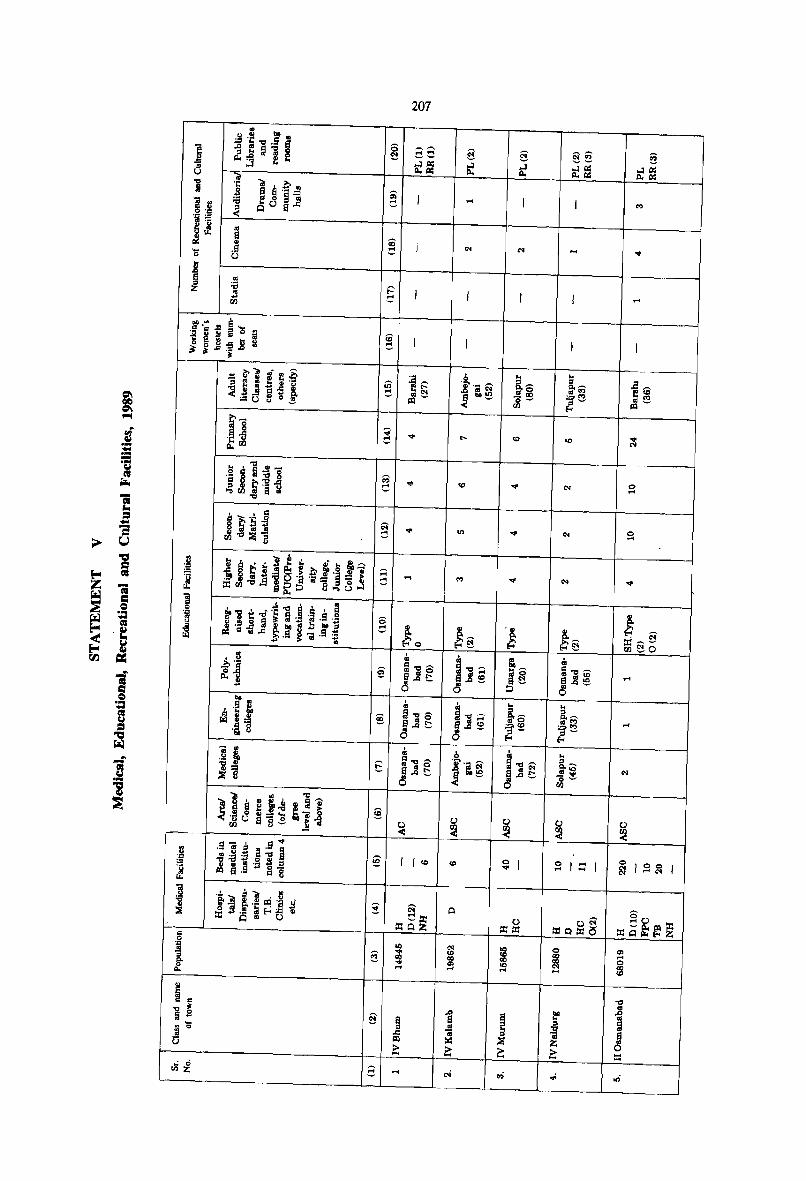
207
0 ~~ ........ ~ ~-
~~
6i 1 c G! 0 b .. S S '-j III 0 § QOS
'" iiO I C
~ ,9
° r: I c
CD I c
~
~
on 1~ c III~ III
"'" :1' .... ~ .... C .. .... -... Col ~ ~ tQ .... C -f .= .. :; ,... u
0:0 .... C
'" Eo- ; Z ";
~ s f;I;;;j ;I
~ Eo- ·e < Eo- ~ tI.l
...:-g
~ .... c
0 c $0 <lI ~ PQ 6' § SAt 0
;I
5 .= ~
<lI ;j ... 6 § sAt: 0
= '" -5 ... ~
§
~..., 6 E a A .... o -
0 <
Il § ( (co
';:J
'" ~ B
~
0:0 ~ C:z: :e~Z
'fl ~
.
" 0 14 .... § ~ ....
'::J
i 0
Q..
i c
~ ~ e
;I: § .9 ... ii 0
D
,.; c:i tlIz ...
....
co
!§ '! as ~~ ~..., ~ S '" '" ~~ .D.~
0 :;J
as .. ::s ~..., ~ ~6 s"'''' ;,..'" .D.~
?~ <5 0 ~..., 0:0 fa~ S "' .... .t:>._.
<5
0 0 ~ ~
0 I co ....
Q
0 :Z:1l! .. 10
'" ~ 00 Ql .., ... .....
.D.
~ S
~ ~ e e c-i co;
!§ as iii..., G aJ~ 0 .. ::s ~~
"'co:> ;.:;0 co:> ::s'-' f-<
... [-'" .., o~
rn
0
~
0 I::: 1 ...
00:0 Il!~=o
0
~ C<I .....
~
~ Z e .,j
o ...
0
~
0 gf 1 00 ..... I
0 ... ~ :e
1l!2l ~Z Ql ... 0
~
..., III
.D.
a S 0 :::
on
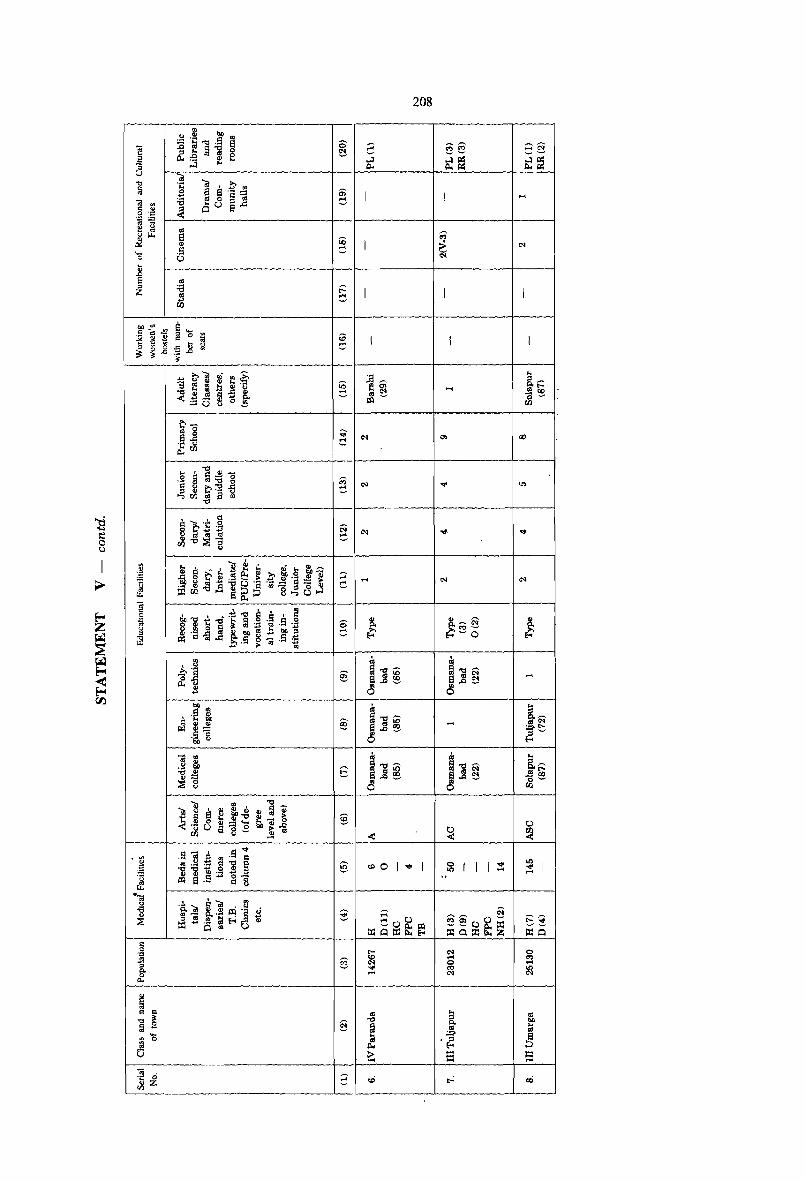
208
'" ] rn
00
~I
J s
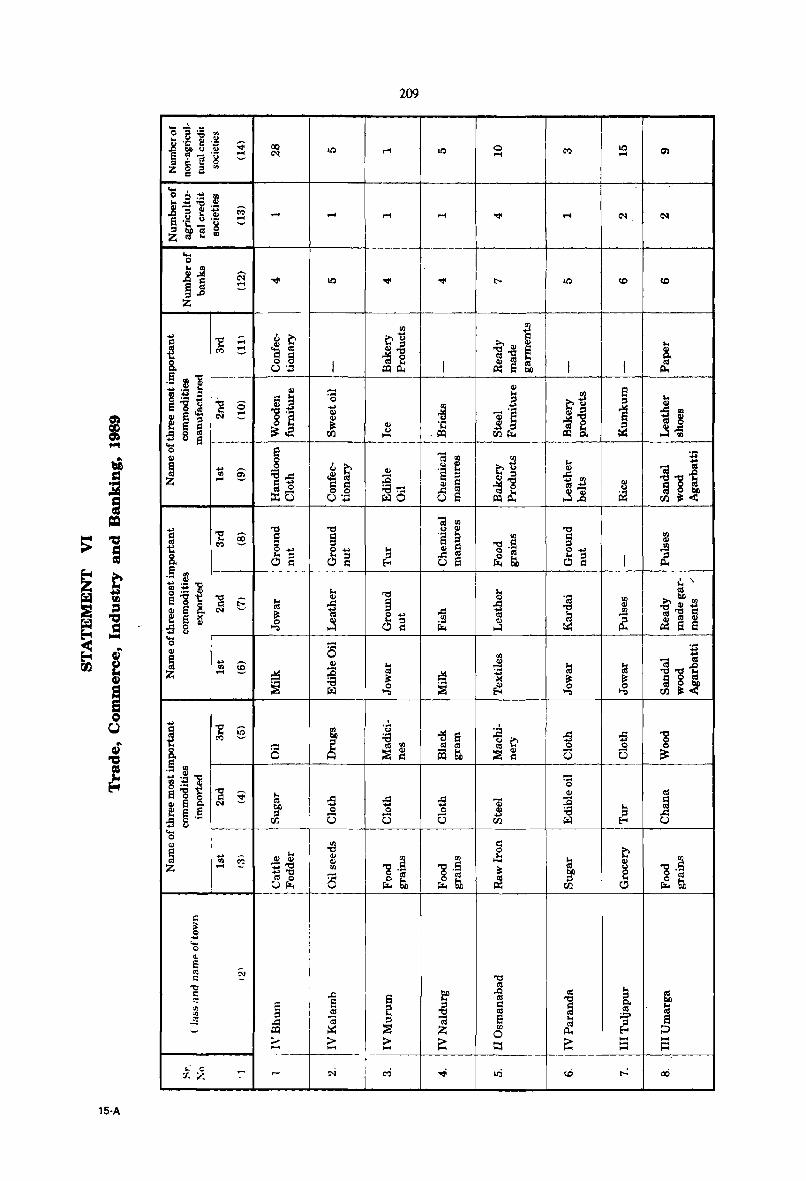
lS-A
209
....
c ....
....
I---..,.---t-~~-- !-----+---+----+-----r--___,f-----+-------I
"'0 § 0 ... o E
til "'0
Q) ~ & '3;g~ I til :;:::
C ~----~----~- ------f------r-----+------~---~--+_---_1
! ,
i i
"'0
.2 '"' 6 liS § ~ ~ .g :a'~ :o~ ::I t'CS '"' Z:g r! ""~ .__ S ~ ~ w 5 ~ ~ ~ ~ > > > - > = = ----1------ ' -------+------+------+-----+----+----:-----i
Serial No.
(1)
Name of the town
with location code
(2)
210
APPENDIX TO TOWN DIRECTORY
Towns showing their outgrowth with population
Population of
core town
(3)
Outgrowth
(4)
"There are no outgrowths in this District, hence the information is nil."
Population of
outgrowth
(5)
PART B
PRIMARY CENSUS ABSTRACT

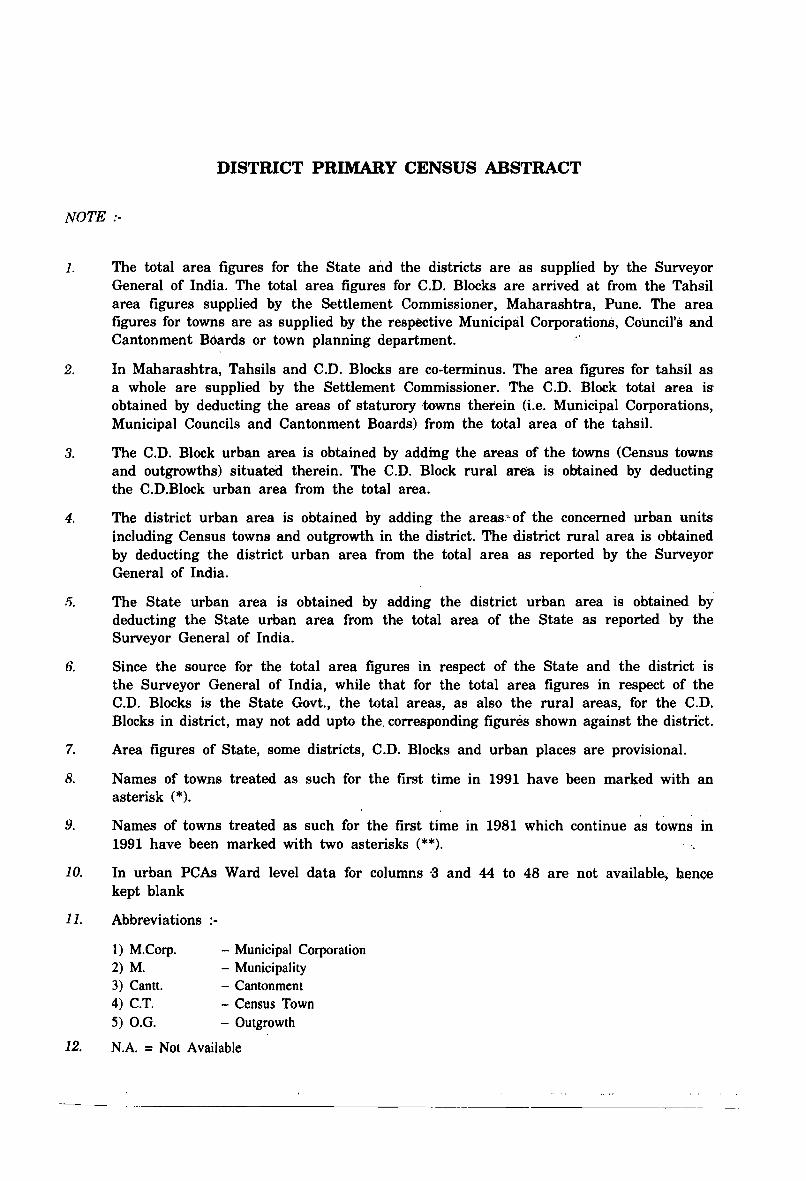
DISTRICT PRIMARY CENSUS ABSTRACT
NOTE ;-
1. The total area figures for the State and the districts are as supplied by the Surveyor General of India. The total area figures for C.D. Blocks are arrived at from the Tahsil area figures supplied by the Settlement Commissioner, Maharashtra, Pune. The area figures for towns are as supplied by the respective Municipal Corporations, Council's and Cantonment Boards or town planning department. .'
2. In Maharashtra, Tahsils and C.D. Blocks are co-terminus. The area figures for tahsil as a whole are supplied by the Settlement Commissioner. The C.D. Block' total area is' obtained by deducting the areas of staturory towns therein (i.e. Municipal Corporations, Municipal Councils and Cantonment Boards) from the total area of the tahsil.
3. The C.D. Block urban area is obtained by adding the areas of the towns (Census towns and outgrowths) situated therein. The C.D. Block rural area is obtained by deducting the C.D.Block urban area from the total area.
4. The district urban area is obtained by adding. the areas" of the concerned urban units including Census towns and outgrowth in the district. The district rural area is obtained by deducting the district urban area from the total area as reported by the Surveyor General of India .
.I). The State urban area is obtained by adding the district urban area is obtained by deducting the State urban area from the total area of the State as reported by the Surveyor General of India.
6. Since the source for the total area figures in respect of the State and the district is the Surveyor General of India, while that for the total area figures in respect of the C.D. Blocks is the State Govt., the total areas, as also the rural areas, for the C.D. Blocks in district, may not add upto the. corresponding figures shown against the distriCt.
7. Area figures of State, some districts, C.D. Blocks and urban places are provisional.
8. Names of towns treated as such for the first time in 1991 have been marked with an asterisk (*).
. . .
9. Names of towns treated as such for the first time in 1981 which continue as towns in 1991 have been marked with two asterisks (**).
10. In urban PCAs Ward level data for columns ·3 and 44 to 48 are not available~ hence kept blank
11. Abbreviations
t) M.Corp. 2) M.
- Municipal Corporation - Municipality
3) Cantt. - Cantonment 4) C.T. - Census Town 5) O.G. - Outgrowth
12. N.A. = Not Available
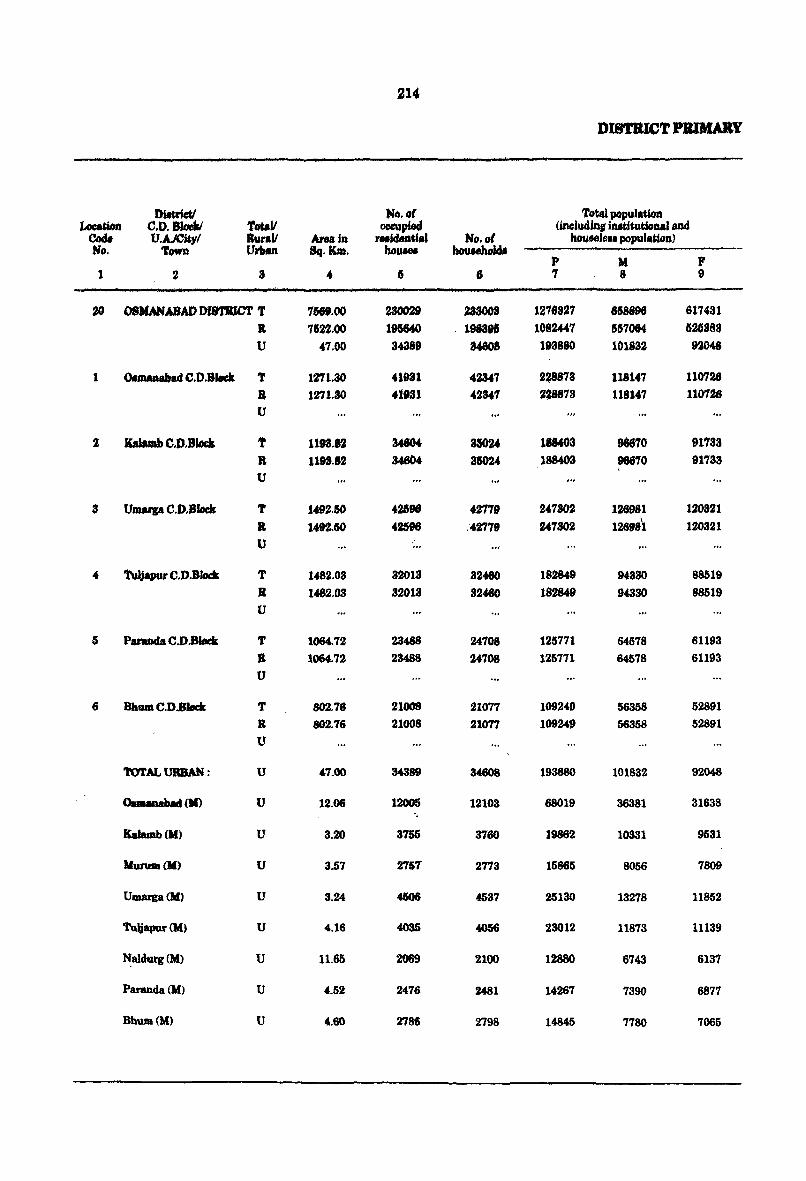
214
DWtrietI Ho.oC Total population lMation C,D. 8JoeIrI 1'cuV oceupiacl (ineludJn, iftJtftutfonal and
Cod. V,A.lCity/ lWr.V Are. in r .. jdHtial No. of hou.aJe •• population) No. 1'OWD Urb4n Sq. KIn. hoUMa houNhDldf
P M F 1 2 3 .. G 6 7 8 9
20 OSMANABAD DlS'J'IUCT T 1H1.00 230029 283003 1216327 668896 617431 a 7422.00 196640 . 1988t& 1082.447 557064 626388
tJ .7.00 3.389 U608 193880 U)1832 92048
1 ~C.D.Bt.ck T 12'71.30 41931 42347 2~78 118147 110726
a 1271.30 41'31 42347 2.73 118147 110726 U
2 KaIMlb e.D,BIock 'l' llfJ3.12 34604 3IOU 1S8403 *'70 91733 a 11".82 34804 310U 188403 96670 91733
U
3 UJtWga C.D,BJoek T 1.492050 42$96 42779 241302 126981 120321
a I.49UO 42596 .42779 247302 12698\ 120321 U ...
4 'l'uljapur C.D.BJock T 1482.03 32013 32480 182849 94330 88519
H 1482.03 32018 82460 182849 94830 88519 U
5 ParaDda C.D.BIoek T 1064.12 23488 24108 125771 64578 61193
It 1*.72 28488 24708 126711 64578 61193
U
6 BilWll C.D.BIetk T 802.76 21008 21077 109249 56358 52891 II 802.76 21008 21077 109249 56358 52891
U
'l'Ol'AL URBAN : U ".00 34389 34608 193880 101832 92048
o..anaNd ()() U 12.06 12005 12103 68019 36381 31638 '.
KaIamb(M) U 8.20 3755 3760 19862 10331 9531
MUI'WD{M) U 3..57 2757 2173 15865 8056 7809
Umarga(M) U 3.24 4606 4537 25130 13278 11852
Tuljapur (14) U 4.16 4035 4056 23012 11873 11139
~aldurg(M) U 11.65 2069 2100 12880 6743 6137
Paranda (l,f) U 4.52 2476 2481 14267 7390 6877
Bhum(K) U 4,60 2786 2798 14845 7780 7065
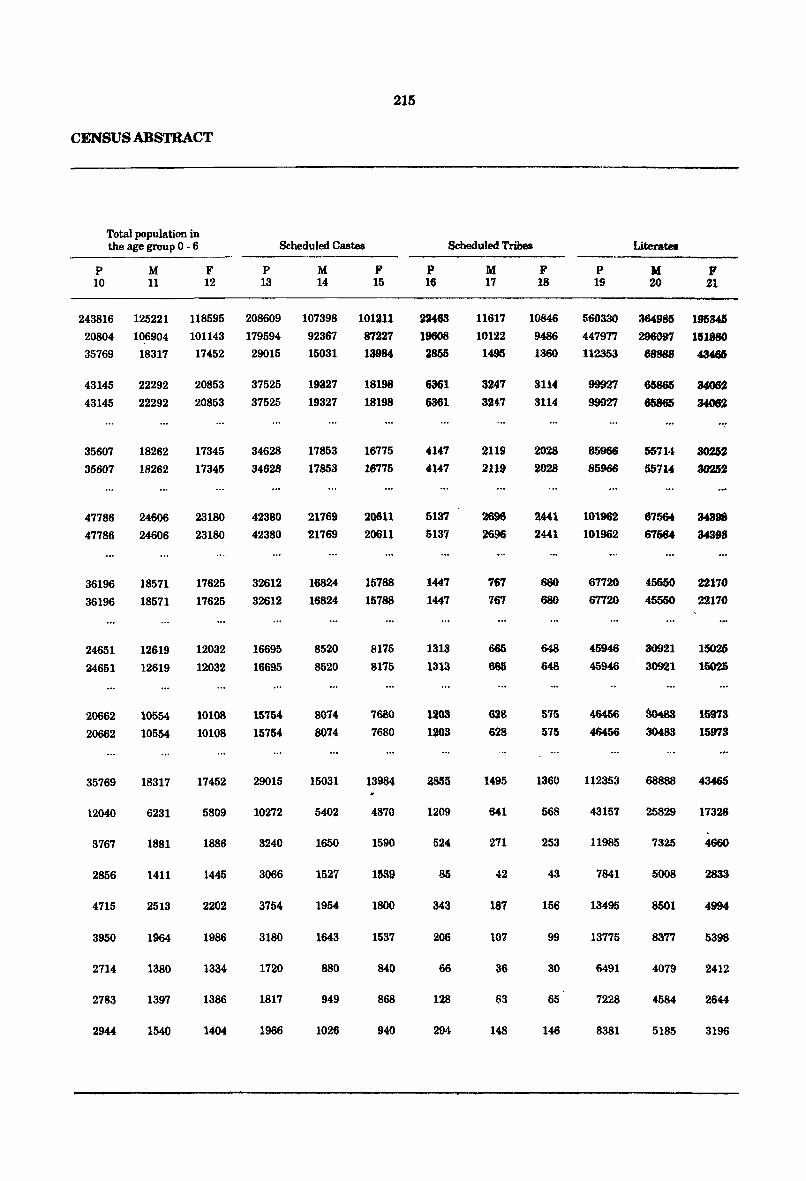
215
CENSUS ABSTRACT
Total population in the age group 0 - 6 Scheduled Castes
P M F P 10 11 12 13
243816 125221 118595 208609 20804 106904 101143 179594 35769 18317 17452 29015
43145 22292 20853 37525 43145 22292 20853 37525
35607 18262 35607 18262
47786 24606 47786 24606
36196 18571 36196 18571
24651 12619 24651 12619
20662 10554 20662 10554
35769 18317
l2040 6231
3767 1881
2856 1411
4715 2513
3950 1964
2714 1380
2783 1397
2944 1540
17345 17345
23180 23180
17625 17625
12032 12032
10108 10108
17452
5809
1886
1445
2202
1986
1334
1386
1404
34628 34628
42380 42380
32612 32612
16695
16695
15754 15754
29015
10272
3240
3066
3754
3180
1720
1817
1966
M 14
107398 92367 15031
19327 19327
17853
17853
21769 ~1769
16824
16824
8520 8520
8074 8074
15031
5402
1650
1527
1954
1643
880
949
1026
F 15
101211 87227
13984
18198 18198
16775 16775
20611
20011
15788 15788
8175 8175
7680 7680
13984
4870
1590
HISS
1800
1537
841)
868
940
Scheduled Tribes Literate.
P 16
22483
19608 2855
8361 6361
4147 nt7
5137 5137
1447 1447
1313 1313
1203 1203
281Ui
1209
524
85
343
206
66
128
294
M 17
11617 10122 1495
3247
32'"
2119
2119
2696
2696
767
761
665
66&
628 628
1495
641
271
42
187
\07
36
63
148
F 18
P M F 19 20 21
10846 9486
1360
560330 364985 1915U6
447977 296097 15188D 112353 68888 43466
3114 3114
2028 85966
2028 85966
2441 101962 2441 101962
680 67720
680 67120
648 45946 648 45946
575 46456
575 46456
1360 112353
568 43157
253 11985
7841
156 13495
99 13775
30 6491
65 7228
146 8381
567J.t 30252
55114 30252
67564 US9&
67584 US98
45550 22170
45550 22170
30921 15026
30921 15025
00483 15973
30483 15973
68888 43465
25829 17328
7825 4660
5008 2833
8501 4994
8377 5398
4079 2412
4584 2644
5185 3196

Location Code No.
1
20
1
2
3
4
5
6
Districtl C.D. Block! U.AJCityl
Town
2
Total! Rurall Urban
3
OSMANABAD DISTRICT T R
U
Osmanabad C.D.Block T
Kalamb C.D.Block.
Umarga C.D.Block
Tuljapur C.D.Block
Paranda C.D.Block
Bhum C.D.Block
TOTAL URBAN:
Osmanabad (M)
Kalamb(M)
Murum(M)
Umarga(M)
Tuljapur (M)
Naldurg (M) ..
Paranda(M)
Bhum(M)
R
U
T R
U
T
R
U
T
R
U
T
R
U
T
R
U
U
U
U
u
u
U
U
u
U
216
DISTRICT PRIMARY
INDUSTRIAL CATEGORY
Total main
workers Cultivators
(I-IX) (l)
Agricultural Labourers
(II) -------- -------- ----- --~-----~
P 22
M F P M 23 .24 25 26
529425 334918 194507
474794 290887 183907
54631 44031 10600
214496 149081
208848 144194
5648 4887
'.
F 27
P 28
65415 217527
64654 204080
761 13497
M 29
99969
92553
7416
F 30
117558
111477
6081
103068 61927 41141 41611 27620 13991 45102 20527 24575
10306~ 61927 41141 41611 27620· 13991 45102 20527 24575
84415 49968 34447 ~~ 43500 27729 15771 . 31633 14135 17498
84415 49968 34447 43500 27729 15771 31633 14135 ~17498
100577
100577
64393
64393
36184
.36184
79736 49593 30143
79736 49593 30143
36606
3~606
28648 7958 50381 ~ 23399
50381 23399 286~ 7958
30396 22596
30396 22596
7800 38070 17095
7800 38070 17095
57307 35066 22241 30533 20702 9831 21690
57307 35066 22241 30533 20702 9831 21690
9851
9851
49691 29940 19751 26202 16899 9303 17154
49691 29940 19751 26202 16899 9303 17154
54631 44031 10600 5648 4887 761 13497
17349 14700 2649 798 737 61 2590
5530 4536 994 437 377 60 1445 •
5566 3610 1756 1140 931 209 2673
7221 5716 1505 785 681 104 1719
6382 5229 1153 490 395 95 1447
3571 2863 708 502 493 9 1152
4445 3554 891 653 552 101 1284
4567 3623 944 843 721 122 1187
7546
7546
7416
1628
841
1312
817
907
643
706
562
26982
26982
20975
20975
11839
11839
9608
9608
6081.
962
604
1361
902
540
509
578
625
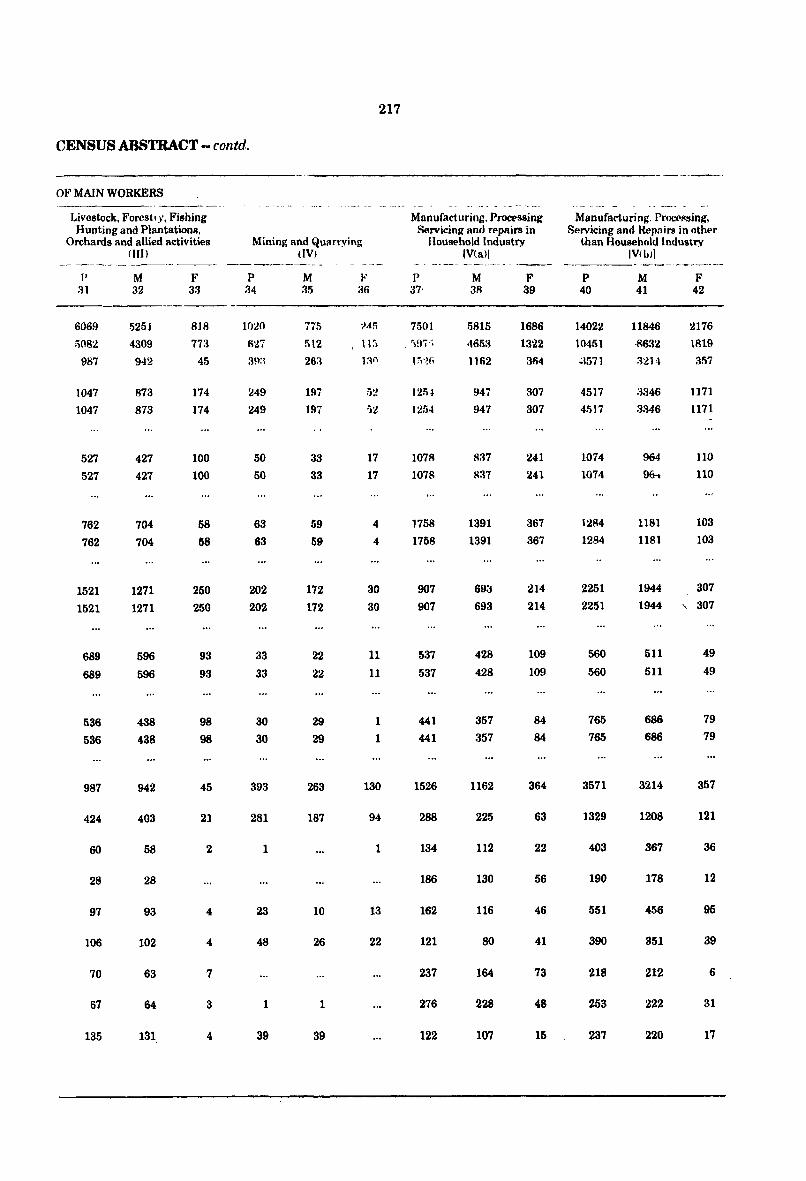
217
CENSUS ABSTRACT·· contd.
OF MAIN WORKERS
Livestock, Forest,y. Fishing Hunting and Plantations,
Orchards and allied activities (fIn
p :n
6069 ;)OS~
987
1047 1047
527
527
762 762
1521 1521
689
689
536
536
987
424
60
28
97
106
70
67
135
M 32
5251
4309 942
873 873
427 427
704 704
1271 1271
596
596
438
438
942
403
58
28
93
102
63
64
131.
F 33
81R
773 45
174 174
100 100
58
58
250 250
93
93
98 98
45
21
2
4
7
3
4
Mining and Quanying (lV,
P 34
IO;.!O
627
:iH:1
249 249
50
50
63
63
202 202
33
33
30
30
393
281
1
23
48
1
39
M 35
197 197
33 33
59
59
172 172
22
22
29 29
263
187
10
26
1
39
F 36
17 17
4
4
30 30
11
11
1
1
130
94
1
13
22
Manufacturing. Procl'ssing &rvicing and rppairs in
Household Industry IV(a)1
7501
1251
125-t
1078 1078
1758
1758
907
907
537
537
441 441
1526
288
134
186
162
121
237
276
122
M 38
5815
465a 1162
947 947
1391
1391
693 693
428
428
357 357
1162
225
112
130
116
80
164
228
107
F 39
1686 1322 364
307 307
241 241
367 367
214 214
109 109
84
84
364
63
22
56
46
41
73
48
15
Manufacturing. Pr()c(>~sing, Servicing and Repnirs in othl.'r
than Household Industry IVlhll .
------ -----------P 40
14022 10451 ~1571
4517 4!lt7
1074 1074
1284 1284
2251 2251
560
560
765 765
3571
1329
403
190
551
390
218
253
237
M F 41 42
11846 2176 ·8632 1819 :12H 357
;i346 1171
3lJ46 1171
964 110
96.. 110
1181 103 1181 103
1944 307 1944 '. 307
511 49
511 49
686 79
686 79
3214 357
1208 121
367 36
178 12
456 95
351 39
212 6
222 31
220 17
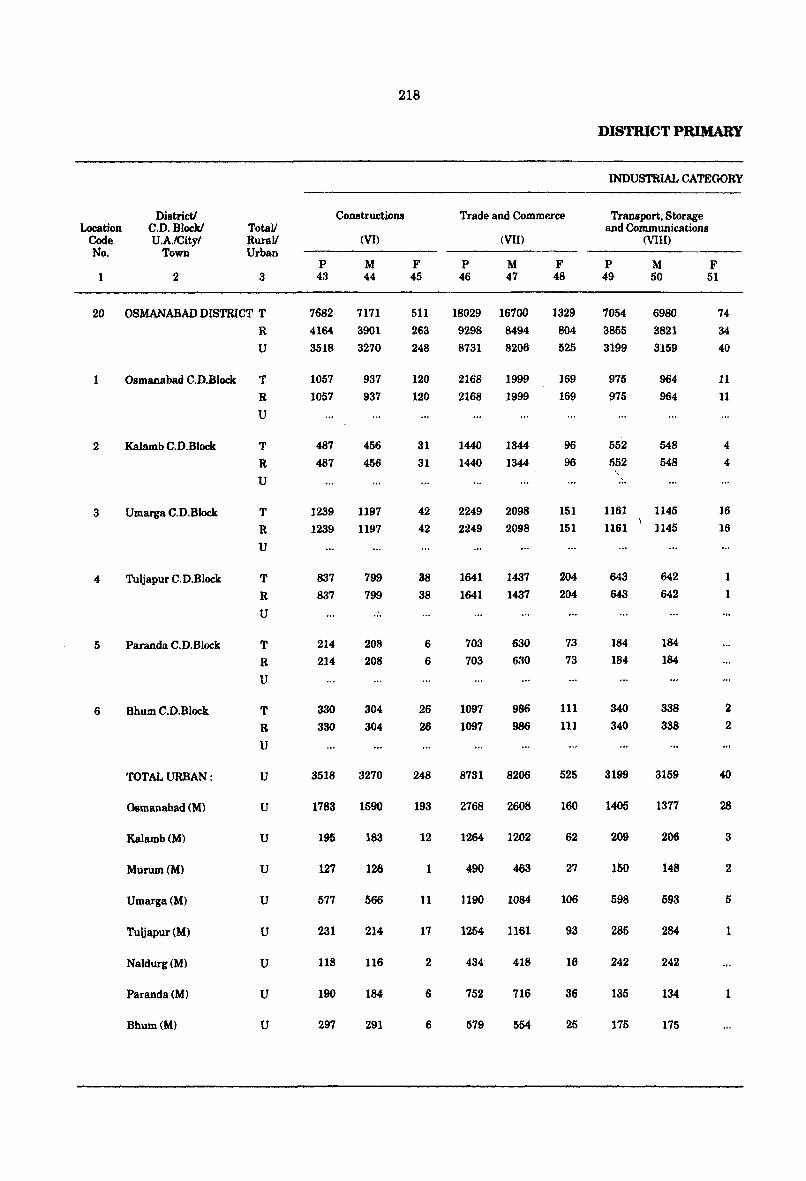
Location Code No.
1
District! C.D.Block! U.A.lCity/
Town
2
TotaV RuraV Urban
3
20 OSMANABAD DISTRICT T
R U
1
2
3
4
5
6
Osmanabad C.D.Block T
R
U
Kalamb C.D.Block T
Umarga C.D.Block
Tuljapur C.D.Block
Paranda C.D.Block
Bhum C.D.Block
TOTAL URBAN :
Osmanabad (M)
Kalamb(M)
Murum(M)
Umarga(M)
Tuljapur (M)
Naldurg(M)
Paranda(M)
Bhum(M)
R U
T
R
U
T
R U
T
R
U
T
R
U
u
u
u
U
U
U
u
u
u
218
Constructions
P 43
7682 4164 3518
1057 1057
487 487
1239 1239
837 837
214 214
330 330
(VI)
M 44
7171 3901 3270
937 937
456 456
1197 1197
799 799
208 208
304 304
3518 3270
1783 1590
195 183
127 126
577 566
231 214
118 116
190 184
297 291
F 45
511 263 248
120 120
31 31
42 42
88
38
6
6
26 26
248
193
12
1
11
17
2
6
6
Trade and Commerce
P 46
(VII)
M 47
18029 16700 9298 8731
2168 2168
1440 1440
8494 8206
1999 1999
1344 1344
2249 2098 2249 2098
1641 1641
703 703
1097 1097
1437 1437
630 630
986
986
8731 8206
2768 2608
1264 1202
490 463
1190 1084
1254 1161
434 418
752 716
579 554
F 48
1329 804 525
169
169
96
96
151 151
204
204
73 73
111 111
525
160
62
27
106
93
16
36
25
DISTRICT PRIMARY
INDUSTRIAL CATEGORY
Transport. Storage and Communications
(VIII)
P 49
M 50
F 51
7054 3855 3199
975 975
552 552
1161 1161
643 643
184 184
340
340
3199
1405
209
150
598
285
242
135
175
6980 3821 3159
964
964
548
548
1145
1145
642
642
184 184
338 338
3159
1317
206
148
593
284
242
134
175
74 34 40
11
11
4
4
16 16
1
1
2 2
40
28
3
2
5
1
1
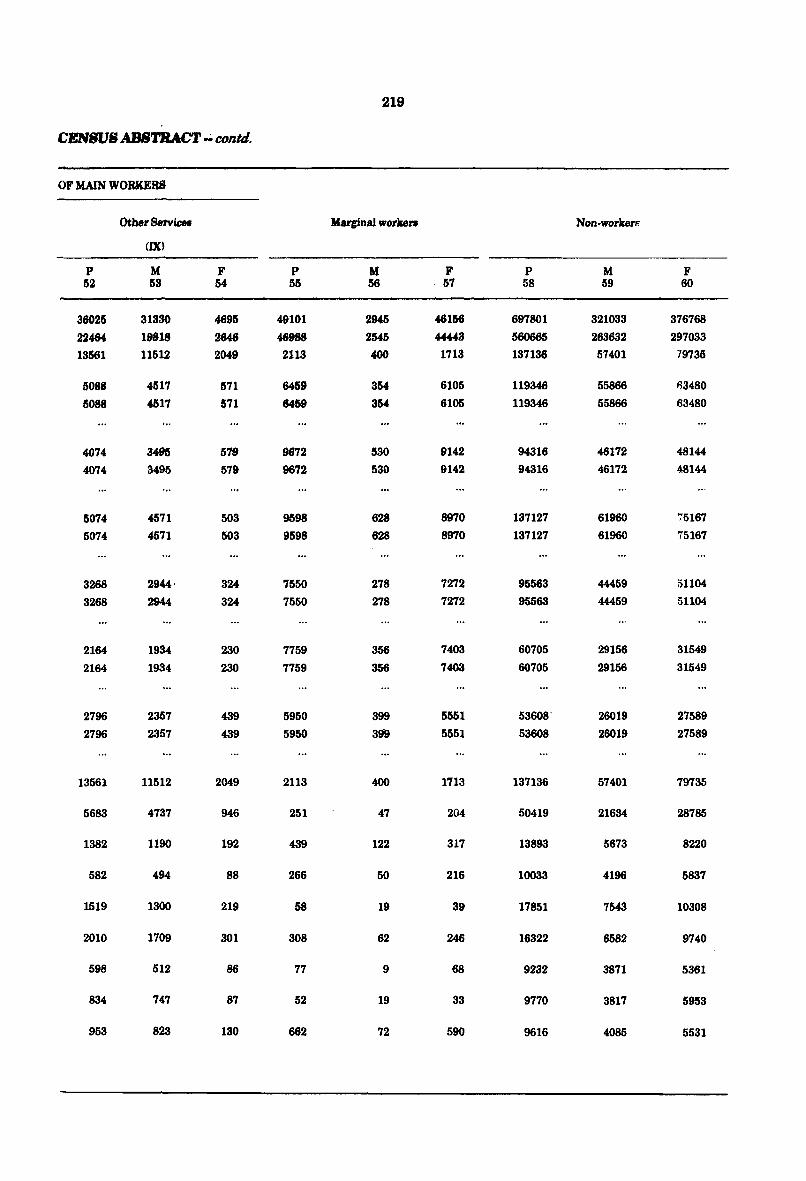
219
CENBV8 ABSTRACT..; contd.
OF MAIN WORKERS
Other 8ervw. Marginal worken Non-workel'!!
(IX)
p M F P M F P M F 52 68 54 56 56 57 58 59 60
36025 31330 4695 49101 2945 46156 697801 321033 376768
22464 19818 2646 46988 2545 44443 560665 263632 297033
13561 11612 2049 2113 400 1713 137136 57401 79735
5088 4517 571 6459 354 6105 119346 55866 1)3480
5088 4517 571 6459 354 6105 119346 55866 63480
4074 3495 519 9672 530 9142 94316 46172 48144
4074 3495 579 9672 530 9142 94316 46172 48144
5074 4571 503 9598 628 8970 137127 61960 75167
5074 4571 503 9598 628 8970 137127 61960 75167
3268 2944· 324 7550 278 7272 95563 44459 51104
3268 2944 324 7550 278 7272 95563 44459 51104
2164 1934 230 7759 356 7403 60705 29156 31549
2164 1934 230 7759 356 7403 60705 29156 31549
2796 2357 439 5950 399 5551 53608' 26019 27589
2796 2357 439 5950 399 5551 53608 26019 27589
13561 11512 2049 2113 400 1713 137136 57401 79735
5683 4737 946 251 47 204 50419 21634 28785
1382 1190 192 439 122 317 13893 5673 8220
582 494 88 266 50 216 10033 4196 5837
1519 1300 219 58 19 39 17851 7543 10308
2010 1709 301 308 62 246 16322 6582 9740
598 512 86 77 9 68 9232 3871 5361
834 747 87 52 19 33 9770 3817 5953
953 823 130 662 72 590 9616 4085 5531
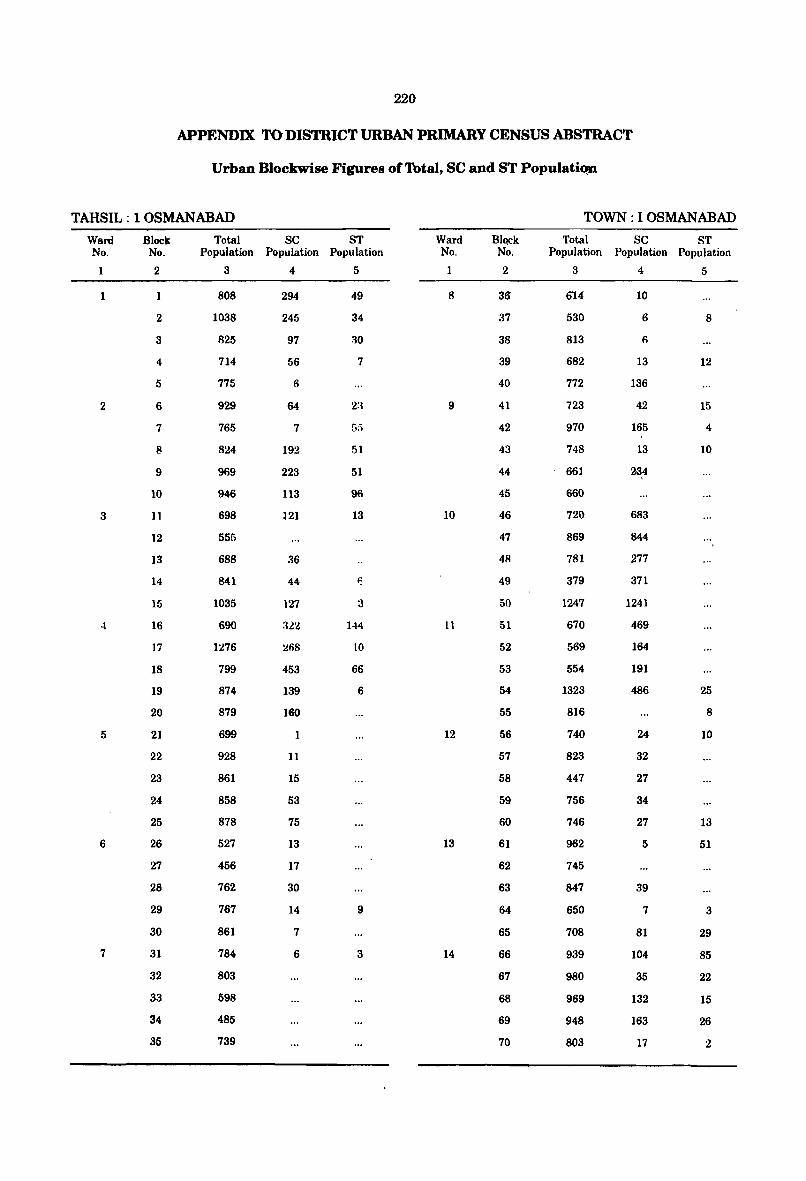
220
APPENDIX TO DISTRICT URBAN PRIMARY CENSUS ABSTRACT
Urban Blockwise Figures of Total, SC and ST PopulatiQll
TAHSIL: 1 OSMANABAD TOWN: IOSMANABAD
Ward No.
1
2
3
5
6
7
Block No.
2
1
2
3
4
5
6
7
8
9
10
11
12
13
14
15
16
17
18
19
20
21
22
23
24
25
26
27
28
29
30
31
32
33
34
35
Total Population
3
808
1038
825
714
775
929
765
824
969
946
698
555
688
841
1035
690
1276
799
874
879
699
928
861
858
878
527
456
762
767
861
784
803
598
485
739
SC ST Population Population
4 5
294
245
97
56
6
64
7
192
223
113
121
36
44
127
:ll2
268
453
139
160
1
11
15
53
75
13
17
30
14
7
6
49
34
30
7
51
51
96
13
E
3
l-l4
10
66
6
9
3
Ward No.
1
8
9
10
11
12
13
14
BlQCk No.
2
36
37
38
39
40
41
42
43
44
45
46
47
4R
49
50
51
52
53
54
55
56
57
58
59
60
61
62
63
64
65
66
67
68
69
70
Total Population
3
614
530
813
682
772
723
970
748
661
660
720
869
781
379
1247
670
569
554
1323
816
740
823
447
756
746
962
745
847
650
708
939
980
969
948
803
SC ST Population Population
4 5
10
6
6
13
136
42
165
13
23,4
683
844
277
371
1241
469
164
191
486
24
32
27
34
27
5
39
7
81
104
35
132
163
17
8
12
15
4
10
25
8
10
13
51
3
29
85
22
15
26
2
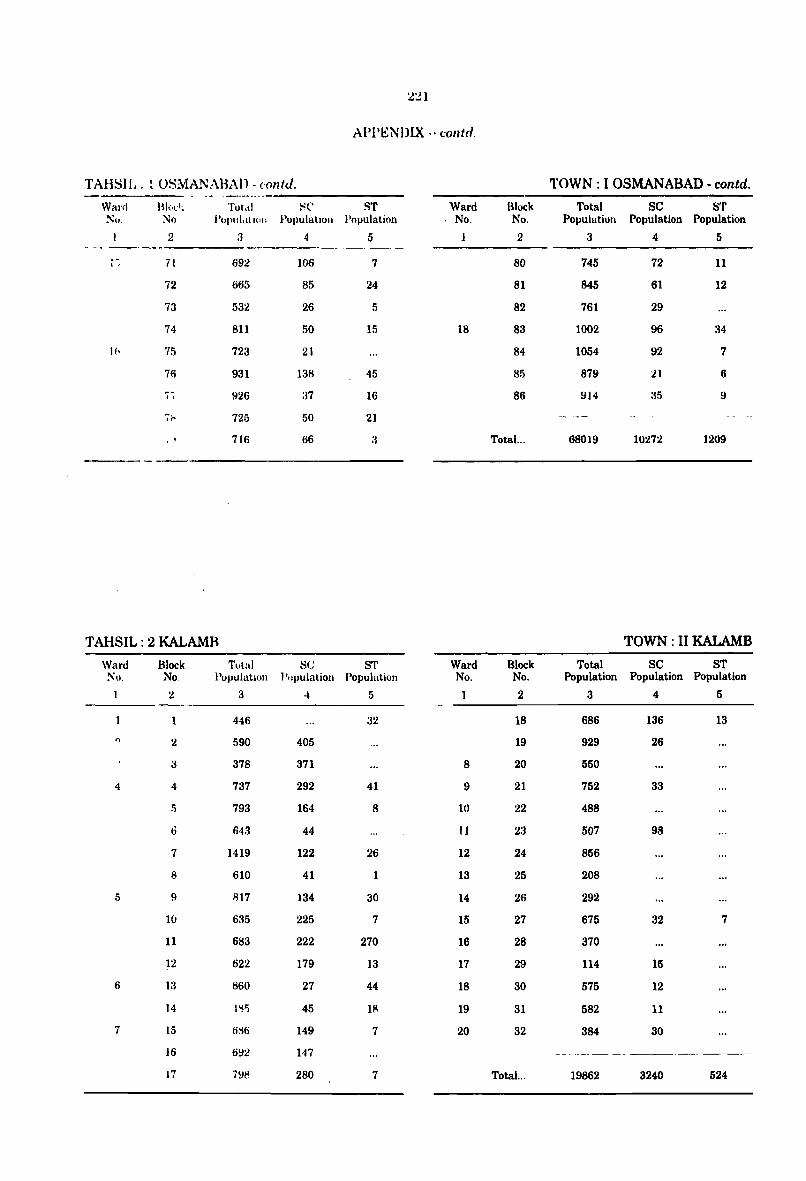
~:.n
APPb:NDIX .. c.:olltd.
TAHSIL. t OSMA.NABAn· ('Ontd. TOWN: I OSMANABAD - contd. . - ,_.-.......
Ward Bh"l·" Tot.11 HC ST Ward Block Total SC ST ,!'o;'". ~o J·()pttl.1I ,(II, PopulatIOn Population No. No. Population Population Population
2 :1 4 5 2 3 -4 5 - ---------
, " il 692 106 7 80 745 72 11 I,
72 665 85 24 81 845 61 12
73 532 26 5 82 761 29
74 811 50 15 18 83 1002 96 34
11' 75 723 21 84 1054 92 7
76 931 138 45 85 879 :ll 6
~. 926 37 16 86 914 35 9 j,
7~ 725 50 21
. I 716 66 3 Total... 68019 10272 ]209
TAHSIL: 2 KALAMR TOWN: II KALAMB Ward Block Total He ST Ward Block Total SC S1'
:!'\u. No. PopulatIOn I 'tlpulation Population No. No. Population Population Population
2 3 4 5 2 3 4 5
446 32 18 686 136 13
" 2 590 405 19 929 26
3 378 371 8 20 550
4 4 737 292 41 9 21 752 33
!l 793 164 8 10 22 488
6 643 44 11 23 507 98
7 1419 122 26 12 24 856
8 610 41 1 13 25 208
5 9 HI7 134 30 14 26 292
1(1 635 225 7 15 27 675 32 7
11 683 222 270 16 28 370
12 622 179 13 17 29 114 15
6 13 860 27 44 18 30 575 12
14 I'll) 45 III 19 31 582 11
7 15 tiS6 149 7 20 32 384 30
16 692 147 _._-,
17 798 280 7 Total ... 19862 3240 524
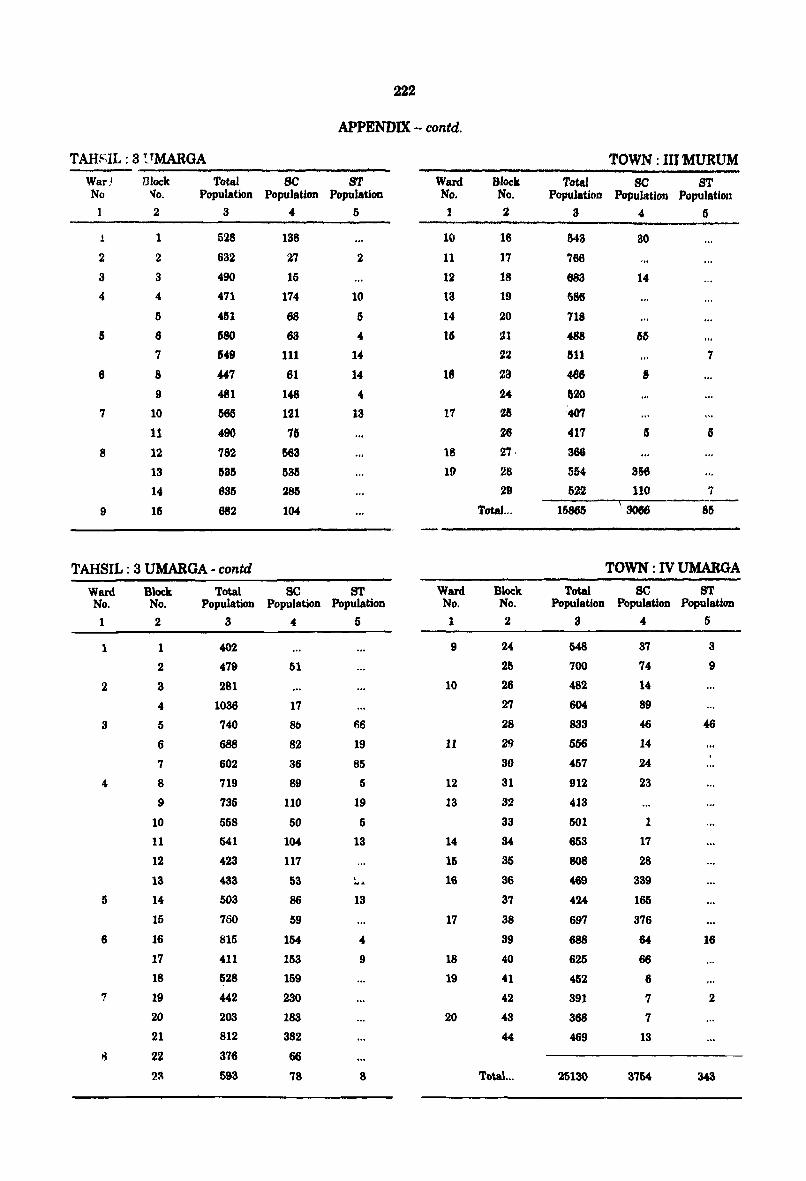
222
APPENDIX -- contd.
TAHF>II..: 3 ~TMARGA TOWN: III MURUM War! mock Total Be ST Ward Block Total Be ST No ~o. Population Population Population No. No. Population Population Populatioll
1 2 3 4 5 1 2 3 4 5
1 1 528 138 10 16 &43 ao 2 2 632 27 2 11 17 786
3 3 490 15 12 18 683 14
4 4 471 174 10 13 19 586
5 461 68 5 14 20 718
6 6 680 63 4 15 III 488 65 7 549 111 14 22 511 7
6 8 447 61 14 18 23 466 8
9 481 148 4 24 &20
7 10 565 121 13 17 25 '407
11 490 76 2(i 417 IS 6
8 12 182 563 18 27, 366
13 535 535 19 28 554 366
14 635 285 29 622 110 7
\ 3066 ---9 15 682 104 Total ... 16865 85
TAHSIL: 3 UMARGA - contd TOWN: IV UMARGA
Ward Block Total SC ST Ward Block Total 8C ST No. No. Population Population Population No. No. Population Population Population
1 2 3 4 5 1 2 3 4 5
1 1 402 9 24 548 37 3
2 479 51 25 700 74 9
2 3 281 10 26 482 14
4 1036 17 27 604 89
3 5 740 8& 66 28 833 46 46
6 688 82 19 11 29 556 14
7 602 36 85 30 457 24
4 8 719 89 5 12 31 912 23
9 735 110 19 13 32 413
10 558 50 5 33 501 1
11 541 104 13 14 34 653 17
12 423 117 15 35 808 28
13 433 53 , 16 36 469 339 ~ ...
5 14 503 86 13 37 424 165
15 780 59 17 38 697 376
6 16 815 154 4 39 688 64 16
17 411 153 9 18 40 625 66
18 528 159 19 41 452 6
7 19 442 230 42 391 7 2
20 203 183 20 43 368 7
21 812 382 44 469 13
22 376 66
2:\ 593 '8 8 Total ... 25130 3'54 34S
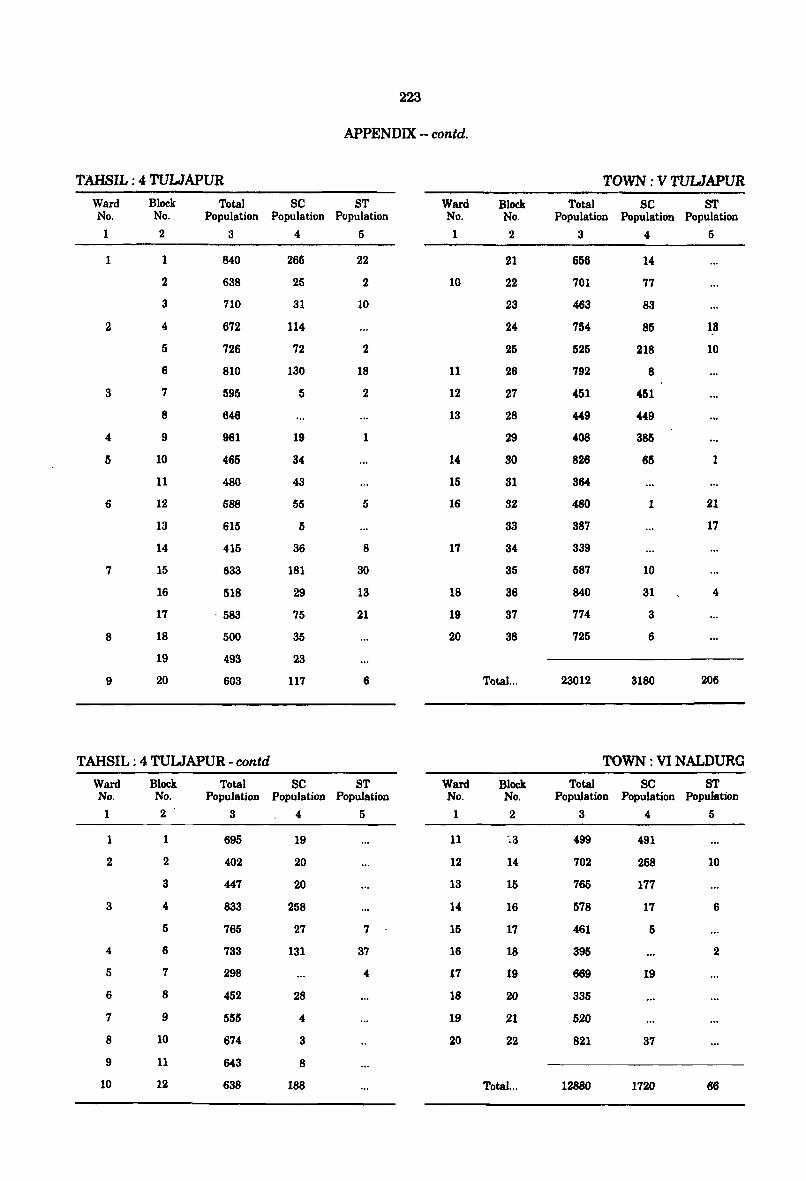
223
APPENDIX -- contd.
TAHSIL: 4 TUWAPUR
Ward No.
t
1
2
3
4
5
6
7
8
9
Block No.
2
1
2
3
4
5
6
7
8
9
10
11
12
13
14
15
16
17
18
19
20
Total se ST Population Population Population
3 4 5
840
638
710
672
726
810
595
646
961
465
480
588
615
415
633
518
. 583
500
493
603
265
25
31
114
72
130
5
19
34
43
55
5
36
181
29
75
35
23
117
22
2
10
2
18
2
1
5
8
30
13
21
6
TAHSIL: 4 TULJAPUR - contd
Ward No.
1
1
2
3
4
5
6
7
8
9
10
Block No.
2
1
2
3
4
5
6
7
8
9
10
11
12
To~l se ST Population Population Population
3 4 5
695
402
447
833
765
733
298
452
555
674
643
638
19
20
20
258
27
131
28
4
3
8
188
7
37
4
Ward No.
1
10
11
12
13
14
15
16
17
18
19
20
Ward No.
1
11
12
13
14
15
16
17
18
19
20
Block No.
2
21
22
23
24
25
26
27
28
29
80
31
32
33
34
35
36
37
38
To~l. ..
Block No. 2
14
15
16
17
18
19
20
21
22
Total ...
TOWN: V TUWAPUR To~l se ST
Population Population Population
3 4 5
656
701
463
754
525
792
451
449
408
826
364
480
387
339
587
840
774
725
23012
14
77
8.1
85
218
8
451
449
385
65
1
10
31
3
6
3180
13
10
1
21
17
4
206
TOWN: VI NALDURG Total se ST
Population Population PopuJstjon
3 4 5
499
702
765
578
461
395
669
335
520
821
12880
491
268
177
17
5
19
37
1720
10
6
2
66
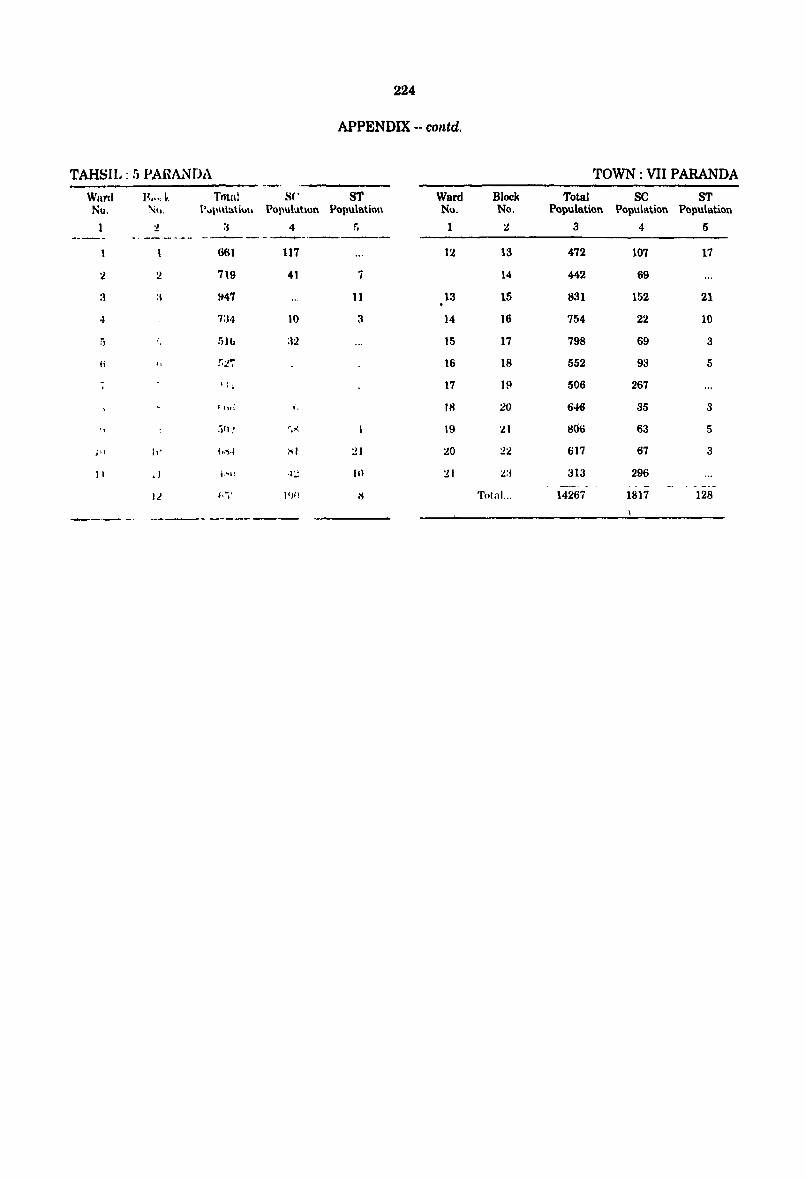
224
APPENDIX -- COlltd,
TAHSIL: ;, PAHAa.,{DA TOWN: VII PARANDA
Ward B,,,,~, 111lnl S(' ST Ward Block Total SC ST Nu. , ... l'''I\IIla\iuh \lol'ul>lt\un Population No, No. Population Population Population
~ a 4 f. 1 :& 3 4 5 -. ---_ .. _- _._--_. __ ._-----
661 117 12 13 472 107 17
'}. ~ 719 41 7 14 442 69
~ :\ !f47 11 13 15 831 152 21
4 7a4 10 3 14 16 754 22 10
:, !illJ :12 15 17 798 69 3
Ii " r.:l~ 16 18 552 93 5
- ,I li 17 ]9 506 267 . • ",i i . 18 20 646 35 3
., :)'l.' '.>\ 19 :.!I B06 63 5
J'l I,' ".':1-1 sl :!I 20 :!'}. 617 67 3
II .1 " ... , , .j:.! III :.!I :.!:j 313 296 - -
It I -. . , I'lll H Total... 14267 1817 128
------ _- -------
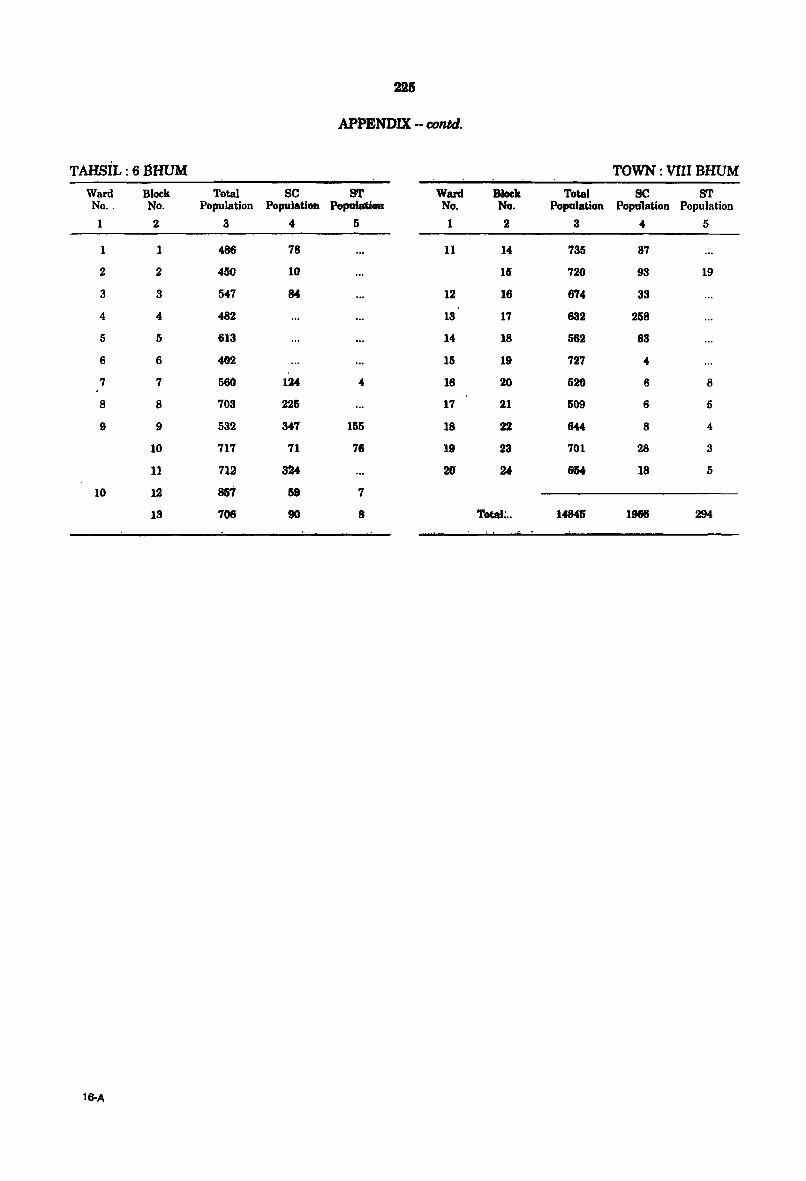
226
APPENDIX -- contd.
TAHSiL: 6 BHUM TOWN: VIII BHUM
Ward Block Total se ST Ward Block Total se ST No .. No. Population Population Population No. No. Population Population Population
1 2 3 4 5 1 2 3 4 5
1 1 486 78 11 14 735 87
2 2 450 10 15 720 93 19
3 3 547 84 12 16 674 33
4 4 482 13 17 632 258
5 5 613 14 18 562 63
6 6 482 15 19 727 4
7 7 560 124 .. 18 20 526 6 8
8 8 703 225 17 21 509 6 5
9 9 532 347 155 18 22 644 8 4
10 717 71 76 19 23 701 28 3
11 712 324 20 24 eM 18 5
10 12 857 59 7
13 706 90 8 TOtal: .. 14845 1968 294
16-A
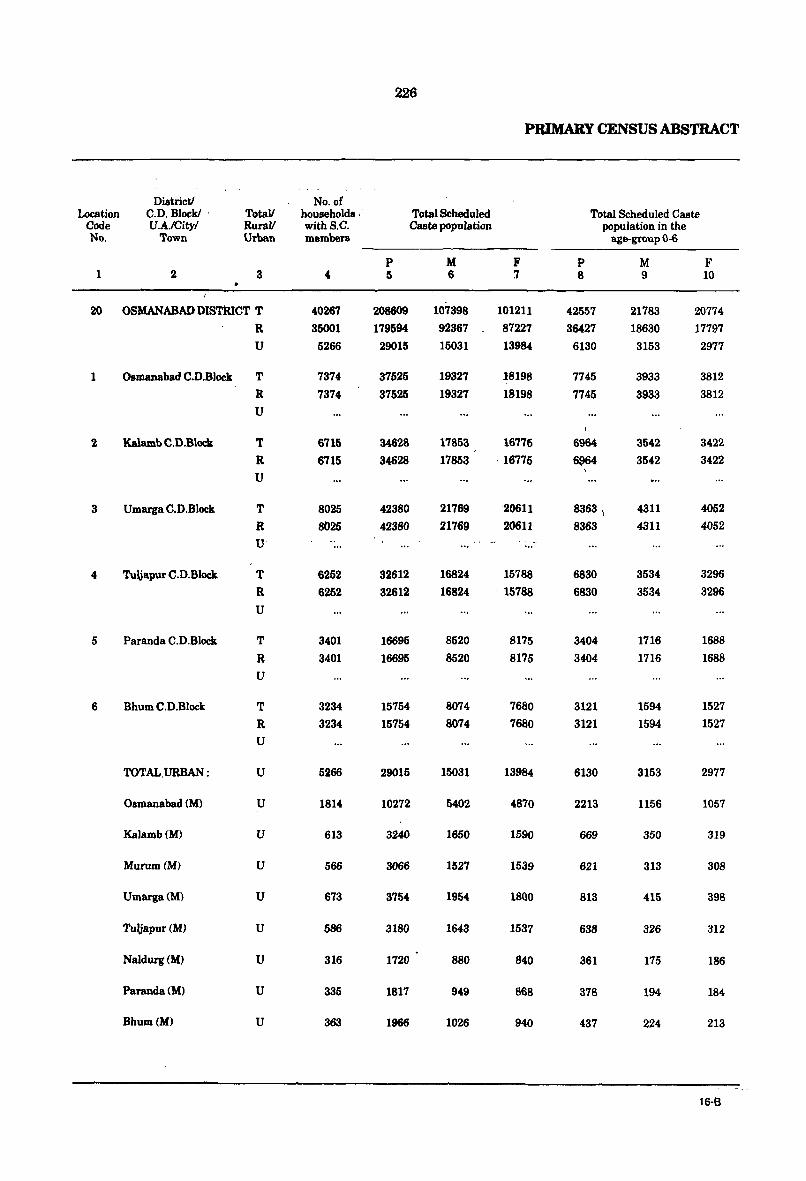
226
PRUKARYCENSUSABSTRACT
Districtl No. of Location C.D. Block! ' TotaV households, . Total Scheduled Total Scheduled Caste
Code U.A./Cityl RuraV with S.C. Caste population population in the No. Town Urban membe1'8 age-group Q-6
p M F P M F 1 2 3 4 5 6 '1 8 9 10
20 OSMANABAD DISTiUCT T 40267 208609 107398 101211 42557 21783 20774 R 35001 179594 92367 87227 36427 18630 17797 U 5266 29015 15031 13984 6130 3153 2977
1 Oamanabad C.D.Block T 7374 37525 19327 18198 7745 3933 3812
R 7374 37525 19327 18198 7745 3933 3812 U
2 Kalamb C.D.Block T 6715 34628 17853 16775 6964 3542 3422
R 6715 34628 17853 ' 16775 ~ 3542 3422 U
3 Umarga C.D.Block T 8025 42380 21769 20611 8363 \ 4311 4052
R 8025 42380 21769 20611 8363 4311 4052
U
4 Tuljapur C.D.Block T 6252 32612 16824 15788 6830 3534 3296
R 6252 32612 16824 15788 6830 3534 3296
U
5 Paranda C.D.Block T 3401 16695 8520 8175 3404 1716 1688
R 3401 16695 8520 8175 3404 1716 1688 U
6 Bhum C.D.Block T 3234 15754 8074 7680 3121 1594 1527
R 3234 15754 8074 7680 3121 1594 1527 U
TOTAL,URBAN : U 5266 29015 15031 13984 6130 3153 2977
Osmanabad (M) U 1814 10272 5402 4870 2213 1156 1057
Kalamb(M) U 613 3240 1650 1590 669 350 319
Murum(M) U 566 3066 1527 1539 621 313 308
Umarga(M) U 673 3754 1954 1800 813 415 398
Tuljapur (M) U 586 3180 1643 1537 638 326 312
Naldurg(M) U 316 1720 880 840 361 175 186
Paranda(M) U 335 1817 949 868 378 194 184
Bhum(M) U 363 1966 1026 940 437 224 213
16-8
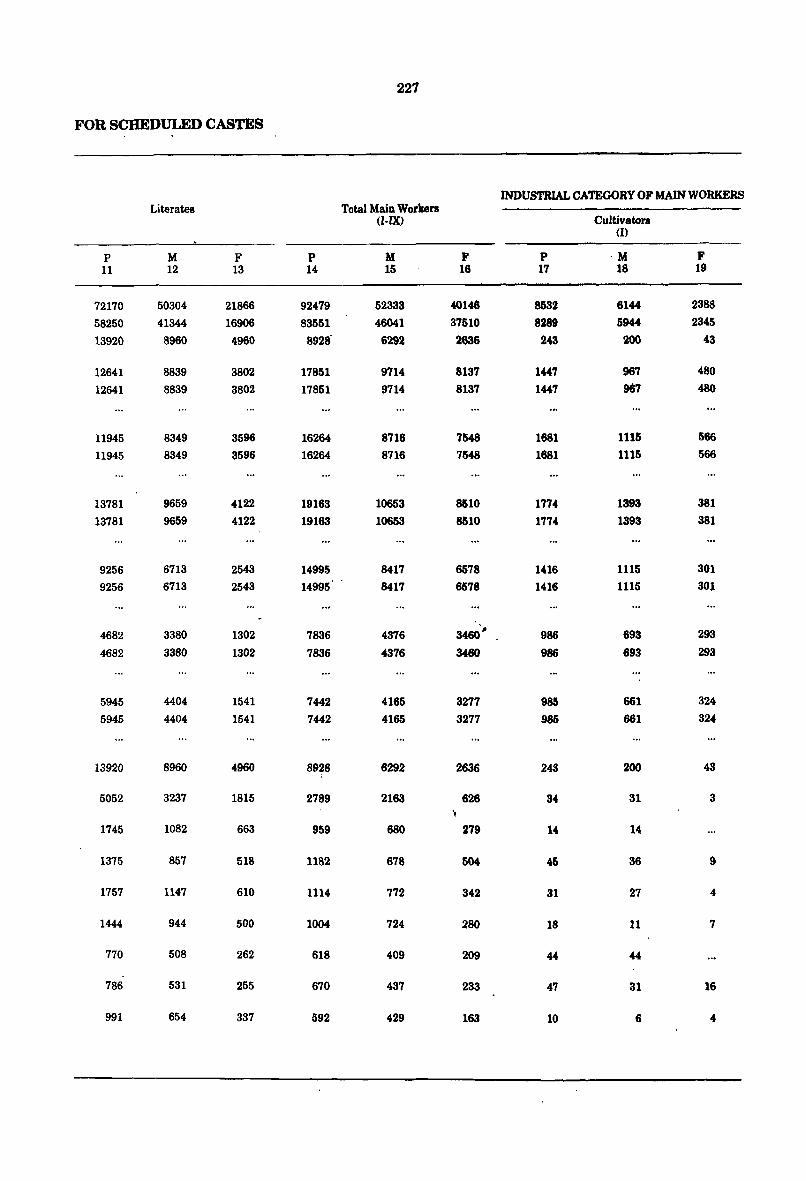
227
FOR SCHEDULED CASTES
INDUSTRIAL CATEGORY OF MAIN WORKERS Literates Total Main Workers
(I·IX) Cultivators (I)
p M F P M F P -M F 11 12 13 14 15 16 17 18 19
72170 50304 21866 92479 52333 40146 8532 6144 2388
58250 41344 16906 83551 46041 37510 8289 5944 2345
13920 8960 4960 8928' 6292 2636 243 200 43
12641 8839 3802 17851 9714 8137 1447 967 480
12641 8839 3802 17851 9714 8137 1447 967 480
11945 8349 3596 16264 8716 7548 1681 111& 566
11945 8349 3596 16264 8716 7548 1681 1115 566
13781 9659 4122 19163 10653 8&10 1774 1393 381
13781 9659 4122 19163 10653 8&10 1774 1393 381
9256 6713 2543 14995 8417 6578 1416 1115 301
9256 6713 2543 14995 8417 6578 1416 1115 301
4682 3380 1302 7836 4376 3460' .. 986 693 293
4682 3380 1302 7836 4376 3460 986 693 293
5945 4404 1541 7442 4165 3277 985 661 324
5945 4404 1541 7442 4165 3277 985 661 324
13920 8960 4960 8928 6292 2636 243 200 43
5052 3237 1815 2789 2163 626 34 31 3
1745 1082 663 959 680 279 14 14
1375 857 518 1182 678 504 45 36 9
1757 1147 610 1114 772 342 31 27 4
1444 944 500 1004 724 280 18 11 7
770 508 262 618 409 209 44 44
786 531 255 670 437 233 47 31 16
991 654 337 592 429 163 10 6 4
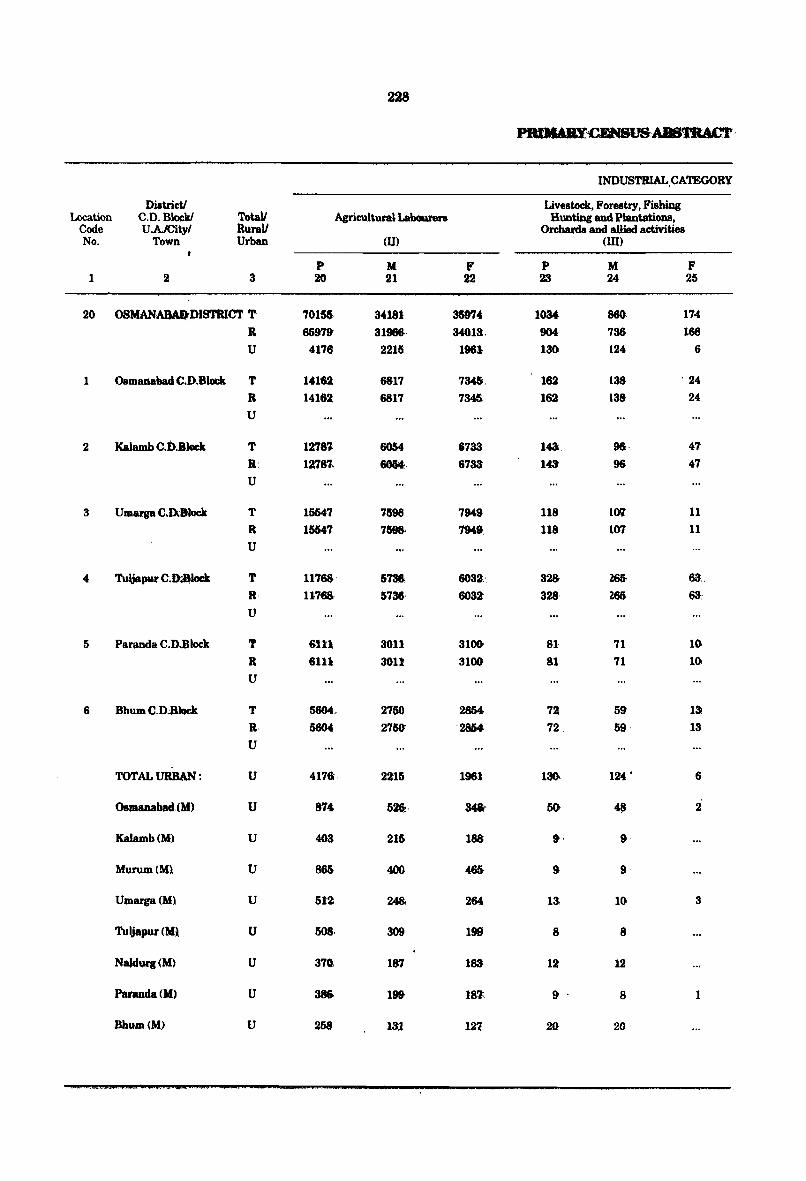
228
PRDUBY£EN8lJSAII8TItACT,
INDUSTRIAL.CATEGORY
District! Livestock, Forestry, Fisbing Location C.D. Block! Total! Agricultural Labourera Hunting and PlamatiODB,
Code U.AJCityl Rurall Orchards and allied activities No. Town Urban (ll) (III)
P M F P M F 1 2 3 20 21 22 23 24 25
20 OSMANA8A.Q'DISTRICT T 70155 34181 35974 10M 86(): 174
B 65979" 31966. 34013', 904 736 168 U 4176 2216 1961, lao. 124 6
1 o.manabad C.D.Block T 14162. 6817 7345;, 163 138 ' 24
R 1416a 6817 7346 163 138 24
U
2 Kalamb C.D.Block T 12'78'1: 6054 8733 143;, 96 47'
R: 12'781, 6O&1l. 6733', 143' 96 47 U
3 Umarga C.D-Block T 15M7 71598 7949 118 loq 11
R 15547 759& 794. 118 107 11
U
4 Tuljapur C.DlQloek T 11768, 5736, 6032,', 32& & 63,
R, 1176& 5736', 6032' 328· ~65 63:
U
5 Paraada C.D.Block 'f 6U1 3011 3100 81 71 10.
R 6111 aou 3100 81 71 lo. U
6 Bhum C.D;Bloek T 15604, 2750 2854 72 59 13 R, 5604 2750 '2864 72 59, 13
U
TOTAL URBAN : U 4176, 2215 1961 lao. 124 • 6
08manabaci,(M) U 874 52&. 3481, 50. 4$ 2
Kalamb(M) U 403 215< 188 9, 9'
Murum(M) U 865 400 465 9 9
Umarga(M) U 512 24& 264 13, 10 3
Tuljapur (Ml U 508, 309 199 8 8
Naldurg(M) U 370 187 183 12 12
Paranda(M) U as. I. 1&1; 9 8 1
Bhum(M) U 258 131 12'1 2Q 20
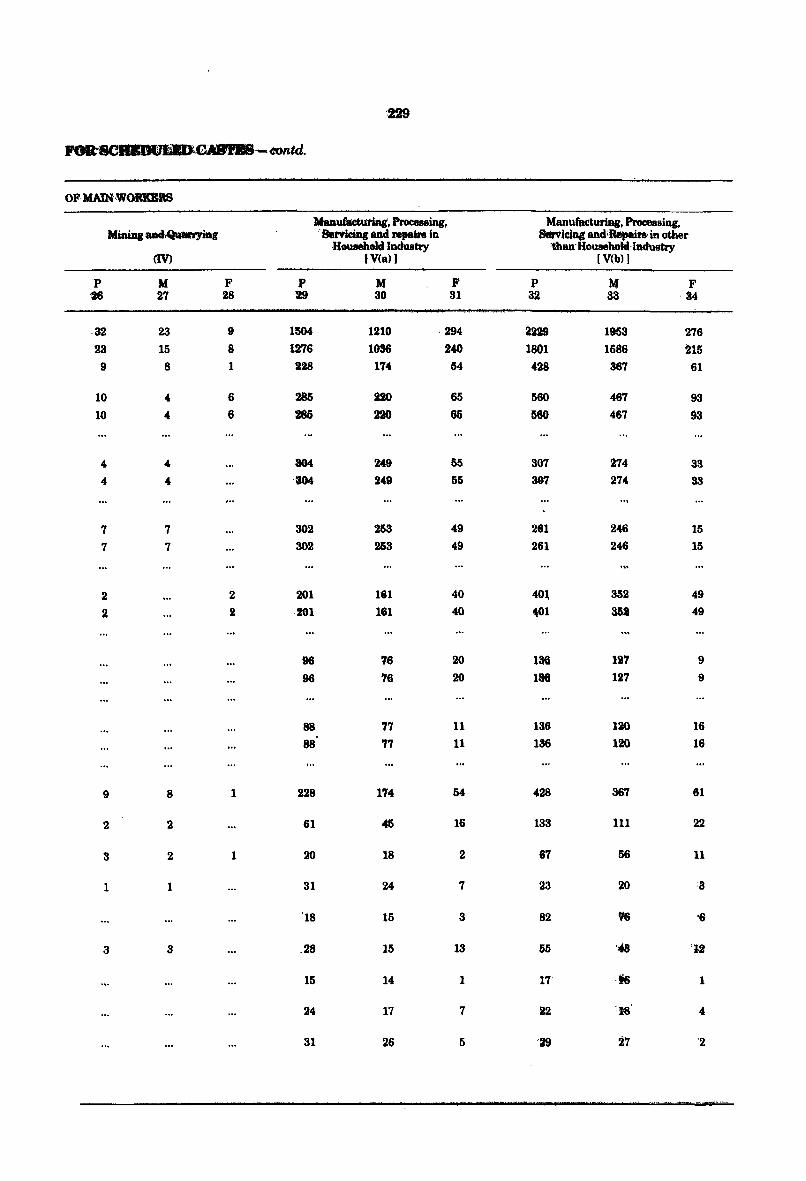
'229
P81t8C~:GMft'JI8·-eontd.
OF MA1NWORKBllS
Manufaeturing, Proceaeing, ManUfacturiar, Procesaing, MiaiDr~g 'Serriclng and Npain in Sevicing and'ae.,ai1'8'ift other
Household Industry 'than'Houaehokl· Iftclustry (IV) IV(a) ) [V(b»)
p M F P M F P M F '26 27 28 29 30 31 32 33 34
32 23 9 15&4 1210 ·294 2229 1953 276 23 15 8 1276 1036 240 1801 1586 215
9 8 1 228 114 54 428 367 61
10 4 6 285 220 65 560 467 93 10 4 6 285 220 65 560 467 93
4 " 3G4 249 55 307 274 33 4 " ,894 249 55 301 214 33
7 7 302 253 49 281 246 15
7 7 302 253 49 261 246 15
2 2 201 1tU 40 40~ 352 49
2 2 201 161 40 4\{)1 SQ 49
96 16 20 136 117 9
96 '16 20 186 127 9
88 77 11 136 lao 16
88 '17 11 136 120 16
9 8 1 228 174 54 428 367 61
2 2 61 4S 16 133 III 22
3 2 1 20 18 2 67 56 11
1 1 31 24 7 23 20 :3
'18 15 3 82 ~ '6
3 3 .28 15 13 55 '48 '12
15 14 1 17 ·16 1
24 17 7 22 '18 4
31 26 5 '29 27 2
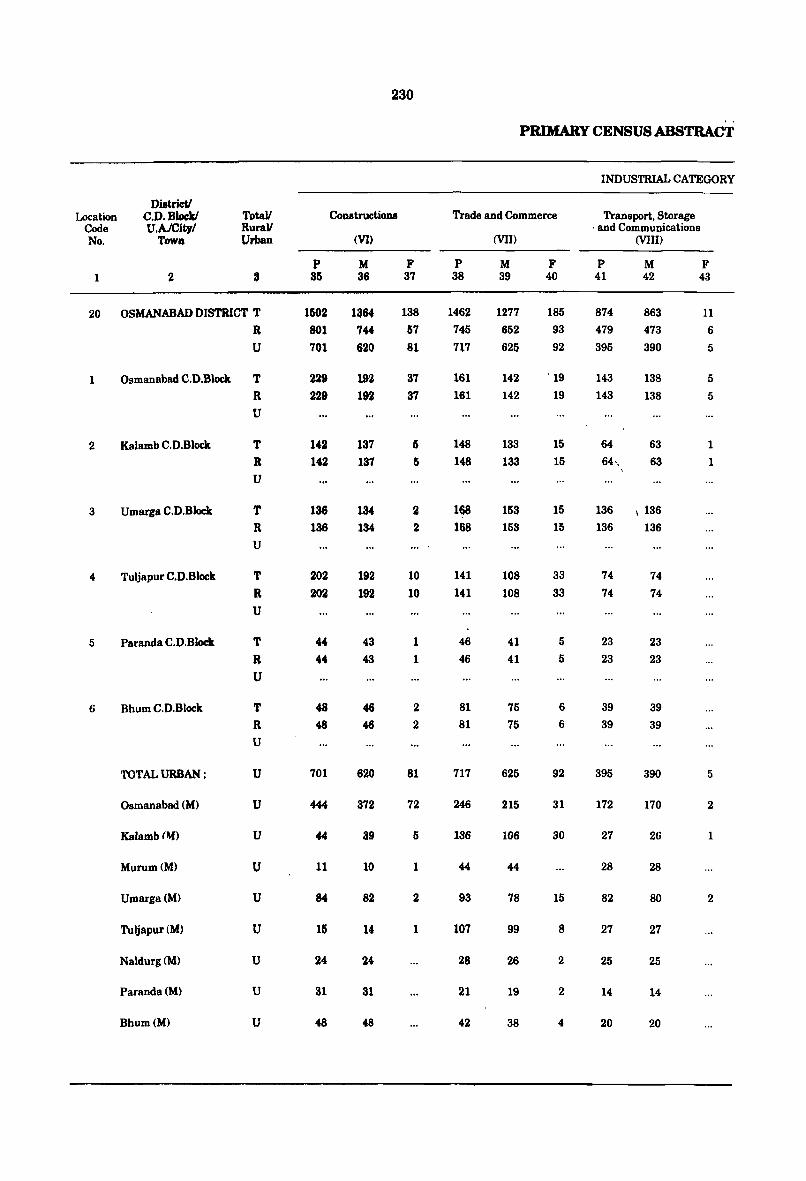
230
PRDKARYCENSUSABSTRACT
INDUSTRIAL CATEGORY
Di8trietl Location C.D. BlockI TotaJI Conatructiona Trade and Commerce Transport, Storage
Code U.AJCityl Rurall . and Communications No. Tcnm Urban (VI) (VII) (VIII)
P M F P M F P M F 1 2 3 35 36 37 38 39 40 41 42 43
20 OSMANABAD DISTRICT T 1502 1364 138 1462 1277 185 874 863 11
R 801 7" 57 745 652 93 479 473 6
U 701 620 81 717 625 92 395 390 5
1 Osmanabad C.D.Block T 229 192 37 161 142 ' 19 143 138 5 R 229 192 37 161 142 19 143 138 5 U
2 Kalamb C.D.Block T 142 137 5 148 133 15 64 63 1 R 142 131 5 148 133 15 64" 63 1 U
3 Umarga C.D.Block T 136 134 2 168 153 15 136 \ 136 R 136 134 2 168 153 15 136 136 U
4 Tuljapur C.D.Block T 202 192 10 141 108 33 74 74
R 202 192 10 141 108 33 74 74 U
5 Paranda C.D.BIock T 44 43 1 46 41 I) 23 23
R 44 43 1 46 41 5 23 23
U
6 Bhum C.D.Block T 48 46 2 81 75 6 39 39 R 48 46 2 81 75 6 39 39 U
TOTAL URBAN ; U 701 620 81 717 625 92 395 390 5
Osmanabad (M) U 444 372 72 246 215 31 172 170 2
Kalamb(~) U 44 39 5 136 106 30 27 26 1
Murum(M) U 11 10 1 " 44 28 28
Umarga(M) U 84 82 2 93 78 15 82 80 2
Tuljapur (M) U 15 14 1 107 99 8 27 27
Naldurg(M) U 24 24 28 26 2 25 25
Paranda(M) U 31 31 21 19 2 14 14
Bhum(M) U 48 48 42 38 4 20 20
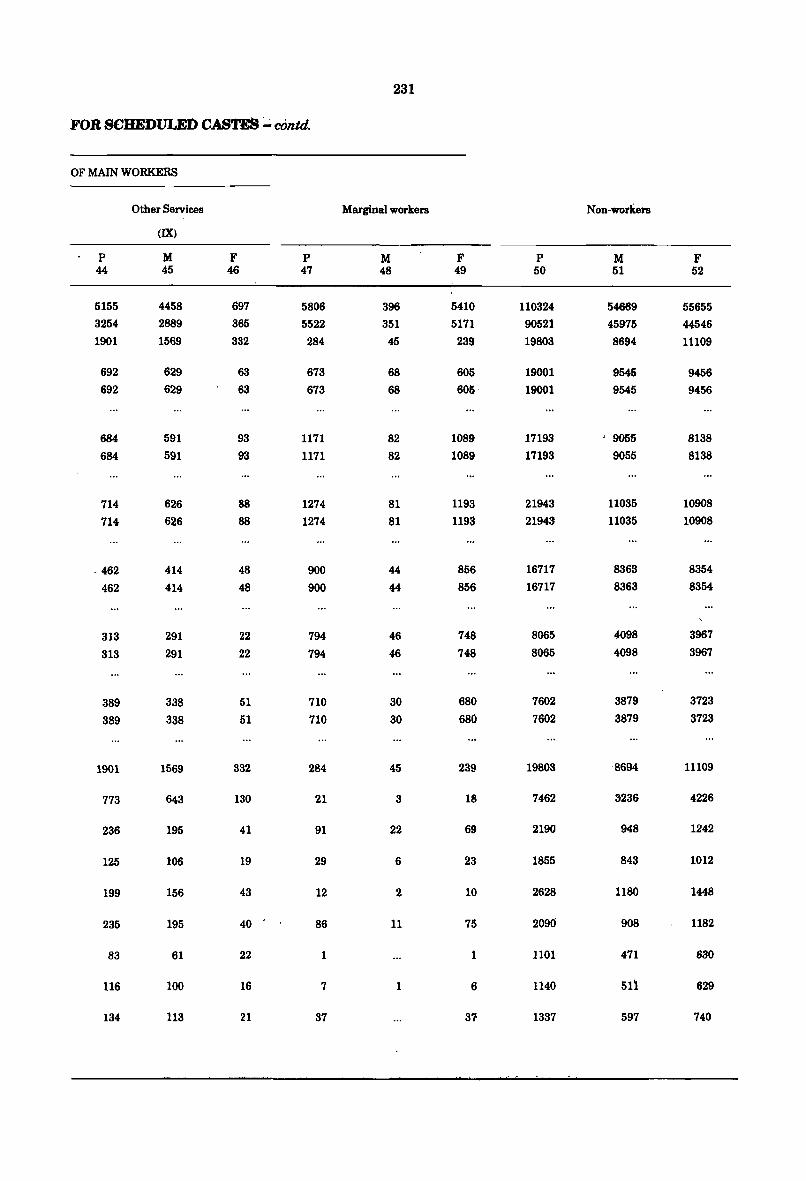
231
FOR SCHEDULED CASTES ~ c6ntd.
OF MAIN WORKERS
Other Services Marginal workers Non-workers
(IX)
p M F P M F P M F 44 45 46 47 48 49 50 51 52
5155 4458 697 5806 396 5410 110324 54669 55655 3254 2889 365 5522 351 5171 90521 45975 44546 1901 1569 332 284 45 239 19803 8694 11109
692 629 63 673 68 605 19001 9545 9456 692 629 63 673 68 605 19001 9545 9456
684 591 93 1171 82 1089 17193 ' 9055 8138
684 591 93 1171 82 1089 17193 9055 8138
714 626 88 1274 81 1193 21943 11035 10908
714 626 88 1274 81 1193 21943 11035 10908
·462 414 48 900 44 856 16717 8363 8354
462 414 48 900 44 856 16717 8363 8354
313 291 22 794 46 748 8065 4098 3967
313 291 22 794 46 748 8065 4098 3967
389 338 51 710 30 680 7602 3879 3723
389 338 51 710 30 680 7602 3879 3723
1901 1569 332 284 45 239 19803 ·8694 11109
773 643 130 21 3 18 7462 3236 4226
236 195 41 91 22 69 2190 948 1242
125 106 19 29 6 23 1855 843 1012
199 156 43 12 2 10 2628 1180 1448
235 195 40 86 11 75 2090 908 1182
83 61 22 1 1 1101 471 630
116 100 16 7 1 6 1140 511 629
134 113 21 37 3'1 1337 597 740
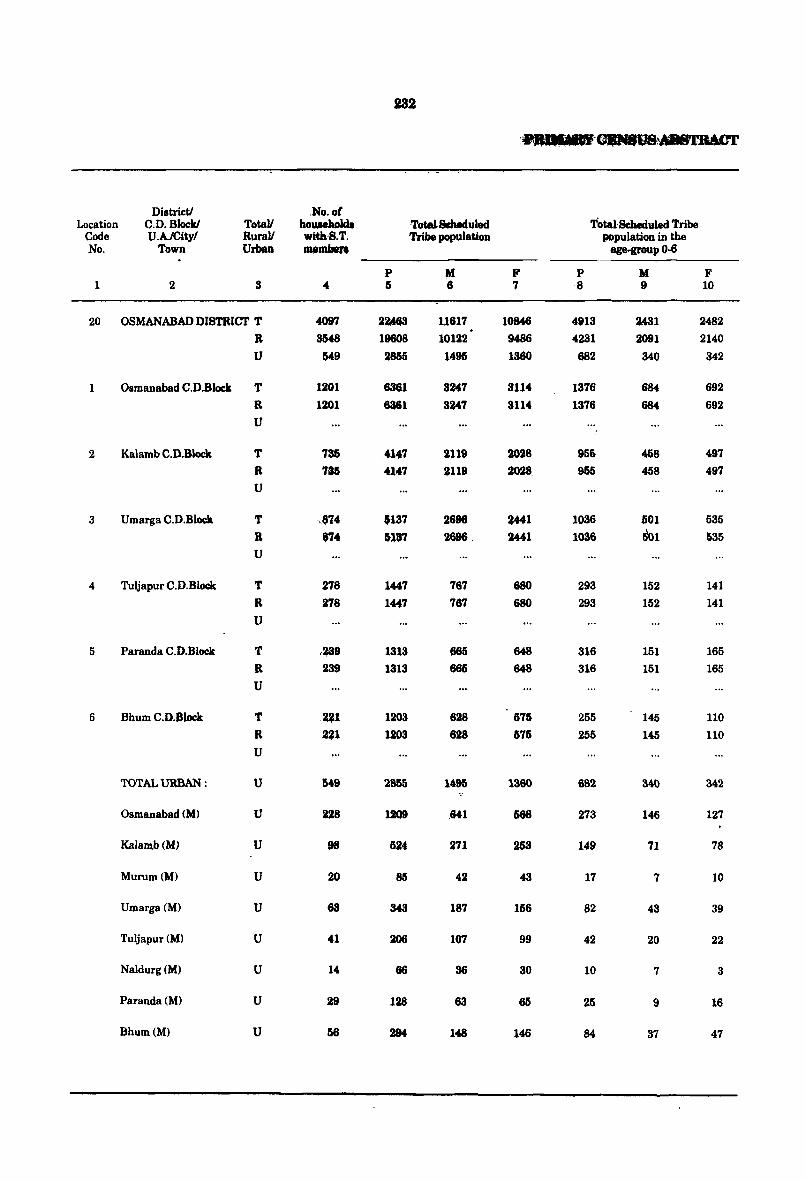
132
District/ .No.of Location C.D. Block! Totall houaeholda Tot.e18cl1eduled Total'Sc:bedllled Tribe
Code U.A/City/ Rural! with·S.T. Tribe population population in the No. Town Urban IDItmbeR age..group 0-6
P '" F P M F 1 2 3 4 5 6 7 ,8 9 10
20 OSMANABAD DISTRICT T 4097 2~ US17 10846 4913 2A31 2482
R 8548 19608 10122 H86 4231 2091 2140
U 549 2855 1495 1360 682 340 342
1 Osmanabad C.D.Block T 1201 6361 3247 3U4 1376 684 692
R 1201 6361 3247 3114 1376 684 692
U
2 Kalamb C.D.Block T 735 .41.7 2119 2028 955 458 497 R 735 4147 2119 2028, 955 458 497
U
3 Umarga C.D.Block T ,$'14 ,137 2696 a441 1036 ~Ol 535
R 874 $131 2696 , 2441 1036 501 535
U
4 Tuljapur C.D.Block T 278 1447 167 680 293 152 141 R 278 1447 767 680 293 152 141
U
5 Paranda C.D.Block T ,~9 1313 665 648 316 151 165 R 239 131S 665 648 316 151 165
U
6 Bhum C.D.Block T .~1 120S 828 575 255 145 110 R 221 120S 828 575 255 145 110 U
TOTAL URBAN : U 549 28&5 1495 1360 682 340 342
Osmanabad (M) U 228 1209 .641 568 273 146 127
Kala:mb{M) U 98 524 271 253 149 71 78
Murum(M) U 20 85 42 43 17 7 10
Umarga(M) U 68 :US 187 156 82 43 39
Tuljapur (M) U 41 206 107 99 42 20 22
Naldurg(M) U 14 66 36 30 10 7 3
Paranda(M) U 29 128 63 65 25 9 16
Bhum(M) U 58 294 148 146 84 37 47
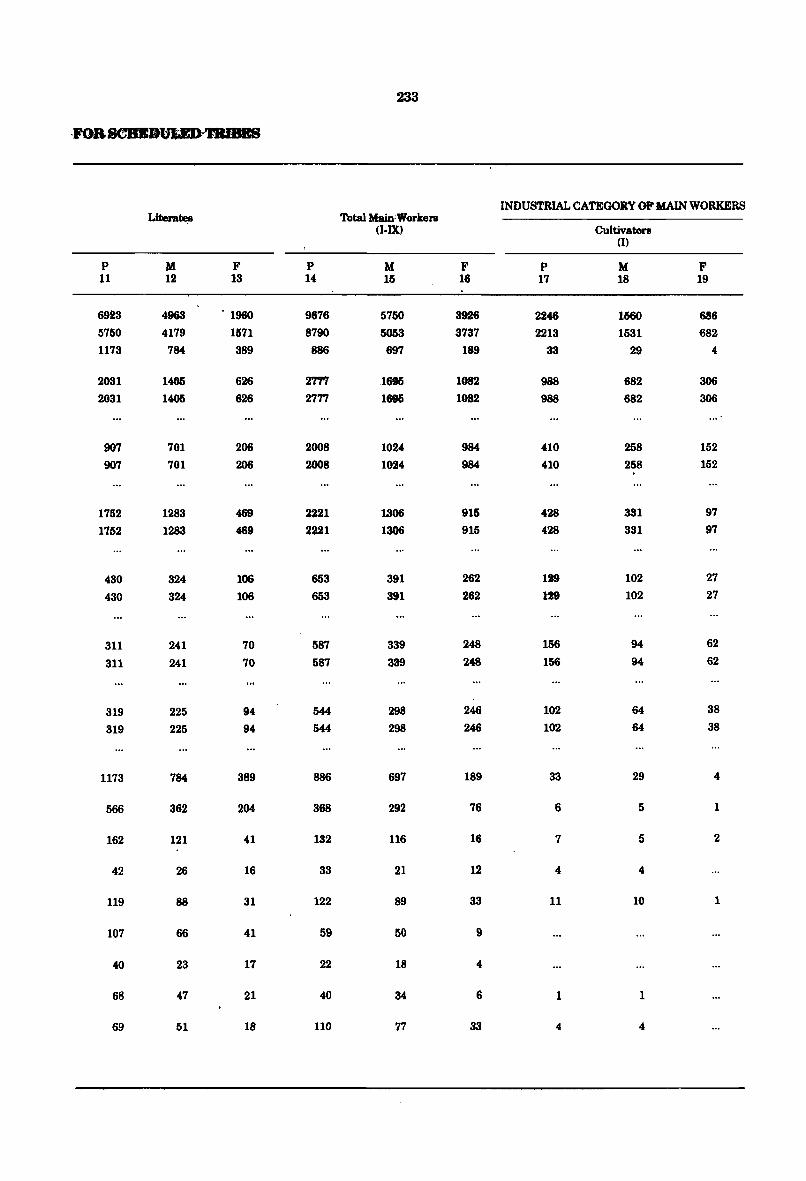
233
INDUSTRIAL CATEGORY OF MAIN WORKERS Litera~ Total Main'Workers
(I-IX) Cultivators (I)
p M F P M F P M F 11 12 13 14 15 16 17 18 19
6923 49&3 . 1960 9676 5750 3926 2246 1560 686
5750 4179 1571 8790 5053 3737 2213 1531 682 1173 784 389 886 697 189 33 29 4
2031 1405 626 271'1 1696 1082 988 682 306
2031 1405 626 2777 1696 1082 988 682 306
907 701 206 2008 1024 984 410 258 152
907 701 206 2008 1024 984 410 258 152
1752 1283 469 2221 1306 915 428 331 97
1752 1283 469 2221 1306 915 428 331 97
430 324 106 653 391 262 lzg 102 27
430 324 106 653 391 262 129 102 27
311 241 70 587 339 248 156 94 62
311 241 70 587 339 248 156 94 62
319 225 94 544 298 246 102 64 38
319 225 94 544 298 246 102 64 38
1173 784 389 886 697 189 33 29 4
566 362 204 368 292 76 6 5 1
162 121 41 132 116 16 7 5 2
42 26 16 33 21 12 4 4
119 88 31 122 89 33 11 10 1
107 66 41 59 50 9
40 23 17 22 18 4
68 47 21 40 34 6 1 1
69 51 18 110 77 33 4 4
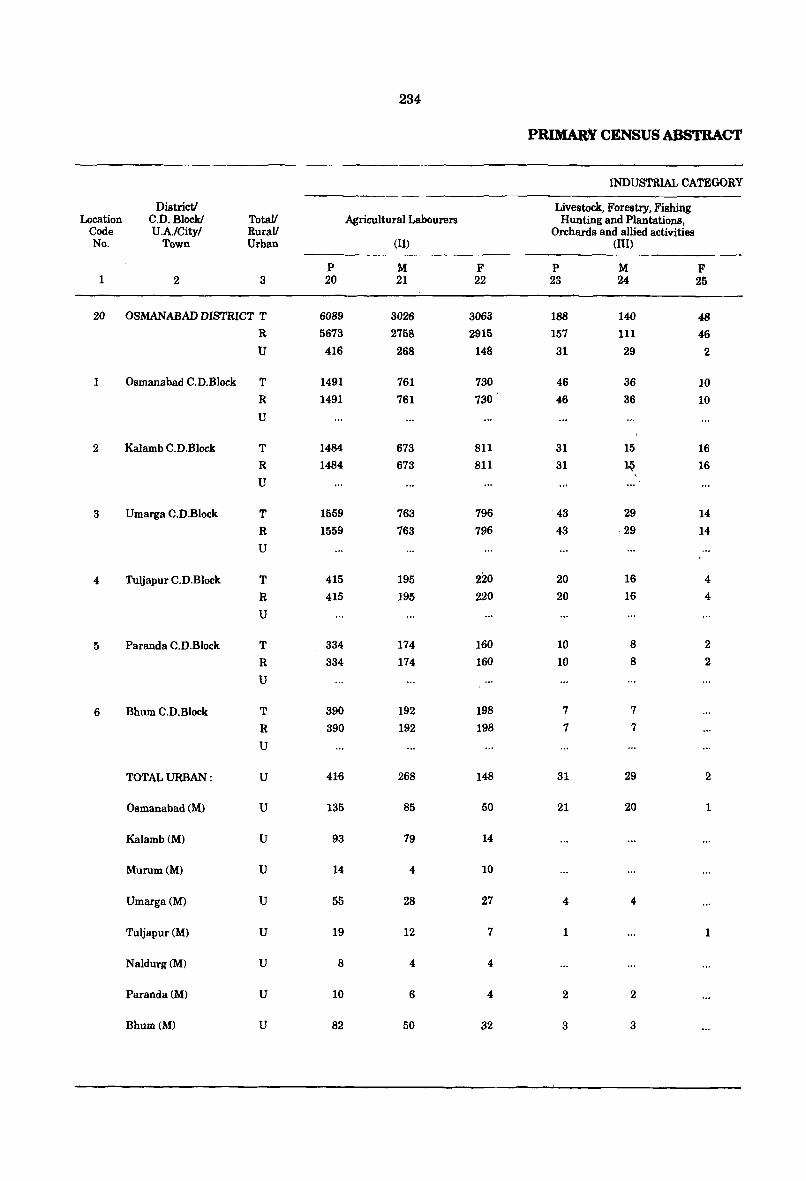
234
PRnKARYCENSUSABsTRACT
INDUSTRIAL CATEGORY
Districtl Livestock, Forestry, Fishing Location C.D. Block! TotaV Agricultural Labourers Hunting and Plantations,
Code U.A./City/ RuraV Orchards and allied activities No. Town Urban (II) (III)
p M F P M F 1 2 3 20 21 22 23 24 25
20 OSMANABAD DISTRICT T 6089 3026 3063 188 140 48
R 5673 2758 2915 157 111 46 U 416 268 148 31 29 2
1 Osmanabad C.D.Block T 1491 761 730 46 36 10 R 1491 761 730 .6 36 10 U
2 Kalamb C.D.Block T 1484 673 811 31 15 16 R 1484 673 811 ' 31 1Q 16
U
3 Umarga C.D.Block T 1559 763 796 43 29 14
R 1559 763 796 43 -29 14
U
4 Tuljapur C.D.Block T 415 195 220 20 16 4
R 415 195 220 20 16 4
U
5 Paranda C.D.Block T 334 174 160 10 8 2
R 334 174 160 10 Ii! 2
U
6 Bhum C.D.Block T 390 192 198 7 7
R 390 192 198 7 7
U
TOTAL URBAN : U 411) 268 148 31 29 2
Osmanabad (M) U 135 85 50 21 20 1
Kalamb(M) U 93 79 14
Murum(M) U 14 4 10
Umarga(M) U 55 28 27 4 4
Tuljapur (M) U 19 12 7 1 1
Naldurg(M) U 8 4 4
Paranda(M) U 10 6 4 2 2
Bhum(M) U 82 50 32 3 3
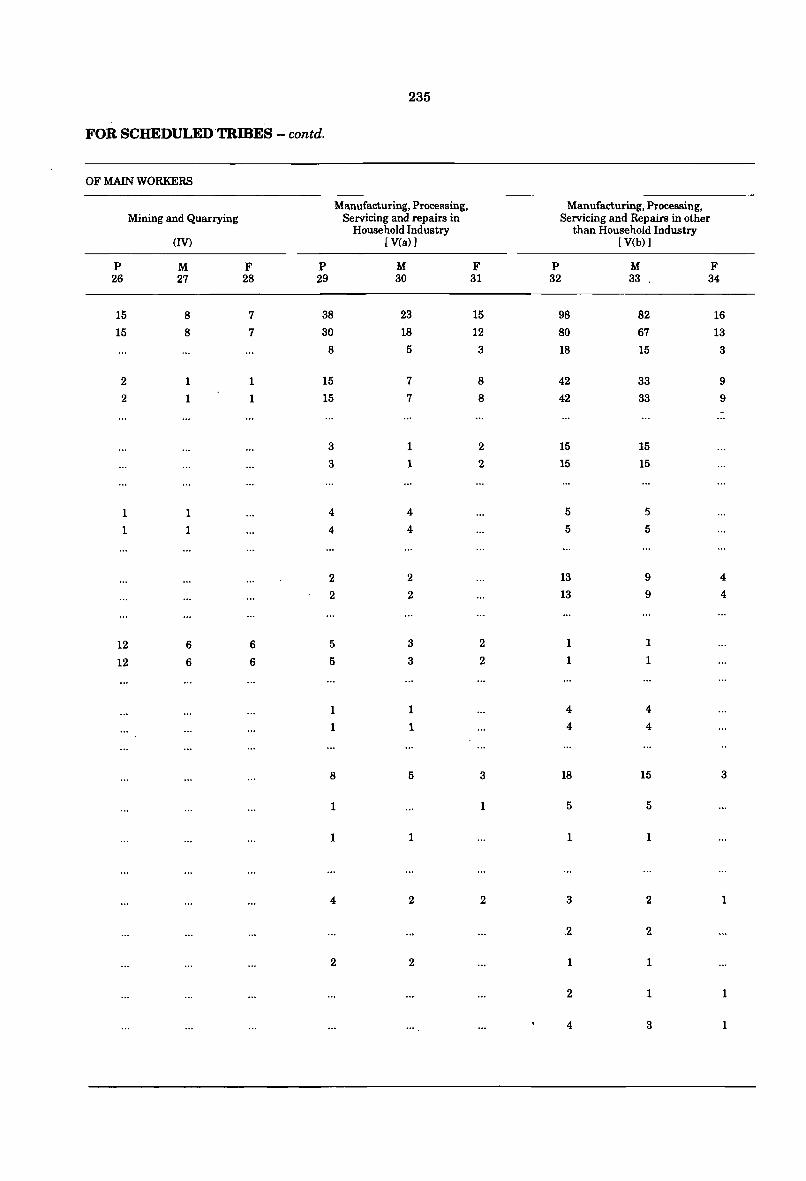
235
FOR SCHEDULED TRIBES - contd.
OF MAIN WORKERS
Manufacturing, Processing, Manufacturing, Processing, Mining and Quarrying Servicing and repairs in Servicing and Repairs in other
Household Industry than Household Industry (IV) [V(a) ) [V(b»)
P M F P M F P M F 26 27 28 29 30 31 32 33 . 34
15 8 7 38 23 15 98 82 16
15 8 7 30 18 12 80 67 13 8 5 3 18 15 3
2 1 1 15 7 8 42 33 9 2 1 1 15 7 8 42 33 9
3 1 2 15 15
3 1 2 15 15
1 1 4 4 5 5
1 1 4 4 5 5
2 2 13 9 4
2 2 13 9 4
12 6 6 5 3 2 1 1
12 6 6 5 3 2 1 1
1 1 4 4
1 1 4 4
8 5 3 18 15 3
1 1 5 5
1 1 1 1
4 2 2 3 2 1
2
2 2 1 1
2 1 1
4 3 1
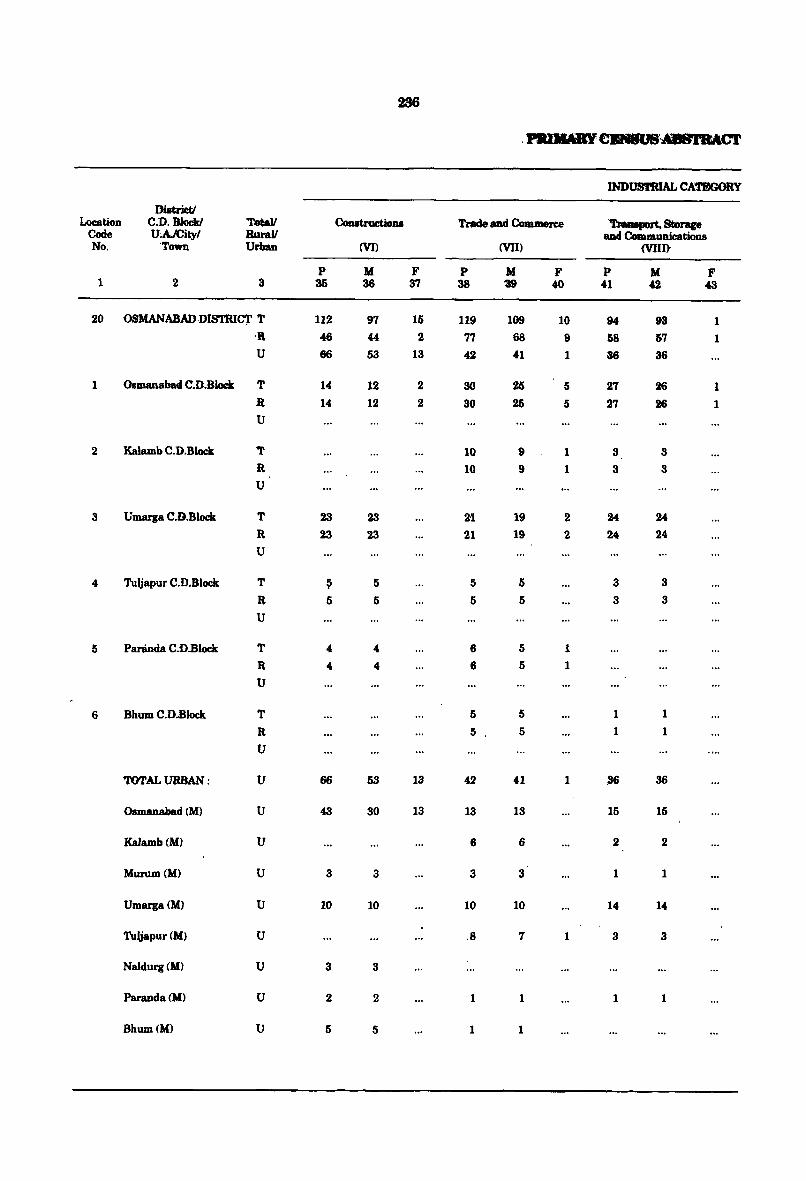
286
.l'ItIIM1lYeBNlRJ8~CT
INDUSTRIAL CATI!lGORY
DiatrietJ Location C.D.BlockI 1lotall Cooatrac:tiona Trade aad Commerce 'TftIaaport, Storage
Code U~A.JCityl Rurall aDd <Amnwnications No. 'Town Urban (VI) (VII) Mm
p M F P M F P M F 1 2 3 35 36 37 38 $ 40 41 42 43
20 OSMANABADDISTRIC1 T 112 97 15 119 109 10 94 93 1 R 46 44 2 77 68 9 58 67 1 U 66 63 13 42 41 1 36 36
1 Osmanaba4 C.D.Bloek T 14 12 2 30 25 5 27 2(; 1 R 14 12 2 30 25 5 27 26 1 U
2 Kalamb C.D.Block T 10 9 1 3 3
R 10 9 1 3 3 U
3 Umarga C.D.Block T 23 23 2>1 19 2 24 24
R 23 23 21 19 2 24 24 U
4 Tuljapur C.D.Block T I; 5 5 5 3 3
R 5 5 5 5 3 3
U
5 Parinda C.D.Block T 4 4 6 5 1
R 4 4 6 5 1
U
6 Bhum C.DBlock T 5 5 1 1
R 5 5 1 1
U
TOTAL URBAN : U 66 53 13 42 41 1 ~ 36
Osmanahad (M) U 43 30 13 13 13 15 15
Kalamb(M) U 6 6 2 2
Murum(M) U 3 3 3 3 1 1
Umarga(M) U 10 10 10 10 14 14
Tuljapur (M) U ,8 7 1 3 3
Naldurg(M) U 3 3
Paranda(M) U 2 2 1 1 1 1
Bhum(M) U 5 5 1 1
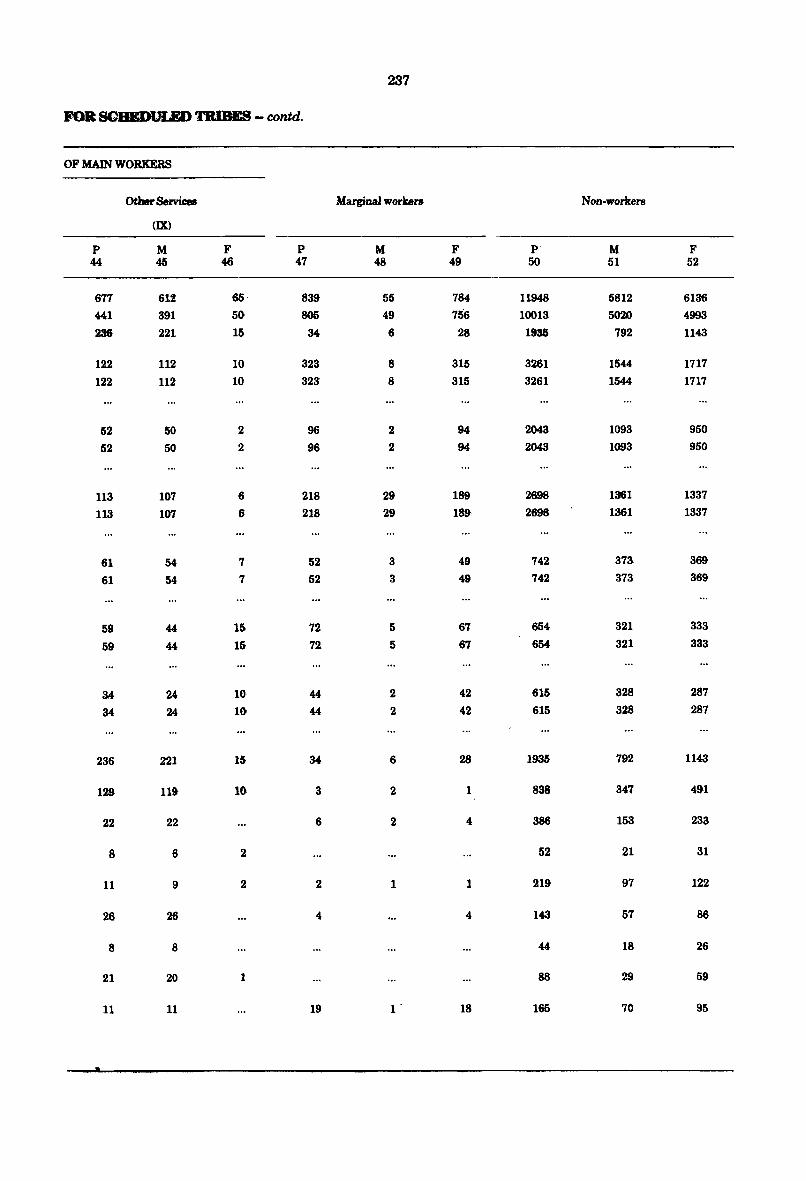
237
FOItSCBED1lLED TRIBES - contd.
OF MAIN WORKERS
Other Services Marginal workers Non.workers
(IX)
p M F P M F p' M F 44 45 46 47 48 49 50 51 52
677 612 65 839 55 784 11948 5812 6136
441 391 50 805 49 756 10013 5020 4993
236 221 15 34 6 28 1936 792 1143
122 112 10 323 8 315 3261 1544 1717
122 112 10 323' 8 315 3261 1544 1717
52 50 2 96 2 94 2043 1093 950
52 50 2 96 2 94 2043 1093 950
113 107 6 218 29 189 2698 13161 1337
113 107 6 218 29 189- 2698 1361 1337
61 54 7 52 3 49 742 373 369
61 54 7 52 3 49 742 373 369
59 44 15, 72 5 61 654 321 333
59 44 15 72 5 61 654 321 333
34 24 10 44 2 42 615 328 287
34 24 10 44 2 42 615 328 287
236 221 15 34 6 28 1935 792 1143
129 119 10. S 2 1 838 347 4!n
22 22 6 2 4 386 153 233
8 6 2 52 21 31
11 9 2 2 1 1 219 97 122
26 26 4 4 143 57 86
8 8 44 18 26
21 20 1 88 29 59
11 11 19 1 . 18 1&5 70 95
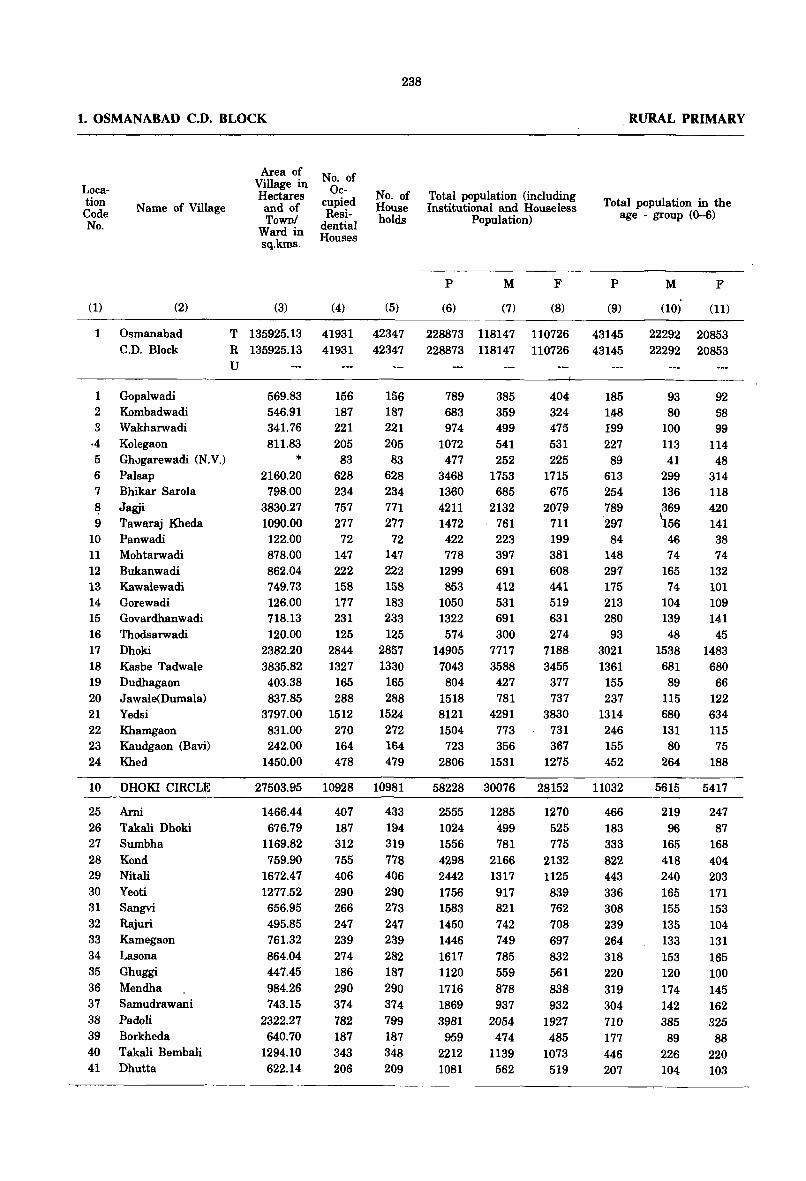
238
1. OSMANABAD C.D. BLOCK
Location Code No.
Name of Village
(1) (2)
1 Osmanabad C.D. Block
1 Gopalwadi 2 Kombadwadi 3 Wakharwadi
·4 Kolegaon 5 Gh.:>garewadi (N.V.) 6 Palsap 7 Bhikar Sarola 8 Jagji 9 Tawaraj Kheda
10 Panwadi 11 Mohtarwadi 12 Bukanwadi 13 Kawalewadi 14 Gorewadi 15 Govardhanwadi 16 Thodsarwadi 17 Dhoki 18 Kasbe Tadwale 19 Dudhagaon 20 Jawale(Dumala) 21 Yedsi 22 Khamgaon 23 Kaudgaon (Bavi) 24 Khed
10 DHOKI CIRCLE
25 Ami 26 Takali Dhoki 27 Sumbha 28 Kond 29 Nitali 30 Yeoti 31 Sangvi 32 Rajuri 33 Kamegaon 34 Lasona 35 Ghuggi 36 Mendha 37 Samudrawani 38 Padoli 39 Borkheda 40 Takali Bembali 41 Dhutta
Area of Village in Hectares and of TownJ
Ward in sq.kms.
(3)
No. of Oc
cupied Resi
dential Houses
(4)
No. of House holds
(5)
T 135925.13 41931 42347 R 135925.13 41931 42347 U
569.B3 546.91 341.76 B11.B3
* 2160.20
79B.00 3830.27 1090.00 122.00 878.00 862.04 749.73 126.00 718.13 120.00
2382.20 3835.82 403.38 837.B5
3797.00 B31.00 242.00
1450.00
27503.95
1466.44 676.79
1169.B2 759.90
1672.47 1277.52 656.95 495.B5 761.32 864.04 447.45 9B4.26 743.15
2322.27 640.70
1294.10 622.14
156 156 187 187 221 221 205 205 83 83
628 628 234 234 757 771 277 277 72 72
147 147 222 222 158 158 177 183 231 233 125 125
2844 2857 1327 1330
165 165 288 288
1512 1524 270 272 164 164 478 479
10928 10981
407 433 187 194 312 319 755 778 406 406 290 290 266 273 247 247 239 239 274 282 186 187 290 290 374 374 782 799 187 187 343 348 206 209
Total population (including Institutional and Houseless
Population)
P
(6)
M
(7)
F
(B)
22BB73 llB147 110726 228873 llB147 110726
789 385 683 359 974 499
1072 541 477 252
3468 1753 1360 685 4211 2132 1472 761 422 223 778 397
1299 691 853 412
1050 531 1322 691 574 300
14905 7717 7043 3588 804 427
1518 7Bl B121 4291 1504 773 723 356
2806 1531
58228 30076
2555 1285 1024 499 1556 781 4298 2166 2442 1317 1756 917 1583 821 1450 742 1446 749 1617 785 1120 559 1716 878 1869 937 3981 2054
959 474 2212 1139 1081 562
40. 324 475 531 225
1715 675
2019 711 199 381 608 441 519 631 274
7188 3455
377 737
3830 731 367
1275
28152
1270 525 775
2132 1125 839 762 708 697 B32 561 838 932
1927 485
1073 519
. RURAL PRIMARY
Total population in the age - group (0-6)
P
(9)
43145 43145
185 1(18 199 227 89
613 254 789 '297
84 148 297 175 213 280 93
3021 1361 155 237
1314 246 155 452
11032
466 183 333 822 443 336 30B 239 264 318 220 319 304 710 177 446 207
M
(10)
F
(11)
22292 20B53 22292 20B53
93 BO
100 113 41
299 136 369 \56
46 74
165 74
104 139
4B 153B
6B1 B9
115 6BO 131 80
264
5615
219 96
165 418 240 165 155 135 133 153 120 174 142 385
89 226 104
92 S8 99
114
48 314 118
420 141 38 74
132 101 109 141
45 1483 680 66
122 634 115 75
188
5417
247 87
168 404 203 171 153 104 131 165 100 145 162 325
88 220 103
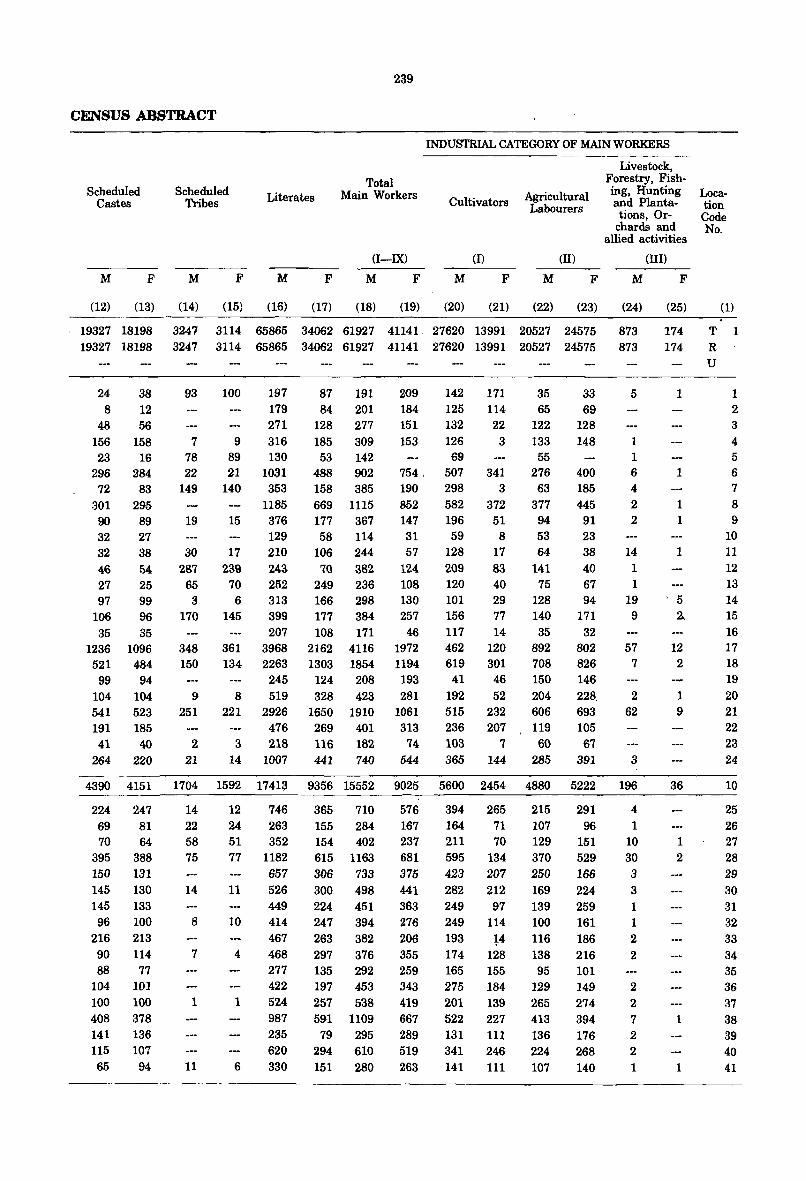
239
CENSUS ABSTRACT
INDUSTRIAL CATEGORY OF MAIN WORKERS
Scheduled Castes
M F
Scheduled Tribes
M F
(12) (13) (14) (15)
Literates
M F
Total Main Workers
(I-IX)
M F
(16) (17) (18) (19)
Cultivators
(I)
M F
(20) (21)
Agricultural Labourers
(II)
M F
(22) (23)
Livestock, Forestry, Fishing, Hunting and Plantations, Or
chards and allied activities
(nI)
M F
(24) (25)
19327 18198 3247 3114 65865 34062 61927 41141. 27620 13991 20527 24575 873 174 174 19327 18198 3247 3114 65865 34062 61927 41141 27620 13991 20527 24575 873
24 38 8 12
48 56 156 158 23 16
296 284 72 83
301 295 90 89 32 27 32 38 46 54 27 25 97 99
106 96 35 35
1236 1096 521 484
99 94 104 104 541 523 191 185 41 40
264 220
93 100 197 87 191 209 142 171 179 84 201 184 125 114 271 128 277 151 132 22
7 9 316 185 309 153 126 3 78 89 130 53 142 69 22 21 1031 488 902 754 , 507 341
149 140 353 158 385 190 298 3 1185 669 1115 852 582 372
19 15 376 177 367 147 196 51 129 58 114 31 59 8
30 17 210 106 244 57 128 17 287 239 243 70 382 124 209 83
65 70 252 249 236 108 120 40 3 6 313 166 298 130 101 29
170 145 399 177 384 257 156 77 207 108 171 46 117 14
348 361 3968 2162 4116 1972 462 120 150 134 2263 1303 1854 1194 619 301
245 124 208 193 41 46 9 8 519 328 423 281 192 52
251 221 2926 1650 1910 1061 515 232 476 269 401 313 236 207
2 3 218 116 182 74 103 7 21 14 1007 441 740 544 365 144
35 65
122 133 55
276 63
377 94 53 64
141 75
128 140 35
892 708 150 204 606 119 60
285
33 69
128 148
400 185 445
91 23 38 40 67 94
171 32
8(}2
826 146 228. 693 105 67
391
5
1 1 6 4 2 2
14 1 1
19 9
57 7
2 62
3
4390 4151 1704 1592 17413 9356 15552 9025 5600 2454 4880 5222 196
224 247 69 81 70 64
395 388 150 131 145 130 145 133 96 100
216 213 90 114 88 77
104 101 100 100 408 378 141 136 115 107 65 94
14 22 58 75
14
8
7
1
11
12 746 24 263 51 352 77 1182
11
10
4
1
6
657 526 449 414 467 468 277 422 524 987 235 620 330
365 710 155 284 154 402 615 1163 306 733 300 498 224 451 247 394 263 382 297 376 135 292 197 453 257 538 591 1109
79 295 294 610 151 280
576 167 237 681 375 441 363 276 206 355 259 343 419 667 289 519 263
394 265 164 71 211 70 595 134 423 207 282 212 249 97 249 114 193 ~4
174 128 165 155 275 184 201 139 522 227 131 111 341 246 141 III
215 107 129 370 250 169 139 100 116 138 95
129 265 413 136 224 107
291 96
151 529 166 224 259 161 186 216 101 149 274 394 176 268 140
4 1
10 30 3 3 1 1 2 2
2 2 7 2 2
1
1
1
1 1
1
5 ~
12 2
1 9
36
1 2
1
1
Location Code No.
(1)
T 1 R U
1 2 3 4 5 6 7 8 9
10 11 12 13 14 15 16 17 18 19 20 21 22 23 24
10
25 26 27 28 29 30 31 32 33 34 35 36 37 38 39 40 41
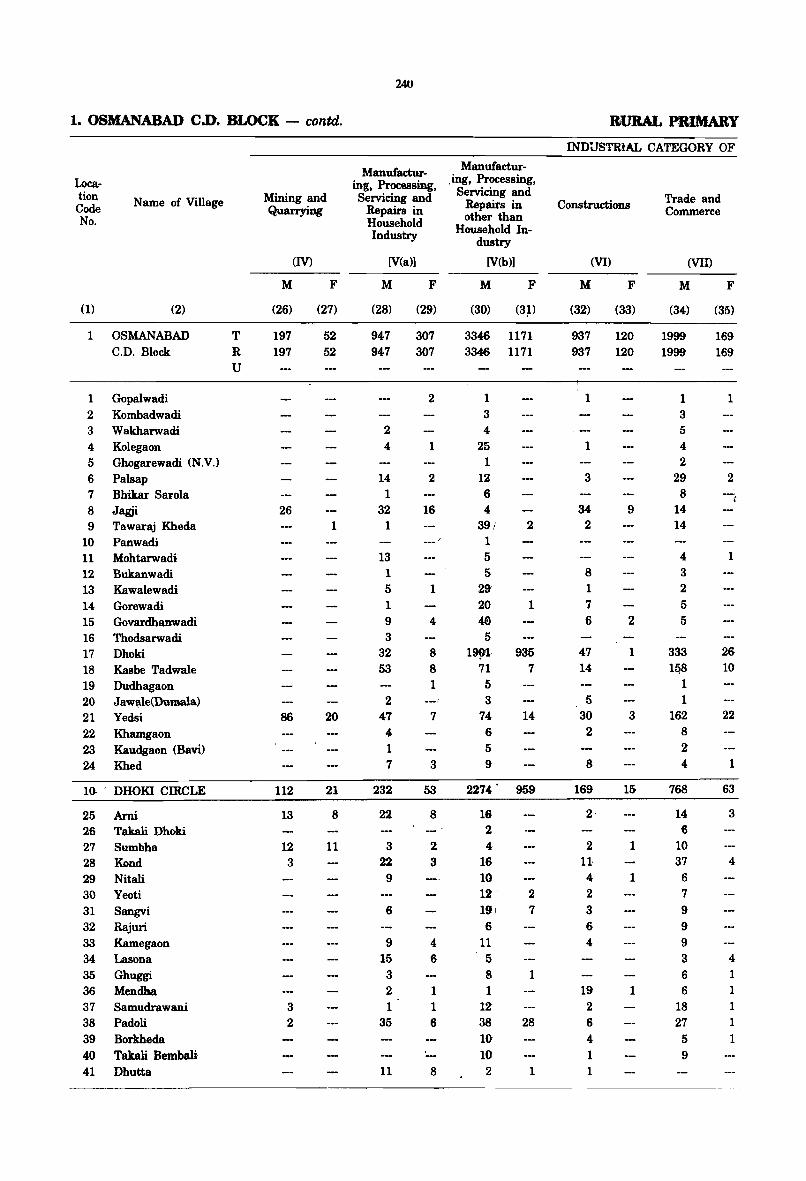
1. OSMANABAD C.D. BLOCK - contd.
Location Code No.
Name of Village
(1) (2)
1 OSMANABAD C.D. Block
1 Gopalwadi 2 Kombadwadi 3 Wakharwadi 4 Kolegaon 5 Ghogarewadi (N.V.) 6 Palsap 7 Bhikar Sarola 8 Jagji 9 Tawaraj Kheda
10 Panwadi 11 Mohtarwadi 12 Bukanwadi 13 Kawalewadi 14 Gorewadi 15 Govardhanwadi 16 Thodsarwadi 17 Dhoki 18 Kasbe Tadwale 19 Dudhagaon 20 Jaw~e(Duma1a)
21 Yedsi 22 Khamgaon 23 Kaudgaon (Bavi) 24 Khed
10- ' DHOKI CIRCLE
25 Ami 26 Takali Dhoki 27 Sumbha 28 Kond 29 Nitali 30 Yeoti 31 Sangvi 32 Rajuri 33 Kamegaon 34 Lasona 35 Ghuggi 36 Mendha 37 Samudrawani 38 Padoli 39 Borkheda 40 Takali Bembali 41 Dhutta
T R U
Mining and Quarrying
M
(26)
197 197
26
(IV)
86
112
13
12 3
3 2
F
(27)
52
52
1
20
21
8
11
240
Manufacturing, Processing, Servicing and
Repairs in Household Industry
[V(a»)
M
(28)
947 947
2 4
14 1
32 1
13 1 5 1 9 3
32 53
2 47
4 1 7
232
22
3 22 9
6
9 15
3
2 1
35
11
F
(29)
307 307
2
1
2
16
1
4
8 8 1
--,' 7
3
53
8
2 3
4 6
1 1 6
8
Manufactur,ing, Processing,
Servicing and Repairs in other than
Household Industry
[V(b»)
M
(30)
F
(3P
3346 1171 3346 1171
1 3 4
25 1
12 6 4
39/ 1 5 5
29
20 4&
5 1~,
71 5 3
74 6 5 9
2
1
935 7
14
2274' 959
16 2 4
16 10 12 191 6
11
5 8 1
12 38 10 10 2
2 7
1
28
1
INDUSTRiAL CATEGORY OF
Constructions
(VI)
M
(32)
937 937
1
1
3
34-2
8 1 7 6
47 14
5 30
2
8
169
2
2 1l 4 2 3 6 4
19 2 6 4 1 1
F
(33)
120 120
9
2
1
3
15
1
1
1
Trade and Commerce
(VII)
M
(34)
1999 1999
1 3 5
4 2
29
8 14 14
4 3
2 5 5
333
1&8 1 1
162 8 2 4
768
14 6
10 37
6 7
9
9
9 3
6 6
18 27
5 9
F
(35)
169 169
1
2
1
26 10
22
1
63
3
4
4 1 1
1 1 1
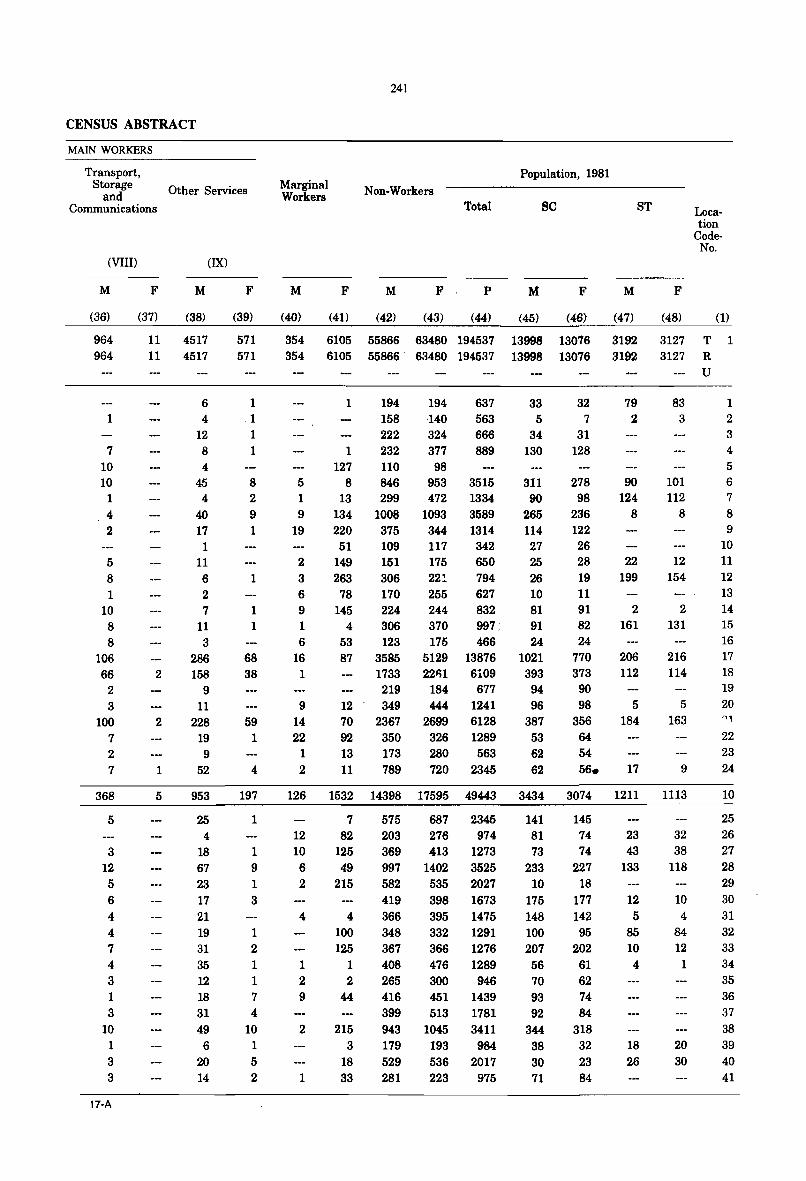
CENSUS ABSTRACT
MAIN WORKERS
Transport, Storage
and Communications
Other Services
(VIII)
M
(36)
964 964
1
7 10 10
1
4 2
5 8 1
10 8 8
106 66
2 3
100 7 2 7
368
5
3
12 5 6 4 4 7 4 3 1 3
10 1 3
3
!7-A
F
(37)
M
(3B)
(IX)
11 4517 11 4517
2
2
1
5
6 4
12 8 4
45 4
40 17
1 11 6 2 7
11 3
286 158
9 11
228 19 9
52
953
25 4
18 67 23 17 21 19 31 35 12 18 31 49 6
20 14
F
(39)
571 571
1 1 1 1
8 2 9 1
1
1 1
68 38
59 1
4
197
1
1 9 1 3
1 2 1 1 7 4
10 1 5 2
Marginal Workers
M
(40)
F
(41)
241
Non-Workers
M
(42)
F
(43)
Total
P
(44)
Population, 1981
M
(45)
SC
F
(48)
M
(47)
ST
F
(4B)
Location
CodeNo.
(1)
354 6105 55866 63480 194537 13998 13076 3192 3127 T 1 354 6105 55866· 63480 194537 13998 13076 3192 3127 R
5 1 9
19
2 3
6 9 1 6
16 1
9 14 22
1 2
1
1
194 158 222 232
194 140 324 377
127 110 98
637 563 666 889
33 5
34 130
8 846 953 3515 311 13 299 472 1334 90
134 1008 1093 3589 265 220 375 344 1314 114 51 109 117 342 27
149 151 175 650 25 263 306 221 794 26 78 170 255 627 10
145 224 244 832 81 4 306 370 997: 91
53 123 175 466 24 87 3585 5129 13876 1021
1733 22~1 6i09 219 184 677
12 349 444 1241 70 2367 2699 6128 92 350 326 1289 13 173 280 563 11 789 720 2345
393 94 96
387 53 62 62
32 7
31 128
278 98
236 122 26 28 19 11 91 82 24
770
79 2
90 124
8
22 199
2 161
206 373 112 90 98 5
356 184 64 54 56. 17
83 3
101 112
8
12 154
2 131
216 114
5
163
9
126 1532 14398 17595 49443 3434 3074 1211 1113
12 10 6 2
4
1
2 9
2
1
7 82
125 49
215
4 100 125
1 2
44
215 3
18 33
575 687 2345 203 276 974 369 413 1273 997 1402 3525 582 535 2027 419 398 1673 366 395 1475 348 332 1291 367 366 1276 408 476 1289 265 300 946 416 399
451 1439 513 1781
943 1045 3411 179 193 984 529 536 2017 281 223 975
141 81 73
233 10
175 148 100 207 56 70 93 92
344 38 30 71
145 74 74
227 18
177 142 95
202 61 62 74 84
318 32 23 84
23 43
133
12 5
85 10 4
18 26
32 38
118
10 4
84 12
1
20 30
U
1 2 3
4 5
6 7 8 9
10 11 12 13 14 15 16 17 18 19 20
22 23 24
10
25 26 27 28 29 30 31 32 33 34 35 36 37 38 39 40 41
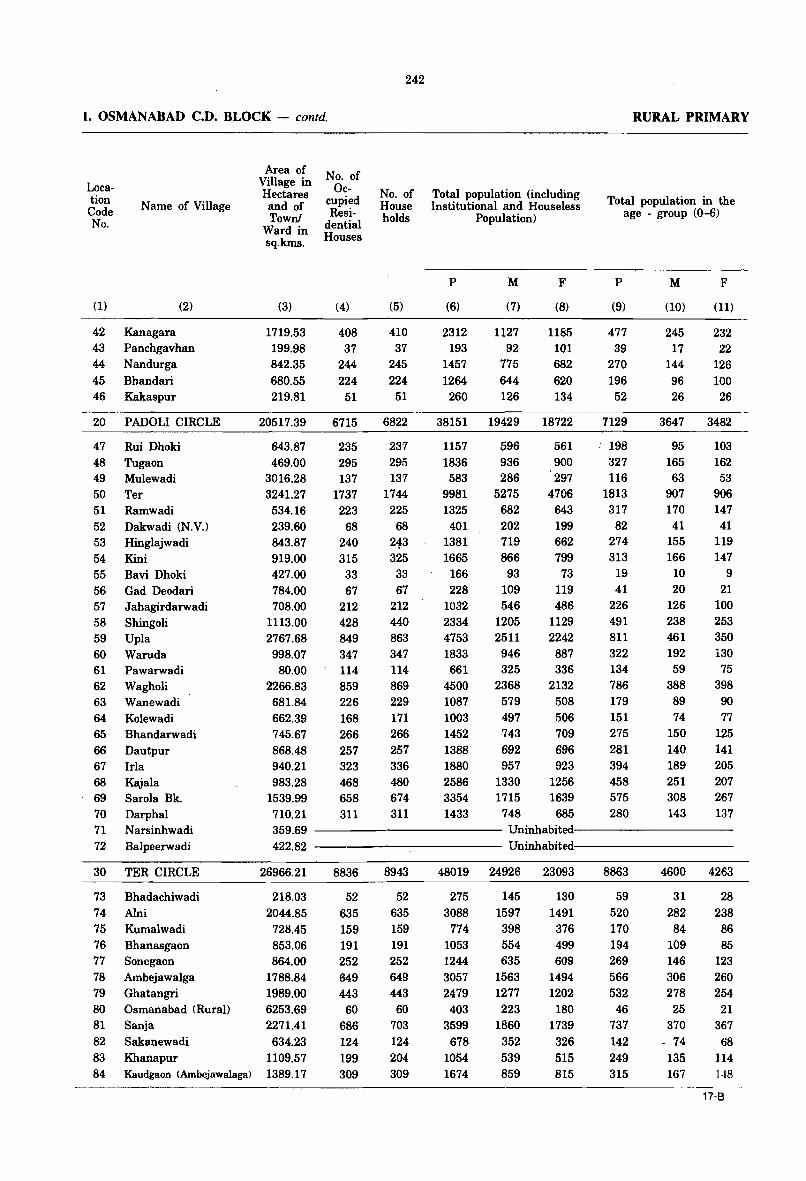
242
1. OSMANABAD C.D. BLOCK - contd. RURAL PRIMARY
Location Code No.
N arne of Village
(1) (2)
42 Kanagara 43 Panchgavhan 44 Nandurga 45 Bhandari 46 Kakaspur
20 PADOLI CIRCLE
47 Rui Dhoki 48 Tugaon 49 Mulewadi 50 Ter 51 Rarnwadi 52 Dakwadi (N.V.) 53 Hinglajwadi 54 Kini 55 Bavi Dhoki 56 Gad Deodari 57 Jahagirdarwadi 58 Shingoli 59 Upla 60 Waruda 61 Pawarwadi 62 Wagholi 63 Wanewadi 64 Kolewadi 65 Bhandarwadi 66 Dautpur 67 IrIa 68 ~ala
69 Sarola Bk. 70 Darphal 71 Narsinhwadi 72 Balpeerwadi
30
73 74 75 76 77 78 79 80 81 82 83 84
TER CIRCLE
Bhadachiwadi Alni Kurnalwadi Bhanasgaon Sonegaon Ambejawalga Ghatangri Osrnanabad (Rural) Sanja Sakanewadi Khanapur Kaudgaon (Ambejawalaga)
Area of Village in Hectares and of Town!
Ward in sq.kms.
(3)
1719.53 199.98 842.35 680.55 219.81
20517.39
643.87 469.00
3016.28 3241.27 534.16 239.60 843.87 919.00 427.00 784.00 708.00
1113.00 2767.68 998.07 80.00
2266.83 681.84 662.39 745.67 868.48 940.21 983.28
1539.99 710.21
No. of Oc
cupied Resi
dential Houses
(4)
408 37
244 224
51
6715
235 295 137
1737 223 68
240 315 33 67
212 428 849 347 114 859 226 168 266 257 323 468 658 311
No. of House holds
(5)
410 37
245 224
51
6822
237 295 137
1744 225
68 243 325 33 67
212 440 863 347 114 869 229 171 266 257 336 480 674 311
Total population (including Institutional and Houseless
Population)
P
(6)
2312 193
1457 1264 260
38151
1157 1836 583
9981 1325 401
1381 1665 166 228
1032 2334 4753 1833 661
4500 1087 1003 1452 1388 1880 2586 3354 1433
M
(7)
1127 92
775 644 126
19429
596 936 286
5275 682 202 719 866
93 109 546
1205 2511 946 325
2368 579 497 743 692 957
1330 1715 748
F
(8)
1185 101 682 620 134
18722
561 900
'297 4706
643 199 662 799
73 119 486
1129 2242 887 336
2132 508 506 709 696 923
1256 1639 685
Total population in the age - group (0-6)
P
(9)
477 39
270 196 52
1129
198 327 116
1813 317
82 274 313
19 41
226 491 811 322 134 786 179 151 275 281 394 458 575 280
M
(10)
245 17
144 96 26
3647
95 165 63
907 170 41
155 166
10 20
126 238 461 192 59
388 89 74
150 140 189 251 308 143
F
(11)
232 22
126 100
26
3482
103 162 53
906 147 41
119 147
9 21
100 253 350 130
75 398 90 77
125 141 205 207 267 137
359.69 ------------ Uninhabitedl----------422.82 Uninhabitedl----------
26966.21
218.03 2044.85 728.45 853.06 864.00
1788.84 1989.00 6253.69 2271.41 634.23
1109.57 1389.17
8836
52 635 159 191 252 649 443 60
686 124 199 309
8943
52 635 159 191 252 649 443 60
703 124 204 309
48019
275 3088
774 1053 1244 3057 2479 403
3599 678
1054 1674
24926
145 1597 398 554 635
1563 1277 223
1860 352 539 859
23093
130 1491
376 499 609
1494 1202 180
1739 326 515 815
8863
59 520 170 194 269 566 532 46
737 142 249 315
4600
31 282 84
109 146 306 278 25
370 - 74 135 167
4263
28 238 86 85
123 260 254
21 367 68
114 1·18
----_---_. -----_._------------------------ - _. __ . 17-8
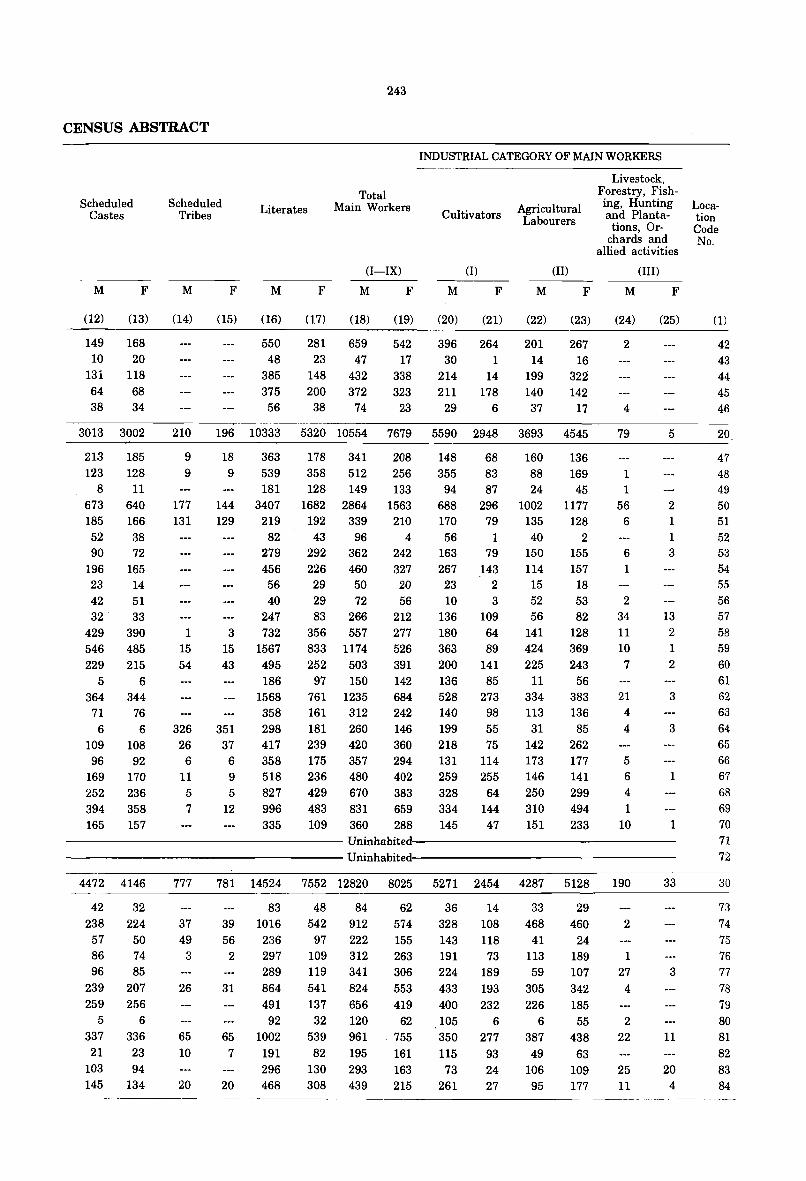
CENSUS ABSTRACT
Scheduled Castes
M F
(12) (13)
149 168 10 20
131 118 64 68 38 34
Scheduled Tribes
M F
(14) (15)
243
Literates Total
Main Workers
M
(16)
550 48
385 375
56
(I-IX)
F M
(17) (18)
281 659 23 47
148 432 200 372
38 74
F
(19)
542 17
338 323
23
INDUSTRIAL CATEGORY OF MAIN WORKERS
Cultivators
M F
(20) (21)
396 264 30 1
214 14 211 178
29 6
Agricultural Labourers
M
(22)
201 14
199 140 37
(II)
F
(23)
267 16
322 142
17
Livestock, Forestry, Fishing, Hunting and Planta
tions, Orchards and
allied activities
(III)
M F
(24) (25)
2
4
3013 3002 210 196 10333 5320 10554 7679 5590 2948 3693 4545 79 5
213 185 123 128
8 11 673 640 185 166 52 38 90 72
196 165 23 14 42 51 32' 33
429 390 546 485 229 215
5 6 364 344
71 76 6 6
109 108 96 92
169 170 252 236 394 358 165 157
9 9
177 131
1 15 54
326 26
6 11
5
7
18 363 178 341 208 9 539 358 512 256
181 128 149 133 144 3407 1682 2864 1563 129 219 192 339 210
82 43 96 4 279 292 362 242 456 226 460 327 56 29 50 20 40 29 72 56
247 83 266 212 3 732 356 557 277
15 1567 833 1174 526 43 495 252 503 391
186 97 150 142 1568 761 1235 684 358 161 312 242
351 298 181 260 146 37 417 239 420 360
6 358 175 357 294 9 518 236 480 402 5 827 429 670 383
12 996 483 831 659 335 109 360 288
148 68 160 136 355 83 88 169
94 87 24 45 688 296 1002 1177 170 79 135 128
56 1 40 2 163 79 150 155 267 143 114 157 23 2 15 18 10 3 52 53
136 109 56 82 180 64 141 128 363 89 424 369 200 141 225 243 136 85 11 56 528 273 334 383 140 98 113 136 199 55 31 85 218 75 142 262 131 114 173 177 259 255 146 141 328 64 250 299 334 144 310 494 145 47 151 233
1 1
56 6
6
1
2 34 11 10 7
21 4 4
5 6
4 1
10
2 1 1
3
13 2
1
2
3
3
1
1 ----------------- Uninhabitedl---------------------------------Uninhabited----------------
4472 4146 777 781 14524 7552 12820 8025 5271 2454 4287 5128 190
42 32 238 224
57 50 86 74 96 85
239 207 259 256
5 6 337 336 21 23
103 94 145 134
37 49
3
26
65 10
20
83 39 1016 56 236
2 297 289
31 864 491 92
65 1002 7 191
20 296 468
-- --- ----- --------
48 84 62 542 912 574
97 222 155 109 312 263 119 341 306 541 824 553 137 656 419 32 120 62
539 961 . 755 82 195 161
130 293 308 439
163 215
36 14 328 108 143 118 191 73 224 189 433 193 400 232 105 6 350 277
115 93 73
261 24 27
33
468 41
113 59
305 226
6 387 49
106 95
29 460
24 189 107 342 185
55 438
63 109 177
2
1 27
4
2 22
25 11
33
3
11
20 4
Location Code No.
(1)
42 43 44 45 46
20_
47 48 49 50 51 52 53 54 55 56 57 58 59 60 61 62 63 64 65 66 67 68 69 70 71 72
30
73 74 75 76 77 78 79 80 81 82 83 84
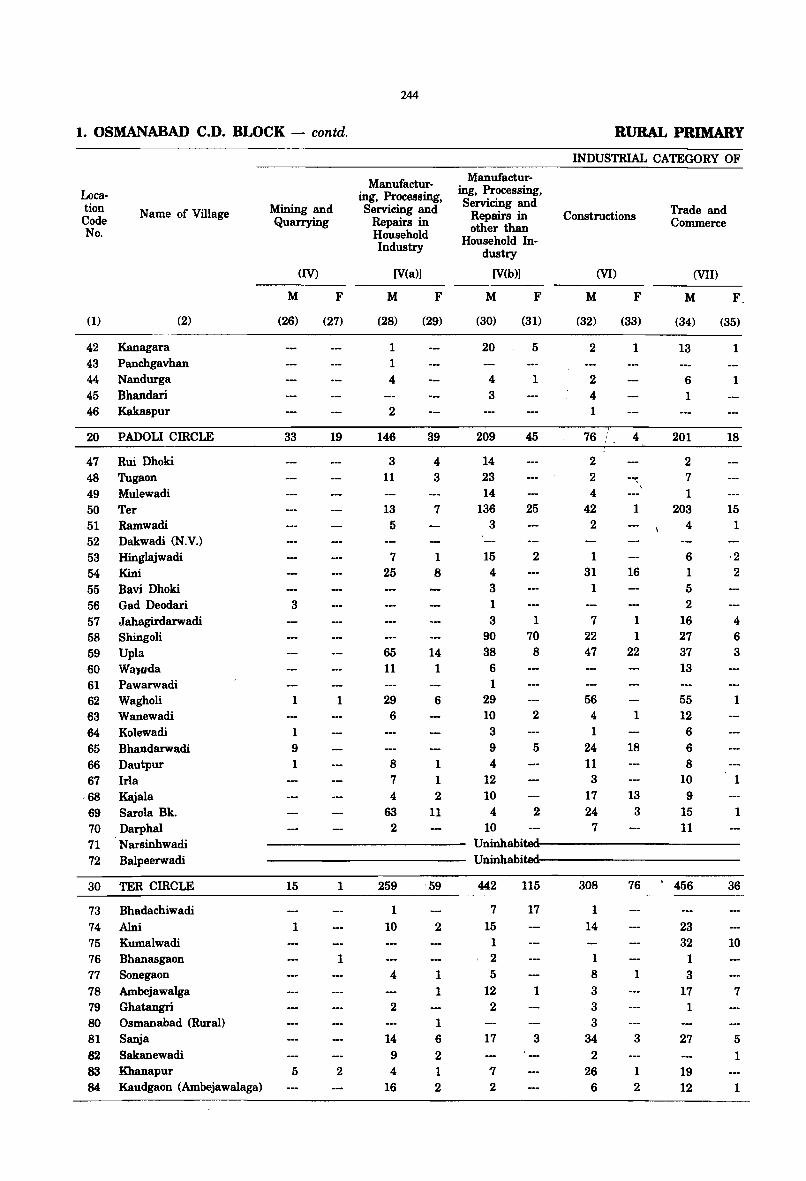
244
1. OSMANABAD C.D. BLOCK - contd. RURAL PRIMARY
Location Code No.
(1)
Name of Village
(2)
42 Kanagara 43 Panchgavhan 44 Nandurga 45 Bhandari 46 Kakaspur
20 PADOLI CIRCLE
47 Rui Dhoki 48 Tugaon 49 Mulewadi 50 Ter 51 Ramwadi 52 Dakwadi (N.V.) 53 Hinglajwadi 54 Kini 55 Bavi Dhoki 56 Gad Deodari 57 Jahagirdarwadi 58 Shingoli 59 Upla 60 Waluda 61 Pawarwadi 62 Wagholi 63 Wanewadi 64 Kolewadi 65 Bhandarwadi 66 Dautpur 67 Ida
·68 Kajala 69 Sarola Bk. 70 Darphal 71 Narsinhwadi 72 Balpeerwadi
30 TER CIRCLE
73 Bhadachiwadi 74 Alni 75 Kumalwadi 76 Bhanasgaon 77 Sonegaon 78 Ambejawalga 79 Ghatangri 80 Osmanabad (Rural) 81 Sanja 82 Sakanewadi 83 Khanapur 84 Kaudgaon (Ambejawalaga)
Mining and Quarrying
M
(26)
33
3
1
1 9 1
(IV)
F
(27)
19
1
Manufacturing, Processing, Servicing and
Repairs in Household Industry
[V(a»)
M
(28)
1
1 4
2
146
3 11
13 5
7 25
65 11
29 6
8 7 4
63
2
F
(29)
39
4 3
7
1 B
14 1
6
1 1 2
11
Manufacturing, Processing, Servicing and
Repairs in other than
Household Industry
[V(b»)
M
(30)
20
4 3
209
14 23 14
136 3
15 4 3 1 3
90 38
6 1
29 10 3 9 4
12 10
F
(31)
5
1
45
25
2
1 70
8
2
5
4 2 10
INDUSTRIAL CATEGORY OF
Constructions
M
(32)
2
2 4 1
(VI)
F
(33)
1
76 :. 4
2 2 4
42 2
1 31
1
7 22
47
56
4 1
24 11 3
17 24
7
1
16
1 1
22
1
18
13 3
Trade and Commerce
(VII)
M F
(34) (35)
13
6 1
201
2 7 1
203 4
6 1 5 2
16 27 37
13
55 12
6 6 8
10 9
15 11
1
1
18
15 1
·2 2
4 6 3
1
1
1
------------ Uninhabit,ed------------------------- Uninhabitedf--------------
15 1
1
1
5 2
259
1 10
4
2
14 9 4
16
',59
2
1 1
1 6 2 1 2
442
7 15
1 , 2
5 12
2
17
'1 2
115
17
1
3
308
1 14
1 8 3 3
3
34 2
26
6
76
1
3
1 2
456
23 32
1 3
17 1
27
19 12
36
10
7
5 1
1
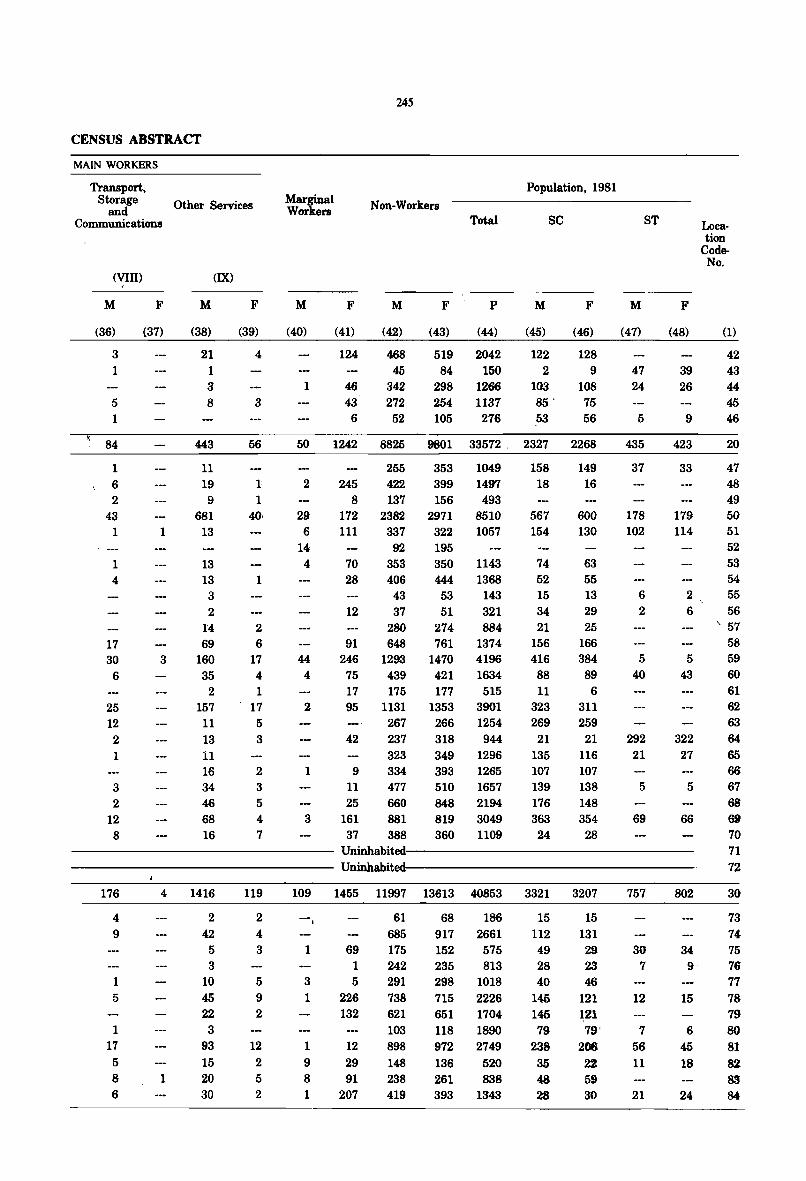
CENSUS ABSTRACT
MAIN WORKERS
Transport, Storage Other Services
and Communications
(VIII)
M
(36)
3 1
5 1
84
1
6 2
43 1
1 4
17 30
6
25 12
2 1
3 2
12 8
. F
(37)
1
3
M
(38)
(IX)
21 1 3 8
443
11 19 9
681 13
13 13
3
2 14 69
160 35
2 157 11 13 11 16 34 46 68 16
F
(39)
4
3
56
1
2 6
17 4 1
17 5 3
2 3
5 4 7
Marginal Workers
M
(40)
1
F
(41)
124
46 43 6
245
Non-Workers
M
(42)
468 45
342 272
52
F
(43)
Total
P
(44)
519 2042 84 150
298 1266 254 1137 105 276
Population, 1981
M
(45)
se
122 2
103 85 . 53
F
(46)
128 9
108 75 56
50 1242 8825 9801 33572. 2327 2268
2
29 6
14 4
44 4
2
1
3
245 8
255 422 137
353 1049 399 1497 156 493
172 2382 2971 8510 111 337 322 1057
92 195 70 353 350 1143 28 406 444 1368
43 53 143 12 37 51 321
280 274 884 91 648 761 1374
246 1293 1470 4196 75 439 421 1634 17 175 177 515 95 1131 1353 3901
42
9 11 25
161 37
267 266 1254 237 323 334 477 660 881 388
318 944 349 1296 393 1265 510 1657 848 2194 819 3049 360 1109
158 18
567 154
74 52 15 34 21
156 416 88 11
323 269
21 135 107 139 176 363 24
149 16
600 130
63 55 13 29 25
166 384 89
6 311 259
21 116 107 138 148 354 28
M
(47)
47 24
5
435
37
ST
178 102
6 2
5
40
292 21
5
69
F
(48)
39 26
9
423
33
Location
CodeNo.
(1)
42 43 44 45 46
20
47 48
49 179 50 114 51
52 53 54
2 55 6 56
, 57
58 5 59
43 60
322 27
5
66
61 62 63 64
65 66 67 68 6» 70
--------------- Uninhabited_---------------- 71 72 ------------------ Uninh~ned_------------------
176
4 9
1 5
1 17
5 8 6
4 1416
1
2 42
5 3
10 45 22 3
93 15 20 30
119
2 4 3
5 9 2
12 2 5 2
109 1455 11997 13613 40853 3321 3207
--,
1
3 1
1 9 8 1
69 1 5
226 132
12 29 91
207
61 685 175 242 291 738 621 103 898 148 238 419
68 186 917 2661 152 575 235 813 298 1018 715 2226 651 1704 118 1890 972 2749 136 520 261 838 393 1343
15 112 49 28 40
145 145 79
238 35 48 28
15 131 29 23 46
121 ~21 79'
206 22 59 30
757
30 7
12
7 56 11
21
802
34 9
15
6 45 18
24
30
73 74 75 76 77 78 79 80 81 82 8.'J 84
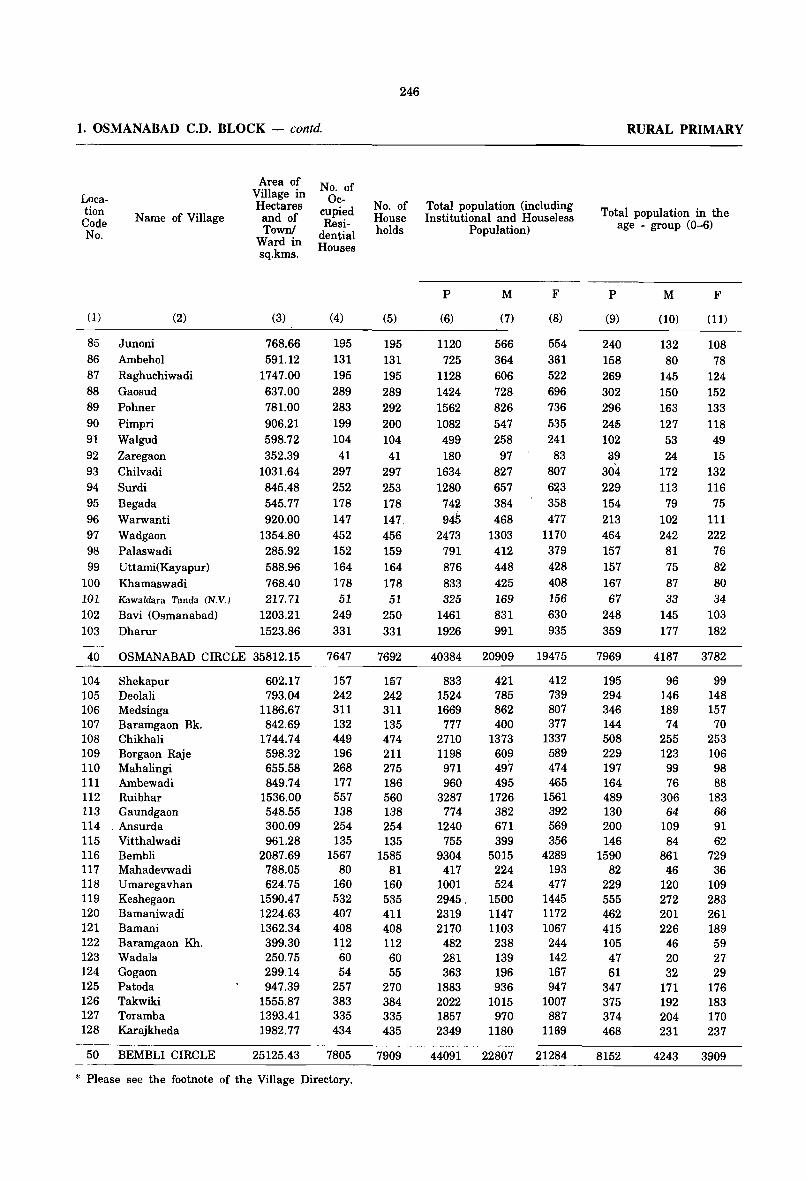
1. OSMANABAD C.D. BLOCK - contd.
Location Code No.
Name of Village
(1) (2)
85 Junoni 86 Ambehol 87 Raghuchiwadi 88 Gaosud 89 Pohner 90 Pimpri 91 Walgud 92 Zaregaon 93 Chilvadi 94 Surdi 95 Begada 96 Warwanti 97 Wadgaon 98 Palaswadi 99 Uttami(Kayapur)
100 Khamaswadi 101 Kawaldara Tanda (N.V.)
102 Bavi (Osmanabad) 103 Dharur
Area of Village in Hectares and of Town!
Ward in sq.kms.
(3)
768.66 591.12
1747.00 637.00 781.00 906.21 598.72 352.39
1031.64 845.48 545.77 920.00
1354.80 285.92 588.96 768.40 217.71
1203.21 1523.86
40 OSMANABAD CIRCLE 35812.15
104 Shekapur 105 Deolali 106 Medsinga 107 Baramgaon Bk. 108 Chikhali 109 Borgaon Raje 11 0 Mahalingi 111 Ambewadi 112 Ruibhar 113 Gaundgaon 114 ,Ansurda 115 Vitthalwadi 116 Bembli 117 Mahadevwadi 118 Umaregavhan 119 Keshegaon 120 Bamaniwadi 121 Bamani 122 Baramgaon Kh. 123 Wadala 124 Gogaon 125 Patoda 126 Takwiki 127 Toramba 128 Karajkheda
50 BEMBLI CIRCLE
602.17 793.04
1186.67 842.69
1744.74 598.32 655.58 849.74
1536.00 548.55 300.09 961.28
2087.69 788.05 624.75
1590.47 1224.63 1362.34 399.30 250.75 299.14 947.39
1555.87 1393.41 1982.77
25125.43
No. of Oc
cupied Resi
dential Houses
(4)
195 131 195 289 283 199 104 41
297 252 178 147 452 152 164 178 51
249 331
7647
157 242 311 132 449 196 268 177 557 138 254 135
1567 80
160 532 407 408 112 60 54
257 383 335 434
7805
* Please see the footnote of the Village Directory.
246
No. of House holds
(5)
195 131 195 289 292 200 104 41
297 253 178 147, 456 159 164 178 51
250 331
7692
157 242 311 135 474 211 275 186 560 138 254 135
1585 81
160 535 411 408 112 60 55
270 384 335 435
7909
Total population (including Institutional and Houseless
Population)
P
(6)
1120 725
1128 1424 1562 1082 499 180
1634 1280 742 945
2473 791 876 833 325
1461 1926
M
(7)
566 364 606 728 826 547 258 97
827 657 384 468
1303 412 448 425 169 831 991
F
(8)
554 361 522 696 736 535 241 83
807 6~3
358 477
1170 379 428 408
156 630 935
40384 20909 19475
833 1524 1669
777 2710 1198 971 960
3287 774
1240 755
9304 417
1001 2945, 2319 2170
482 281 363
1883 2022 1857 2349
44091
421 785 862 400
1373 609 497 495
1726 382 671 399
5015 224 524
1500 1147 1103 238 139 196 936
1015 970
1180
22807
412 739 807 377
1337 589 474 465
1561 392 569 356
4289 193 477
1445 1172 1067 244 142 167 947
1007 887
1169
21284
RURAL PRIMARY
Total population in the age - group (0-6)
P
(9)
240 158 269 302 296 245 102 39
304 229 154 213 464 157 157 167 67
248 359
7969
195 294 346 144 508 229 197 164 489 130 200 146
1590 82
229 555 462 415 105 47 61
347 375 374 468
8152
M
(10)
132 80
145 150 163 127 53 24
172 113 79
102 242
81 75 87 33
145 177
F
(11)
108 78
124 152 133 118 49 15
132 116 75
111 222
76 82 80 34
103 182
4187 3782
96 146 189 74
255 123 99 76
306 64
109 84
861 46
120 272 201 226
46 20 32
171 192 204 231
4243
99 148 157 70
253 106 98 88
183 66 91 62
729 36
109 283 261 189 59 27 29
176 183 170 237
3909
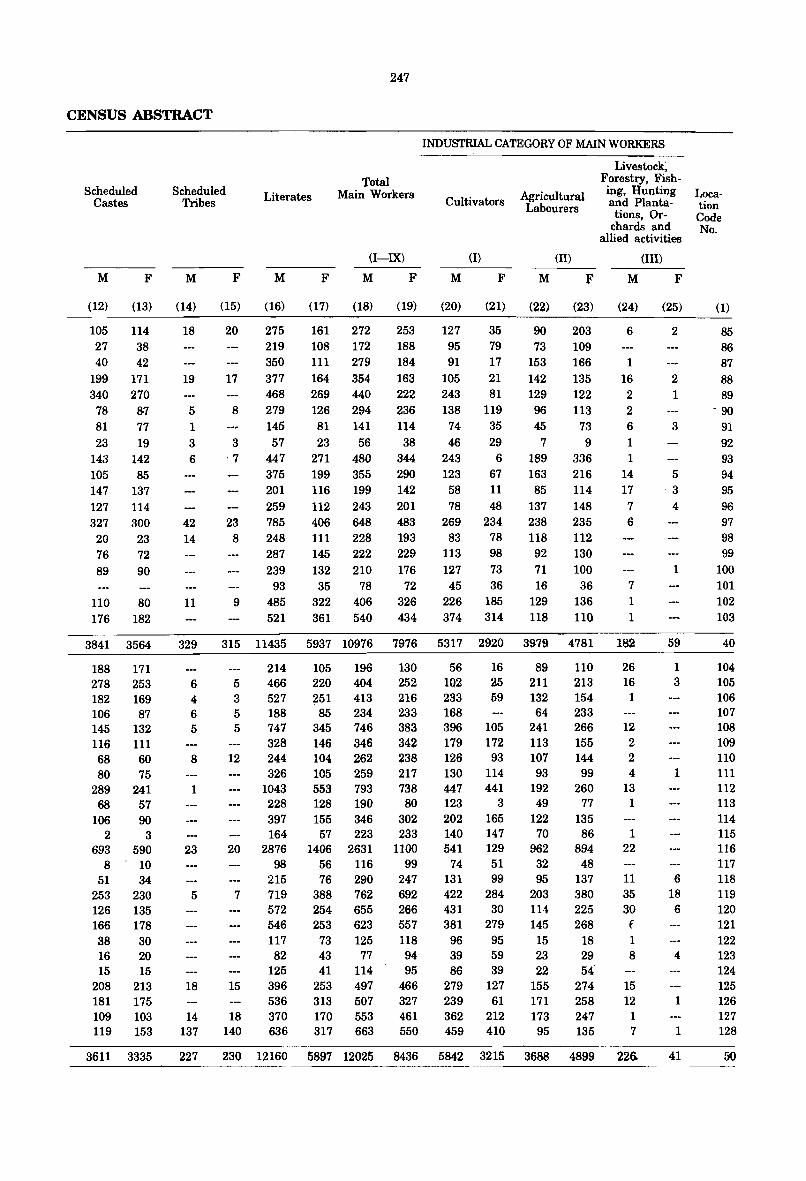
CENSUS ABSTRACT
Scheduled Castes
Scheduled Tribes
M F M
(12) (13) (14)
105 114 18 27 38 40 42
199 171 19 340 270
78 87 5 81 77 1
23 19 3 143 142 6 105 85 147 137 127 114 327 300 42 20 23 14 76 72 89 90
110 80 11 176 182
F
(15)
20
17
8
3
7
.1.--
23 8
9
Literates
M F
247
Total Main Workers
(I-IX)
M F
(16) (17) (18) (19)
275 161 272 253 219 108 172 188 350 111 279 184 377 164 354 163 468 269 440 222 279 126 294 236 145 81 141 114 57 23 56 38
44 7 271 480 344 375 199 355 290 201 116 199 142 259 112 243 201 785 406 648 483 248 111 228 193 287 145 222 229 239 132 210 176
93 35 78 72 485 322 406 326 521 361 540 434
INDUSTRIAL CATEGORY OF MAIN WORKERS
Cultivators
(I)
M F
Agricultural Labourers
(II)
M F
(20) (21) (22) (23)
127 35 90 203 95 79 73 109 91 17 153 166
105 21 142 135 243 81 129 122 138 119 96 113
74 35 45 73 46 29 7 9
243 6 189 336 123 67 163 216 58 11 85 114 78 48 137 148
269 234 238 235 83 78 118 112
113 98 92 130 127 73 71 100 45 36 16 36
226 185 129 136 374 314 118 110
Livestock; Forestry, Fishing, Hunting and Plantations, Or
chards and allied activities
M
(24)
6
1 16 2 2 6 1 1
14 17
7
6
7 1 1
(Ill)
F
(25)
2
2 1
3
5 ·3
4
1
3841 3564 329 315 11435 5937 10976 7976 5317 2920 3979 4781 182 59
188 171 278 253 182 169 106 87 145 132 116 111 68 60 80 75
289 241 68 57
106 90 2 3
693 590 8 . 10
51 34 253 230 126 135 166 178 38 30 16 20 15 15
208 213 181 175 109 103 119 153
3611 3335
6 4 6 5
8
1
23
5
18
14 137
227
214 5 466 3 527 5 188 5 747
328 12 244
326 1043 228 397 164
20 2876 98
215 7 719
572 546 117 82
125 15 396
536 18 370
140 636
105 196 220 404 251 413 85 234
345 746 146 346 104 262 105 259 553 793 128 190 155 346 57 223
1406 2631 56 116 76 290
388 762 254 655 253 623 73 125 43 77 41 114
253 497 313 507 170 553 317 663
130 252 216 233 383 342 238 217 738 80
302 233
1100 99
247 692 266 557 118 94 95
466 327 461 550
56 102 233 168 396 179 126 130 447 123 202 140 541
74 131 422 431 381
96 39 86
279 239 362 459
16 25 59
105 172 93
114 441
3
165 147 129 51 99
284 30
279 95 59 39
127 61
212 410
89 211 132 64
241 113 107 93
192 49
122 70
962 32 95
203 1H 145 15 23 22
155 171 173 95
110 213 154 233 266 155 144 99
260 77
135 86
894 48
137 380 225 268
18 29 54'
274 258 247 135
26 16 1
12 2 2 4
13 1
1 22
11 35 30 f 1 8
15 12
1 7
230 12160 5897 12025 8436 5842 3215 3688 4899 226.
1 3
1
6 18 6
4
1
1
41
Location Code No.
(1)
85 86 87 88 89
- 90
91 92 93 94 95 96 97 98 99
100 101 102 103
40
104 105 106 107 108 109 110 111 112 113 114 115 116 117 118 119 120 121 122 123 124 125 126 127 128
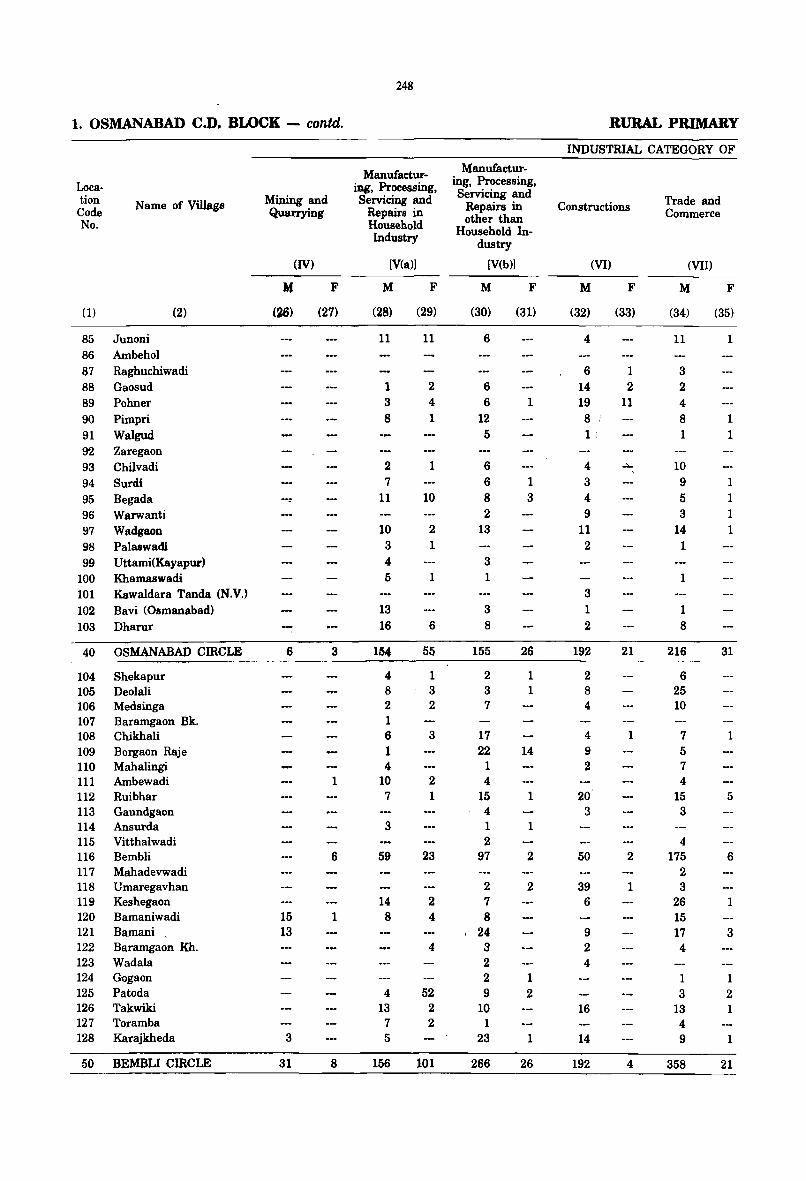
248
1. OSMANABAD C.D. BLOCK - contd. RURAL PRIMARY
INDUSTRIAL CATEGORY OF
Manufactur- Manufactur-
Loca- iDg, Processing, ing, Processing,
tion Mining and Servicing and Servicing and Trade and Name of Village Repairs in Constructions Code Quarrying Repairs in other than Commerce
No. Household Household In-Industry dustry
(IV) [V(a») [V(b») (VI) (VII)
M F M F M F M F M F
(1) (2) (26) (27) (28) (29) (30) (31) (32) (33) (34) (35)
85 Junoni 11 11 6 4 11 1 86 Ambehol 87 Raghuchiwadi 6 1 3 88 Gaosud 1 2 6 14 2 2 89 Pohner 3 4 6 1 19 11 4 90 PiJnpri 8 1 12 8 8 1 91 Walgud 5 1 : 1 1 92 Zaregaon 93 Chilvadi 2 1 6 4 ... 10 , 94 Surdi 7 6 1 3 9 1 95 Begada . 11 10 8 3 4 5 1 96 Warwanti 2 9 3 1 97 Wadgaon 10 2 13 11 14 1 98 Palaswadi 3 1 2 1 99 Uttami(Kayapur) 4 3
100 Khamaswfldi 5 1 1 1 101 Kawaldara Tanda (N.V.) 3 102 Bavi (Osmanabad) 13 3 1 1 103 Dharur --- 16 6 8 2 8
40 OSMANABAD CIRCLE 6 3 lIS. 55 155 26 192 21 216 31
104 Shekapur 4 1 2 1 2 6 105 Deolali 8 3 3 1 8 25 106 Medsinga 2 2 7 4 10 107 Baramgaon Bk. 1 108 Chikhali 6 3 17 4 1 7 1 109 Borgaon Raje 1 22 14 9 5 110 Mahalingi 4 1 2 7 111 Ambewadi 1 10 2 4 4 112 Ruibhar 7 1 15 1 20 15 5 113 Gaundgaon 4 3 3 114 Ansurda 3 1 1 115 Vitthalwadi 2 4 116 Bembli 6 59 23 97 2 50 2 175 6 117 Mahadevwadi 2 118 Umaregavhan 2 2 39 1 3 119 Keshegaon 14 2 7 6 26 1 120 Bamaniwadi 15 1 8 4 8 15 121 Bamani . 13 24 9 17 3 122 Baramgaon Kh. 4 3 2 4 123 Wadala 2 4 124 Gogaon 2 1 1 1 125 Patoda 4 52 9 2 3 2 126 Takwiki 13 2 10 16 13 1 127 Toramba 7 2 1 4 128 Karajkheda 3 5 23 1 14 9 1
50 BEMBLI CIRCLE 31 8 156 101 266 26 192 4 358 21
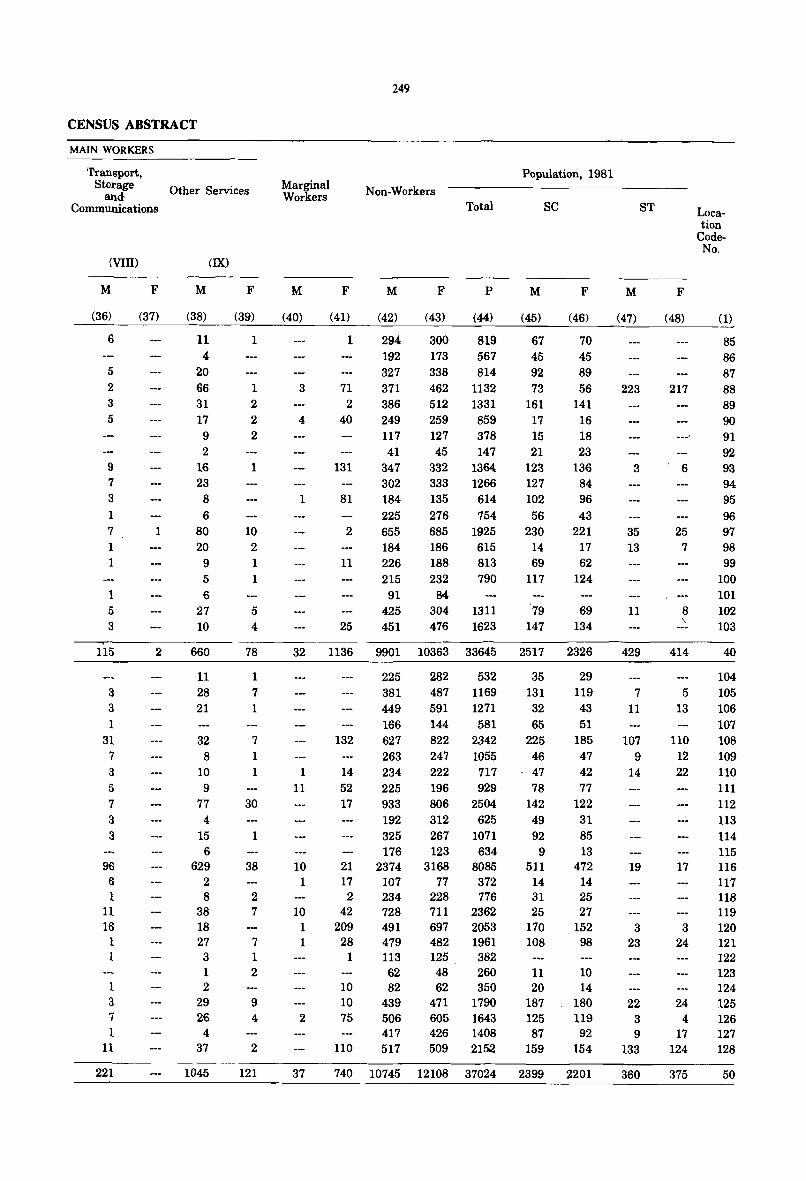
249
CENSUS ABSTRACT
MAIN WORKERS
'I'ransport, Storage
andCommunications
(VIII)
M F
Other Services
(IX)
Marginal Workers Non-Workers
Population, 1981
Total SC ST
M F M F M F PM F M F
Location
CodeNo.
___ (3_6} __ ~(3_7_) ___ (_38~) ___ (_3~9) __ ~(4_0~) __ ~(_41~) ___ (~4~2) __ ~(4_3~) __ ~(~#~) __ ~(4~5) __ ~(4_6~} ___ (~47~) __ ~(4~8)~ __ (1)
6 11 1 1 294 300 819 67 70 85
5 2 3 5
9 7 3
1 7 1 1
1 5 3
115
3 3 1
31 7 3 5 7 3 3
96 6 1
11 16
1 1
1 3 7 1
11
221
1
2
4 192 173 567 45 45 86 20 327 338 814 92 89 87 66 1 3 71 371 462 1132 73 56 223 217 88 31 2 2 386 512 1331 161 141 89 17 2 4 40 249 259 859 17 16 90 9 2 117 127 378 15 18 . 91 2 41 45 147 21 23 92
16 1 131 347 332 1364 123 136 3 6 93 23 302 333 1266 127 84 94
8 1 81 184 135 614 102 96 95 6 225 276 754 56 43 96
80 10 2 655 685 1925 230 221 35 25 97 20 2 184 186 615 14 17 13 7 98
9 1 11 226 188 813 69 62 99 5 1 215 232 790 117 124 100 6 91 84 101
27 5 425 304 1311 '79 69 11 8 102 10 4 25 451 476 1623 147 134 "103
660
11 28 21
32 8
10 9
77 4
15 6
629 2 8
38 18 27 3 1 2
29 26
4 37
1045
78
1 7 1
7 1 1
30
1
38
2 7
7 1 2
9 4
2
121
32 1136 9901 10363 33645 2517 2326
1 11
10 1
10 1 1
2
37
132
14 52 17
21 17 2
42 209
28 1
10 10 75
110
740
225 381 449 166 627 263 234 225 933 192 325 176
2374 107 234 728 491 479 113 62 82
439 506 417 517
10745
282 532 487 1169 591 1271 144 581 822 2342 247 1055 222 717 196 929 806 2504 312 625 267 1071 123 634
3168 8085 77 372
228 776 711 2362 697 2053 482 1961 125 382 48 260 62 350
471 1790 605 1643 426 1408 509 21512
12108 37024
35 131 32 65
225 46
. 47
78 142 49 92
9 511
14 31 25
170 108
11 20
187 125 87
159
2399
29 119 43 51
185 47 42 77
122 31 85 13
472 14 25 27
152 98
10 14
180 119 92
154
2201
429
7 11
107 9
14
19
3 23
22 3 9
133
360
414
5 13
110 12 22
17
3 24
24 4
17 124
375
40
104 105 106 107 108 109 110 111 112 113 114 115 116 117 118 119 120 121 122 123 124 125 126 127 128
50
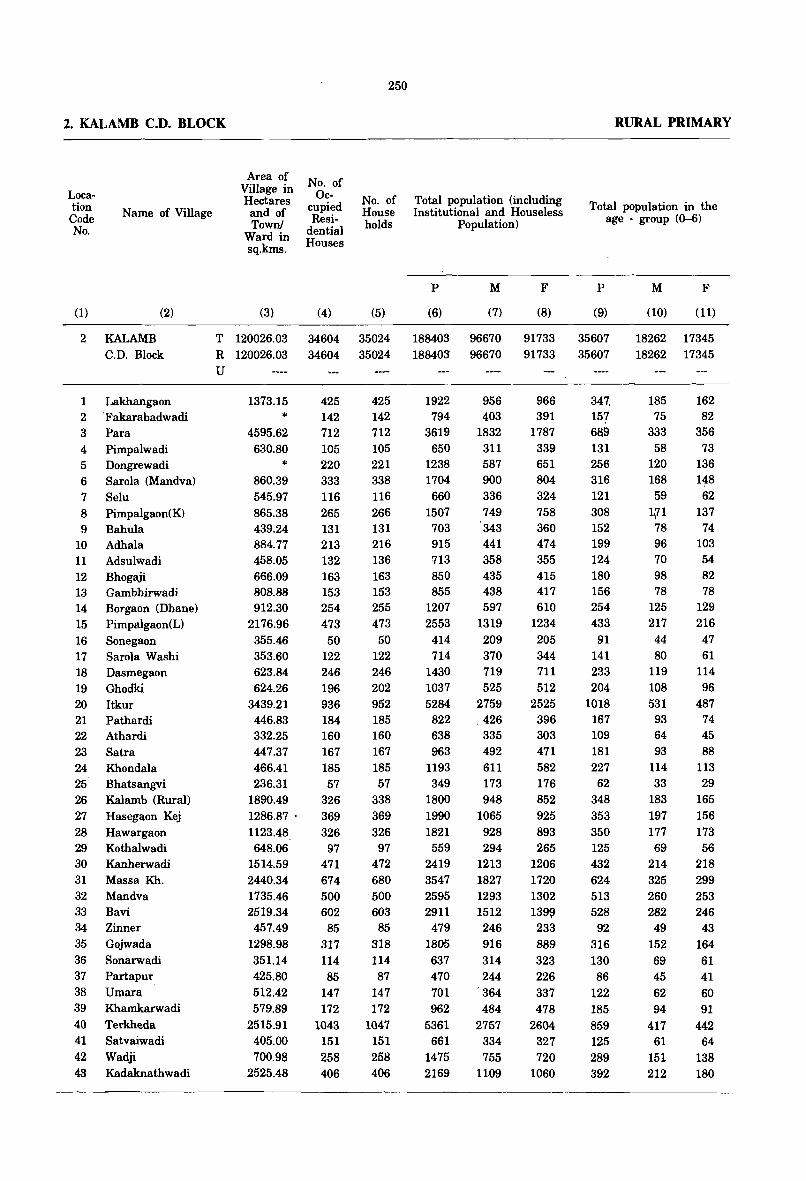
250
2. KALAMB C.D. BLOCK RURAL PRIMARY
Location Code No.
Name of Village
(l) (2)
2 KALAMB C.D. Block
1 Lakhangaon 2 'Fakarabadwadi 3 Para 4 Pimpalwadi 5 Dongrewadi 6 Sarola (Mandva) 7 Selu 8 Pimpalgaon(K) 9 Bahula
10 Adhala 11 Adsulwadi 12 Bhogaji 13 Gambhirwadi 14 Borgaon (Dhane) 15 Pimpalgaon(L) 16 Sonegaon 17 Sarola Washi 18 Dasmegaon 19 Ghodki 20 Itkur 21 Pathardi 22 Athardi 23 Satra 24 Khondala 25 Bhatsangvi 26 Kalamb (Rural) 27 Hasegaon Kej 28 Hawargaon 29 Kothalwadi 30 Kanherwadi 31 Massa Kh. 32 Mandva 33 Bavi 34 Zinner 35 Gojwada 36 Sonarwadi 37 Partapul' 38 Umara 39 Khamkarwadi 40 Terkheda 41 Satvaiwadi 42 Wadji 43 Kadaknathwadi
Area of Village in Hectares and of Town!
No. of Oc
cupied Resi
dential Houses
No. of House holds
Total population (including Institutional and Houseless
Population)
Total population in the age - group (0-6)
Ward in sq.kms.
P M F P
(3) (4) (5) (6) (7) (8) (9)
T 120026.03 34604 35024 188403 96670 91733 35607 R 120026.03 34604 35024 188403 96670 91733 35607 U
1373.15 425
* 142 4595.62 712
630.80 105
* 220 860.39 333 545.97 116 865.38 265 439.24 131 884.77 213 458.05 132 666.09 163 808.88 153 912.30 254
2176.96 473 355.46 50 353.60 122 623.84 246 624.26 196
3439.21 936 446.83 184 332.25 160 447.37 167 466.41 185 236.31 57
1890.49 326 1286.87 . 369 1123.48 326 648.06 97
1514.59 471 2440.34 674 1735.46 500 2519.34 602
457.49 85 1298.98 317 351.14 114 425.80 85 512.42 147 579.89 172
2515.91 1043 405.00 151 700.98 258
2525.48 406
425 142 712 105 221 338 116 266 131 216 136 163 153 255 473 50
122 246 202 952 185 160 167 185 57
338 369 326
97 472 680 500 603
85 318 114 87
147 172
1047 151 258 406
1922 794
3619 650
1238 1704
660 1507
703 915 713 850 855
1207 2553
414 714
1430 1037 5284
822 638 963
1193 349
1800 1990 1821
559 2419 3547 2595 2911
479 1805
637 470 701 962
5361 661
1475 2169
956 403
1832 311 587 900 336 749 343 441 358 435 438 597
1319 209 370 719 525
2759 .426
335 492 611 173 948
1065 928 294
1213 1827 1293 1512
246 916 314 244
. 364
484 2757
334 755
1109
966 347. 391 . 151
1787 . 689
339 131 651 256 804 316 324 121 758 308 360 152 474 199 355 124 415 180 417 156 610 254
1234 433 205 91 344 141 711 233 512 204
2525 1018 396 167 303 109 471 181 582 227 176 62 852 348 925 353 893 350 265 125
1206 432 1720 624 1302 513 13W 528
233 92 889 316 323 130 226 86 337 122 478 185
2604 859 327 125 720 289
1060 392
M F
(10) (11)
18262 17345 18262 17345
185 75
333 58
120 168 59
111 78 96 70 98 78
125 217 44 80
119 108 531
93 64 93
114 33
183 197 177 69
214 325 260 282 49
152 69 45 62 94
417 61
151 212
162 82
356 73
136 148 62
137 74
103
54 82 78
129 216 47 61
114 96
487 74 45 88
113 29
165 156 173 56
218 299 253 246
43 164 61 41 60 91
442 64
138 180
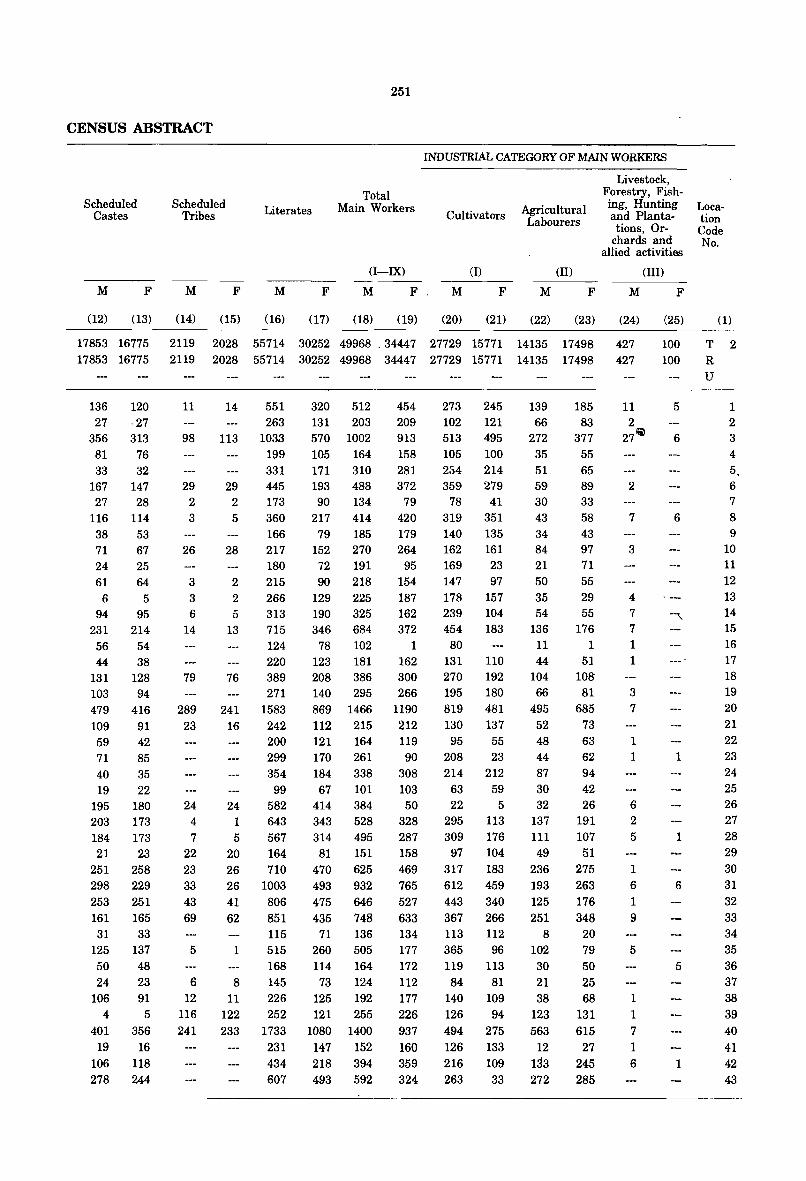
CENSUS ABSTRACT
Scheduled Castes
Scheduled Tribes Literates
251
Total Main Workers
(I-IX)
INDUSTRIAL CATEGORY OF MAIN WORKERS
Cultivators
(I)
Agricultural Labourers
(II)
Livestock, Forestry, Fishing, Hunting and Plantations, Or
chards and allied activities
(III)
Location Code No.
M F M F M F M F, M F M F M F
(12) (13) (14) (15) (16) (17) (18) (19) (20) (21) (22) (23) (24) (25) (1) -------------------------------------------------------------------------------
17853 16775 2119 2028 55714 30252 49968 _ 34447 27729 15771 14135 17498 427 17853 16775 2119 2028 55714 30252 49968 34447 27729 15771 14135 17498 427
136 120 27 ·27
356 313 81 76 33 32
167 147 27 28
116 114 38 53 71 67 24 25 61 64
6 5 94 95
231 214 56 54 44 38
131 128 103 94 479 416 109 91 59 71 40 19
42 85 35 22
195 180 203 173 184 173 21 23
251 258 298 229 253 251 161 165
31 33 125 137 50 48 24 23
106 91 4 5
401 356 19 16
106 118 278 244
11
98
29 2 3
26
3 3
6
14 551 263
113 1033
29 .2
5
28
2 2 5
199 331 445 173 360 166 217 180 215 266 313
320 512 131 203 570 1002 105 164 171 310 193 488 90 134
217 414 79 185
152 270 72 191 90 218
129 225 190 325
454 209 913 158 281 372
79 420 179 264
95 154 187 162
14 13 715 346 684 372 124 220
78 102 1 123 181 162
79 76 389 208 386 300 271 140 295 266
289 241 1583 869 1466 1190 23 16 242 112 215 212
24 4 7
22 23 33
43 69
200 299 354 99
24 582 1 643 5 567
20 164 26 710 26 1003 41 62
806 851
121 164 170 261 184 338 67 101
414 384 343 528 314 495 81 151
470 625 493 932 475 646 435 748
115 71 136 5 1 515 260 505
168 114 164 6 8 145 73 124
12 11 226 125 192 116 122 252 121 255 241 233 1733 lOBO 1400
231 147 152 434 218 394 607 493 592
119 90
308 103 50
328 287 158 469 765 527 633 134 177 172 112 177 226 937 160 359 324
273 245 102 121 513 495 105 100 2:14 214 359 279
78 41 319 351 140 135 162 161 169 23 147 97 178 157 239 104 454 183
80 131 110 270 192 195 180 819 481 130 137 95 55
208 23 214 212
63 59 22 5
295 113 309 176
97 104 317 183 612 459 443 340 367 266 113 112 365 96 119 113
84 81 140 109 126 94 494 275 126 133 216 109 263 33
139 66
272 35 51 59 30 43 34 84 21 50 35 54
136 11 44
104 66
495 52 48 44 87 30 32
137 111 49
236 193 125 251
8 102 30 21 38
123 563
12 133 272
185 83
377 55 65 89 33 58 43 97 71 55 29 55
176 1
51 108'
81 685
73 63 62 94 42 26
191 107 51
275 263 176 348
20 79 50 25 68
131 615
27 245 285
11 2 27~
2
7
3
4 7 7 1 1
3
7
1 1
6 2 5
1
6 1
9
5
1
1 7 1 6
100 T 2 100 R
U
5
6
6
1
1
6
5
1
1 2 3 4 5. 6 7 8 9
10 11 12 13 14 15 16 17 18 19 20 21 22 23 24 25 26 27 28 29 30 31 32 33 34 35 36 37 38 39 40 41 42 43
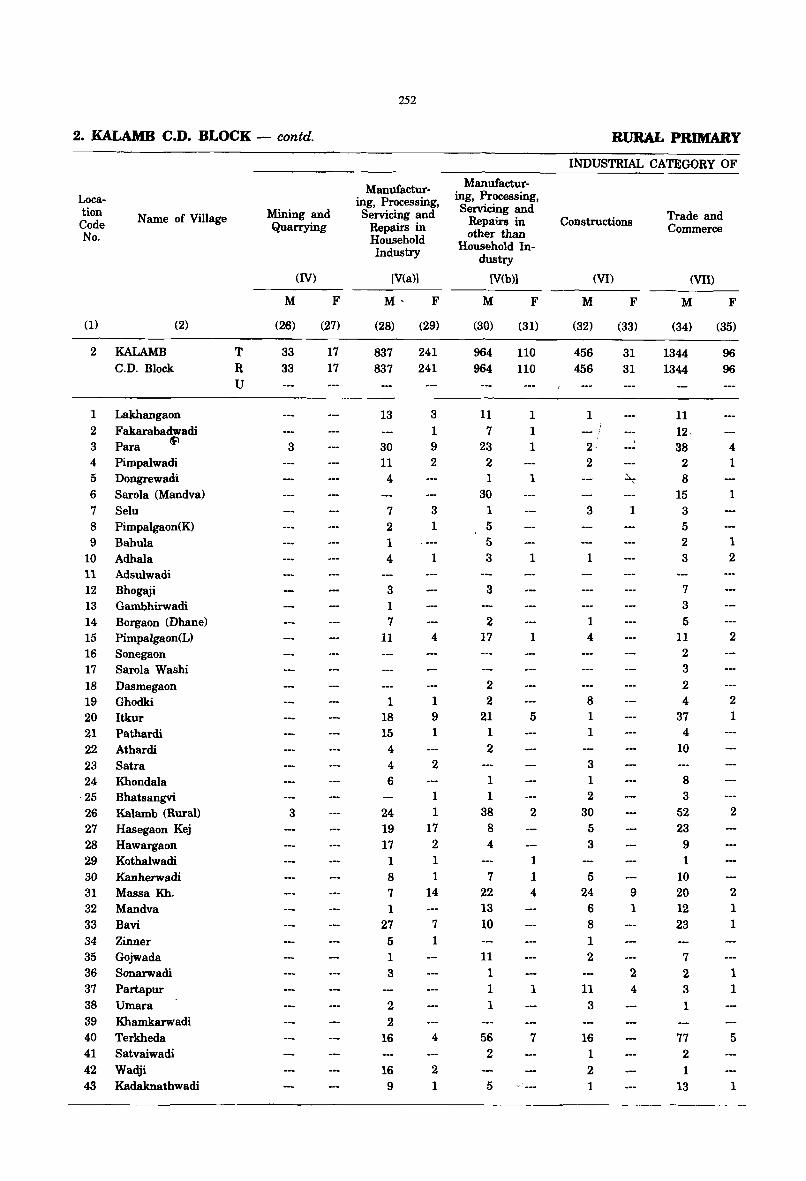
2. KALAMB C.D. BLOCK - contd.
Location Code No.
Name of Village
(1) (2)
2 KALAMB C.D. Block
1 2 3
4 5 6 7 8 9
Lakhangaon Fakarabadwadi
f\ Para Pimpalwadi Dongrewadi Sarola (Mandva) Selu Pimpalgaon(K) Bahula
10 Adhala 11 Adsulwadi 12 Bhogaji 13 Gambhirwadi 14 Borgaon (Dhane) 15 Pimpalgaon(L) 16 Sonegaon 17 Sarola Washi 18 Dasmegaon 19 Ghodki 20 Itkur 21 Pathardi 22 Athardi 23 Satra 24 Khondala
- 25 Bhatsangvi 26 Kalamb (Rural) 27 Hasegaon Kej 28 Hawargaon 29 Kothalwadi 30 Kanherwadi 31 Massa Kh. 32 Mandva 33 Bavi 34 Zinner 35 Gojwada 36 Sonarwadi 37 Partapur 38 Umara 39 Khamkarwadi 40 Terkheda 41 Satvaiwadi 42 Wadji 43 Kadaknathwadi
T R U
Mining and Quarrying
(IV)
M F
(26)
33 33
3
3
(27)
17 17
252
Manufacturing, Processing, Servicing and
Repairs in Household Industry
[V(a)]
M· F
(28)
837 837
13
30 11
4
7 2 1 4
3 1 7
11
1 18 15
4 4 6
24 19 17 1 8 7 1
27 5 1 3
2 2
16
16 9
(29)
241 241
3 1 9 2
3 1
1
4
1 9 1
2
1
1 17 2 1 1
14
7 1
4
2 1
Manufacturing, Processing, Servicing and
Repairs in other than
Household Industry
[V(b)]
M F
(30)
964 964
11 7
23 2 1
30 1 5 5 3
3
2 17
2 2
21 1 2
1 1
38 8
4
7 22 13 10
11 1 1 1
56 2
5
(31)
110 110
1
1 1
1
1
1
5
2
1
1 4
1
7
RURAL PRIMARY
INDUSTRIAL CATEGORY OF
Constructions
(VI)
M F
(32)
456 456
1 I
-_ .. I
2,
2
3
1
1 4
8 1 1
3 1 2
30 5 3
5 24
6 8 1 2
11 3
16 1
2 1
(33)
31 31
1
9 1
2 4
Trade and Commerce
(VII)
M F
(34)
1344 1344
11 12, 38
2 8
15 3 5
2 3
7 3 5
11 2 3
2 4
37
4 10
8 3
52 23
9 1
10 20 12 23
7 2 3
1
77 2
1 13
(35)
96 96
4 1
1
1 2
2
2 1
2
2 1
1
1 1
5
1
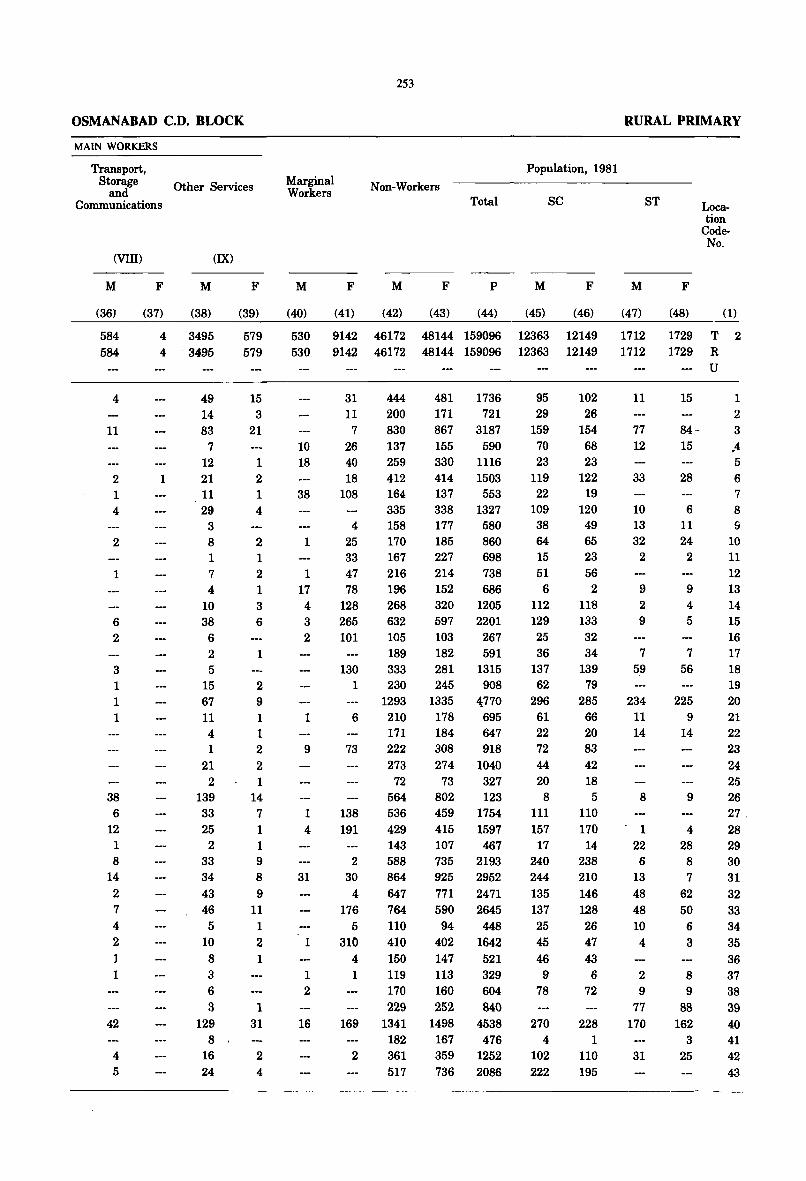
OSMANABAD C.D. BLOCK
MAIN WORKERS
Transport, Storage Other Services
and Communications
(VIII)
M
(36)
584 584
4
11
2 1 4
2
1
6 2
3 1 1
1
38 6
12 1 8
14 2 7 4 2 1 1
42
4 5
(IX)
F M
(37) (38)
4 3495 4 3495
1
49 14 83
7 12 21 11 29
3 8 1 7 4
10 38
6 2 5
15 67 11 4 1
21 2
139 33 25
2 33 34 43 46
5 10 8 3
6 3
129 8
16 24
F
(39)
579 579
15 3
21
1 2 1 4
2 1 2 1 3 6
1
2 9
1 1 2 2 1
14 7 1 1 9
8 9
11 1 2 1
1 31
2 4
Marginal Workers
M
(40)
F
(41)
253
Non-Workers
M
(42)
F
(43)
Total
P
(44)
Population, 1981
SC
M F
(45) (46)
RURAL PRIMARY
ST
M
(47)
F
(48)
Location
CodeNo.
(1)
530 9142 46172 48144 159096 12363 12149 1712 1729 T 2 530 9142 46172 48144 159096 12363 12149 1712 1729 R
10 18
38
1
1 17
4 3 2
1
9
1 4
31
1
1 2
16
31 11 7
26 40 18
108
444 200 830 137 259 412 164 335
4 158 25 170 33 167 47 216 78 196
128 268 265 632 101 105
189 130 333
1 230 1293
6 210 171
73 222
273 72
564 138 536 191 429
143 2 588
30 864 4 647
176 764 5 110
310 410 4 150 1 119
170 229
481 1736 171 721 867 3187 155 590 330 1116 414 1503 137 553 338 1327 177 580 185 860 227 698 214 738 152 686 320 1205 597 2201 103 267 182 591 281 1315 245 908
1335 ~770
178 695 184 647 308 918 274 1040
73 327 802 123 459 1754 415 1597 107 467 735 2193 925 2952 771 2471 590 2645 94 448
402 1642 147 521 113 329 160 252
604 840
169 1341 1498 4538
2 182 361 517
167 476 359 1252 736 2086
95 29
159 70 23
119 22
109 38 64 15 51 6
112 129 25 36
137 62
296 61 22 72 44 20
8 111 157 17
240 244 135 137 25 45 46 9
78
270 4
102 222
102 26
154 68 23
122 19
120 49 65 23 56
2 118 133 32 34
139 79
285 66 20 83 42 18
5 110 170 14
238 210 146 128 26 47 43 6
72
228 1
110 195
11
77 12
33
10 13 32
2
9 2 9
7 59
234 11 14
8
. 1
22 6
13 48 48 10 4
2 9
77 170
31
15
84-15
28
6 11 24
2
9 4 5
7 56
225 9
14
9
4
28 8 7
62 50
6 3
8 9
88 162
3
25
U
1
2 3
,4 5 6 7 8 9
10 11 12 13 14 15 16 17 18 19 20 21 22 23 24 25 26 27 . 28 29 30 31 32 33 34 35 36 37 38 39 40 41 42 43
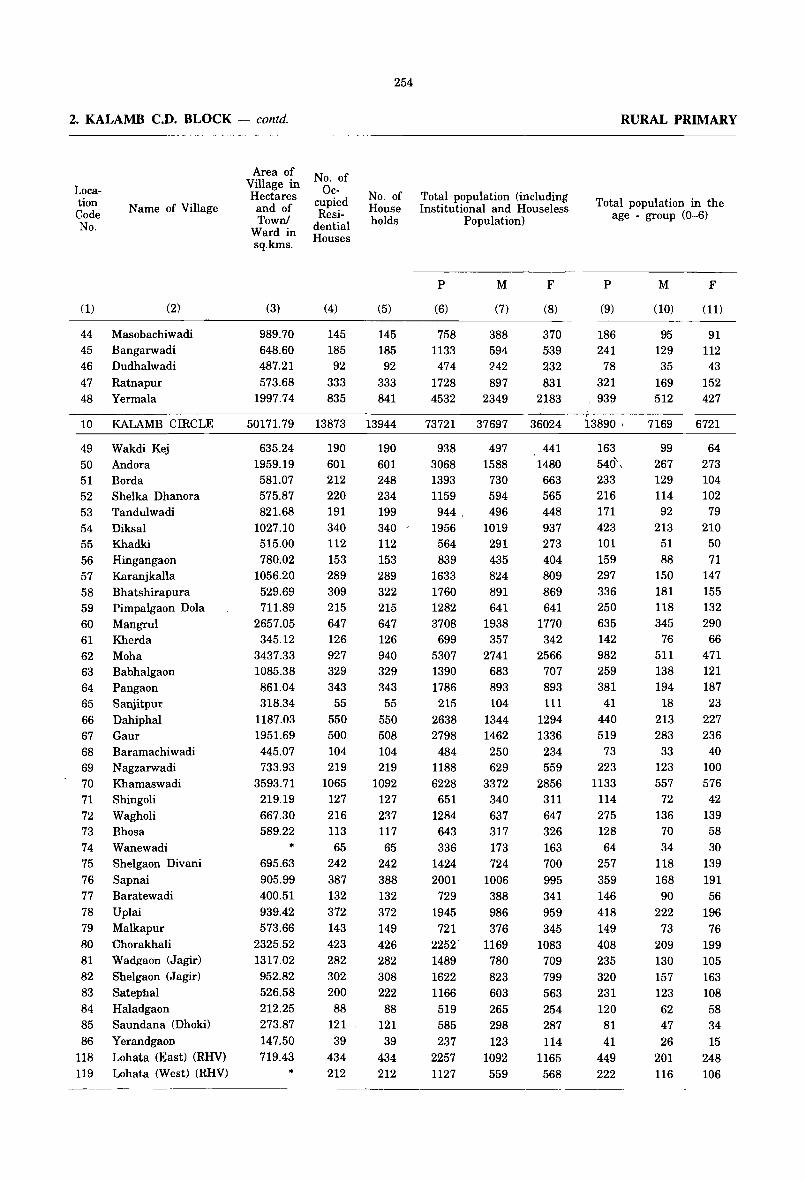
2. KALAMB C.D. BLOCK - contd.
Location Code No.
(1)
44 45 46 47 48
10
49 50 51 52 53 54 55 56 57 58 59 60 61 62 63 64 65 66 67 68 69 70 71 72 73 74 75 76 77 78 79 80 81 82 83 84 85 86
118 119
Name of Village
(2)
Masobachiwadi Bangarwadi Dudhalwadi Ratnapur Yermala
KALAMB CIRCLE
Wakdi Kej Andora Borda Shelka Dhanora Tandulwadi Diksal Khadki Hingangaon Karanjkalla Bhatshirapura Pimpalgaon Dola Mangrul Kherda Moha Babhalgaon Pangaon Sanjitpur Dahiphal Gaur Baramachiwadi Nagzarwadi Khamaswadi Shingoli Wagholi Bhosa Wanewadi Shelgaon Divani Sapnai Baratewadi Uplai Malkapur Ohorakhali Wac4raon (Jagir) Shelgaon (Jagir) Satepbal Haladgaon Saundana (Dhoki)
Yerandgaon Lohata (East) (RHV) Lohata (West) (RHV)
Area of Village in Hectares and of Town!
Ward in sq.kms.
(3)
989.70 648.60 487.21 573.68
1997.74
50171.79
635.24 1959.19 581.07 575.87 821.68
1027.10 515.00 780.02
1056.20 529.69 711.89
2657.05 345.12
3437.33 1085.38 861.04 318.34
1187.03 1951.69 445.07 733.93
3593.71 219.19 667.30 589.22
* 695.63 905.99 400.51 939.42 573.66
2325.52 1317.02 952.82 526.58 212.25 273.87 147.50 719.43
*
No. of Oc
cupied Resi
dential Houses
(4)
145 185 92
333 835
13873
190 601 212 220 191 340 112 153 289 309 215 647 126 927 329 343 55
550 500 104 219
1065 127 216 113 65
242 387 132 372 143 423 282 302 200 88
121 39
434 212
254
No. of House holds
(5)
145 185 92
333 841
13944
190 601 248 234 199 340 / 112 153 289 322 215 647 126 940 329 343 55
550 508 104 219
1092 127 237 117 65
242 388 132 372 149 426 282 308 222 88
121 39
434 212
Total population (including Institutional and Houseless
Population)
P
(6)
758 1133 474
1728 4532
73721
938 3068 1393 1159 944,
1956 564 839
1633 1760 1282 370B
699 5307 1390 1786 215
2638 2798
484 1188 6228
651 1284 643 336
1424 2001 729
1945 721
2252' 1489 1622 1166 519 585 237
2257 1127
M
(7)
388 594 ?42
897 2349
37697
497 1588
730 594 496
1019 291 435 824 891 641
1938 357
2741 683 893 104
1344 1462 250 629
3372 340 637 317 173 724
1006 388 986 376
1169 780 823 603 265 298 123
1092 559
F
(8)
370 539 232 831
2183
36024
441 1480 663 565 448 937 273 404 809 869 641
1770 342
2566 707 893 111
1294 1336 234 559
2856 311 647 326 163 700 995 341 959 345
1083 709 799 563 254 287 114
1165 568
RURAL PRIMARY
Total population in the age - group (0-6)
P
(9)
186 241
78 321 939
13890 '
163 540\ 233 216 171 423 101 159 297 336 250 635 142 982 259 381 41
440 519
73 223
1133 114 275 128 64
257 359 146 418 149 408 235 320 231 120 81 41
449 222
M
(10)
95 129 35
169 512
7169
99 267 129 114 92
213 51 88
150 181 118 345
76 511 138 194 18
213 283
33 123 557 72
136 70 34
118 168 90
222 73
209 130 157 123 62 47 26
201 116
F
(11)
91 112 43
152 427
6721
64 273 104 102 79
210 50 71
147 155 132 290 66
471 121 187 23
227 236 40
100 576
42 139 58 30
139 191 56
196 76
199 105 163 108 58 34 15
248 106
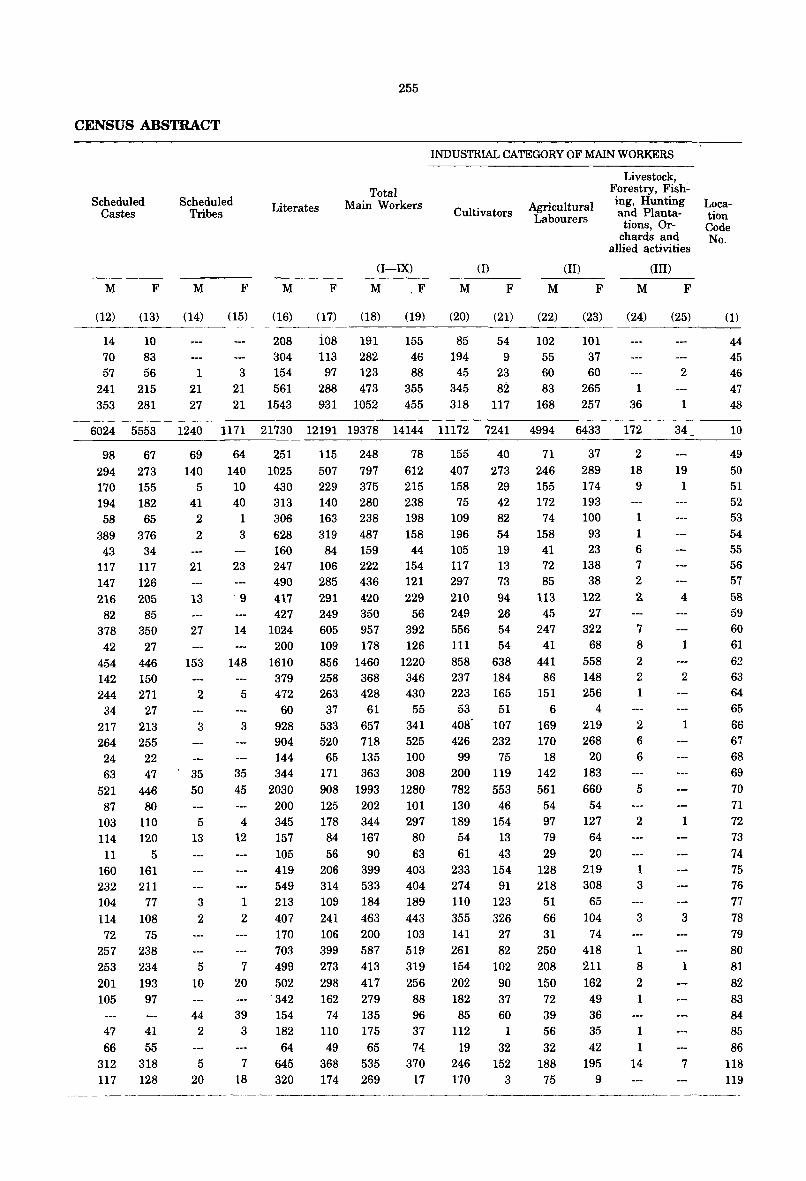
255
CENSUS ABSTRACT
Scheduled Castes
Scheduled Tribes Literates
Total Main Workers
M F M
(12) (13) (14)
14 10 70 83 57 56 1
241 215 21
353 281 27
F M
(15) (16)
208 304
3 154 21 561 21 1543
(I-IX)
F M .F
(17) (18) (19)
i08 191 155 113 282 46
97 123 88 288 473 355 931 1052 455
INDUSTRIAL CATEGORY OF MAIN WORKERS
Cultivators
(I)
M F
Agricultural Labourers
(II)
M F
Livestock, Forestry, Fish~ mg, Hunting and Plantations, Or
chards and allied activities
(III)
M F
(20) (21) (22) (23) (24) (25)
85 54 102 101 194 9 55 37
45 23 60 60 2 345 82 83 265 1 318 117 168 257 36 1
6024 5553 1240 1171 21730 12191 19378 14144 11172 7241 4994 6433 172 34
98 67 294 273 170 155 194 182 58 65
389 376 43 34
117 117 147 126
216 205 82 85
378 350 42 27
454 446 142 150 244 271
34 27 217 213 264 255
24 22 63 47
521 446 87 80
103 110 114 120
11 5 160 161 232 211 104 77
114 108 72 75
257 238 253 234
201 193 105
47
66
97
41
55 312 318 117 128
69
140 5
41 2
2
21
13
27
153
2
3
35 50
5 13
3 2
5 10
44 2
5 20
64 251
140 1025 10 430 40 313
1 306 3 628
160 23 247
490 ·9 417
427 14 1024
200 148 1610
379 5 472
60 3 928
904 144
35 344
45 2030 200
4 345 12 157
105 419 549
1 213
2 407 170 703
7 499
20 502 '342
39 154 3 182
7
18
64 645 320
115 248 78
507 797 612 229 375 215 140 280 238 163 238 198 319 487 158
84 159 44 106 222 154 285 436 121
291 420 229 249 350 56 605 957 392 109 178 126
856 1460 1220 258 368 346 263 428 430
37 61 55 533 657 341 520 718 525
65 135 100 171 363 308 908 1993 1280 125 202 101 178 344 297
84 167 80
56 90 63 206 399 403 314 533 404 109 184 189
241 463 443 106 200 103 399 587 519 273 413 319
298 417 256 162 279
74 135 110 175
49 65 368 535 174 269
88 96 37 74
370 17
155 40
407 273 158 29
75 42 109 82 196 54 105 19 117 13 297 73
210 94 249 26 556 54 111 54
858 638 237 184 223 165
53 51 408' 107 426 232
99 75 200 119
782 553 130 46 189 154
54 13
61 43 233 154 274 91 110 123
355 326 141 27 261 82 154 102
202 90 182 85
112
19
37 60
1
32 246 152 1'70 3
71 246 155 172
74 158 41 72 85
113 45
247 41
441 86
151 6
169 170
18 142
561 54 97 79
29 128 218
51 66 31
250 208
150 72 39 56
32 188
75
37
289 174 193 100
93 23
138 38
122 27
322 68
558 148 256
4 219 268
20 183
660 54
127 64 20
219 308
65
104 74
418 211 162
49 36 35 42
195 9
2
18 9
1
1 6 7 2 2
7 8 2 2 1
2 6 6
5
2
1 3
3
1 8
2 1
1
1 14
19 1
4
1
2
1
1
3
1
7
Location Code No.
(1)
44 45 46 47 48
10
49
50 51 52 53 54 55 56 57
58 59 60 61 62 63 64 65 66 67 68 69
70 71 72 73
74 75 76 77 78 79 80 81
82 83 84 85 86
118 119
----------------.-----------
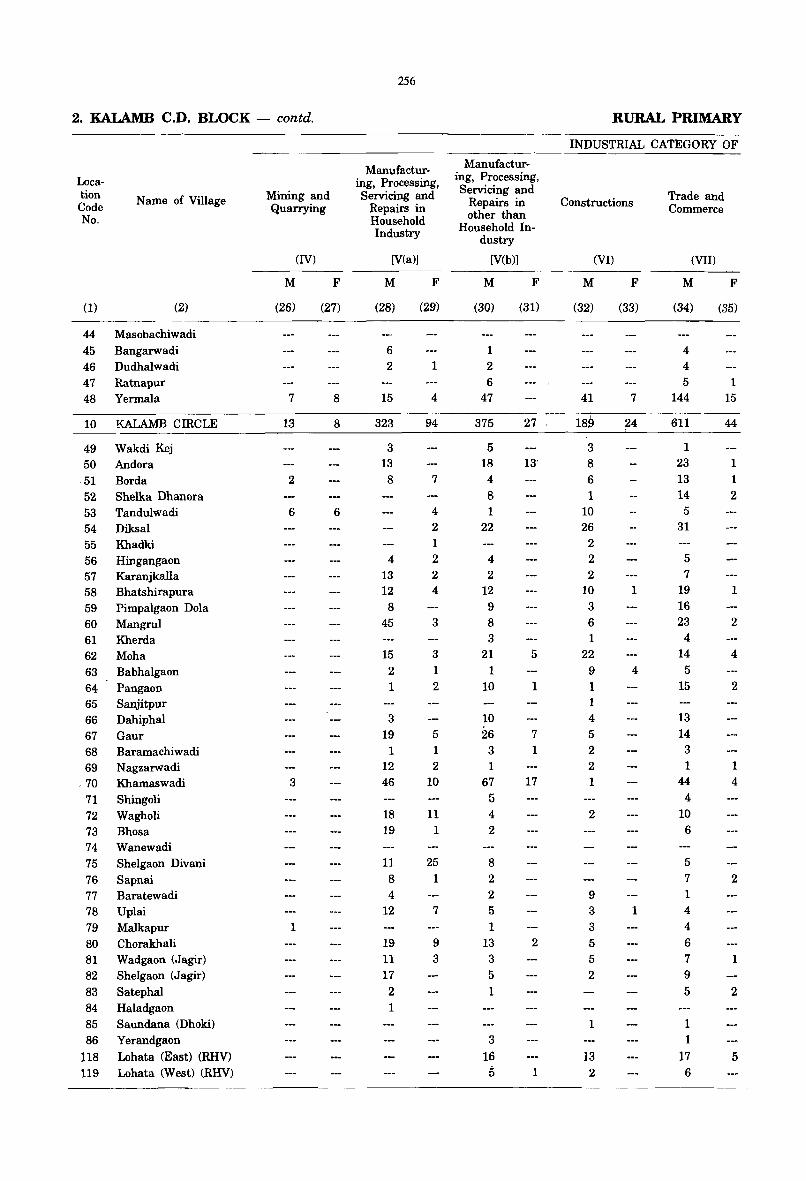
256
2. KALAMB C.D. BLOCK - contd. RURAL PRIMARY
___________________ I_N.:.::D--=-.:::USTRIAL CATEGORY OF
Location Code No.
Name of Village
(1) (2)
44 Masobachiwadi 45 Bangarwadi 46 Dudhalwadi 47 Ratnapur 48 Yermala
10 KALAMB CIRCLE
49 Wakdi Kej 50 Andora
·51 Borda 52 Shelka Dhanora 53 Tandulwadi 54 Diksal 55 Khadki 56 Hingangaon 57 Karanjkalla 58 Bhatshirapura 59 Pimpalgaon Dola 60 Mangrul 61 Kherda 62 Moha 63 Babhalgaon 64 Pangaon 65 Sanjitpur 66 Dahiphal 67 Gaur 68 Baramachiwadi 69 Nagzarwadi
- 70 Khamaswadi 71 Shingoli 72 Wagholi 73 Bhosa 74 Wanewadi 75 Shelgaon Divani 76 Sapnai 77 Baratewadi 78 Uplai 79 Malkapur 80 Chorakhali 81 Wadgaon (Jagir) 82 Shelgaon (Jagir) 83 Satephal 84 Haladgaon 85 Saundana (Dhoki) 86 Yerandgaon
118 Lohata (East) (RHV) 119 Lohata (West) (RHV)
Mining and Quarrying
M
(26)
7
13
2
6
3
1
(IV)
F
(27)
8
8
6
Manufacturing, Processing, Servicing and
Repairs in Household Industry
[V(a)]
M
(28)
6 2
15
323
3 13 8
4 13 12
8 45
15 2 1
3
19 1
12 46
18 19
11 8 4
12
19 11 17 2 1
F
(29)
1
4
94
7
4 2 1 2 2 4
3
3 1 2
5
1 2
10
11 1
25 1
7
9 3
Manufacturing, Processing, Servicing and
Repairs in other than
Household Industry
[V(b)]
M
(30)
1 2 6
47
375
5 18
4 8 1
22
4 2
12 9 8 3
21 1
10
10 26
3 1
67 5 4 2
8 2 2 5 1
13 3
5 1
3 16
I)
F
(31)
27
13'
5
1
7 1
17
2
1
Constructions
M
(32)
41
(VI)
3 8 6 1
10 26
2 2 2
10 3 6 1
22
9 1 1 4 5
2 2 1
2
9 3
3
5 5 2
1
13 2
F
(33)
7
24
1
4
1
Trade and Commerce
(VII)
M F
(34) (35)
4 4 5
144
611
1 23 13 14
5
31
5 7
19 16 23
4 14
5 15
13 14
3
1 44
4
10
6
5 7 1 4 4 6 7 9 5
1
1 17 6
1
15
44
1 1
2
1
2
4
2
1 4
2
1
2
5
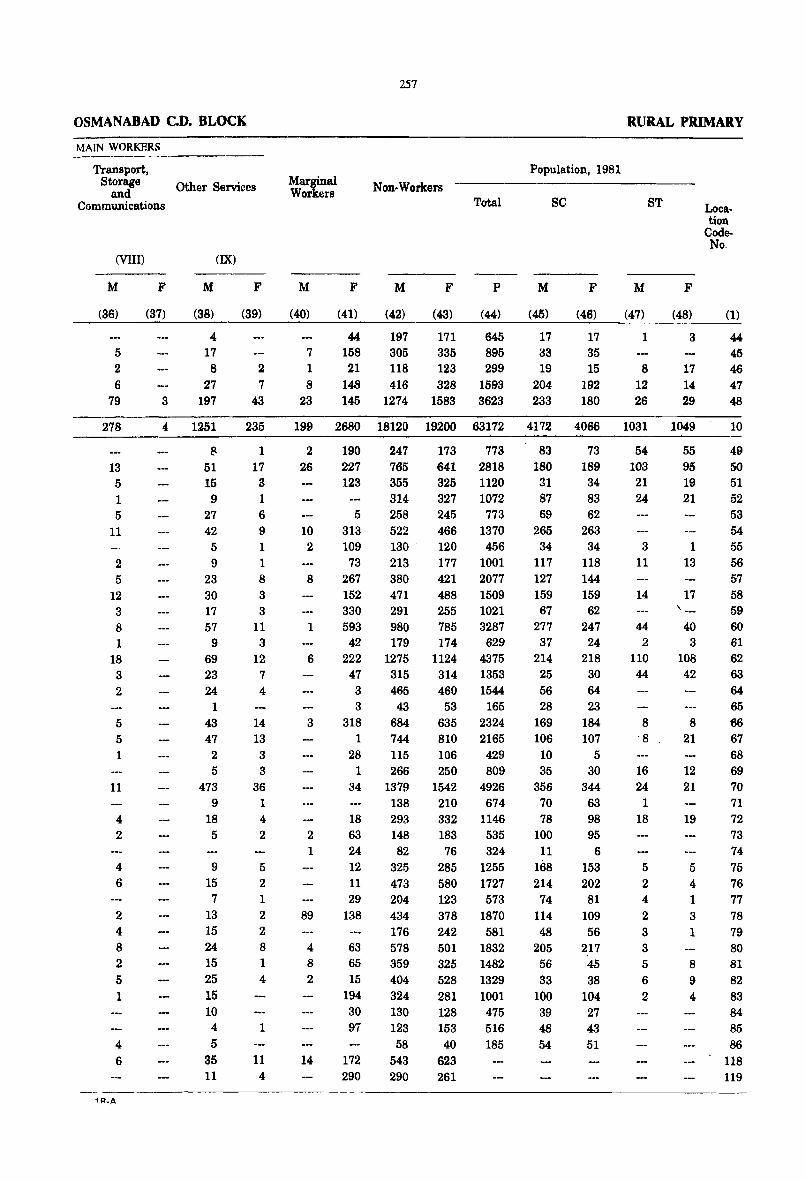
OSMANABAD C.D. BLOCK
MAIN WORKERS
Transport, Storage Other Services
and Communications
(VIII)
M
(36)
5 2 6
79
278
13 5 1 5
11
2 5
12 3 8 1
18 3
2
5 5 1
11
4 2
4 6
2 4 8 2 5 1
4 6
1R_A
F
(37)
3
M
(38)
(IX)
4 17 8
27 197
4 1251
8 51 15 9
27 42
5 9
23 30 17 57 9
69 23 24
1 43 47
2 5
473 9
18 5
9 15
7 13 15 24 15 25 15 10
4 5
35 11
F
(39)
2 7
43
235
1 17 3 1 6 9 1 1 8 3 3
11 3
12 7 4
14 13 3 3
36 1 4 2
5 2 1 2 2 8 1 4
1
11 4
Marginal Workers
M
(40)
7 1 8
23
257
Non-Workers Total
F M F P
(41) (42) (43) (44)
44 197 171 645 158 305 335 895 21 118 123 299
148 416 328 1593 145 1274 1583 3623
PopUlation, 1981
M
(45)
17 33 19
204 233
SC
F
(46)
17 35 15
192 180
RURAL PRIMARY
M
(47)
1
8 12 26
ST
F
(48)
3
17 14 29
Location
CodeNo.
(1)
44 45 46 47 48
199 2680 18120 19200 63172 4172 4066 1031 1049 - 10
2 26
10 2
8
1
6
3
2 1
89
4-8 2
14
190 227 123
5
247 765 355 314 25B
173 773 641 2818 325 1120 327 1072 245 773
313 522 466 1370 109 130' 120 456 73 213 177 1001
267 380 421 2077 152 471 488 1509 330 291 255 1021 593 980 785 3287 42 179 174 629
222 1275 1124 4375 47 315 314 1353 3 465 460 1544 3 43 53 165
318 684 635 2324 1 744 810 2165
28 115 106 429 1 266 250 809
34 1379 1542 4926
18 63 24 12 11 29
138
63 65 15
194 30 97
172 290
138 210 674 293 148 82
325 473 204 434 176 578 359 404 324-130 123 58
543 290
332 1146 183 535 76 324
285 1255 580 1727 123 573 378 1870 242 581 501 1832 325 1482 528 1329 281 1001 128 153 40
623 261
475 516 185
83 180 31 87 69
265 34
117 127 159 67
277 37
214 25 56 28
169 106 10 35
356 70 78
100 11
168 214 74
114 48
205 56 33
100 39 48 54
73 189 34 83 62
263 34
118 144 159 62
247 24
218 30 64 23
184 107
5 30
344 63 98 95
6 153 202 81
109 56
217 45 38
104-27 43 51
54 103 21 24
3 11
14
44 2
110 44
8 '8
16 24
1 18
5 2 4 2
3 3 5 6 2
,
55 95 19 21
1 13
17
40 3
108 42
8 21
12 21
19
5 4 1 3
1
8 9 4-
49 50 51 52 53 54 55 56 57 58 59 60 61 62 63 64 65 66 67 68 69 70 71 72 73 74 75 76 77 78 79 80 81 82 83 84 85 86
118 119
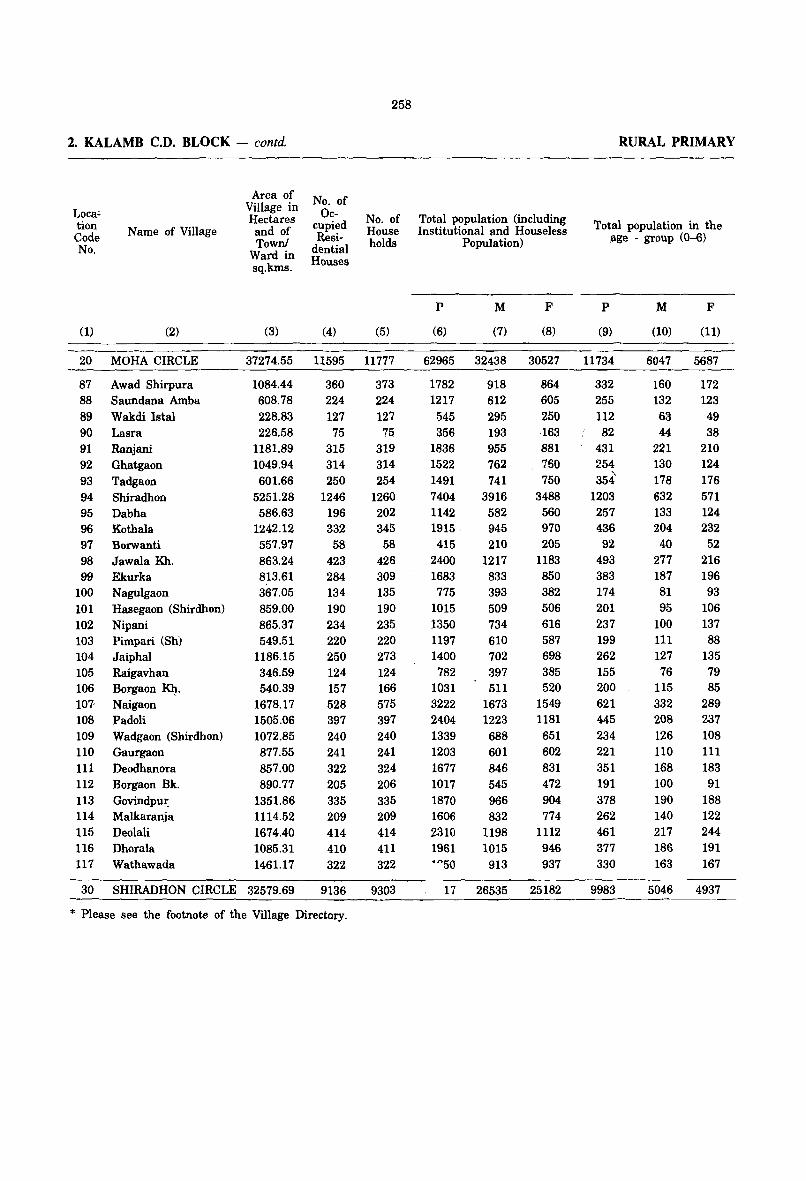
2. KALAMB C.D. BLOCK - contd.
Loca~ tion Code No.
Name of Village
(1) (2)
20 MORA CIRCLE
87 Awad Shirpura 88 Saundana Amba 89 Wakdi Istal 90 Lasra 91 Ranjani 92 Ghatgaon 93 Tadgaon 94 Shiradhon 95 Dabha 96 Kothala 97 Borwanti 98 Jawala Kh. 99 Ekurka
100 Nagulgaon 101 Hasegaon (Shirdhon) 102 Nipani 103 Pimpari (8h) 104 Jaiphal 105 Raigavhan 106 Borgaon 1<4. 107· Naigafln 108 Padoli 109 Wadgaon (8hirdhon) 110 Gaurgaon 111 Deodhanora 112 Borgaon Bk. 113 Govindpu:r: 114 Malkaranja 115 Deolali 116 Dhorala 117 Wathawada
Area of Village in Hectares and of Town!
Ward in sq.kms.
(3)
37274.55
1084.44 608.78 228.83 226.58
1181.89 1049.94 601.66
5251.28 586.63
1242.12 557.97 863.24 813.61 367.05 859.00 865.37 549.51
1186.15 346.59 540.39
1678.17 1505.06 1072.85 877.55 857.00 890.77
1351.86 1114.52 1674.40 1085.31 1461.17
30 SHIRADHON CIRCLE 32579.69
No. of Oc
cupied R.esi
dential Houses
258
No. of House holds
(4) (5)
11595 11777
360 373 224 224 127 127
75 75 315 319 314 314 250 254
1246 1260 196 202 332 345 58 58
423 426 284 309 134 135 190 190 234 235 220 220 250 273 124 124 157 166 528 575 397 397 240 240 241 241 322 324 205 206 335 335 209 209 414 414 410 411 322 322
9136 9303
* Please see the footnote of the Village Directory.
Total population (including Institutional and Houseless
Population)
p M
(6) (7)
62965 32438
1782 918 1217 612
545 295 356 193
1836 955 1522 762 1491 741 7404 3916 1142 582 1915, 945 415 210
2400 1217 1683 833
775 393 1015 509 1350 734 1197 610 1400 702 782 397
1031 511 3222 1673 2404 1223 1339 688 1203 601 1677 846 1017 545 1870 966 1606 832 2310 1198 1961 1015 .n50 913
F
(8)
30527
864 605 250 163 881 760 750
3488 560 970 205
1183 850 382 506 616 587 698 385 520
1549 1181 651 602 831 472 904 774
1112 946
937
17 26535 25182
RURAL PRIMARY
Total population in the .age - group (0-6)
P
(9)
11734
332 255 112 82
431 254
"-354'
1203 257 436 92
493 383 174 201 237 199 262 155 200 621 445 234 221 351 191 378 262 461 377 330
9983
M
(10)
6047
160 132 63 44
221 130 178 632 133 204 40
277 187 81 95
100 111 127 76
115 332 20B 126 110 16B 100 190 140 217 186 163
F
(11)
5687
172 123
49 38
210 124 176 571 124 232
52 216 196 93
106 137
8B 135 79 85
289 237 108 111 183 91
188 122 244 191 167
5046 4937
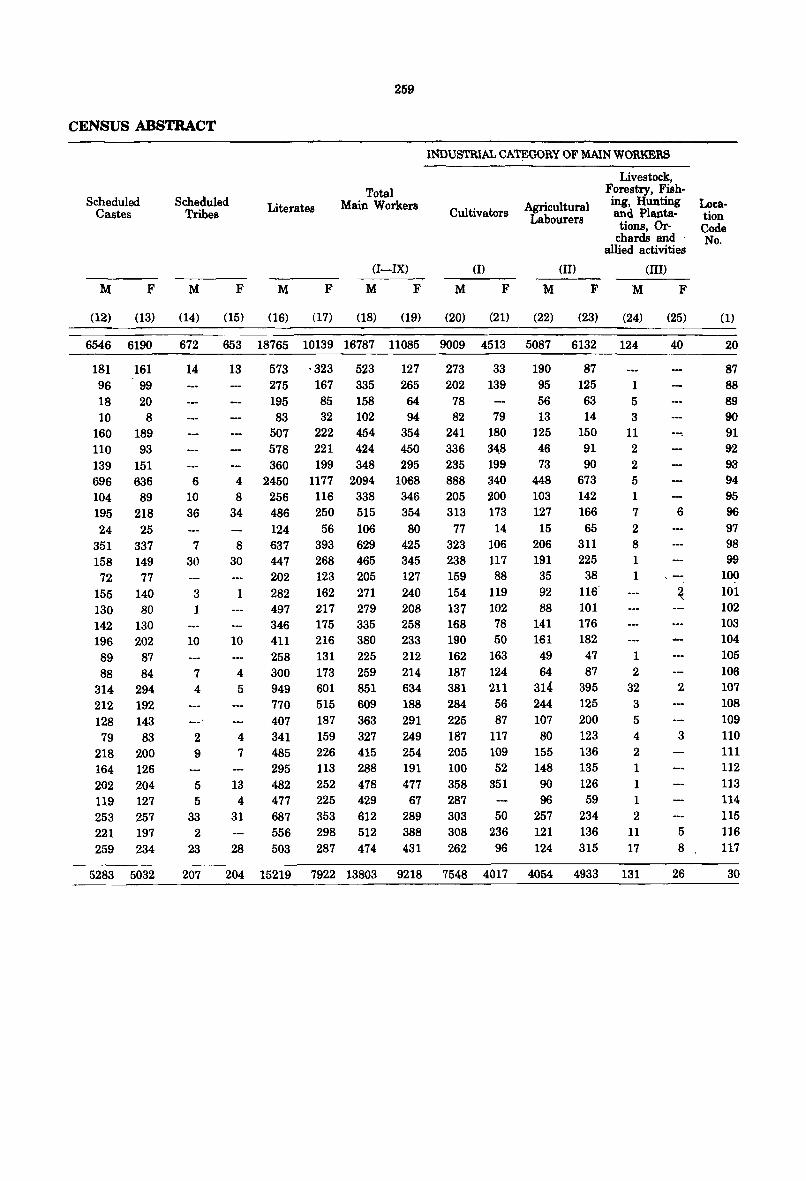
259
CENSUS ABSTRACT
Scheduled Castes
M F
6546 6190
181 161 96 18
99 20
10 8 160 189 110 93 139 151 696 636 104 89 195 218 24 25
351 337 158 149 72 77
155 140 130 80 142 130 196 202 89 87 88 84
314 294 212 192 128 143 79 83
218 200 164 126 202 204 119 127 253 257 221 197 259 234
5283 5032
Scheduled Tribes
M F
Literates
M F
Total Main Workers
(I-IX)
M F
INDUSTRIAL CAT~GORY OF MAIN WORKERS
Livestock,
Cultivators
(I)
M F
Agricultural Labourers
(II)
M F
Forestry, Fishing, Hunting and Plantations, Or
chards and . allied activities
(III)
M F
672 653 18765 10139 16787 11085 9009 4513 5087 6132 124 40
14
6 10 36
7 30
3 1
10
7 4
2 9
5 5
33 2
23
13 573 ·323 523 275 195
167 335 85 158
127 265 64
83 32 102 94 507 222 454 354 578 221 424 450 360 199 348 295
4 2450 1177 2094 1068 8
34
8 30
1
10
4 5
4 7
13 4
31
28
256 116 338 346 486 250 515 354 124 56 106 80 637 393 629 425 44 7 268 465 345 202 123 205 127 282 162 271 240 497 217 279 208 346 175 335 258 411 216 380 233 258 131 225 212 300 173 259 214 949 601 851 634 770 515 609 188 407 187 363 291 341 159 327 249 485 226 415 254 295 113 28B 191 482 252 478 477 477 225 429 67 687 353 612 289 556 298 512 3BB 503 287 474 431
273 33 202 139
78 82 79
241 180 336 3~8
235 199 888 340 205 200 313 173 77 14
323 106 238 117 159 88 154 119 137 102 168 78 190 50 162 163 187 124 381 211 284 56 225 87 187 117 205 109 100 52 358 351 287 303 50 308 236 262 96
190 95 56 13
125 46 73
448 103 127 15
206 191
35 92 88
141 161 49 64
314 244 107 80
155 148 90 96
257 121 124
87 125 63 14
150 91 90
673 142 166 65
311 225
38 116 101 176 182 47 87
395 125 200 123 136 135 126 59
234 136 315
1 5 3
11 2 2 5 1 7
2 8 1 1
1
2 32 3 5 4 2 1 1 1 2
11 17
207 204 15219 7922 13803 9218 7548 4017 4054 4933 131
6
2
3
5 8
26
Location Code No.
20
87 88 89 90 91 92 9a 94 95 96 97 98 99
100 101 102 103 104 105 106 107 108 109 110 111 112 113 114 115 116 117
30
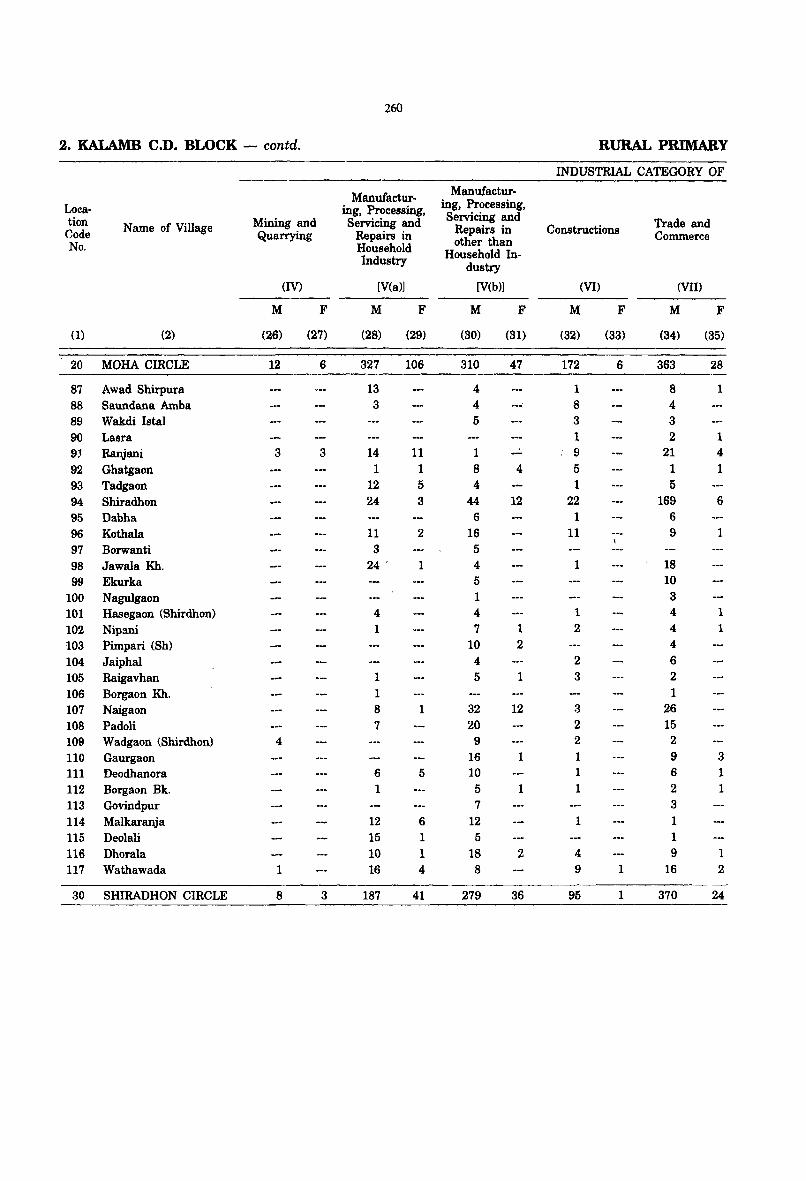
260
2. KALAMB C.D. BLOCK - contd. RURAL PRIMARY
INDUSTRIAL CATEGORY OF
Manufactur- Manufactur-
Loea- ing, Processing, ing, Processing,
tion Name of Village Mining and Servicing and Servicing and Trade and Code Quarrying Repairs in Repairs in Constructions Commerce No. Household other than
Industry Household In-dustry
(IV) [V(a)] [V(b)] (VI) (VII)
M F M F M F M F M F
(1) (2) (26) (27) (28) (29) (30) (31) (32) (33) (34) (35)
20 MOHA CIRCLE 12 6 327 106 310 47 172 6 363 28
87 Awad Shirpura 13 4 1 8 1 88 Saundana Amba 3 4 8 4 89 Wakdi Istal 5 3 3 90 Lasra 1 2 1 9) Ranjani 3 3 14 11 1 9 21 4 92 Ghatgaon 1 1 8 4 5 1 1 93 Tadgaon 12 5 4 --- I 5
94 Shiradhon 24 3 44 12 22 169 6 95 Dabha 6 1 6
96 Kothala 11 2 16 11 --- 9 1 \
97 Borwanti 3 5 98 Jawala Kh. 24 . 1 4 1 18 99 Ekurka 5 10
100 Nagulgaon 1 3
101 Hasegaon (Shirdhon) 4 4 1 4 1
102 Nipani 1 7 1 2 4 1 103 Pimpari (Sh) 10 2 4
104 Jaiphal 4 2 6
105 Raigavhan 1 5 1 3 2
106 Borgaon Kh. 1 1 107 Naigaon 8 1 32 12 3 26 108 Padoli 7 20 2 15 109 Wadgaon (Shirclhon) 4 9 2 2 110 Gaurgaon 16 1 1 9 3 111 Deodhanora 6 5 10 1 6 1 112 Borgaon Bk. 1 5 1 1 2 1 113 Govindpur 7 3 114 Malkaranja 12 6 12 1 1 115 Deolali 15 1 5 1 116 Dhorala 10 1 18 2 4 9 1 117 Wathawada 1 16 4 8 9 1 16 2
30 SHIRADHON CIRCLE 8 3 187 41 279 36 95 1 370 24
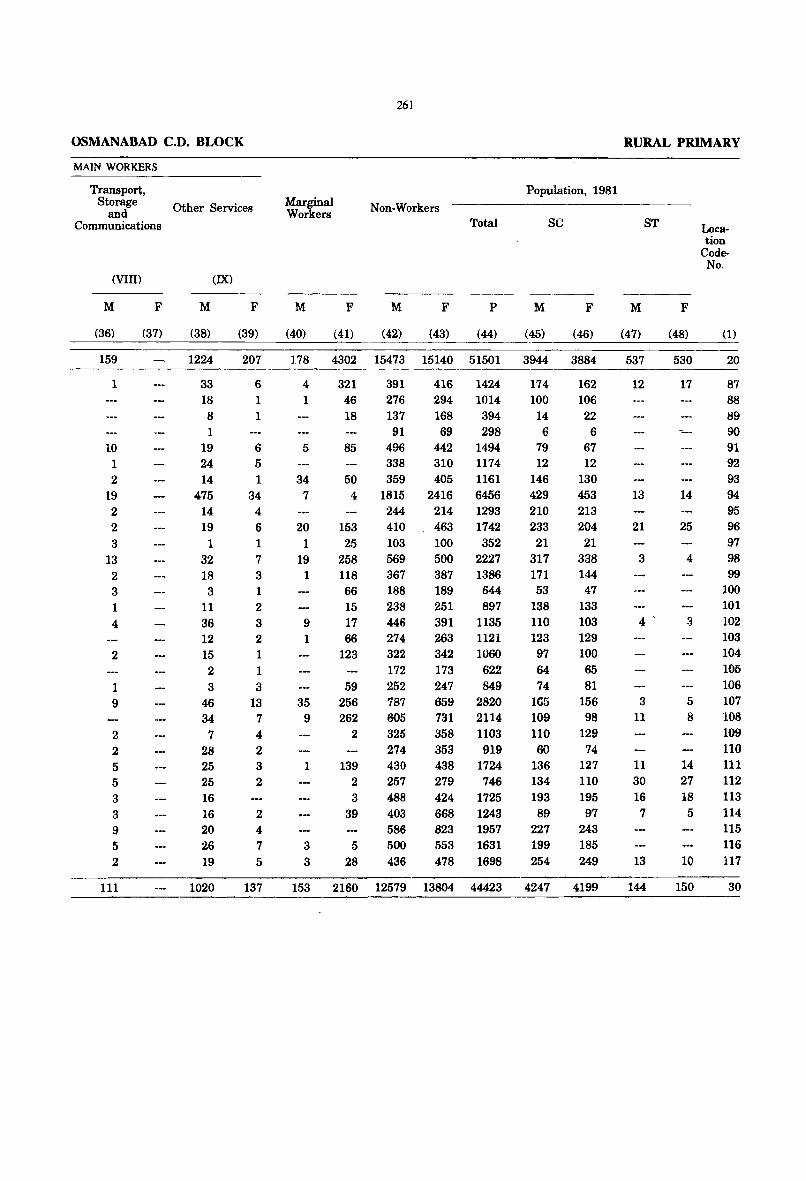
OSMANABAD C.D. BLOCK
MAIN WORKERS
Transport, Storage
and Communications
(VIII)
M
(36)
159
1
10 1 2
19 2 2 3
13 2 3
1 4
2
1 9
2 2 5 5 3 3 9 5 2
111
F
(37)
Other Services
M
(38)
(IX)
1224
33 18 8 1
19 24 14
475 14 19
1
32 18 3
11 36 12 15 2 3
46 34
7 28 25 25 16 16 20 26 19
1020
F
(39)
207
6 1 1
6 5 1
34 4 6 1 7 3 1
2 3 2 1 1 3
13 7 4 2 3 2
2 4 7 5
137
Marginal Workers
M
(40)
F
(41)
261
Non-Workers
M
(42)
F
(43)
Total
P
(44)
178 4302 15473 15140 51501
4 321 391 416 1424 1 46 276 294 1014
18 137 168 394 91 69 298
5 85 496 442 1494 338 310 1174
34 50 359 405 1161 7 4 1815 2416 6456
244 214 1293 20 153 410 463 1742
1 25 103 100 352 19 258 569 500 2227
1 118 367 387 1386 66 188 189 644 15 238 251 897
9 17 446 391 1135 1 66 274 263 1121
123 322 342 1060 172 173 622
59 252 247 849 35 256 787 659 2820
9 262 605 731 2114
1
3 3
153
2 325 274
139 430 2 257 3 488
39 403 586
5 500 28 436
2160 12579
358 1103 353 919 438 1724 279 746 424 1725 668 1243 823 1957 553 1631 478 1698
13804 44423
Population, 1981
SC
M F
(45) (46)
3944 3884
174 162 100 106
14 22 6 6
79 67 12 12
146 130 429 453 210 213 233 204
21 21 317 338 171 144 53 47
138 133 110 103 123 129 97 100 64 65 74 81
165 156 109 98 110 60
136 134 193 89
227 199 254
4247
129 74
127 110 195 97
243 185 249
4199
RURAL PRIMARY
M
(47)
ST
F
(48)
537 530
12 17
13 14
21 25
3 4
4 ' 3
3 5 11 8
11 30 16 7
13
144
14 27 18 5
10
150
Location
CodeNo.
(1)
20
87 88 89 90 91 92 93 94 95 96 97 98 99
100 101 102 103 104 105 106 107 108 109 110 111 112 113 114 115 116 117
30
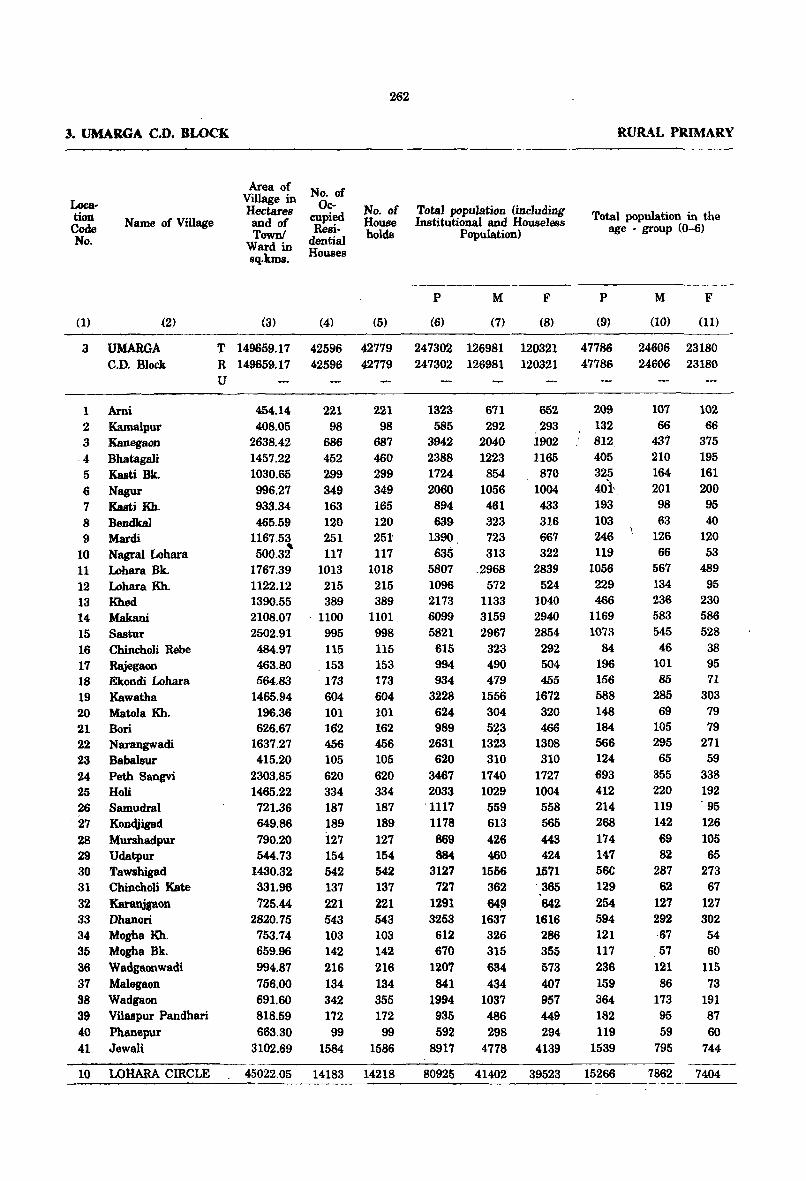
262
3. UMARGA C.D. BLOCK RURAL PRIMARY
Loca· tion Code No.
Name of Village
(1) ,(2)
3 UMARGA C.D. Block
1 Ami 2 Kamalpur 3 Kanegaon
. 4 Bhatagali 5 Kasti Bk. 6 Nagur 7 Kasti Kb. 8 Bendkal 9 Mardi
10 Nagral Lahara 11 Lahara Bk. 12 Lahara Kh. 13 Khed 14 Makani 15 Sastor 16 Chincholl Rebe 17 Rajegaon 18 Ekondi Lahara 19 Kawatha 20 Matoia Kh. 21 Bori 22 Narangwadi 23 Babalsur 24 Peth Sangvi 25 Holl 26 Samudral 27 Koncijigad 28 Mursbadpur 29 Udatpur 30 Tawahigad 31 Chincboll Kate 32 Karanjgaon 33 Dhanori 34 Mogha Kh. 35 Mogha Bk. 36 Wadgaonwadi 37 Maiegaon 38 Wadgaon 39 Vilaspur Pandbari 40 Pbanepur 41 Jewali
10 LOHARA CIRCLE
Area of Village in Hectares and of Town!
Ward in sq.kms.
(3)
No. of Oc
cupied Resi
dential Houses
(4)
No. of House holds
(5)
Total population (including Institutional and Houseless
Population)
P
(6)
M
(7)
F
(8)
Total population in the age - group (0--6)
P
(9)
M
(10)
F
(11)
T 149659.17 42596 42779 247302 126981 120321 47786 24606 23180 24606 23180 R 149659.17 42596 42779 247302 126981 120321 47786
U
454.14 221 221 1323 671 652 209 107 102 408.05 98 98 585 292 293 132 66 66
2638.42 686 687 3942 2040 1902 812. 431 375 1457.22 452 460 2388 1223 1165 405 210 195 1030.65 299 299 1724 854 870 325 164 161
996.27 349 349 2060 1056 1004 401,. 201 200 933.34 163 165 894 461 433 193 98 95 465.59 120 120 639 323 316 103 63 40
1167.53 251 251 , 500.32 117 117
1390 . 723 667 246 635 313 322 119
126 120 66 53
1767.39 1013 1018 5807 _2968 2839 1056 567 489
1122.12 215 215 1096 572 524 229 134 95 1390.55 389 389 2173 1133 1040 466 236 230 2108.07 . 1100 1101. 6099 3159 2940 1169 583 586 2502.91 995 998 5821 2967 2854 1073 545 528
484.97 115 115 615 323 292 84 46 38 463.80 . 153 153 994 490 504 196 101 95 564.83 173 173 934 479 455 156 85 71
1465.94 604 604 3228 1556 1672 588 285 303 196.36 101 101 624 304 320 148 69 79 626.67 162 162 989 5~3 466 184 105 79
1637.27 456 456 2631 1323 1308 566 295 271 415.20 105 105 620 310 310 124 65 59
2303.85 620 620 3467 1740 1727 693 355 338 1465.22 334 334 2033 1029 1004 412 220 192 721.36 187 187 ·1117 559 558 214 119 . 95
649.86 189 189 1178 613 565 268 142 126 790.20 127 127 869 426 443 174 69 105 544.73 154 154 8S4 460 424 147 82 65
1430.32 542 542 3127 1556 1571 56C 287 273 331.96 137 137 727 362 . 365 129 62 67 725.44 221 221 1291 64.9 642 -254 127 127
2820.75 543 543 3253 1637 1616 594 292 302 753.74 103 103 612 326 286 121 ·67 54 659.96 142 142 670 315 355 117 57 60 994.87 216 216 1207 634 573 236 121 115 756.00 134 134 841 434 407 159 86 73 691.60 342 355 1994 1037 957 364 173 191 818.59 172 172 935 486 449 182 95 87 663.30 99 99 592 298 294 119 59 60
3102.69 1584 1586 8917 4778 4139 1539 795 744
45022.05 14183 14218 80925 41402 39523 15266 7862 7404
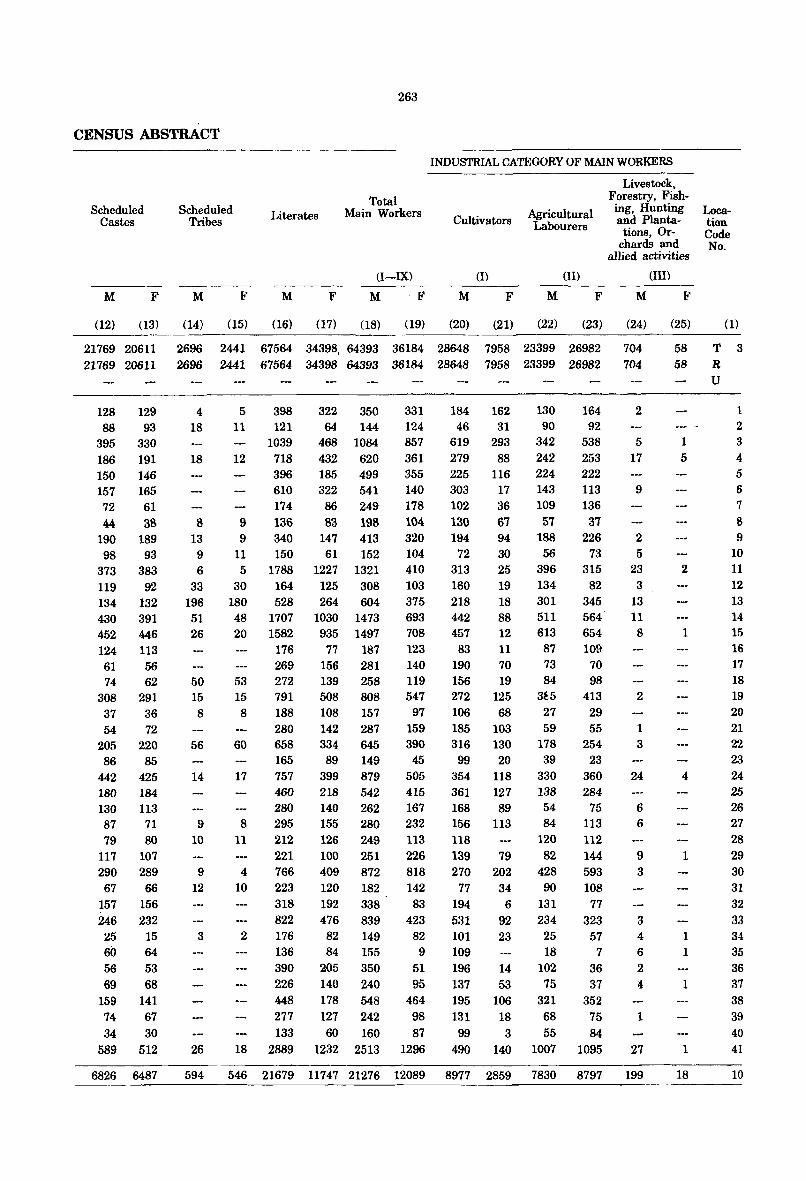
CENSUS ABSTRACT
Scheduled Castes
M F
Scheduled Tribes
M F
Literates
M F
263
Total Main Workers
(I-IX)
M F
INDUSTRIAL CATEGORY OF MAIN WORKERS
Cultivators
(I)
M F
Agricultural Labourers
(II)
M F
Livestock, Forestry, Fishing, Hunting and Planta
tions, Orchards and
allied activities
(Ill)
M F
Location Code No.
(12) (13) (14) (15) (16) (17) (18) (19) (20) (21) (22) (23) (24) (25) (1) ----------------------------------------------------------------------
21769 20611 2696 2441 67564 34398, 64393 36184 28648 7958 23399 26982 704 58 T 3 21769 20611 2696 2441 67564 34398 64393 36184 28648 7958 23399 26982 704 58 R
128 129 88 93
395 330 186 191 150 146 157 165
72 61 44 38
190 189 98 93
373 383 119 92 134 132 430 391 452 446 124 113 61 56 74 62
308 291 37 36 54 72
205 220 86 85
442 425 180 184 130 113 87 71 79 80
117 107 290 289 67 66
157 156 246 232
25 15 60 64 56 53 69 68
159 141 74 67 34 30
589 512
6826 6487
4 18
18
8 13
9 6
33 196 51 26
50 15 8
56
14
9 10
9 12
3
26
594
5 398 11 121
1039 12 718
396 610 174
9 136 9
11 340 150
322 350 64 144
468 1084 432 620 185 499 322 541 86 249 83 198
147 413 61 152
5 1788 1227 1321 30 164 125 308
180 528 264 604 48 1707 1030 1473 20 1582 935 1497
176 77 187 269 156 281
53 272 139 258 15 791 508 808 8 188 108 157
60
17
8 11
4 10
280 142 287 658 165 757 460 280 295 212 221 766 223 318 822
334 645 89 149
399 879 218 542 140 262 155 280 126 249
100 251 409 872 120 182 192 338 476 839
331 124 857 361 355 140 178 104 320 104 410 103 375 693 708 123 140 119 547
97 159 390
45 505 415 167 232 113 226 818 142 83
423 2 176 82 149 82
136 84 155 9 390 205 350 51 226 140 240 95 448 178 548 464 277 127 242 98 133 60 160 87
18 2889 1232 2513 1296
184 162 46 31
619 293 279 88 225 116 303 17 102 36 130 67 194
72 94 30
313 25 160 19 218 18 442 88 457 12
83 11 190 70 156 19 272 125 106 68 185 103 316 130 99 20
354 118 361 127 168 89 156 113 118 139 79 270 202
77 34 194 6 531 92
130 90
342 242 224 143 109 57
188 56
396 134 301 511 613
87 73 84
3M 27 59
178 39
330 138 54 84
120 82
428 90
131 234
164 92
538 253 222 113 136
37 226
73 315
82 345 564 654 109
70 98
413 29 55
254 23
360 284
75 113 112 144 593 108
77 323
101 23 25 57 109 18 7 196 14 102 36 137 53 75 37 195 106 321 352 131 18 68 75
99 3 55 84 490 140 1007 1095
2
5 17
9
2
5 23
3 13 11
8
2
1 3
24
6 6
9 3
3 4 6 2 4
1
27
546 21679 11747 21276 12089 8977 2859 7830 8797 199
1 5
2
1
4
1
1 1
1
1
18
U
1 2 3 4 5 6 7 8 9
10 11 12 13 14 15 16 17 18 19 20 21 22 23 24 25 26 27 28 29 30 31 32 33 34 35 36 37 38 39 40 41
10
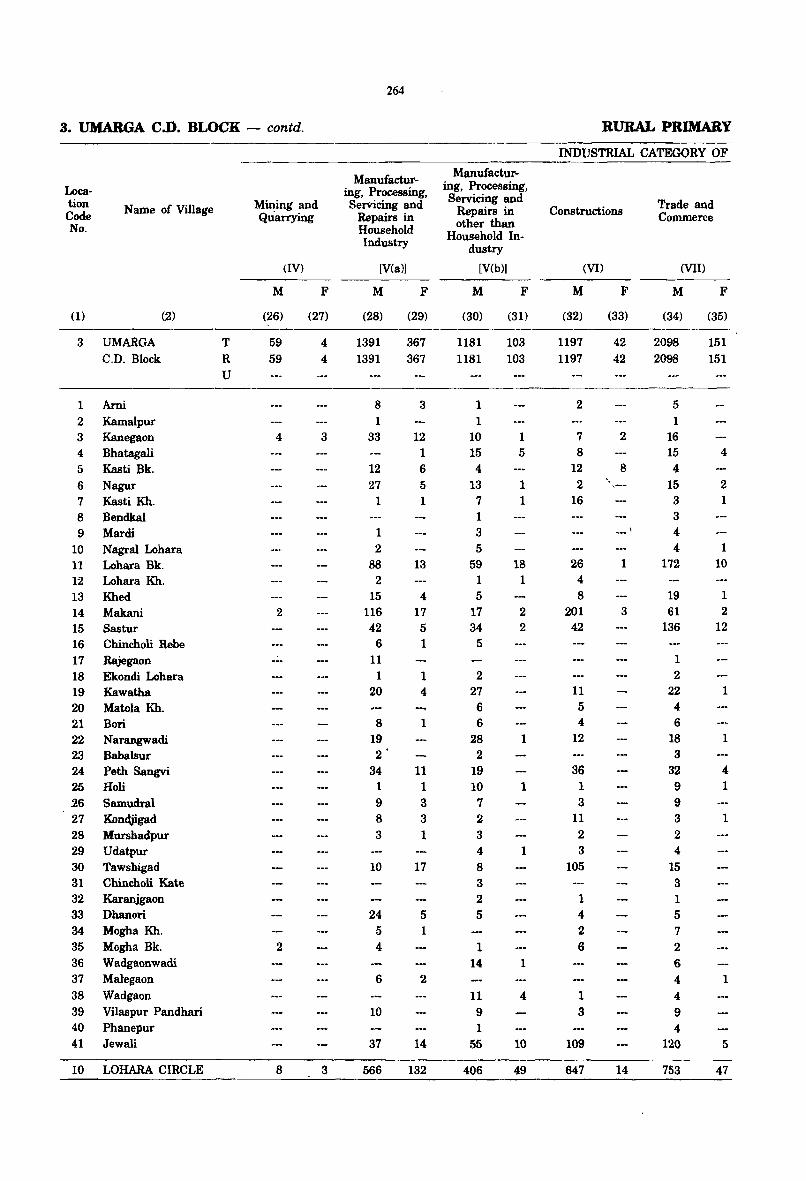
3. UMARGA CoO. BLOCK - contd.
Location Code No.
Name of Village
(1) (2)
3 UMARGA C.D. Block
1 Ami 2 Kamalpur 3 Kanegaon 4 Bhatagali 5 Kasti Bk. 6 Nagur 7 Kasti Kh. 8 Bendkal 9 Mardi
10 Nagral Lohara 11 Lohara Bk. 12 Lohara Kh. 13 Khed 14 Makani 15 Sastur 16 Chincholi Rebe 17 Rajegaon 18 Ekondi Lohara 19 Kawatha 20 Matola Kh. 21 Bori 22 Narangwadi 23 Babalsur 24 Peth Sangvi 25 Holi 26 Samudral 27 Koncljigad 28 ~urshadpur
29 Udatpur 30 Tawshigad 31 Chincholi Kate 32 Karanjgaon 33 Dhanori 34 Mogha Kh. 35 Mogha Bk. 36 Wadgaonwadi 37 Malegaon 38 Wadgaon 39 Vilaspur Pandhari 40 Phanepur 41 Jewali
10 LOHARA CIRCLE
T R U
Mining and QUarrying
(IV)
M F
(26) (27)
59 59
4
2
2
8
4
4
3
3
264
Manufacturing, Processing, Servicing and
Repairs in Household Industry
[V(a)]
M
(28)
1391 1391
8 1
33
12 27
1
1 2
88 2
15 116 42
6 11
1 20
8 19 2·
34 1 9 8 3
10
24 5 4
6
10
37
566
F
(29)
367 367
3
12 1 6 5 1
13
4 17 5 1
1 4
1
11 1 3 3 1
17
5 1
2
14
132
Manufacturing, Processing, Servicing and
Repairs in other than
Household Industry
[V(b»)
M
(30)
1181 1181
1 1
10 15 4
13 7 1 3 5
59 1 5
17 34
5
2 27 6 6
28 2
19 10
7 2 3 4 8 3 2 5
1 14
11 9 1
55
406
F
(31)
103 103
1 5
1 1
18 1
2 2
1
1
1
1
4
10
49
RURAL PRIMARY
INDUSTRIAL CATEGORY OF
Constructions
M
(32)
1197
1197
2
'1 8
12 2
16
(VI)
26 4 8
201 42
11 5 4
12
36 1
3 11
2 3
105
1 4 2 6
1 3
109
647
F
(33)
42 42
2
8
1
3
14
Trade and Commerce
(VII)
M
(34)
2098 2098
5 1
16 15 4
15 3 3 4 4
172
19 61
136
1 2
22 4 6
18 3
32 9 9 3 2 4
15 3 1 5 7 2 6 4 4
9 4
120
753
F
(35)
151 151
4
2 1
1 10
1 2
12
1
1
4 1
1
1
5
47
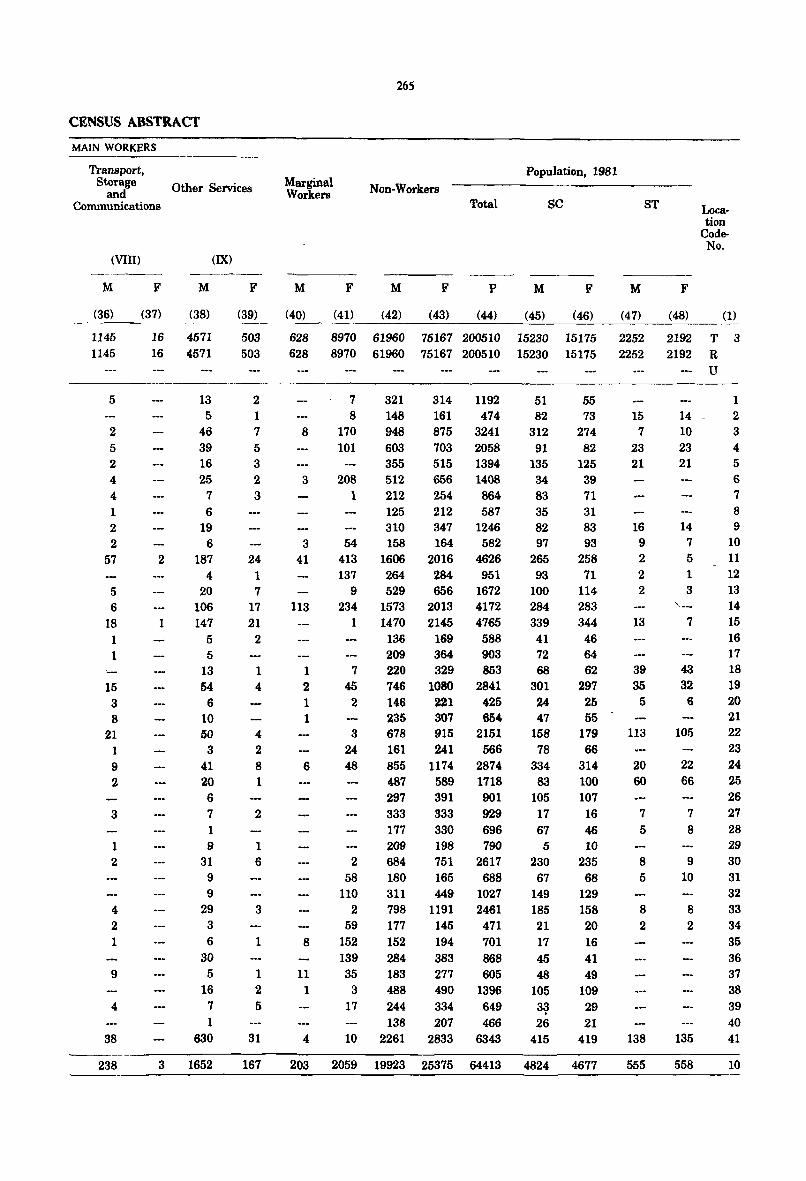
CENSUS ABSTRACT
MAIN WORKERS
Transport, Storage
and Communications
Other Services
(VIn)
M
(36)
1145 1145
5
2 5 2 4 4 1 2 2
57
5 6
18 1 1
15 3 8
21 1 9 2
3
1 2
4 2 1
9
4
38
238
(IX)
F M
(37) (38)
16 4571 16 4571
2
1
13 5
46 39 16 25
7 6
19 6
187 4-
20 106 147
5 5
13 54
6 10 50
3 41 20 6 7 1 9
31 9 9
29 3
6 30
5 16
7 1
630
3 1652
F
(39)
503 503
2 1
7 5 3 2 3
24 1 7
17 21
2
1 ...
4-2 8 1
2
1 6
3
1
1 2 5
31
167
Marginal Workers
M
(40)
F
(41)
265
Non-Workers
M F
(42) (43)
Total
p
(44)
Population, 1981
se
M F
(45) (46)
M
(47)
ST
F
(48)
Location
CodeNo.
(1)
628 8970 61960 75167 200510 15230 15175 2252 2192 T 3 628 8970 61960 75167 200510 15230 15175 2252 2192 R
8
3
3 41
113
1 2 1 1
6
8
11 1
4
7 8
170 101
208 1
321 148 948 603 355 512 212
314 1192 161 474 875 3241 703 2058 515 1394 656 1408 254 864
125 212 587 310 347 1246
54 158 164 582 413 1606 2016 4626 137 264 284 951
9 529 656 1672 234 1573 2013 4172
1 1470 2145 4765
7 45
2
3 24 48
136 169 588 209 364 903 220 329 853 746 1080 2841 146 221 425 235 307 654 678 915 2151 161 241 566 855 1174 2874 487 589 1718 297 391 901 333 177 209
333 330 198
929 696 790
2 684 751 2617 58 180 165 688
110 311 449 1027 2 798 1191 2461
59 177 145 471 152 152 194 701 139 284 383 868 35 183 277 605
3 488 490 1396 17 244 334 649
138 207 466 10 2261 2833 6343
51 82
312 91
135 34 83 35 82 97
265 93
100 284 339 41 72 68
301 24 47
158 78
334 83
105 17 67 5
230 67
149 185 21 17 45 48
105 33 . 26
415
55 73
274 82
125 39 71 31 83 93
258 71
114-283 344 46 64 62
297 25 55
179 66
314 100 107 16 46 10
235 68
129 158 20 16 41 49
109 29 21
419
203 2059 19923 25375 64413 4824 4677
15 7
23 21
16 9 2 2 2
13
39 35
5
113
20 60
7 5
8 5
8 2
138
555
14 10 23 21
14 7 5 1 3
7
43 32 6
105
22 66
7 8
9 10
8 2
135
558
U
1 2 3 4 5
6 7 8 9
10 11 12 13 14 15 16 17 18 19 20 21 22 23 24 25 26 27 28 29 30 31 32 33 34 35 36 37 38 39 40 41
10
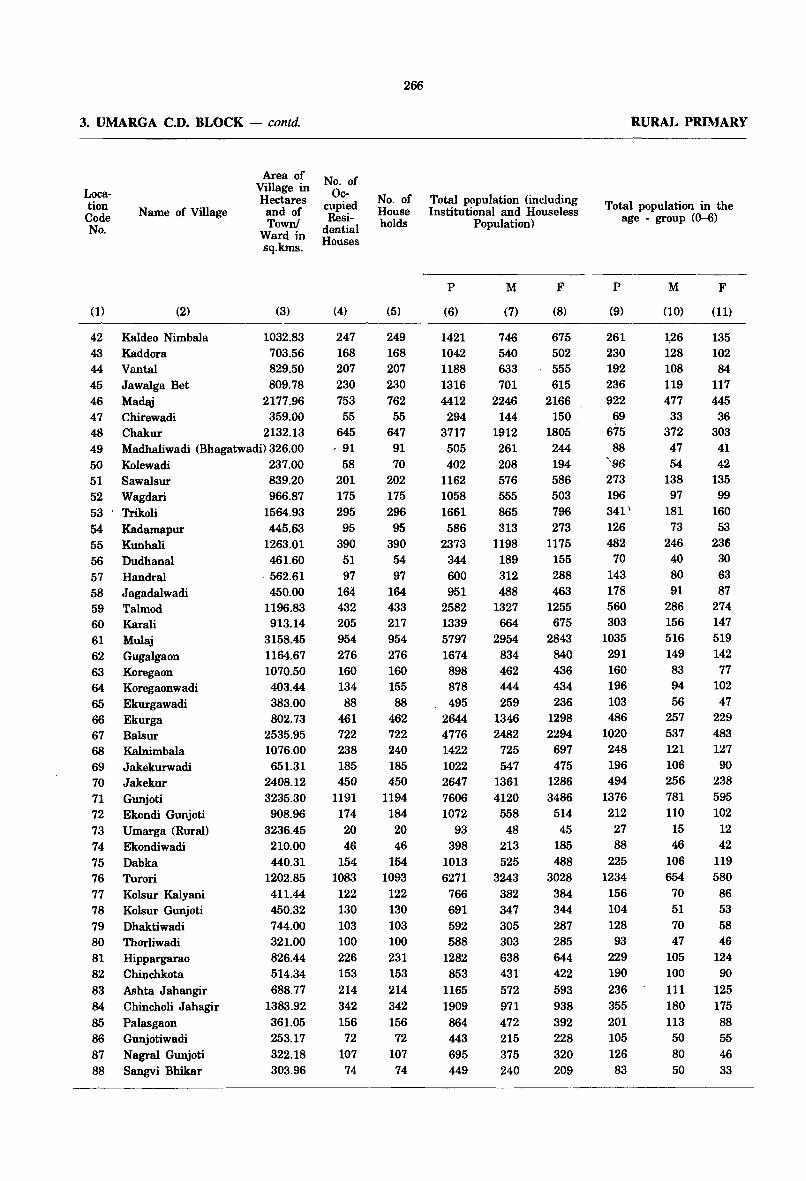
3. UMARGA C.D. BLOCK - contd.
Location Code No.
Name of Village
(1) (2)
42 Kaldeo Nimbala 43 Kaddora 44 Vantal 45 Jawalga Bet 46 Madaj 47 Chirewadi 48 Chakur
Area of Village in Hectares and of Town!
Ward in sq.kms.
(3)
1032.83 703.56 829.50 809.78
2177.96 359.00
2132.13 49 50 51 52 53 54 55 56 57 58 59 60 61 62
Madhaliwadi (Bhagatwadi) 326.00 Kolewadi 237.00 Sawalsur Wagdari Trikoli Kadamapur Kunhali Dudhanal Handral Jagadalwadi Talmod Karali Mulaj Gugalgaon
63 Koregaon 64 Koregaonwadi 65 Ekurgawadi 66 Ekurga 67 Balsur 68 Kalnimbala 69 Jakekurwadi 70 Jakekur 71 Gunjoti 72 Ekondi Gunjoti 73 Umarga (Rural) 74 Ekondiwadi 75 Dabka 76 Turori 77 Kolsur Kalyani 78 Kolsur Gunjoti 79 Dhaktiwadi 80 Thorliwadi 81 Hippargarao 82 Chinchkota 83 Ashta Jahangir 84 Chincholi Jahagir 85 Palasgaon 86 Gunjotiwadi 87 Nagral Gunjoti 88 Sangvi Bhikar
839.20 966.87
1564.93 445.63
1263.01 461.60
·562.61 450.00
1196.83 913.14
3158.45 1164.67 1070.50 403.44 383.00 802.73
2535.95 1076.00 651.31
2408.12 3235.30 908.96
3236.45 210.00 440.31
1202.85 411.44 450.32 744.00 321.00 826.44 514.34 688.77
1383.92 361.05 253.17 322.18 303.96
No. of Oc
cupied Resi
dential Houses
(4)
247 168 207 230 753 55
645 . 91
58 201 175 295 95
390 51 97
164 432 205 954 276 160 134 88
461 722 238 185 450
1191 174 20 46
154 1083 122 130 103 100 226 153 214 342 156 72
107 74
266
No. of House holds
(5)
249 168 207 230 762 55
647 91 70
202 175 296 95
390 54 97
164 433 217 954 276 160 155 88
462 722 240 185 450
1194 184 20 46
154 1093
122 130 103 100 231 153 214 342 156 72
107 74
Total population (including Institutional and Houseless
Population)
P
(6)
1421 1042 1188 1316 4412
294 3717 505 402
1162 1058 1661 586
2373 344 600 951
2582 1339 5797 1674 898 878 495
2644 4776 1422 1022 2647 7606 1072
93 398
1013 6271
766 691 592 588
1282 853
1165 1909 864 443 695 449
M
(7)
746 540 633 701
2246 144
1912 261 208 576 555 865 313
1198 189 312 488
1327 664
2954 834 462 444 259
1346 2482
725 547
1361 4120 558 48
213 525
3243 382 347 305 303 638 431 572 971 472 215 375 240
F
(8)
675 502 555 615
2166 150
1805 244 194 586 503 796 273
1175 155 288 463
1255 675
2843 840 436 434 236
1298 2294
697 475
1286 3486
514 45
185 488
3028 384 344 287 285 644 422 593 938 392 228 320 209
RURAL PRIMARY
Total population in the age - group (0-6)
P
(9)
261 230 192 236 922 69
675 88
"96 273 196 341' 126 482
70 143 178 560 303
1035 291 160 196 103 486
1020 248 196 494
1376 212 27 88
225 1234 156 104 128 93
229 190 236 355 201 105 126 83
M
(10)
~26
128 108 119 477 33
372 47 54
138 97
181 73
246 40 80 91
286 156 516 149 83 94 56
257 537 121 106 256 781 110
15 46
106 654
70 51 70 47
105 100 111 180 113 50 80 50
F
(11)
135 102 84
117 445 36
303 41 42
135 99
160 53
236 30 63 87
274 147 519 142 77
102 47
229 483
127 90
238 595 102
12 42
119 580
86 53 58 46
124 90
125 175 88 55 46 33
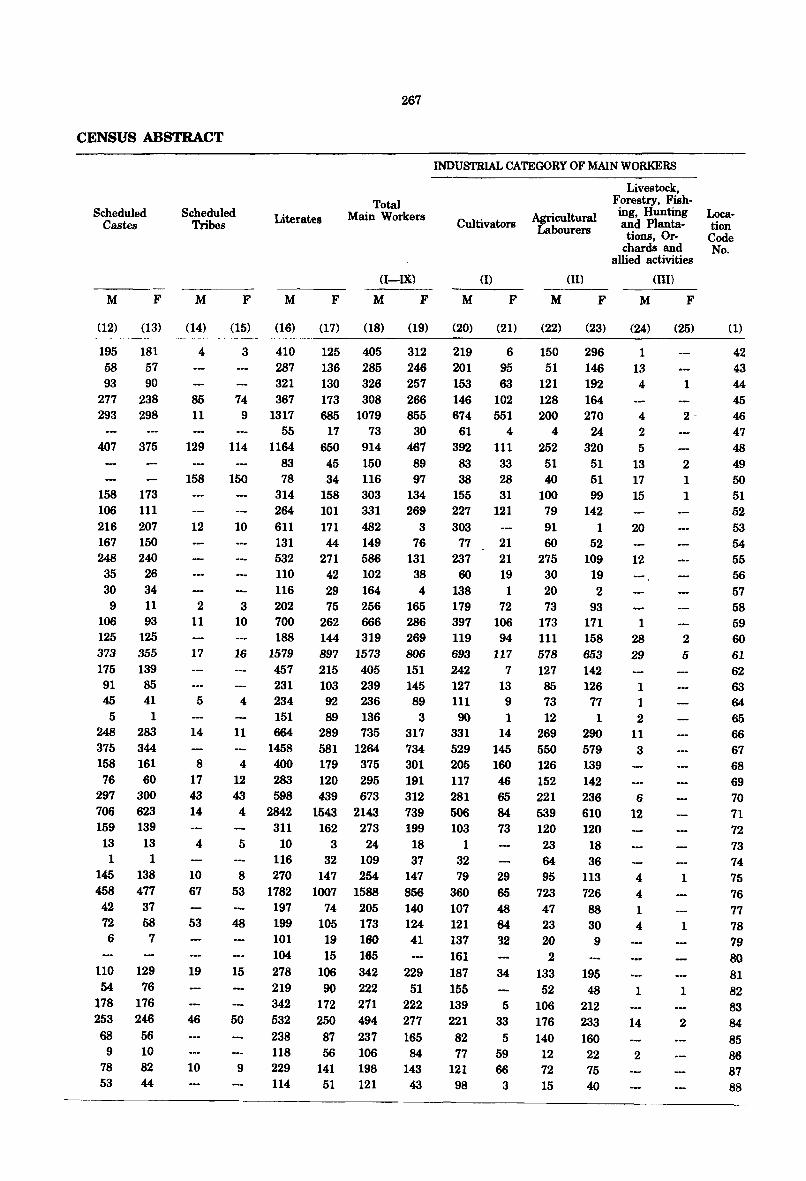
CENSUS ABSTRACT
Scheduled Castes
M F
Scheduled Tribes
M F
Literates
M F
267
Total Main Workers
(I-IX)
M F
INDUSTRIAL CATEGORY OF MAIN WORKERS
Cultivators
(l)
M F
Agricultural Labourers
(lI)
M F
Livestock, Forestry, Fishing, Hunting and Plantations, Or
chards and allied activities
(III)
M F
Location Code No.
(12) (13) (14) (15) (16) (17) (18) (19) (20) (21) (22) (23) (24) (25) (1)
195 181 58 57 93 90
277 238 293 298
407 375
158 173 106 111 216 207 167 150 248 240 35 26 30 34 9 11
106 93 125 125 373 355 175 139 91 85 45 41
5 1 248 283 375 344 158 161 76 60
297 300 706 623 159 139 13 13 1 1
145 138 458 477 42 37 72 58 6 7
110 129 54 76
178 176 253 246 68 56
9 78 53
10 82 44
4 3 410 287 321
125 405 136 285 130 326
219 201
6 95
153 63
150
85 74 367 173 308
312 246 257 266 855
146 102
51 121 128 200 11 9 1317 685 1079 674 551
55 17 73 61 4 129 114 1164 650 914
30 467
89 97
392 III 4
252 51 40
83 45 150 158 150 78 34 116
83 38
33 28
12
2 11
17
5
14
8 17 43 14
4
10 67
53
19
46
10
314 264
10 611 131 532 110 116
3 202 10 700
188 16 1579
158 303 134 101 331 269 171 482 3 44 149 76
271 586 131 42 102 38 29 164 4 75 256 165
262 666 286 144 319 269 897 1573 806
457 215 405 151 231 103 239 145
4 234 92 236 89 151 89 136 3
11 664 289 735 317 1458 581 1264 734
4 400 179 375 301 12 283 120 295 191 43 598 439 673 312 4 2842 1543 2143 739
311 162 273 199 5 10 3 24 18
116 32 109 37
155 31 227 121 303
77 21 237 21
60 19 138 1 179 72 397 106 119 94 693 117
100 79 91 60
275 30 20 73
173 111 578
242 7 127 127 13 85 111 9 73 90 1 12
331 14 269 529 145 550 205 160 126 117 46 152 281 65 221 506 84 539 103 73 120
1 23 32 64
8 270 147 254 147 79 29 65 48 84 32
95 53 1782 1007 1588 856 360
197 74 205 140 107 48 199 105 173 124 121
101 19 180 41 137 104 15 165 161
15 278 106 342 229 187 219 90 222 51 155 342 172 271 222 139
50 532 250 494 277 221
9
238 87 237 165 82 118 229 114
56 106 141 198 51 121
84 143 43
77 121 98
34
5 33 5
59 66
3
723 47 23 20 2
133 52
106 176 140 12 72 15
296 146 192 164 270
24 320
51 51 99
142 1
52 109
19 2
93 171 158 653 142 126
77 1
290 579 139 142 236 610 120
18 36
113 726 88 30 9
195 48
212 233 160 22 75 40
1 13 4
4 2 5
13 17 15
20
12
1 28 29
1 1 2
11 3
6 12
4 4 1 4
1
14
2
1
2-
2 1 1
2 5
1
1
1
2
42 43 44 45 46 47 48 49 50 51 52 53 54 55 56 57 58 59 60 61 62 63 64 65 66 67 68 69 70 71 72 73 74 75 76 77 78 79 80 81 82 83 84 85 86 87 88

268
8. UMARGA C.D. BLOCK - contd. RURAL PRIMARY
INDUSTRIAL CATEGORY OF -----------------------------------------------Location Code No.
Name of Village
(1) (2)
42 Kaldeo Nimbala 43 Kaddora 44 Vantal 45 Jawalga Bet 46 Madaj 47 Chirewadi 48 Chakur 49 Madhaliwadi (Bhagatwadi) 50 Kolewadi 51 Sawalsur 52 Wagdari 53 Trikoli 54 Kadamapur 55 Kunhali 56 Dudhanal 57 Handral 58 Jagadalwadi 59 Talmod 60 Karali 61 Mulaj 62 Gugalgaon 63 Koregaon 64 Koregaonwadi 65 Ekurgawadi 66 Ekurga 67 Balsur 6B Kalnimbala 69 Jakekurwadi 70 Jakekur 71 Gunjoti 72 Ekondi Gunjoti 73 Umarga (Rural) 74 Ekondiwadi 75 Dahka 76 Turori 77 Koisur Kalyani 78 Kolsur Gunjoti 79 Dhaktiwadi 80 Thorliwadi 81 Hippargarao 82 Chinchkota 83 Ashta Jahangir 84 Chincholi Jahagir 85 Palasgaon 86 Gunjotiwadi 87 Nagral Gunjoti 88 Sangvi Bhikar
Mining and Quarrying
M
(26)
2
3
46
(IV)
F
(27)
1
Manufacturing, Processing, Servicing and
Repairs in Household Industry
N(a)]
M
(28)
7 8 1 4
16
29 1
12 8
18 5
11
4
7 14 20
11 2
27
39 5 5
20 61
9
37 36
6
1 3
2
2
F
(29)
4
1
8
10 1
2 2
3
1
4 8 1 1
3 1 1 7 6
2 1
16 4
1 21
4 3
1
Manufacturing, Processing. Servicing and
Repairs in other than
Household In· dustry
[V(b)]
M
(30)
6 7
20 1
45
1
4
6
1
1 16
1 23
6 5
20 15 20 22
3 2
17 53
3
6 6
46
1
3
3
20 1
2 1 2
F
(31)
1
1
1 1
2
1
20
1
1
Constructions
M
(32)
1
13 2
,13
1 23
(VI)
18
1 9
3
2
1
13 2
54
2
2 2
11 4 7
9 50
4
6 18
1 2
2 3
8 3
1
F
(33)
17
-\--
1
Trade and Commerce
(VIl)
M F
(34) (35)
6 6 8 6
48 1
63 2
5 3
12 3
16 1
1 10 8
47 4 4 5 4
14 20
2 5
40 100
12
1 8
163 3
5
1
7 2 2
12 4
2 1 2
4
1
4 1 3 2
1 1
1
8
1
3 8 1
1 9
1
2
2 1
----------.. ---- -------------------------------------------
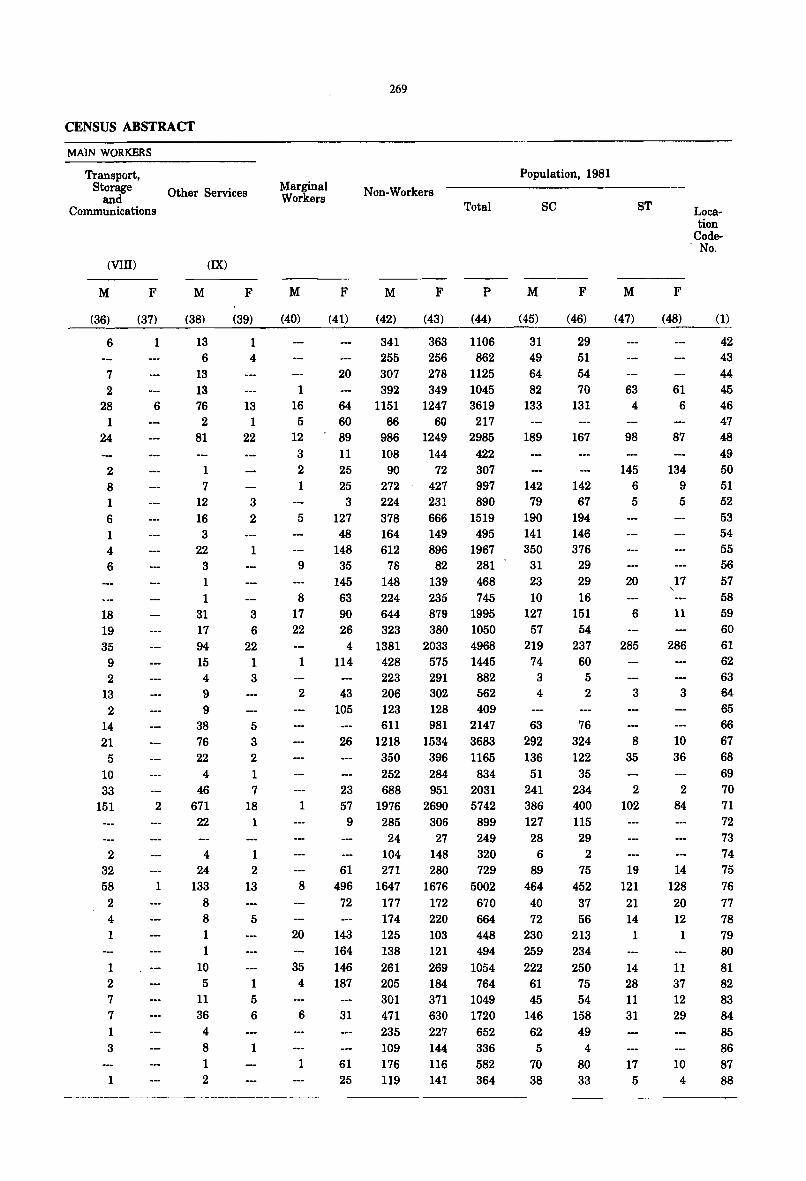
CENSUS ABSTRACT
MA1N WORKERS
Transport, Storage
and Communications
(VIII)
M F
Other Services
(IX)
M F
Marginal Workers
M
(36) (37) (38) (39) (40)
6 1 13 1 6 4
7 13 2 13 1
28 6 76 13 16 1
24
2 8 1
6 1 4 6
18 19 35 9 2
13 2
14 21
5 10 33
151
2 32 58
2 4 1
1 2 7 7
1 3
1
2
1
2 81
1 7
12 16 3
22 3
1 1
31 17 94 15 4 9 9
38 76 22
4 46
671 22
4 24
133 8 8 1 1
10 5
11 36 4 8 1 2
1 22
3 2
1
3 6
22 1 3
5 3 2 1 7
18 1
1 2
13
5
1 5 6
1
5 12 3 2 1
5
9
8 17 22
1
2
1
8
20
35 4
6
1
269
Population, 1981
Non-Workers Total SC ST
F M F p M F M F
(41) (42) (43) (44) (45) (46) (47) (48)
341 363 1106 31 29 255 256 862 49 51
20 307 278 1125 64 54 392 349 1045 82 70 63 61
64 1151 1247 3619 133 131 4 6 60 89 11 25 25 3
127 48
148 35
145 63
66 60 217 986 1249 2985 108 144 422
90 72 307 272 427 997 224 231 890 378 666 1519 164 612
78 148 224
149 495 896 1967
82 281 139 235
468 745
90 644 879 1995 26 323 380 1050 4 1381 2033 4968
114 428 575 1445 223 291 882
43 206 302 562 105 123 128 409
611 981 2147 26 1218 1534 3683
350 396 1165 252 284 834
23 688 951 2031 57 1976 2690 5742
9 285 306 899 24 27 249
104 148 320 61 271 280 729
496 1647 1676 5002 72
143 164 146 187
31
61 25
177 174 125 138 261 205 301 471 235 109 176 119
172 220 103
670 664 448
121 494 269 1054 184 764 371 1049 630 1720 227 652 144 336 116 582 141 364
189
142 79
190 141 350 31 23 10
127 57
219 74
3 4
63 292 136 51
241 386 127 28
6 89
464 40 72
230 259 222 61 45
146 62 5
70 38
167
142 67
194 146 376
29 29 16
151 54
237 60
5 2
76 324 122 35
234 400 115 29
2 75
452 37 56
213 234 250
75 54
158 49
4 80 33
98
145 6 5
20
6
285
3
8 35
2 102
19 121 21 14
1
14 28 11 31
17 5
87
134 9 5
17
11
286
3
10 36
2 84
14 128 20 12
1
11 37 12 29
10 4
Location
Code- No.
(1)
42 43 44 45 46 47 48
49 50 51 52 53 54 55 56 57 58 59 60 61 62 63 64 65 66 67 68 69 70 71 72 73 74 75 76 77 78 79 80 81 82 83 84 85 86 87 88
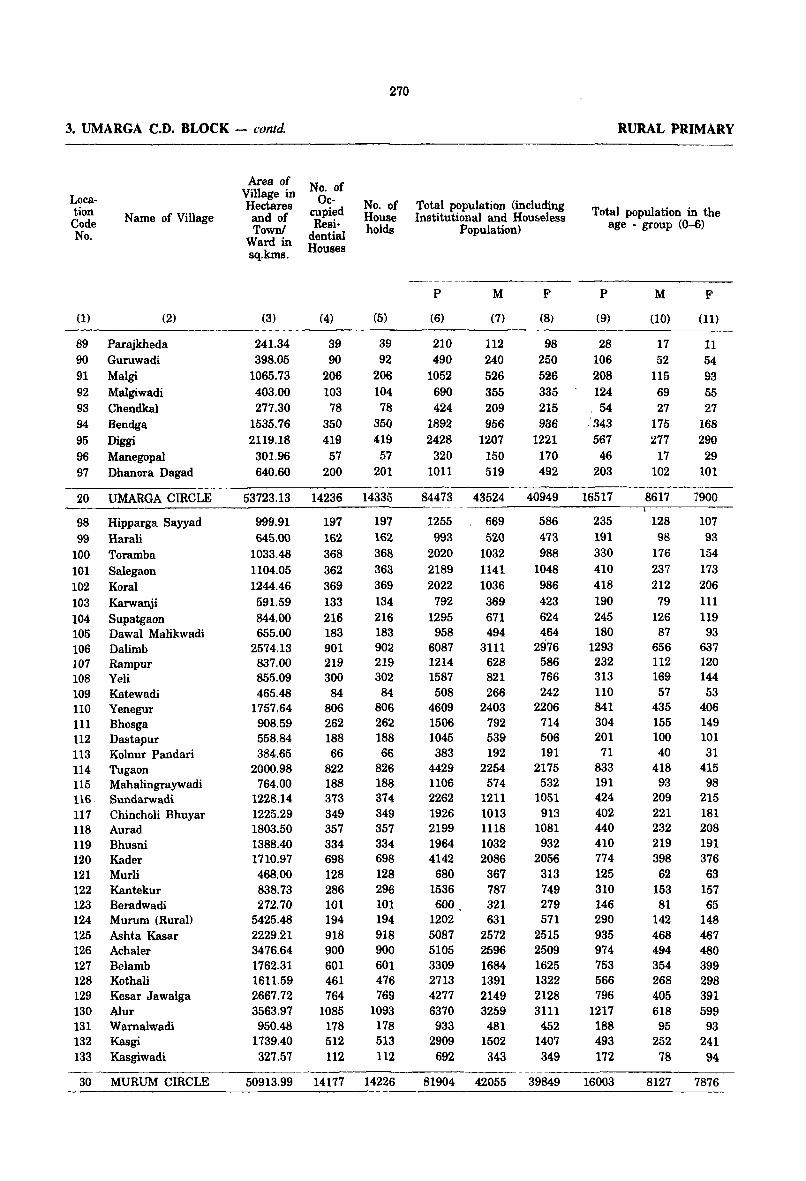
3. UMARGA C.D. BLOCK - contd.
Location Code No.
Name of Village
(1) (2)
89 Parajkheda 90 Guruwadi 91 Malgi 92 Malgiwadi 93 Chendkal 94 Bendga 95 Diggi 96 Manegopal 97 Dhanora Dagad
20 UMARGA CIRCLE
98 Hipparga Sayyad 99 Harali
100 Toramba 101 Salegaon 102 Koral 103 Karwanji 104 Supatgaon 105 Dawal Malikwadi 106 Dalimb 107 Rampur 108 Yeli 109 Katewadi 110 Yenegur 111 Bhosga 112 Dastapur 113 Kolnur Pandari 114 Tugaon 115 Mahalingraywadi 116 Sundarwadi 117 Chincholi Bhuyar 118 Aurad 119 Bhusni 120 Kader 121 Murli 122 Kantekur 123 Beradwadi 124 Murum (Rural) 125 Ashta Kasar 126 Achaler 127 Belamb 128 Kothali 129 Kesar Jawalga 130 Alur 131 Wamalwadi 132 Kasgi 133 Kasgiwadi
30 MURUM CIRCLE
Area of Village in Hectares and of Town!
Ward in sq.kms.
(3)
241.34 398.05
1065.73 403.00 277.30
1535.76 2119.18
301.96 640.60
53723.13
999.91 645.00
1033.48 1104.05 1244.46 591.59 844.00 655.00
2574.13 837.00 855.09 465.48
1757.64 908.59 558.84 384.65
2000.98 764.00
1228.14 1225.29 1803.50 1388.40 1710.97 468.00 838.73 272.70
5425.48 2229.21 3476.64 1762.31 1611.59 2667.72 3563.97 950.48
1739.40 327.57
50913.99
No. of Oc
cupied Resi
dential Houses
270
No. of House holds
(4) (5)
39 39 90 92
206 206 103 104 78 78
350 350 419 419
57 57 200 201
14236 14335
197 197 162 162 368 368 362 363 369 369 133 134 216 216 183 183 901 902 219 219 300 302 84 84
806 806 262 262 1B8 188 66 66
822 826 188 188 373 374 349 349 357 357 334 334 698 698 128 128 286 296 101 101 194 194 918 918 900 900 601 601 461 476 764 769
1085 1093 178 178 512 513 112 112
14177 14226
Total population (including Institutional and Houseless
Population)
P M
(6) (7)
210 112 490 240
1052 526 690 355 424 209
1892 956 2428 1207
320 150 1011 519
84473 43524
1255 669 993 520
2020 1032 2189 1141 2022 1036
792 369 1295 671
958 494 6087 3111 1214 628 1587 821 508 266
4609 2403 1506 792 1045 539 383 192
4429 2254 1106 574 2262 1211 1926 1013 2199 1118 1964 1032 4142 2086
680 367 1536 7B7 600 321
1202 631 5087 2572 5105 2596 3309 1684 2713 1391 4277 2149 6370 3259 933 481
2909 1502 692 343
81904 42055
F
(8)
98 250 526 335 215 986
1221 170 492
40949
586 473 988
1048 986 423 624 464
2976 586 766 242
2206 714 506 191
2175 532
1051 913
1081 932
2056 313 749 279 571
2515 2509 1625 1322 2128 3111
452 1407 349
39849
RURAL PRIMARY
Total population in the age - group (0-6)
P
(9)
28 106 208 124 54
343 567
46 203
16517
235 191 330 410 418 190 245 1BO
1293 232 313 110 841 304 201
71 833 191 424 402 440 410 774 125 310 146 290 935 974 753 566 796
1217 188 493 172
16003
M
(10)
17 52
115 69 27
175 277
17 102
8617
128 98
176 237 212
79 126
B7 656 112 169 57
435 155 100 40
418 93
209 221 232 219 398 62
153 81
142 46B 494 354 268 405 618 95
252 78
8127
F
(11)
11
54 93 55 27
168 290 29
101
7900
107 93
154 173 206 111 119 93
637 120 144 53
406 149 101 31
415 98
215 IB1 208 191 376 63
157 65
148 467 480 399 298 391 599 93
241 94
7876
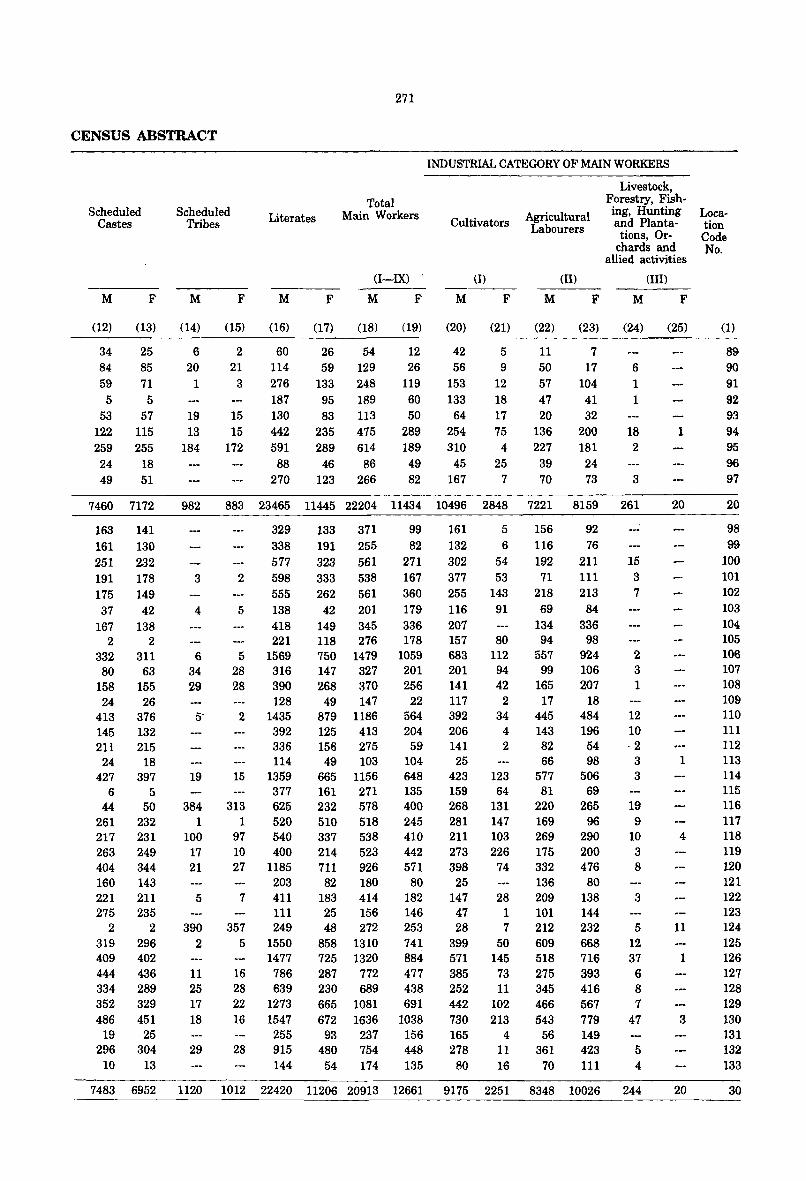
CENSUS ABSTRACT
Scheduled Castes
M F
(12) (13)
34 25 84 85 59 71
5 5 53 57
122 115 259 255 24 18 49 51
Scheduled Tribes
M
(14)
6 20
1
19 13
184
F
(15)
2 21
3
15 15
172
271
Literates Total
Main Workers
(I-DO
M F M
(16) (17) (18)
60 26 54 114 59 129 276 133 248 187 95 189 130 83 113 442 235 475 591 88
270
289 614 46 86
123 266
F
(19)
12 26
119 60 50
289 189 49 82
INDUSTRIAL CATEGORY OF MAIN WORKERS
Cultivators
m M F
Agricultural Labourers
(II)
M F
(20) (21) (22) (23)
42 5 11 7 56 9 50 17
153 12 57 104 133 18 47 41 64 17 20 32
254 75 136 200 310
45 167
4 25
7
227 39 70
181 24 73
Livestock, Forestry, Fishing, Hunting and Plantations, Or
chards and allied activities
(III)
M F
(24) (25)
6 1 1
18 1 2
3
7460 7172 982 883 23465 11445 22204 11434 10496 2848 7221 8159 261 20
163 141 161 130 251 232 191 178 175 149 37 42
167 138 2 2
332 311 80 63
158 155 24 26
413 376 145 132 211 215 24 18
427 397 6 5
44 50 261 232 217 231 263 249 404 344 160 143 221 211 275 235
2 2 319 296 409 402 444 436 334 289 352 329 486 451
19 25 296 304
10 13
3
4
6 34 29
329 338 577
2 598 555
5 138 418 221
5 1569 28 316 28 390
128 5' 2 1435
392 336 114
19 15 1359 377
384 313 625 1 1 520
100 97 540 17 10 400 21 27 1185
203 5 7 411
111 390 357 249
2 5 1550 1477
11 16 786 25 28 639 17 22 1273 18 16 1547
255 29 28 915
144
133 371 99 161 5 191 255 82 132 6
323 561 271 302 54 333 538 167 377 53 262 561 360 255 143 42 201 179 116 91
149 345 336 207 118 276 178 157 80 750 1479 1059 683 112 147 327 201 201 94 268 370 256 141 42 49 147 22 117 2
879 1186 564 392 34 125 413 204 206 4 156 275 59 141 2 49 103 104 25
665 1156 648 423 123 161 271 135 159 64 232 578 400 268 131 510 518 245 281 147 337 538 410 211 103 214 523 442 273 226 711 926 571 398 74 82 180 80 25
183 414 182 147 28 25 156 146 47 1 48 272 253 28 7
858 1310 741 399 50 725 1320 884 571 145 287 772 477 385 73 230 689 438 252 11 665 1081 691 442 102 672 1636 1038 730 213
93 237 156 165 4 480 754 448 278 11
54 174 135 80 16
156 116 192
71 218 69
134 94
557 99
165 17
445 143 82 66
577 81
220 169 269 175 332 136 209 101 212 609 518 275 345 466 543
56 361
70
92 76
211 111 213
84 336
98 924 106 207
18 484 196
54 98
506 69
265 96
290 200 476
80 138 144 232 668 716 393 416 567 779 149 423 111
15 3 7
2 3 1
12 10 ·2
3 3
19 9
10 3 8
3
5 12 37 6 8 7
47
5 4
7483 6952 1120 1012 22420 11206 20913 12661 9175 2251 8348 10026 244
1
4
11
1
3
20
Location Code No.
(1)
89 90 91 92 93 94 95 96 97
20
98 99
100 101 102 103 104 105 106 107 108 109 110 111 112 113 114 115 116 117 118 119 120 121 122 123 124 125 126 127 128 129 130 131 132 133
30
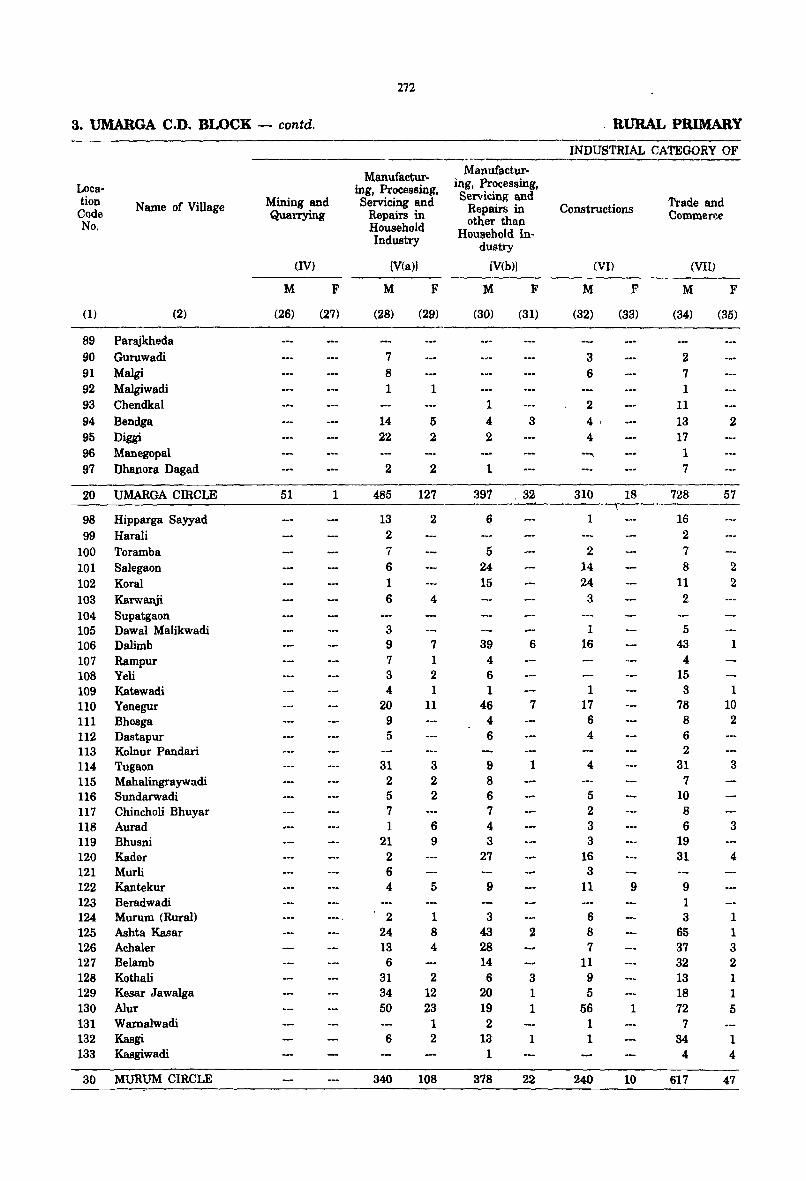
272
3. UMARGA C.D. BLOCK - contd. . RURAL PRIMARY
INDTJSTRIAL CATEGORY OF
Manufactur· Mal'lufactur-
Loca- ing, Processing, ing, Processing,
tion Name of Village Mining and Servicing and Servicing and Trade and
Code Quarrying Repairs in Repairs in Constructions Commerce other than No. Household Household In-Industry dustry
(IV) [V(a)! [V(b)] (Vl) (VII) ------M F M F M F M F M F
(1) (2) (26) (27) (28) (29) (30) (31) (32) (33) (34) (35)
89 Parajkheda 90 Guruwadi 7 3 2 91 Malgi 8 6 7 92 Malgiwadi 1 1 1 93 Chendkal 1 2 11 94 Bendga 14 5 " 3 4, 13 2 95 Diggi 22 2 2 4 17 96 Manegopal --" 1 97 Dhanora Dagad 2 2 1 7
ZO UMARGA CIRCLE 51 1 485 127 397 .32 310 18 728 57
98 Hipparga Sayyad 13 2 6 1 16 99 Harali 2 2
100 Toramba 7 5 2 7 101 Salegaon 6 24 14 8 2 102 Koral 1 15 24 11 2 103 Karwanji 6 4 3 2
104 Supatgaon 105 Dawal MaHkwadi 3 1 5 106 Dalimb 9 7 39 6 16 43 1 107 Rampur 7 1 4 4 108 YeH 3 2 6 15 109 Katewadi 4 1 1 1 3 1 110 Yenegur 20 11 46 7 17 78 10 111 Bhosga 9 4 6 8 2 112 Dastapur 5 6 4 6 113 Kolnur Pandari 2 114 Tugaon 31 3 9 1 4 31 3 115 Mahalingraywadi 2 2 8 7 116 Sundarwadi 5 2 6 5 10 117 Chincholi Bhuyar 7 7 2 8 118 Aurad 1 6 4 3 6 3 119 Bhusni 21 9 3 3 19 120 Kader 2 27 16 31 4 121 MurH 6 3 122 Kantekur 4 5 9 11 9 9 123 Beradwadi 1 124 Murum (Rural) , 2 1 3 6 3 1 125 Ashta Kasar 24 8 43 2 8 65 1 126 Achaler 13 4 28 7 37 3 127 Belamb 6 14 11 32 2 128 Kothali 31 2 6 3 9 13 1 129 Kesar Jawalga 34 12 20 1 5 18 1 130 Alur 50 23 19 1 56 1 72 5 131 Wamalwadi 1 2 1 7 132 Kasgi 6 2 13 1 1 34 1 133 Kasgiwadi 1 4 4
30 MURUM CIRCLE 340 108 378 22 240 10 617 47
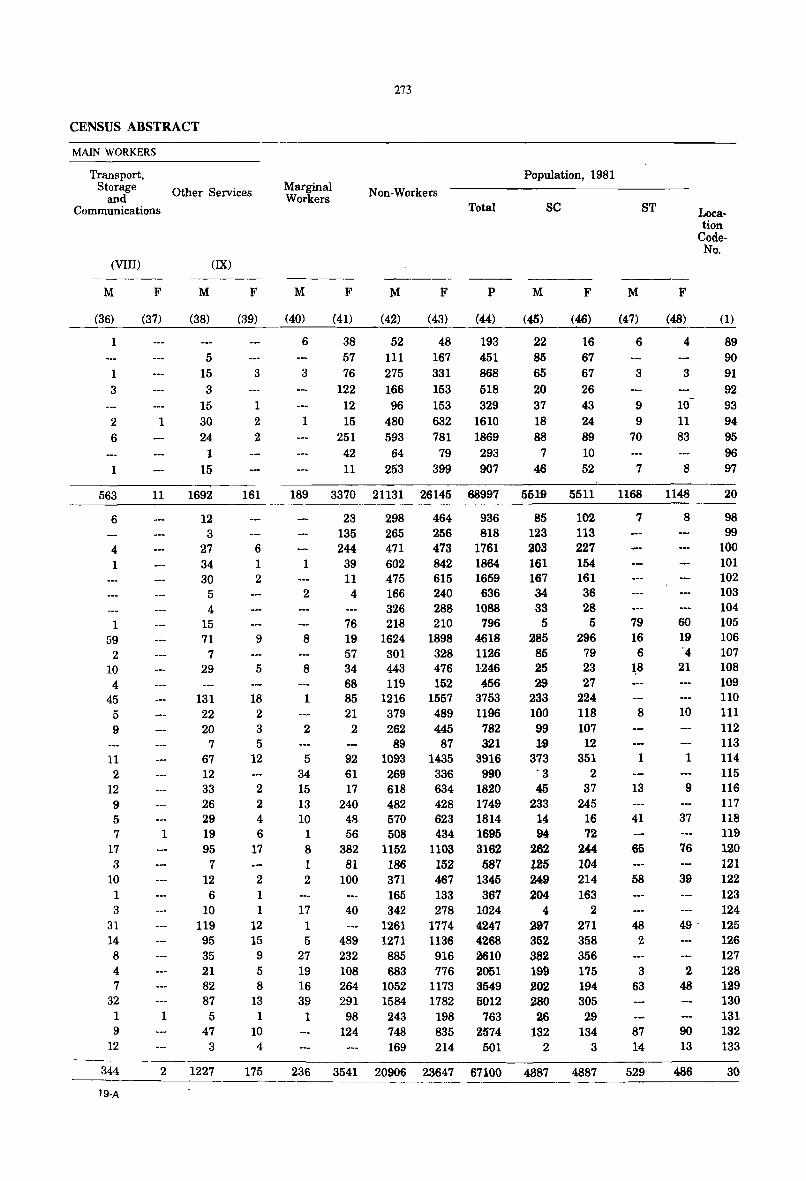
CENSUS ABSTRACT
MAIN WORKERS
Transport, Storage
and Communications
Other Services
(VIII)
M
(36)
1
1 3
2 6
1
563
6
4 1
1 59 2
10 4
45 5 9
11 2
12 9 5 7
17 3
10 1 3
31 14 8 4 7
32 1 9
12
344
19-A
F
(37)
1
(IX)
M
(38)
5 15 3
15 30 24
1 15
11 1692
1
1
2
12 3
27 34 30
5 4
15 71
7 29
131 22 20
7 67 12 33 26 29 19 95
7 12
6 10
119 95 35 21 82 87
5 47
3
1227
F
(39)
3
1 2 2
161
6 1 2
9
5
18 2 3 5
12
2 2 4 6
17
2 1 1
12 15 9 5 8
13 1
10 4
175
Marginal Workers
M
(40)
6
3
1
F
(41)
38 57 76
122 12 15
251 42 11
273
Non-Workers
M
(42)
52 111 275 166 96
480 593
64 253
F
(43)
48 167 331 153
Total
P
(44)
193 451 868 518
153 329 632 1610 781 1869 79 293
399 907
Population, 1981
SC
M
(45)
22 85 65 20 37 18 88
7 46
F
(46)
16 67 67 26 43 24 89
10 52
M
(47)
ST
6
3
9 9
70
7
F
(48)
4
3
10 11 83
8
Location
CodeNo.
(1)
89 90 91 92 93 94 95 96 97
189 3370 21131 26145 68997 5519 5511 1168 1148 20
23 298 464 936 85 102 135 265 256 818 123 113 244 471 473 1761 203 227
1 39 602 842 1864 161 154 11 475 615 1659 167 161
2 4 166 240 636 34 36 326 288 1088 33 28
76 218 210 796 5 5 8 19 1624 1898 4618 285 296
57 301 328 1126 85 79 8 34 443 476 1246 25 23
68 119 152 456 29 27 1 85 1216 1557 3753 233 224
21 379 489 1196 100 118 2 2 262 445 782 99 107
89 87 ;J2.l 19 12 5 92 1093 1435 3916 373 351
34 61 269 33~ 990 '3 2 15 17 618 634 1820 45 37 13 240 482 428 1749 233 245 10 48 570 623 1814 U 16
1 56 508 434 1695 94 72 8 382 1152 1103 3162 262 244 1 81 186 152 587 U5 104 2 100 371 467 1345 249 214
165 133 367 204 163 17 40 342 278 1024 4 2 1 1261 1774 4247 297 271 5 489 1271 1136 4268 352 358
27 232 885 916 2610 382 356 19 108 683 776 2051 199 175 16 264 1052 1173 3549 202 194 39 291 1584 1782 5012 280 305
1 98 243 198 763 2.6 29 124 748 835 2574 132 134
169 214 501 2 3
236 3541 20906 23647 67100 4887 4887
7
79 16 6 ~8
8
1
13
41
58
48 2
3 63
87 14
529
8 98 99
100 101 102 103 104
60 105 19 106 '4 107
21 108 109 110
10 111 112 113
1 114 115
9 116 117
37 118 119
76 120 121
39 122 123 124
49' 125 126 127
2 128 48 129
130 131
90 132 13 133
486 30
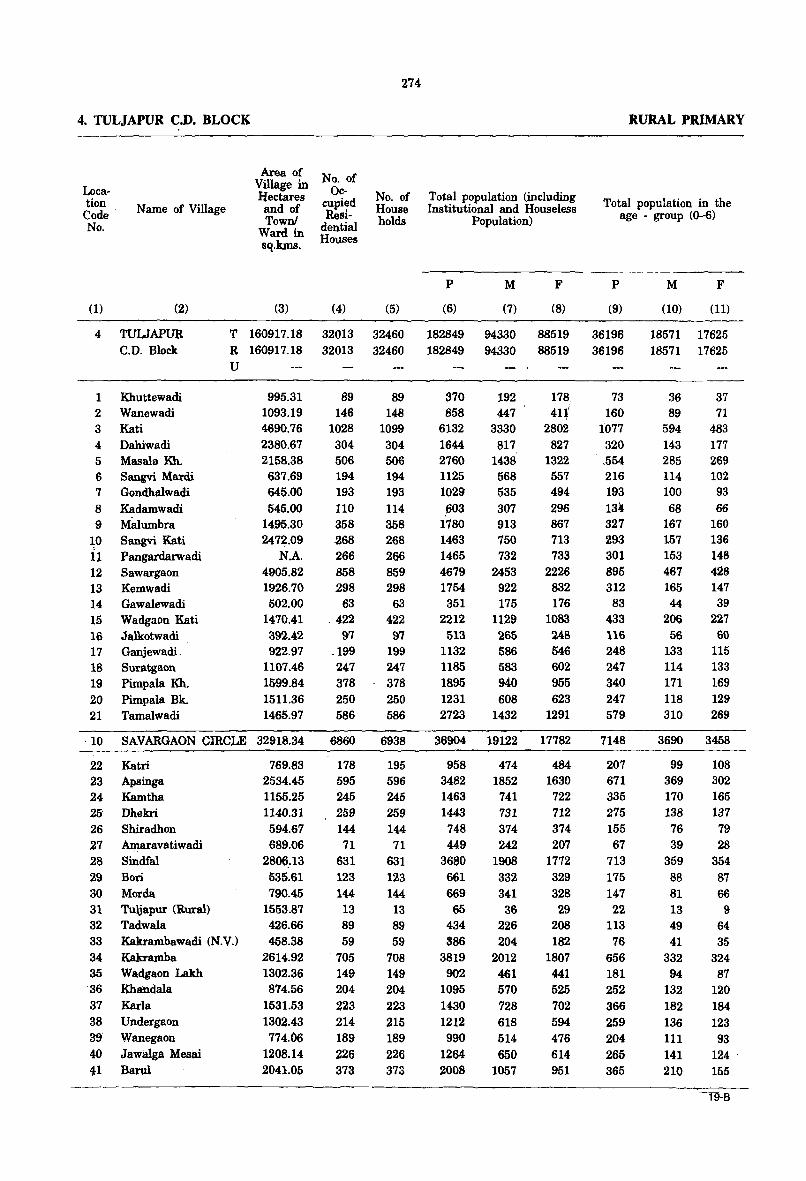
274
4. TULJAPUR C.D. BLOCK RURAL PRIMARY
Location Code' No.
Name of Village
Area of Village in }fectares and of Town!
No. of Qc·
cupied Resi
dential Houses
No. of House holds
Total population (including Institutional and Houseless
Population)
Total population in the age - group (0--6)
(1) (2)
4 TULJAPUR C.D. Block
1 Khuttewadi 2 Wanewadi 3 Kati 4 Dahiwadi 5 Masala Kh. 6 Sangvi Mardi 7 Gondhalwadi 8 Kadamwadi 9 M8lumbra
10 Sangvi Kati 11 Pangar<iarwadi 12 Sawargaon 13 Kemwadi 14 Gawalewadi Hi Wadgaon Kati 16 Jalkotwadi. 17 Ganjewadi. 18 Suratgaon 19 Pimpala Kh. 20 Pimpala Bk. 21 Tamalwadi
Ward in sq.kms.
P M F P
(3) (4) (5) (6) (7) (8) (9)
T 160917.18 32013 32460 182849 94330 88519 36196 R 160917.18 32013 32460 182849 94330 88519 36196 U
995.31 89 1093.19 146 4690.76 1028 2380.67 304 2158.38 506 637.69 194 645.00 193 545.00 110
1495.30 358 24 7~.09 .268
N.A. 266 4905.82 858 1926.70 298 502.00 63
1470.41 . 422 392.42 97 922.97 .. 199
1107.46 247 1599.84 378 1511.36 250 1465.97 586
89 148
1099 304 506 194 193 114 358 268 266 859 298
63 422 97
199 247 378 250 586
370 858
6132 1644 2760 1125 1029 ,603
1780 1463 1465 4679 1754 351
2212 513
1132 1185 1895 1231 2723
192 447
3330 817
1438 568 535 307 913 750 732
2453 922 175
1129 265 586 583
940 608
1432
178, 41~i
2802 827
1322 557 494 296 867 713 733
2226 832 176
1083 248 546 602 955 623
1291
73 160
1077 320
. ,554
216 193 134 327 293 301 895 312 83
433 116 248 247 340 247 579
, 10 SAVARGAON CIRCLE 32918.34 6860 6938 36904 19122 17782 7148
22 Katri 23 Apsinga 24 Kamtha 25 Dhekri 26 Shiradhon 27 ~aravatiwadi
28 Sindfal 29 Bori 30 Morda 31 Tuljapur (Rural) 32 Tadwala 33 Kakrambawadi (N.V.) 34 Kakramba 35 Wadgaon ~ 36 Khandala 37 Karla 38 Undergaon 39' Wanegaon 40 Jawalga Mesai 4:1 Barul
769.83 2534.45 1155.25 1140.31 594.67 689.06
2806:13 535.61 790.45
1553.87 426.66 458.38
2614.92 1302.36 874.56
1531.53 1302.43 774.06
1208.14 2041.05
178 595 245 259 144 71
631 123 144 13 89 59
705 149 204 223 214 189 226 373
195 596 245 259 144 71
631 123 144 13 89 59
708 149 204 223 215 189 226 373
958 3482 1463 1443
748 449
3680 661 669 65
434 386
3819 902
1095 1430 1212 990
1264 2008
474 1852
741 731 374 242
1908 332 341 36
226 204
2012 461 570 728 618 514 650
1057
484 1630
722 712 374 207
1772 329 328 29
208 182
1807 441 525 702 594 476 614 951
207 671 335 275 155 67
713 175 147 22
113 76
656 181 252 366 259 204 265 365
M F
(10) (11)
18571 17625 18571 17625
36 89
594 143 285 114 100 68
167 157 153 467 165 44
206 56
133 114 171 118 310
37 71
483 177 269 102 93 66
160 136 148 428 147 39
227 60
115 133 169 129 269
3690 3458
99
369 170 138 76 39
359 88 81 13 49 41
332 94
132 182 136 111 141 210
108 302 165 187
79 28
354 87 66
9 64 35
324 87
120 184 123 93
124 ' 155
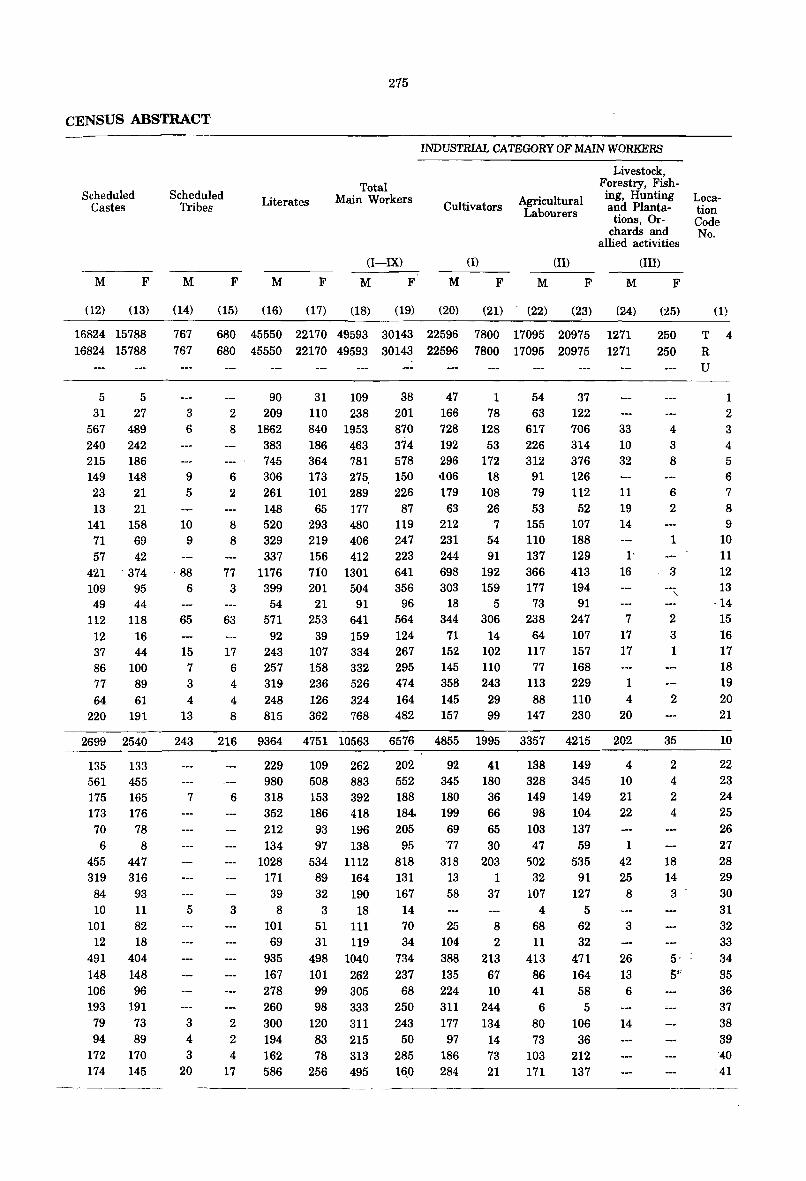
275
CENSUS ABSTRACT
INDUSTRIAL CATEGORY OF MAIN WORKERS
Scheduled Castes
Scheduled Tribes Literates
Total Main Workers
Cultivators Agricultural Labourers
M F M
(12) (13) (14)
16824 15788 16824 15788
767 767
(I-IX)
F M F M F M
(15) (16) (17) (18) (19) (20)
680 45550 22170 49593 30143 22596 680 45550 22170 49593 30143 22596
(l) (lI)
F M F
(21) (22) (23)
7800 17095 20975 7800 17095 20975
Livestock, Forestry, Fishing, Hunting and Planta
tions, Orchards and
allied activities
(Ill)
M F
(24) (;l5)
1271 1271
250 250
Location Code No.
(1)
T R U
4
--------------------------------------------------------------------------_.----5
31 5
27 567 489 240 242 215 186 149 148 23 21 13 21
141 158 71 69 57 42
421 374 109 95 49 44
112 118 12 16 37 44 86 100 77 89 64 61
220 191
2699 2540
l35 133 561 455 175 165 173 176 70 78 6 8
455 447 319 316 84 93 10 11
101 82 12 18
491 404 148 148 106 96 193 191
79 73 94 89
172 170 174 145
3 6
9 5
10 9
- 88 6
65
15 7 3 4
13
243
7
5
3
4 3
20
2 90
209 8 1862
383 745
6 306 2 261
148 8 520 8 329
337 77 1176
3 399 54
63 571 92
17 243 6 257 4 319 4 248 8 815
31 109 110 238 840 1953 186 463 364 781 173 275. 101 289
65 177 293 480 219 406 156 412 710 1301 201 504
21 91 253 641
39 159 107 334 158 332 236 526 126 324 362 768
38 201
47 166
1 78
870 728 128 374 192 53 578 296 172 150 .106 18 226 179 108
87 63 26 119 212 7 247 231 54 223 244 91 641 698 192 356 303 159
96 18 5 564 344 306 124 71 14 267 152 102 295 145 110 474 358 243 164 145 29 482 157 99
54 63
617 226 312
91 79 53
155 110 137 366 177
73 238
64 117 77
113 88
147
37 122 706 314 376 126 112
52 107 188 129 413 194
91 247 107 157 168 229 110 230
33 10 32
11 19 14
l' 16
7 17 17
1 4
20
216 9364 4751 10563 6576 4855 1995 3357 4215 202
229 980
6 318 352 212 134
1028 171 39
3 8
2 2 4
17
101 69
935 167 278 260 300 194 162 586
109 262 508 883 153 392 186 418 93 196 97 138
534 1112 89 164 32 190
3 18 51 111 31 119
498 1040 101 262 99 305 98 333
120 311 83 215 78 313
256 495
202 92 41 552 345 180 188 180 36 184. 199 66 205 69 65
95 '77 30 818 318 203 131 13 1 167 58 37
14 70 25 8 34 104 2
734 388 213 237 135 67 68
250 243
50 285
16.0
224 10 311 244 177 134
97 14 186 284
73 21
138 328 149 98
103 47
502 32
107 4
68 11
413 86 41
6 80 73
103 171
149 345 149 104 137 59
535 91
127 5
62 32
471 164 58
5 106
36 212 137
4 10 21 22
1 42 25 8
3
26 13 6
14
4 "3
8
6 2
1
-3
2
3 1
2
35
2 4 2 4
18 14 3
1 2 3 4 5
6 7 8 9
10 11 12 13
·14 15 16 17 18 19 20 21
10
22 23 24 25 26 27 28 29 30 31 32 33 34 35 36 37 38 39 "40
41

4. TULJAPUR C.D. BLOCK - contd.
Location Code No.
Name of Village
(I) (2)
4 TULJAPUR C.O. Block
1 Khuttewadi 2 Wanewadi 3 Kati 4 Dahiwadi 5 Masala Kh. 6 Sangvi Mardi 7 Gondhalwadi 8 Kadamwadi 9 Malumbra
10 Sangvi Kati 11 Pangardarwadi 12 Sawargaon 13 Kemwadi 14 Gawalewadi 15 Wadgaon Kati 16 Jalkotwadi 17 Ganjewadi 18 Suratgaon 19 Pimpala Kh. 20 Pimpala Bk. 21 Tamalwadi
T R U
10 SAVARGAON CIRCLE
22 Katri 23 Apsinga 24 Kamtha 25 Dhekri 26 Shiradhon 27 Amaravatiwadi 28 Sindfal 29 Bori 30 Morda 31 Tuljapur (Rural) 32 Tadwala 33 Kakrambawadi (N.V.) 34 Kakramba 35 Wadgaon lAUth 36 Khandala 37 Karla 38 Undergaon 139 Wanegaon -'-i0 Ja'walga Mesai 41 lUil'tll
Mining and Quarrying
(IV)
M F
(26)
172 172
1
2
2
8
13
6
1
(27)
30 30
5
276
Manufacturing, Processing, Servicing and
Repairs in Household Industry
[V(a)]
M F
(28)
693
693
1
32 11 2
2 7
,1
25 11
29 1
19
5 9 4 3 3
156
4
22 1 -2 1 5
'16
2
25
iil 1
4
(29)
214 214
5 3 3
3
5
3
1
5
2 6
41
7 13
2 1 6 4 1
9
2
1
Manufacturing, Processing, Servicing and
Repairs in other than
Household Industry
[V{b)]
(SO) (31)
1944 807 1944 S07
1
41 7
16 11
2 1
14 18 to '46
4
4
2
1
2 2
1
18 '2 38 4 1:9 1 '57 18
320 135
624 166
15 3 1
49 10 '5
10 2 1
31
" 'a 5 9 :a -., 3
1 1
'11 2
'8
RURAL PRIMARY
INDUSTRIAL CATEGORY OF
Constructions
(VI)
M F
(32)
799 799
1 20'
2 ~
15
7 6 4 1
16 2
1 1
30 2 3
11
125
2 23 15 19
24 57
1 2 2
23 1 3 1
12 15
1 3
(33)
38 38
1
1
1 1
1
3
8
4
3
6
Trade and Commerce
(VII)
M F
(34)
1437 1437
3
73 3
27 4 6
18 17 8 8
51 5
8
6 10
8 10 32
297
5 32
8 19
7 1
58 8
4 2 3
49 3 9 3 4
6 2 8
(35)
204 204
1 10
5 3
1 2
1 3 2
4
1
4
3 4
1 1 1 1
20 21
9 1
1 1
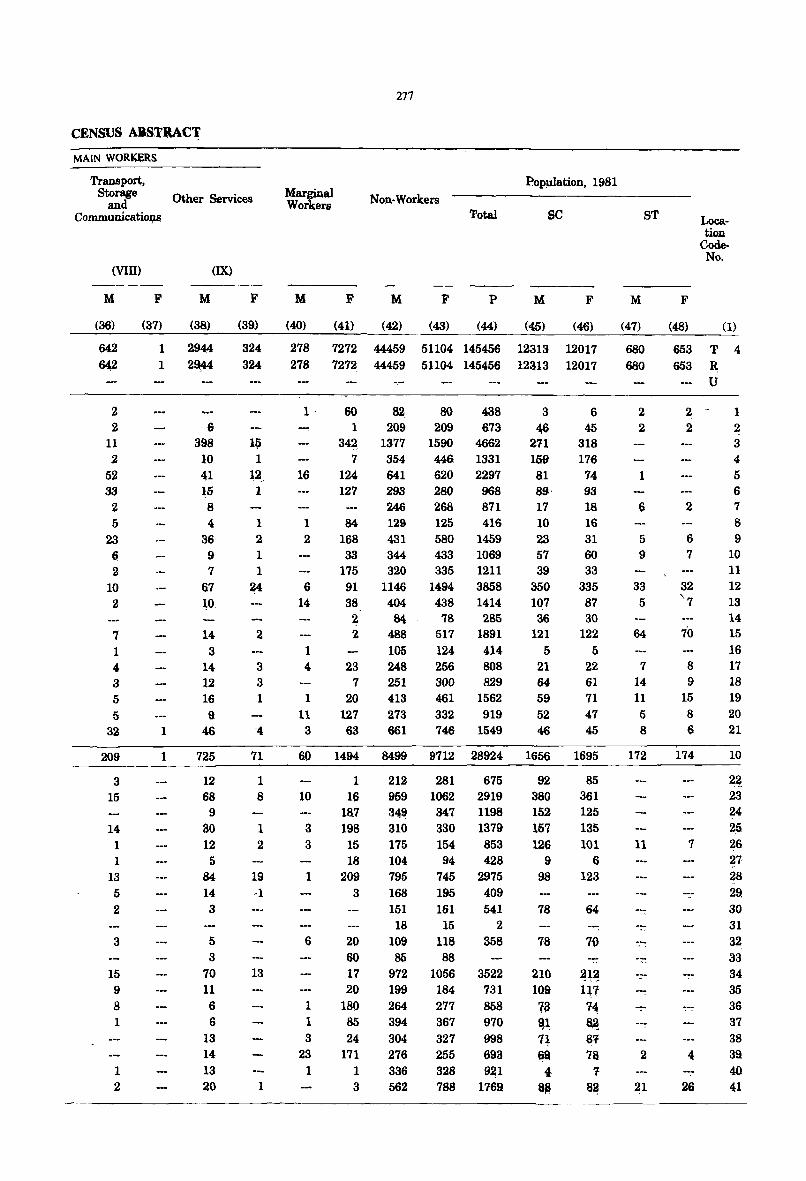
CENSUS ABSTltAC~
MAIN WORKERS
Transport, Storage Other Services
and Communicatio~
(VIll)
M
(36)
642
~
.2 2
11 .2
52 33
.2 5
23
~ .2
10 .2
7 1 4 3 5 5
32
209
3 15
14 1 1
13 5 2
3
15 9 8 1
1 2
F
(37)
M
(38)
(IX)
1 2944 1 29;44
1
1
6 398
10 41 15 8 4
36 9 7
67 10,
14 3
14 12 16 9
46
725
12 68
9 30 12
5 84 14 3
5 3
70 11 6 6
13 14 13 20
F
(39)
324 324
Ie; 1
12. 1
1 2 1 1
~
2
3 3 1
71
1 8
1 .2
19 -1
13
1
Marginal Workers
M
(40)
F
(41)
277
Non-Workers
M
(42)
F
(43)
'Fotal
P
(44)
Pop:uiation, 1981
M
(45)
sc
F
(46)
278 7272 44459 51104 145456 12313 12017 278 7272 44459 51104 145456 12313 12017
-,-
1 . 60 82. 80 438 1 209 209 673
342 1377 1590 4662 7 354 44& 1331
16 124 641 620 2297 127 293 280 968
246 268 871 1 84 129 125 416 2 168 431 580 1459
33 344 433 1069 175 320 335 1211
6 91 1146 1494 3858 14 38 404 438 1414
2 84 78 285 2 488 517 1891
1 105 124 414 4 23 248 256 808
7 251 300 829 1 20 413 461 1562
11 127 273 332 919 3 63 661 746 1549
60 1494 8499 9712 28924
10
3 3
1
6
1 1 3
23 1
1 16
187 198 15 18
209 3
20 60 17 20
180 85 24
171 1 3
212 281 675 959 1062 2919 349 347 1198 310 330 1379 175 104 795 168 151 18
109 85
154 853 94 428
745 2975 195 409 161
15 118 88
541 .2
358
972 1056 3522 199 184 731 264 277 858 394 367 970 304 327 998 276 255 693 336 328 9~1
562 788 1769
3 6 46 45
271 318 159 176 81 74 89· 93 17 18 10 16 23 31 57 60 39 33
350 335 107 87 36 30
121 122 5 5
21 22 64 61 59 71 52 47 46 45
1656 1695
92 380 152 157 126
9 98
78
78
210 109
f~ ~l
1\ ~
4-a~
85 361 125 135 101
6 123
64
~l~ In ~ ~ ~'t 78
'1
8~
M
(47)
ST
680 680
2 2
1
6
5 9
33 5
7 14 11 5 8
172
11
2
21
F
(48)
Location
CodeNo.
(I)
653 T 4 653 R
U
2 - 1 2 2
3 4 5 6
2 7 8
6 9 7 10
11 32 12 '7 13
14 7'0 15
16 8 17 9 18
15 19 8 20 6 21
174 10
7
4
26
2~ 23 24
~ 26 27· 28 29. 30 31 32 33 34 35 36 37 38 39 40 41
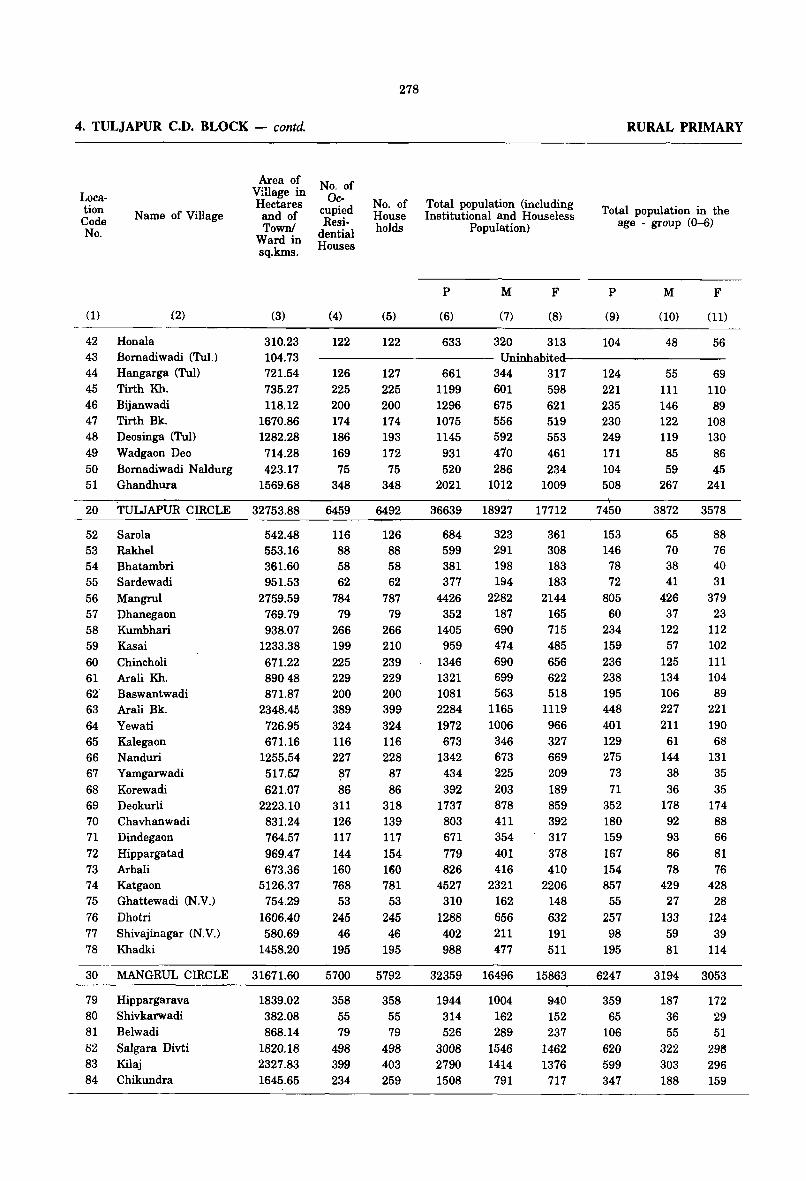
4. TULJAPUR C.D. BLOCK - contd.
Location Code No.
N arne of Village
(1) (2)
42 Honala 43 Bornadiwadi (Tul.)
44 Hangarga (Tul)
45 Tirth Kh. 46 Bijanwadi 47 Tirth Bk. 48 Deosinga (Tul)
49 Wadgaon Deo 50 Bornadiwadi Naldurg 51 Ghandhura
20 TULJAPUR CIRCLE
52 Sarola 53 Rakhel 54 Bhatambri 55 Sardewadi 56 Mangrul 57 Dhanegaon 58 Kumbhari 59 Kasai 60 Chincholi 61 Arali Kh. 62' Baswantwadi 63 Arali Bk. 64 Yewati 65 Kalegaon 66 Nanduri 67 Yamgarwadi 68 Korewadi 69 Deokurli 70 Chavhanwadi 71 Dindegaon 72 Hippargatad 73 Arbali 74 Katgaon
---
75 Ghattewadi (NV.)
76 Dhotri 77 Shivajinagar (N.V.) 78 Khadki
30 MANGRUL CIRCLE
79 Hippargarava 80 Shivkarwadi 81 Belwadi 82 Salgara Divti 83 Kilaj 84 Chikundra
Area of Village in Hectares and of Town!
Ward in sq.kms.
(3)
310.23 104.73 721.54 735.27 118.12
1670.86 1282.28 714.28 423.17
1569.68
32753.88
542.48 553.16 361.60 951.53
2759.59 769.79 938.07
1233.38 671.22 89048 871.87
2348.45 726.95 671.16
1255.54 517.5:7 621.07
2223.10 831.24 764.57 969.47 673.36
5126.37 754.29
1606.40 580.69
1458.20
31671.60
1839.02 382.08 868.14
1820.18 2327.83 1645.65
No. of Oc
cupied Resi
dential Houses
(4)
122
278
No. of House holds
(5)
122
Total population (including Institutional and Houseless
Population)
P
(6)
633
M
(7)
F
(8)
320 313
RURAL PRIMARY
Total population in the age - group (0-6)
P
(9)
104
M
(10)
48
F
(11)
56 ----------- Un~abited----------
126 225 200 174 186 169 75
348
6459
116 88 58 62
784 79
266 199 225 229 200 389 324 116 227 87 86
311 126 117 144 160 768 53
245 46
195
5700
358 55 79
498 399 234
127 225 200 174 193 172 75
348
6492
126 88 58 62
787 79
266 210 239 229 200 399 324 116
228 87 86
318 139 117 154 160 781 53
245 46
195
5792
358 55 79
498 403 259
661 1199 1296 1075 1145 931 520
2021
36639
684 599 381 377
4426 352
1405 959
1346 1321 1081 2284 1972 673
1342 434 392
1737 803 671 779 826
4527 310
1288 402 988
32359
1944 314 526
3008 2790 1508
344 317 601 598 675 621 556 5i9 592 410 286
1012
18927
323 291 198 194
2282 187 690 474 690 699 563
1165 1006
346 673 225 203 878 411 354 401 416
2321 162 656 211 477
16496
1004 162 289
1546 1414
791
553 461 234
1009
17712
361 308 183 183
2144 165 715 485 656 622 518
1119 966 327 669 209 189 859 392 317 378 410
2206 148 632 191 511
15863
940 152 237
1462 1376
717
124 221 235 230 249 171 104 508
7450
153 146 78 72
805 60
234 159 236 238 195 448 401 129 275
73 71
352 180 159 167 154 857
55 257 98
195
6247
359 65
106 620 599 347
55 111 146 122 119
85 59
267
3872
65 70 38 41
426 37
122 57
125 134 106 227 211
61 144 38 36
178 92 93 86 78
429 27
133 59 81
3194
187 36 55
322 303 188
69 110 89
108 130 86 45
241
3578
88 76 40 31
379 23
112 102 111 104 89
221 190 68
131 35 35
174 88 66 81 76
428 28
124 39
114
3053
172 29 51
29S 296 159
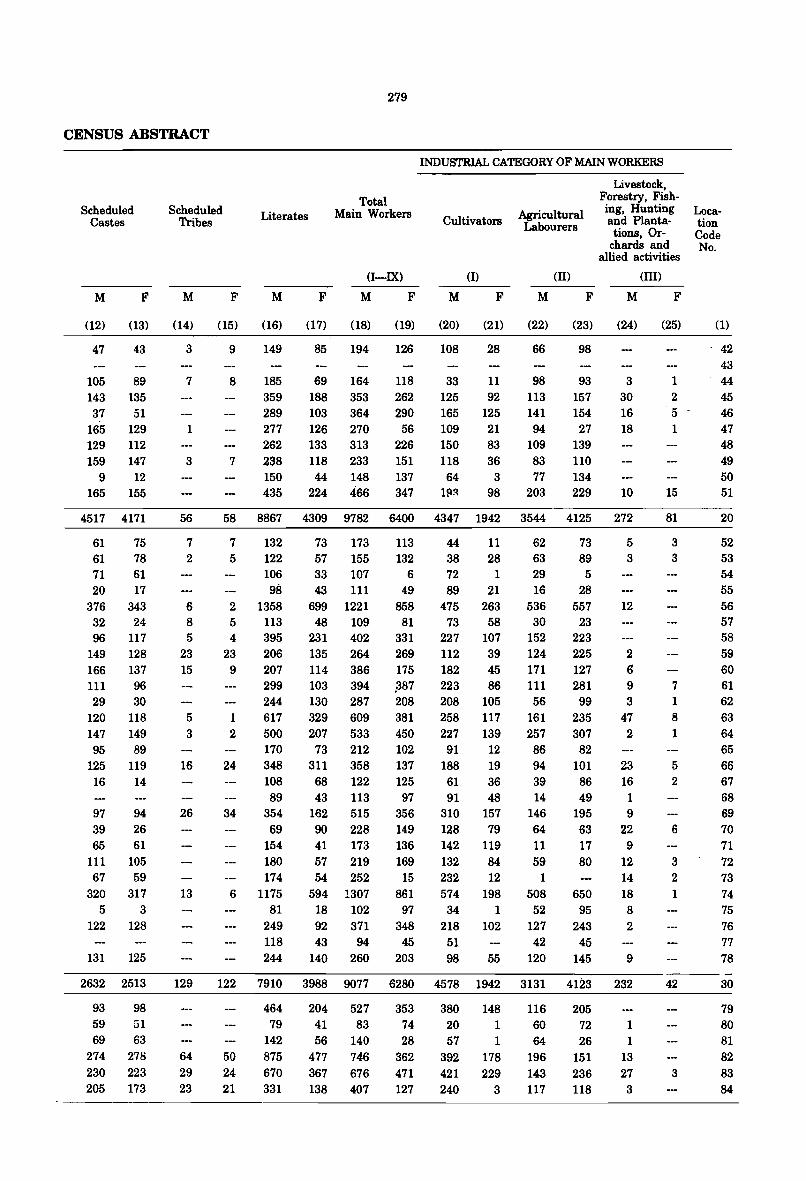
279
CENSUS ABSTRACT
Scheduled Castes
M F
(12) (13)
47 43
105 89 143 135 37 51
165 129 129 112 159 147
9 12 165 155
4517 4171
61 75 61 78 71 61 20 17
376 343 32 24 96 117
149 128 166 137 111 96 29 30
120 118 147 149 95 89
125 119 16
97 39
14
94 26
65 61 111 105 67 59
320 317 5 3
122 128
131 125
2632 2513
93 98 59 51 69 63
274 278 230 223 205 173
Scheduled Tribes
M F
Literates
M F
Total Main Workers
(I-IX)
M F
INDUSTRIAL CATEGORY OF MAIN WORKERS
Cultivators
(I)
M F
Agricultural Labourers
(II)
M F
Livestock, Forestry, Fishing, Hunting and Plantations, Or
chards and allied activities
(III)
M F
(14) (15) (16) (17) (18) (19) (20) (21) (22) (23) (24) (25)
3
7
1
3
56
7 2
6 8 5
23 15
5 3
16
26
13
129
64 29 23
9
8
7
58
7 5
149
185 359 289 277 262 238 150 435
8867
132 122 106 98
2 1358 5 113 4
23 9
1
2
24
34
395 206 207 299 244 617 500 170 348 108 89
354 69
154 180 174
6 1175 81
249 118 244
85 194 126
69 164 118 188 353 262 103 364 290 126 270 56 133 313 226 118 233 151 44 148 137
224 466 347
4309 9782 6400
73 173 113 57 155 132 33 107 6 43 111 49
699 1221 48 109
231 402 135 264 114 386 103 394 130 287 329 609 207 533
73 212 311 358 68 122 43 113
162 515 90 228 41 173 57 219 54 252
594 1307 18 102 92 371 43 94
140 260
858 81
331 269 175 .387 208 381 450 102 137 125 97
356 149 136 169
15 861
97 348
45 203
108 28
33 11 125 92 165 125 109 21 150 83 118 36 64 3
Ifill 98
4347 1942
44 11 38 28 72 1 89 21
475 263 73 58
227 107 112 39 182 45 223 86 208 105 258 117 227 139
91 12 188 19 61 91
36 48
310 157 128 79 142 119 132 84 232 12 574 198
34 1 218 102
51 98 55
66
98 113 141 94
109 83 77
203
3544
62 63 29 16
536 30
152 124 171 111 56
161 257 86 94 39 14
146 64 11 59
1 508 52
127 42
120
98
93 157 154 27
139 110 134 229
4125
73 89 5
28 557
23 223 225 127 281 99
235 307 82
101 86 49
195 63 17 80
650 95
243 45
145
3 30 16 18
10
272
5 3
12
2 6 9 3
47 2
23 16 1 9
22 9
12 14 18 8 2
9
122 7910 3988 9077 6280 4578 1942 3131 4123 232
50 24 21
464 79
142 875 670 331
204 527 41 83 56 140
477 746 367 676 138 407
353 74 28
362 471 127
380 148 20 1 57 1
392 178 421 229 240 3
116 60 64
196 143 117
205 72 26
151 236 118
1 1
13 27 3
1 2 5 ~
1
15
81
3 3
7 1 8 1
5 2
6
3 2 1
42
3
Location Code No.
(1)
42 43 44
45 46 47 48 49 50 51
20
52 53 54 55 56 57 58 59 60 61 62 63 64 65 66 67 68 69 70 71 72 73 74 75 76 77 78
30
79 80 81 82 83 84
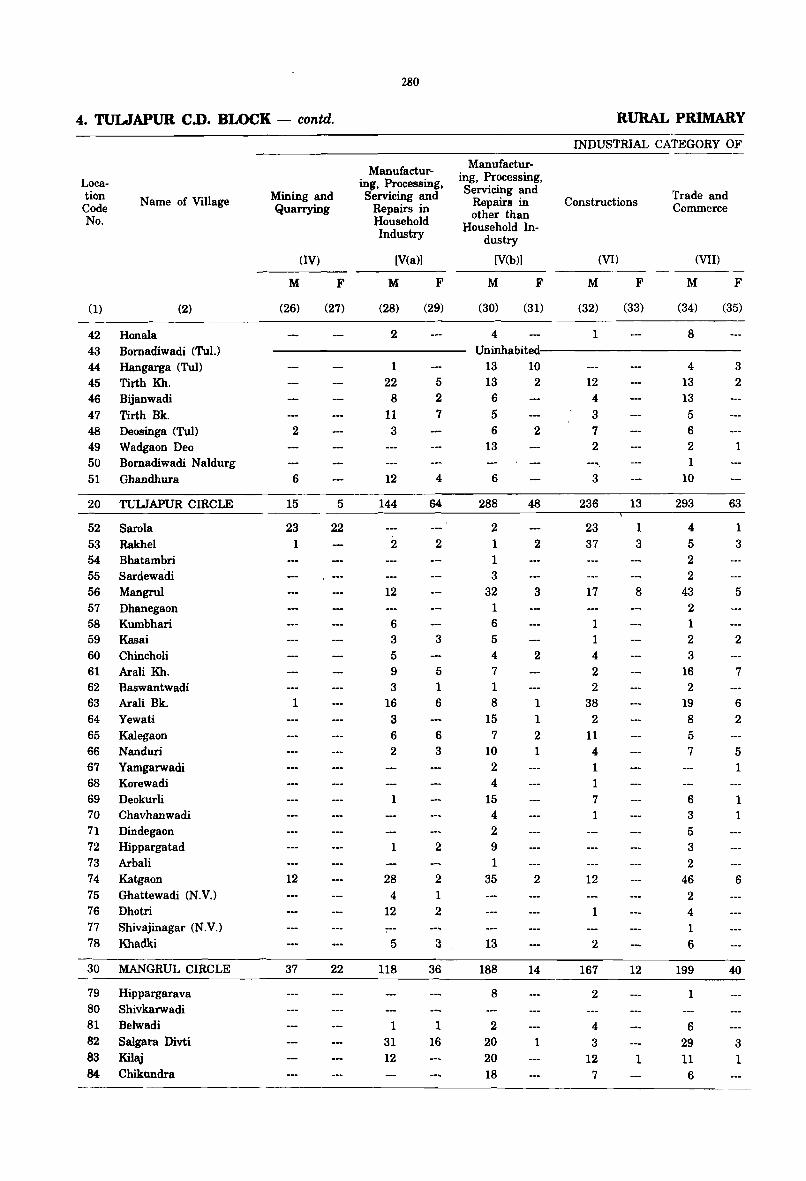
4. TULJAPUR C.D. BLOCK - contd.
Location Code No.
Name of Village
(l) (2)
42 Honala 43 Bomadiwadi (Tul.) 44 Hangarga (Tul)
45 Tirth Kh. 46 Bijanwadi 47 Tirth Bk. 48 Deosinga (Tul) 49 Wadgaon Deo 50 Bomadiwadi Naldurg 51 Ghandhura
20 TULJAPUR CIRCLE
52 Sarola 53 Rakhel 54 Bhatambri 55 Sardewadi 56 Mangrul 57 Dhanegaon 58 Kumbhari 59 Kasai 60 Chincholi 61 Arali Kh. 62 Baswantwadi 63 Arali Bk. 64 Yewati 65 Kalegaon 66 Nanduri 67 Yamgarwadi 68 Korewadi 69 Deokurli 70 Chavhanwadi 71 Dindegaon 72 Hippargatad 73 Arbali 74 Katgaon 75 Ghattewadi (N.V.) 76 Dhotri 77 Shivajinagar (N.V.) 78 Khadki
30 MANGRUL CIRCLE
79 Hippargarava 80 Shivkarwadi 81 Belwadi 82 Salgara Divti 83 Kilaj 84 Chikundra
Mining and Quarrying
(IV)
M
(26)
2
6
15
23 1
1
12
37
F
(27)
5
22
22
280
Manufacturing, Processing, Servicing and
Repairs in Household Industry
[V(a»)
M
(28)
2
1 22
8 11
3
12
144
2
12
6 3 5 9 3
16 3 6 2
1
1
28 4
12
5
118
1
31 12
F
(29)
5 2 7
4
64
2
3
5 1 6
6 3
2
2 1 2
3
36
1 16
Manufacturing, Processing, Servicing and
Repairs in other than
Household Industry
[V(b»)
M
(30)
4
F
(31)
RURAL PRIMARY
INDUSTRIAL CATEGORY OF
Constructions
M
(32)
1
(VI)
F
(33)
Trade and Commerce
(VII)
M F
(34) (35)
8 Uninhabited-------------
13 10 13 . 2 6 5 6
13
6
288
2 1 1 3
32 1 6
5
4 7 1 8
15 7
10 2 4
15 4 2 9 1
35
13
188
8
2 20 20 18
2
48
2
3
2
1 1 2 1
2
14
1
12 4 3 7 2
3
236
23 37
17
1 1 4 2 2
38 2
11 4 1 1
7 1
12
1
2
167
2
4
3 12
7
13
1 3
8
12
1
4 13 13 5 6 2 1
10
293
4 5 2 2
43 2 1 2 3
16 2
19 8 5 7
6 3 5
3
2 46
2 4 1
6
199
1
6
29 11 6
3
2
1
63
1 3
5
2
7
6
2
5
1
1 1
6
40
3 1
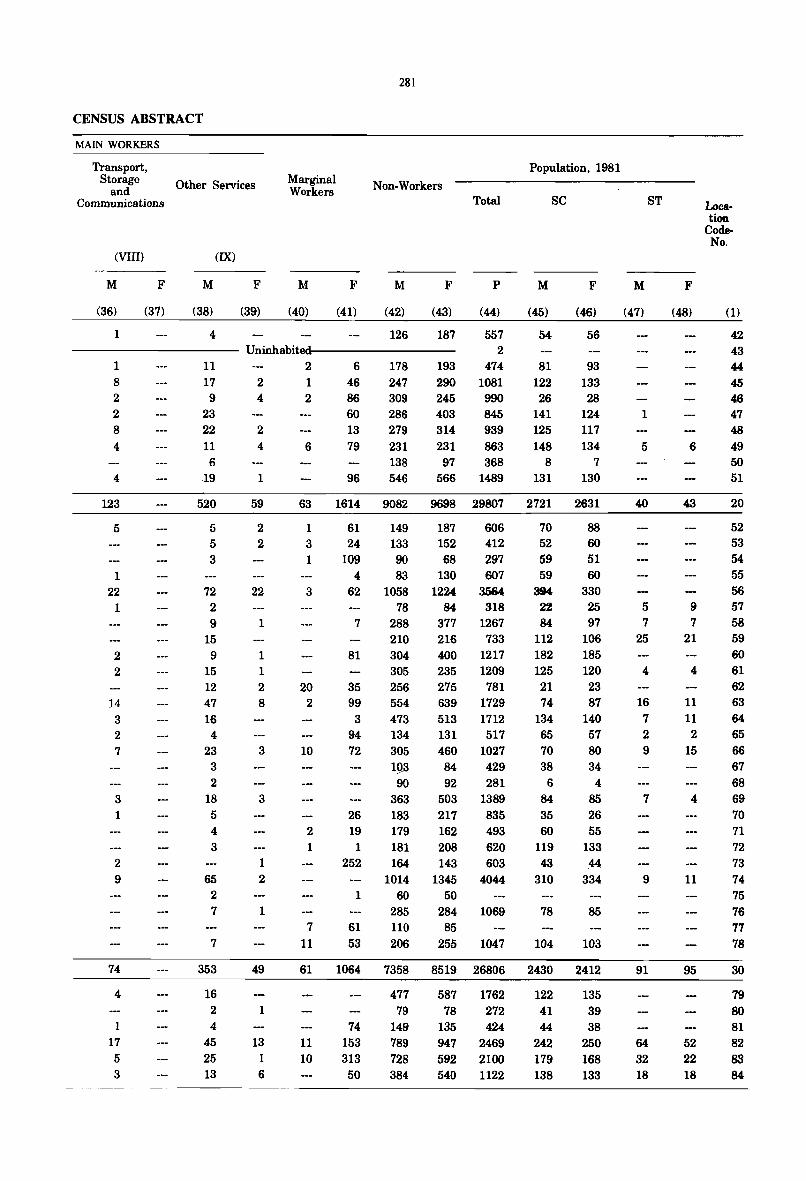
281
CENSUS ABSTRACT
MAIN WORKERS
Population, 1981 Transport, Storage
and Communications
Other Services Marginal Workers Non-Workers
(VIII)
M F
(36) (37)
1
(IX)
M
(38)
4
F
(39)
M
(40)
F
(41)
Total SC
M F P M F
(42) (43) (44) (45) (46)
126 187 557 54 56 ---------- Uninhabit.ed--------- 2
193 474 290 1081
1 8 2 2 8 4
123
5
1 22
1
2 2
14 3 2 7
3
1
2 9
74
4
1 17 5 3
11 17 9
23 22 11 6
19
520
5
5 3
72 2 9
15 9
15 12 47 16
4 23
3
2 18 5 4 3
65 2 7
7
353
16 2 4
45 25 13
2 2 1 4 2
2
4 6
1
6 46 86 60 13 79
96
178 247 309 286 279 231 138 546
245 990 403 845
314 939 231 863 97 368
566 1489
81 122 26
141 125 148
8 131
93 133 28
124 117 134
7 130
59 63 1614 9082 9698 29807 2721 2631
2 2
22
1
1 1 2 8
3
3
1 2
1
49
1
13 1 6
1 3 1
3
20 2
10
2 1
7
11
61 24
109
149 133 90
187 152 68
606 412 297
4 83 130 607 62 1058 l224 3564
78 84 318 7 288 377 1267
210 216 733 81 304 400 1217
305 235 1209 35 256 275 781 99 554 639 1729 3 473 513 1712
94 134 131 517 72 305 460 1027
26 19
1 252
193 84 429 90 92 281
363 183 179 181 164
503 1389 217 835 162 208 143
493 620 603
1014 1345 4044 1 60 50
61 53
285 284 1069 110 206
85 255 1047
70 52 59 59
394 22 84
112 182 125 21 74
134 65 70 38
6 84 35 60
119 43
310
78
104
88 60 51 60
330 25 97
106 185 120 23 87
140 57 80 34 4
85 26 55
133 .44
334
85
103
61 1064 7358 8519 26806 2430 2412
11 10
74 153 313 50
477 79
149 789 728 384
587 1762 78 272
135 424 947 2469 592 2100 540 1122
122 41 44
242 179 138
135 39 38
250 168 133
ST
M
(47)
1
5
40
5 7
25
4
16 7 2 9
7
9
91
64 32 18
F
(48)
6
43
9 7
21
4
11 11
2 15
4
11
95
52 22 18
Location
CodeNo.
(1)
42 43 44 45 46 47 48
49 50 51
20
52 53 54 55 56 57 58 59 60 61 62 63 64 65 66 67 68 69 70 71 72 73 74 75 76 77 78
30
79 80 81 82 83 84
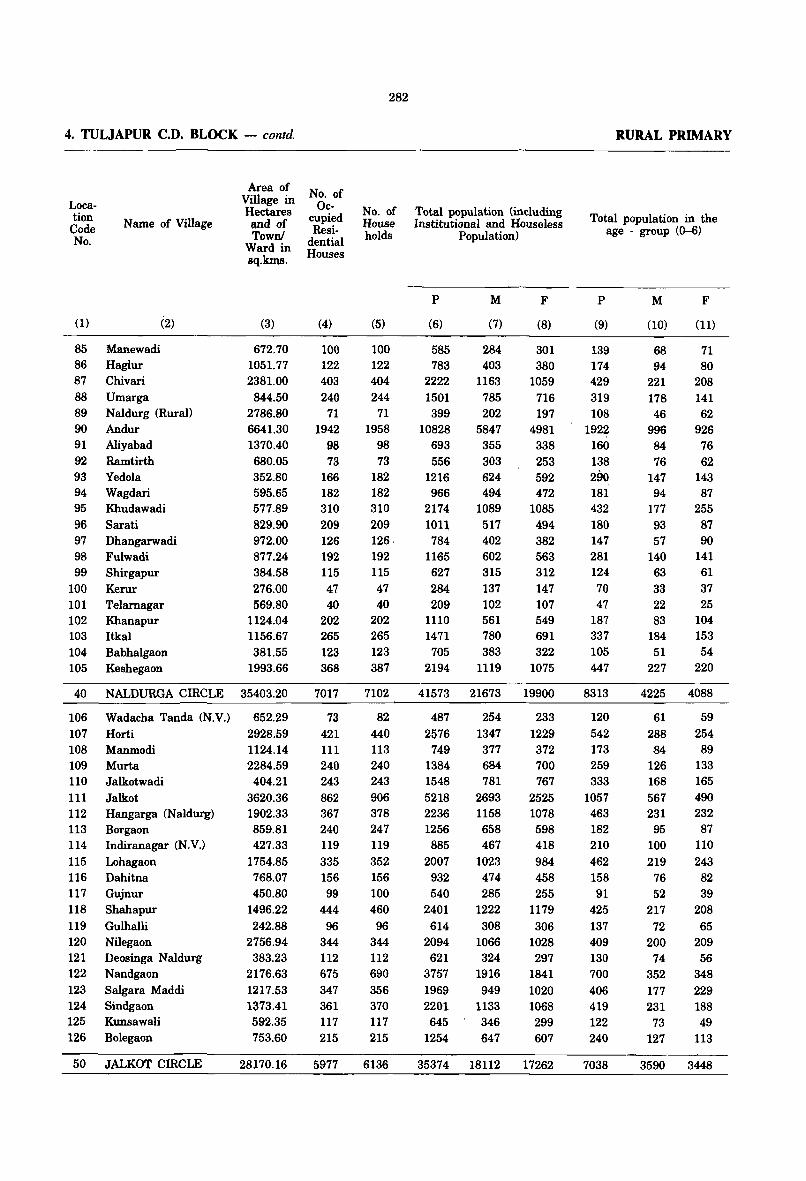
4. TULJAPUR C.D. BLOCK - contd.
Location Code No.
(1)
85 86 87 88 89 90
91 92 93 94 95 96 97 98 99
100 101 102 103 104 105
40
106 107 108 109 110 111 112 113 114 115 116 117 118 119 120 121 122 123 124 125 126
50
Name of Village
Manewadi Haglur Chivari
(2)
Umarga Naldurg (Rural) Andur Aliyabad Ramtirth Yedola Wagdari Khudawadi Sarati Dhangarwadi Fulwadi Sbirgapur Kerur Telarnagar Khanapur Itkal Babhalgaon Keshegaon
NALDURGA CIRCLE
Wadacha Tanda (N.V.) Horti Manmodi Murta Jalkotwadi Jalkot Hangarga (Naldurg) Borgaon Indiranagar (N.V.) Lohagaon Dahitna Gujnur Shahapur Gulhalli Nilegaon Deosinga N aldurg Nandgaon Salgara Maddi Sindgaon Kunsawali Bolegaon
JALKOT CIRCLE
Area of Village in Hectares and of Townl
Ward in sq.kms.
(3)
672.70 1051.77 2381.00 844.50
2786.80 6641.30 1370.40 680.05 352.80 595.65 577.89 829.90 972.00 877.24 384.58 276.00 569.80
1124.04 1156.67 381.55
1993.66
35403.20
652.29 2928.59 1124.14 2284.59 404.21
3620.36 1902.33 859.81 427.33
1754.85 768.07 450.80
1496.22 242.88
2756.94 383.23
2176.63 1217.53 1373.41 592.35 753.60
28170.16
No. of Oc
cupied Resi
dential Houses
(4)
100 122 403 240
71 1942
98 73
166 182 310 209 126 192 115 47 40
202 265 123 368
7017
73 421 111 240 243 862 367 240 119 335 156 99
444 96
344 112 675 347 361 117 215
5977
282
No. of House holds
(5)
100 122 404 244
71 1958
98 73
182 182 310 209 126, 192 115 47 40
202 265 123 387
7102
82 440 113 240 243 906 378 247 119 352 156 100 460 96
344 112 690 356 370 117 215
6136
Total population (including Institutional and Houseless
Population)
P
(6)
585 783
2222 1501 399
10828 693 556
1216 966
2174 1011 784
1165 627 284 209
1110 1471 705
2194
41573
487 2576
749 1384 1548 5218 2236 1256 885
2007 932 540
2401 614
2094 621
3757 1969 2201 645
1254
35374
M
(7)
284 403
1163 785 202
5847 355 303 624 494
1089 517 402 602 315 137 102 561 780 383
1119
21673
254 1347 377 684 781
2693 1158 658 467
1023 474 285
1222 308
1066 324
1916 949
1133 346 647
18112
F
(8)
301 380
1059 716 197
4981 338 253 592 472
1085 494 382 563 312 147 107 549 691 322
1075
19900
233 1229 372 700 767
2525 1078 598 418 984 458 255
1179 306
1028 297
1841 1020 1068 299 607
17262
RURAL PRIMARY
Total population in the age - group (0-6)
P
(9)
139 174 429 319 108
1922 160 138 290 181 432 180 147 281 124 70 47
187 337 105 447
8313
120 542 173 259 333
1057 463 182 210 462 158 91
425 137 409 130 700 406 419 122 240
7038
M
(10)
68 94
221 178 46
996 84 76
147 94
177 93 57
140 63 33 22 83
184 51
227
4225
61 288 84
126 168 567 231
95 100 219
76 52
217 72
200 74
352 177 231 73
127
3590
F
(11)
71 80
208 141 62
926 76 62
143 87
255 87 90
141 61 37 25
104 153 54
220
4088
59 254 89
133 165 490 232 87
110 243 82 39
208 65
209 56
348 229 188 49
113
3448
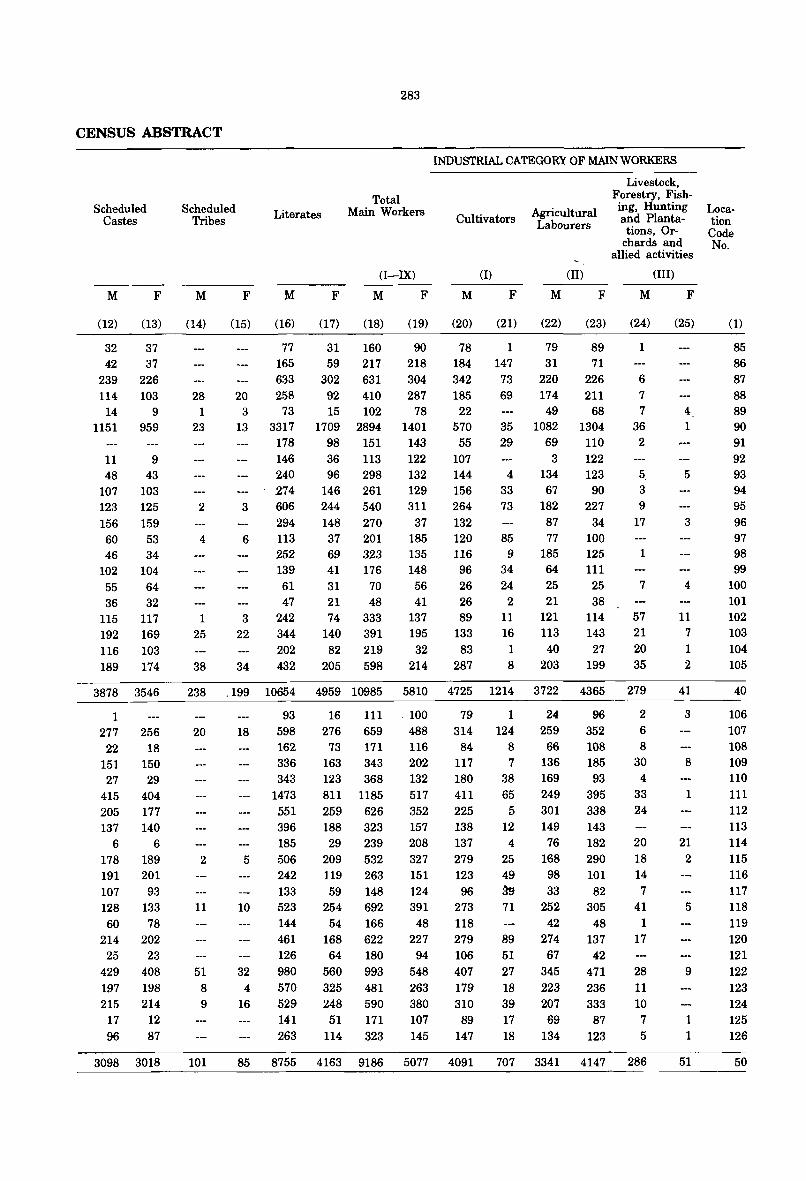
283
CENSUS ABSTRACT
Scheduled Castes
M F
(12) (13)
32 37 42 37
239 226 114 103
14 9 1151 959
11 9 48 43
107 103 123 125 156 159 60 53 46 34
102 104 55 64 36 32
115 117 192 169 116 103 189 174
3878 3546
1 277 256
22 18 151 150 27 29
415 404 205 177 137 140
6 6 178 189 191 201 107 93 128 133 60 78
214 202 25 23
429 408 197 198 215 214
17 12 96 87
3098 3018
Scheduled Tribes
M F
Literates
M F
Total Main Workers
(I-IX)
M F
INDUSTRIAL CATEGORY OF MAIN WORKERS
Cultivators
(I)
M F
Agricultural Labourers
(II)
M F
Livestock, Forestry, Fishing, Hunting and Plantations, Or
chards and allied activities
(III)
M F
(14) (15) (16) (17) (18) (19) (20) (21) (22) (23) (24) (25)
28 1
23
2
4
1 25
38
77 31 160 90 165 59 217 218 633 302 631 304
20 258 92 410 287 3 73 15 102 78
13 3317 1709 2894 1401
3
6
3 22
34
178 98 151 143 146 240 274 606 294 113 252 139 61 47
242 344 202 432
36 113 96 298
146 261 244 540 148 270
37 201 69 323 41 176 31 70 21 48 74 333
140 391 82 219
205 598
122 132 129 311
37 185 135 148
56 41
137 195
32 214
78 1 79 89 184 147 31 71 342 73 220 226 185 69 174 211
22 49 68 570 35 1082 1304
55 29 69 110 107 144 156 264 132 120 116
96 26 26 89
133 83
287
4 33 73
85 9
34 24
2 11 16
1 8
3 134 67
182 87 77
185 64
25 21
121 113
40 203
122 123
90 227
34 100 125 111 25 38
114 143
27 199
1
6 7 7
36 2
5, 3
9 17
1
7
57 21 20 35
238 ,199 10654 4959 10985 5810 4725 1214 3722 4365 279
20
2
11
51 8 9
101
93 16 111 ,100 79 18 598 276 659 488 314
162 73 171 116 84 336 163 343 202 117 343 123 368 132 180
1473 811 1185 517 411 551 259 626 352 225 396 188 323 157 138 185 29 239 208 137
5 506 209 532 327 279 242 119 263 151 123 133 59 148 124 96
10 523 254 692 391 273 144 54 166 48 118 461 168 622 227 279 126 64 180 94 106
32 980 560 993 548 407 4 570 325 481 263 179
16 529 248 590 380 310 141 51 171 107 89 263 114 323 145 147
85 8755 4163 9186 5077 4091
1 24 96 2 124 259 352 6
8 66 108 8 7 136 185 30
38 169 93 4 65 249 395 33
5 301 338 24 12 149 143 4 76 182 20
25 168 290 18 49 98 101 14 S9 33 82 7
71 252 305 41 42 48 1
89 274 137 17 51 67 42 27 345 471 28 18 223 236 11 39 207 333 10 17 69 87 7 18 134 123 5
707 3341 4147 286
4 1
5
3
4
11 7 1
2
41
3
8
1
21 2
5
9
1 1
51
Location Code No.
(1)
85 86 87 88 89 90 91 92 93 94 95 96 97 98 99
100 101 102 103 104 105
40
106 107 108 109 110 111 112 113 114 115 116 117 118 119 120 121 122 123 124 125 126
50
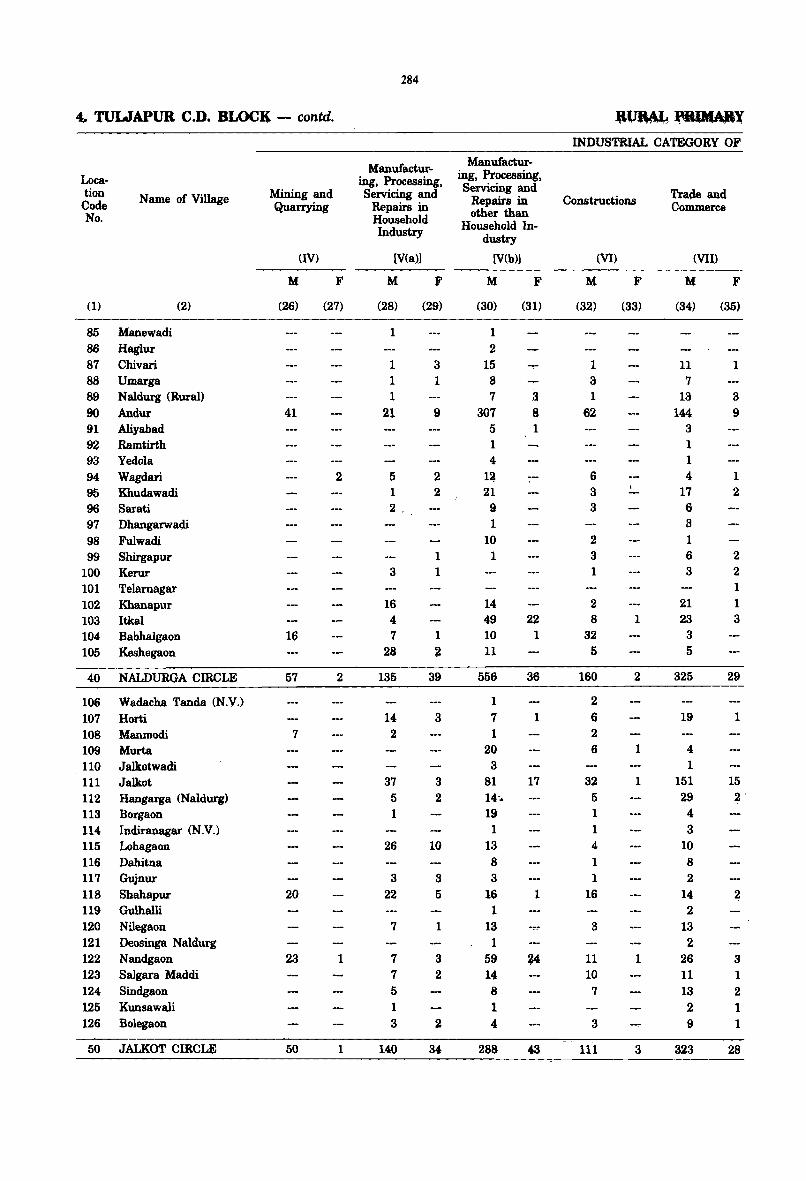
284
4.. TULJAPUR C.D. BLOC~ - contd. ~~~l
INDUSTRIAL CATEGORY OF
Manufactur- Manufactur-
Loea- ing, Processing, ing, Processing,
tion Name of Village Mining and Servicing and Servicing and Trade and
Code Quarrying Repairs in Repairs in Constructions Comnterce other than No. Household Household In-Industry dustry
(IV) [V(a)] [V(b)] (VI) (VII)
M F M F M F M F M F
(1) (2) (26) (27) (28) (29) (30) (31) (32) (33) (34) (35)
85 Manewadi 1 1 86 Haglur 2 -.,.. 87 Chivari 1 3 15 1 11 1 88 Umarga 1 1 8 3 7 89 N aldurg (Rural) 1 7 3 1 13 3 90 Andur 41 21 9 307 8 62 144 9 91 Aliyabad 5 1 3 92 Ramtirth 1 1 93 Yedola 4 1 94 Wagdari 2 5 2 1~ 6 4 1 95 Khudawadi 1 2 21 3 \ 17 2 96 Sarati 2, 9 3 6 97 Dhangarwadi 1 a 98 Fulwadi 10 2 1 99 Shirgapur 1 1 3 6 2
100 Kerur 3 1 1 3 2 101 Telarnagar 1 102 Khanapur 16 14 2 21 1 103 Itkal 4 49 22 8 1 23 3 104 Babhalgaon 16 7 1 10 1 32 3 105 Keshegaon 28 2 11 5 5
40 NALDURGA CIRCLE 57 2 135 39 556 36 160 2 325 29
106 Wadacha Tanda (N.V.) 1 2 107 Horti 14 3 7 1 6 19 1 108 Manmodi 7 2 1 2 109 Murta 20 6 1 4 110 Jalkotwadi 3 1 111 Jalkot 37 3 81 17 32 1 151 15 112 Hangarga (Naldurg) 5 2 14,. 5 29 2' 113 Borgaon 1 19 1 4 114 Indiranagar (N.V.) 1 1 3 115 Lohagaon 26 10 13 4 10 116 Dahitna 8 1 8 117 Gqjnur 3 3 3 1 2 118 Shahapur 20 22 5 16 1 16 14 2 119 Gulhalli 1 2 120 Nilegaon 7 1 13 " 3 13 121 Deosinga Naldurg 1 2 122 Nandgaon 23 1 7 3 59 34 11 1 26 3 123 Salgara Maddi 7 2 14 10 11 1 124 Sindgaon 5 8 7 13 2 125 Kunsawali 1 1 2 1 126 Bolegaon 3 2 4 3 9 1
50 JALKOT CIRCLE 50 1 140 34 288 43 111 3 323 28
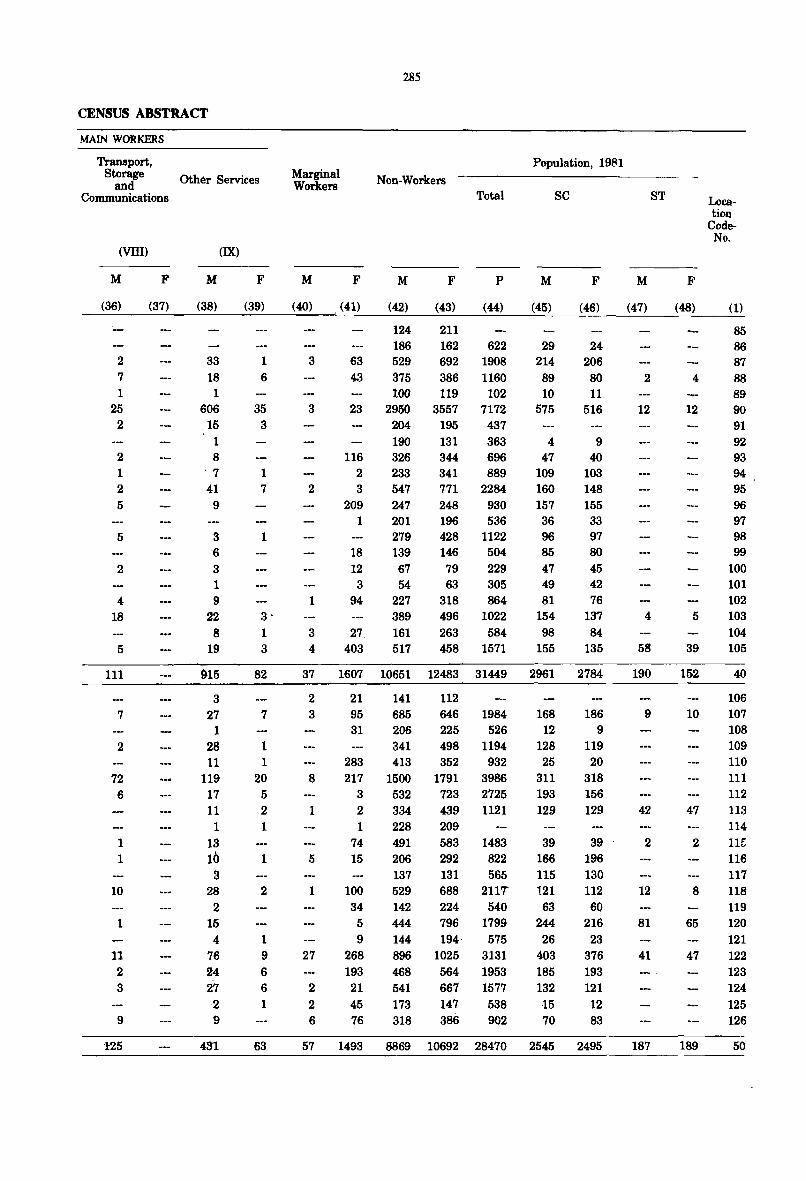
CENSUS ABSTRACT
MAIN WORKERS
Transport, Storage
and Communications
(VIII)
M
(36)
2 7 1
25 2
2 1 2 5
5
2
4 18
5
111
7
2
72 6
1 1
10
1
11 2 3
9
1:25
F
(37)
Other Services
M
(38)
33 18 1
606 .15
1 8
·7
41 9
3 6 3 1 9
(IX)
22 8
19
915
3 27
1 28 11
119 17 11 1
13 10 3
28 2
15 4
76 24 27
2 9
431
F
(39)
1 6
35 3
1 7
1
3-
1 3
82
7
1 1
20 5 2 1
1
2
1 9 6 6 1
63
Marginal Workers
M
(40)
F
(41)
285
Non-Workers
M
(42)
124
F
(43)
211
Total
P
(44)
Population, 1981
M
(45)
SC
F
(46)
186 162 622 29 24 3 63 529 692 1908 214 206
43 375 386 1160 89 80 100 119 102 10 11
3 23 2950 3557 7172 575 516 204 195 437 190 131 363 4 9
116 326 344 696 47 40 2 233 341 889 109 103
2 3 547 771 2284 160 148 209 247 248 930 157 155
1 201 196 536 36 33 279 428 1122 96 97
18 139 146 504 85 80 12 67 79 229 47 45 3 54 63 305 49 42
1 94 227 318 864 81 76 389 496 1022 154 137
3 27. 161 263 584 98 84 4 403 517 458 1571 155 135
37 1607 10651 12483 31449 2961 2784
2 21 141 112 3 95 685 646 1984 168 186
31 206 225 526 12 9 341 498 1194 128 119
283 413 352 932 25 20 8 217 1500 1791 3986 311 318
3 532 723 2725 193 156 1 2 334 439 1121 129 129
5
1
27
2 2 6
1 74 15
100 34
5 9
268 193 21 45 76
228 491 206 137
209 583 1483 292 131
822 565
529 688 2117 142 224 540 444 796 1799 144 194· 575 896 1025 3131 468
541 173 318
564 1953 667 1577 147 538 386 902
39 166 115 121
63 244
26 403
185 132 15 70
39 196 130 112 60
216 23
376 193 121 12 83
57 1493 8869 10692 28470 2545 2495
ST
M
(47)
2
12
4
58
190
9
42
2
12
81
41
187
F
(48)
4
12
5
39
152
10
47
2
8
65
47
189
Location
CodeNo.
(1)
85 86 87 88 89 90 91 92 93 94 95 96 97 98 99
100 101 102 103 104 105
40
106 107 108 109 110 111 112 113 114 11[;
116 117 118 119 120 121 122 123 124 125 126
50
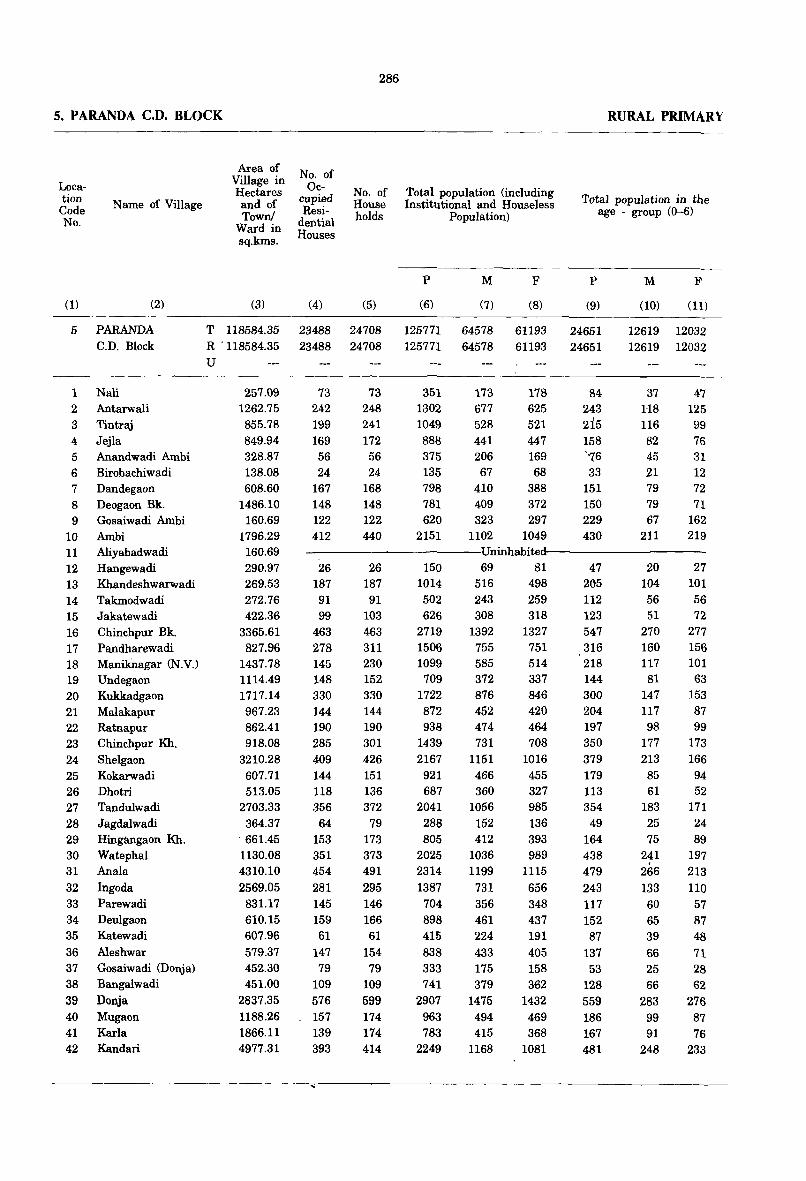
286
5. PARANDA C.D. BLOCK RURAL PRIMARY
Location Code No.
Name of Village
(1) (2)
5 PARANDA C.D. Block
1 Nali 2 Antarwali 3 Tintraj 4 Jejla 5 Anandwadi Ambi 6 Birobachiwadi 7 Dandegaon 8 Deogaon Bk. 9 Gosaiwadi Ambi
10 Ambi 11 Aliyabadwadi 12 Hangewadi 13 Khandeshwarwadi 14 Takmodwadi 15 Jakatewadi 16 Chinchpur Bk. 17 Pandharewadi 18 Manikllagar (N.V.) 19 Undegaon 20 Kukkadgaon 21 Malakapur 22 Ratnapur 23 Chinchpur Kh. 24 Shelgaon 25 Kokarwadi 26 Dhotri 27 Tandulwadi 28 Jagdalwadi 29 Hingangaon Rh. 30 Watephal 31 Anala 32 Ingoda 33 Parewadi 34 Deulgaon 35 Katewadi 36 Aleshwar 37 Gosaiwadi (Donja) 38 Bangalwadi 39 Donja 40 Mugaon 41 Karla 42 Kandari
Area of Village in Hectares and of Town!
Ward in sq.kms.
No. of Oc
cupied Resi
dential Houses
No. of House holds
Total population (including Institutional and Homeless
Population)
p M F
(3) (4) (5) (6) (7) (8)
T 118584.35 23488 24708 125771 64578 61193 R . 118584.35 23488 24708 125771 64578 61193 U
257.09 1262.75
855.78
849.94 328.87 13B.08
60B.60
1486.10 160.69
73 242 199 169 56 24
167 148 122 412
73 248 241 172 56 24
168 148 122 440
351 1302 1049 888 375 135 798 781 620
2151
173 677 528 441 206 67
410 409 323
1102
178 625 521 447 169 68
388 372 297
1049
Total population in the age - group (0-6)
P
(9)
24651 24651
84 243 215 158 '16 33
151 150 229 430
M F
(10) (11)
12619 12032 12619 12032
37 118 116 82 45 21 79 79 67
211
47 125 99 76 31 12 72 71
162 219 1796.29
160.69 290.97 269.53 272.76 422.36
-----------Uninhabited----------
3365.61 827.96
1437.78 1114.49 1717.14 967.23 862.41 918.08
3210.28 607.71 513.05
2703.33 364.37
. 661.45 1130.08 4310.10 2569.05
831.17 610.15 607.96 579.37 452.30 451.00
2837.35 1188.26 1866.11 4977.31
26 187 91 99
463 278 145 148 330 144 190 285 409 144 118 356 64
153 351 454 281 145 159 61
147 79
109 576 157 139 393
26 187 91
103 463 311 230 152 330 144 190 301 426 151 136 372
79 173 373 491 295 146 166 61
154 79
109 599 174 174 414
150 1014 502 626
2719 1506 1099 709
1722 872 938
1439 2167 921 687
2041 288 805
2025 2314 1387 704 898 415 838 333 741
2907 963 783
2249
69 81 516 498 243 259 308 318
1392 1327 755 751 585 514 372 337 876 846 452 420 474 731
1151 466 360
1056 152 412
1036 1199
731 356 461 224 433 175 379
1475 494 415
1168
464 708
1016 455 327 985 136 393 989
1115 656 348 437 191 405 158 362
1432 469 368
1081
47 205 112 123 547 316 218 144 300 204 197 350 379 179 113 354 49
164 438 479 243 117 152 87
137 53
128 559 186 167 481
20 104 56 51
270 160 117 81
147 117 98
177 213 85 61
183 25 75
241 . 266 133 60 65 39 66 25 66
283 99 91
248
27 101 56 72
277 156 101 63
153 87 99
173 166 94 52
171 24 89
197 213 110
57 87 48 71 28 62
276 87 76
233

287
CENSUS ABSTRACT
Scheduled Castes
M F
(12) (13)
8520 8175 8520 8175
26 24 90 93 79 76 27 33 15 14
42 51 60 57 4 2
164 167
INDUSTRIAL CATEGORY OF MAIN WORKERS
Scheduled Tribes
M F
Literates
M F
Total Main Workers
(I-IK)
M F
Cultivator.
M F
(14) (15) (16) (17) (18) (19) (20) (21)
648 30921 15025 35066 22241 20102 9831
Agricultural Labourers
(II)
M F
(22) (23)
9851 11839
Livestock, Forestry, Fishing, Hunting and Plantations, Or
chards and allied activities
(III)
M F
(24) (25)
596 665 665 648 30921 15025 35066 22241 20702 9831 9851 11839 596
93 93
1 5 4
16 5
5
60 311 207 179 88 31
183 195 146 584
20 107 161 339 168 2115 80 232 ~3 115 21 28 56 216 91 223 46 176
310 582
102 355 310
m 111 29
220 180 168 501
54 16 209 209 174 154 128 124 82 80 23 26
174 175 166 146 128 126 317 271
50 105 107 83 30
1 23 17 34
182
85 142 155 98 31
3 41 31 41
215
1 6
1 3 2
1
-----------------uninhabitedl----------------
4 9 5
1M 28 68 69
107 105 57
122 207 20 15
195 6 8
4 6
13 166 15 65 61
108 120 59
133 186 20 12
190 5 7
235 224 167 154 126 96 56 59 32 30
5 42
7
50
9 37
8 55
268 272 22 26 30 26
134 121
24 5 8 a 5
13
46
2 3
3
7 5
7 30 5
24 3 5 4
3 2
12 4
36 3 7 1 3
11
40
1 2
3
3
4
6 17 6
24 2 2 5
2 1
9 5
17 205 105 111 573 280 262 161 328 232 214 360 479 190 132 582 80
201 502 625 331 165 217 116 194 73
156 676 206 181 497
6 61 28 22
214 99 84 99
101 106 97
147 264
75 38
276 27 69
40 18 290 116 129 108 155 128 735 478 388 386 315 215 203 50 447 317 244 237 246 19 400 101 611 396 226 155 237 196 577 364 83 16
236 180 226 542 302 647 148 367
391 479 151
75 218 92 239 37 133 97 237 21 114 96 218
439 814 107 278 72 206
206 657
86 147 96
140 26
194 484 180 40
341
39 258
86 103 466 284 223 142 282 147 205 283 323
79 193 417 66
205
16 18 57 88
182 229
36 37 66
124 3
40
199 60
199 5
147 406 315 311 132 275 81 140 48 165 105 124 113 75
114
82 79 14 63
374 176 173 83 155 21 454 187
29 22 25
174 34 72 45
140 92 26 61
164 131 44 90 12 24 79
154 60 41 58
7 55 19 72
305 65 28
134
2 96 51 28
280 125 175
12 239 113
16 60
174 93
196 149
8 31 73
322 63 38 39 13 59 10
129 289 96 16
147
1
4 "-13 6 10 28 20
5 7 I-
I
1 7
28 1
15
39 10 9 9
15 2
13
2
1
2
Location Code No.
(1)
T 5 R U
1 2 3 4
5 6 7 8 9
10 11 12 13 14 15 16 17 18 19 20 21 22 23 24 25 26 27 28 29 30 31 32 33 34 35 36 37 38 39 40 41 42
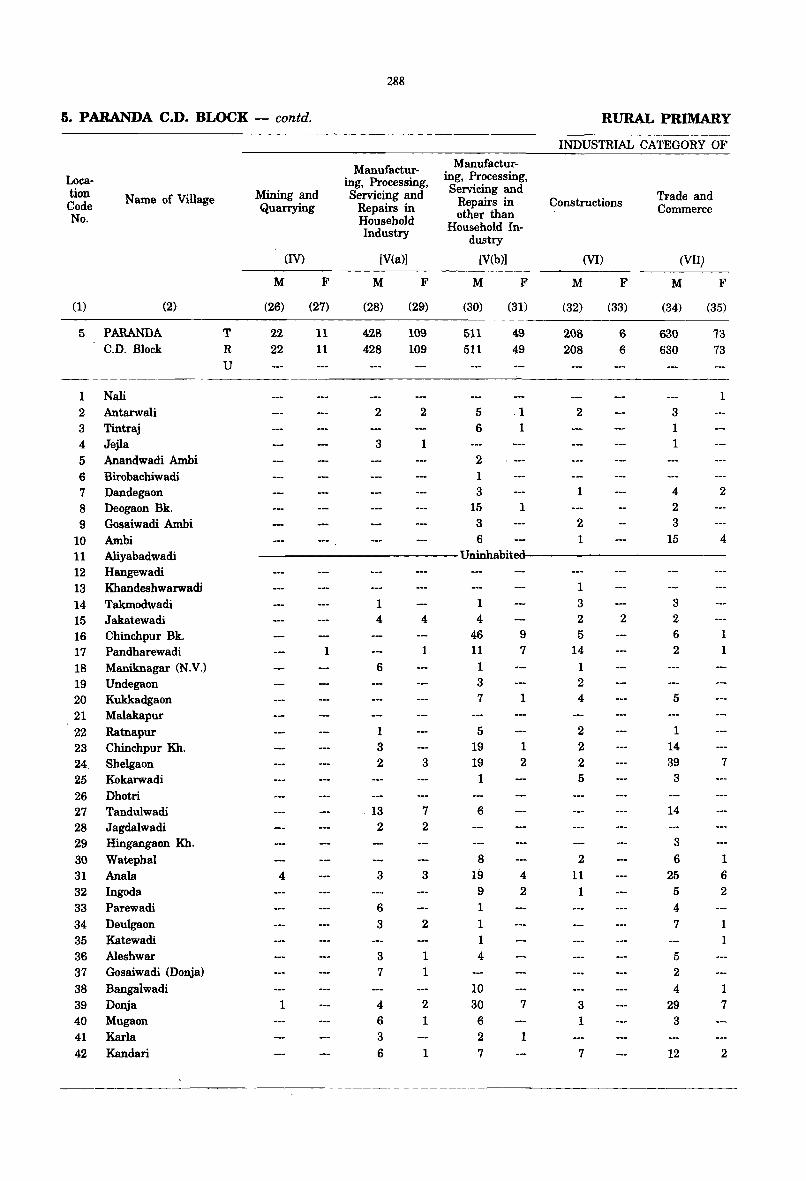
288
5. PARANDA C.D. BLOCK - contd. RURAL PRIMARY
INDUSTRIAL CATEGORY OF
Manufactur- Manufactur-
Loca- ing, Processing, ing, Processing,
tion Name of Village Mining and Servicing and Servicing and Trade and
Code Quarrying Repairs in Repairs in Constructions Commerce other than No. Household Household In-Industry dustry
(IV) [V(a») [V(b») (VI) (VII)
M F M F M F M F M F
(1) (2) (26) (27) (28) (29) (30) (31) (32) (33) (34) (35)
5 PARANDA T 22 11 428 109 511 49 208 6 630 73 C.D. Block R 22 11 428 109 511 49 208 6 630 73
U
1 Nali 1 2 Antarwali 2 2 5 1 2 3 3 Tintraj 6 1 1 4 Jejla 3 1 1 5 Anandwadi Ambi 2 6 Birobachiwadi 1 7 Dandegaon 3 1 4 2 8 Deogaon Bk. 15 1 2
9 Gosaiwadi Ambi 3 2 3
10 Ambi 6 1 15 4
11 Aliyabadwadi Uninhabited
12 Hangewadi
13 Khandeshwarwadi 1
14 Takmodwadi 1 1 3 3
15 Jakatewadi 4 4 4 2 2 2
16 Chinchpur Bk. 46 9 5 6 1
17 Pandharewadi 1 1 11 7 14 2 1
18 Maniknagar (N.V.) 6 1 1 19 Undegaon 3 2
20 Kukkadgaon 7 1 4 5
21 Malakapur
22 Ratnapur 1 5 2 1
23 Chinchpur Kh. 3 19 1 2 14
24. Shelgaon 2 3 19 2 2 39 7
25 Kokarwadi 1 5 3
26 Dhotri 27 Tandulwadi .. 13 7 6 14 28 Jagdalwadi 2 2 29 Hingangaon Kh. 3
30 Watephal 8 2 6 1 31 Anala 4 3 3 19 4 11 25 6 32 Ingoda 9 2 1 5 2 33 Parewadi 6 1 4 34 Deulgaon 3 2 1 7 1 35 Katewadi 1 1
36 Aleshwar 3 1 4 5 37 Gosaiwadi (Donja) 7 1 2
38 Bangalwadi 10 4 1 39 Donja 1 4 2 30 7 3 29 7 40 Mugaon 6 1 6 1 3 41 Karla 3 2 1 42 Kandari 6 1 7 7 12 2
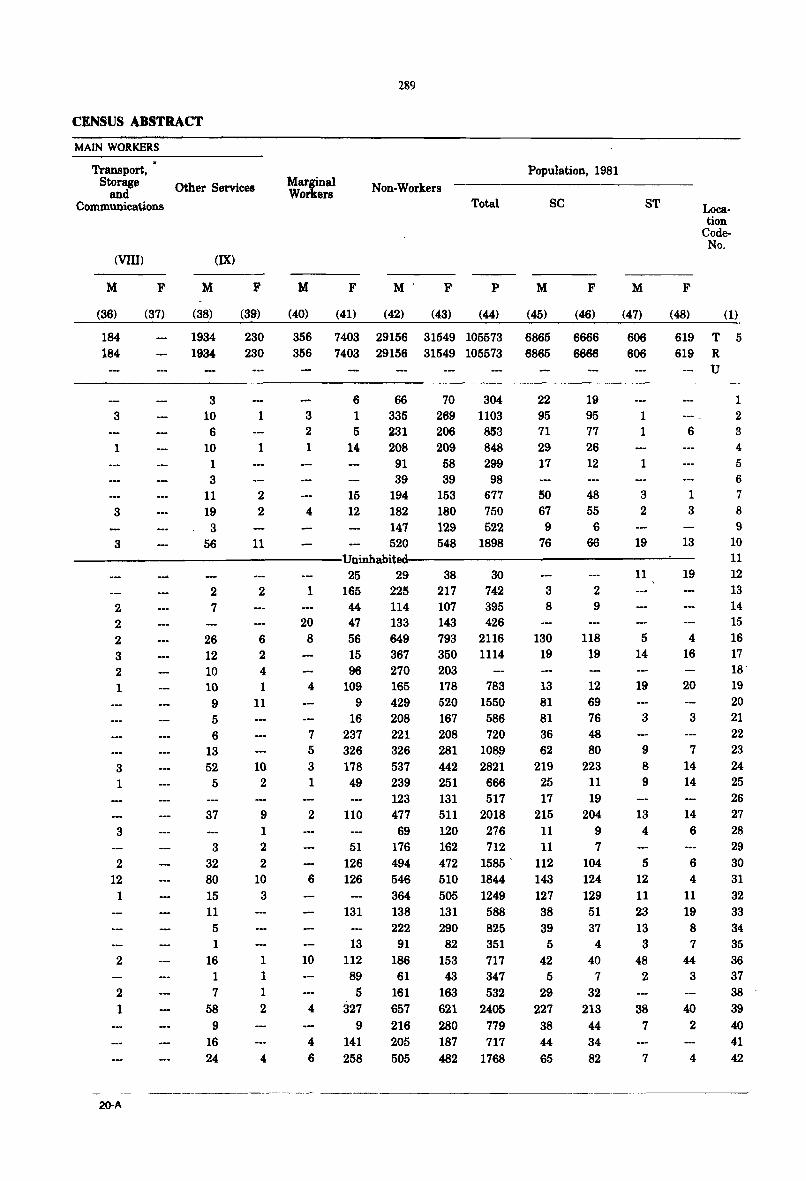
CENSUS ABSTRACT
MAIN WORKERS
Transport, Storage Other Services
and Communications
(VIll)
M
(36)
184 184
3
1
3
3
F
(37)
M
(38)
(IX)
1934 1934
3 10 6
10 1 3
11 19
3 56
F
(39)
230 230
1
1
2 2
11
Marginal Workers
M
(40)
F
(41)
289
Non-Workers
M
(42)
F
(43)
Total
P
(44)
Population, 1981
M
(45)
SC
F
(46)
356 7403 29156 31549 105573 6865 6666 356 7403 29156 31549 105573 6865 6666
3 2 1
4
6 1 5
15 12
66 335 231 208 91 39
194 182 147 520
70 304 269 1103 206 853 209 848 58 299 39
153 180 129
98 677 750 522
548 1898
22 95 71 29 17
50 67
9 76
19 95 77 26 12
48 55
6 66
M
(47)
ST
606 606
1 1
1
3
2
19
F
(48)
Location
CodeNo.
(1)
619 T 5 619 R
6
1 3
13
U
1 2 3 4 5 6 7
8 9
----------------Uninhabit.ed-------------------'-10 11 12 13 14 15 16 17 18' 19 20 21 22 23 24 25 26 27 28 29 30 31 32 33 34 35 36 37 38 39 40 41 42
2 2 2
3 2 1
3 1
3
2 12 1
2
2 1
2Q-A
2 7
26 12 10 10 9 5 6
13 52
5
37
3 32 80 15 11
5 1
16 1 7
58 9
16 24
2
6 2 4 1
11
10 2
9 1 2 2
10 3
1 1 1 2
4
1
20 8
4
7 5 3 1
2
6
10
4
4 6
25 29 165 225 44 47 56 15 96
109 9
16 237 326 178 49
110
51 126 126
131
13 112 89 5
327 9
141 258
114 133 649 367 270 165 429 208 221 326 537 239 123 477 69
176 494 546 364 138 222 91
186 61
161 657 216 205 505
38 217
30 742 3
107 395 8 143 426 793 2116 130 350 1114 19 203 178 783 13 520 1550 81 167 586 81 208 720 36 281 1089 62 442 2821 219 251 666 25 131 517 17 511 2018 215 120 276 11 162 712 11 472 1585 ' 112 510 1844 143 505 1249 127 131 588 38 290 825 39 82 351 5
153 717 42 43 347 5
163 532 29 621 2405 227 280 779 38 187 717 482 1768
44 65
2 9
118 19
12 69 76 48 80
223 11 19
204 9 7
104 124 129 51 37
4 40
7
32 213 44 34 82
11
5 14
19
3
9 8 9
13 4
5 12 11 23 13 3
48 2
38 7
7
19
4 16
20
3
7 14 14
14 6
6 4
11 19 8 7
44 3
40 2
4
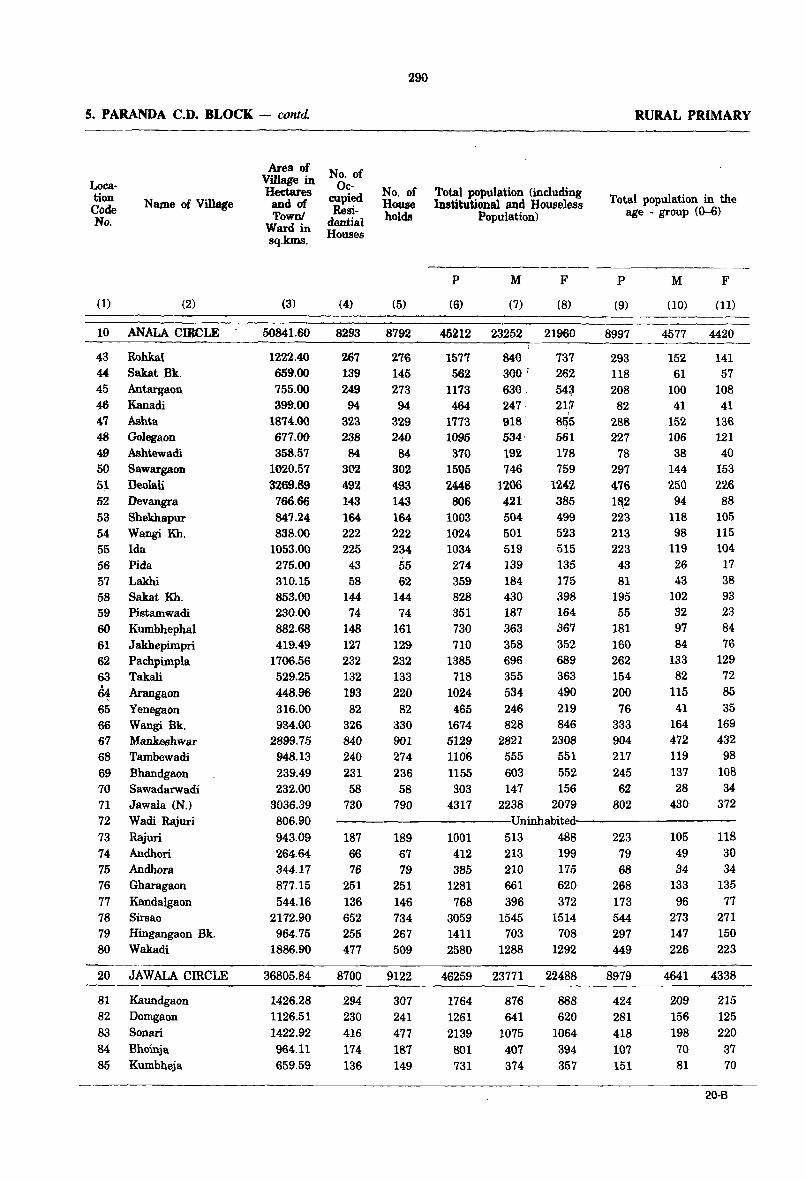
5. PARANDA C.D. BLOCK - contd.
Loca· tion Code No.
Name of Village
(1) (2)
10 ANALA CIRCLE
43 RohkaI 44 Sakat Bk. 45 Antargaon 46 Kanadi 47 Ashta 48 Golegaon 49 Ashtewadi 50 Sawargaon 51 ~olali
52 Devangra 53 Shekhapur 54 Wangi Kh. 55 Ida 56 Pida 57 Lakhi 58 Sakat Kh. 59 Pistamwadi 60 Kumbhephal 61 Jakhepimpri 62 Pachpimpla 63 Takali f4 Arangaon 65 Yenegaon 66 Wangi Bk. 67 Mankeshwar 68 Tarnbewadi 69 Bhandgaon 70 Sawadarwadi 71 Jawala (N.) 72 Wadi Rajuri 73 Rajuri 74 Andhori 75 Andhora 76 Gharagaon 77 Kandalgaon 78 Sirsao 79 Hingangaon Bk. 80 Wakadi
20 JAWALA CIRCLE
81 Kaundgaon 82 Dorngaon 83 Sonari 84 Bhoinja 85 Kurnbheja
Area of Village in Hectares and of Town!
Ward in sq.kms.
(3)
50841.60
1222.40 659.00 755.00 399.00
1874.00 677.00 358.57
1020.57 3269.89
766.66 847.24 838.00
1053.00 275.00 310.15 853.00 230.00 882.68 419.49
1706.56 529.25 448.96 316.00 934.00
2899.75 948.13 239.49 232.00
3036.39 806.90 943.09 264.64 344.17 877.15 544.16
2172.90 964.75
1886.90
36805.84
1426.28 1126.51 1422.92 964.11 659.59
No. of Oc·
cupied Resi·
dential Houses
290
No. of House holds
(4) (5)
8293 8792
267 276 139 145 249 273 94 94
323 329 238 240 84 84
302 302 492 493 143 143 164 164 222 222 225 234
43 55 58 62
144 144 74
148 127 232 132 193 82
326 840 240 231 58
730
74 161 129 232 133 220
82 330 901 274 236 58
790
Total population (including Institutional and Houseless
Population)
p M F
(6) (7) (8)
45212 23252 21960
1577 840 737 562 300 : 262
1173 630 , 54~
464 247 . 2111 , 1773 918' ~5
1095 534 561 370 192 178
1505 746 759 2448 1206 1242
806 421' 385 1003 504 499 1024 501 523 1034 519 515 274 139 135 359 184 175 828 430 398 351 730 710
1385 718
1024 465
1674 5129 1106 1155 303
4317
187 164 363 367 358 352 696 689 355 363 534 490 246 219 828 846
2821 2308 555 551 603 552 147 156
2238 2079
RURAL PRIMARY
Total population in the age • group (0-6)
P
(9)
8997
293 118 208 82
288 227
78 297 476 1&2 223 213 223 43 81
195 55
181 160 262 154 200 76
333 904 217 245 62
802
M F
(10) (11)
4577 4420
152 141 61 57
100 108 41 41
152 136 106 121 38 40
144 153 250 226 94 88
118 105 98 115
119 104 26 17 43 38
102 93 32 97 84
133 82
115 41
164 472 119 137 28
430
23 84 76
129 72 85 35
169 432 98
108 34
372 -----------Uninhabited,...----------
187 66 76
251 136 652 255 477
8700
294 230 416 174 136
189 67 79
251 146 734 267 509
9122
307 241 477 187 149
1001 412 385
513 488 213 199 210 175
1281 661 620 768 396 372
3059 1545 1514 1411 703 708 2580 1288 1292
46259 23771 22488
1764 876 888 1261 641 620 2139 1075 1064
801 407 394 731 374 357
223 79 68
268 173 544 297 449
8979
424 281 418 107 151
105 49 34
118 30 34
133 135 96 77
273 271 147 150 226 223
4641 4338
209 215 156 125 198 220 70 37 81 70
20·B
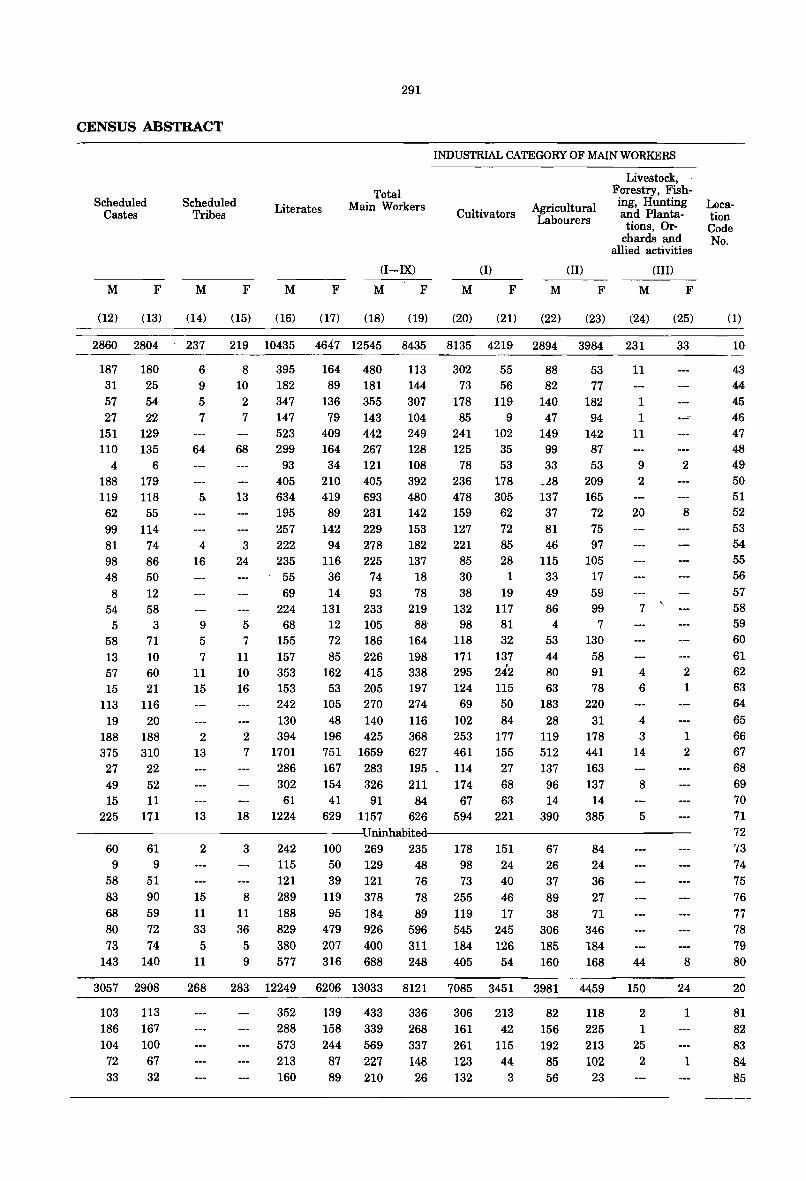
291
CENSUS ABSTRACT
Scheduled Castes
M F
(12) (13)
2860 2804
187 180 31 25 57 54 27 22
151 129 110 135
4 6 188 179 119 118 62 55 99 114 81 98 48 8
74 86 50 12
54 58 5 3
58 71 13 10 57 60 15 21
113 116 19 20
188 188 375 310 27 22 49 52 15 11
225 171
Scheduled Tribes
M F
(14) (15)
Literates
M F
(16) (17)
Total Main Workers
(I-IX)
M F
(18) (19)
INDUSTRIAL CATEGORY OF MAIN WORKERS
Cultivators
(I)
M F
(20) (21)
Agricultural Labourers
(II)
M F
(22) (23)
Livestock, Forestry, Fishing, Hunting and Plantations, Or
chards and allied activities
(III)
M F
(24) (25)
237 219 10435 4647 12545 8435 8135 - 4219 2894 3984 231 33
6 9 5 7
64
5
4 16
9 5 7
11 15
2 13
13
8 10 2 7
68
13
3 24
395 182 347 147 523 299
93 405 634 195 257 222 235 55 69
224 5 68 7 155
11 157 10 353 16 153
242 130
2 394 7 1701
286 302 61
18 1224
164 480 89 181
136 355 79 143
409 442 164 267 34 121
210 405 419 693 89 231
142 229 94 278
116 225 36 74 14 93
131 233 12 105 72 186 85 226
162 415 53 205
105 270 48 140
196 425 751 1659 167 283 154 326 41 91
629 1157
113 144 307 104 249 128 108 392 480 142 153 182 137 18 78
219 88
164 198 338 197 274 116 368 627 195 211 84
626
302 55 73 56
178 119 85 9
241 102 125 35 78 53
236 178 478 305 159 62 127 72 221
85 30 38
85 28
1 19
132 117 98 81
118 32 171 137 295 242 124 115 69 50
102 84 253 177 461 155 114 27 174 68 67 63
594 221
88 82
140 47
149 99 33
_.l8
137 37 81 46
115 33 49 86
4 53 44 80 63
183 28
119 512 137 96 14
390
53 77
182 94
142 87 53
209 165
72 75 97
105 17 59 99
7 130 58 91 78
220 31
178 441 163 137 14
385
11
1 1
11
9 2
20
7 '
2
8
4 2 6 1
4 3 1
14 2
8
5 ------------------uninhabited:----------------
60 9
58 83 68 80 73
61 9
51 90 59 72 74
143 140
3057 2908
103 113 186 167 104 100 72 67 33 32
2
15 11 33 5
11
268
3
8 11 36
5 9
242 115 121 289 188 829 380 577
100 50 39
269 235 129 48 121 76
119 378 95 184
479 926 207 400 316 688
78 89
596 311 248
178 98 73
151 24 40
255 46 119 17 545 245 184 126 405 54
67 26 37 89 38
306 185 160
84 24 36 27 71
346 184 168 44
283 12249 6206 13033 8121 7085 3451 3981 4459 150
352 288 573 213 160
139 433 158 339 244 569 87 227 89 210
336 268 337 148 26
306 213 161 42 261 115 123 44 132 3
82 156 192 85 56
118 225 213 102 23
2 1
25 2
8
24
1
1
Location Code No.
(1)
10
43 44 45 46 47 48 49 50 51 52 53 54 55 56 57 58 59 60 61 62 63 64 65 66 67 68 69 70 71 72 '/3
74 75 76 77 78 79 80
20
81 82 83 84 85
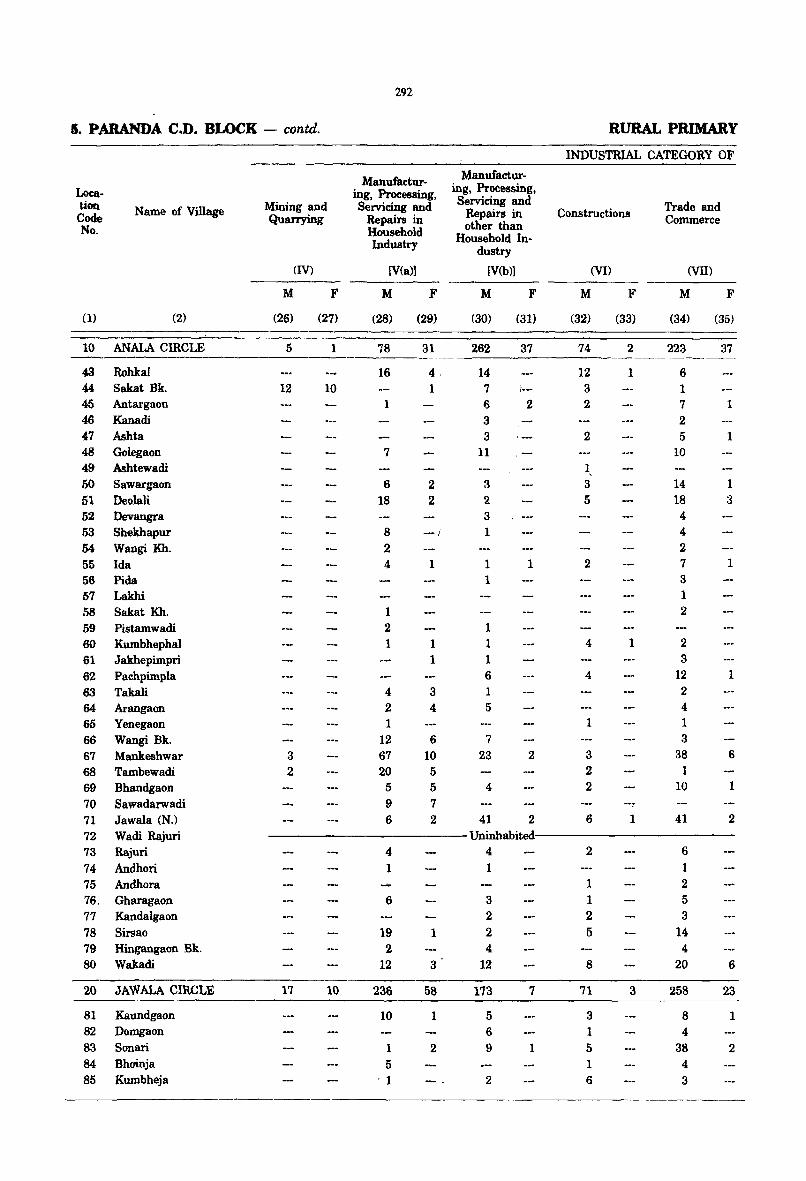
292
5. PARANDA C.D. BLOCK - contd. RURAL PRIMARY
INDUSTRIAL CATEGORY OF
Manufaetur- Manufactur-Loea- ing, Processing, mg, PToeessing, tion Name of Village Mining and Servicing and Servicing and Trade and Code Quarrying Repairs in Repairs in Constructions Commerce No. Household other than
Household In-Industry dustry
(IV) lV(a)] (V(b)] (VI) (VII)
M F M F M F M F M F
(1) (2) (26) (27) (28) (29) (30) (31) (32) (33) (34) (35)
10 ANALA CIRCLE 5 1 78 31 262 37 74 2 223 37
43 Rohkal 16 4 14 12 1 6 44 Sakat Bk. 12 10 1 7 i--- 3 1 45 Antargaon 1 6 2 2 7 1 46 Kanadi 3 2 47 Ashta 3 2 5 1 48 Golegaon 7 11 -- 10
49 Ashtewadi 1 , 50 Sawargaon 6 2 3 3 14 1 51 Deolali 18 2 2 5 18 3 52 Devangra 3 4 53 Shekhapur 8 __ OM l 1 4
54 Wangi Kh. 2 2
55 Ida 4 1 1 1 2 7 1
56 Pida 1 3
57 Lakhi 1
58 Sakat Kh. 1 2
59 Pistamwadi 2 1
60 Kumbhephal 1 1 1 4 1 2
61 Jakhepimpri 1 1 3 62 Pachpimpla 6 4 12 1
63 Takali 4 3 1 2
64 Arangaon 2 4 5 4
65 Yenegaon 1 1 1
66 Wangi Bk. 12 6 7 3
67 Mankeshwar 3 67 10 23 2 3 38 6
68 Tambewadi 2 20 5 2 1
69 Bhandgaon 5 5 4 2 10 1
70 Sawadarwadi 9 7
71 Jawala (N.) 6 2 41 2 6 1 41 2 72 Wadi Rajuri Uninhabited 73 Rajuri 4 4 2 6
74 Andhori 1 1 1 75 Andhora 1 2
76. Gharagaon 6 3 1 5
77 Kandalgaon 2 2 3
78 Sirsao 19 1 2 5 14 79 Hingangaon Bk. 2 4 4 80 Wakadi 12 3 12 8 20 6
20 JAW ALA CIRCLE 17 10 236 58 173 7 71 3 258 23
81 Kaundgaon 10 1 5 3 8 1 82 Domgaon 6 1 4 83 Sonari 1 2 9 1 5 38 2 84 Bhainja 5 1 4 85 Kumbheja . 1 2 6 3
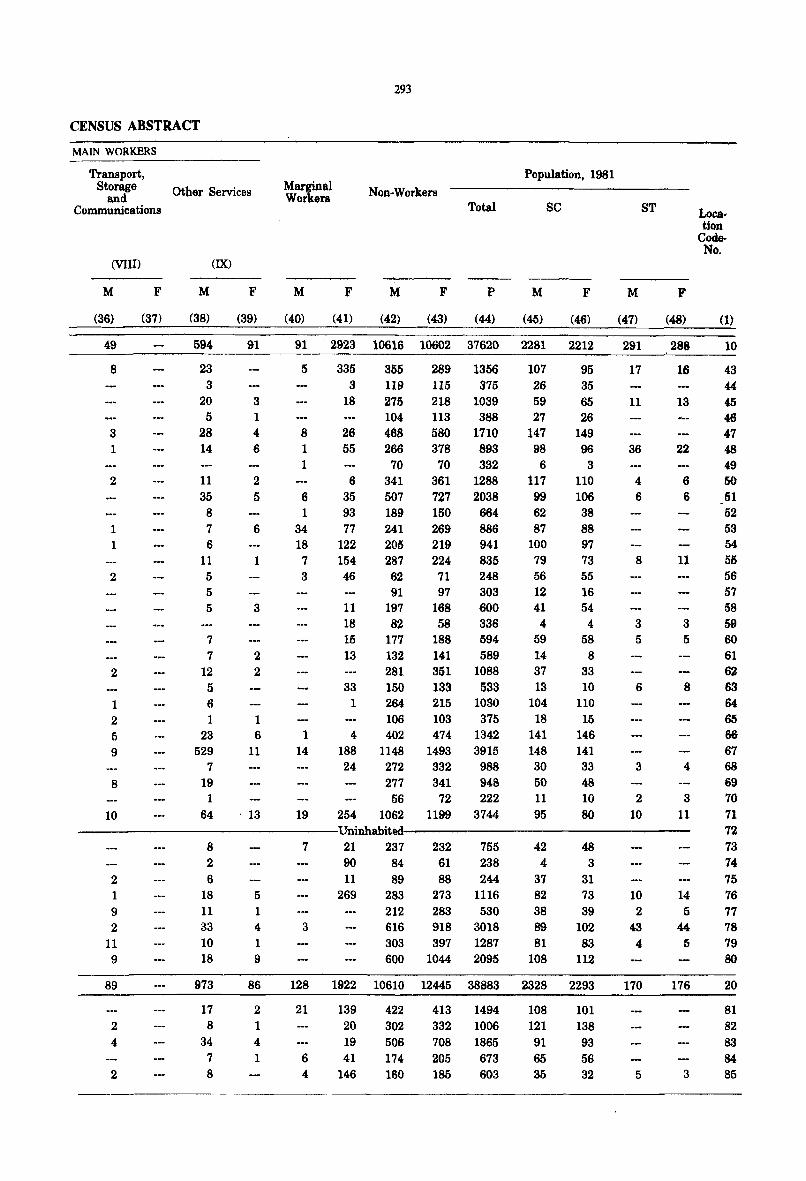
CENSUS ABSTRACT
MAIN WORKERS
Transport, Storage Other Services
and Communications
(VIII)
M
(36)
49
8
3 1
2
1 1
2
2
1 2 5 9
8
10
F
(37)
M
(38)
(IX)
594
23 3
20 5
28 14
11 35
8 7 6
11 5 5 5
7 7
12 5 6 1
23 529
7 19
64
F
(39)
91
3
1 4 6
2 5
6
1
3
2 2
1 6
11
. 13
Marginal Workers
M
(40)
F
(41)
293
Non-Workers
M
(42)
F
(43)
Total
P
(44)
Population, 1981
M
(45)
SC
F
(46)
91 '2923 10616 10602 37620 2281 2212
5
8 1 1
6 1
34 18 7 3
1 14
19
335 355 3 119
18 275 104
26 468 55 266
70 6 341
35 507 93 189 77 241
122 205 154 287 46 62
91 11 197 18 82 15 177 13 132
281 33 150
1 264 106
4 402 188 1148 24 272
277 56
254 1062
289 1356 115 375 218 1039 113 388 580 1710 378 893
70 332 361 1288 727 2038 150 664 269 886 219 941 224 835 71 248 97 303
168 600 58 336
188 594 141 589 351 1088 133 533 215 lO30 103 375 474 1342
1493 3915 332 988 341 948
72 222 1199 3744
107 26 59 27
147 98
6 117 99 62 87
100 79 56 12 41 4
59 14 37 13
104 18
141 148 30 50 11 95
95 35 65 26
149 96
3 110 106 38 88 97 73 55 16 54 4
58 8
33 10
110 15
146 141 33 48 10 80
M
(47)
291
17
11
36
ST
4 6
8
3 5
6
3
2 10
F
(48)
288
16
13
22
6 6
11
3 5
8
4
3 11
---------------Uninhabited-----------------
2 1 9 2
11 9
89
2 4
2
8 2 6
18 11 33
10 18
973
17 8
34 7 8
5 1 4
1 9
86
2 1 4 1
7
3
21 237 232 61 88
755 238 244
90 84 11 89
269 283 273 1116 212 283 530 616 918 3018 303 397 1287 600 1044 2095
42 4
37 82 38 89 81
108
48 3
31 73 39
102 83
112
128 1922 10610 12445 38883 2328 2293
21
6 4
139 20 19 41
146
422 302 506 174 160
413 1494 332 1006 708 1865 205 673 185 603
108 121 91 65 35
101 138 93 56 32
10 2
43 4
170
5
14 5
44 5
176
3
Location
CodeNo.
(1)
10
43 44 45 46 47 48 49 50 51 52 53 54 56 56 57 58 59 60 61 62 63 64 65 66 67 68 69 70 71 72 73 74 75 76 77 78 79 80
20
81 82 83
84 85
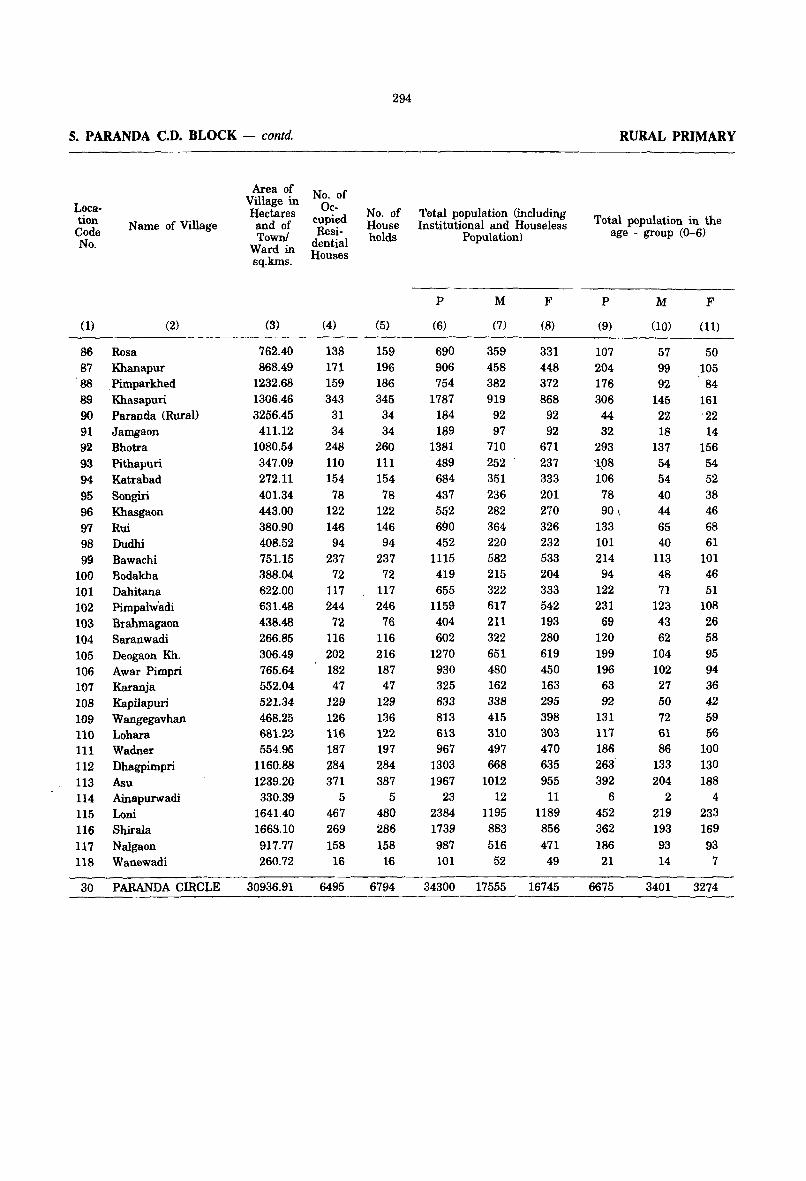
5. PARANDA C.D. BLOCK - contd.
Location Code No.
Name of Village
(1) (2)
86 Rosa 87 Khanapur 88 Pimparkhed 89 Khasapuri 90 Paranda (Rural) 91 Jamgaon 92 Bhotra 93 Pithapuri 94 Katrabad 95 Songiri 96 Khasgaon 97 Rui 98 Dudhi 99 Bawachi
100 Bodakha 101 Dahitana 102 Pimpalwildi 103 Brahmagaon 104 Saranwadi 105 Deogaon Kh. 106 Awar Pimpri 107 Karanja 108 Kapilapuri 109 Wangegavhan 110 Lahara 111 Wadner 112 Dhagpimpri 113 Asu 114 Ainapurwadi 115 Loni 116 Shirala 117 Nalgaon 118 Wanewadi
30 PARANDA CIRCLE
Area of Village in Hectares and of Town!
Ward in sq.kms.
(3)
762.40 868.49
1232.68 1306.46 3256.45 411.12
1080.54 347.09 272.11 401.34 443.00 380.90 408.52 751.15 388.04 622.00 631.48 438.48 266.85 306.49 765.64 552.04 521.34 468.25 681.23 554.95
1160.88 1239.20 330.39
1641.40 1668.10 917.77 260.72
30936.91
No. of Oc
cupied Resi
dential Houses
(4)
138 171 159 343
31 34
248 110 154 78
122 146 94
237 72
117 244
72 116 202 182 47
129 126 116 187 284 371
5 467 269 158
16
6495
294
No. of House holds
(5)
159 196 186 345
34 34
260 111 154 78
122 146 94
237 72
117 246
76 116 216 187 47
129 136 122 197 284 387
5 480 286 158 16
6794
Total population (including Institutional and Houseless
Population)
p M F
(6) (7) (8)
690 359 331 906 458 448 754 382 372
1787 919 868 184 92 92 189 97 92
1381 710 671 , 489 252' 237 684 351 333 437 236 201 552 282 270 6~0 364 326 452 220 232
1115 582 533 419 215 204 655 322 333
1159 617 542 404 211 193 602 322 280
1270 651 619 930 480 450 325 162 163 633 338 295 813 415 398 613 310 303 967 497 470
1303 668 635 1967 1012 955
23 12 11 2384 1195 1189 1739 883 856 987 516 471 101 52 49
34300 17555 16745
RURAL PRIMARY
Total population in the age - group (0-6)
P
(9)
107 204 176 306
44 32
293 '1,08 106 78 90 \
133 101 214 94
122 231
69 120 199 196 63 92
131 117 186 263 392
6
452 362 186 21
6675
M F
(10) (11)
57 50 99 105 92 84
145 161 22 '22 18 14
137 156 54 54 54 52 40 38 44 46 65 68 40 61
113 101 48 46 71 51
123 108 43 26 62 58
104 95 102 94 27 36 50 42 72 59 61 56 86 100
133 130 204 188
2 4 219 233 193 169 93 93 14 7
3401 3274
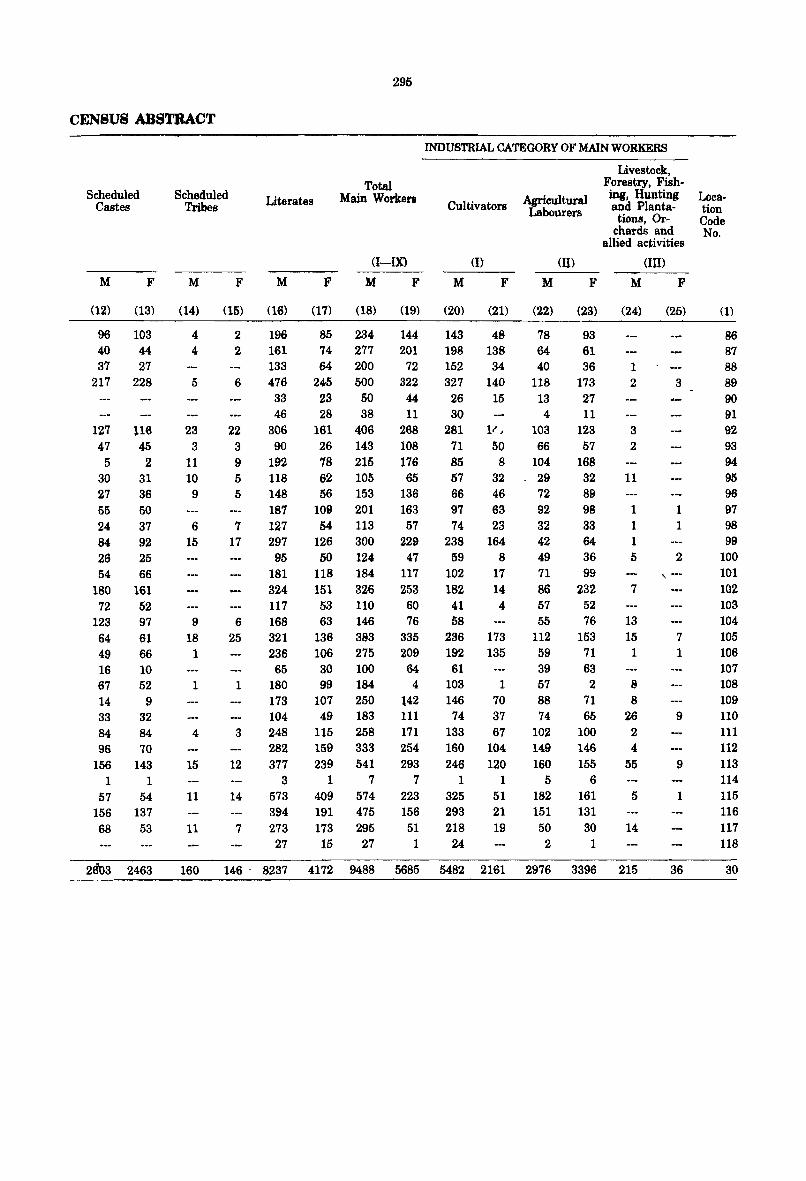
CENSUS ABSTRACT
Scheduled Castes
M F
(12) (13)
96 103 40 44 37 27
217 228
127 116 47 45 5 2
30 31 27 36 55 50 24 37 84 92 26 25 54 66
180 161 72 52
123 97 64 61 49 66 16 10 67 52 14 9 33 32 84 84 96 70
156 143 1 1
57 54 156 137 68 53
Scheduled Tribes
M F
(14) (15)
4 4
5
23 3
11 10 9
6 15
9 18 1
1
4
15
11
11
2 2
6
22 3 9 5 5
7 17
6
25
1
3
12
14
7
Literates
M F
295
Total Main Worken
(I-OO
M F
(16) (17) (18) (19)
196 161 133 476 33 46
306 90
192 118 148 187 127 297 95
181 324 117 168 321 236 65
180 173 104 248 282 377
3 573 394 273 27
85 234 144 74 277 201 64 200 72
245 500 322 23 50 44 28 38 11
161 406 268 26 143 108 78 215 176 62 105 65 56 153 136
109 201 163 54 113 57
126 300 229 50 124 47
118 184 117 151 326 253 53 110 60 63 146 76
138 383 335 106 275 209 30 100 64 99 184 4
107 250 H2 49 183 111
115 258 171 159 333 254 239 541 293
1 7 7 409 574 223 191 475 156 173 295 51 15 27 1
INDUSTRIAL CATEGORY OF MAIN WORKERS
Cultivators
M F
Agricultural Labourers
(ll)
M
(20) (21) (22) (23)
143 48 78 93 198 138 64 61 152 34 40 36 327 140 118 173
26 15 13 27 30 4 11
281 11 , 103 123 71 50 00 M 85 8 104 168 M ~ 29 ~
66 46 72 89 97 63 92 98 74 23 32 33
238 164 42 64 59 8 49 36
102 17 71 99 182 14 86 232
41 4 57 52 58 55 76
236 173 112 153 192 135 59 71 61 39 63
103 1 57 2 146 70 88 71
74 37 74 65 133 67 102 100 160 104 149 146 246 120 160 155
1 1 5 6 325 51 182 161 293 21 151 131 218 19 50 30 24 2 1
Livestock, Forestry, Fishing, Hunting and Planta
tions, Orchards and
allied activities
(Ill)
M F
(24) (25)
1 2 3
3 2
11
1 1 1 1 1 5 2
, ---7
13 15 7 1 1
8 8
26 9 2 4
55 9
5 1
14
2603 2463 160 146' 8237 4172 9488 5685 5482 2161 2976 3396 215 36
Location Code No.
(1)
86 87 88 89 90 91 92 93 94 95 96 97 98 99
100 101 102 103 104 105 106 107 108 109 110 111 112 113 114 115 116 117 118
30
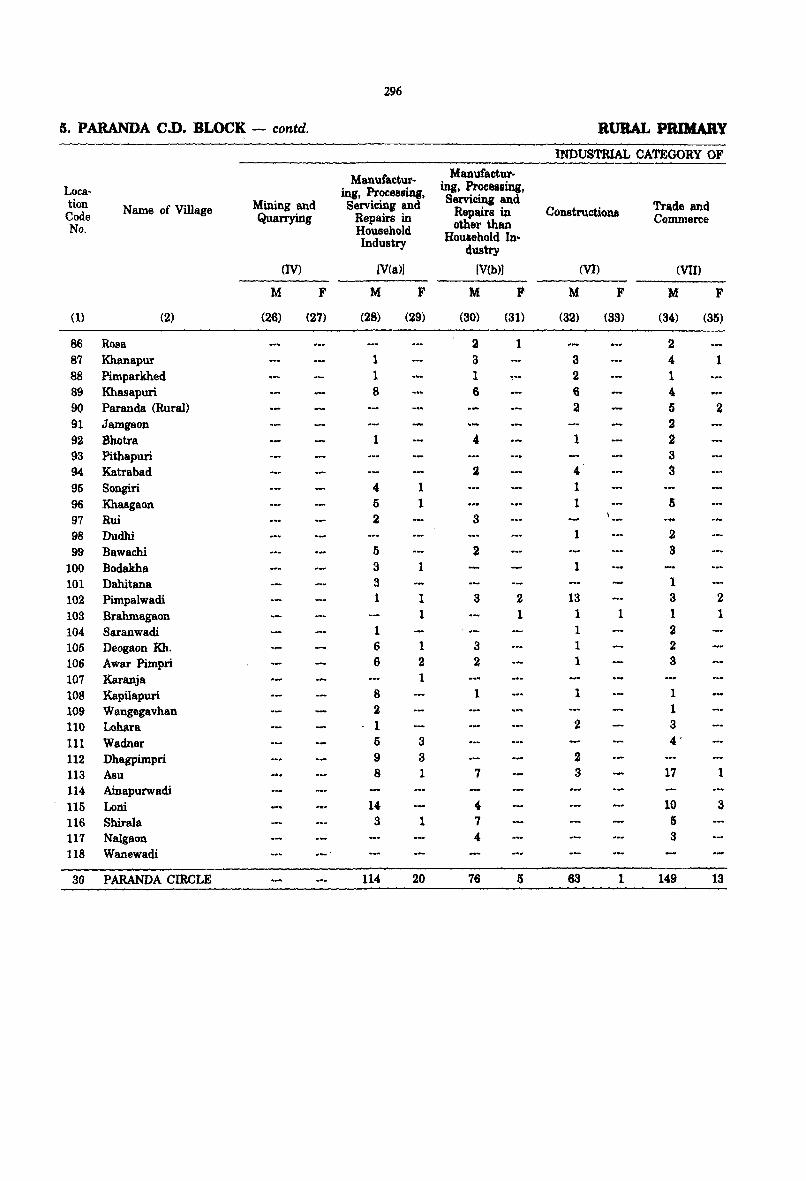
296
5. PARANDA C.D. BLOCK - contd. RURAL PRIMARY
INDUSTRIAL CATEGORY OF
Manufactur- ManufactUl'-Loea- ing, Processing, ing, Processing, tion Name of Village Mining and Sel'\ficing and Servicing and
Trade and Code Quarrying Repairs in Repairs in Constructions Commerce No. other than Household Houaehold In-Industry dustry
(IV) [V(a)] [V(b») (VI) (VII)
M F M F M F M F M F
(1) (2) (26) (27) (28) (29) (30) (31) (32) (33) (34) (35)
86 Rosa 2 1 2 87 Khanapur 1 3 3 4 1 88 Pimparkhed 1 1 .- 2 1 89 Khasapuri 8 6 6 4
90 Paranda (Rural) 2 5 2 91 Jamgaon 2 92 Bhotra 1 .. 1 2 93 Pithapuri 3 94 Katrabad 2 .. 3 95 Songiri 4 1 1 96 Khasgaon 5 1 ... 1 Ii 97 Rui 2 3 \ -.' 98 Dudhi 1 2 99 Bawachi 5 2 3
100 Bodakha 3 1 1 101 Dahitana 3 1 102 Pimpalwadi 1 1 3 2 13 3 2
103 Brahmagaon 1 1 1 1 1 1 104 Saranwadi 1 1 2 105 Deogaon Kb. 6 1 3 1 2 106 Awar Pimpri 6 2 2 1 3
107 Karanja 1 108 Kapilapuri 8 1 1 1
109 Wangegavhan 2 1 110 Lohara 1 2 3
111 Wadner 5 3 4'
112 Dhagpimpri 9 3 2 113 ABu 8 1 7 3 17 1 114 Ainapurwadi 115 Loni 14 4 10 :3 116 Shirala 3 1 7 5 117 Nalgaon 4 3 118 Wanewadi
30 PARANDA CIRCLE 114 20 76 5 63 1 149 13
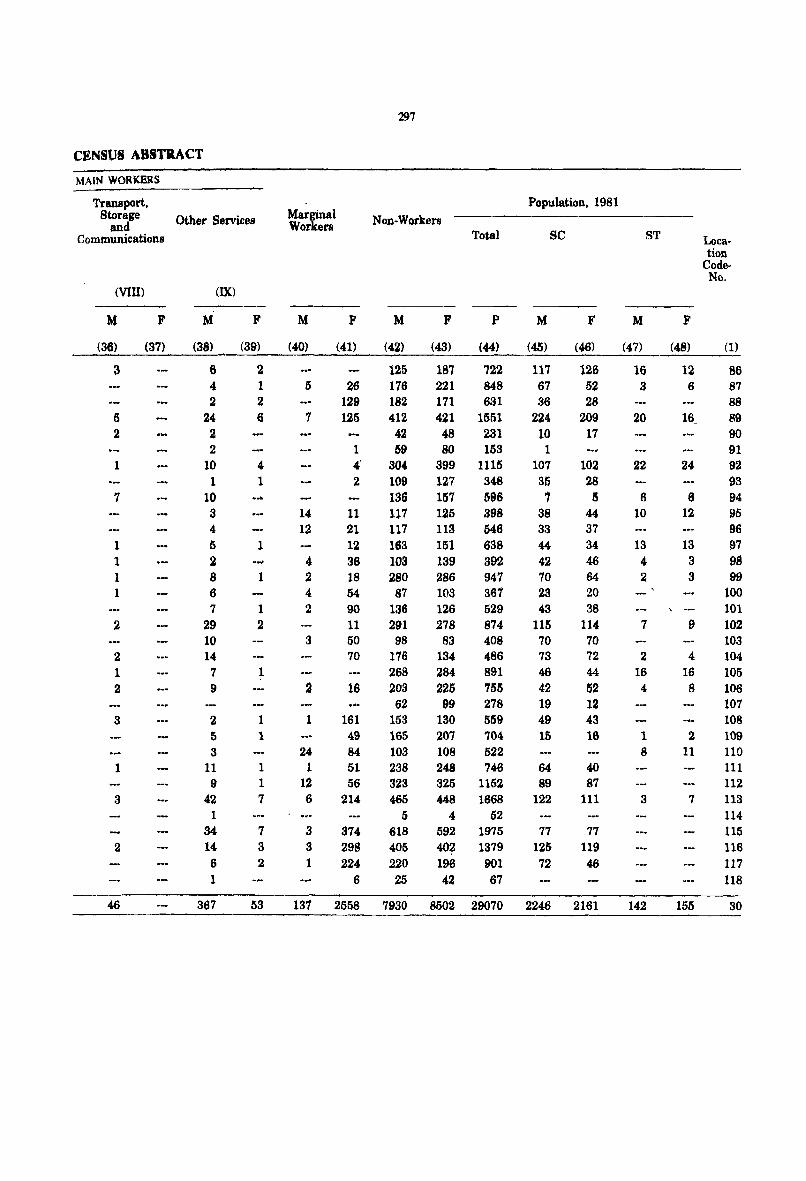
297
CENSUS ABSTRACT
MAIN WORKERS
Transport, Population, 1981 Storage Other Services Marginal Non-Workers and Workers
Communications Total BC ST Loca-tion
Code-No.
(VIII) (IX)
M F M F M F M F P M F M F
(36) (37) (38) (39) (40) (41) (42) (43) (44) (45) (MJ) (47) (48) (1)
3 6 2 125 187 722 117 126 16 12 86 4 1 5 26 176 221 848 67 52 a 6 87 2 2 129 182 171 631 36 28 88
5 24 6 7 125 412 421 1551 224 209 20 16_ 89 2 2 42 48 231 10 17 90
2 1 59 80 153 1 91 1 10 " 4' 304 399 1115 107 102 22 24 92
1 1 2 109 127 348 35 28 93 7 10 136 157 596 7 IS 8 6 94
3 14 11 117 125 398 38 44 10 12 95 4 12 21 117 113 546 33 37 96
1 5 1 12 163 151 638 44 34 13 13 97 1 2 4 36 103 139 392 42 46 4 3 98 1 8 1 2 18 280 286 947 70 64 2 3 99 1 6 4 54 87 103 381 23 20 100
7 1 2 90 136 126 529 43 38 '\ ...... - 101 2 29 2 11 291 278 874 115 114 7 9 102
10 3 50 98 83 408 70 70 103 2 14 70 176 134 486 73 72 2 4 104 1 7 1 268 284 891 46 44 16 16 105 2 9 2 16 203 225 755 42 52 4 8 106
62 99 278 19 12 107 3 2 1 1 161 153 130 559 49 43 108
5 1 49 165 207 704 15 18 1 2 109 3 24 84 103 108 522 8 11 110
1 11 1 1 51 238 248 746 64 40 111 9 1 12 56 323 325 1152 89 87 112
3 42 7 6 214 465 448 1868 122 111 3 7 113 1 5 4 52 114
34 7 3 374 618 592 1975 77 77 115 2 14 3 3 298 405 402 1379 125 119 116
6 2 1 224 220 196 901 72 46 117 1 6 25 42 67 118
46 367 53 137 2558 7930 8502 29070 2246 2161 142 155 30
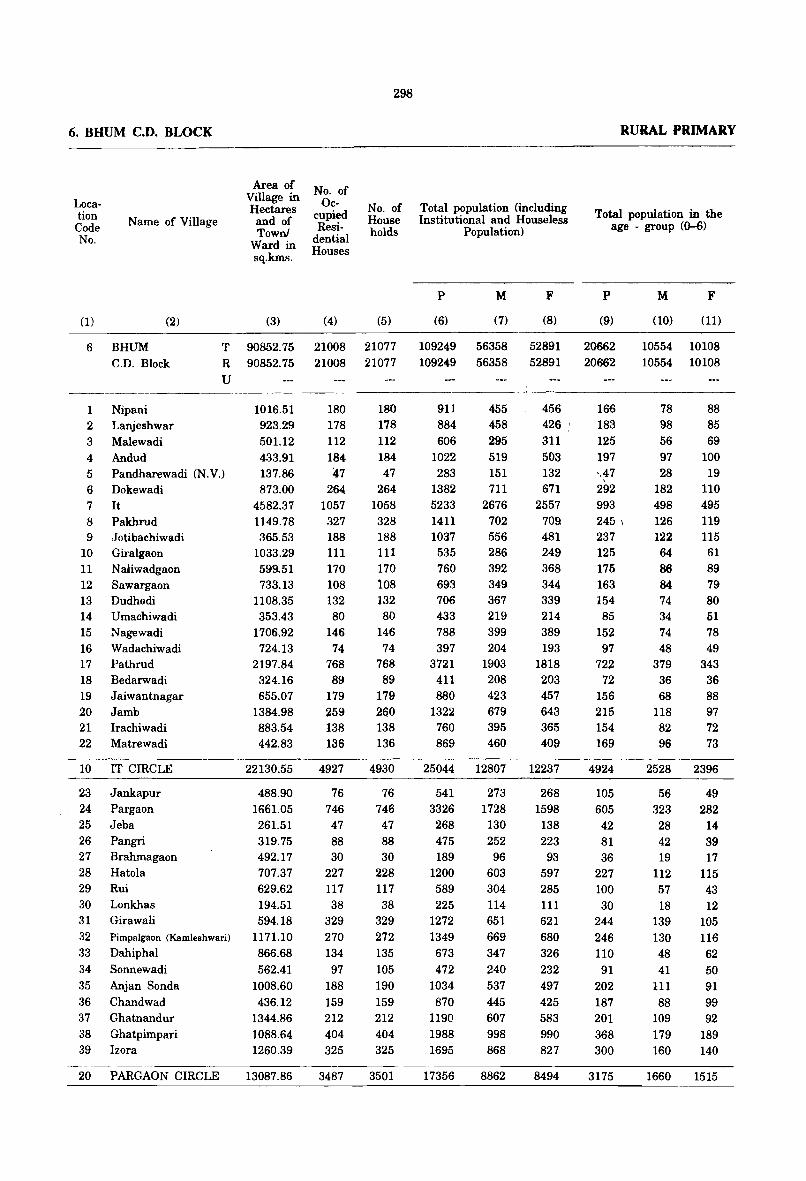
298
6. BHUM C.D. BLOCK
Location Code No.
(1)
Name of Village
(2)
Area of Village in Hectares and of Town!
Ward in sq.kms.
(3)
No. of Oc
cupied Resi
dential Houses
(4)
No. of House holds
(5)
Total population (including Institutional and Houseless
Population)
P
(6)
M
(7)
F
(8)
6 BHUM T 90852.75 R 90852.75
U
21008 21077 109249 109249
56358 56358
52891 52891
1 2 3
4 5 6 7 8 9
10 11 12 13 14 15 16 17 18 19 20 21 22
C.D. Block
Nipani Lanjeshwar Malewadi Andud Pandharewadi (N.V.) Dokewadi It Pakhrud J otibachiwadi Giralgaon N aliwadgaon Sawargaon Dudhodi Umachiwadi Nagewadi Wadachiwadi Pathrud Bedarwadi Jaiwantnagar Jamb Irachiwadi Matrewadi
21008 21077
1016.51 180 180 911 455 456 923.29 178 178 884 458 426 501.12 112 112 606 295 311 433.91 184 184 1022 519 503 137.86 47 47 283 151 132 873.00 264 264 1382 711 671
4582.37 1057 1058 5233 2676 2557 1149.78 327 328 1411 702 709 365.53 188 188 1037 556 481
1033.29 111 11 I 535 286 249 599.51 170 170 760 392 368 733.13 108 108 693 349 344
1108.35 132 132 706 367 339 353.43 80 80 433 219 214
1706.92 146 146 788 399 389 724.13 74 74 397 204 193
2197.84 768 768 3721 1903 1818 324.16 89 89 411 208 203 655.07 179 179 880 423 457
1384.98 259 260 1322 679 643 883.54 138 138 760 395 365 442.83 136 136 869 460 409
RURAL PRIMARY
Total population in the age - group «()....{)
P
(9)
20662 20662
166 183 125 197 '.47 , 292 993 245 \ 237 125 175 163 154 85
152 97
722 72
156 215 154 ]69
M
(10)
F
(11)
10554 10108 10554 10108
78 98 56 97 28
182 498 126 122 64 86 84
74 34 74 48
379 36 68
118 82 96
88 85 69
100 19
110 495 119 115 61 89 79 80 51 78 49
343 36 88 97 72 73
10 22130.55 4927 4930 25044 12807 12237 4924 2528 2396 IT CIRCLE --------------------------------------------------------------------------------23 Jankapur 488.90 76 76 541 273 268 105 56 49 24 Pargaon 1661.05 746 746 3326 1728 1598 605 323 282 25 Jeba 261.51 47 47 268 130 138 42 28 14 26 Pangri 319.75 88 88 475 252 223 81 42 39 27 Brahmagaon 492.17 30 30 189 96 93 36 19 17 28 Hatola 707.37 227 228 1200 603 597 227 112 115 29 Rui 629.62 117 117 589 304 285 100 57 43 30 Lonkhas 194.51 38 38 225 114 111 30 18 12 31 Girawali 594.18 329 329 1272 651 621 244 139 105 32 Pimpalgaon (Kamleshwaril 1171.10 270 272 1349 669 680 246 130 116 33 Dahiphal 866.68 134 135 673 347 326 110 48 62 34 Sonnewadi 562.41 97 105 472 240 232 91 41 50 35 Anjan Sonda 1008.60 188 190 1034 537 497 202 111 91 36 Chandwad 436.12 159 159 870 445 425 187 88 99 37 Ghatnandur 1344.86 212 212 1190 607 583 201 109 92 38 Ghatpimpari 1088.64 404 404 1988 998 990 368 179 189 39 Izora 1260.39 325 325 1695 868 827 300 160 140
20 PARGAON CIRCLE 13087.86 3487 3501 17356 8862 8494 3175 1660 1515
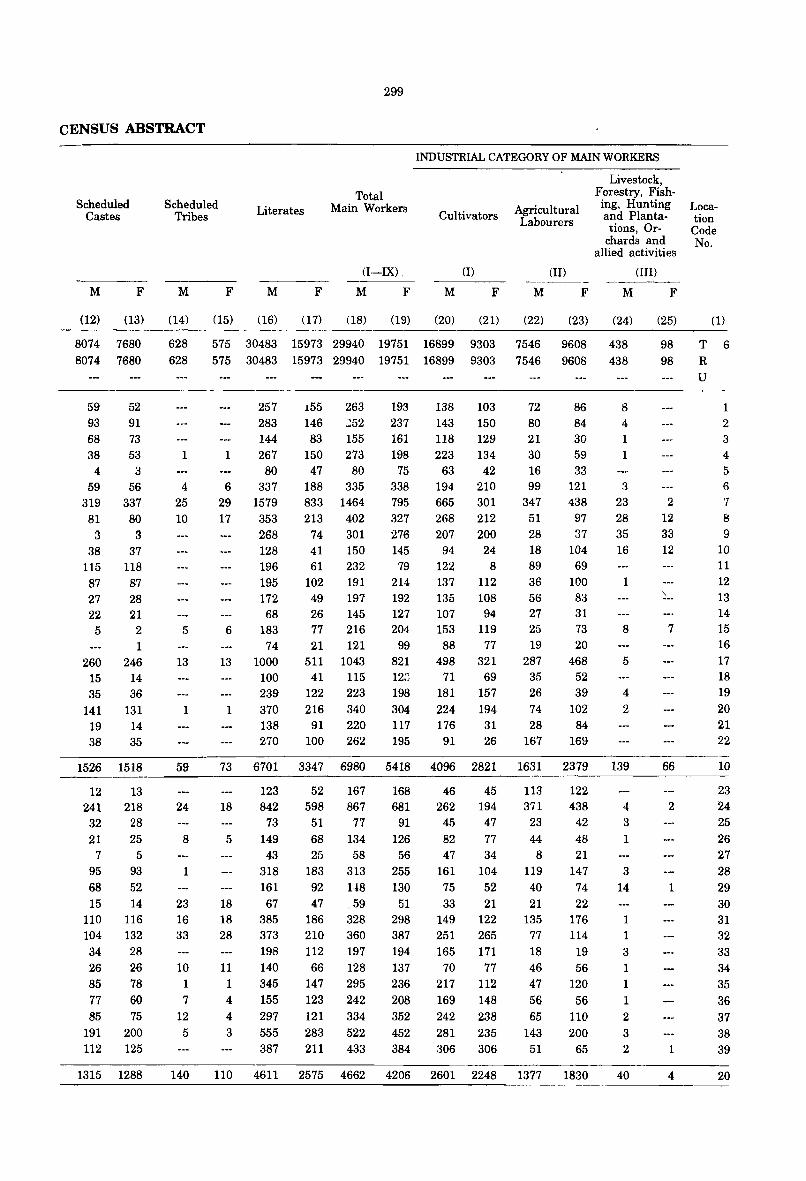
299
CENSUS ABSTRACT
Scheduled Castes
M F
(12) (13)
8074 7680
8074 7680
59 93 68 38
4
52 91 73 53
3 59 56
319 337 81 80
3 3 38 37
115 118 87 87 27 22 5
28 21 2 1
260 246 15 14 35 36
141 131 19 38
14 35
1526 1518
12 13 241 218
32 28 21 25
7 5 95 93 68 52 15 14
110 116 104 132 34 28 26 26 85 78
77 60 85 75
191 200 112 125
1315 1288
INDUSTRIAL CATEGORY OF MAIN WORKERS
Scheduled Tribes Literates
Total Main Workers
Cultivators Agricultural Labourers
Livestock, Forestry, Fishing, Hunting and Plantations, Or
chards and allied activities
Location Code No.
M
(14)
628
628
1
4 25 10
5
13
1
59
24
8
1
23 16 33
10
1 7
12
5
140
(I-IX) . (I) (II) (JII)
F M F M F M F M F M F
(15) (16) (17) (18) (19) (20) (21) (22) (23) (24) (25) (1)
575 30483 15973 29940 19751 16899 9303 7546 9608 438 98
98
T 6 R 575 30483 15973 29940 19751 16899 9303 7546 9608 438
257 283 144
155 263 146 252
83 155 1 267
80 6 337
150 273 47 80
188 335 29 1579 833 1464
17 353 213 402
6
268 128 196 195 172 68
183 74
74 301 41 150 61 232
102 191 49 197 26 145 77 216 21 121
13 1000 511 1043 100 239
41 115 122 223
1 370 216 340
73
18
5
18 18 28
11 1 4 4 3
138 270
91 220 100 262
6701 3347 6980
123 52 167 842 598 867
73 51 77 149 68 134 43 25 58
318 183 313 161 92 148 67
385 373 198 140 345
155 297 555 387
47 .59 186 328 210 360 112 197 66 128
147 295
123 242 121 334 283 522 211 433
193 237 161 198
75 338 795 327 276 145
79 214 192 127 204
99 821 128 198
304 117 195
138 103 143 150 118 129 223 134
63 42 194 210 665 301 268 212 207 200
94 24 122 8 137 112 135 108 107 94 153 119
88 77 498 321
71 69 181 157
224 194 176 91
31 26
5418 4096 2821
168 46 45 681 262 194
91 45 47 126 82 77
56 47 34 255 161 104 130 75 52
51 298 387 194 137 236 208 352 452 384
33 21 149 122 251 265 165 171
70 77 217 112
169 148 242 238 281 235 306 306
72 80 21 30 16 99
347 51 28 18 89 36 56 27 25 19
287 35 26 74 28
167
1631
113 371
23 44 8
119 40 21
135 77 18 46 47
56 65
143 51
86 84 30 59 33
121 438
97 37
104 69
100 83 31 73 20
468 52 39
102 84
169
8 4 1
1
3 23 28
35 16
1
8
5
4
2
2 12 33 12
7
U
1
2 3
4 5
6 '1 8 9
10
11 12 13 14 15 16 17 18 19
20 21 22
2379 139 66 10 ----------------122 23 438 4 2 24
42 3 25
48 1 26 21 27
147 3 28 74 14 1 29 22 30
176 1 31 114 1 32
19 3 33 56 1 34
120 1 35
56 1 36 110 2 37 200 3 38
65 2 1 39
110 4611 2575 4662 4206 2601 2248 1377 1830 40 4 20
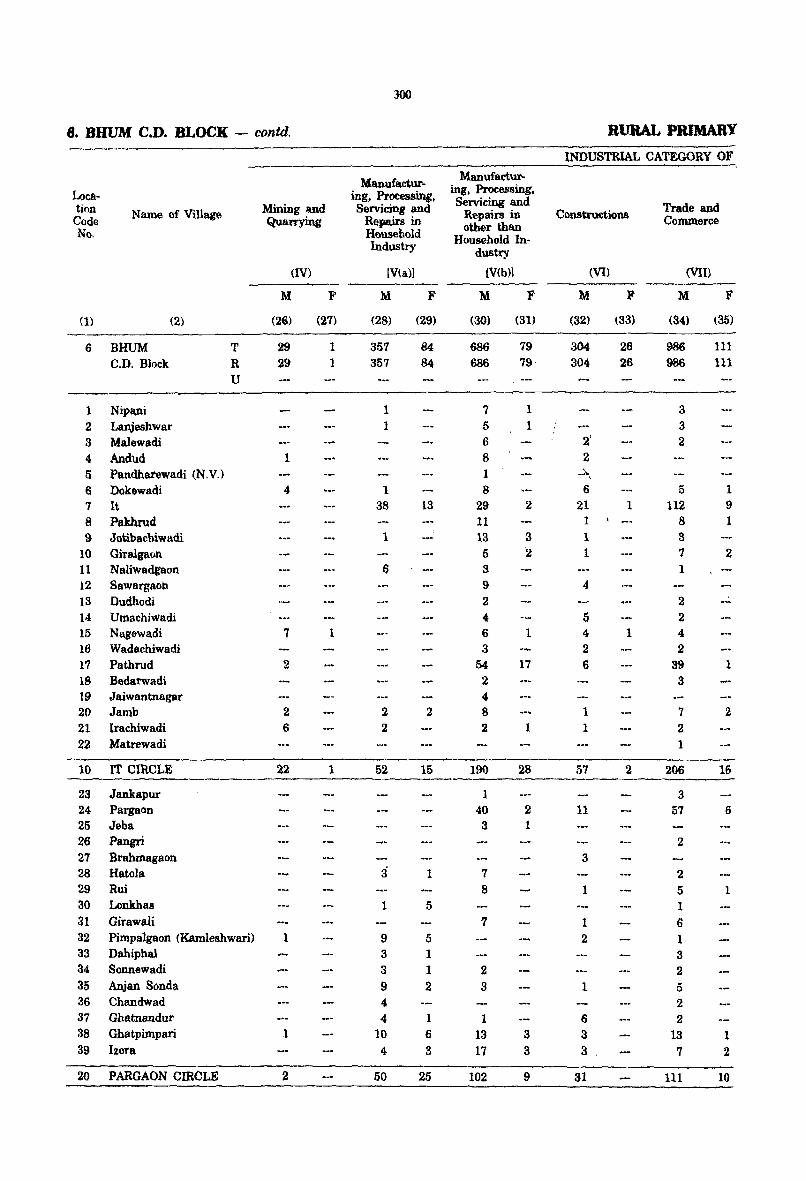
300
6. DRUM C.D. BLOCK - contd. RURAL PRIMARY
INDUSTRIAL CATEGORY OF
Manuf_ctur- ManufactUl'-
Lota- ing, Processing, ing, Processing, Servicing and tion Name of Village Mining and Servicing and R~pail'S in Constructions Trade and
Code Quarrying Repairs in oUwr than Commerce No. Household Household In-
Industry dustry
(IV) (V(a)1 {V(b)l (VI) (VII)
M F M F M F M F M F
(1) (2) (26) (27) (28) (29) (30) (31) (32) (33) (34) (35)
6 BHUM T 29 1 357 84 686 79 304 26 986 111 C.D. Block R 29 1 357 84 686 79· 304- 26 986 111
U --1 Nipani 1 7 1 3
2 Lanjeshwar 1 5 1 3 3 Malewadi 6 2' 2
4 Andud 1 8 2 5 Pandh~wadi (N.V') 1 ....... ,
6 Dokewadi 4 1 8 6 5 1 7 It 38 13 29 2 21 1 112 9 8 Pakhrud 11 1 8 1 9 Jotibacbiwadi 1 13 3 1 3
10 Giralgaon 5 2 1 7 2 11 Naliwadgaon 6 3 1 12 Sawargallh 9 4 13 Dudhodi 2 2 --. 14 UlUachiwadi 4 5 2 15 Nagewadi 7 1 6 1 4 1 4 16 Wadachiwadi 3 2 2 17 Pathrud 2 54 17 6 39 1 18 Bedarwadi 2 3 19 Jaiwantnagar 4 20 Jamb 2 2 2 8 1 7 2 21 lrachiwadi 6 2 2 1 1 2 22 Matrewadi 1
10 IT CIRCLE 22 1 52 15 190 28 57 2 206 16
23 Jankapur 1 3 24 Pargaon 40 2 11 57 6 25 Jeba 3 1 26 Pangri 2 27 Brahmagaon 3 28 Hatola :3 1 7 2 29 Rui 8 1 5 1 30 Lonkhas 1 5 1 31 Girawali 7 1 6 32 Pimpalgaon (Kamleshwari) 1 9 5 2 1 33 Dahiphal 3 1 3 34 Sonnewadi 3 1 2 2 35 Anjan Sonda 9 2 3 1 5 36 Chandwad 4 2 37 Ghatnandur 4 1 1 6 2 38 Ghatpimpari 1 10 6 13 3 3 13 1 39 Izora 4 3 17 3 3 7 2
20 PARGAON CIRCLE 2 50 25 102 9 31 111 10
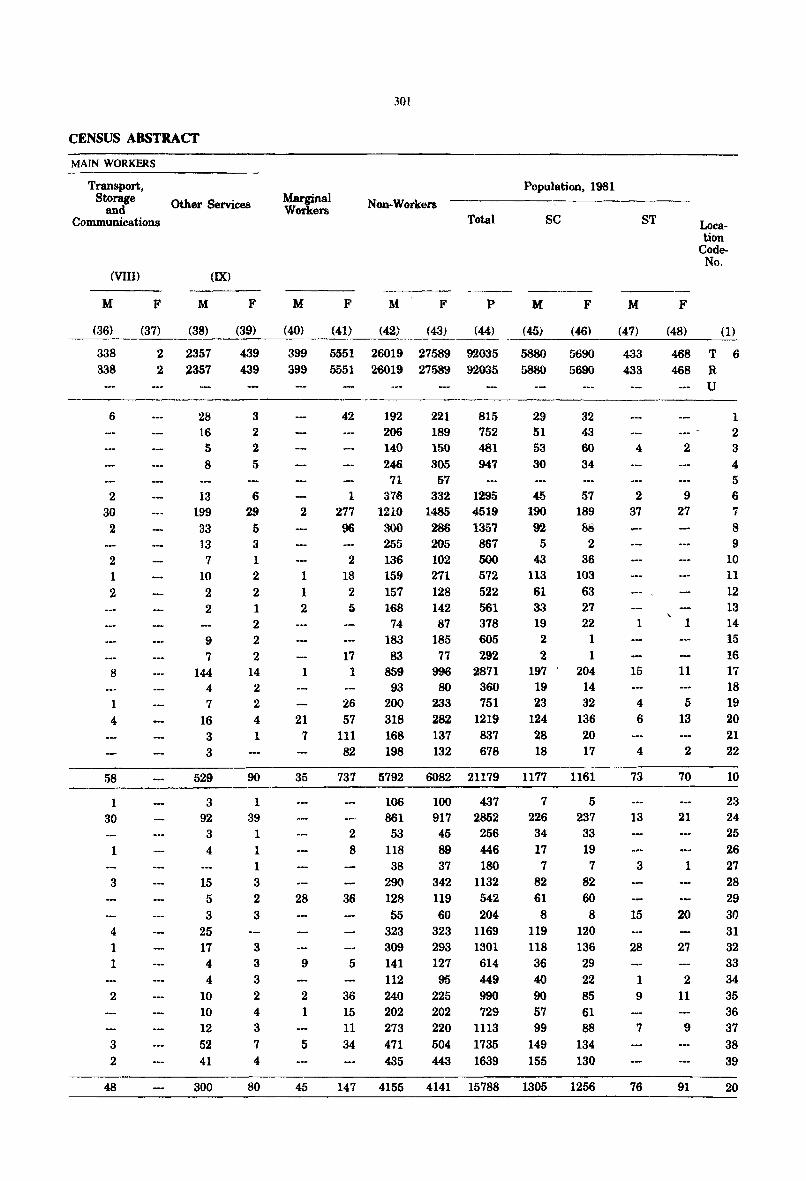
CENSUS ABSTRACT
MAIN WORKERS
Transport, Storage
and Communications
(VIII)
Other Services
(IX)
Marginal Workers
M F M F M
(36) (37) (38) (39) (40) ----------~.~~--~----
F
(41)
301
Non-Workers
M
(42)
F
(43)
Total
P
(<<)
Population, 1981
SC
M F
(45) (46)
338 2 2357 439 399 5551 26019 27589 92035 5880 5690 338 2 ~357 439
6
2 30 2
2 1 2
8
1 4
58
1 30
1
3
4 1 1
2
3 2
48
28 16 5 8
13 199 33 13
7 10 2 2
9 7
144 4 7
16 3 3
529
3 92 3 4
15 5 3
25 17 4 4
10 10 12 52 41
300
3
2 2 5
6 29
5 3 1 2
2 1 2 2 2
14 2 2 4 1
90
1 39
1
1 1 3 2 3
3
3 3 2 4 3 7 4
80
399 5551 26019 27589 92035 5880 5690
2
1 1 2
1
21 7
35
28
9
2 1
5
45
42 192 206 140 246-
71
221 189 150 305
57
815 752 481 947
29 51 53 30
32 4.'3 60
34
1 376 332 1295 45 190 92
5 43
57 189 8e
2 36
277 1210 1485 4519 96 300 286 1351
255 205 867 2 136 102 500
18 2 5
17 1
26 57
III 82
159 157 168 74
183 83
859 93
200 318 168 198
271 128 142 87
185 77
572 522 561 378 605 292
996 2871 80 360
233 751 282 1219 137 837 132 678
113 61 33 19
2
2 197 19 23
124 28 18
103 63 27 22
1 1
204 14 32
136 20 17
737 5792 6082 21179 1177 1161
106 100 437 7 5 861 917 2852 226 237
2 53 45 256 34 33 8 118 89 446 17 19
38 37 180 7 7 290 342 1132 82 82
36 128 119 542 61 60 55 60 204 8 8
323 323 1169 119 120 309 293 1301 118 136
5 141 127 614 36 29 112 95 449 40 22
36 240 225 990 90 85 15 202 202 729 57 61 11 273 220 1113 99 88 34 471 504 1735 149 134
435 443 1639 155 130
147 4155 4141 15788 1305 1256
M
(47)
ST
433 433
4
2 37
1
15
4 6
4
73
13
3
15
28
1 9
7
76
F
(48)
Location
CodeNo.
(1)
468 T 6 468 R
2
9 27
1
11
5 13
2
70
21
1
20
27
2 11
9
91
U
1 2 3 4 5 6 7 8 9
10 11 12 13 14 15 16 17 18 19 20 21 22
10
23 24 25 26 27 28 29 30 31 32 33 34 35 36 37 38 39
20
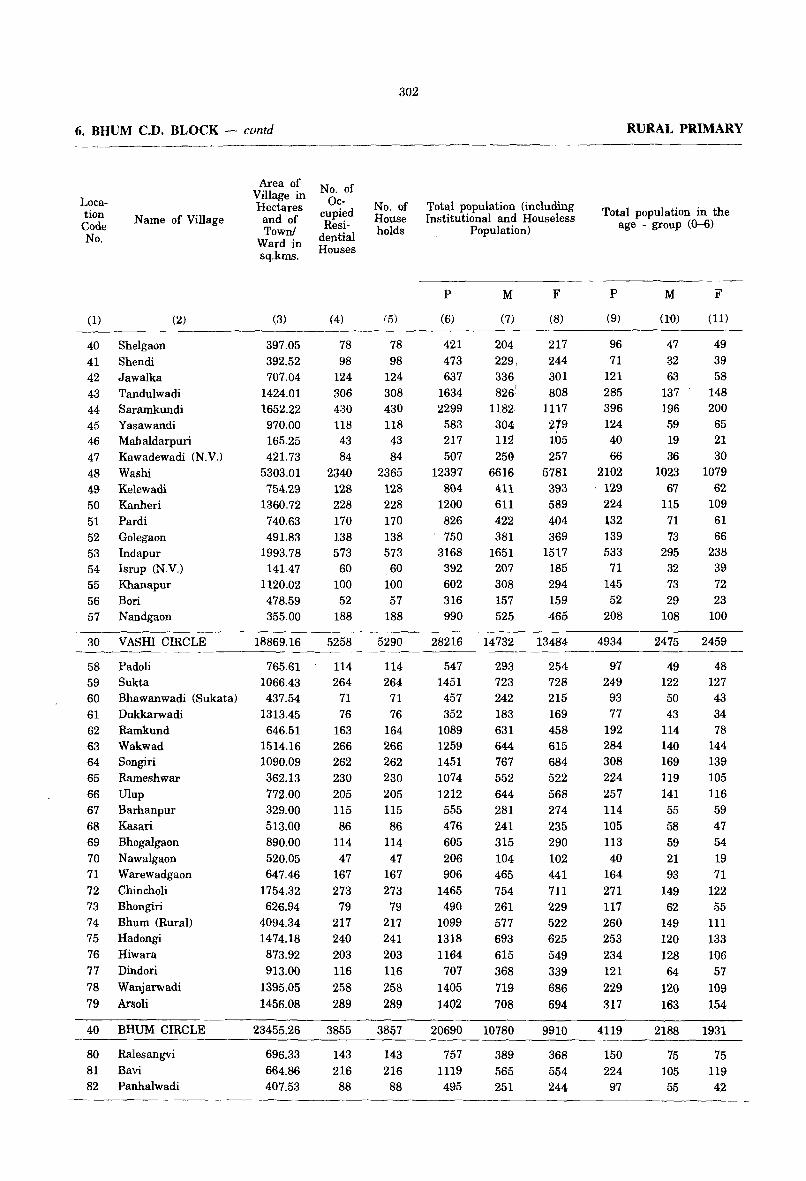
6. BHUM C.D. BLOCK - contd
Location Code No.
(1)
40 41 42 43 44 45 46 47 48 49 50 51 52 53 54 55 56 57
30
58 59 60 61 62 63 64 65 66 67 68 69 70 71 72 73 74 75 76 77 78 79
40
80 81 82
N arne of Village
(2)
Shelgaon Shendi Jawalka Tandulwadi Saramkundi Yasawandi Mahaldarpuri Kawadewadi (N.V.) Washi Kelewadi Kanheri Pardi Golegaon Indapur Isrup (N.V.) Khanapur Bori Nandgaon
V ASHI CIRCLE
Padoli Sukta Bhawanwadi (Sukata) Dukkarwadi Ramkund Wakwad Songiri Rarneshwar Ulup Barhanpur Kasari Bhogalgaon Nawalgaon Warewadgaon Chincholi Bhongiri Bhurn (Rural) Hadongi Hiwara Dindori Wanjarwadi Arsoli
BHUM CIRCLE
Ralesangvi Bavi Panhalwadi
Area of Village in Hectares and of Town!
Ward in sq.kms.
(3)
397.05 392.52 707.04
1424.01 1652.22 970.00 165.25 421.73
5303.01 754.29
1360.72 740.63 491.83
1993.78 141.47
1120.02 478.59 355.00
18869.16
765.61 1066.43 437.54
1313.45 646.51
1514.16 1090.09 362.13 772.00 329.00 513.00 890.00 520.05 647.46
1754.32 626.94
4094.34 1474.18 873.92 913.00
1395.05 1456.08
23455.26
696.33 664.86 407.53
No. of Oc
cupied Resi
dential Houses
(4)
78 98
124 306 430 118 43 84
2340 128 228 170 138 573 60
100 52
188
5258
114 264
71 76
163 266 262 230 205 115 86
114 47
167 273
79 217 240 203 116 258 289
3855
143 216 88
302
No. of House holds
(5)
78 98
124 308 430 118 43 84
2365 128 228 170 138 573 ,60 100 57
188
5290
114 264
71 76
164 266 262 230 205 115 86
114 47
167 273 79
217 241 203 116 258 289
3857
143 216 88
Total population (including Institutional and Houseless
Population)
P
(6)
421 473 637
1634 2299
583 217 507
12397 804
1200 826 750
3168 392 602 316 990
28216
547 1451 457 352
1089 1259 1451 1074 1212 555 476 605 206 906
1465 490
1099 1318 1164 707
1405 1402
20690
757 1119 495
M
(7)
204 229, 336 826:
1182. 304 112 250
6616 411 611 422 381
1651 207 308 157 525
14732
293 723 242 183 631 644 767 552 644 281 241 315 104 465 754 261 577 693 615 368 719
708
10780
389 565 251
F
(8)
217 244 301 808
1117 219 , 105 257
5781 393 589 404 369
1517 185 294 159 465
13484
254 728 215 169 458 615 684 522 568 274 235 290 102 441 711 229 522 625 549 339 686 694
9910
368 554 244
RURAL PRIMARY
Total popUlation in the age - group (0-6)
P
(9)
96 71
121 285 396 124 40 66
2102 129 224 ,32 139 533 71
145 52
208
4934
97 249
93 77
192 284 308 224 257 114 105 113 40
164 271 117 260 253 234 121 229 317
4119
150 224 97
M
(to)
47 32 63
137 196 59 19 36
1023 67
115 71 73
295 32 73 29
108
2475
49 122 50 43
114 140 169 119 141 55 58 59 21 93
149 62
149 120 128 64
120 163
2188
75 105 55
F
(11)
49 39 58
148 200 65 21 30
1079 62
109 61 66
238 39 72 23
100
2459
48 127 43 34 78
144 139 105 116 59 47 54 19 71
122 55
111 133 106 57
109 154
1931
75 119 42
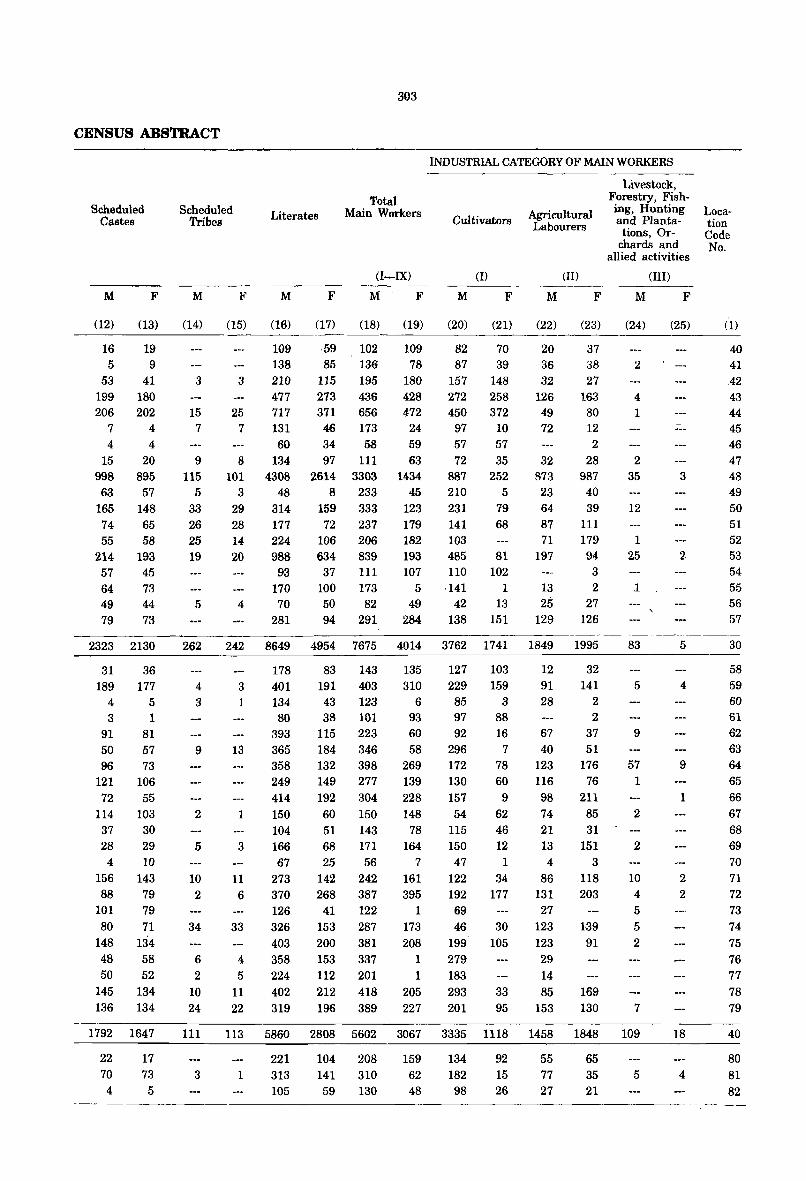
CENSUS ABSTRACT
Scheduled Castes
M F
(12) (13)
16 19 5 9
53 41 199 180 206 202
7 4 4 4
15 20 998 895
63 57 165 148 74 65 55 58
214 193 57 45 64 73 49 44 79 73
2323 2130
31 36 189 177
4 5 3
91 50
1 81 57
96 73 121 106 72 55
114 103 37 30 28 29
4 10 156 143 88 79
101 79
80 71 148 134 48 58 50 52
145 134 136 134
Scheduled Tribes
M
(14)
3
15 7
9 115
5 33 26 25 19
5
262
4
3
9
2
5
10 2
34
6 2
10 24
F
(15)
3
25 7
8 101
3
29 28 14 20
4
242
3 1
13
1
3
11 6
33
4
5 11 22
303
Literates Total
Main Workers
M
(16)
109 138 210 477
(I ........ IX)
F M F
(17) (18) (19)
59 102 85 136
115 195 273 436
109 78
180 428
717 371 656 472 131 46 173 24 60 34 58 59
134 97 111 63 4308 2614 3303 1434
48 8 233 45
314 159 333 123 177 72 237 179 224 106 206 182 988 634 839 193
93 37 111 107 170 100 173 5 70 50 82 49
281 94 291 284
8649 4954 7675 4014
178 83 143 135 401 191 403 310 134 43 123 6 80
393 365 358 249 414
150 104 166 67
273 370 126 326 403 358 224
402 319
38 101 115 223 184 346 132 398 149 277 192 304 60 150 51 143 68 171 25 56
142 242 268 387
41 122 153 287 200 381 153 337 112 201
212 418 196 389
93 60 58
269 139 228
148 78
164 7
161 395
1
173
208 1 1
205 227
INDUSTRIAL CATEGORY OF MAIN WORKERS
Cultivators
(I)
M F
(20) (21)
82 70 87 39
157 148 272 258 450 372
97 10 57 57 72 35
887 252 210 5 231 79 141 68 103 485 81 110 102
·141 1 42 13
138 151
3762 1741
127 103 229 159
85 3 97 92
296
88 16
7 172 78 130 60
157 9 54 62
115 46 150 12 47 1
122 34 192 177 69 46 30
199 105 279 183
293 33 201 95
Agricultural Labourers
(II)
M F
(22) (23)
20 36 32
126 49 72
32 873
23 64 87 71
197
13 25
129
1849
12 91 28
67 40
123 116
98 74 21 13 4
86 131 27
123
123 29 14
85 153
37 38 27
163 80 12 2
28 987
40 39
111 179 94
3 2
27 126
1995
32 141
2 2
37 51
176 76
211 85 31
151 3
118 203
139 91
169 130
Livestock, Forestry, Fishing, Hunting and Planta
tions, Orchards and
allied activities
(III)
M F
(24)
2
4 1
2
(25)
35 3
12
1 25 2
.1
,
83 5
5 4
9
57 1
2
2
10 4
5 5 2
7
9
1
2 2
1792 1647 111 113 5860 2808 5602 3067 3335 1118 1458 1848 109 18
22 70
4
17 73
5 3 1
221 313 105
104 208 141 310 59 130
159 62 48
134 182 98
92 15 26
55 77 27
65 35 21
5 4
Location Code No.
(1)
40 41 42 43 44 45 46 47 48 49 50 51 52 53 54 55 56 57
30
58 59 60 61 62 63 64 65
66 67 68 69 70
71 72 73 74
75 76 77 78 79
40
80 81
82
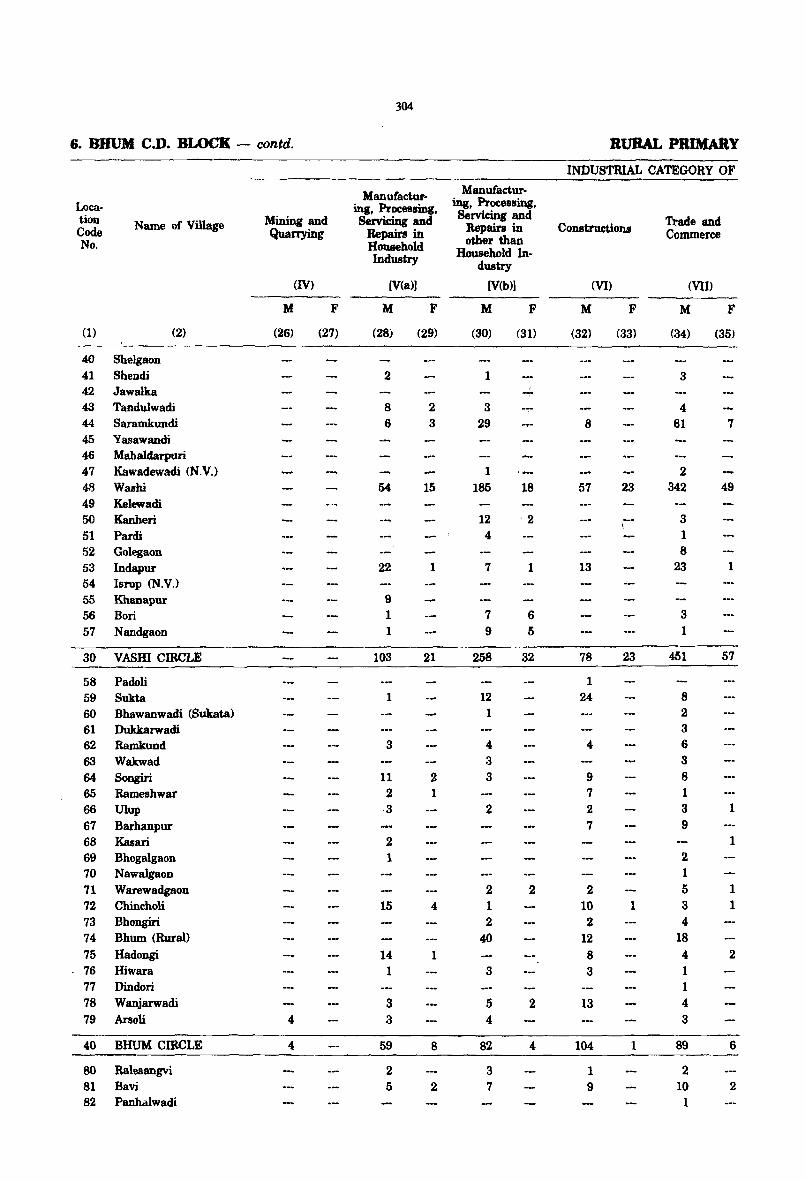
304
6. DRUM C.D. BLOCK - contd. RURAL PRIMARY
INDUSTRIAL CATEGORY OF
Manufactur· Manufactur-
Loca- ing, Processing, ing, Processing,
tioo Name of Village Mining and Servicing and Servicing and Trade and Code Quarrying Repairs in Repainin COIUltructions Commerce other than No. Houaehold Household In-Industry
dustry
(IV) W(a)1 W(b)1 (VI) (VIl)
M F M F M F M F M F
(1) (2) (26) (27) (28) (29) (30) (31) (32) (33) (34) (35)
40 Shelgaoo 41 Shendi 2 1 3 42 Jawalka -+ 43 Tandulwadi 8 2 3 4 44 Saramkundi 6 3 29 8 61 7 45 Yasawandi 46 Mahaldarpuri 47 Kawadewadi (N.V.) 1 2 48 Washi 54 15 185 18 57 23 342 49 49 Kelewadi 50 Kanheri 12 2 i- 3 51 Pardi 4 1 52 Golegaon 8 53 Indapur 22 1 7 1 13 23 1 54 Isrup eN. V.) 55 Khanapur 9 56 Bori 1 7 6 3 57 Nandgaon 1 9 5 1
30 VASID CIRCLE 103 21 258 32 78 23 451 57
58 Padoli 1 59 Sukta 1 12 24 8 60 Bhawanwadi (Sukata) 1 2 61 Dukkarwadi 3 62 Ramkund 3 4 4 6 63 Wakwad 3 3 64 Songiri 11 2 3 9 8 65 Rameshwar 2 1 7 1 66 Ulup ·3 2 2 3 1 67 Barbanpur 7 9 68 Kasari 2 1 69 Bhogalgaon 1 2 70 Nawalgaon 1 71 Warewadgaon 2 2 2 5 1 72 Chincholi 15 4, 1 10 1 3 1 73 Bhongiri 2 2 4 74 Bhum (Rural) 40 12 18 75 Hadongi 14 1 8 4, 2 76 Hiwara 1 3 3 1 77 Dindori 1 78 Wanjarwadi 3 5 2 13 4 79 Arsoli 4 3 4 3
40 BHUM CIRCLE 4 59 8 82 4, 104 1 89 6
80 Ralesangvi 2 3 1 2 81 Bavi 5 2 7 9 10 2 82 Panhalwadi 1
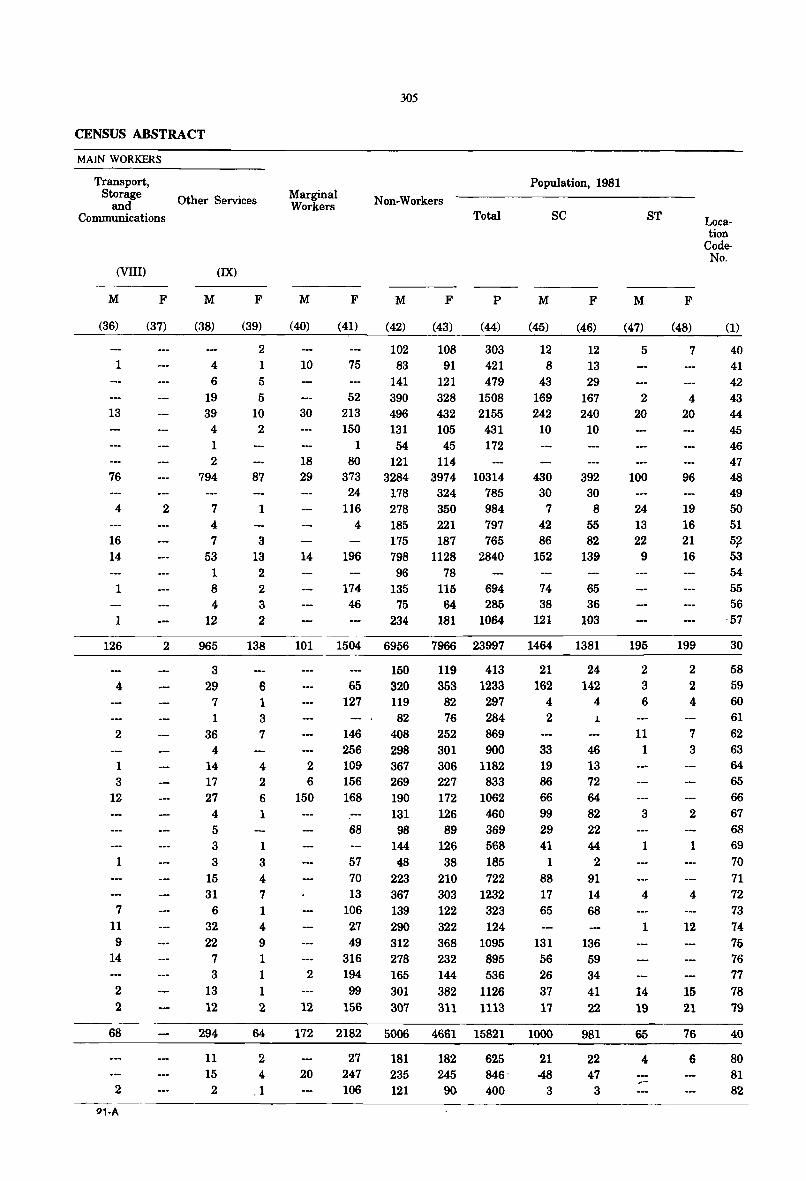
CENSUS ABSTRACT
MAIN WORKERS
Transport, Storage
and Communications
(VIII)
M
(36)
1
13
76
4
16 14
1
1
126
2
1 3
12
1
7 11 9
14
2 2
68
2
!)1·A
F
(37)
2
2
Other Services
(IX)
M
(38)
4 6
19 39
4 1 2
794
7 4 7
53 1 8 4
12
965
3 29
7 1
36 4
14 17 27
4 5 3
3 15 31
6 32 22
7 3
13 12
294
11 15
2
F
(39)
2 1 5 5
10 2
87
1
3 13 2 2 3 2
138
6 1 3
7
4 2 6 1
1 3 4 7 1 4 9 1 1 1 2
64
2 4
.1
305
Population, 1981 Marginal Workers
M
(40)
10
30
18 29
14
F
(41)
75
52 213 150
1
Non-Workers
M
(42)
102 83
141 390 496 131 54
F
(43)
Total
P
(44)
108 303 91 421
121 479 328 1508 432 2155 105 431 45 172
80 121 114 373 3284 3974 10314 24 178 324 785
116 278 350 984 4 185 221 797
175 187 765 196 798 1128 2840
174 46
96 135 75
234
78 115 694 64 285
181 1064
SC
M
(45)
12 8
43 169 242 10
430 30
7 42 86
152
74 38
121
F
(46)
12 13 29
167 240 10
392 30 8
55 82
139
65 36
103
101 1504 6956 7966 23997 1464 1381
2 6
150
65 127
146 256 109 156 168
68
57 70 13
106
150 320 119 82
408 298 367 269 190 131 98
144 48
223 367 139
119 413 353 1233 82 297 76 284
252 869 301 900 306 1182 227 833 172 1062 126 460 89 369
126 38
210
568 185 722
303 1232 122 323
2.7 290 322 124
21 162
4 2
33 19 86
66 99 29 41
1 88 17 65
49 312 368 1095 131 316 278 232 895 56
2 194 165 144 536 26 99 301 382 1126 37
12 156 307 311 1113 17
172 2182 5006 4661 15821 1000
20 27
247 106
181 235 121
182 245 90
625 846· 400
21 48
3
24 142
4 1
46 13 72 64 82 22 44
2 91 14 68
136 59 34 41 22
981
22 47
3
M
(47)
5
2 20
ST
100
24 13 22
9
195
2 3 6
11 1
3
1
4
1
14 19
65
4
F
(48)
7
4 20
96
19 16 21 16
199
2 2 4
7 3
2
1
4
12
15 21
76
6
Location
CodeNo.
(1)
40 41 42 43 44 45 46 47 48
49 50 51 5~ 53 54 55 56 57
30
58 59 60 61 62 63 64 65 66 67 68 69 70 71 72 73 74 76 76 77
78 79
40
80 81 82
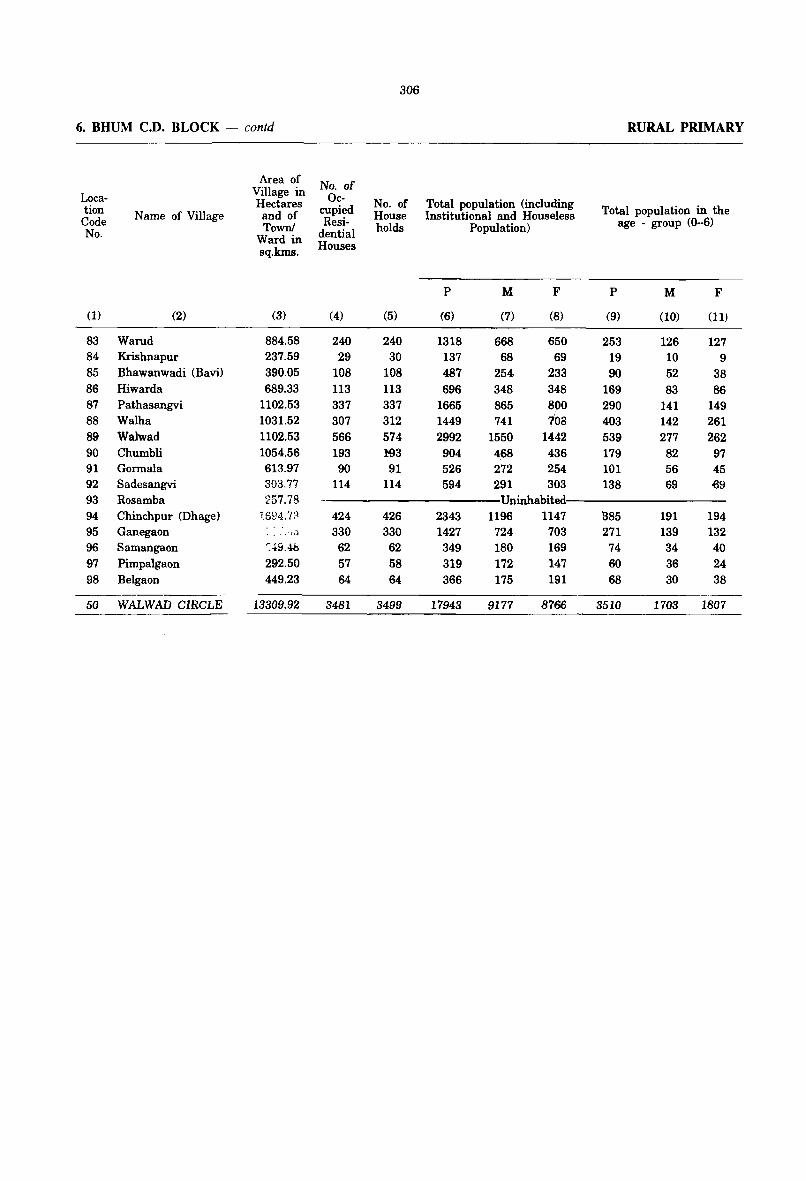
306
6. BHUM C.D. BLOCK - contd RURAL PRIMARY
Area of No. of Loca- Village in Qc-tion Hectares cupied No. of Total population (including Total population in the Code N arne of Village and of Resi- House Institutional and Houseless age - group (0-6) No. Town! dential holds Population)
Ward in Houses sq.kms.
P M F P M F
(1) (2) (3) (4) (5) (6) (7) (8) (9) (10) (11)
83 Warud 884.58 240 240 1318 668 650 253 126 127 84 Krishnapur 237.59 29 30 137 68 69 19 10 9 85 Bhawanwadi (Bavi) 390.05 108 108 487 254 233 90 52 38 86 Hiwarda 689.33 113 113 696 348 348 169 83 86 87 Pathasangvi 1102.53 337 337 1665 865 800 290 141 149 88 Walha 1031.52 307 312 1449 741 708 403 142 261 89 Walwad 1102.53 566 574 2992 1550 14,42 539 277 262 90 Churnbli 1054.56 193 193 904 4.68 436 179 82 97 91 Gormala 613.97 90 91 526 272 254 101 56 45 92 Sadesangvi 303.77 114 114 594 291 303 138 69 ~9
93 Rosarnba 257.78 Uninhabited 94 Chinchpur (Dhage) 1_694.7:~ 424 426 2343 1196 1147 885 191 194 95 Ganegaon ' •. . 'It.) 330 330 1427 724 703 271 139 132 96 Samangaon ':~9.4b 62 62 349 180 169 74 34 40 97 Pirnpalgaon 292.50 57 58 319 172 147 60 36 24 98 Belgaon 449.23 64 64 366 175 191 68 30 38
50 WALWAD CIRCLE 13309.92 3481 3499 17943 9177 8766 3510 1703 1807
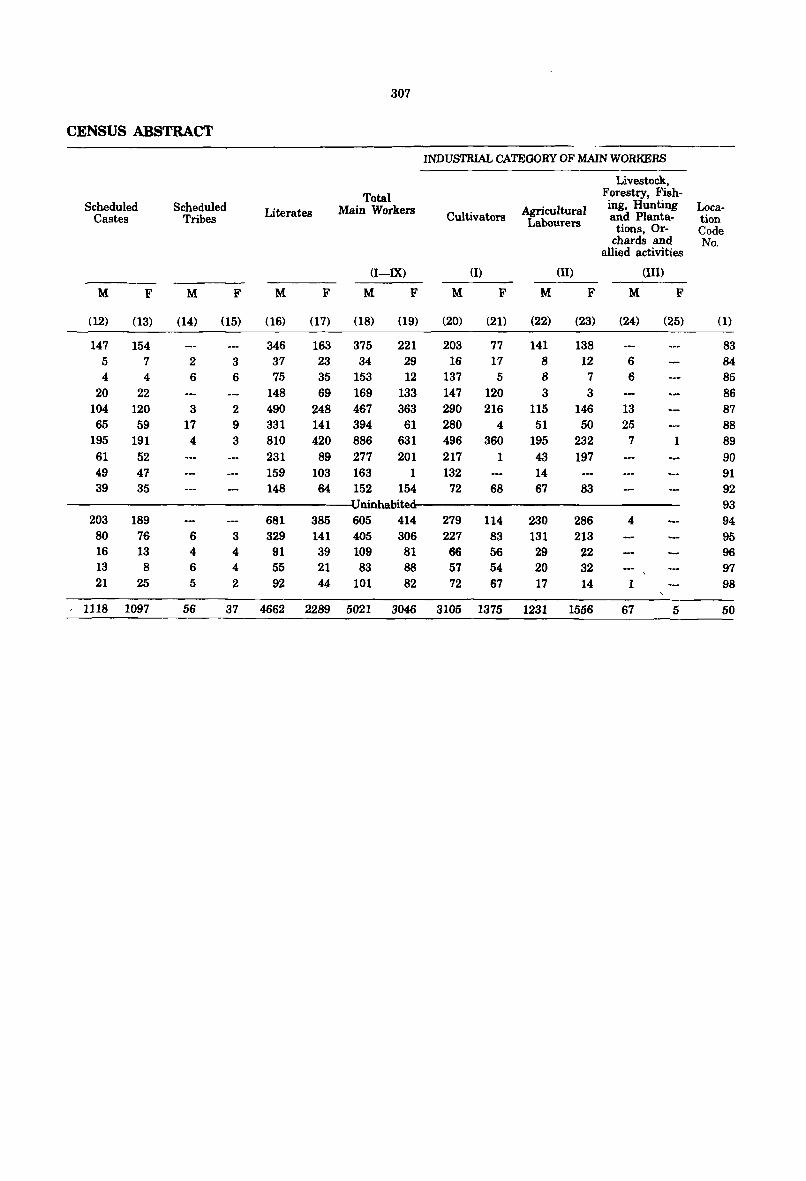
307
CENSUS ABSTRACT
INDUSTRIAL CATEGORY OF MAIN WORKERS
Livestock,
Total Forestry, Fish-Scheduled Scheduled Literates Main Workers Agricultural ing, Hunting Loca-
Castes Tribes Cultivators and Planta- tion Labourers tions, Or- Code chards and No.
allied activities
(I-JX) (l) (II) (III)
M F M F M F M F M F M F M F
(12) (13) (14) (15) (16) (17) (18) (19) (20) (21) (22) (23) (24) (25) (1)
147 154 346 163 375 221 203 77 141 138 83 5 7 2 3 37 23 34 29 16 17 8 12 6 84 4 4 6 6 75 35 153 12 137 5 8 7 6 85
20 22 148 69 169 133 147 120 3 3 86 104 120 3 2 490 248 467 363 290 216 115 146 13 87 65 59 17 9 331 141 394 61 280 4 51 50 25 88
195 191 4 3 810 420 886 631 496 360 195 232 7 1 89 61 52 231 89 277 201 217 1 43 197 90 49 47 159 103 163 1 132 14 91 39 35 148 64 152 154 72 68 67 83 92
ninhabite 93 203 189 681 385 605 414 279 114 230 286 4 94 80 76 6 3 329 141 405 306 227 83 131 213 95 16 13 4 4 91 39 109 81 66 56 29 22 96 13 8 6 4 55 21 83 88 57 54 20 32 97 21 25 5 2 92 44 101 82 72 67 17 14 1 98
1118 1097 56 37 4662 2289 5021 3046 3105 1375 1231 1556 67 5 50
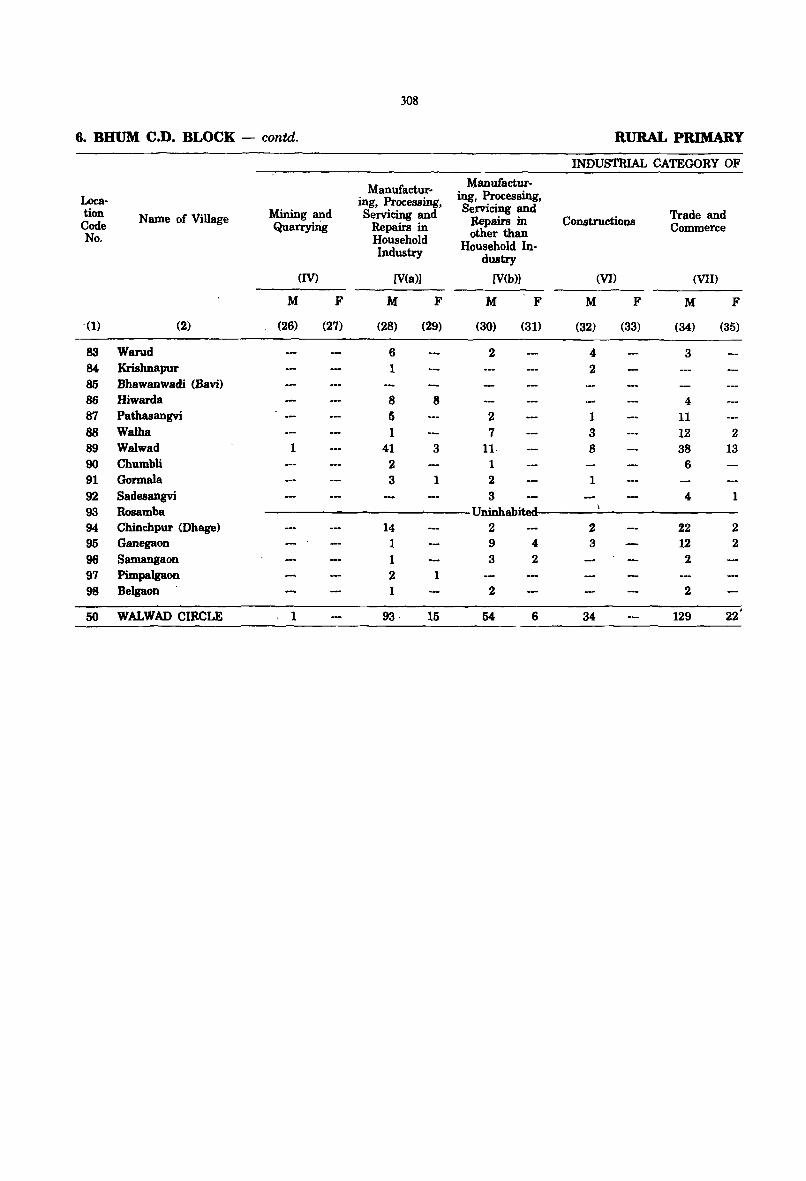
308
6. DRUM C.D. BLOCK - contd. RURAL PRIMARY
INDUSTRIAL CATEGORY OF
Manufactur- Manufactur-
Loca- ing, Processing, ing, Processing,
tion Name of Village Mining and Servicing and Servicing and Trade and Code Quarryhlg Repairs in Repairs in Constructions Commerce other than No. Household Household In-Industry dustry
(IV) [V(a») [V(b») (VI) (VII)
M F M F M F M F M F
(1) (2) (26) (27) (28) (29) (30) (31) (32) (33) (34) (35)
83 Warud 6 2 " 3 84 Krishnapur 1 2 85 Bhawanwadi (Bari) 86 Hiwarda 8 8 4 87 Pathasangvi 5 2 1 11 88 Walha 1 7 3 12 2 89 Walwad 1 41 3 11 8 38 13 90 Chumbli 2 1 6 91 Gormala 3 1 2 1 92 Sadesangvi 3 4 1 93 Rosamba Uninhabit 94 Chinchpur (Dhage) 14 2 2 22 2 95 Ganegaon 1 9 4 3 12 2
96 Samangaon l' 3 2 2 97 Pimpalgaon 2 1 98 Belgaon 1 2 2
50 WALWAD CmCLE 1 93· 15 54 6 34 129 22'
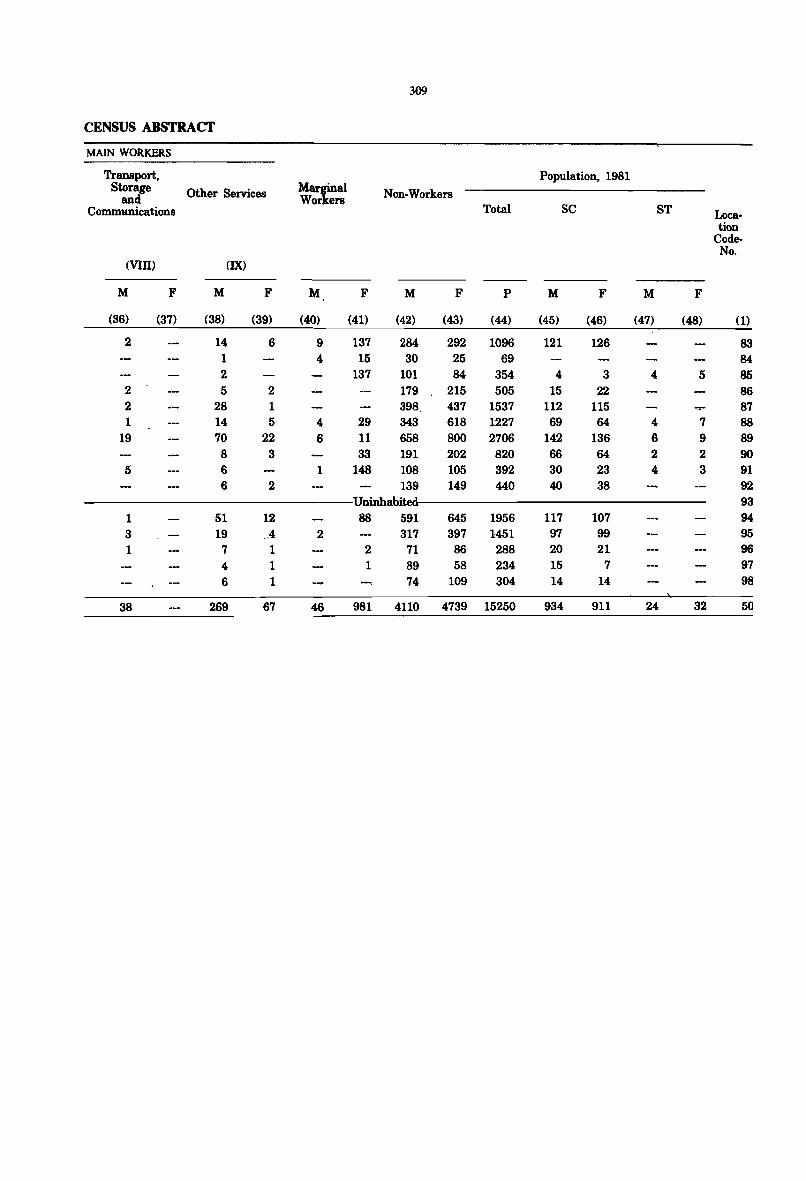
309
CENSUS ABSTRACT
MAIN WORKERS
Transport, Population, 1981 Storage Other Services Marginal Non-Workers and Workers
Commwrications Total SC ST Loca-tion
Code-No.
(VITI) (IX)
M F M F M F M F P M F M F
(36) (37) (38) (39) (40) (41) (42) (43) (44) (45) (46) (47) (48) (1)
2 14 6 9 137 284 292 1096 121 126 83 1 4 15 30 25 69 84 2 137 101 84 354 4 3 4 5 85
2 5 2 179 215 505 15 22 86 2 28 1 398, 437 1537 112 115 87 1 14 5 4 29 343 618 1227 69 64 4 7 88
19 70 22 6 11 658 800 2706 142 136 6 9 89 8 3 33 191 202 820 66 64 2 2 90
5 6 1 148 108 105 392 30 23 4 3 91 6 2 139 149 440 40 38 92
Uninhabit 93 1 51 12 88 591 645 1956 117 107 94
3 19 .4 2 317 397 1451 97 99 95 1 7 1 2 71 86 288 20 21 96
4 1 1 89 58 234 15 7 97 6 1 74 109 304 14 14 9a
38 269 67 46 981 4110 4739 15250 934 911 24 32 50
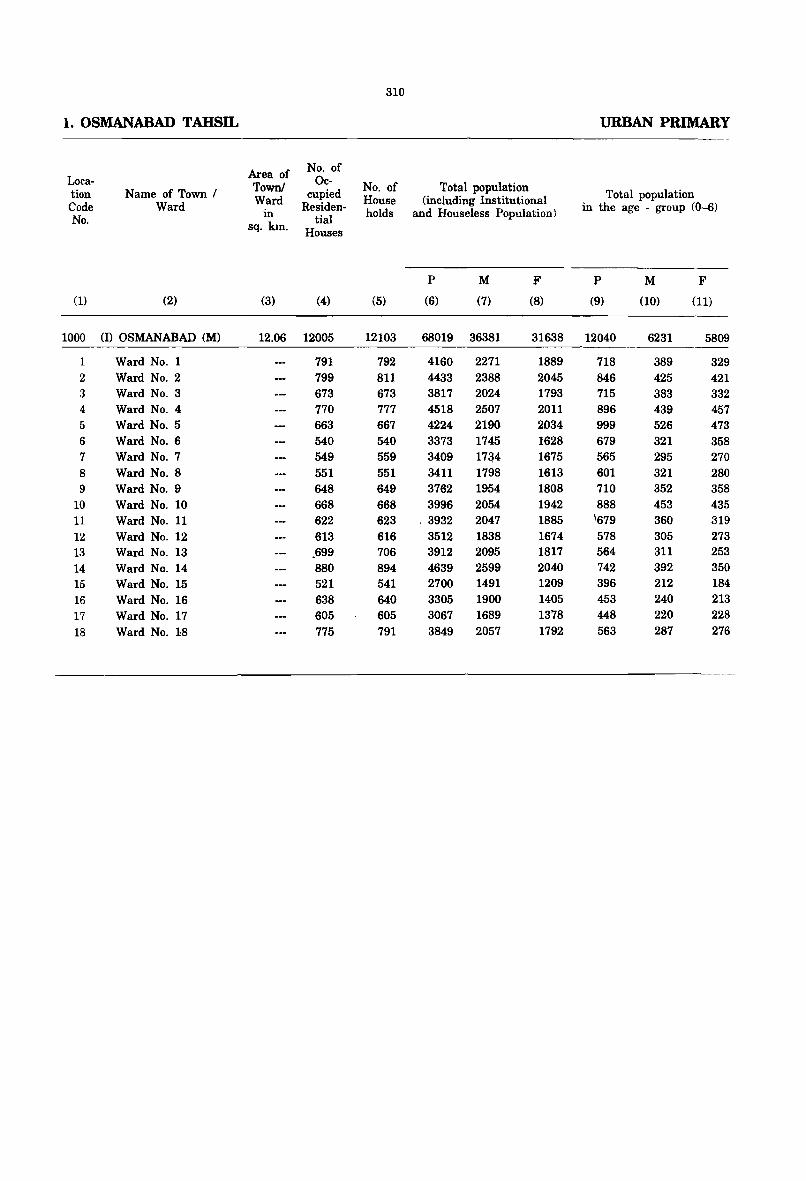
310
1. OSMANABAD TAHSIL URBAN PRIMARY
Area of No. of Loca- Town! Oc- No. of Total population tion Name of Town I cupied Total population Code Ward Ward Residen- House (including Institutional in the age - group (0-6) No. m tial holds and Houseless Population)
sq. km. Houses
P M F P M F
(1) (2) (3) (4) (5) (6) (7) (8) (9) (10) (11)
1000 (I) OSMANABAD (M) 12.06 12005 12103 68019 36381 31638 12040 6231 5809
1 Ward No.1 791 792 4160 2271 1889 718 389 329 2 Ward No.2 799 811 4433 2388 2045 846 425 421 3 Ward No.3 673 673 3817 2024 1793 715 383 332 4 Ward No.4 770 777 4518 2507 2011 896 439 457 5 Ward No.5 663 667 4224 2190 2034 999 526 473 6 Ward No.6 540 540 3373 1745 1628 679 321 358 7 Ward No.7 549 559 3409 17~4 1675 565 295 270 8 Ward No.8 551 551 3411 1798 1613 601 321 280 9 Ward No.9 648 649 3762 1954 1808 710 352 358
10 Ward No. 10 668 668 3996 2054 1942 888 453 435 11 Ward No. 11 622 623 . 3932 2047 1885 \679 360 319 12 Ward No. 12 613 616 3512 1838 1674 578 305 273 13 Ward No. 13 .699 706 3912 2095 1817 564 311 253 14 Ward No. 14 880 894 4639 2599 2040 742 392 350 15 Ward No. 15 521 541 2700 1491 1209 396 212 184 16 Ward No. 16 638 640 3305 1900 1405 453 240 213 17 Ward No. 17 605 605 3067 1689 1378 448 220 228 18 Ward No. 18 775 791 3849 2057 1792 563 287 276
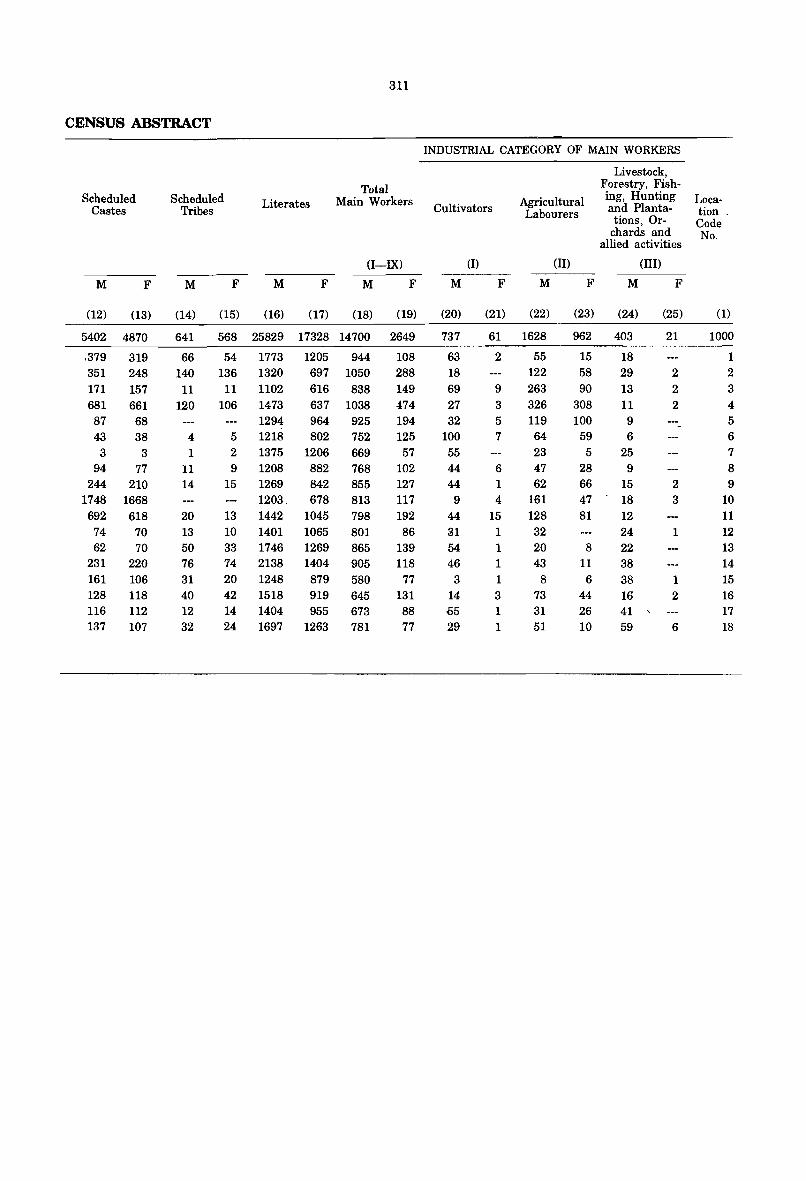
311
CENSUS ABSTRACT
Scheduled Castes
M F
(12) (13)
5402 4870
.379 319 351 248 171 157 681 661 87 68 43 38
3 3 94 77
244 210 1748 1668
692 618 74 70 62 70
231 220 161 106 128 118 116 112 137 107
Scheduled Tribes
Literates Total
Main Workers
M
(14)
641
66 140
11 120
4 1
11 14
20 13 50 76 31 40 12 32
(I-IX)
F M F M
(15) (16) (17) (18)
568 25829 17328 14700
54 136
11 106
5 2
1773 1320 1102 1473 1294 1218 1375
1205 944 697 1050 616 838 637 1038 964 925 802 752
1206 669 9 1208 882 768
15 1269 842 855 1203 . 678 813
13 1442 1045 798 10 1401 1065 801 33 1746 1269 865 74 2138 1404 905 20 1248 879 580 42 1518 919 645 14 1404 955 673 24 1697 1263 781
F
(19)
2649
108 288 149 474 194 125
57 102 127 117 192 86
139 118
77 131 88 77
INDUSTRIAL CATEGORY OF MAIN WORKERS
Cultivators
M
(20)
737
63 18 69 27 32
100 55 44 44 9
44 31 54 46
3
14 55 29
(I)
F
(21)
61
2
9 3
5
7
6 1 4
15 1 1 1 1 3 1 1
Agricultural Labourers
M
(22)
1628
55 122 263 326 119 64 23 47 62
161 128 32 20 43
8 73 31 51
(II)
F
(23)
962
15 58 90
308 100
59 5
28 66 47 81
8 11
6 44 26 10
Livestock, Forestry, Fishing, Hunting and Planta
tions, Orchards and
allied activities
M
(24)
403
18 29 13 11 9 6
25 9
(III)
F
(25)
21
2 2 2
15 2 18 3 12 24 1 22 38 38 1 16 2 41 ,
59 6
Location _ Code No.
(1)
1000
1 2 3 4 5 6 7 8 9
10 11 12 13 14 15 16 17 18
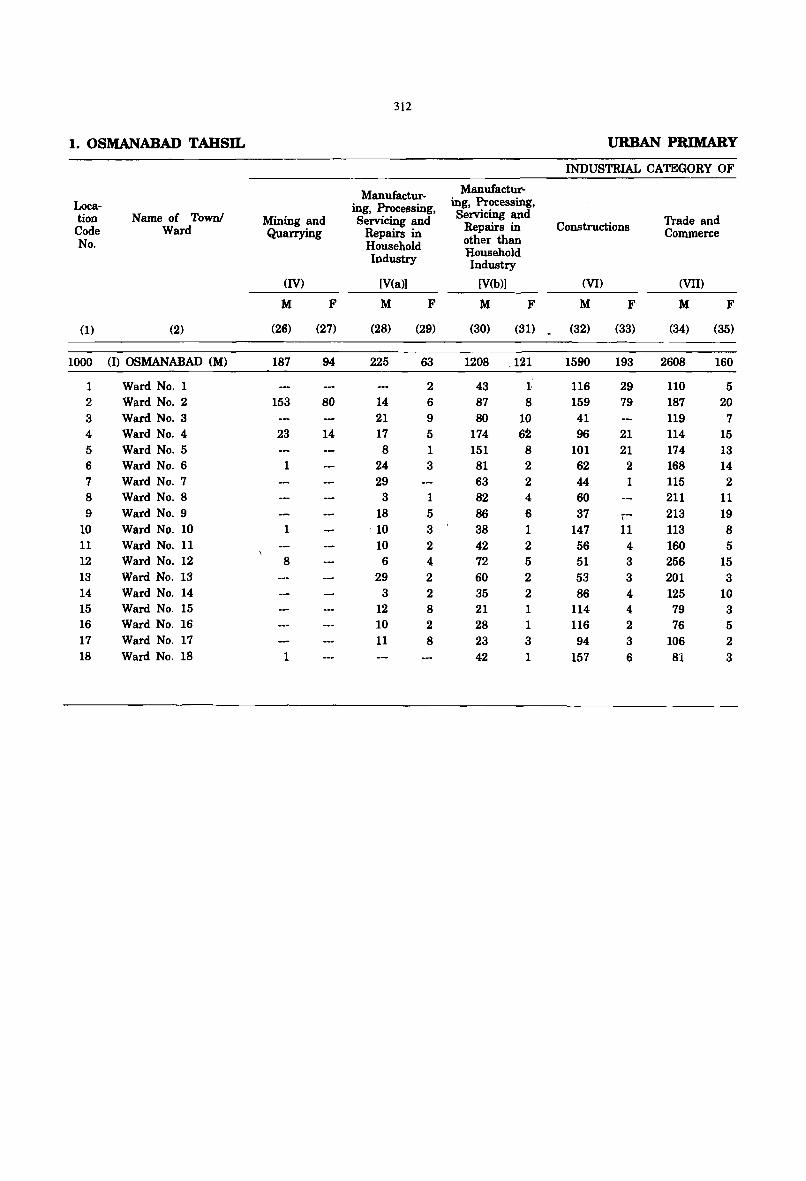
312
1. OSMANABAD TAHSIL URBAN PRIMARY
INDUSTRIAL CATEGORY OF
Manufactur- Manufactur-Loca- ing, Processing, ing, Processing, tion Name of Town! Mining and Servicing and Servicing and Trade and Code Ward Quarrying Repairs in Repairs in Constructions Commerce No. Household other than
Industry Household Industry
(IV) [V(a») [V(b») (VI) (VII)
M F M F M F M F M F
(1) (2) (26) (27) (28) (29) (30) (31) (32) (33) (34) (35)
1000 (I) OSMANABAD (M) 187 94 225 63 1208 .121 1590 193 2608 160
1 Ward No.1 2 43 1 116 29 110 5 2 Ward No.2 153 80 14 6 87 8 159 79 187 20 3 Ward No.3 21 9 80 10 41 119 7 4 Ward No.4 23 14 17 5 174 62 96 21 114 15 5 Ward No.5 8 1 151 8 101 21 174 13 6 Ward No.6 1 24 3 81 2 62 2 168 14 7 Ward No.7 29 63 2 44 1 115 2 8 Ward No.8 3 1 82 4 60 211 11 9 Ward No.9 18 5 86 6 37 r- 213 19
10 Ward No. 10 1 10 3 38 1 147 11 113 8 11 Ward No. 11 10 2 42 2 56 4 160 5 12 Ward No. 12 8 6 4 72 5 51 3 256 15 13 Ward No. 13 29 2 60 2 53 3 201 3 14 Ward No. 14 3 2 35 2 86 4 125 10 15 Ward No. 15 12 8 21 1 114 4 79 3 16 Ward No. 16 10 2 28 1 116 2 76 5 17 Ward No. 17 11 8 23 3 94 3 lOS 2 18 Ward No. 18 1 42 1 157 6 81 3
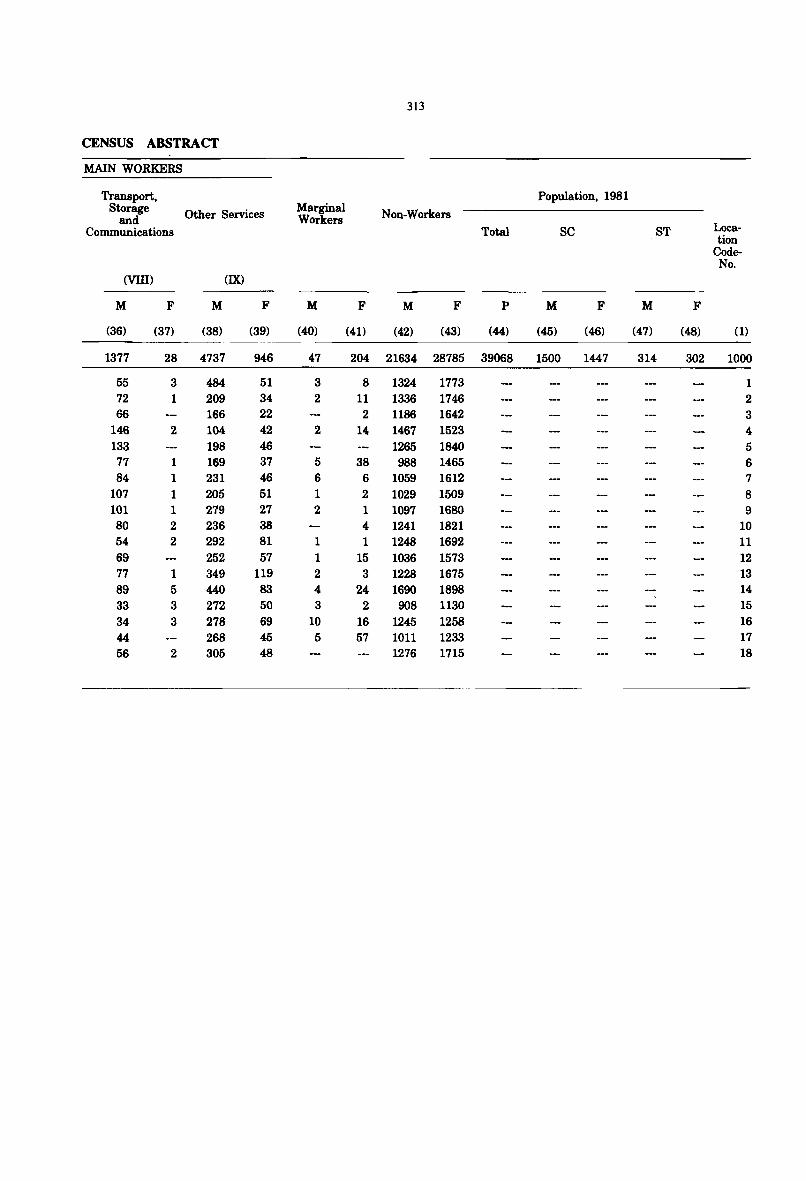
313
CENSUS ABSTRACT
MAIN WORKERS
Transport, Population, 1981 Storage Other Services Marginal Non-Workers and Workers
Communications Total SC ST Loca-tion
Code-No.
(VIll) (IX)
M F M F M F M F P M F M F
(36) (37) (38) (39) (40) (41) (42) (43) (44) (45) (46) (47) (48) (1)
1377 28 4737 946 47 204 21634 28785 39068 1500 1447 314 302 1000
55 3 484 51 3 8 1324 1773 1 72 1 209 34 2 11 1336 1746 2 66 166 22 2 1186 1642 3
146 2 104 42 2 14 1467 1523 4 133 198 46 1265 1840 5 77 1 169 37 5 38 988 1465 6 84 1 231 46 6 6 1059 1612 7
107 1 205 51 1 2 1029 1509 8 101 1 279 27 2 1 1097 1680 9 80 2 236 38 4 1241 1821 10 54 2 292 81 1 1 1248 1692 11 69 252 57 1 15 1036 1573 12 77 1 349 119 2 3 1228 1675 13 89 5 440 83 4 24 1690 1898 14 33 3 272 50 3 2 908 1130 15 34 3 278 69 10 16 1245 1258 16 44 268 45 5 57 1011 1233 17 56 2 305 48 1276 1715 18
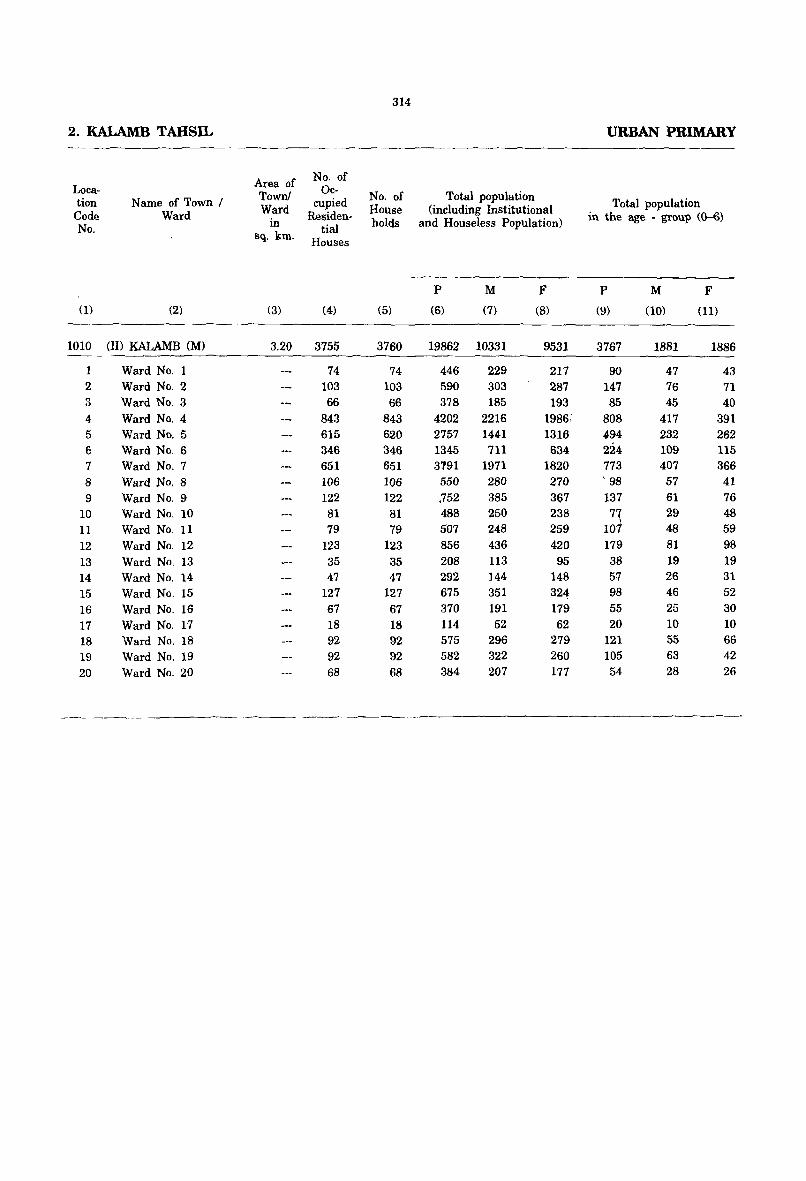
314
2. KALAMB TAHSIL URBAN PRIMARY
Area of No. of Loca- Town' Oc- No. of Total population tion Name of Town / Ward cupied House (including Institutional Total population Code Ward
in Residen- holds and Houseless Population) in the age - group (0-6) No. tial sq. kIn. Houses
P M F P M F (1) (2) (3) (4) (5) (6) (7) (8) (9) (10) (11)
1010 (II) KALAMB (M) 3.20 3755 3760 19862 10331 9531 3767 1881 1886
1 Ward No.1 74 74 446 229 217 90 47 43 2 Ward No.2 103 103 590 303 287 147 76 71 3 Ward No.3 66 66 378 185 193 85 45 40 4 Ward No.4 843 843 4202 2216 1986, 808 417 391 5 Ward No.5 615 620 2757 1441 1316 494 232 262 6 Ward No.6 346 346 1345 711 634 224 109 115 7 Ward No.7 651 651 3191 1971 1820 773 407 366 8 Ward No.8 106 106 550 280 270 ' 98 57 41 9 Ward No.9 122 122 .752 385 367 137 61 76
10 Ward No. 10 81 81 488 250 238 7'{ 29 48 11 Ward No. 11 79 79 507 248 259 101 48 59 12 Ward No. 12 123 123 856 436 420 179 81 98 13 Ward No. 13 35 35 208 113 95 38 19 19 14 Ward No. 14 47 47 292 ]44 148 51 26 31 15 Ward No. 15 127 127 675 351 324 98 46 52 16 Ward No. 16 67 67 370 191 179 55 25 30 17 Ward No. 17 18 18 114 52 62 20 10 10 18 Ward No. 18 92 92 575 296 279 121 55 66 19 Ward No. 19 92 92 582 322 260 105 63 42 20 Ward No. 20 68 68 384 207 177 54 28 26
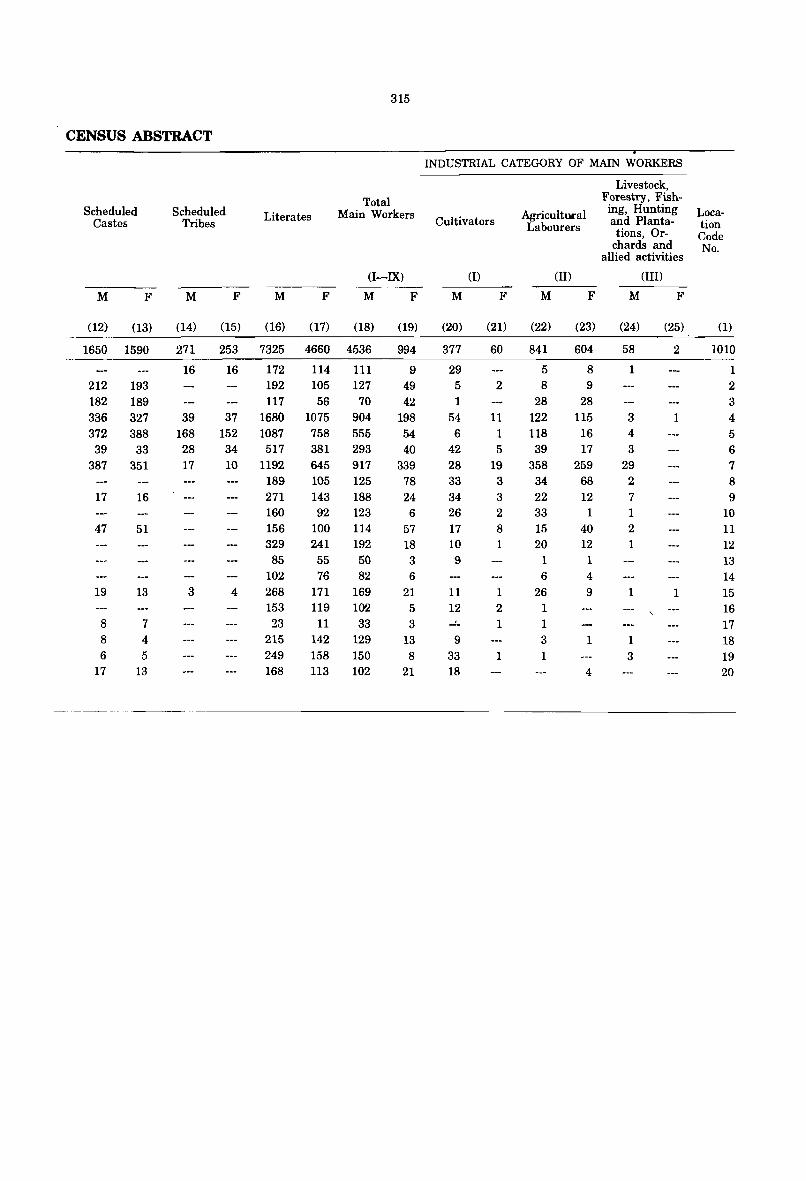
315
CENSUS ABSTRACT
INDUSTRIAL CATEGORY OF MAIN WORKERS
Livestock,
Total Forestry, Fish-Scheduled Scheduled Literates Main Workers Agricultucal ing, Hunting Loca-
Castes Tribes Cultivators Labourers and Planta- tion tions, Or- Code
chards and No. allied activities
(I-IX) (l) (II) (III)
M F M F M F M F M F M F M F
(12) (13) (14) (15) (16) (17) (18) (19) (20) (21) (22) (23) (24) (25) (1)
1650 1590 271 253 7325 4660 4536 994 377 60 841 604 58 2 1010
16 16 172 114 111 9 29 5 8 1 1 212 193 192 105 127 49 5 2 8 9 2 182 189 117 56 70 42 1 28 28 3 336 327 39 37 1680 1075 904 198 54 11 122 115 3 1 4 372 388 168 152 1087 758 555 54 6 1 118 16 4 5 39 33 28 34 517 381 293 40 42 5 39 17 3 6
387 351 17 10 1192 645 917 339 28 19 358 259 29 7 189 105 125 78 33 3 34 68 2 8
17 16 271 143 188 24 34 3 22 12 7 9 160 92 123 6 26 2 33 1 1 10
47 51 156 100 114 57 17 8 15 40 2 11 329 241 192 18 10 1 20 12 1 12 85 55 50 3 9 1 1 13
102 76 82 6 6 4 14 19 13 3 4 268 171 169 21 11 1 26 9 1 1 15
153 119 1()12 5 12 2 1 16 B 7 23 11 33 3 --- 1 1 17 8 4 215 142 129 13 9 3 1 1 18 6 5 249 158 150 8 33 1 1 3 19
17 13 168 113 102 21 18 4 20
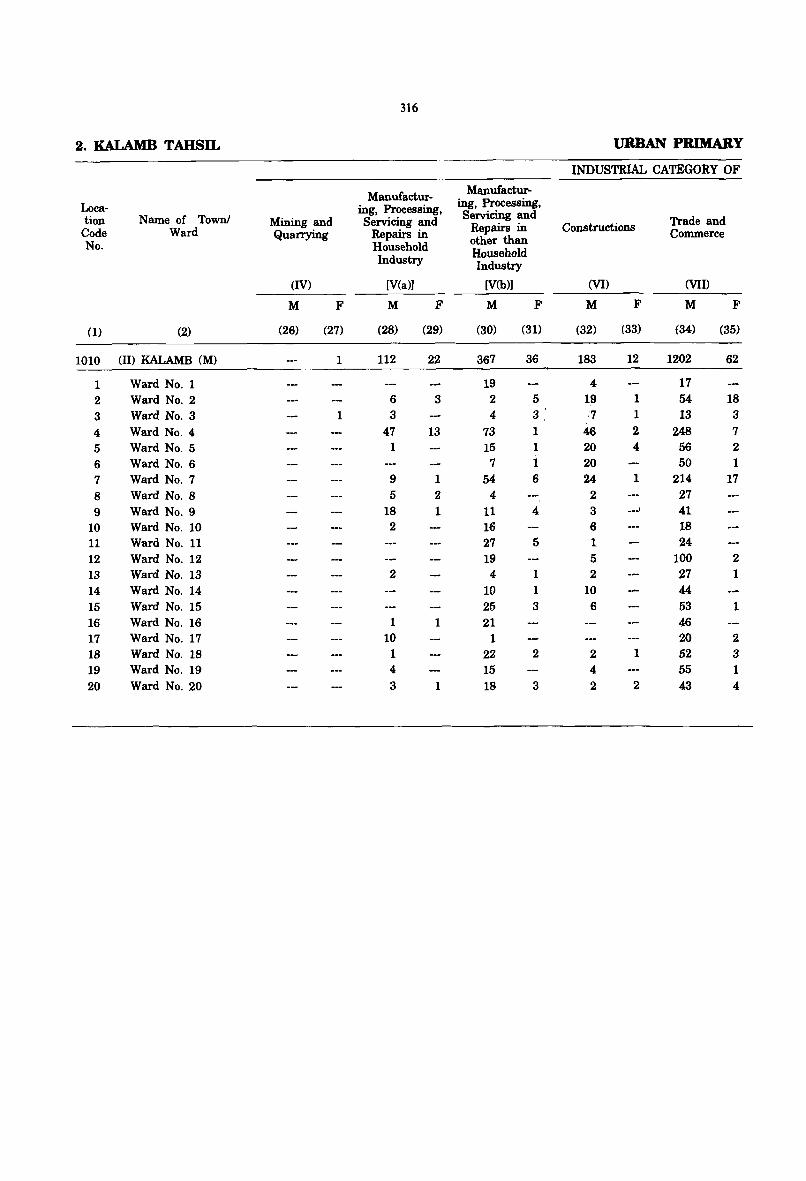
316
2. KALAMB TAHSIL URBAN PRIMARY
INDUSTRIAL CATEGORY OF
Manufactur- Manufactur-
Loca- ing, Processing, ing, Processing,
tion Name of Town! Mining and Servicing and Servicing and Trade and Code Ward Quarrying Repairs in Repairs in Constructions Commerce No. Household other than
Industry Household Industry
(IV) [V(a)] [V(b)] (VI) (VII)
M F M F M F M F M F
(1) (2) (26) (27) (28) (29) (30) (31) (32) (33) (34) .(35)
1010 (II) KALAMB (M) 1 112 22 367 36 183 12 1202 62
1 Ward No.1 19 4 17
2 Ward No.2 6 3 2 5 1~ 1 54 18
3 Ward No.3 1 3 4 3 /7 1 13 3
4 Ward No.4 47 13 73 1 46 2 248 7
5 Ward No.5 1 15 1 20 4 56 2
6 Ward No.6 7 i 20 50 1
7 Ward No.7 9 1 54 6 24 1 214 17
8 Ward No.8 5 2 4 2 27 9 Ward No.9 18 1 11 4 3
___ I 41
10 Ward No. 10 2 16 6 18
11 Ward No. 11 27 5 1 24
12 Ward No. 12 19 5 100 2 13 Ward No. 13 2 4 1 2 27 1
14 Ward No. 14 10 1 10 44 15 Ward No. 15 25 3 6 53 1 16 Ward No. 16 1 1 21 46 17 Ward No. 17 10 1 20 2 18 Ward No. 18 1 22 2 2 1 52 3 19 Ward No. 19 4 15 4 55 1
20 Ward No. 20 3 1 18 3 2 2 43 4
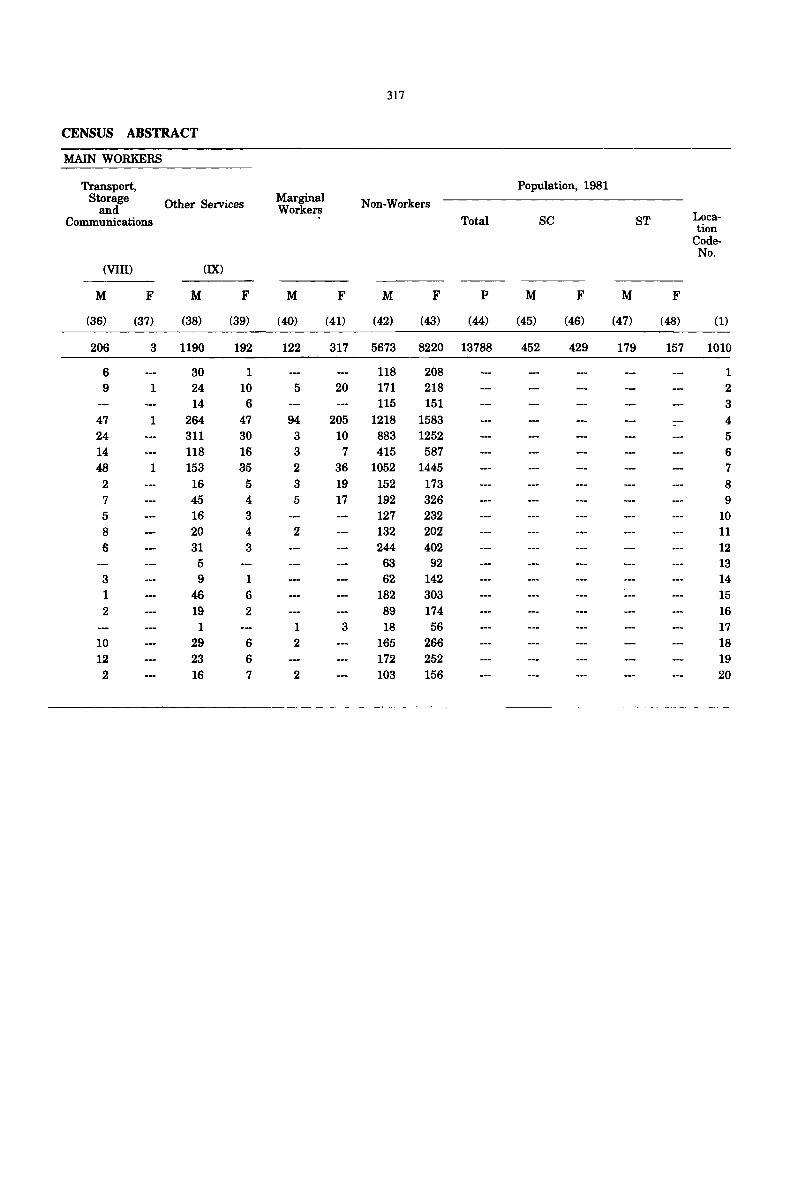
317
CENSUS ABSTRACT
MAIN WORKERS
Transport, Population, 1981 Storage Marginal Non-Workers and Other Services Workers
Communications Total SC ST Loca-tion
Code-No.
(VIII) (IX)
M F M F M F M F P M F M F
(36) (37) (38) (39) (40) (41) (42) (43) (44) (45) (46) (47) (48) (1)
206 3 1190 192 122 317 5673 8220 13788 452 429 179 157 1010
6 30 1 118 208 1 9 1 24 10 5 20 171 218 2
14 6 115 151 3 47 1 264 47 94 205 1218 1583 --- 4 -
24 311 30 3 10 883 1252 5 14 118 16 3 7 415 587 6 48 1 153 35 2 36 1052 1445 7 2 16 5 3 19 152 173 8 7 45 4 5 17 192 326 9 5 16 3 127 232 10 8 20 4 2 132 202 11 6 31 3 244 402 12
5 63 92 13 3 9 1 62 142 14 1 46 6 182 303 15 2 19 2 89 174 16
1 1 3 18 56 17 10 29 6 2 165 266 18 12 23 6 172 252 19 2 16 7 2 103 156 20
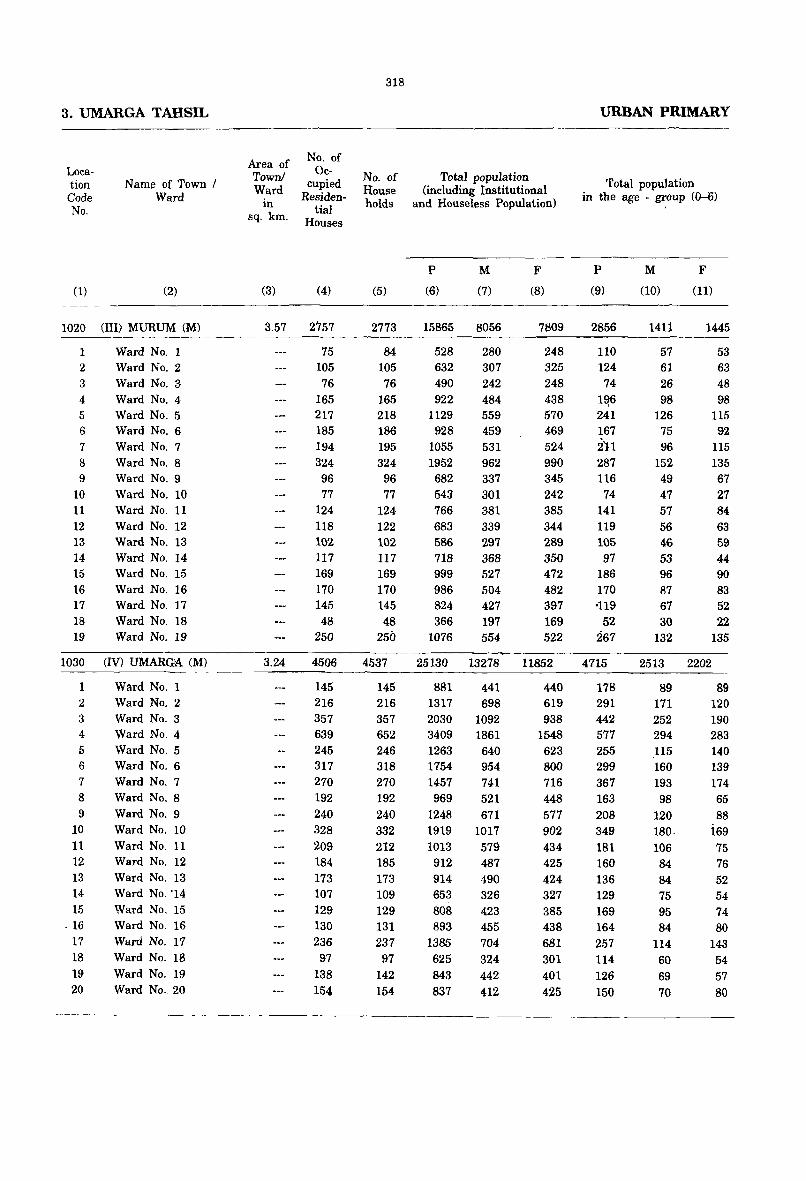
3. UMARGA TAHSIL
Location Code No.
N arne of Town I Ward
(1) (2)
1020 (Ill) MURUM (M)
1 2
3 4 5 6 7
8 9
10 11 12 13 14 15 16 17 18 19
Ward No.1 Ward No.2 Ward No.3 Ward No.4 Ward No.5 Ward No.6 Ward No.7 Ward No.8 Ward No.9 Ward No. 10 Ward No. 11 Ward No. 12 Ward No. 13 Ward No. 14 Ward No. 15 Ward No. 16 Ward No. 17 Ward No. 18 Ward No. 19
1030 (IV) UMARGA (M)
1 2
3 4
5 6 7 8 9
10 11 12 13 14 15
.16 17 18 19 20
Ward No.1 Ward No.2 Ward No.3 Ward No.4 Ward No.5 Ward No.6 Ward No.7 Ward No.8 Ward No.9 Ward No. 10 Ward No. 11 Ward No. 12 Ward No. 13 Ward No. '14 Ward No. 15 Ward No. 16 Ward No. 17 Ward No. 18 Ward No. 19 Ward No .. 20
Area of Town! Ward
in sq. krn.
No. of Oc
cupied Residen
tial Houses
(3) (4)
3.57 2'757
3.24
75 105 76
165 217 185 194 324 96 77
124 118 102 117 169 170 145 48
250
4506
145 216 357 639 245 317 270 192 240 328 209 184 173 107 129 130 236 97
138 154
318
No. of Rouse holds
(5)
2773
84 105 76
165 218 186 195 324
96 77
124 122 102 117 169 170 145 48
250
4537
145 216 357 652 246 318 270 192 240 332 212 185 173 109 129 131 237
97 142 154
Total population (including Institutional
and Houseless Population)
P M (6) (7)
15865 8056
528 632 490 922
1129 928
1055 1952 682 543 766 683 586 718 999 986 824 366
1076
280 307 242 484 559 459 531 962 337 301 381 339 297 368 527 504 427 197 554
25130 13278
881 441 1317 698 2030 1092 3409 1861 1263 640 1754 954 1457 741 969 521
1248 671 1919 1017 1013 579 912 487 914 490 653 326 808 423 893 455
1385 704 625 324 843 442 837 412
F
(8)
7809
248 325 248 438 570 469 524 990 345 242 385 344 289 350 472 482 397 169 522
11852
440 619 938
1548 623 800 716 448 577 902 434 425 424 327 385 438 681 301 401 425
URBAN PRIMARY
Total population in the age - group (0-0)
P
(9)
2856
110 124 74
1~6 241 167 2'11 287 116
74 141 119 105 97
186 170 ·119
52 267
4715
178 291 442 577 255 299 367 163 208 349 181 160 136 129 169 164 257 114 126 150
M F
(10) (11)
1411 1445
57 61 26 98
126 75 96
152 49 47 57 56 46 53 96 87 67 30
132
2513
89 171 252 294 115 160 193 98
120 180. 106 84
84 75 95 84
114 60 69 70
53 63 48 98
115 92
115 135 67 27 84
63 59 44 90 83 52 22
135
2202
89 120 190 283 140 139 174 65 88
169 75 76 52 54 74 80
143 54 57 80
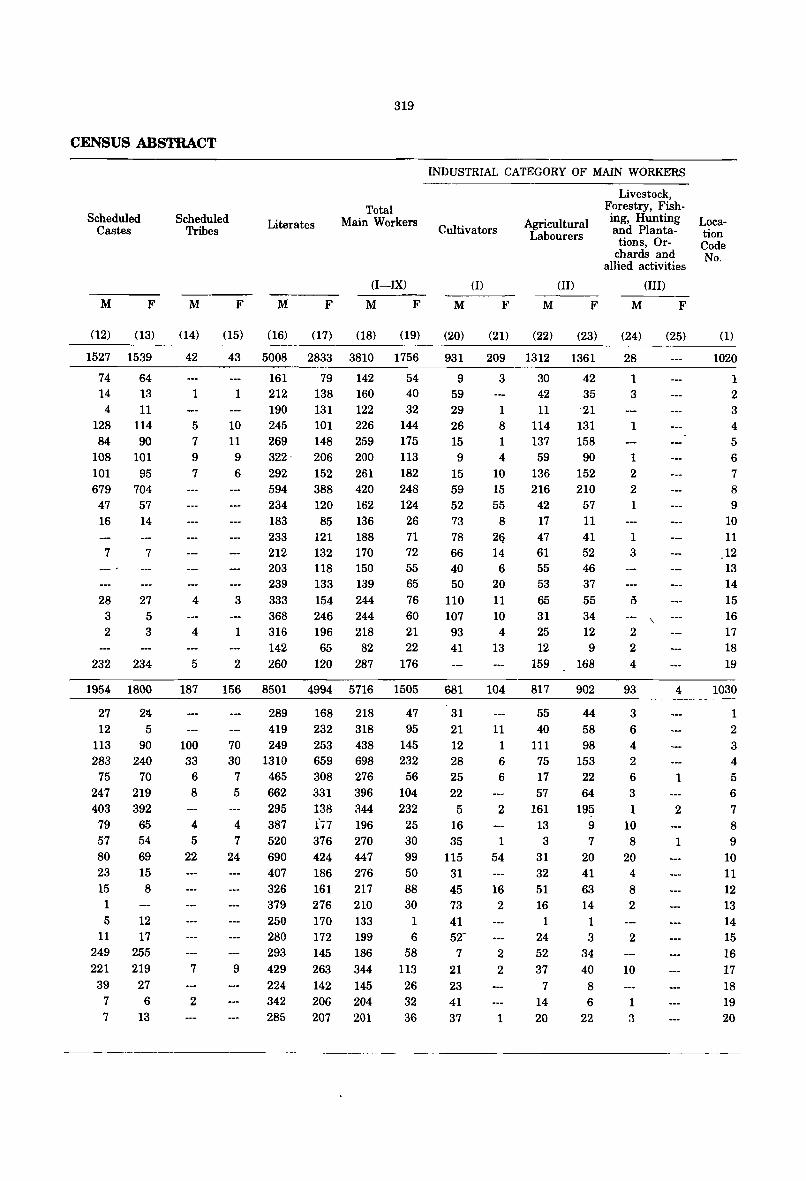
CENSUS ABSTRACT
Scheduled Castes
M F
Scheduled Tribes
M F
Literates
M F
319
Total Main Workers
(I-IX)
M F
INDUSTRIAL CATEGORY OF MAIN WORKERS
Cultivators
(I)
M F
Agricultural Labourers
(II)
M F
Livestock, Forestry, Fishing, Hunting and Plantations, Or
chards and allied activities
(III)
M F
(12) (13) (14) (15) (16) (17) (18) (19) (20) (21) (22) (23) (24) (25)
1527 1539
74 64 14 13 4 11
128 114 84 90
108 101 101 95 679 704
47 57 16 14
7 7
28 3
2
27 5 3
232 234
1954 1800
27 12
2l!
5 113 90 283 240
75 70 247 219 403 392
79 65 57 54 80 23 15 1
69 15 8
5 12 11 17
249 255 221 219
39 27 7 7
6 13
42
1
5 7 9 7
4
4
5
187
100 33
6 8
4 5
22
7
2
43 5008 2833 3810 1756
161 79 142 54 1 212 138 160 40
190 131 122 32 10 245 101 226 144 11 269 148 259 175
9 322 . 206 200 113
6 292 152 261 182 594 388 420 248 234 120 162 124 183 85 136 26 233 121 188 71 212 132 170 72 203 118 150 55
3
1
2
239
333 368 316 142 260
133 139 154 244 246 244 196 218 65 82
120 287
65 76 60 21 22
176
156 8501 4994 5716 1505
289 419
70 249 30 1310
7 465 5 662
295 4 387 7 520
24
9
690 407 326 379 250 280 293
429 224 342 285
168 218 232 318 253 438 659 698 308 276 331 396 138 344 1,7 196 376 270 424 447 186 276 161 217 276 210 170 133 172 199 145 186 263 344 142 145 206 204 207 201
47 95
145 232
56 104 232
25 30 99 50 88 30
1 6
58 113 26 32 36
931 209 1312 1361
9 3 30 42 59 42 35 29 1 11 '21 26 8 114 131 15 1 137 158 9 4 59 90
15 10 136 152 59 15 216 210 52 55 42 57 73 8 17 11 78 2Q 47 41 66 14 61 52 40 6 55 46 50
110 107
93 41
20
11 10 4
13
681 104
31 21 12 28 25 22
5 16 35
115 31 45 73 41 52-
7 21
23 41 37
11 1 6 6
2
1
54
16 2
2 2
1
53 65 31 25 12
159
817
55 40
111 75 17 57
161 13 3
31 32 51 16
1 24 52
37 7
14 20
37 55 34 12 9
168
902
44 58 98
153 22 64
195 9 7
20 41 63 14
1 3
34 40
8 6
22
28
1 3
1
1 2 2 1
1 3
5
2 2
4
93
3 6 4 2 6 3 1
10 8
20 4 8 2
2
10
1 3
4
1
2
1
Location Code No.
(1)
1020
1 2
3 4
5 6 7
8 9
10 11 12 13 14
15 16 17 18
19
1030
1 2 3 4 5 6
7 8 9
10 11 12 13 14 15 16 17 18 19 20
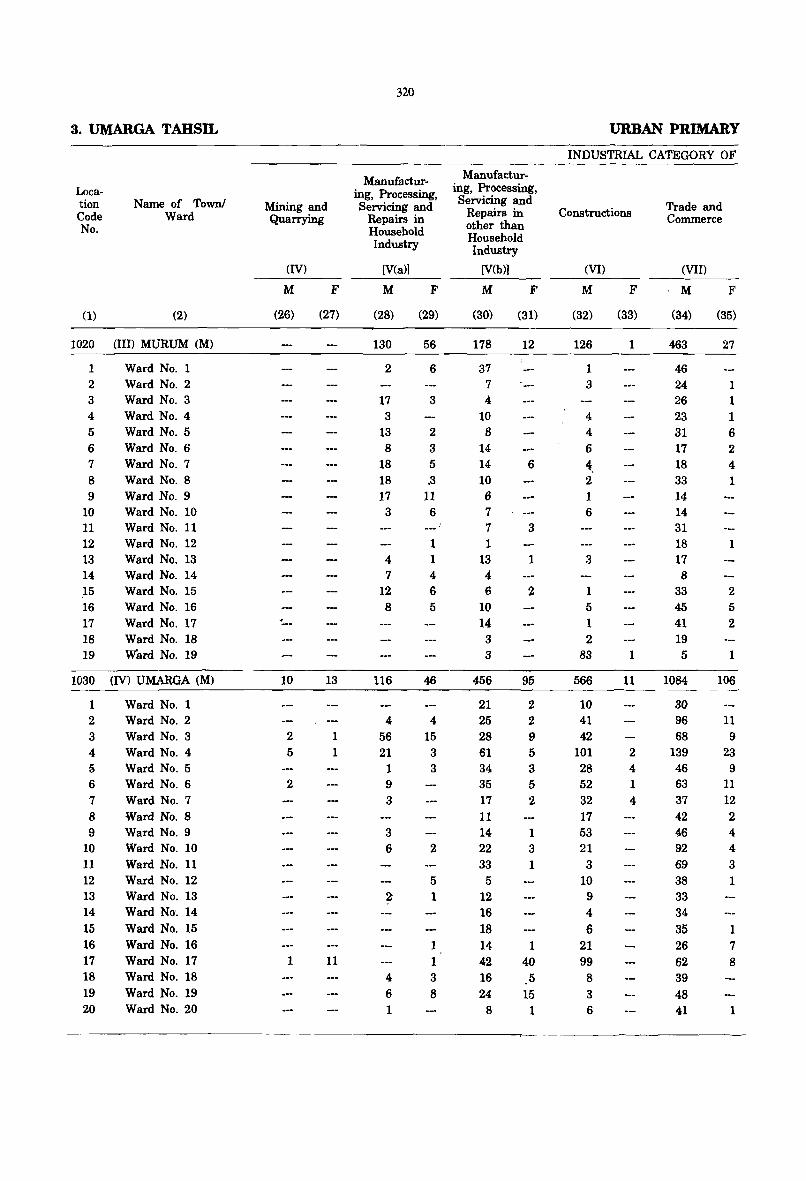
3. UMARGA TAHSIL
Location Code No.
(1)
Name of Town! Ward
(2)
1020 (III) MURUM (M)
1 2 3 4 5 6 7 8 9
10 11 12 13 14 15 16 17 18 19
Ward No.1 Ward No.2 Ward No.3 Ward No.4 Ward No.5 Ward No.6 Ward No.7 Ward No.8 Ward No.9 Ward No. 10 Ward No. 11 Ward No. 12 Ward No. 13 Ward No. 14 Ward No. 15 Ward No. 16 Ward No. 17 Ward No. 18 Ward No. 19
1030 (IV) UMARGA (M)
1 2 3 4 5 6 7 8 9
10 11 12 13 14 15 16 17 18
19 20
Ward No.1 Ward No.2 Ward No.3 Ward No.4 Ward No.5 Ward No.6 Ward No.7 Ward No.8 Ward No.9 Ward No. 10 Ward No. 11 Ward No. 12 Ward No. 13 Ward No'. 14 Ward No. 15 Ward No. 16 Ward No. 17 Ward No. 18 Ward No. 19 Ward No. 20
Mining and Quarrying
(IV)
M
(26)
10
2 5
2
1
F
(27)
13
1
1
11
320
Manufacturing, Processing, Servicing and
Repairs in Household Industry
[V(a)]
M
(28)
130
2
17 3
13 8
18 18 17 3
4 7
12 8
116
4 56 21 1 9 3
3 6
4 6 1
F
(29)
56
6
3
2 3 5 .3
11 6
1 1 4 6 5
46
4 15 3 3
2
5 1
1 1 3 8
Manufacturing, Processing, Servicing and
Repairs in other than Household Industry
[V(b)]
M
(30)
178
37 7 4
10 B
14 14 10 6 7 7 1
13 4 6
10 14
3 3
456
21 25 28 61 34 35 17 11 14 22 33
5 12 16 18 14 42 16 24
8
F
(31)
12
6
3
1
2
95
2 2 9 5 3 5 2
1 3 1
1 40
5 15
1
URBAN PRIMARY
INDUSTRIAL CATEGORY OF
Constructions
(VI)
M
(32)
126
1 3
4 4 6 4, 2 1 6
3
1 5 1 2
83
566
10 41 42
101 28 52 32 17 53 21
3 10 9 4
6 21 99
8
3 6
F
(33)
1
1
11
2 4 1 4
Trade and Commerce
(VII)
M
(34)
463
46 24 26 23 31 17 18 33 14 14 31 18 17 8
33 45 41 19 5
1084
30 96 68
139 46 63 37 42 46 92 69 38 33 34
35 26 62 39 48 41
F
(35)
27
1 1 1 6 2 4 1
1
2 5 2
1
106
11 9
23 9
11 12 2 4 4 3 1
1 7 8
1

321
CENSUS ABSTRACT --- ----~.---------------------------
:MAJ N WORKlmS
Transport, Stornge
and Communications
(VIII)
M
(36)
F
Other Services
(IX)
M
(38) (39)
Marginal Workers
M
(40)
F
(41)
Non-Workers
M
(42)
F
{43)
Total
P
(44)
Population, 1981
M
(45)
sc
F
(46)
M
(47)
ST
(48)
Location
Code-No.
(1) -.--_-_._ ---.-------.-----.-.------.. --.-.--------~---
148
1 3
J.8 '1
W
17 7 9
14
3 8 6
3 17
1 12
593
14 31 59 67 19 41 44 18 12 49 32 17 24 15 19 29 17 19 28 39
2
1
1 .
494
16 :'::1 32 27 44 74
7 10 21 1-5
9 6
35 23 2
21
5 1300
1
1
1
2
54 54 56
199 100 112 44 69 96 .91 72
43 39 22 43
37 55 29 39 46
88
3 4 6
4 8
14 4
is J 1 1
4 1 4
,5
3
6
219
1 9
11
39 8
23 15 14 16 15 5 3
13
2 12 11
8 3
11
50
4
3
1
14
25
2
19
5
1
1 10
1
1
.216 4196 5837 13451 1394 1270 50 53 1020
1 26
27 4
25 11
105 1
15
138 146 120
258 300 255 27u 5:i!1 175 165 192
155 147 229 258 260 207 115 267
194 284
216 294 394 330 342 '/15 21'j
216 289 261 234 285 291 421 361 147 346
'. -...,.
1 2 3 4 5 6 7
8 9
10 11 12 13 14 15 16 17 18 19
39 7543 10308, 16087 1124 1078 130 121 1030
223 393 4 380 520
654 793 9 1158 1307 3
6
2
364 55-7 397 325 400 560 303 269
280 193 224 269 359 179 238 211
56.4 696 478. 423 547 789 383 337 394 326 ' 379 380 566 275 369 389
-----------------------------1 2
3 4 5 6 7 8 9
10 11 12 13 14 15 16 17 18 19 20
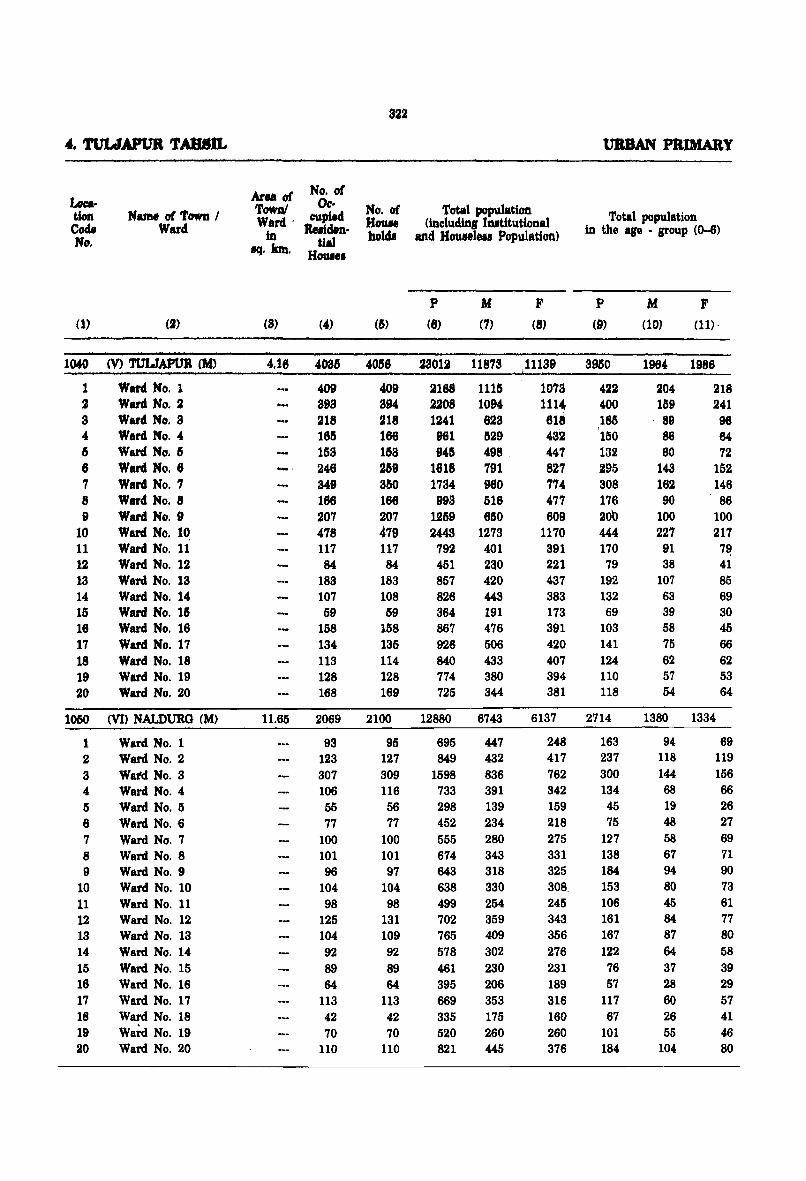
toe. tion Code No.
Name of' Town / Ward
(1) (2)
1040 (v) TUlJAPUB (M)
1 2 a 4 6 6 7 8 9
10 11 12 13 14 15 16 17 18 19 20
Ward No.1 Ward No, 2 Ward. No. a Warci No.4 Ward No.6 Ward No.6 Ward No.7 Ward No.8 Warci No.9 Ward No. 1~ Warci No. 11 Warci No. 12 Warci No. 13 Ward No. 14 Warci No. 16 Ward No. 16 Ward No. 17 Warci No. 18 Ward No. 19 Ward No. 20
1050 (VI) NALDURG (M)
1 2 3 4 5 6 7 8 9
10 11 12 13 14 15 16 17 18 19 20
Warci No.1 Ward No.2 Watd No.3 Ward No.4 Ward No.5 Ward No.6 Ward No.7 Ward No.8 Ward No.9 Ward No. 10 Ward No. 11 Ward No. 12 Ward No. 13 Warci No. 14 Ward No. 15 Ward No. 16 Ward No. 17 Ward No. 18 Wai-d No. 19 Ward No. 20
Area of' Town! Ward'
in .q. km.
No. of' 01:.
cupiecl Re.iden·
tdJ Houe.
822
No. of Houe hoIdI
(3) (4) (5)
4.16 40315 40&6
409 393 218 186 153 246 349 166 207 478 117 84
183 107 59
158 134 113 128 168
409 394 218 166 11SS 259 alSO 166 207 479 117 84
183 108 59
158 135 114 128 169
11.65 2069 2100
93 123 307 106 55 77
100 101 96
104 98
125 104 92
89 64
113 42 70
110
95 127 309 116 56 77
100 101 97
104 98
131 109 92 89 64
113 42 70
110
Total populatiott (includin, tl1ltitutional
and Houlel ... Population)
P M F (6) (7) (8)
23012 11873 .11139
2188 1115 2208 1094 1241 623 961 629 945 498 .
1618 791 1734 960 993 516
1259 650 2443 1273
792 401 451 230 857 420 826 443 364 191 867 476 926 506 840 433 774 380 725 344
12880 6743
695 849
1598 733 298 452 555 674 643 638 499 702 765 578 461 395 669 335
520 821
447 432 836 391 139 234 280 343
318 330 254 359 409 302 230 206 353 175 260 445
1073 11l~ 618 432 447 827 774 477 809
1170 391 221 437 383 173 391 420 407 394 381
6137
248 417 762 342 159 218 275 331 325 308 245 343 356 276 231 189 316 160 260 376
Total population in the are . sroup (0-6)
P
(9)
39M
422 400 185 150 132 295 308 176 20b 444 170 79
192 132 69
103 141 124 110 118
2714
163 237 300 134 45 75
127 138 184 153 106 161 167 122 76 57
117 67
101 184
M F (10) (11)·
1964 1986
204 169
. 89 88 80
143 162 90
100 227
91 38
107 63 39 58 75 62 57 54
218 241 96 64 72
152 146
- 86 100 217 7~ 41 85 69 30 45 66 62 53 64
1380 1334
94 118 144 68 19 48 58 67 94 80 45 84 87 64 37 28 60 26 55
104
69 119 156 66 26 27 69 71 90 73 61 77 80 58 39 29 57 41 46 80
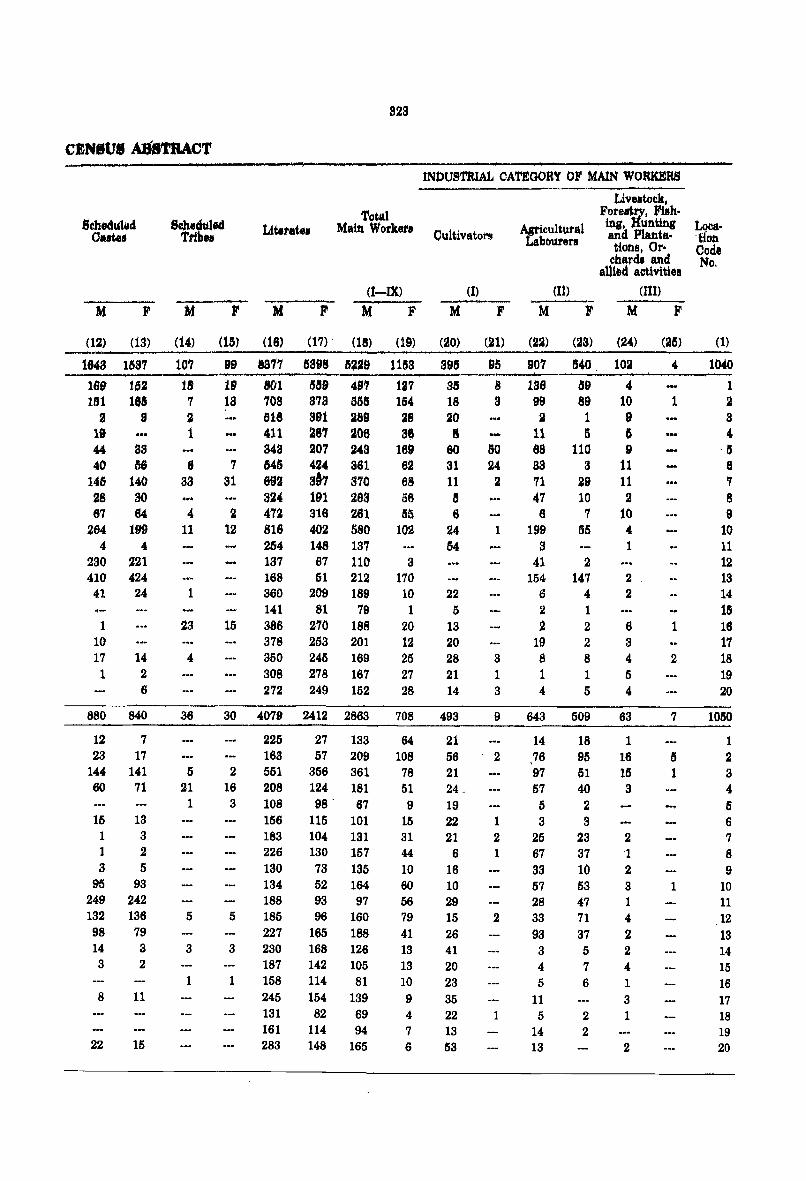
323
eEMIVI ABSTRAcT
M F
(12) (is)
1843 1&37
169 152 1&1 185
a 9 19 44 83 40 &6
146 14('J 28 ao 67 64
264 199 4 4
230 221 410 424 41 24
1 10 17 14 1 2
6
880 840
12 7 23 17
144 141 60 71
15 13 1 3 1 2 3 5
95 93 249 242 132 136 98 79 14 3 3 2
8 11
22 15
Scheeluled Tttbett Literate.
Total Main Workerl
M F M (I-IX)
M F
(14)
107 18 7 2 1
., 33 .... 4
11
1
23
4
36
5 21
1
5
3
1
(1&) (18)
99 SS17
19 801 18 708
518 411 843
7 64& 31 692
324 2 472
12 816 264 137 168 360 141
15 386 378 350 308 272
30 4079
(17) (18) (19)
15398 5229 11&3
lStf9 497 127 878 51515 1Ii4 891 289 28 287 206 ~ 207 248 169 424 861 62 S87 370 68 191 283 56 316 281 55 402 580 102 148 137 67 110 3 51 212 170
209 189 10 81 79 1
270 188 20 253 201 12 245 169 25 278 167 27 249 152 28
2412 2863 708
225 27 133 64 163 57 209 108
2 551 356 361 78 16 208 124 181 51 3 108 98 - 67 9
156 115 101 15 183 104 131 31 226 130 157 44 130 73 135 10 134 52 164 60 188 93 97 56
5 185 96 160 79 227 165 188 41
3 230 168 126 13 187 142 105 13
1 158 114 81 10 245 154 139 9 131 82 69 4 161 114 94 7 283 148 165 6
INOUSTRIAL CAT1!lGORY or MAlN W01UCERS
Liv •• tack, Fare8~ry. Fish· ing, Hunting and Plan.tations, Or
charda and alUed activitiell
Oultivators
M F
(20)
398
3/5 18 20 8
80 3l 11 5 6
24 54
22 5
13 20 28 21 14
493
21 56 21
19 22 21
6 16 10 29 15 26 41 20 23 35 22 13 53
(21)
95
8 3
50 24 2
1
3 1 3
9
2
1 2 1
2
1
Agricultural fAbouters
(Il)
M F
(22)
907 136 99 2
11 88 88 71 47 6
199 S
41 154
6 2 2
19 8 1 4
643
14 ,76 97 57 5 3
25 67 33 57 28 33 93 3 4 5
11 5
14 13
(23)
1540
59 89 1 5
110 3
29 10 7
55
2 147
4 1 2 2 8 1 5
509
18 95 51 40 2 3
23 37 10 53 47 71 37 5 7 6
2 2
(Ill)
M F
(24)
102
" 10 9 I)
9 11 11 2
10
1
2 2
6 3 4 5 4
63
1 16 15 3
2 1 2 3 1 4 2 2 4 1 3 1
2
(25)
1
...
1
2
7
5 1
1
Loea-tion Code No.
1040
1 2 3
" -5 6 7 8 9
10 11 12 13 14 15 16 17 18 19 20
1050
1 2 3 4 5 6 7 8 9
10 11
12 13 14 15 16 17 18 19 20
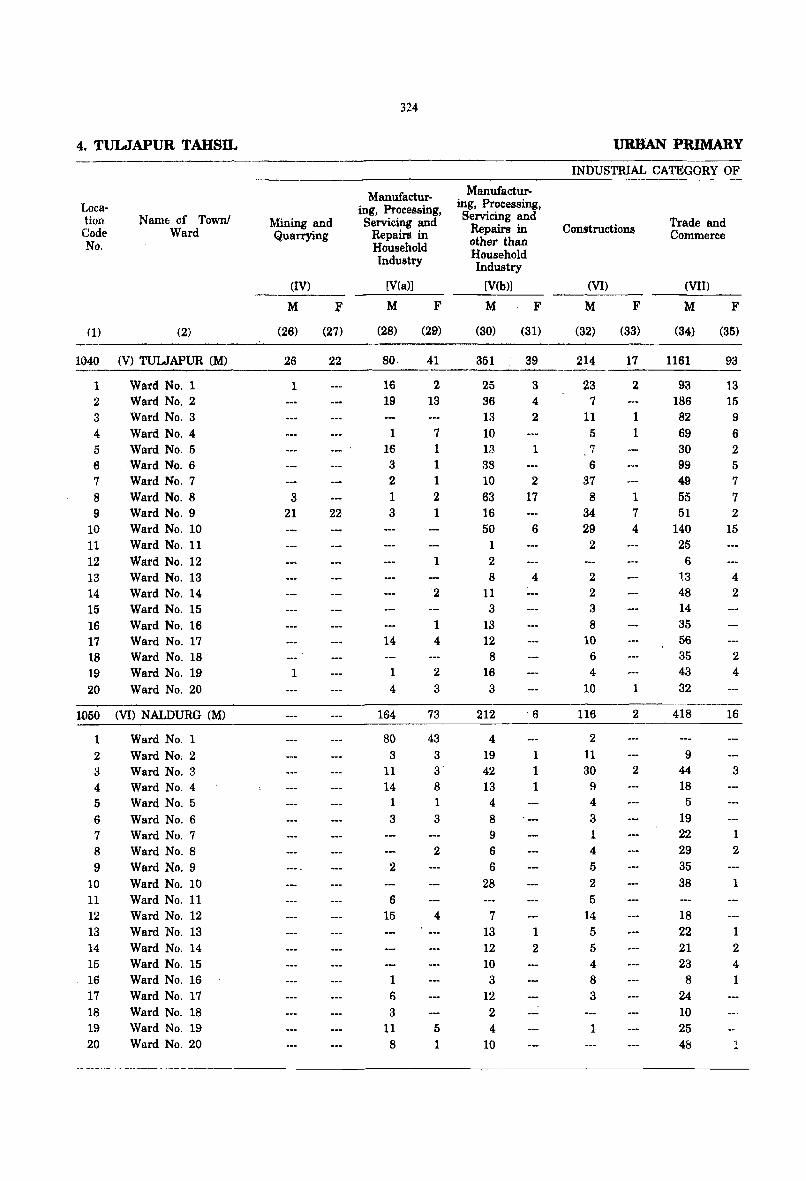
4. TULJAPUR TAHSIL
Location Code No.
Name of Town! Ward
(1) (2)
1040 (V) TUWAPUR (M)
1 Ward No.1 2 Ward No.2 3 Ward No.3 4 Ward No.4 5 Ward No.5 6 Ward No.6 7 Ward No.7 8 Ward No.8 9 Ward No.9
10 Ward No. 10 11 12 13 14 15 16 17 18 19 20
Ward No. 11 Ward No. 12 Ward No. 13 Ward No. 14 Ward No. 15 Ward No. 16 Ward No. 17 Ward No. 18 Ward No. 19 Ward No. 20
1050 (VI) NALDURG (M)
1 2 3 4 5 6 7 8 9
10 11 12 13 14 15 16 17 18 19 20
Ward No.1 Ward No; 2 Ward No.3 Ward No.4 Ward No.5 Ward No.6 Ward No.7 Ward No.8 Ward No.9 Ward No. 10 Ward No. 11 Ward No. 12 Ward No. 13 Ward No. 14 Ward No. 15 Ward No. 16 Ward No. 17 Ward No. 18 Ward No. 19 Ward No. 20
324
URBAN PRIMARY
INDUSTRIAL CATEGORY OF ---------------_----------------Manufactur
ing, Processing, Mining and Servicing and Qua~g Repaks in
Household Industry
(IV) [V(a)]
M F M F
(26)
26
1
3 21
1
(27)
22
22
(28) (29)
80· 41
16 2 19 13
1 7 16 1 3 1 2 1 1 2 3 1
14
1
4
164
80 3
11 14
1 3
2
6 15
1 6 3
11 8
1
2
1 4
2
3
73
43 3 3
8 1
3
2
4
5 1
Manufacturing, Processing, Servicing and
Repairs in other than Household Industry
[V(b)]
M F
(30)
351
25 36 13 10 13 38 10 63 16 50
1 2 8
11 3
13 12
8 16 3
(31)
39
3 4 2
1
2 17
6
4
Constructions
(VI)
M F
(32)
214
23 7
11 5 7 6
37 8
34 29
2
2 2 3
8 10
6 4
10
(33)
17
2
1 1
1 7 4
1
212 . 6 116 2
4 19 42 13 4 8 9 6 6
28
7 13 12 10 3
12 2 4
10
-----
1 1 1
1 2
2 11 30
9 4
3
1 4 5 2 5
14 5 5 4 8 3
1
2
Trade and Commerce
(VII)
M F
(34)
1161
93 186 82 69 30 99 49 55 51
140 25
6 1.3 48 14 35 56 35 43 32
418
9 44 18 5
19 22 29
35 38
18 22
21 23 8
24 10 25 48
(35)
93
13 15 9 6 2 5 7
7 2
15
4 2
2 4
16
3
1 2
1
1 2 4 1
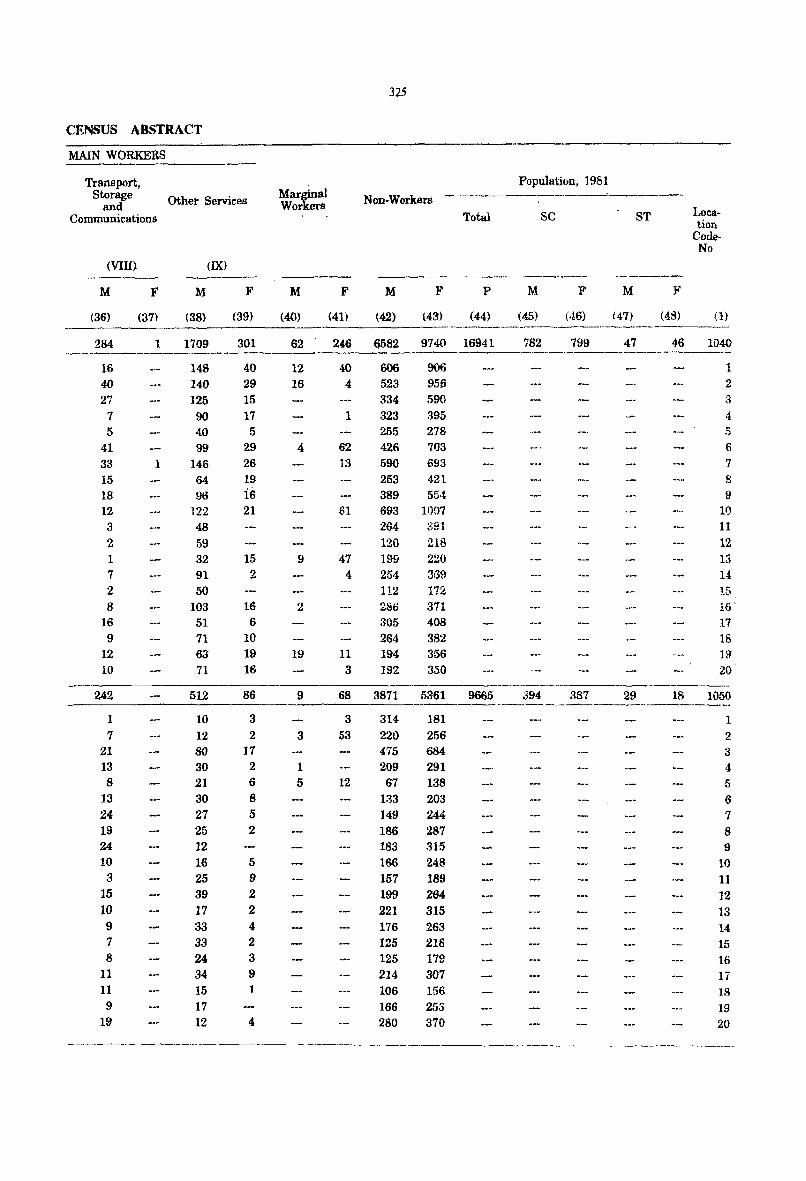
CENSUS ABSTRACT
MAIN WORKERS
Transport, Storage
and Communications
Other Services
(VIII)
M F
(36) (37)
M
(38)
(IX)
F
(39)
284 1. 1709 301 ------------_----_-----16 40
27 7 5
41 33 15 18 12
3
2 1 7 2 8
16 9
12 10
1
148 140 125 90 40 99
146 64 96
122 48 59 32 91 50
103 51 71 63 71
242 512 -------1 7
21 13 8
13 24 19 24 10
3 15 10
9
7 8
11 11 9
19
10 12 80 30 21 30 27 25 12 16 25 39 17 33 33 24 34
15 17 12
40 29 15 17 5
29
26 19 16 21
15 2
Ig 6
10 19 16
86
3 2
17 2 6 8 5 2
5 9 2 2 4 2 3 9
4
Marginal Workers
M
(40)
62
12 16
4
9
2
19
9
3
1 5
F
(41)
32.5
Non-Workers --
M
(42)
F
(43)
Total
P
(44)
246 6582 9740 16941
40 4
1
62 13
61
47 4
11
3
606 523 334 323 255
426
906 956 590 395 278 703
590 693
253 421 389 554 693 1007 264 120 199 254 112 286 305 264 194 192
891 218 220 369 1'12 371 408 382
356 350
68 3871 5361 9665
3 53
12
314 220 475 209 67
133 149 186 183 166 157 199 221 176 125 125 214 106 166 280
181 256 684 291 138 203 244 287 315 248 189 264 315 263 218 17g 307
156 253 370
Population, ]981
SC
M
(45)
782 799
ST
M
147)
47
F
(48)
Location
CodeNo,
m 46 1040 --_._------------
394 387 29
1 2 3 4 5 6 7 8 9
10 11
12 13 14 15 H, ' 17 18 19 20
18 1050
1 2 3 4
5 6 7 8 9
10 11 12 13 14 15 16 17 18 19 20
------------------------------------------------_.
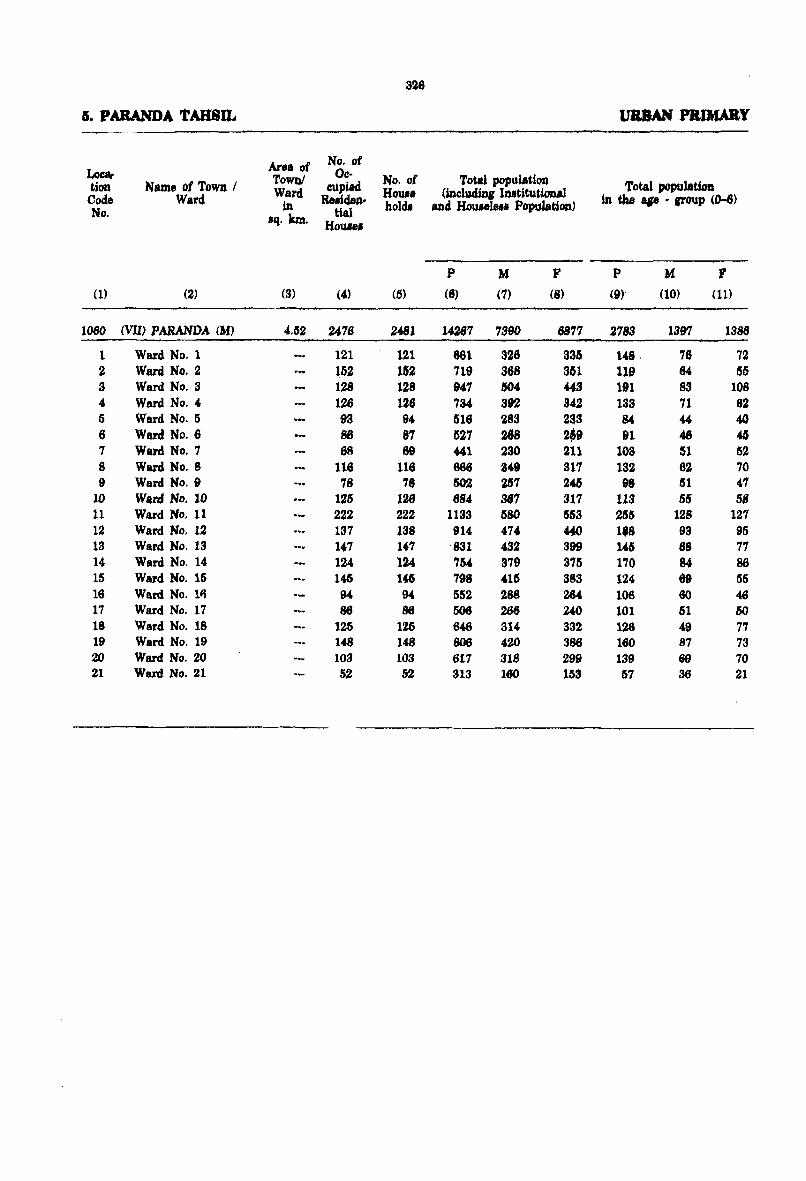
326
I. PARANDA tAll8IL l1BJJAN PRIMARY
Area of No. of Locar ToWIll Dc- No. of Totil population tiOD Name of Town I Ward eupied Hou .. (including butitutioul Total population Code Ward in Retiden· hoIdl and HoUJelell Population) in the qe . Il'OUp (D-8) No. tiel .q. km. Houae.
p M F P M F (1) (2) (3) (4) (5) (6) (7) (8) (9)' (10) (11)
1080 (VII) PABANDA (M) 4.52 2476 2481 14287 7390 6877 2783 1397 1388
1 Ward No.1 121 121 661 326 335 148. 76 72 2 Ward No.2 .52 152 719 36B 361 119 64 ISIS 3 Ward No.3 128 128 941 $04 U8 191 83 108 4 Ward No.4 126 126 734 392 842 133 71 62 5 Ward No.5 93 94 516 283 ZaS S4 44 40 6 Ward No.6 88 81 527 268 Z~9 91 48 43 7 Ward No.7 68 69 441 230 211 103 51 52 8 Ward No.8 116 116 666 34' 317 132 62 70 9 Ward No.9 78 78 502 237 245 98 lSI 4/1
10 Ward No. 10 1:15 128 684 387 317 118 66 58 11 Ward No. 11 222 222 1133 580 553 255 128 127 12 Ward No. 12 137 138 914 474 «0 Its 93 95 13 Ward No. 13 147 147 831 432 399 146 68 77 14 Ward No. 14 1~4 124 754 379 375 170 84 86 15 Ward No. 15 145 ItS 198 416 383 124 6t 65 16 Ward No. lli 94 94 552 288 264 106 60 46 11 Ward No. 17 86 86 506 266 Z40 101 51 50 18 Ward No. 18 125 125 646 314 332 128 49 77 19 Ward No. 19 148 148 806 420 386 160 87 73 20 Ward No. 20 103 103 617 318 299 139 69 70 21 Ward No. 21 52 52 313 160 153 57 36 21
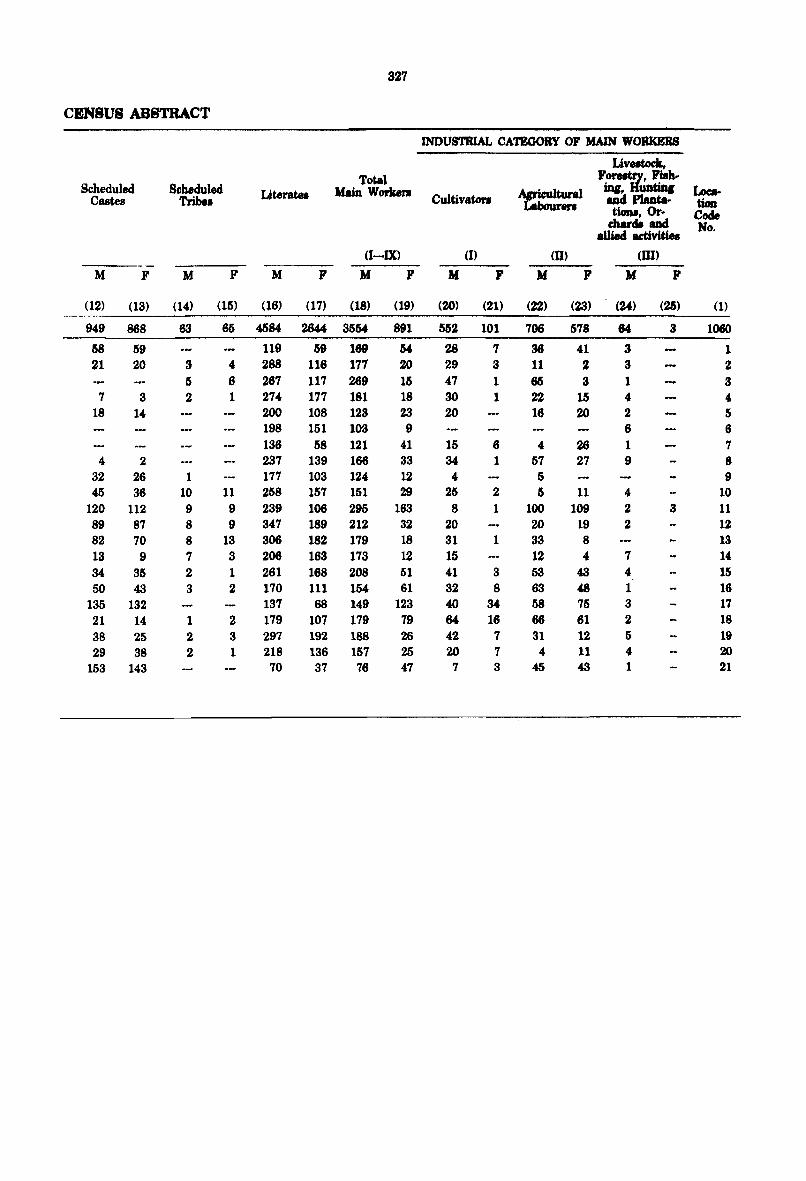
327
CENSUS ABSTRACT
INDUSTRIAL CATEGORY OF MAIN WORKERS
Livettoek, Total FO~'
Scheduled Scheduled Literatea Main Workerw :..~al m" . toea-
Castes Tribe. Cultivatot'l and Plante· tiDD tionl. Or· Code
eharc» and No. allW aetivitiel
(I-IX) (l) (D) (W)
M F M F M F M F M F M F M F
(12) (13) (14) (16) (16) (17) (18) (19) (20) (21) (n) (23) (U) (26) (1)
949 868 63 65 4684 2844 3554 891 562 101 706 578 64 3 1060
58 59 119 59 169 54 28 7 36 41 3 1 21 20 3 4 288 116 177 20 29 3 11 2 3 2
5 6 267 117 269 16 47 1 66 3 1 3 7 3 2 1 274 177 181 18 30 1 22 15 4 4
18 14 200 108 123 23 20 16 20 2 5 198 151 103 9 6 6 136 58 121 41 15 6 4 26 1 7
4 2 237 139 166 33 34 1 57 27 9 8 32 26 1 177 103 124 12 4 5 9 46 36 10 11 258 157 151 29 25 2 5 11 4 10
120 112 9 9 239 106 295 163 8 1 100 109 2 3 11 89 87 8 9 347 189 212 32 20 20 19 2 12 82 70 8 13 306 182 179 18 31 1 33 8 13 13 9 7 3 206 163 173 12 15 12 " 7 If 34 35 2 1 261 168 208 51 41 3 53 43 4 15 50 43 3 2 170 111 154 61 32 8 63 48 1 16
135 132 137 68 149 123 40 34 68 75 3 17 21 14 1 2 179 107 179 79 64 16 66 61 2 18 38 25 2 3 297 192 188 26 42 7 31 12 5 19 29 38 2 1 218 136 157 25 20 7 " 11 " 20
153 143 70 37 76 47 7 3 45 43 1 21
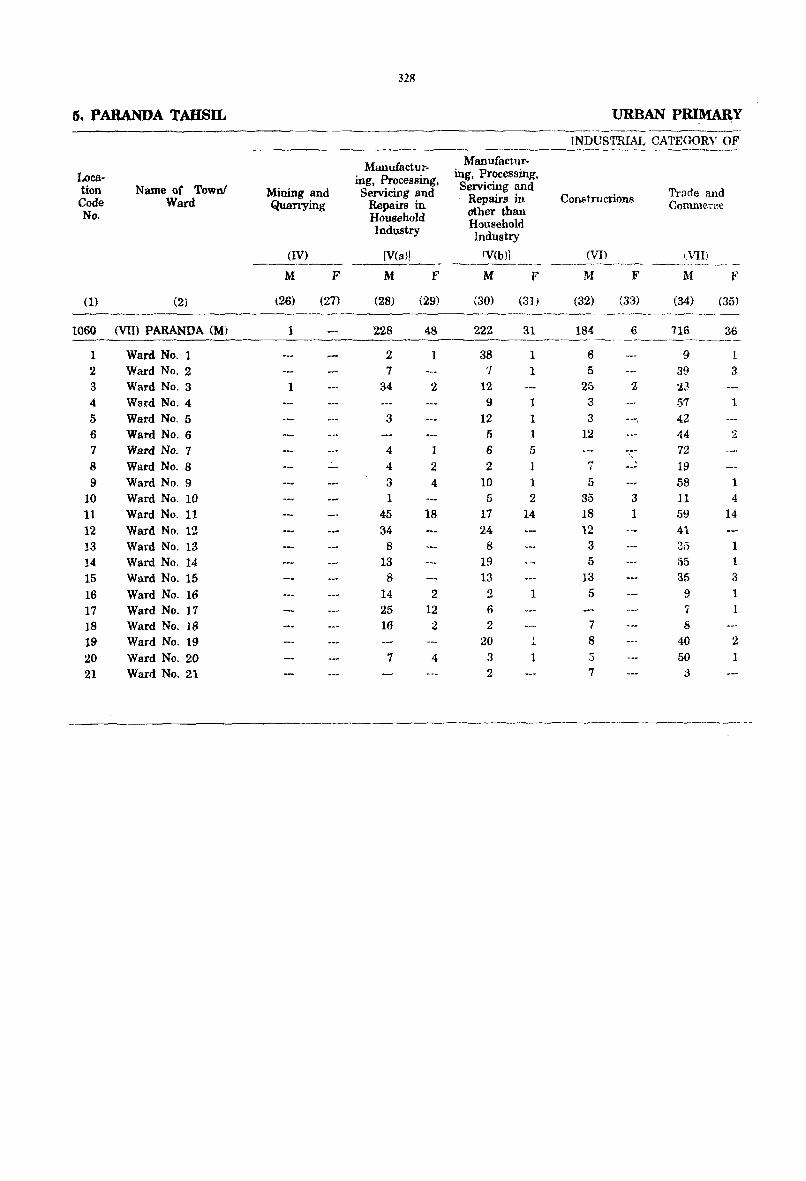
32R
5. PARANDA TAHSIL URBAN PR:IMAnY ______ ._~_~ __ 4 ___ ~ ____
INDDS'I'RIAI.I CA1'E('zt)RY OF -----_---------~----~-------Manufactur- Manufactllr-
Loca- ing, Processing, ing, Processing, t.ion Name of Town! Mining and Servicing and
Servicing and Trade and Code Ward Quarrying Repairs in Repairs in Constru ctions Commerce No. Household other than
Industry Household Industry
(IV) [V(a)] N(b)1 (VI) (VIl) - ----_ ... _----_- ------~~------ -_--- ---- ~- -M F M F M F M F M F
(1) (2) (26) (27) (28) (29) (30) (31 ) (32) (33) (34) (35) ------ ----- ---------------
1060 (VIl) PARANDA (M) 1 228 48 222 31 184 6 716 36 ---_.-- ----------------.. -~-1 Ward No.1 2 1 38 1 6 9 1 2 Ward No.2 7 'I 1 5 39 3 3 Ward No.3 1 34 2 12 25 2 :1.2-4 Ward No.4 9 1 3 57 1
5 Ward No.5 3 12 1 3 --, 42 6 Ward No.6 5 ] 12 44 2 7 Ward No.7 4 1 6 5 72 8 Ward No.8 4 2 2 N
, 19 -- I
9 Ward No.9 3 4 10 1 5 58 1 10 Ward No. 10 1 5 2 35 3 11 4 11 Ward No. 11 45 18 17 14 18 1 59 14
12 Ward No. 12 34 24 12 41 13 Ward No. 13 8 8 3 '>1' ".J 1
14 Ward No. 14 13 19 5 55 1
15 Ward No. 15 8 13 13 35 3
16 Ward No. 16 14 2 :2 1 5 9 1 17 Ward No. 17 25 12 6 'i 1
18 Ward No. 18 16 :.1 2 7 8
19 Ward No. 19 20 1 8 40 2
20 Ward No. 20 7 4 3 1 ;} 50 1 21 Ward No. 21 2 7 :3
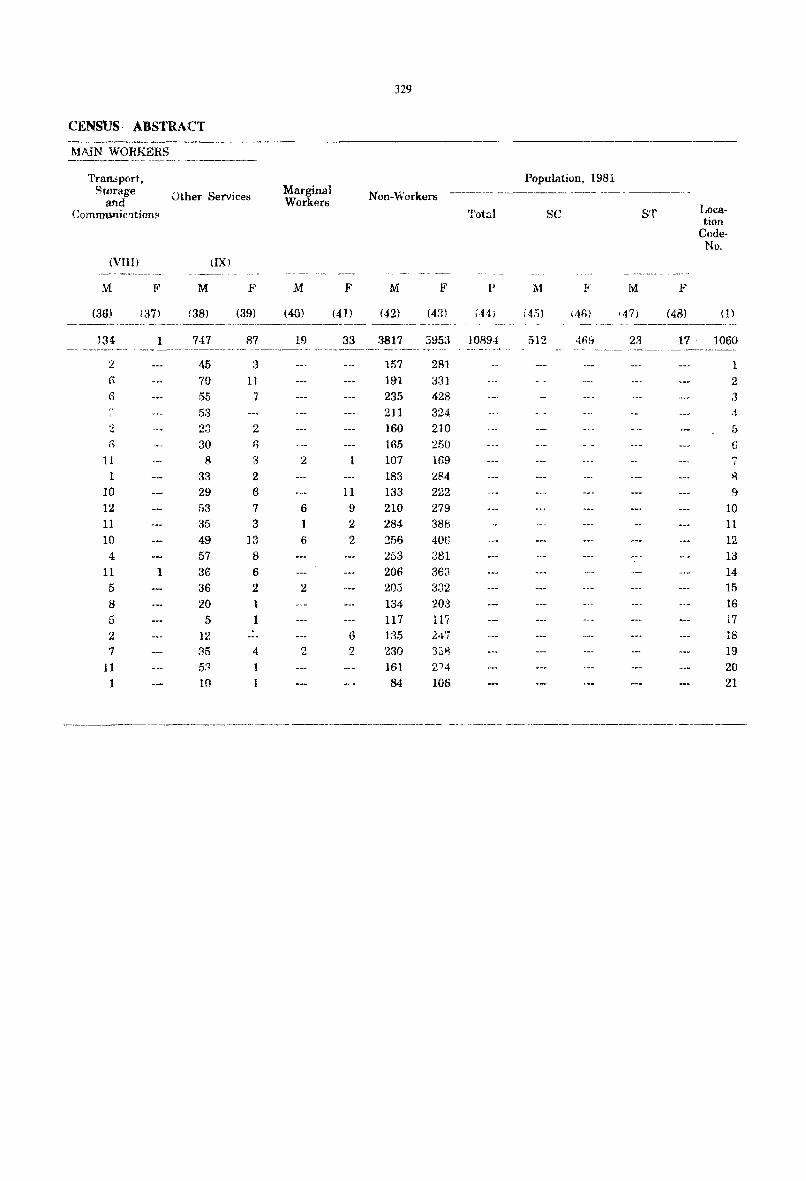
CENSUS· ABSTRACT
MMN WORKERS
Transport, Storage
a'ld CommUTljcntianf'
(VIlI) - --~ - ---. __ ._
~1 F
(36) (;m
Other Services
(IX) ----------
M F
(38) (39)
Marginal Workers
"- - - _._ ----_
1\1 F
(40) (41)
329
Non-Workers
M F
(42) (43) ----.-.------- ----- ---------------------~----.--- ------
J34 1 747 R7 19 33 3817 3!l5a - -------_-- --- -- -- --_._- -------_---- . __ ----------- - --- _._-....-----_. -- -_--- -~ ._--
2 45 3 157 281 (i 70 11 191 :S~n
() 55 7 235 428
.'53 211 324 .~ 23 2 160 210 () 30 (; 165 250
11 8 3 2 1 107 169 1 33 2 183 <:84
10 29 6 11 133 222
12 53 7 6 [~ 210 279 11 .35 3 2 284 388 10 49 ]3 6 2 256 40(;
4 57 8 253 :381 11 1 36 6 206 363
5 36 2 2 203 332 8 20 1 134 203
5 5 1 117 111 2 12 6 ]~5 247 7 35 4 C) 2 '230 1:18 '"
11 5~ 1 ]61 274 1 10 1 84 106
Total
P
,44)
10fl94 --_ --- --'- -
Population, 1981
sc
M F
(4.,)) (41'»
ST
M
<.17)
F
(43)
Location
CodeNo.
0) --- --------~.---
512 4h~1 2,'1 17 ]060 .- -- -_ ------- ---- ._----_ ..
1
2 :l :f.
I)
" ,)
7
" 9
10 11 12 13 14 15 16 17 18 19 20 21
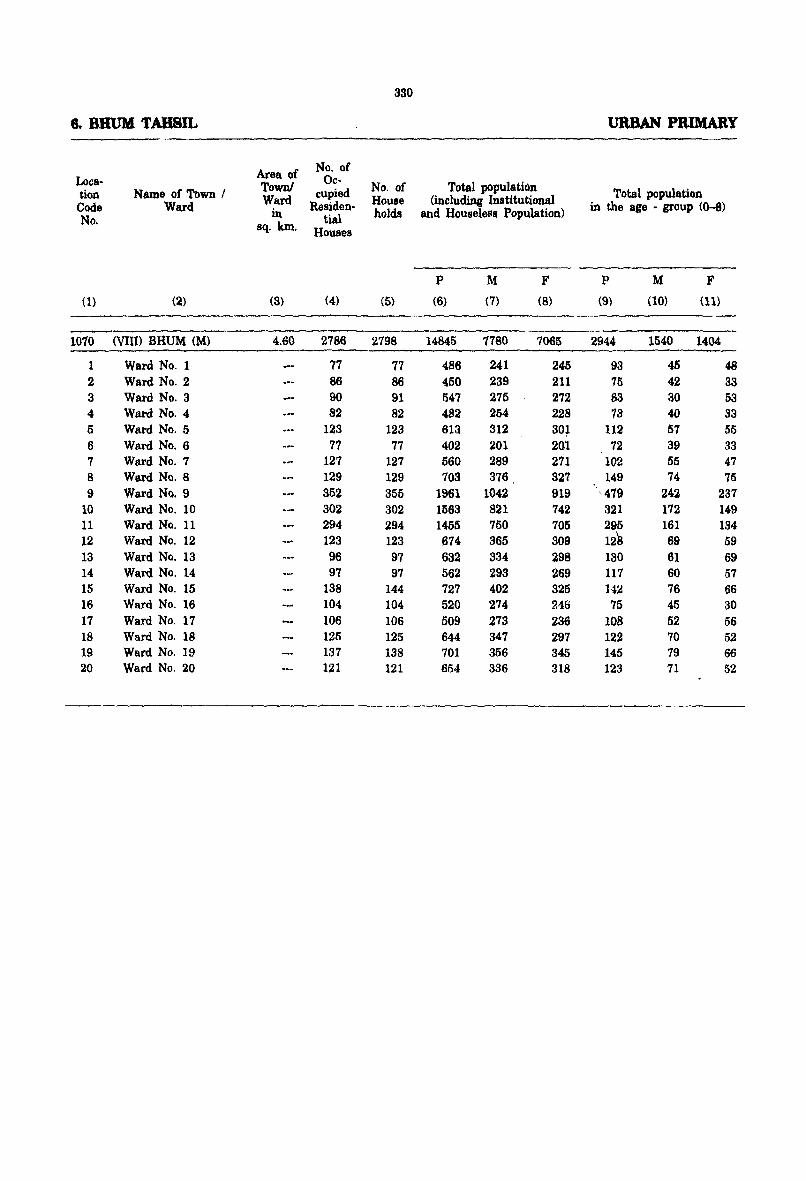
330
8. DRUM TAHSIL URBAN PRIMARY
Area of No. of
Loea- Town! Oe- No. of Total population tion Ntune of Town / eupied Total population Code Ward Ward Residen- House (including Institutional in the age • group (0-6) No. in tial holds and Houseless Population)
sq. km. Houses
p M F P M F
(1) (2) (3) (4) (5) (6) (7) (8) (9) (10) (ll)
1070 (VIm BRUM (M) 4.60 2786 2798 14845 7780 7065 2944 1540 1404
1 Ward No.1 77 77 4B6 241 245 93 45 48 2 Ward No.2 86 B6 450 239 211 75 42 33 3 Ward No.3 90 91 547 275 272 83 30 53 4 Ward No.4 82 82 482 254 228 13 40 33 5 Ward No.5 123 123 613 312 301 112 57 55 6 Ward No.6 77 77 402 201 201 12 39 33 7 Ward No.7 127 127 560 289 271 102 55 47 8 Ward No.8 129 129 703 376 327 149 74 75 9 Ward No.9 352 355 1961 1042 919 '479 242 237
10 Ward No. 10 302 302 1563 821 742 321 172 149 11 Ward No. 11 294 294 1455 750 705 295 161 134 12 Ward No. 12 123 123 tI74 365 309 12~ 69 59 13 Ward No. 13 96 97 632 334 298 130 61 69 14 Ward No. 14 97 97 562 293 269 117 60 57 15 Ward No. 15 138 144 727 402 325 H~ 76 66 16 Ward No. 16 104 104 520 274 216 75 45 30 17 Ward No. 17 106 106 509 273 236 lOB 52 56 18 Ward No. 18 125 125 644 347 297 122 70 52 19 Ward No. 19 137 138 701 356 345 145 79 66 20 Ward No. 20 121 121 654 336 318 123 71 52
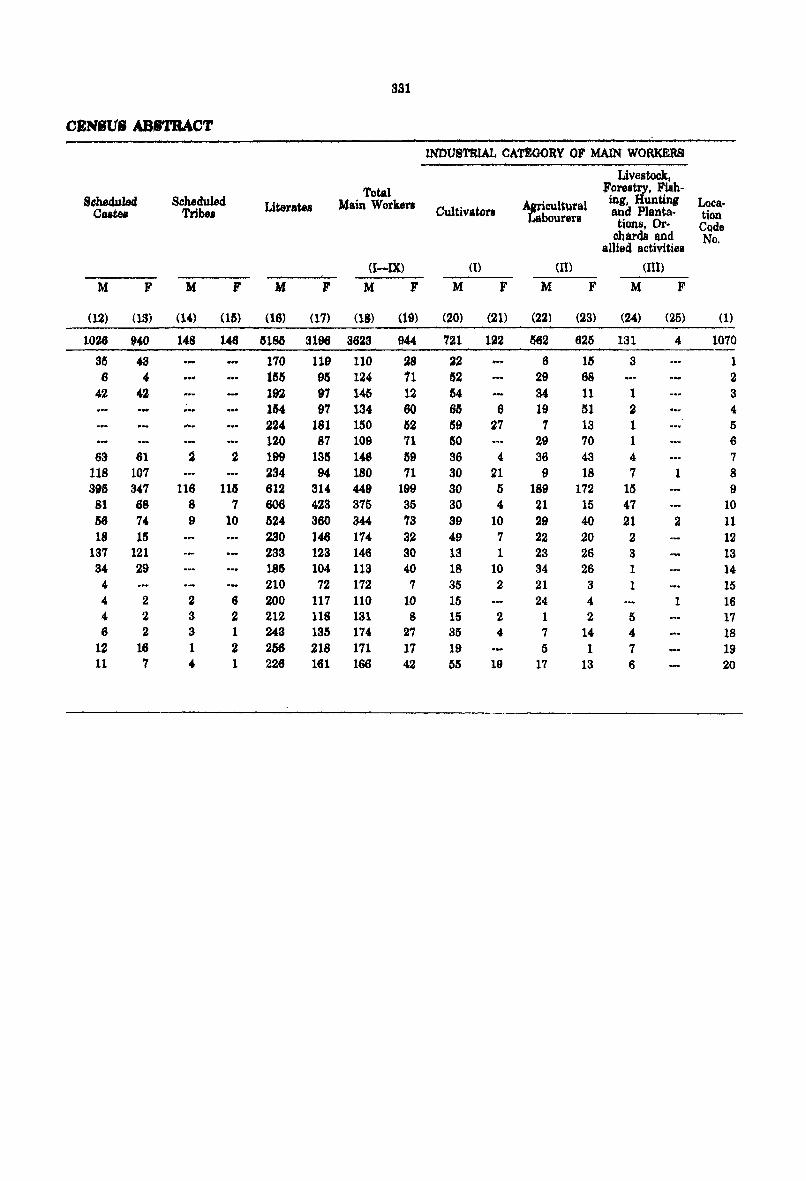
331
CRNit18 AB'1"RACT
INDUSTRIAL CAT1!lOORY 0' MAIN WORKERS
Livestock, Total Forestry, Fish-
Scheduled Scheduled Literates Main Workel'l ~cultural ing, Hunting Loca-
Cute. Tribes Cultivators bourer. and Planta- tion tions, Or· Code
chards and No. allied activities
<I-IX) (I) (II) (IlI)
M F M F M F M F M F M F M F
(12) (18) (14) (15) (16) (17) (18) (19) (20) (21) (22) (23) (24) (25) (1)
1026 940 148 1046 5185 3196 3623 944 721 122 562 6215 131 4 1070
35 48 170 119 110 28 22 6 lIS 3 1 6 .. {ISIS 95 124 11 52 29 68 2
42 42 192 91 145 12 54 34 11 1 3
-.- 154 97 134 60 66 6 19 51 2 4: 224 181 150 62 159 27 7 13 1 5 120 87 109 71 ISO 29 70 1 6
83 61 2 2 199 135 146 l59 36 4 36 43 4 7 118 107 234 94 180 71 30 21 9 18 7 1 8 395 347 116 115 612 314 449 199 30 5 189 172 15 9 81 68 8 7 606 423 375 35 30 4 21 15 47 10 IS8 74 9 10 1524 360 344 13 39 10 29 40 21 2 11 18 15 230 146 174 32 49 7 22 20 2 12
137 121 283 123 146 30 13 1 23 26 3 13 34 29 185 104 113 40 18 10 34 26 1 14 .. 210 72 172 7 35 2 21 3 1 15
" 2 2 6 200 117 110 10 15 24 4 1 16 4- 2 3 2 212 118 131 8 15 2 1 2 5 17 (; 2 3 1 243 135 174 27 35 4: 7 14 4 18
12 16 1 2 266 218 171 17 19 5 1 7 19 11 7 4 1 226 161 166 42 55 19 17 13 6 20
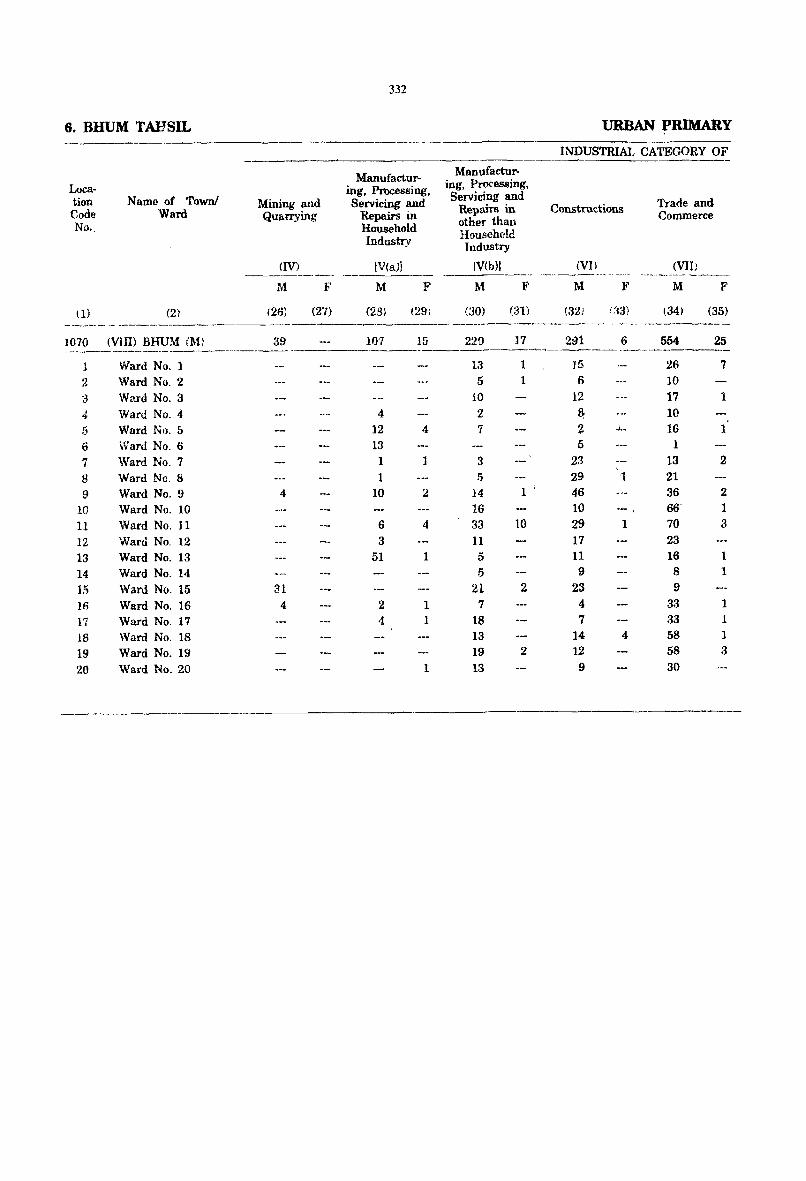
6. BHUM TAHSn. ------
Loca-tion Name of TownJ Mining and Code Ward Quarrying No.,
(IV) ---------
M F
(1) (2) (26) (27)
332
Manufadur-ing, Processing, Servicing and
Repairs in Household Industry
IV(a)]
M F
(2B} (29)
Man ufacturing, Processing, Servicing and
Reptrirs in other than Household Industry
fV(h)]
URBAN fRIMARY
INDUSTRIAl, CATEGORY OF
Constructions
Ml
Trade and Commerce
(VII) "_ -_ .. --_------- ---- ---.------- ---
M F M F M F
(30) (31) (32) (34) (35) ______ • _____________________________ "._---' _____________ ~ _ ____,.. ____ ~_ - __ • _r _ _ ~ ________ • __
1070 (VII!) BOOM (1\1: 39 10'1 15 220 ]7 291 6 554 25 ._. --_.---._----__ -_----_------- -. ----------------------~--.-- -_--_._-------
1 Ward No.1
Z Ward No.2 ;3 Ward No.3
4 Ward No.4
5 Ward No. b
6 Ward No_ 6
7 Ward No_ 7
8 Ward No_ 8
9 Ward No_ 9
10 Ward No. 10
11 Ward No. 11 12 Ward No. 12
13 Ward No. 13 14 Ward No. 1<1
15 Ward No_ 15 lA Ward No. 16 17 Ward No. 17 18 Ward No_ 18
19 Ward No. 19 20 Ward No. 20
-------.
4
31 4
4 12 13 1 1
10
6 3
51
2 4
4
2
4
1
1 1
1
13 5
10 2 7
3 5
14 16 33 11 5 5
21 7
18 13 19 13
1 1
1
10
2
2
15 6
12 & Z 5
23 29 46 10 29 17 11 9
23 4 7
14 12 9
_Co
1
1
4
26 7 10 17 1
10 16 1 1
13 2 21 36 2 66' 1
70 3 23 16 1
8 1 9
33 1 33 1
58 1 58 3
30
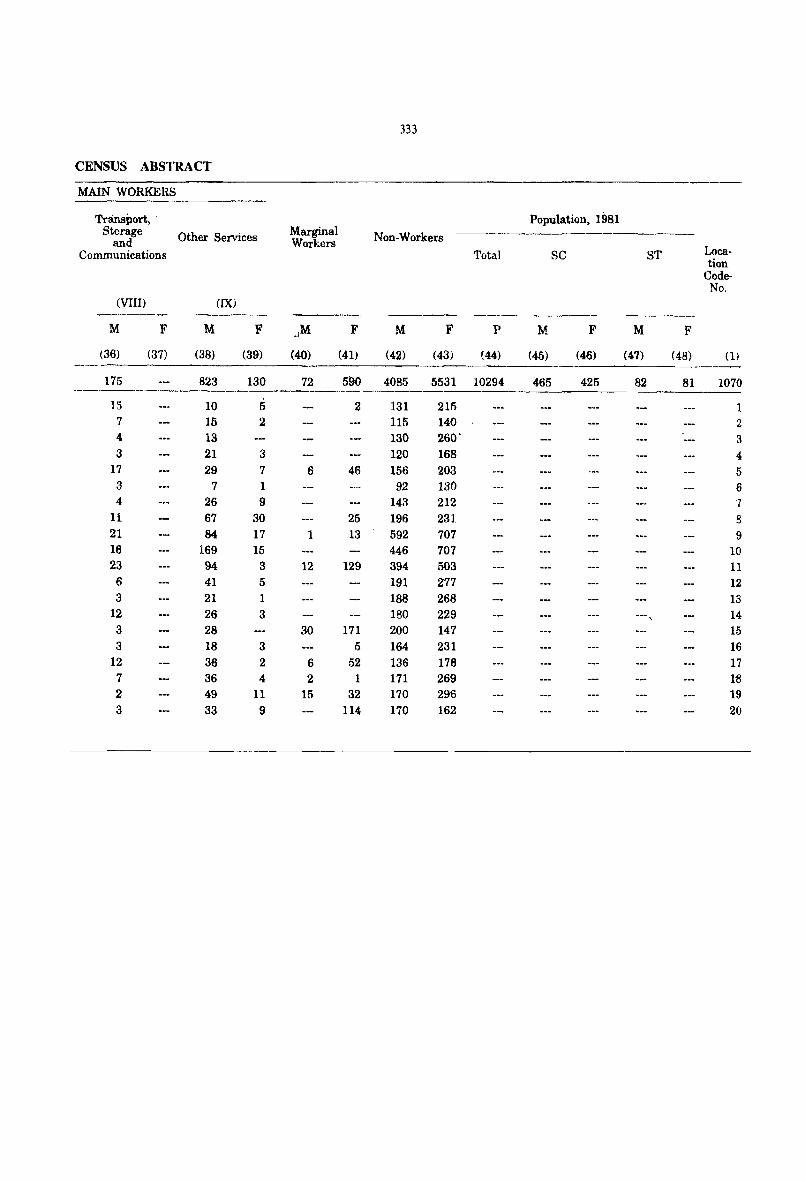
333
CENSUS ABSTRACT -------
MAIN WORKERS
Transport, . Population, 1981 Storage Other Services Marginal Non-Workers -----------------
and Workers Communications Total BC ST Loca-
tion Code-
No. (VIII) (IX)
_--.------ ---- ---_---M F M F .)M F M F P M F M F
(36) (3'7) (38) (39) (40) (41) (42) (43) (44) (45) (46) (47) (48) (1)
175 823 130 72 590 4085 5531 10294 465 425 82 81 1070 -------. ---_._---15 10 5 2 131 211) 1 7 15 2 115 140 2 4 13 130 260' 3 3 21 3 120 168 4
17 29 7 6 46 156 203 5 3 7 1 92 130 6 4 26 9 143 212 '7
11 67 30 25 196 231 8 21 84 17 1 13 592 707 9 16 169 15 446 707 10 23 94 3 12 129 394 503 11
6 41 5 191 277 12 3 21 1 188 268 13
12 26 3 180 229 14 3 28 30 171 200 147 15 3 18 3 5 164 231 16
12 36 2 6 52 136 176 17 7 36 4 2 1 171 269 18 2 49 11 15 32 170 296 19 3 33 9 114 170 162 20
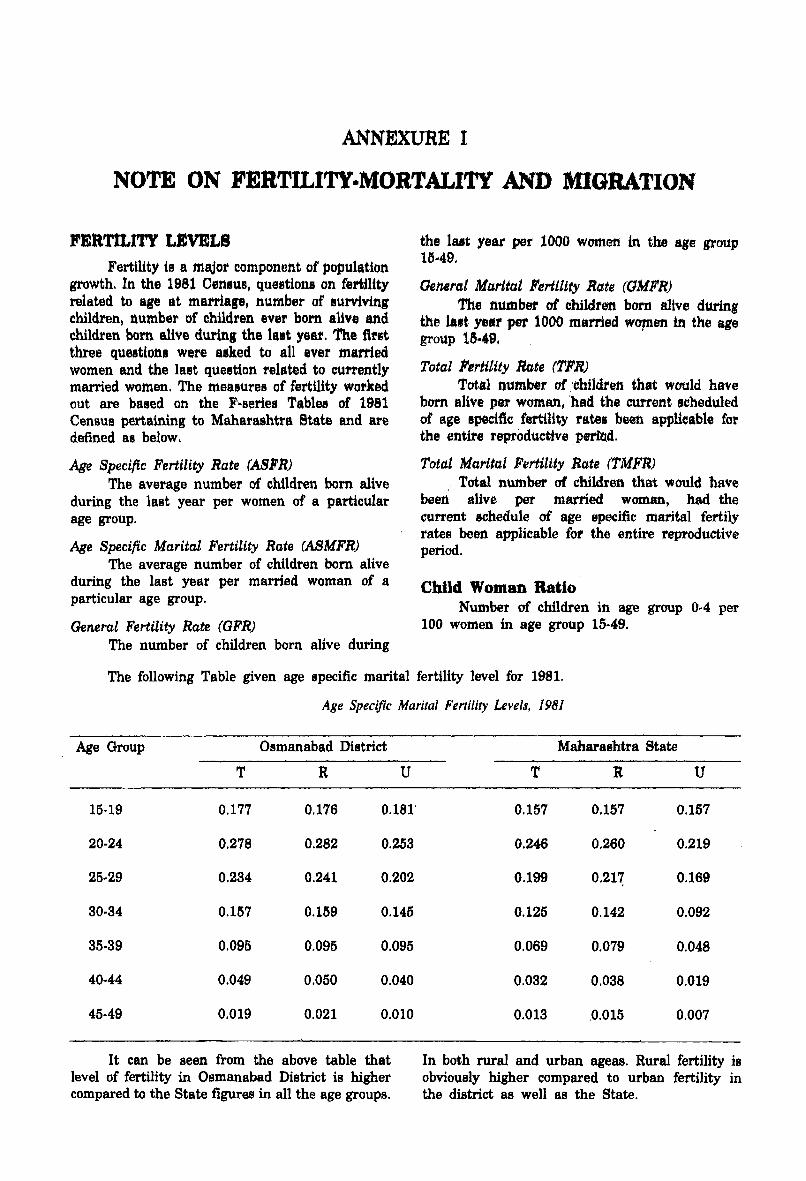
ANNEXURE I
NOTE ON FERTILITY·MORTALITY AND MIGRATION
FERTILITY LEVELS Fertility is a major component of population
growth. In the 1981 Census, questions on fertility related to age at marriage, number of surviving children, number of children ever born alive and children born alive during the lalt yeat. The first three questions were Bsked to all ever married women and the last question related to currently married women. The measures of fertility worked out are based on the F·series Tables of 1981 Census pertaining to Maharashtra State and are defined as below.
Age Specific Fertility Rate (ASFR) The average number of children born alive
during the last year per women of a particular age group.
Age Specific Marital Fertility Rate (ASMFR) The average number of children born alive
during the last year per married woman of a particular age group.
General Fertility Rate (GFR) The number of children born alive during
the last yeat pet 1000 women in the age group 154 49.
General Marital Ferliltty Rate (GMFR) The number of children born alive during
the la.t year pet 1000 married woplEm in the age group 1&·49,
Total Fertility Rate (TFll) Total number of -'children that would have
born alive per woman j 'had the current scheduled of age _pacific fertility rates been applicable for the entire reproductive period.
Total Marital Futility Rate (1'MFR) , Total number of children that vtould have
been alive per married woman, had the current schedule of age specific marital fertily rates been applicable {or the entire reproductive period.
Child Woman Ratio Number of children in age group 0-4 per
100 women in age group 15-49.
The following Table given age specific marital fertility level for 1981.
Age Specific Marital Fertility Levels, 1981
Age Group Osmanabad District
T R U
15-19 0.177 0.176 0.181'
20-24 0.278 0.282 0.253
25-29 0.234 0.241 0.202
30·34 0.157 0.159 0.145
35-39 0.095 0.095 0.095
40-44 0.049 0.050 0.040
45-49 0.019 0.021 0.010
It can be seen from the above table that level of fertility in Osmanabad District is higher compared to the State figures in all the age groups.
Maharashtra State
T R U
0.157 0.157 0.157
0.246 0.260 0.219
0.199 0.21~ 0.169
0.125 0.142 0.092
0.069 0.079 0.048
0.032 0.038 0.019
0.013 ,0.015 0.007
In both rural and urban ageas. Rural fertility is obviously higher compared to urban fertility in the district as well as the State.
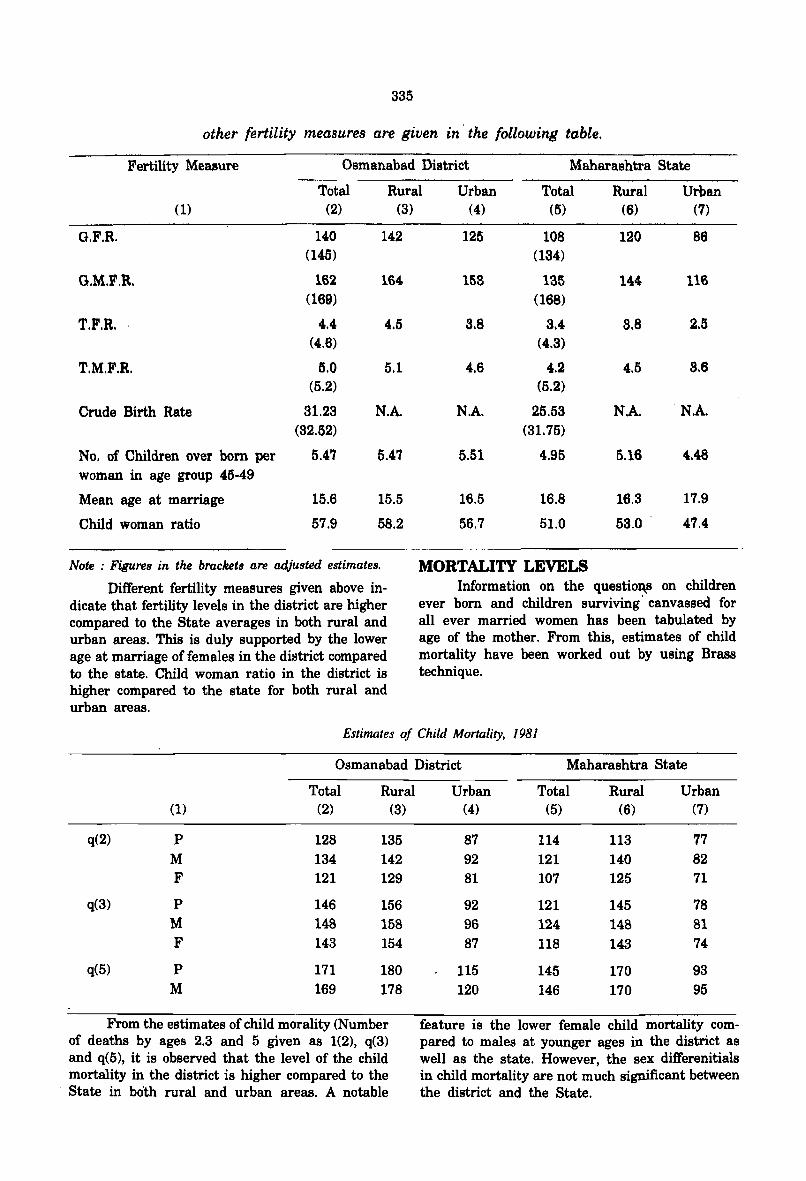
335
other fertility measures are given in' the following table.
Fertility Measure Osmanabad District Maharashtra State
Total Rural Urban Total Rural Urban (1) (2) (3)
O.F.R. 140 142 (145)
G.M.F.R. 162 164 (169)
T.F.R. ' 4.4 4.5 (4.6)
T.M.F.R. 5.0 5.1 (5.2)
Crude Birth Rate 31.23 N.A. (32.52)
No. of Children over bom per 5.47 5.47 woman in age group 45~49
Mean age at marriage 15.6 15.5
Child woman ratio 57.9 58.2
Note : Figures in the brackets are adjusted estimates.
Different fertility measures given above indicate that fertility levels in the district are higher compared to the State averages in both rural and urban areas. This is duly supported by the lower age at marriage of females in the district compared to the state. Child woman ratio in the district is higher compared to the state for both rural and urban areas.
(4) (5) (6) (7)
125 108 120 86 (184)
153 135 1~4 116 (168)
3.8 3.4 3.8 2.5 (4.8)
4.6 4.2 4.5 3.6 (5.2)
N.A. 25.53 N.A. 'N.A. (31.75)
5.51 4.95 5.16 4.~8
16.5 16.8 16.3 17.9
56.7 51.0 53.0 47.4
MORTALITY LEVELS Information on the questiol\s on children
ever bom and children surviving' canvassed for all ever married women has been tabulated by age of the mother. From this, estimates of child mortality have been worked out by using Brass technique.
Estimates of Child Mortality, 1981
Osmanabad District Maharashtra State
Total Rural (1) (2) (3)
q(2) p 128 135 M 134 142 F 121 129
q(3) P 146 156 M 148 158 F 143 154
q(5) P 171 180 M 169 178
From the estimates of child morality (Number of deaths by ages 2.3 and 5 given as 1(2), q(3) and q(5), it is observed that the level of the child mortality in the district is higher compared to the
, State in both rural and urban areas. A notable
Urban Total Rural Urban (4) (5) (6) (7)
87 ll4 113 77 92 121 140 82 81 107 125 71
92 121 145 78 96 124 148 81 87 ll8 143 74
115 145 170 93 120 146 170 95
feature is the lower female child mortality compared to males at younger ages in the district as well as the state. However, the sex differenitials in child mortality are not much significant between the district and the State.
MOVEMENT OF POPULATION
What is Migration ?
Migration is the third component of population. change, the other two being mortality and fertility. A perSOll is considered as a migrant by place of birth if the place in which he is etmmered during the census is ocher thlll1 the place on his birth. Similarly a person 18 considered as a mirg(mt by place of last residence if the place in which he is enumerated during the:.· ct!nsus is other than his place if immediate last residence.
Internal And International Migr'ation
The migrational movements are of thre(l types - (i) Migration within the state itself with its components- (a) Migration within the district of enumeration rintradistrict migration), (b) Migration from one district of state to another district of state (interdistrict migration), (ii) Migration from one one state to another state of the country (interstate migration), and (iii) Migration from one country to another country. The first two stream~ together constitute internal migration, while the last type of movement is called international migration.
Why the people migrate?
For . the first time in the census, reasons for migration were elicited in 1981. Keeping operational constraints in view, the reasons for migration were broadly categorised as (1) employment, (2) education, (3) marriage, (4) family movement and (5) other reasons. Reasons for migration have been elicited only with reference to movement from place of last residence.
Impact of Migration
Growth of population of a particular place depends upon the .q_atural increase due to excess of births over deaths and migration. Knowledge of trends in migration helps in future planning of a region.
Analysis of Osmanabad District in camparison with Maharashtra migrants by place of birth
On the basis of migrants by place of birth, there are 261.43 lakh migrants in Maharashtra in 1981, comprising 104.68 lakh males and 156.75 lakh females. These migrants constitute 41.64 percent of total population. Male migrants constitute 32.29 percent of male population while female migrants account for 51.62 percent of female population.
,In 1981, in undivided' Osmanabad district there were 7.32 lakh migrants comprising of 1.96 lakb males and 5.36 lakh females. The migrants of this district constitute 32.82 percent of total population. Male and female migrants account for
336
17.22 and 49.1 0 perren t ref per ti vely of total population.
Frnm the distribution ()f' tuwl mign:nts in Maharashtra by pj;:Jce "f birth, it can be dearly seen th?lt :f8m:11es predominate in lutt'Hdistriet migrutioI\" \,'hU-: males {lredominllte in intordistrict. int('rstate ~).nd interni.ltiofinl milratiun. Similar trend is I\ot.kp-d ill Chile or O,<;manabud district ahlO.
The number of migmnis born in other Statef: of fndia was 44,04 lakh iIi 1981. It is sef'n that 16.85 percf'nt of the total migrants are from other States. in ease of Osmnnabad district. 6.27 percent . /i th0 total migrant~ are from ,.ther Stat('s.
In ('ase of MaL:'I.1"a~htr3 . .., statr)!,; namely Uttar Pradt'sh, Kb1"natah.a. (h.lJ8rat, Ivlailhya Pradesh, Andhra Pradesh, Kerala, Rajasthan and Tamil Na~lu together ':lOCOUl,t f':lI" 40.[)0 lakhs (91.98 rkrl~ent) out of 44.04 lakh intcr'''~:ite migrant.~. In re .. Jt)('('t of Of"rnanahnd rhs/r:ct, of lr'f> total 4i'i.8(,i) mlg1'Hnts, (Kam~;tnka 'ac('l)u.it·~ f(ll' Br:,.:q percent, Andln'a Pradesil 8 .. ~f:i pt)'C(;nt, R1;a;}han 1,1'l pi~r" cent and ''Uttar Pllld",:,h ~ceo1.lnts f;'l! 0512 pelcem inter State migrant::;.
Rural • Urban Components of Migration
The flow of migr3nt~' would {~onsist of fOUT
streams such as rural to rural, rural to urban, urban to rural and urban to urban. The uata (In the basis of these streams in case of migrants is classified by placB of hirth. It presents data only in relatibn t.o internal migrants. The data for Osmanabad district is presented separately.
Of the total intrastate migrants of 214.66 lakh, 60.95 percent have moved rom rural to rural, 10.44 percent from urban to urban, 21.01 percent from rural to urban and 7.56 percent from urban to rural. In case of undivided Osmanahad district of 1981 of the total 6.86 lakh intra state migrants, 75.49 percent h:w'c! moved from rural to rural, 4.90 percent from l.trban to urban, 13.34 percent from rural to urban and 6.27 percent from urban to rural.
In case of migrants from other States numbering 44.04 lakh, 16.18 percent have migrated from rural to rural, 32.31 percent from urban to urban 47.57 percent from rural to urban and only ~:3.85 percent from urban to rural. In case of Osmanabad district, of the total 45,865 migrants, 55.91 percent have migrated from rural to rural, 16.17 percent from urban to urban, 19.70 percent from rural to urban and 8.22 percent from urban to rural.
Note : Analysis is based on Table 'D-1' of Migration Tables Part V - A & B, 1981 census.
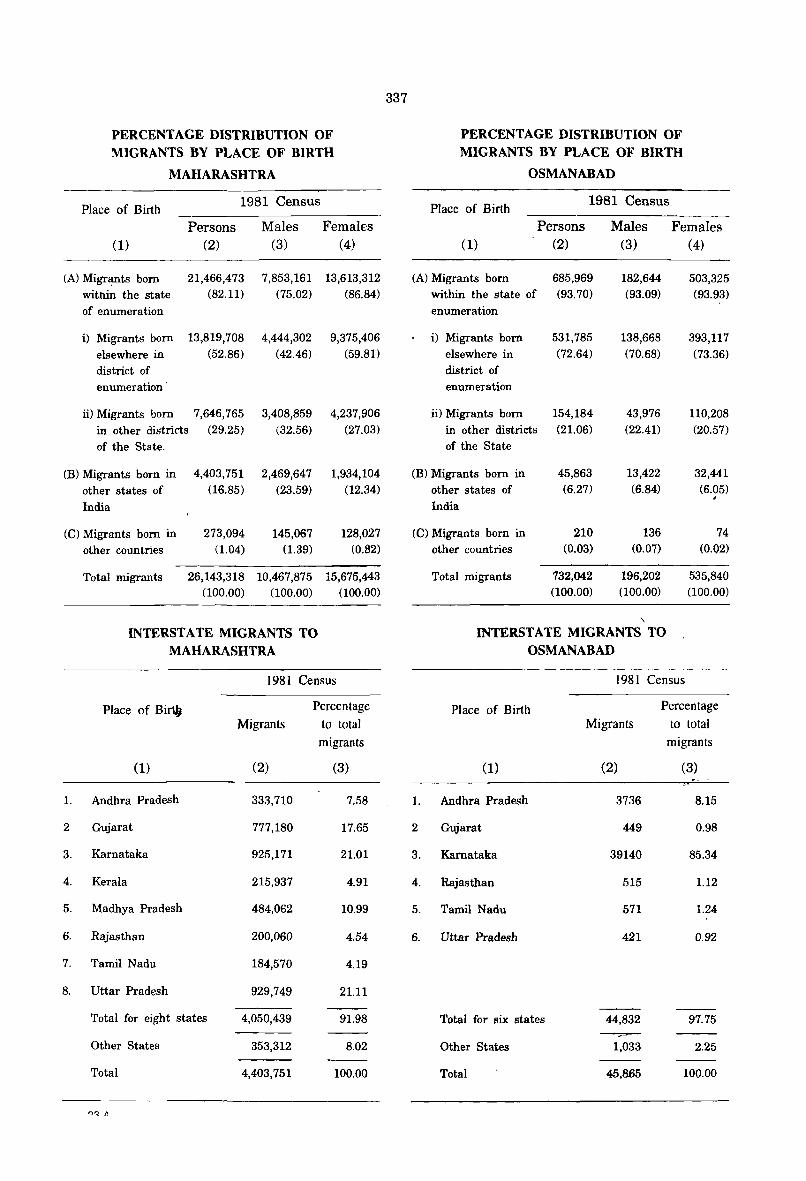
PERCENTAGE DISTRIBUTION OF MIGRANTS BY PLACE OF BIRTH
Place of Birth
(1)
MAHARASHTRA
Persons (2)
1981 Census
Males (3)
Females (4)
(A) Migrants born 21,466,473 7,853,161 13,613,312 within the state (82.11) (75.02) (86.84)
of enumeration
i) Migrants born 13,819,708 elsewhere in (52.86) district of enumeration
ii) Migrants born in other districts of the State.
(B) Migrants born in other states of India
(C) Migrants born in other countries
7,646,765 (29.25)
4,403,751 (16.85)
273,094 (1.04)
4,444,302 (42.46)
3,408,859 (32.56)
2,469,647 (23.59)
145,067 (1.39)
9,375,406 (59.81)
4,237,906 (27.03)
1,934,104 (12.34)
128,027 (0.82)
Total migrants 26,143,318 10,467,875 15,675,443
1.
2
3.
4.
5.
6.
7.
8.
(100.00) (100.00) (100.00)
INTERSTATE MIGRANTS TO MAHARASHTRA
1981 Census
Place of Bii19 Percentage
Migrants to total
migrants
(1) (2) (3)
Andhra Pradesh 333,710 7.58
Gujarat 777,180 17.65
Kamataka 925,171 21.01
Kerala 215,937 4.91
Madhya Pradesh 484,062 10.99
Rajasthan 200,060 4.54
Tamil Nadu 184,570 4.19
Uttar Pradesh 929,749 21.11
Total for eight states 4,050,439 91.98
Other States 353,312 8.02
Total 4,403,751 100.00
337
PERCENTAGE DISTRIBUTION OF MIGRANTS BY PLACE OF BIRTH
OSMANABAD
Place of Birth 1981 Census
(1)
Persons (2)
(A) Migrants born 685,969 within the state of (93.70) enumeration
i) Migrants born elsewhere in district of enumeration
ii) Migrants born in other districts of the State
(B) Migrants born in other states of India
(C) Migrants born in other countries
Total migrants
531,785 (72.64)
154,184 (21.06)
45,863 (6.27)
210 (0.03)
732,042 (100.00)
Males (3)
182,644 (93.09)
138,668 (70.68)
43,976 (22.41)
13,422 (6.84)
136 (0.07)
196,202 (100.00)
\
INTERSTATE MIGRANTS TO OSMANABAD
Females (4)
503,325 (93.93)
393,117 (73.36)
110,208 (20.57)
32,441 (6.05) ,
74 (0.02)
535,840 (100.00)
1981 Census
Place of Birth Percentage
Migrants to total
migrants
(1) (2) (3)
1. Andhra Pradesh 3736 8.15
2 Gujarat 449 0.98
3. Kamataka 39140 85.34
4. Rajasthan 515 1.12
5. Tamil Nadu 571 1.24
6. Uttar Pradesh 421 0.92
Total for six states 44,832 97.75
Other States 1,033 2.25
Total 45,865 100.00
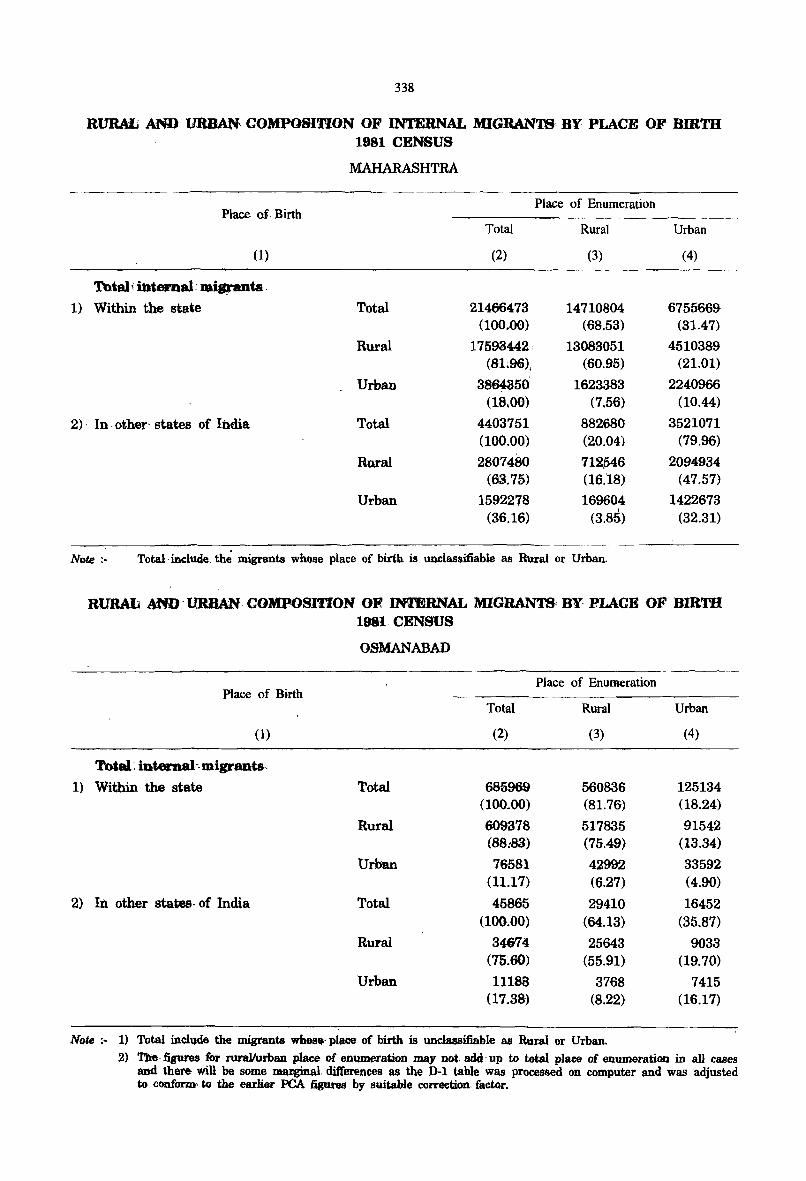
338
RI1R.A.L AND URBAN, COMPOSITION OF INTERNAL MIGRAN'18' BY PLACE OF Bmm 1981 CENSUS
MAHARASHTRA
Place of. Birth Place of Enumeration
Total Rural Urban
(1) (2) (3) (4)
Thtali intemal: .iarants. 1) Within the staie Total 21466473 14710804 6755669
(100.00) (68.53) (31.47)
Rural 17593442, 13083051 4510389 (81;96)1 (60.95) (21.01)
Urban 3864850 1623383 2240966 (18,00) (7.56) (10.44)
2) In· other· states of India Total 4403751 882680 3521071 (100.00) (20.04) (79.96)
Rural 2807480 712_546 2094934 (63.75) (16.18) (47.57)
Urban 1592278 169604 1422673 (36.16) (3.85) (32.31)
Note :- Total iBclude. th.~ migrants whose place of birth .is unclassmable as R\Ual or Urban.
RURAb AND' URBAN· COMPOSI'I10N OR INl'fmNAL MIGRANTS BY PLACE OF Bmm 1981. CENSUS
OSMANABAD
Place of Enumeration Place of Birth
Total Rural Urban
(1) (2) (3) (4)
'l'btal', iDtemal-mignmts. 1) Within the state Total 685969 560836 125134
(100.00) (81.76) (18.24)
Rural 600378 517835 91542 (88:83) (75.49) (13.34)
Urban 76581 42992 33592 (11.17) (6.27) (4.90)
2) In. other states· of India Total 45865 29410 16452 (100.00) (64.13) (35.87)
Rural 34674 25643 9033 (75~60) (55.91) (19.70)
Urban 11188 3768 7415 (17.38) (8.22) (16.17)
Nl1te:· 1) Total inclQ.de the migrants whos. place of birth is unclassifiable as Rural or Urban.
2) The· figures for rurallurban place of enumeration may not, add: up to total place of enumeration in all cases and there- will be some m8l'ginal differences as the J}.l table was processed on computer and was adjusted to conform· to the earlier PCA figures by suitable correction factor.
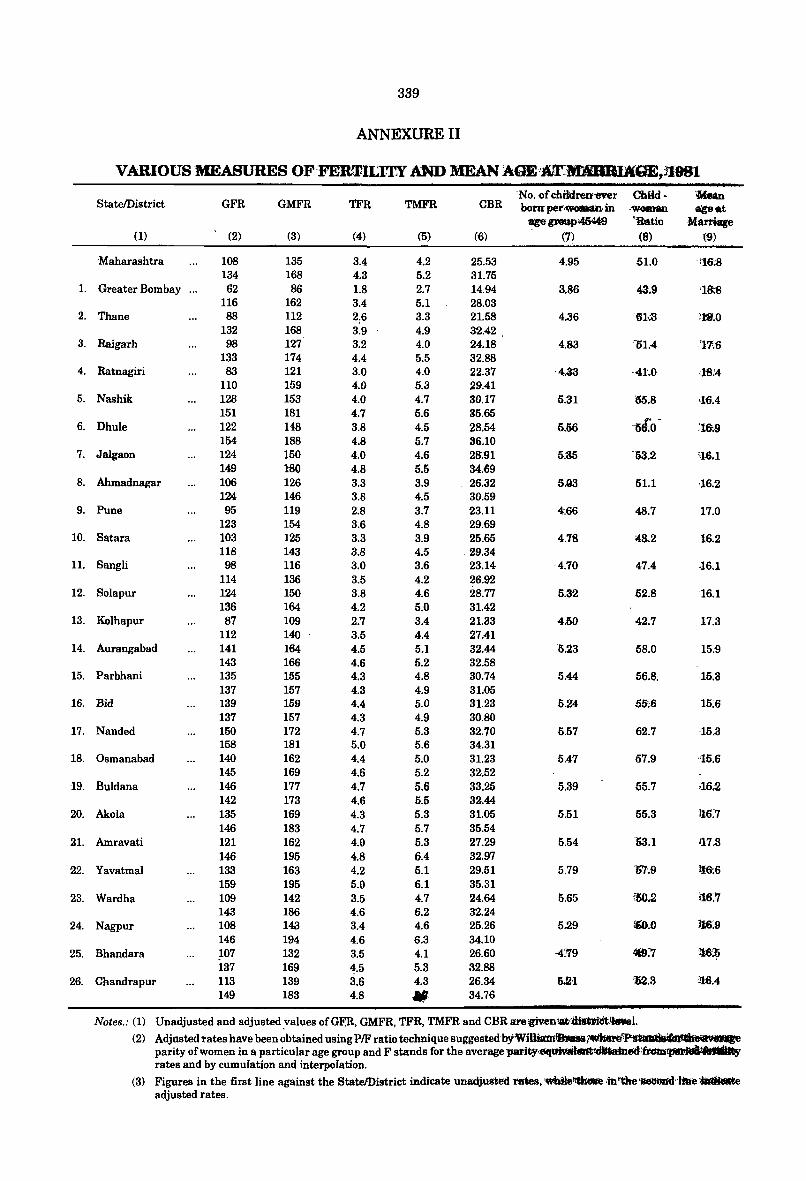
339
ANNEXURE II
VARIOUS MEASURES OF<FERmILITY AM> MEAN AQE<!)\,~,l1991
TFR No.ofchnd~~r Child· 'Mean
StatelDistrict GFR GMFR TMFR CBR born per'WOMIIl' in ·weman •• t a'ge p!lUp46449 'Ratio 'Marria«e
(1) (2) (3) (4) (5) (6) (7) (8) (9)
Maharashtra 108 135 3.4 4.2 25.53 4.95 51.0 116:8 134 168 4.3 5.2 31.75
1. Greater Bombay ... 62 86 1.8 2.7 14.94 3.86 43.9 '18:8 116 162 3.4 5.1 28.03
2. Thane 88 112 2.6 3.3 21.58 4.36 '6U l19 . .o 132 168 3.9 4.9 32.42
3. Raigarh 98 127 3.2 4.0 24.18 4.83 li1.4 'I'M 133 174 4.4 5.5 32.88
4. Ratnagiri 83 121 3.0 4.0 22.37 '4.33 <41.0 ,18.'4 110 159 4.0 5.3 29.41
5. Nashik 128 153 4.0 4.7 30.17 5.31 M.8 ,16.4 151 181 4.7 5.6 35.65
6. Dhule 122 148 3.8 4.5 28.54 5.56 'M.Q- :tas 154 188 4.8 5.7 36.10
7. Jalgaon 124 150 4.0 4.6 28.91 &.35 <53.2 '16.1 149 180 4.8 5.5 34.69
8. Ahmadnagar 106 126 3.3 3.9 . 26.32 S.Q3 51.1 -16.2 124 146 3.8 4.5 30.59
9. Pune 95 119 2.8 3.7 23.11 4.66 48.7 17.0 123 154 3.6 4.8 29.69
10. Satara 103 125 3.3 3.9 25.65 4.78 48.2 16.2 118 143 3.8 4.5 .29.34
11. Sangli 98 116 3.0 3.6 23.14 -4.70 47.4 J.6.1 114 136 3.5 4.2 26.92
12. Solapur 124 150 3.8 4.6 28.77 5.32 52.8 16.1 136 164 4.2 5.0 31.42
13. Kolbapur 87 109 2.7 3.4 21.33 4.50 42.7 17.3 112 140 3.5 4.4 27.41
14. Aurangabad 141 164 4.5 5.1 32.44 5.23 58.0 15.9 143 166 4.6 5.2 32.58
15. Parbhani 135 155 4.3 4.8 30.74 5.44 56.8. 15.3 137 157 4.3 4.9 31.05
16. Bid 139 159 4.4 5.0 31.23 5.24 55:6 15:6 137 157 4.3 4.9 30.80
17. Nanded 150 172 4.7 5.3 32.70 5.57 62.7 15.3 158 181 5.0 5.6 34.31
18. Osmanabad 140 162 4.4 5.0 31.23 5,47 57.9 '15.6 145 169 4.6 5.2 32.52
19. Buldana 146 177 4.7 5.6 33.25 5.39 55.7 ,16.2 142 173 4.6 5.5 32.44
20. Akola 135 169 4.3 5.3 31.05 5.51 55.3 lU[7
146 183 4.7 5.7 35.54 21. Amravati 121 162 4.0 5.3 27.29 5.54 03.1 ,17.3
146 195 4.8 6.4 32.97 22. Yavatmal 133 163 4.2 5.1 29.51 5.79 '57.9 ;iflJ;6
159 195 5.0 6.1 35.31 23. Wardha 109 142 3.5 4.7 24.64 5.65 f6O.2 ;16:7
143 186 4.6 6.2 32.24 24. Nagpur 108 143 3.4 4.6 25.26 5.29 ~.O il6;S
146 194 4.6 6.3 34.10 25. Bhandara 107 132 3.5 4.1 26.60 -4t/9 41[7 ~li
137 169 4.5 5.3 32.88 26. Chandrapur 113 139 3.6 4.3 26.34 5.21 '62.3 216.4
149 183 4.8 '" 34.76
Notes.: (1) Unadjusted and adjusted ,values of GF,R, GMFR, TFR, TMFR and CBR are!fPvtm'4lt~~l. (2) Adjustedl'ates have been obtained usingPlFratio technique suggested·byW.iru.m_,~
parity of women in a particular age group and F stands for the averageparity'~~~~~ rates and by cumulation and interpolation.
(3) Figures in the first line against the StatelDistrict indicate unadjusttHl -rates, 'WbiIe~ ,in·the 1IWmG"lme ~ adjusted rates.
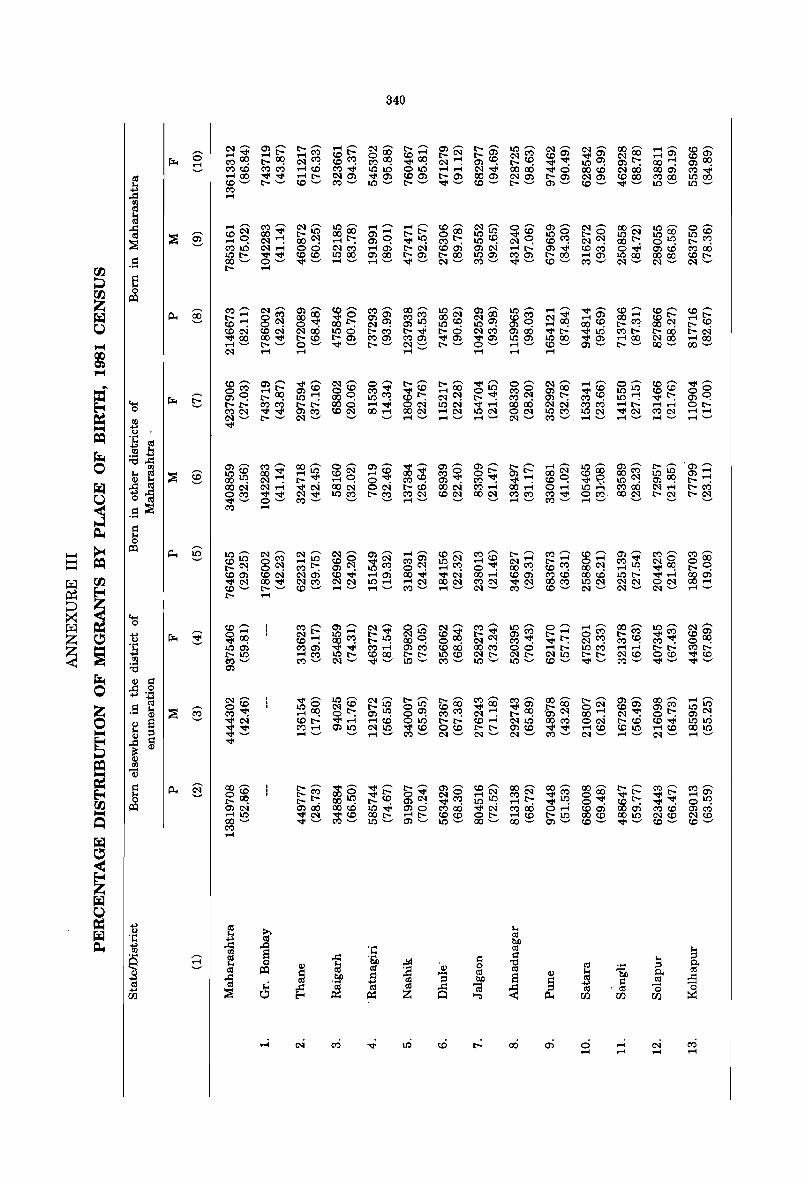
340
C"I""'" 0)""'" r:-""'" .-I ,...... C"I""'" r:-""'" 0)""'" r:-""'" 10""'" C"I""'" C"I'-' 00""'" .-t .-. co""'" ,...... .-I"'" ..... r:- .-IC!:l cor:- 0 00 co.-l r:-C"I r:-O) C"IC!:l coO) "",0) C"I OO .-to) coO)
rx.. 0 C!:l~ r:-~ C"I~ co~ C!:l~ ""'~ C"I~ O)~ r:-~ ""'~ lOa: O)t-: CXl~ O)~ .-I '-' C!:lCO C!:lC!:l ..... co C':l"'" 1010 010 .-I .-I C"I"'" 0000 ""'0 00 co C"IOO 000) C':l"'"
~ ..... 00
""'''''' ..... r:- 1:\10) ""'0) coO) r:-O) 00C1l C"IO) r:-O) C"IO) co 00 C':l00 1000
co '-' r:- '-' CO'-' C':l '-' 10 '-' r:- '-' ""''--' co '-' r:- '-' 0) '-' co'-' "'" '-' 10 '-' 10 '-' C!:l ..c: .-I
gj 1a ..... ,...... C!:l""'" C"I""'" 10""'" .-I ,...... ..... ,...... C"I'"' ~ co""'" 0""'" 0)--- C"I""'" 00""'" 10'-' 0'-'
~ § coC"l 00"'" r:-IO 0000 0) ..... r:-r:- 0 00 1010 "",co 10 0 r:- 0 IOC"I 10 00 lOCO
~ ..... ~ C"I~ oo~ .-It-: O)~ ""'~ C!:lt-: IO~ C"I~ co~ C"I~ oot-: o~ r:-~ C!:l1O C"I ..... 00 C"IC':l .-10) r:-C"I coO) 0)C"I .-Ir:- 0)"", COC':l 0"'" 0) co C!:l00
.S lOr:- ""'''''' coco 1000 0)00 r:-O) r:-oo 100) C!:l0) r:-oo .-10) IOCXl CXlOO cor:-00 '-' 0'-' ""''-' .-I '-' .-I '-' ""''-' C"I '-' C!:l '-' ""''-' co '-' C!:l '-' C"I '-' C"I '--' C"I '-"
00 r:- ..... p e 00 0
Z r;:I:l
§ C!:l""'" C"I""'" C1l""'" co""'" C!:l""'" 00""'" 10""'" 0)""'" 10""'" .-I ,...... ""',...... CO'-' CO'-' co'-' f;(;I p.. r:- ..... 0C!:l 0000 "",0 0)0) C!:lC!:l ooC"l C"I oo coC!:l C"I"'" ..... C1l 00 ..... cor:- .-Ir:-
0 co~ o~ o~ CXlt-: C"Ia: O)~ IO~ lOa: O)~ ..... ~ oo~ r:-~ oo~ r:-~ COC"l COC"l C"IOO 100 r:-C!:l r:-"", r:-o C"IC!:l 0)00 "",r:- ""'10 C':lr:- r:-oo r:-C"I ""'00 00"'" r:-co r:-O) C!:l0) C!:l0) ""'0) ""'0) 100) 1000 ""'0) ..... 00 C"IOO ..... 00
1""1 ..... '-' 1:-'-' 0'-' ""''-' r:- '-' 1:\1'-' r:- '-" 0'-' ..... '-' CO'-' 0)'-" r:- '-' CXl'-' 00'-' (Xl C"I ..... ..... ..... '--' ..... ..... ..... ~ 1""1
CO" 0)""'" ""''' 1:\1""'" 0" r:-'"' r:-""'" "",'""' 0""" 1:\1'-'" ..... ,-... 0--- co,...., ""'---
~ 0C!:l ..... r:- O)CO OCO C!:l"'" ""'co ..... 00 010 C!:l0 0)00 ""'co 1010 COCO 00
rx.. t:' O)~ r:-~ IO~ oo~ IO~ cot-: C"I~ r:-~ C!:l"'! O)t-: C!:l~ IO~ "",t-: O)~ ...... r:-r:- C':l C!:l r:-r:- CXlO .......... OC"l IOC"I ""'rl 0000 C"IC"I C':l C!:l ..... r:- .......... or:-o '-' C!:lC"l
""'''''' 0)C!:l COC"l 00 ..... OOC"l ..... C"I IOC"I OC"l 1OC!:l IOC"I ""'C"I C':lC"l ..........
.5 C"I '--' r:- '--' C"I '--' '--' '--' ..... '--' ..... '--' ..... ._" C"I "-' C!:l '--', ..... '--' ..... ,,_, .-I '-' ..... '--'
"'" ~ <.> j:Q .J:: e ..., ~
Ul ;.s ..., ..c:
0 III 0)""'" C!:l""'" 00""'" 0""'" 0)""'" ""'--- 0)--- 0)'-' r:---- ..... .-. 10""'" 0)""'" r:- ,...... . 0) .-. r-. e ~ § lOCO 00"'" ..... 10 coC"l ..... co 00"'" C!:l0 or:- ~~ ooC"l co 00 00C!:l 1010 0) ..... Q) oo~ C"I~ r:-~ .-1 0 o~ C!:l~ O)~ C':l~ co~ ""'~ IO~ O)~ r:-~
f;(;I .s \II OOC"l C"I ..... ""'C"I CXlC"l OC"l r:-co OOC"l C!:l ..... 00 ..... 0 ..... 10.-"\ C!:l00 C"I ..... r:-C!:l ~ OC!:l ""'''''' C"I"'" IO~ r:-~ C!:lC"l co~ oo~ C':lC!:l C':l"'" OC!:l. CXl~ r:-~ r:-~
j 0 "'" '-' 0'-' C!:l '-" ..... '--' ..... '-' C!:l '-' ..... '-"
= ::e1 C!:l ..... .... Q.. e
0
~ r;:I:l p.. § 10'-' C"I'-' C"I'-' 1:\1'"' 0)'"' ..... .-. co'"' t":!'-' r:-'"' t":!'"' co'"' 0)'-' C':l'"' C!:l'-' t-t t-t j:Q COlO oC!:l ..... 10 coO "",1:\1 C!:l0) IOC"I ..... co C"I ..... r:- ..... 0 ..... C!:l"'" C"I 0 0 00 t-t r:-~ o~ C!:lt-: O)~ IO~ o~ ..... ~ o~ oo~ co~ 00C'! ..... ~ ""'~ r:-~
00 coO) COC"l C"Io) co"", ..... 0) 00"'" ""'C"I 00 ..... coO) C':lCO 00 co lOr:- ""' ..... 000)
~ "'" C'1 00"'" C"IC!:l C"IC"I 10 ..... ..... C"I OOC"l C!:lC"l ""'C"I 00C!:l IOC"I C"IC"I OC"l CXl .....
~ CO'-' r:- '-' CO'-' ..... '-' .-t '-' C!:l '-' ..... '-' C"I '-" C':l '-" CO'-' C"I '-" C"I '-' C"I '-" ..... '-"
~ r:- .....
~ ...... r:.l 0 co""' C!:l""' 0)""'" C"I'-' 0""" C"I""" C!:lr.. 10" 0'-'" ..... ,...., 00""" 10" 1:\1""" ...,
~ 0 ..... C"Ir:- 10 ..... r:-"'" C"IIO co"'" r:-"'" 0)C!:l r:- ..... 0C!:l r:-C!:l "",C':l coO)
Z <.> rx.. ""'~ co~ oo~ r:-~ oo~ o~ C"I~ C!:l~ "",t-: C"I~ C':l~ C!:l~ o~
~ ~ ] 100) C!:l 0) ""'''''' C!:l ..... 0)C':l co 00 00C':l 00 ..... r:- 1OC!:l .......... r:-r:- C!:lr:-
r:- 10 ..... C':l lOr:- co 00 r:-r:- lOCO C"Ir:- C"Ir:- C"IIO r:-r:- C"ICO oco ""'co Ul C!:l '--' C!:l'--' 1:\1'-' ""''-' 10 '-' C!:l '-' 10 '-" 10 "-' CO"-' ""''-'' M '-' ""''-'' ""''-' ;.s 0)
~ Q) = 0 ..c: 0 ..., :p C!:l""" C"I""'" ""',...., 10 ,...... C"I""'" r:-""'" r:- '"' C':l""'" 00'-' r:-'-' 0)""'" 00'-' ..... .-.
Z .S \II OCO 10 0 C"ICO r:-IO 010 co 00 "",00 "",0) r:- OO oC"l coO) 0)C':l 1010 r-. ~ § C!:l~ ..... 00 ot-: 0)Ul! oa: C!:l~ C"I~ r:-~ '0) ~ oo~ C"I~ ot-: O)~ Q)
0 S ""'C"I cor:- ""' ..... ..... co 010 r:-r:- co ..... C"IIO 00C!:l OC"l r:-co co"'" 10 10 ~ ""''''''
M ..... O)e C"IIO ""'co oco r:-r:- 0) co ""''''''
..... co COlO ..... co 0010
§ Jl ::s ""''-' ..... '-' ..... '-' C!:l '-' C"I '-' C"I '-" C"I '-' C!:l "-' C"I '-' ..... '-' C"I '-" ..... '-'
= "'" ~ Q)
j:Q III
~ Ql
e p.. § 00""'" r:- --- ""',...... ""',...... r:-""'" 0)""'" co,...., 00'"' 00'"' 00""'" r:-'-' C!:l'-' C':l .-. OCO r:-C!:l CXlO "",r:- 0"'" C"I 0 ..... C"I C!:lC"l "",C!:l OCXl "",r:- "",r:- ..... 0)
rn 0 r:-~ r:-t-: ooaq r:-~ O)C'! ""'~ lOaq ..... t-: "",aq o~ cot-: ""'~ oaq r;:I:l O)C"I 0)00 CXlCO 10"'" 0)0 C!:lCXl ""'C"I t":! 00 0 ..... coO) 000) C':lCO O)t":!
~ ..... 10 ""'C"I ""'co 00r:- ..... r:- coco or:- ..... co r:-IO 00 co 0010 C"ICO C"ICO Q 00 '-" "'" '-'
M '-' 10 '-' 0) '-" 10 '-" 00 '-' 00 '-" 0) "-' co '-" "'" "-' co '-' co "-'
C!:l ..... f;(;I C!l
~ f";r;l 0 ~ ...,
\II r-. <.> ~ f";r;l .1:: .b ~ Q.. ..., ..c: -s .1: \II r-.
~ III = ::s ;::;- \II ..c: .6'0 ,,!jj = r-. 1a
0 Q) ~ 0 "C ttl ..... ::;:l Po '-' r;:I:l ttl
~ Q) ttl ttl = = - \II Q) r-. "So Po
~ ttl bIl ::s bIl S = \II \II ;S c::I
c!i ~ ..., ..., = ...,
~ ~ t'iI til ..c: tii ~ ::s t'iI til '0 ~ 00 ~ Z Cl r-;, p.. 00 00 00
...i ~ CI:i ..,;. to ~ r.: ex) ai 0 ...i ~ CI:i ..... ..... ..... .....
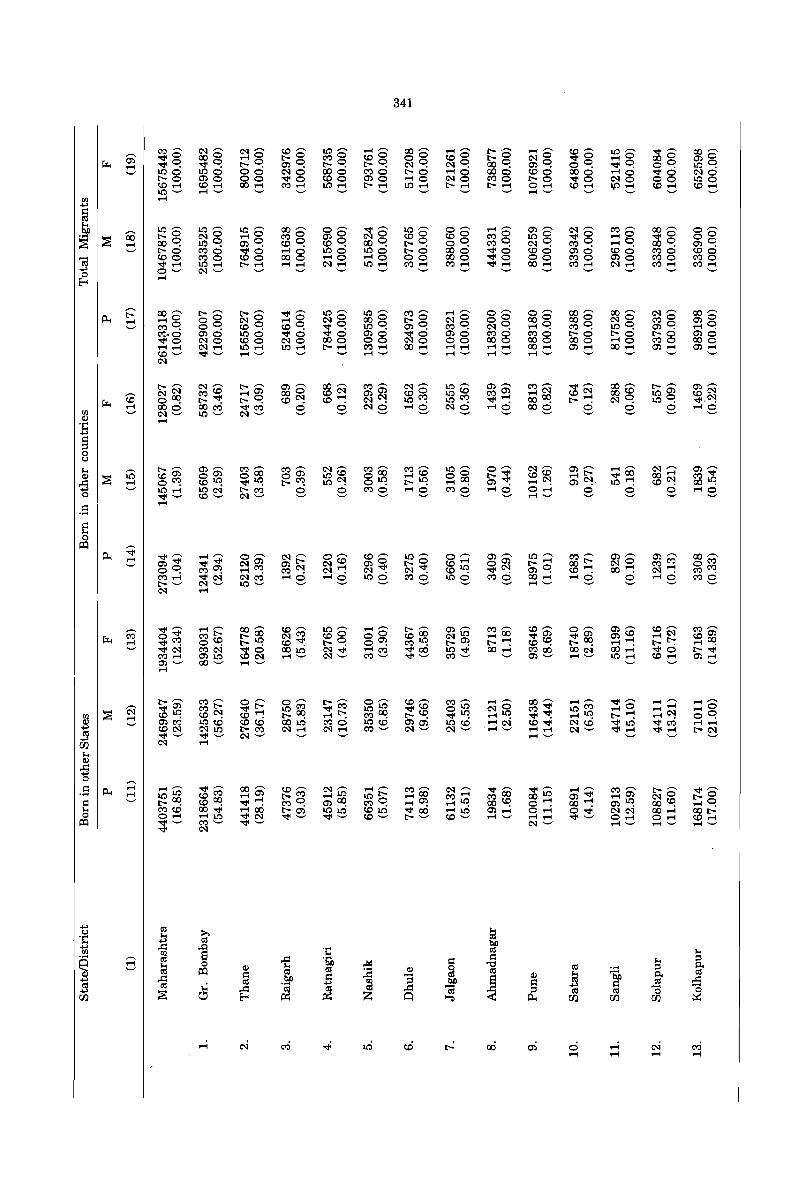
341
"'~ ~"""' ~"""' c.o"""' IQ """' ..... '""' 00'""' ..... '""' t----- ..... '""' c.o--- IQ '""' '<1''''''' 00 ,...., $ '<1'0 00 0 ..... 0 t-- 0 ",0 c.o 0 00 c.o 0 t-- 0 ~o '<1'0 ..... 0 00 0 0')0
JJ:. ...... '<1'~ '<1'~ t--~ O')~ t--~ t--~ ~~ ~~ oo~ O')~ o~ '<1'~ o~ IQ~ ~g LQO 00 ~o 000 "'0 t--o ..... 0 000 c.oo 000 ..... 0 '<1'0 ~o
0')0 00 '<1'0 CDO 0')0 ..... 0 ~o "'0 t--o '<1'0 ~o 00 LQO c.o ...... c.o ..... 00:::, "':::, IQ ..... t-- ..... LQ ..... t-- ..... t-- ..... 0 ..... c.o:::, lp ..... c.o:::, c.o ..... 10 '-" ..... '-" '-" '-" '-" '-" ..... '-" '-"
rJl ..... .;.>
-= tI:I
6D 10""" LQ --- LQ'""' 00--- 0'""' '<1'--- LQ ,-.. 0'-" ..... '""' 0')'""' ~,-.. '" '""' 00""" 0'""' :g ::E 00- t-- 0 ~o ..... 0 ",0 0')0 ~g c.o 0 c.o 0 ",0 LQO '<1'0 ..... 0 '<1'0 00
...... oo~ IOC! O')~ c.oC! c.oC! 00 • t--C! oC! ",C! ~C! ",C! ..... ~ 00C! O')~ '-" t--o "'0 '<1'0 ..... 0 IQO LQO t--o 000 '<1'0 c.oo 0')0 c.oo "'0 c.oo
t\1 c.oo "'0 c.oo 000 ..... 0 ..... 0 00 000 '<1'0 00 "'0 0')0 "'0 "'0 '<1' ..... LQ ..... t--:::, .......... ~:::, LQ ..... "':::' "':::, '<1':::, 00:::, "':::, ~ ..... "':::, "':::, .;.> 0'-" ~ '-' '-' '-" '-' 0 .....
Eo<
t: 00""" t--'""' t--'""' '<1''-'' ID '""' ID'""' "',...... ..... ,...... 0""'" 0""'" 00""'" 00 '""' ~,...... 00'-" p.., ..... 0 00 ~o ..... 0 ~o 00 0 t-- 0 ~o 0 0 00 0 00 0 ~o ",0 0')0 ..... "'~ o~ c.oC! c.o~ '<1'~ LQ~ O')~ "'~ ~C! ..... ~ "'~ LQ~ O')~ ..... ~ t'!:·o 0')0 LQO '<1'0 '<1'0 0')0 '<1'0 0')0 "'0 "'0 t--o t--o t--o 0')0 '<1'0 ~o c.oo ~o 000 00 ~o 00 000 000 000 ..... 0 "'0 000 .......... ~ ..... ID ..... ID:::, t-- ..... "' ..... 00:::, .......... .......... 00 ..... 0'):::, 00 ..... 0'):::, 0'):::, c.o '-" '<1' '-' ..... '-'
.._, ..... '-" ..... '-" ..... '-' ..... '-" C'I
t-- ,...., ~,-.. t-- ,-.. 0')'""' 00'-" "''""' ~,-.. 10'""' 0')'""' '" ,-.. '<1''""' 00 ....... t-- ,...., 0')"""
G ~~ ",c.o ..... 0') 00 0 CD~ 0')0') c.o 0 IOc.o ",0') ..... ~ c.o~ 00(0 LQO') c.o~
JJ:. o~ t--~ t--~ c.oC'! CD""! ~C'! LQ~ IO~ '<1'''"! oo~ t--""! ~~ LQ~ '<1'.C'! ...... 000 00", '<1'''' S S ~S ..... S ~S ..... S ooS S 8 S ..... S rJl ~'-" LQ '-' ~'-" CD .....
'1:: .;.>
-= ::l 0 t)
10< to t-- ....... 0') """' '" ,...... "' ....... ~'""' "''""' '" ,-..
10 ,-.. 0 ....... ~ ....... 0') ....... ............ ~,-.. 0') ....... CD ::E c.oO') 00') of:i.l 00') IQc.o 0 00 ..... c.o 0 0 t--'<1' c.oc.o ..... t-- '<1'00 00 ..... ",'<1'
..c: ..... o~ c.o'q '<1' . t--~ IDC'! otq t--tq ..... 00 O')~ ..... C'! 0') C'! . LQ""! c.oC'! ootq .;.> 10 ...... LQ~ t--", S S "'S ..... S "'S ..... S 0 ..... S S S ..... S 0 '<1' '-" c.o '-' ~ '-" ..... '-' . S .....
-= 10<
a3 ~ p.., '<1'''''''' ..... ,..... 0""'" ~,..... 0""'" c.o""'" IQ""'" 0""'" 0')""'" ID""" "',-.. 0') "'"' 0')'-" 00""'" ..... 0')'<1' '<1''<1' ~O') O')t-- ~c.o 0')0 t-- 0 c.o ..... 00') t-- ..... oot-- ~o ",,,, 0'"
o~ "'~ ..... ~ ",C'! ~""! ~~ ~~ c.otq '<1'C'! O')~ c.o""! oo""! ~""! "'~ "' ..... '<1'~ ~'" ..... S ..... S LQS "'S lOS "'0 00 ..... ..... S 0 .....S "'S t-- '-" ~ '-" LQ ,_, '-' ..... '-' '-' ~ .....
C;; '<1''-'' ..... ,-.. 00'-" c.o ,-.. ID ,-.. ..... "'"' t-- ,-.. 0') ,-.. '" ,-.. c.o '""' 0'""' 0') '""' c.o'-" "',-.. JJ:. 0'<1' ",t-- t-- OO ~'" c.o O 0 0 c.o OO ~LQ ..... 00 '<1'0') '<1'0') O')c.o ..... ~ c.oO')
...... '<1'~ o~ t--tq c.o~ t--~ o~ ",tq t--~ t--""! c.o~ t--~ ..... ""! t--t-: ..... ~ '-" '<1'~ "'~ '<1'0 OOLQ ~'<1' ..... '" '<1'00 10'<1' 00 ..... "'00 oo~ 00 ..... '<1'0 t--'<1' "' ..... 0')10 CD~ ..... '-" ~ ,_, '" '-"
'<1''-'' '" '-' '-' 0') '-" ..... '-' LQ ..... c.o ..... 0') ..... 0') '-" 00 '-" ..... '-" '-" '-" .....
t-- ,...., '" '""' 0"""' 0""" t-- ,-.. 0'-" c.o "'"' '" ,-.. ..... """' 00'-" ..... ,-.. '<1''''"' ..... ,-.. ..... ,-..
~ ~ '<1'0') ",t-- '<1't-- LQ'" '<1'''' LQLQ '<1'c.o oLQ ~o ",'<1' LQ'" ..... 0 .......... ..... 0
rJl c.otq c.oC'! c.o""! t--~ ..... t-: "'~ t--~ '<1'tq ..... tq '<1'~ ..... LQ t--""! ..... C'! o~ $
...... 0')", LQ-C,O c.oc.o OOLQ "'0 LQc.o 0')0') LQc.o ..... ~ c.o'<1' ~c.o '<1'1D '<1'''' .......... c.o~ C'l1D t--", ~ ..... ~ ..... "''-'' ~ '-' ~'-" ..... .._, ..... ..... ~.._, '<1':::, '<1'::- t--2:! tI:I '<1' '-" '<1' '-' ~ '-' '-' '-" ..... '-" .;.>
r:I1 ~ ..... M CD ..c:
.;.> 0 ,...., . S p.., ...... ..... ,-.. '<1' """' 00""" c.o ,-.. ~'""' ..... ,..... '" ....... ~'""' '<1' ,-.. '<1' ....... ............ '" .--.. t-- ,...., '<1''--'' ..... LQIO c.o'" ..... 0') t--'" ..... 10 lOt-- ..... 00 "' ..... ",00 ooLQ 0')'<1' ..... 0') ~o t-- 0
-= t--~ c.o~ '<1'''"! "'~ O')~ ",C! ..... ~ ..... ID OO~ o~ oo~ O')tq ooct! ..... C! 10< ",c.o 00'<1' ..... 00 t--O') IDLQ c.oLQ '<1'00 ..... LQ 0') ..... 0 ..... 0'<1' ~~ 00 ..... oot--0 0 ..... ..... LQ '<1'~ '<1' '-' '<1''-'' c.o '-" t-- '-' c.o '-" ..... '-' .......... '<1' '-" 0 ..... 0 ...... c.o ..... ~ '<1' '-" '" '-"
'<1' '-' ~'-" ..... '-' ..... '-" ..... '-" '<1' ~
.;.> tI:I M t)
b >-. !:IS '1:: !:IS bIl .;.> ..c: .c '1:: tI:I M rJl rJl S .... ;:( tI:I ..c: '6'0 -=
I::l M ::l
~ 10< 0 10< ..!od "C !:IS ::l Po ._., tI:I ~
Q) !:IS tI:I :.a Q) ~ !:IS
.... !:IS I::l M 'bo p.
~ bIl .s "3 S CD .5 ..c: .;.> !:IS rJl bIl I::l I::l tI:I tI:I
c'5 E5 '(U tI:I !:IS ..c: t\1 ~ ::l - ~ .;.> ::E !:IS tI:I 0
r:I1 Il:: Il:: Z 0 ._ p.., r:I1 r:I1 r:I1
,....; C'i cv:) -q; ..0 cD ~ cxi ai 0 ,....; e<i cv:) ..... ..... ..... .....
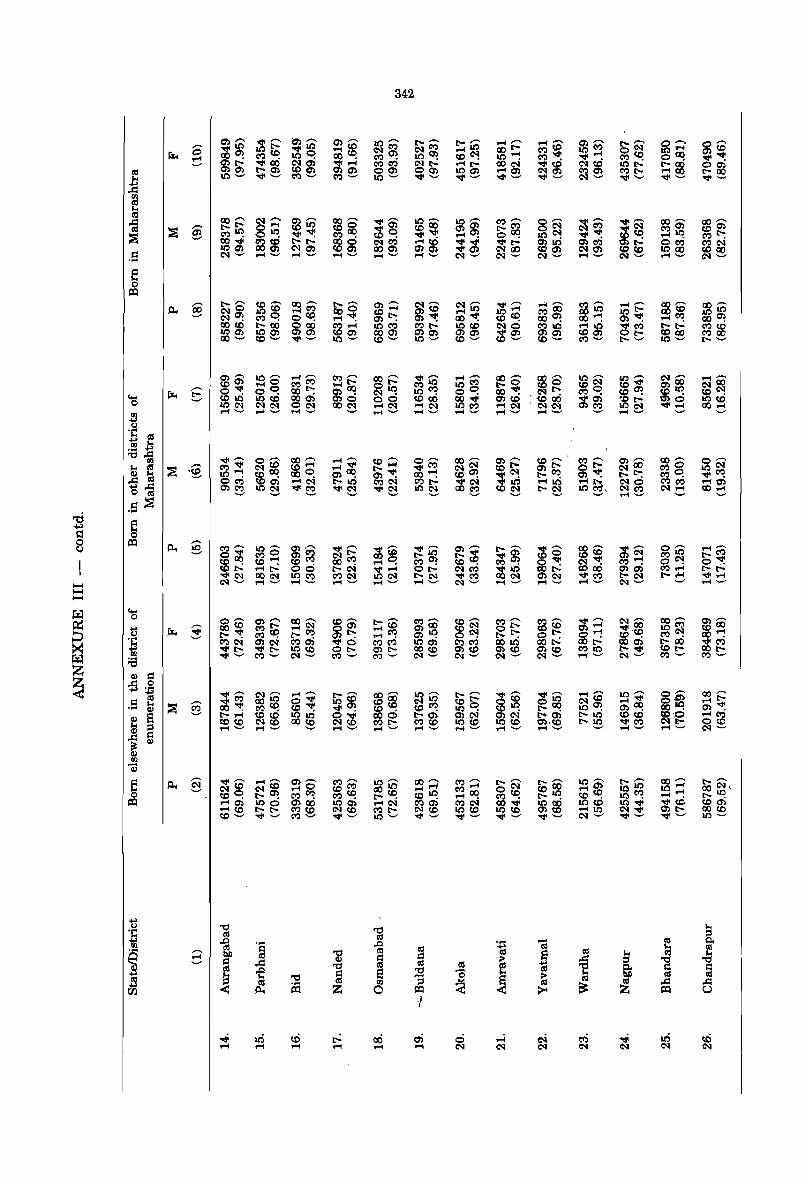
342
(1)""'" ;1.;t::'
~ ....... (1) ....... 10 ....... r-- r-r- ~,.,...., ~,....., 0)-' r-'-' 0 ...... a: G ~ ~~ "",10 ~CO t-:I~ t-:I~ ~IO oot- ~CO 101:':) 0<:'1 10 .... rz.. I:':)~ IOC! oo~ ~ . 10 • CO~ IO~ I:':)~ "",,,",! I:':)~ oct:! ""'~ ._, Olt- ""'00 <:'10) QI;~ ~I:':) <:'It-- ~t- 00C'l "",co <:'I CO 10 t-- t-oo Oal
b alal t-al COOl Oal Oal lOal ~Ol <:'10) ~Ol ~t-- .-400 t-OO IO~ ""''-' ~'-' ~'-' 10 '-' "", ....... ""'._, ""''-' ""''-' C'iI'-' ""' ....... ""'._, ""''-' ..r::
~ '"' as
00"""' C'l'-" al ,.,...., 00-' ""' ....... .; 10 ""' 10"- ~ ....... 0 ....... ""' ...... i~
00-- 00-::s r- r-t"- o~ COlO COO "",Ol CO <:10 al~ t-~ 0C'l C'iI~ ~Ol co (1)
::s ~ ~~ oll:! ""'~ ~ct:! CDC! ""'~ ~ . 00C? IO~ ""'~ ~~ ~r-; <:10"'" &3~ t--r- ~~ C'iI~ ~~ ~at; ""'t- ~IO 0l0':) 00':) 0':)<:'1 10(7) C'l0) (00) C'loo C'l0) cot-- 10<:10 co 00 Q C'I --
.... .._, .... '-' .... '-' ~ .._, ~ '-' C'I '-' C'l '-' C'lS .... '-' C'I~ ~ '-" C'I '-' .... e 0 ~
r- r-'-" co- 00 ....... toO' al- C'l ""' <:'1"'- ""' ....... .-4 ,... ~iO ~ -- 00 ....... 00""" tl. ClO C'l0 lOCO .... ~ co .... OlCO .... 10 IO~ ",00 101:- 00 CO 1010
-' <:'IO"! ~C! O~ .... ~ alr-; Ol~ oo~ co~ oo,,! oo""'! Ol~ ~O':) oo~ coco r-oo ~g:] ~ .... IO~ ~t-- lOCO ~O ~~ ~IO ~g? t-t- ~CO 10(1') 10(1') (oOl ~e alOl OlOl co~ COOl coco ~oo 00'-' (0'-" ""''-' 10 '-' 10 '-' co._., CO'-' ~ '-' t- '-' 10 '-' t- '-'
Ol'" 10'-' ........... ~.-. 00'-' ""'.-. ~ .-. 00'-' 008 10 ....... 10 ....... C'I ...- .... .-. (0(1') .... 0 ~~ .... t- ot- ~IO IO~ 1:- 0 coC'l CO"'" 0100 C'loo ..- o~ 0C! <:lOr-; ~~ CII~ IO~ 0C? oo~ (Ot- ~C! co"! CQ~ IC~
1) r:. t:- (010 lOCO ~~ 00 CO 00 00"'" alCO ' ~ IX) ""'Ol 'c t- 010 lOCO IOC"I CllC'I oo~ .... C'I .... C'I 101:':) .... C'l ' C'I"C'I Ol~ IOC'I ""'~ 00 ....
~ .... '-' .... '-' ......... .... '-' .... '-' .... ._., .... '-' .... ._ .... ._, '-' '-'
t)
'C as .... I1J ~ ....
"C rtJ ""' ....... 0"'" 00 ,-.. .... ....... co ....... 0-' 00 ".... Ol ....... co ....... ~-. Ol ....... 00 ".... 0"'-
'"' CIS ::s ".... ~~ C'lr.&> r.&> .... .... "'" t- .... ~~ C'lC'l cc~ Olt-- or- C'loo 0':)0 1OC'l
Q) ~ 'CO IO~ coOC? <:IOC! enct:! Ol~ CO~ I:-~ al~ t-t-: ~C! ""'~ ._, ~ad ~.; oe, COOl .... C'I t-IO ~C'l e,r- ""'C'I .... 10 :ri ~, C'l0 ~~ .... Ol
Ole, IOC'I ""'~ ""'CII ""'C'l IO~ 001:':) co~ I:-CII C'I~ C'I .-4 co~ .._, '-' '-' '-' ._., '-' .... ._, ._, '-'
d:;g
r-ci .... ... e
s::: 0 0 ~ p., "..... () 10 ~ ....... 10"'- ~c;" ""' ....... ""'.-. ""' ....... Ol""" t- ....... egO' ~G ""' ....... 0""" .... ,.... ._, o~ ~o C'lt- 00(,IIJ t- IO t-"'" "",en alC'l ~IO t-~
coCiC! co'""! CO~ oo~ .... C! ~~ co~ ~~ o~ C'l~ ~~ o~ o~ cot-- .... t- 00 t-C'l ~~ ot- CIIC'f.) ~~ cot-- woo alOl ~ .... t-t-""'<:'I 00C'l IO~ C'f.)<:'1 I:-C'l """~ Ol<:'l ""'~ 1:-<:'1 t-~ ""'.-4 - <:'I '-' .... ._, .... '-' .... '-' .... '-' .... '-' <:'1'-' .... '-' .... '-' .... '-' C'I ._, .... ._, --ril 1) 0 ....... Ol ....... 00 ,.... co""' t- ....... C'f.) ....... co ....... ~,...
~G 0';;:; C'I'-' 00"'" al'-" ~ ~ r:. ....... 00 co ~t- .-4<:'1 oal .... CO en 00 coC'l ot- "",,~ IOC':! co 00
~ "'" r-~ I:':)~ r-~ Olr-; .... ~ <1l~ o~ r-r-; or-; o~ I:':)~ oo~ ] '-' CD.
~C'iI OlC'I ~O) ""'0 I:':)~ 100) cr,,~ 0010 oot-- oor- 000l t-oo ~g: """I:- ""'r- lOCO 01:- Olt- 00 CO ClCO OlCD 0)(0 ~IO 1:-"", cot-ril
I1J ""''-' ~ ._, C'l '-' C'f.) '-' C':) ._, C'l ._, <:'I'_" <:'I '-' C'l ....... .... ._, C'l ._, ~ ._, CI'J ....., .... Z "C
Q) Q
~ oS 0 :g ~c; C'l'-" ........... t--' 00 ....... 10 ....... t-- ....... ~G ""'-. .... ....... 10 ....... 0 ....... 00 ....... d '"' .-. 0010 0"'" 10 CD CO 00 C'l1O cot- 010 CllCO .... "'" o·~ .... r--.... Q) ~ ~ oo~ C':)~ co"'" ""'~ CO~ co~ IOC! ~ci r--ct:! IO~ Olct:! oo~ al~
§ t- .... coco 10' 0",," ooCl 1:-0) 0lC'l ~Ol r--IO coco COcO .... ct:) e CO eo C'lCO oo~ C'leo ~t- C':)CO lOCO lOCO Ol'CO t-e ""'~ C'lt- OCO Q) .... '-' .... ._, ....... .... '-' .-4 '-' .... -- .... ._, .... .._, .... .._, .... '-' .... ._. C'l ._,
..r:: d
~ Q)
I1J -Q)
~ p., ,....
""' ....... .... ,.... Ol-' C':)-. 10-' 00 ....... CI'J'"" t--' t- ....... 10-' t- ....... 00 ....... t-""' C'l C'lCD C'lCO ~o coct:) 0010 .-4 .... 1:':) .... oC'l CC oo .... 0) 1010 10 .... 00 C'I \ ._, CDC! t-O'! ~~ ~~ t-~ co~ .... OC? CI'J~ t-lI:! co~ IO~ .... ""'! r--~
~ .... Ol 100 0)<:10 100l .-4C'l ~Ol Cl'JC'I 00""" 10<:10 lOCO 10"'" "",co COOl .... CD t-t- Cl'JCO C'lCO ~ t- C'lCO lOCO lOCO Oleo .... 10 <:'I""" Olt- 00 co co'-' "'" '-' CI'J '-' "'" '-' 10 ._, ""'-- "'" ._, ""'._, "'" ._, CII '-' ""'....., ""' ..... 10 '-'
.... t) "C 'tl E '1:: CIS as ....
~ .~ ~ ~ - ~ Q.
~ as CIS
CIS f ;:; bO 11 ~ '"' ~ ~ d
E ..r:: ::s "8 'tl ..r:: "C CIS CIS as
~ l s:: of "C '0
~ "C d :; ~ 1U Cd as
.5 ~ .... CIS I1J ~ ..r:: ..r::
rJ.l I::I:l Z 0 ~ >< I::I:l 0 .,
...j. lt5 ~ r.: «i a) 0 ,...4 e4 et5 ~ 10 ~ .... .... .... .... .... .... C'l C'l C'l C'l <:'I <:'I
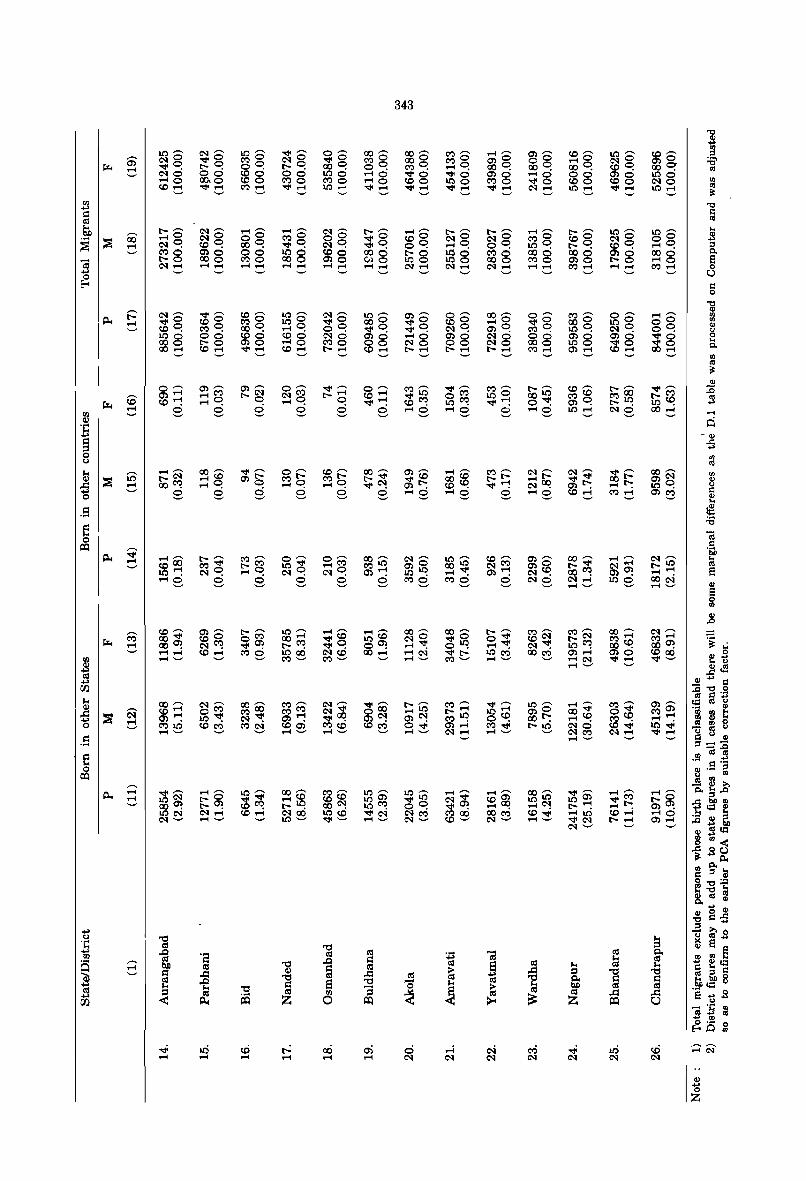
e o !:Q
343
Related Documents


