OSGM02: A new geoid model of the British Isles and Ireland R. Forsberg and G. Strykowski KMS, National Survey and Cadastre, Rentemestervej 8, DK-2400 Copenhagen NV, Denmark, E-mail: [email protected] or [email protected] , fax: +45 35875052. J.C. Iliffe, M. Ziebart and P. A. Cross Department of Geomatics Engineering, University College London, Gower Street, London WC1E6BT, UK C.C. Tscherning Department of Geophysics, Univ. of Copenhagen, Juliane Maries Vej 30, DK-2100 Copenhagen Ø, Denmark P. Cruddace Ordnance Survey, Romsey Road, Southampton, SO16 4GU, UK K. Stewart Ordnance Survey Northern Ireland, Colby House, Stranmillis Court, Belfast, BT9 5BJ, UK C. Bray and O. Finch Ordnance Survey Ireland, Phoenix Park, Dublin 8, Republic of Ireland Abstract. This paper briefly describes the con- struction of a new geoid model of the British Isles and Ireland. The new model, the Ordnance Survey Geoid Model 2002 (OSGM02), covers the area 45.5°N- 61.5°N and 11.5°E-3.5°W (approximately 1445 km × 980 km) with the grid spacing 0.01333° × 0.02° (ap- proximately 1.5 km × 1.5 km). A dense set of gravity and height data was used. The spatial data resolution was 100 m × 100 m for heights, one gravity station per 1.5 km × 1.5 km on land and one station per 5 km × 5 km offshore. These require-ments were met by the data except in few areas. A quasigeoid was constructed and, subsequently, converted to geoidal heights. The OSGM02 gravimetric geoid was then fitted to GPS/levelling. To accommodate different vertical datums, the GPS fitting was done in patches corresponding the various datums in use (i.e. Newlyn, Belfast, Malin Head and various island datums). The final postfit error r.m.s. of the fitted geoid is 2 cm for the Great Britain and 3-4 cm for other areas. Keywords. Geoid, quasi-geoid, fitting to GPS/levelling, vertical datums 1 Introduction The years since the 1950’s have seen several pro- jects aimed at determining geoid models for the British Isles and Ireland, whether as part of regional or local initiatives or more specifically focussed on parts of these islands. Featherstone and Olliver (2001) give an overview of the history of geoid models over the British Isles and Ireland. In 2001, a consortium consisting of the Ordnance Surveys of Great Britain (GB), Northern Ireland (NI) and Ireland invited tenders for the computation of a new geoid model for the British Isles and Ireland, the Ordnance Survey Geoid Model 2002 (OSGM02). This new project would for the first time utilise all available gravity, terrain and GPS/levelling data. The work was subsequently carried out by a team of contractors consisting of the National Survey and Cadastre (KMS), Denmark, Department of Geomatics Engineering, University College London, UK, and Department of Geophysics, University of Co- penhagen, Denmark. The objective was to construct a cm-geoid for the whole area. It was estimated that these requirements would be met with a data distribution of a 100 m × 100 m Digital Elevation Model (DEM), a gravity station coverage of one point per 1.5 km × 1.5 km on land, and one station per 5 km × 5 km offshore. In section 2 it is seen that, except for few areas, these requirements were fulfilled by the available data. The methodology used is described in section 3. Section 4 describes the procedure leading to the construction of OSGM02 gravimetric geoid. In section 5 the fitting to the GPS/levelling data is briefly described.

Welcome message from author
This document is posted to help you gain knowledge. Please leave a comment to let me know what you think about it! Share it to your friends and learn new things together.
Transcript

OSGM02: A new geoid model of the British Isles and Ireland
R. Forsberg and G. Strykowski KMS, National Survey and Cadastre, Rentemestervej 8, DK-2400 Copenhagen NV, Denmark, E-mail: [email protected] or [email protected], fax: +45 35875052.
J.C. Iliffe, M. Ziebart and P. A. Cross Department of Geomatics Engineering, University College London, Gower Street, London WC1E6BT, UK
C.C. Tscherning Department of Geophysics, Univ. of Copenhagen, Juliane Maries Vej 30, DK-2100 Copenhagen Ø, Denmark
P. Cruddace Ordnance Survey, Romsey Road, Southampton, SO16 4GU, UK K. Stewart Ordnance Survey Northern Ireland, Colby House, Stranmillis Court, Belfast, BT9 5BJ, UK
C. Bray and O. Finch Ordnance Survey Ireland, Phoenix Park, Dublin 8, Republic of Ireland
Abstract. This paper briefly describes the con-struction of a new geoid model of the British Isles and Ireland. The new model, the Ordnance Survey Geoid Model 2002 (OSGM02), covers the area 45.5°N-61.5°N and 11.5°E-3.5°W (approximately 1445 km × 980 km) with the grid spacing 0.01333° × 0.02° (ap-proximately 1.5 km × 1.5 km). A dense set of gravity and height data was used. The spatial data resolution was 100 m × 100 m for heights, one gravity station per 1.5 km × 1.5 km on land and one station per 5 km × 5 km offshore. These require-ments were met by the data except in few areas. A quasigeoid was constructed and, subsequently, converted to geoidal heights. The OSGM02 gravimetric geoid was then fitted to GPS/levelling. To accommodate different vertical datums, the GPS fitting was done in patches corresponding the various datums in use (i.e. Newlyn, Belfast, Malin Head and various island datums).
The final postfit error r.m.s. of the fitted geoid is 2 cm for the Great Britain and 3-4 cm for other areas.
Keywords. Geoid, quasi-geoid, fitting to GPS/levelling, vertical datums
1 Introduction
The years since the 1950’s have seen several pro-jects aimed at determining geoid models for the British Isles and Ireland, whether as part of regional or local initiatives or more specifically focussed on parts of these islands. Featherstone and Olliver (2001) give an overview of the history of geoid
models over the British Isles and Ireland. In 2001, a consortium consisting of the Ordnance Surveys of Great Britain (GB), Northern Ireland (NI) and Ireland invited tenders for the computation of a new geoid model for the British Isles and Ireland, the Ordnance Survey Geoid Model 2002 (OSGM02). This new project would for the first time utilise all available gravity, terrain and GPS/levelling data. The work was subsequently carried out by a team of contractors consisting of the National Survey and Cadastre (KMS), Denmark, Department of Geomatics Engineering, University College London, UK, and Department of Geophysics, University of Co-penhagen, Denmark. The objective was to construct a cm-geoid for the whole area. It was estimated that these requirements would be met with a data distribution of a 100 m × 100 m Digital Elevation Model (DEM), a gravity station coverage of one point per 1.5 km × 1.5 km on land, and one station per 5 km × 5 km offshore. In section 2 it is seen that, except for few areas, these requirements were fulfilled by the available data. The methodology used is described in section 3. Section 4 describes the procedure leading to the construction of OSGM02 gravimetric geoid. In section 5 the fitting to the GPS/levelling data is briefly described.
2 DEM and gravity data Members of the Ordnance Surveys Consortium provided DEMs for their respective territories in the national grids. A DEM for Isle of Man was pro-vided directly by the Isle of Man Government. For Northern Ireland and Eire, heights were given in the Irish Grid (OSI & OSNI, 2000), a Transverse Mer-cator projection on a modified Airy ellipsoid. For Great Britain, the DEM data were given in the Brit-ish National Grid on the OSGB36 datum; a Trans-verse Mercator projection on the Airy ellipsoid. The DEM for Great Britain, originally provided on a 50 m × 50 m grid (OSGB, 2001a), was a uni-form commercial product. The Isle of Man DEM, which is defined in the same national (horizontal) grid, but with different vertical datum, could be directly patched on top of the above grid. Eire and NI use the same national grid, the Irish Grid (OSI & OSNI, 2000), which made it quite straightforward to connect DEMs of both countries. The vertical datum associated with the Irish Grid is Malin Head (OSI & OSNI, 2000, Appendix C). Eire provided height data on a 10 m × 10 m grid, and Northern Ireland on a 50 m × 50 m. Some patches of DEM data were missing in Eire, and these voids were closed by interpolating from GTOPO30, a coarser 30’’×30’’ DEM downloaded through the National Geophysical Data Center, USA (see http://edcdaac.usgs.gov/gtopo30/README.html). The gravity data were obtained from three main data sources: the British Geological Survey (BGS), KMS (Denmark) and Bureau Gravimetrique Inter-national (BGI), France. Proprietary data from sev-eral sources were included: The Institute of Ad-vanced Studies (IAS, Dublin, Eire), the Geological Survey of Northern Ireland (GSNI) and the UK Hydrographic Office (HO). The gravity data from all sources were subjected to consistency tests, checking absolute gravity value, station height, location, free-air gravity anomaly and the Bouguer anomaly, and data con-verted from GRS67 to GRS80 as required. Gener-ally, the gravity data supplied were of high quality. One additional test was to compare the station heights of the gravity points with the interpolated height from the detailed DEMs. This comparison showed a mean bias below 2 m and a r.m.s. fit of 4-7 m, illustrating the high quality and internal consis-tency of the data set. Unadjusted marine gravity data from HO were supplied via BGS; other marine gravity data were supplied via BGI. These data were screened for gross errors using KMS99, a 1999 version of the global free-air gravity anomaly field derived from
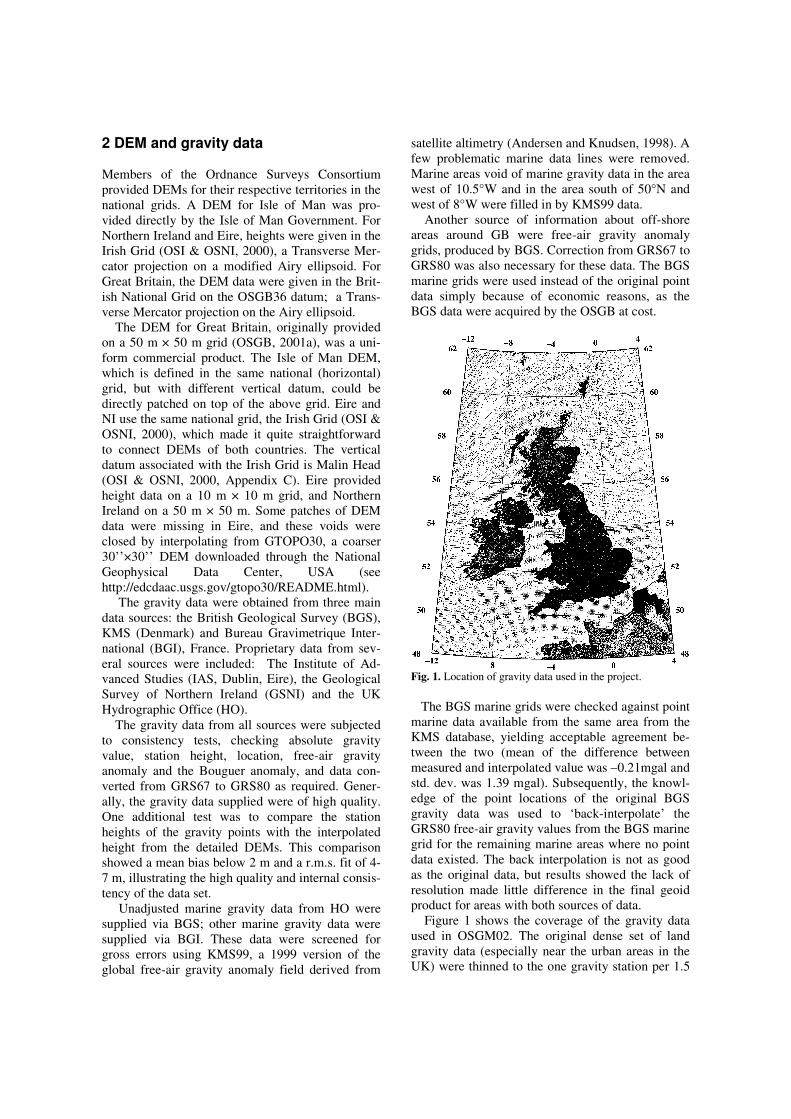
satellite altimetry (Andersen and Knudsen, 1998). A few problematic marine data lines were removed. Marine areas void of marine gravity data in the area west of 10.5°W and in the area south of 50°N and west of 8°W were filled in by KMS99 data. Another source of information about off-shore areas around GB were free-air gravity anomaly grids, produced by BGS. Correction from GRS67 to GRS80 was also necessary for these data. The BGS marine grids were used instead of the original point data simply because of economic reasons, as the BGS data were acquired by the OSGB at cost.
Fig. 1. Location of gravity data used in the project. The BGS marine grids were checked against point marine data available from the same area from the KMS database, yielding acceptable agreement be-tween the two (mean of the difference between measured and interpolated value was –0.21mgal and std. dev. was 1.39 mgal). Subsequently, the knowl-edge of the point locations of the original BGS gravity data was used to ‘back-interpolate’ the GRS80 free-air gravity values from the BGS marine grid for the remaining marine areas where no point data existed. The back interpolation is not as good as the original data, but results showed the lack of resolution made little difference in the final geoid product for areas with both sources of data. Figure 1 shows the coverage of the gravity data used in OSGM02. The original dense set of land gravity data (especially near the urban areas in the UK) were thinned to the one gravity station per 1.5

km × 1.5 km on land, and to one gravity station per 5 km × 5 km in marine areas. Only a few areas in Eire have significant gravity data voids, resulting in risk of geoid errors, see Figure 1. 3 Methodology The methodology for geoid construction is based on remove-restore techniques. The anomalous gravity potential T is split into three parts.
resRTMEGM TTTT ++= 96 (1)
where TEGM96 is the anomalous gravity potential of the EGM96 global field (Lemoine et al., 1998), TRTM is the anomalous gravity potential generated by the residual topography and Tres is the residual anomalous gravity potential residual, i.e. the the unmodelled part of the residual gravity field.
In this project, the height anomaly ζ, i.e. the quasi-geoid, was modelled via Bruns’ s equation
( )
),(,,H
HTφγ
λφζ = (2)
where γ is normal gravity, ϕ and λ are the geo-graphical latitude and longitude, and H is the Hel-mert orthometric height. From Eq.(1), the height anomaly ζ, i.e. the quasi-geoid, can also be split into three parts
resRTMEGM ζζζζ ++= 96 (3) Nevertheless, the overall goal is to model the classical geoid heights N, i.e. the geoid. The rela-tion between N and ζ is given approximately by
Hg
N B
0γζ
∆≈− (4)
where Bg∆ is the Bouguer anomaly. Computation of ζEGM96 is straightforward using
( ) ( )φλλ
γζ
sinsincos)(0
’
296
nm
n
mnmnmnm
nN
nEGM
PmSmCC
ra
aGM
∑
∑
=
=
+−×
×
=
(5
where G is the gravitational constant; M and a is the mass and the radius of the Earth; γ is the normal gravity; Cnm, Snm are harmonic coefficients; and C’ nm are zonal coefficients of the normal potential.
Computation of ζRTM is done relative to the mean elevation surface, see Figure 2. The effect of the high-frequency topography above this surface, both the gravity disturbances and the gravity potential, is modelled. The mean elevation surface was obtained from the DEM by filtering, i.e. by moving 9×9 cell average across a 4’ ×6’ averaged DEM, cf. Figure 3.
The geoid effect of the topography is
( ) ( ) ( )∫
∫ ∫=
=
∞
∞−
∞
∞−
−−+−
×=
),(
),(222
yxhz
yxhz QQQQQQ
QQQ
RTM
ref yxyxyx
dzdydx
Gγρζ
(6)
where ρ is the topographic mass density.
In practice, the computations of ζRTM were done in the frequency domain by Fourier methods. Equa-tion (6) can be expanded into infinite series of con-volutions in powers of h and href. In this project, a 3rd order term was included
( ) ( )
( ) ( ) −−−+
+−−−=
333
322
3
61
*61
*3
61
*31
*
shh
shhh
shhh
shh
G
refref
refrefRTM γρζ
(7)
where s is the horizontal distance between the grav-ity station in P and the DEM grid point in Q, and where * is the (2D-)convolution. The 3rd order expansion was an improvement to the earlier used linear approximation (Forsberg, 1985), with differ-ence up to few cm in the mountains. The corre-sponding RTM effects on gravity data were com-puted directly by space-domain prism integration using the dense height data.
The computation of ζres was performed using Stoke’ s integration (Heiskanen and Moritz, 1967), using the residual free-air anomaly ∆gres, i.e. what is left in the gravity data after the contributions of the RTM-effect, ∆gRTM, and the global field, ∆gEGM, were subtracted. In order to optimise modelling of ζres different modifications of Stokes’ s kernel S(ψ), where ψ is the spherical distance, were tried. A modified version of the Wong and Gore (1969) method, supplemented with a linear taper to avoid abrupt spectral discontinuities was used, i.e.
( ) ( ) ( ) ( )∑= −
+−=2
2mod cos
112N
nnP
nn
nSS ψαψψ (8)
with a linear tapering coefficient

( ) Nn
nNfor
NnNforNNnN
Nnfor
n ,,2,
0
21
2
2112
2
1
�=
≤
≤≤−−
≤≤
=α (9)
Fig. 2. RTM effect principle, from Forsberg (1985). Gravita-tional effect of the mass surplus and mass deficit of the detailed topography with respect to a mean elevation surface is removed computationally.
Fig. 3. Reference DEM, i.e. a mean elevation surface, ob-tained from detailed DEMs by filtering, see above, to ap-proximately 66 km spatial resolution. Geoid heights derived from GPS-levelling were used to find “optimised” values of N1 and N2, i.e. where the fit between the gravimetric geoid Ngrav
and the geoidal heights from GPS-levelling
NGPS = hellipsoidal – Horthometric (10)
is best in the least squares sense. The results indi-cated that the residual gravity field relative to EGM96 had some long wavelength components, and values of N1 = 12 and N2 = 15 were used for the final gravimetric geoid computation. Given the size of the area (NS×WE: 1445 km × 980 km) the rela-tively small values of N1 and N2 indicate that there is long-wavelength information left in the residual gravity data after the subtraction of EGM96. 4 OSGM02: gravimetric geoid The OSGM02 gravimetric geoid was constructed based on methodology described in Section 3. After reductions, the gravity data was gridded by least squares collocation with empirical correlation length 25 km and rms noise as defined by the data. A final screening for errors in the gravity data was carried out on ∆gres, cf. Figure 4.
Fig. 4. Residual free-air gravity anomalies ∆gres. Possible inconsistencies in the gravity data, which sometimes can pass undetected in the measured free-air gravity anomalies, often appear as spikes in the smoother ∆gres field. On the other hand, if the value of ∆gres is consistent with the values at neighbouring stations, and especially if these values correlate with known geology (e.g. continental shelf

structures or igneous intrusions), these data are not in error. Only relatively few detected individual spikes were removed from the data set in this final screening. For the marine data 11 suspicious loca-tions with anomalous ∆gres were investigated in details. It resulted in removal of 57 erroneous ma-rine data points (often a part of a marine survey line). Similarly, for the land data 7 suspicious loca-tions with anomalous ∆gres were investigated. 5 outliers were detected and removed. Height anomalies ζres were computed using the modified Stokes’ integration, see section 3. A multi-band spherical FFT method (Forsberg and Sideris, 1993) was used with 100% zero-padding to avoid the FFT periodicity effects. The atmospheric correc-tion on gravity was applied at this stage taking into account the dependence of height. Table 1. OSGM02 gravimetric geoid. Basic statistics of the different components of the model construction.
mgal or metre
mean std.dev. min. max.
∆g (mgal) 9.5 20.7 -75.8 167.9 ∆gres 1.0 8.9 -67.2 129.7
ζres (m) 0.11 0.26 -0.67 1.63 ζRTM 0.00 0.05 -0.24 0.50
ζGravim. 51.68 5.07 40.92 60.63 ζ - N 0.00 0.00 -0.06 0.04
N 51.68 5.07 40.92 60.63
Fig. 5. OSGM02 gravimetric geoid. Contour interval: 1m.
ζRTM was computed by the third-order expansion spherical FFT methods, cf. Eq. (7), on the 1.5 km basic resolution grid. Finally, ζEGM96, computed at the surface of topography was added to obtain the final quasigeoid. The quasigeoid was subsequently converted into the classical geoid N, referring to sea level, using the approximative formula Eq. (4), with Bouguer anomalies derived from the cleaned and gridded free-air anomalies. Table 1 shows the basic statistics of the differ-ent stages of the model construction. Figure 5 shows the final OSGM02 gravimetric geoid. 5 Geoid fitting to GPS/levelling The Ordnance Surveys Consortium requested the new gravimetric geoid to be fitted to their GPS/levelling data and to transfer the vertical da-tum across the British Isles The quantities to compare are the gravimetric geoidal heights Ngrav and the geoidal height NGPS from GPS/levelling, NGPS = h – H. The misfit ε
gravGPS NN −=ε (12)
includes datum differences, systematic errors and subsidence/uplift in the levelling, as well as errors in the gravimetric geoid. In practise, ε was modelled using a four-parameter Helmert model for the long wavelength trend and a second-order Gauss-Markov collocation fit for the residuals. For the UK an apriori error of 20 mm and a correlation length of 50 km was used. Table 2 shows the misfits of the fundamental (FBN) GPS levelling points for the mainland UK. The misfit ε has a mean of 13 cm and r.m.s. of 11 cm. The bias is unavoidable since NGPS and Ngrav refer to different datums. The r.m.s value is likely due to the well-known Ordnance Datum Newlyn (ODN) level-ling problem in the mainland UK; a NS-slope of some 0.053 m/degree of latitude (Thompson, 1980; Featherstone and Olliver, 1994). Figure 6 supports these results. The problem with different datums was handled by constructing individual geoid patches for each datum. Also, even for the same datum there can be problems. For example the Orkneys are in ODN, but the crossing from the mainland was done by trigonometric heighting. The geoid did not show a good fit across, indicating that the height transfer must be inaccurate. A separate Orkney geoid patch was done.
wadeg
Typewritten Text
and Ireland.
wadeg
Typewritten Text
wadeg
Typewritten Text

Table 2. GPS levelling geoid fits of UK FBN network (179 points). unit: meter Mean std. dev. min. max.
misfit Ngrav
-0.129
0.110
-0.431
0.081
misfit after 4-par. fit
0.000
0.032
-0.089
0.092
Table 3. Main datums. Post-fit GPS/levelling statistics. (Newlyn, GB: 179 points; Belfast, NI: 36 points; Malin Head, Eire: 110 points)
Unit: meter
mean std. dev. min. max.
Newlyn 0.000 0.004 -0.011 0.018 Belfast 0.002 0.019 -0.035 0.041
M. Head 0.003 0.024 -0.064 0.050
Fig. 6. Location of 179 ODN GPS/levelling points used in post-fit GPS/levelling statistics and the modeled geoid fit surface ε. Contour interval: 0.05 m. In Eire, several problems with GPS-levelling were discovered, in part due to levelling and in part due to GPS problems yielding a larger standard deviation. Table 3 shows the post-fit statistics for the main datums. Figure 6 shows the distribution of the GPS/levelling points. The off-sets between the main datums were inves-tigated by two methods: rigorous least-squares collocation with parameters (using a thinned-out data set covering all of the British Isles in one batch solution), and by direct comparison through height transfer to the OSGM02 gravimetric geoid. Colloca-
tion yielded 0.42 m between Newlyn datum and Malin Head, while OSGM02 yielded 0.31m be-tween the Newlyn datum and Belfast datum and 0.38m between the Newlyn datum and Malin Head datum. A height value in Newlyn datum would be numerically larger then the same height in the Irish datums, meaning the Irish geoid is above the New-lyn geoid. Due to the apparent tilt in the Newlyn datum in England, relative to the OSGM geoid model, an more accurate definition of the height difference seems not possible, and will depend on latitude. 6 Conclusion The OSGM geoid surface has been derived from dense height and gravity data, and fitted to available GPS datums. The quality of the gravimetric solution seems excellent, with a 3.2 cm r.m.s. misfit across the UK after subtracting a trend, taking into account an apparent slope of ODN. References Andersen O. B. and P. Knudsen: Global Marine Gravity Field
from the ERS-1 and GEOSAT Geodetic Mission Altimetry, J. Geophys. Res., 103(C4), 8129-8137, 1998.
Featherstone W.E. and J.G. Olliver: A New Gravimetric Deter-mination of the Geoid of the British Isles. Survey Review, 32, pp. 464-478,1994.
Featherstone W.E. and J.G. Olliver: A review of Geoid Models Over the British Isles: Progress and Proposals, Survey Re-view, 36, pp. 78-100, 2001.
Forsberg, R: Gravity field Terrain Effect Computations by FFT. Bulletin Geodesique, 59, pp. 342-360, 1985.
Forsberg, R., M. G. Sideris: Geoid computations by the multi-band spherical FFT approach. Manuscripta Geodaetica, 18, pp. 82-90, 1993.
Heiskanen, W. A., H. Moritz: Physical Geodesy. Freeman, San Francisco, 1967.
Lemoine, F.G., S.C. Kenyon, J.F. Factor, R.G. Trimmer, N.K. Pavlis, D.S. Chinn, C.M. Cox, S.M. Klosko, S.B. Luthcke, M.H. Torrence, Y.M. Wang, R.G. Williamson, E.C. Pavlis, R.H. Rapp and T.R. Olson: The Development of the Joint NASA GSFC and the National Imagery and Mapping Agency (NIMA) Geopotential Model EGM96. NASA/TP-1998-206861 report. Goddard Space Flight Center, Green-belt, Maryland, 1998.
Ordnance Survey Great Britain: “Land Form Panorama (DTM).” CD-ROMs, Business Geographic Product, 2001a.
Ordnance Survey Great Britain: “Land Form Panorama. User guide v3.0“. Received on a PDF-file panorama-web.pdf, 2001b.
Ordnance Survey Ireland & Ordnance Survey Northern Ireland: “The Irish Grid”. 2000.
Ordnance Survey Northern Ireland: “A Note on Levelling”, March 2000.
Thompson, K.: An analysis of British monthly mean sea level. Geophys J R astr Soc 63: 57-73, 1980.
Wong L. and Gore R.: Accuracy of geoid heights from modified Stokes kernels. Geophys J R astr Soc 18:81-91, 1969.
Related Documents


![5-Towards a New Geoid Model of Tanzania Using Precise ... · [8], the Tanzania geoid was computed using Gravity Field Modeling software developed by DTU-Space, Niels Bohr Institute](https://static.cupdf.com/doc/110x72/60574e8233f7787dd27928c2/5-towards-a-new-geoid-model-of-tanzania-using-precise-8-the-tanzania-geoid.jpg)


