.# # ORNLJSUb/94-SS110/04 The Development of Chemically Vapor Deposited Mullite Coatings for the Corrosion Protection of SiC May 1,1998 Report Prepared by Michael Auger, Ping Hou, Anita Sengupta, Somendra Basu, and Vinod Sarin Boston University Manufacturing Engineering 15 St Mary's Street Boston MA 02215 IV AUG 0 6 1938 OSTI under ORNL/S~b/94-SS110/04 for OAK RIDGE NATIONAL LABORATORY Oak Ridge, Tennessee 3783 1 Managed by LOCKHEED MARTIN ENERGY RESEARCH COW. for the U.S. DEPARTMENT OF ENERGY under contract DE-AC05-960R22464 SI

Welcome message from author
This document is posted to help you gain knowledge. Please leave a comment to let me know what you think about it! Share it to your friends and learn new things together.
Transcript

.# #
ORNLJSUb/94-SS110/04
The Development of Chemically Vapor Deposited Mullite Coatings for the Corrosion Protection of SiC
May 1,1998
Report Prepared by Michael Auger, Ping Hou,
Anita Sengupta, Somendra Basu, and Vinod Sarin
Boston University Manufacturing Engineering
15 St Mary's Street Boston MA 02215
IV AUG 0 6 1938
O S T I
under ORNL/S~b/94-SS110/04
for
OAK RIDGE NATIONAL LABORATORY Oak Ridge, Tennessee 3783 1
Managed by LOCKHEED MARTIN ENERGY RESEARCH COW.
for the U.S. DEPARTMENT OF ENERGY
under contract DE-AC05-960R22464
SI

DISCLAIMER
Portions of this document may be illegible in electronic image products. Images are produced from the best available original document.

The Development of Chemically Vapor Deposited Mullite Coatings for the Corrosion Protection of S i c
May 1, 1998
Research sponsored by the U.S. Department of Energy, Office of Fossil Energy
Advanced Research and Technology Development Materials Program
Report Prepared by Michael Auger, Ping Hou,
Anita Sengupta, Somendra Basu, and Vinod Sarin
Boston University Manufacturing Engineering
15 St. Mary’s Street Boston MA 02215
under ORNL/S~b/94-SS110/04
for
OAK RIDGE NATIONAL LABORATORY Oak Ridge, Tennessee 3783 1
Managed by LOCKHEED MARTIN ENERGY RESEARCH COW.
for the U. S . DEPARTMENT OF ENERGY
under contract DE-AC05-960R22464

Research sponsored by the US. Department of Energy, Fossil E n e r s Advanced b e a r c h and Technology Development Materials Prwam, DOEFE AA 15 10 10 0, Work Breakdown Structure Element BU-2
Abstract
Crystalline mullite coatings have been chemically vapor deposited onto Sic substrates to enhance the
corrosion and oxidation resistance of the substrate. Current research has been divided into three distinct
areas: 1) Development of the deposition processing conditions for increased control over ccating’s growth
rate, microstructure, and morphology, 2) Analysis of the coating’s crystal structure and stability, 3) The
corrosion resistance of the CVD mullite coating on Sic
Contents
1 Introduction
2 Experimental Procedure
4
5
3 Results and Discussion 8
Processing Conditions . . . . . . . . . . . . . . . . . . 8
3.1.1 Gas Velocity and Uniformity . . . . . . . . . ~ . . . . . . . . . . . . . . . . . . . . . . 10
Microstructures of the CVD Mullite Coating 17
3.2.1 17
3.2.2 . . . . . . . . . . . . . . . 22
3.3 Post Exposure Coal Slag . . . . . . . . . . . . . . . . . . . . . . . . . . . . . . . . . . . . . . . 22
3.4 Corrosion of AI203 . . . . . , . . . . . . . . . . . . . . . . . . . . . . . . . . . . . . . . . . . . 31
3.5 Corrosion of Mullite Substrate . . . . e . . . . . . . . . . . . . ~ . . . . . . . . . . . . . . . . 31
3.6 Corrosion of S i c . . . . . . . . . . . . . . . . . . . . . . . . . . . . . . . . . . . . . . . . . . . 32
3.7 Corrosion of CVD Mullite Coated S i c . . . . . . . . . . . . . . . . . . . . . . . . . . . . . . . 34
3.1 . . , . . . . . . . . . . . . . . . . . .
3.2 a . . . . . . . . . . . . . . . . . . . . . . , . . .
Mullite Coating on S i c Substrate . . e . . . . . . . . . . . . . , . , . . . . . . . . . . .
Mullite Coatings on Other Substrates . . . . . . . . . . .
4 Conclusions
5 Acknowledgments
35
44
1
List of Figures
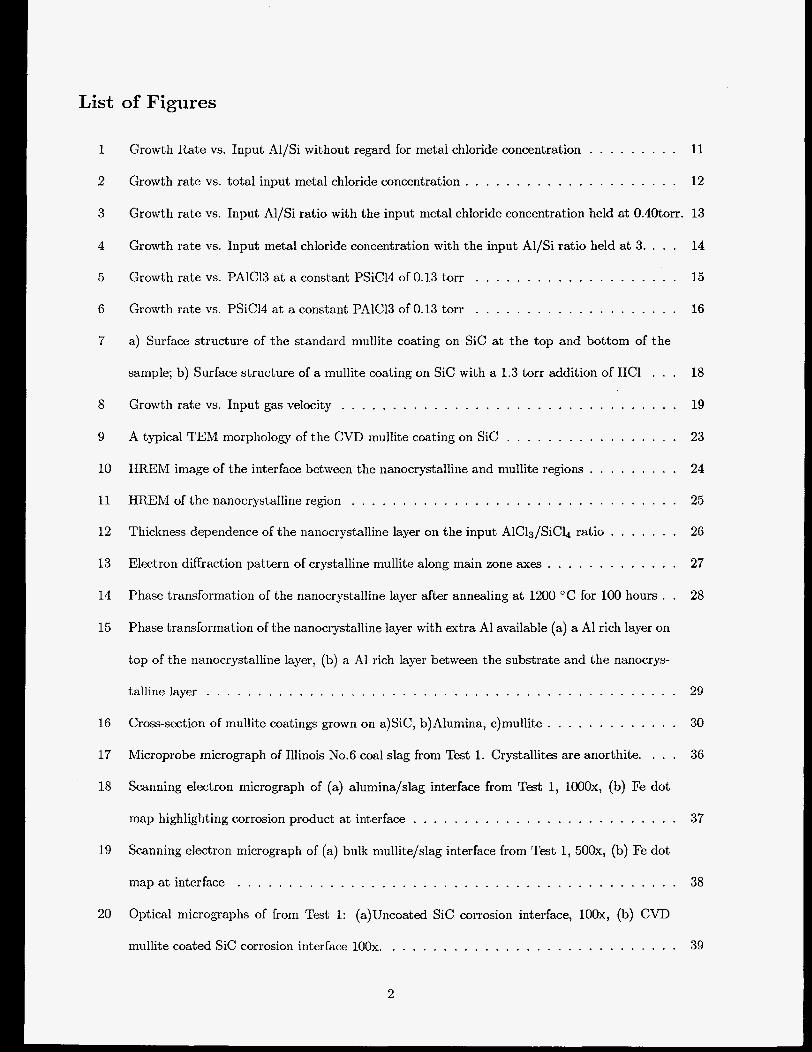
1 Growth Rate vs. Input Al/Si without regard for metal chloride concentration . . . . . . . . . 11
2 Growth rate vs. total input metal chloride concentration . . . . . . . . . . . . . . . . . . . . . 12
3 Growth rate vs. Input Al/Si ratio with the input metal chloride concentration held at OAOtorr. 13
4 Growth rate vs. Input metal chloride concentration with the input Al/Si ratio held at 3. . . . 14
5 Growth rate vs. PAlCl3 at a constant PSiC14 of 0.13 torr . . . . . . . . . . . . . . . . . . . . 15
G Growth rate vs. PSiC14 a t a constant PAlC13 of 0.13 torr . . . . . . . . . . . . . . . . . . . . 16
7 a) Surface structure of the standard mullite coating on S i c at the top and bottom of the
sample; b) Surface structure of a mullite coating on S i c with a 1.3 torr addition of HC1 . . . 18
. . . . . . - . . . . . 19
23
8
9
Growth rate vs. Input gas velocity . . . . . . . . . . . . . . . . .
A typical TEM morphology of the CVD mullite coating on S i c . . . , . . . . . . . . . . . . .
10
11
12
13
14
15
HREM image of the interface between the nanocrystalline and mullite regions . . . . . . 24
. . . 25
. . . 26
. . . 27
28
HREM of the nanocrystalline region . . . . . . . . . . . . . . . . . . . . . . . . . .
Thickness dependence of the nanocrystalline layer on the input AlClS/SiCl* ratio . . ,
Electron diffraction pattern of crystalline mullite along main zone axes . . . . . . . . .
Phase transformation of the nanocrystalline layer after annealing at 1200 "C for 100 hours . .
Phase transformation of the nanocrystalline layer with extra A1 available (a) a A1 rich layer on
top of the nanocrystalline layer, (b) a A1 rich layer between the substrate and the nanocrys-
talline layer . . . . . . . . . . . . . . . . . . . . . . . . . . . . . . . . . . . . . . . , . . . . . .
Cross-section of mullite coatings grown on a)SiC, b)Alumina, c)mullite . . . . . . . . . . . . . Microprobe micrograph of Illinois No.6 coal slag from Test 1. Crystallites are anorthite. . . .
Scanning electron micrograph of (a) alumina/slag interface from Test 1, lOOOx, (b) Fe dot
29
30
36
16
17
18
map highlighting corrosion product a t interface . . . . . . . . . . . . . . . . . . . . . . . . . . Scanning electron micrograph of (a) bulk mullite/slag interface from Test 1, 50Ox, (b) Fe dot
map at interface . . , . . . . . . . . . . . . . . . . . . . . . . . . . . . . . . . . . . . . . . . .
Optical micrographs of from Test 1: (a)Uncoated S i c corrosion interface, lOOx, (b) CVD
mullite coated S i c corrosion interface IO&. . . . . . . . . . . . . . . . . . . . . . . . I
37
19
38
20
I . . 39
2

21 Uncoated S i c corrosion pit from Testl: (a) SEM micrograph. 20Ox . (b) Fe dot map dot
map(c) Si dot map . . . . . . . . . . . . . . . . . . . . . . . . . . . . . . . . . . . .
Optical micrograph of 2-phase iron silicide corrosion region from Test1 . . . . . . .
CVD mullite coating region from Testl: (a)SEM of slag/mullite/coating interfaces. 2500X (b)
A1 dot map. (e) Fe dot map. (d) Si dot map . . . . . . . . . . . . . . . . . . . . . .
Comparison of corrosion rates of Coated and Uncoated S i c . . . . . . . . . . . . .
22
23
24
. . . 40
. . . 41
. 42
. . . 43
List of Tables
5
G
7
8
Composition of mullite substrate (Coors Ceramic Co.) as determined by microprobe analysis G
Composition and Base/Acid ratio of Illinois No.6 coal slag as determined by microprobe analysis 7
Coal slag corrosion test conditions . . . . . . . . . . . . . . . . . . . . . . . . . . . . . . . 8
Composition at the nano-crystalline-crystalline mullite boundary . . . . . . . . . . . . . . . . 20
Diffraction Pattern of the Nano-Crystalline Region . . . . . . . . . . . . . . . . . . . . . . . . 21
Microprobe analysis of the 2-phase iron silicide corrosion product at the Sic-slag interface . . 32
Average slag pitting depth and parabolic corrosion rate constant . . . . . . . . . . . . . . . . 33
Stress in selected materials caused by thermal expansion mismatch with the coal slag . . . . . 35
3

1 Introduction
The continued interest in improving energy efficiency has led t o extensive research related t o improved fuel
efficiencies in fossil fuel powered combustion processes. To raise the energy efficiency and reduce emissions
of coal fired power systems, higher working fluid temperatures are required. Therefore, the traditional metal
based heat exchangers which are limited t o temperatures of 800°C t o 900°C, must be replaced by ceramic
heat exchangers that can withstand working temperatures of up t o 1400°C [l, 2, 3, 4, 51.
Silicon carbide-based materials such as sintered Sic , siliconized Sic , or a composite containing S i c are
promising candidate materials for high temperature applications such as heat exchangers, gas turbines,
and internal combustion engines. These materials possess a good combination of physical and mechanical
properties such as high strength and thermal conductivity, low thermal expansion coefficients, as well as
thermal shock and oxidation resistance at temperatures above 1000°C. The oxidation resistance of these
ceramics is due to the formation of a thin silica layer on the surface under oxidizing conditions. However,
the usefulness of these materials is limited in the presence of molten salts. In the presence of these melts,
the protective silica layer forms liquid silicates at temperatures as low as 800°C leading t o rapid degradation
of the ceramic by hot corrosion [GI. The coal gasification reaction produces an extremely corrosive wood
ash deposit called coal slag. At high gasification operating temperatures (T>1100"C) the slag is liquidous
and contains numerous oxides that react with the unprotected refractory lining of the process vessels. The
reaction between liquid slag and silicon carbidebased ceramics results in severe pit formation, material loss,
and increased porosity. Coal slag attack of S i c is well documented and has been shown t o reduce the room
temperature strength and fracture properties of the Sic-based ceramics [7].
The need to reduce and/or prevent coal slag corrosion, has led t o the development of protective coatings
that will enhance corrosion resistance in high temperature slag environments. The application of a thin
refractory oxide coating t o silicon carbide based materials has been studied as a possible method to improve
coal slag corrosion resistance. Alumina (Alaos) based coatings have been studied by several researchers
due t o their superior corrosion resistance, but failed due t o thermal expansion stresses between alumina and
SiC[8]. Further investigations have shown that alumina is unsuitable in the coal slag combustion environment
4

due t o cracking most likely caused by thermal expansion coefficient mismatch between the coal slag and
alumina [4].
Mullite (3A1203.2Si02) has been targeted as a potential coating material for silicon carbide-based ce-
ramics due t o the close coefficient of thermal expansion match between the two materials and the reported
superior corrosion resistance of mullite. Mullite has received considerable attention as a high temperature
material because of its unique ability to retain its strength, resist creep, and avoid thermal shock failure at
elevated temperatures[9, 10, 11, 121. Theoretically dense and homogenous bulk mullite ceramics are difficult
t o produce using traditional powder processing techniques. Previous attempts t o grow mullite coatings by
various processing methods have met with limited success[l3]. Most commonly reported techniques require
a post deposition heat treatment t o convert the amorphous alumina-silicate into crystalline mullite [14, 151.
To overcome these deficiencies, the direct formation of chemically vapor deposited (CVD) mullite coatings
has been investigated. The CVD process results in dense adherent coatings with the ability to control
microstructural and morphological properties.
A systematic analysis of the thermodynamics and kinetics of the process is necessary in order to control the
microstructure and morphology of the resultant coating. This information becomes increasingly important
when depositing a multi-component system such as mullite [16]. Equilibrium thermodynamic analysis was
performed on the CVD mullite system in order to establish equilibrium reaction products at various operating
conditions and has been detailed in previous publications [17, 181. Kinetic data for deposition environments
is sparse and usually limited to simple systems [19]. Initial kinetic evaluations on the CVD mullite system
have been performed and continue in the present work [20]. Current research has focused upon the kinetics of
mullite deposition, nucleation and growth evolution, as well as the thermal stability and protective properties
of mullite coatings.
2 Experimental Procedure
A CVD reactor consisting of a vertical hot-walled reactor with a resistively heated three-zoned furnace was
used for the deposition of CVD mullite coating. The deposition techniques are detailed in previous literature
[all. The reactants used in the formation of mullite are AlC13, SiCb, COz, H2, and Ar as a dilutant. A1C13 is
5

Oxide W t % Si02 Ti02 A1203 FeO MgO CaO Mullite Grain 25.45 0.61 69.82 0.33 0.08 0.0 Silicate Matrix 71.89 2.517 13.43 1.8064 0.8278 0.6075
Table 1: Composition of mullite substrate (Coors Ceramic Co.) as determined by microprobe analysis
formed by chlorinating heated A1 chips; Sic14 was introduced by evaporating the liquid at room temperature.
Excess H2 was present t o ensure complete reduction of the metal chlorides to form HCl before exiting the
chamber. All CVD mullite coatings reported in this study were deposited at 75 torr and 950°C. All coatings
were characterized through X-ray diffraction (XRD) and scanning electron microscopy (SEM). Selected
coatings were characterized with energy dispersive spectroscopy (EDS) , transmission electron microscopy
(TEM), and scanning transmission electron microscopy (STEM). Electron probe microanalysis (EPMA) of
corrosion products and substrate composition was performed using a JEOL JXA-733 superprobe.
In order t o investigate possible the phase transformations within the nanocrystalline layer, three types
of coatings were deposited on S i c substrates: 1) Only a nanocrystalline layer; 2) An A1 rich layer between
the substrate and the nanocrystalline layer; 3). A nanocrystalline layer and an A1 rich layer on the top. A
thin A1 rich layer was achieved on the bottom and the top of the coating by simply switching off the S i c k
flow at the first and last 30 minutes of the experiment. These samples were annealed at 1200 "C for up t o
100 hours.
Four different materials were tested in the coal slag corrosion environment: a-Al2O3 , mullite, Sic, and
CVD mullite coated Sic . Polished bars of 3x 4 x 20mm Hexaloy S i c (Carborundum Co., Niagara Falls,
N.Y.), a-Al2O3 , and mullite (Coors Ceramic Co., Golden, CO) were prepared t o a 600 grit finish. X-ray
diffraction of the A1203 revealed corundum (a) t o be the only crystalline phase. X-ray diffraction of the
S i c revealed a mixture of hexagonal and cubic phases (6H, 4H, 2H, 4C). Orthorhombic mullite was the only
crystalline phase detected in the as received mullite substrates, although microprobe analysis indicated that
the material was a porous heterogeneous mixture of mullite grains containing trace amounts of FeO, TiO2,
and MgO in an SiOz-rich matrix containing significant amounts of Ala03 with trace amounts of FeO, TiO2,
and MgO(see Table 1).
The coal slag utilized was formed from Illinois No. 6 wood ash. Illinois No. 6 is an iron rich acidic wood
ash deposit found in Eastern US Coal Power Plants (Table 2). It was collected at the Illinois Power Company's
6

I Oxide I Wood Ash I Cryst. Slag I Uncryst. Slag I I W t % I W t % I W t % I
Si02 53.4 57.38 57.56 A1203 18.6 18.71 17.32 Fe203 17.6 13.54 12.87 Ti09 0.7 0.902 0.9955 P205 0.0 0.0416 0.0016 CaO 7.1 3.44 3.56 M a 0 0.9 1.6843 1.6494 - Na2 0 0.0 0.1601 0.1657 K2O 1.7 1.7911 1.9217
Base/Acid 0.376 0.268 0.266 so3 0.1 0.0 0.0
Table 2: Composition and Base/Acid ratio of Illinois No.6 coal slag as determined by microprobe analysis
Baldwin Plant and supplied by the Energy and Environmental Research Center at the University of North
Dakota. Initially, the coal slag used t o perform these corrosion studies was in the form of an amorphous
grey colored wood ash. In order to remove excess carbon from the wood ash, it was preheated in an alumina
crucible at 900°C for four hours under a simulated gasification atmosphere[22].
A coal slag corrosion unit was built at the Boston University Surface Modification Laboratory for the
slag corrosion studies. The unit has a controllable atmosphere with a high temperature reaction chamber.
The atmosphere of the gasifier was simulated by 30% H2,45% CO, and 25% co2[22]. The trays were placed
inside of the furnace reaction chamber and ramped up t o the test temperature of 1260°C. Assuming that
the input gasses react t o thermodynamic equilibrium at 1260°C a reducing environment is present with
& = 1.61 and e = 4.19. A test temperature of 126OOC was chosen t o simulate the actual operating
temperature inside a typical coal gasifier [23].
Four different types of coal slag corrosion tests were performed. Test 1 was a continuous 300 hour
exposure a t the test temperature 1260°C, the atmosphere simulated gasification conditions at a pressure
of 40 torr. Test 1 was performed to determine the long term corrosion resistance of the samples. Tests
2, 3, and 4 were a short duration time study to determine the corrosion mechanisms and rates governing
the diffusion and corrosive reactions between the slag and test samples. The time study was performed at
12G0°C, atmospheric pressure (760 torr), with an air atmosphere (Table 3).
Thermodynamic analysis of possible coal slag corrosion reactions with CVD mullite coatings, Sic , a-
A1203 , and mullite were performed using SOLGAS MIX PV, free energy calculations were obtained with
7

I Test I Duration I Temp I 1
I Atmosphere I 300 hrs I 1260°C I 30%Hz. 45%CO, 25%co2 1 - . -
2 10 hrs 126OOC Air 3 20 hrs 1260°C Air
t 4 I 40 hrs 1 1260°C I Air
Table 3: Coal slag corrosion test conditions
F*A*C*T [28,29]. These software systems are based upon a minimization of Gibb’s free energy of all possible
reactant species. Hardness values were collected using a Knoop microindentor at a 25g load with a Wilson
Tulron@ Series 200 hardness tester.
3 Results and Discussion
Current efforts on the CVD mullite system have been divided into three separate areas: 1) Deposition process
conditions, and the effects on the resultant coating, 2) The thermal stability and structure of the coating
substrate system, 3) The properties of CVD mullite coatings in a coal gasification environment.
3.1 Processing Conditions
CVD mullite coatings exhibit an unusual coating evolution on Si-based substrates [17, 301. The coating
initiates as a nano-sized mixture of y-A1203 in an amorphous Si02 matrix. As the coating grows away
from the substrate the Al/Si ratio steadily increases. When the ratio reaches a critical ratio of - 3/1 the
columnar mullite grains begin growing with a steadily increasing Al/Si ratio. The causes of this evolution
are poorly understood, and will be further discussed in Sec. 3.2. The influences of process variables such as
metal chloride concentrations and input Al/Si upon the coating growth rate and morphology are discussed
in the present section.
Achieving a given input AI/Si ratio is achieved by proportionally varying the flow rates of A1C13 and Sic14
into the deposition reactor. There are several methods t o achieve the desired ratio including: 1) varying
the S i c 4 flow rate and holding AlC13 constant, 2) varying the AlC13 flow rate and holding Sic14 constant,
and 3) varying both AICl3 and Sic14 and holding the total metal chloride concentration constant. Each of
these methods has been investigated and is discussed. The total metal chloride concentration is referred to
8
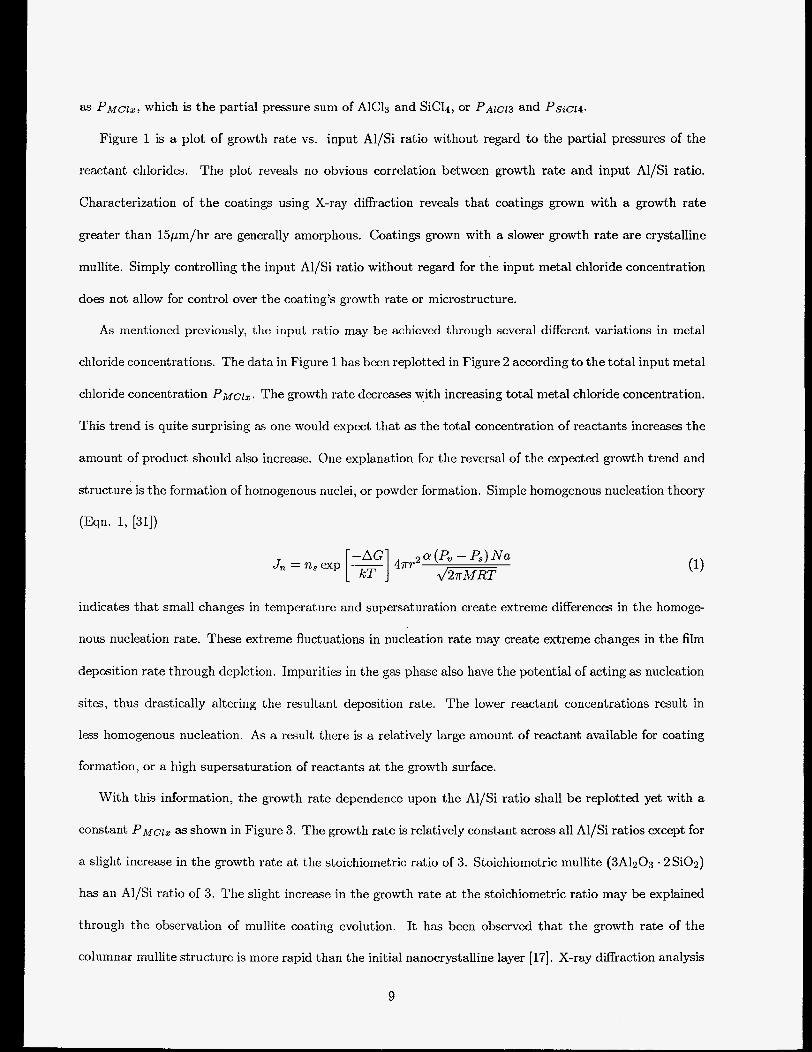
as PMClz, which is t he partial pressure sum of and sic14, or P A l C l 3 and Psicr4.
Figure 1 is a plot of growth rate vs. input Al/Si ratio without regard t o the partial pressures of the
reactant chlorides. The plot reveals no obvious correlation between growth rate and input AI/Si ratio.
Characterization of t he coatings using X-ray diffraction reveals that coatings grown with a growth rate
greater than 15pm/hr are generally amorphous. Coatings grown with a slower growth rate are crystalline
mullite. Simply controlling the input AI/Si ratio without regard for the input metal chloride concentration
does not allow for control over the coating’s growth rate or microstructure.
As mentioned previously, the input ratio may be achieved through several different variations in metal
chloride concentrations. The data in Figure 1 has been replotted in Figure 2 according to the total input metal
chloride concentration P ~ c l ~ . The growth rate decreases with increasing total metal chloride concentration.
This trend is quite surprising as one would expect that as the total concentration of reactants increases the
amount of product should also increase. One explanation for the reversal of the expected growth trend and
structure is the formation of homogenous nuclei, or powder formation. Simple homogenous nucleation theory
( ~ q n . 1, ~311)
-AG cy (Pv - Ps) N a Jrn J, = n, exp [ F ] 4m-2
indicates that small changes in temperature and supersaturation create extreme differences in the homoge-
nous nucleation rate. These extreme fluctuations in nucleation rate may create extreme changes in the film
deposition rate through depletion. Impurities in the gas phase also have the potential of acting as nucleation
sites, thus drastically altering the resultant deposition rate. The lower reactant concentrations result in
less homogenous nucleation. As a result there is a relatively large amount of reactant available for coating
formation, or a high supersaturation of reactants at the growth surface.
With this information, the growth rate dependence upon the AI/Si ratio shall be replotted yet with a
constant PMClZ as shown in Figure 3. The growth rate is relatively constant across all AI/Si ratios except for
a slight increase in the growth rate at the stoichiometric ratio of 3. Stoichiometric mullite (3A1203 . 2 Si02)
has an AI/Si ratio of 3. The slight increase in the growth rate at the stoichiometric ratio may be explained
through the observation of mullite coating evolution. It has been observed that the growth rate of the
columnar mullite structure is more rapid than the initial nanocrystalline layer [17]. X-ray diffraction analysis
9

of the coatings grown with an input ratio of 3/1 reveal a highly textured coating in the (001) direction, as
will be discussed further in Sec. 3.2. This growth direction corresponds t o the lowest energy growth direction
when mullite is prepared using numerous traditional and non-traditional means [32].
Stoichiometric mullite (3A1203 - 2Si02) has an Al/Si ratio of 3 so careful attention has been paid t o
coatings grown within this ratio. As can be seen in Figure 1 a large variation in growth rate has been
achieved at this input ratio. Figure 4 further constrains the reactant metal chloride to the stoichiometric
ratio of 3/1.
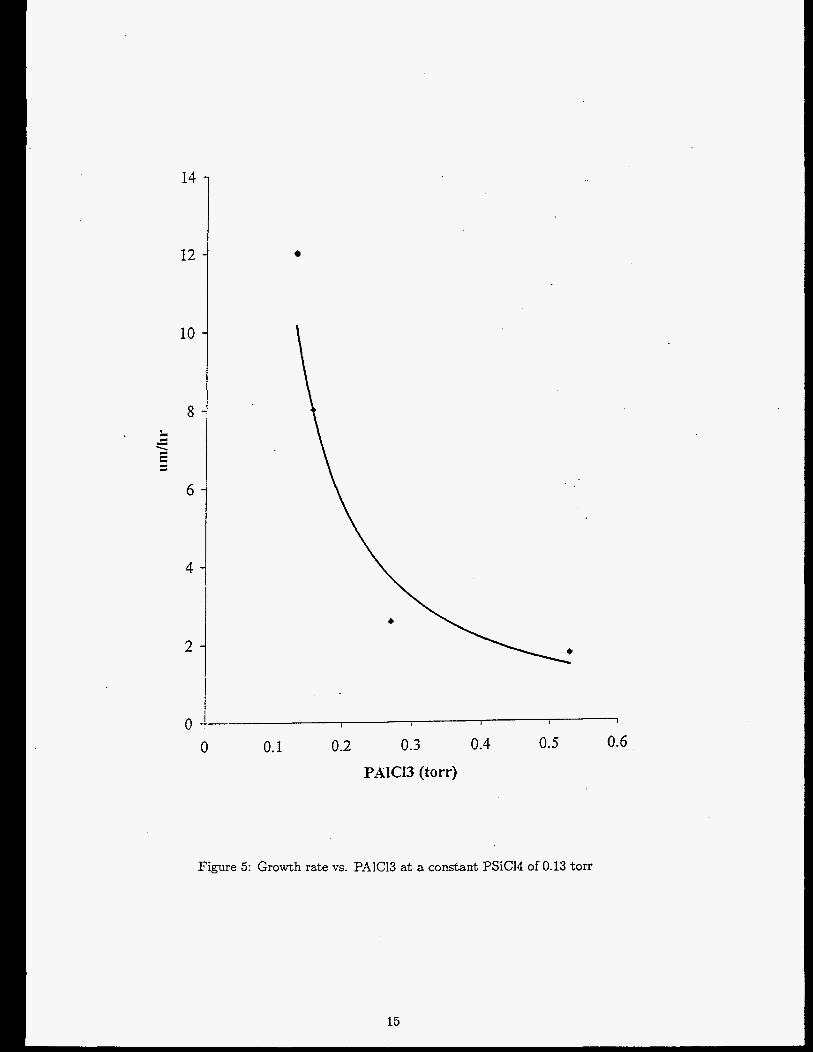
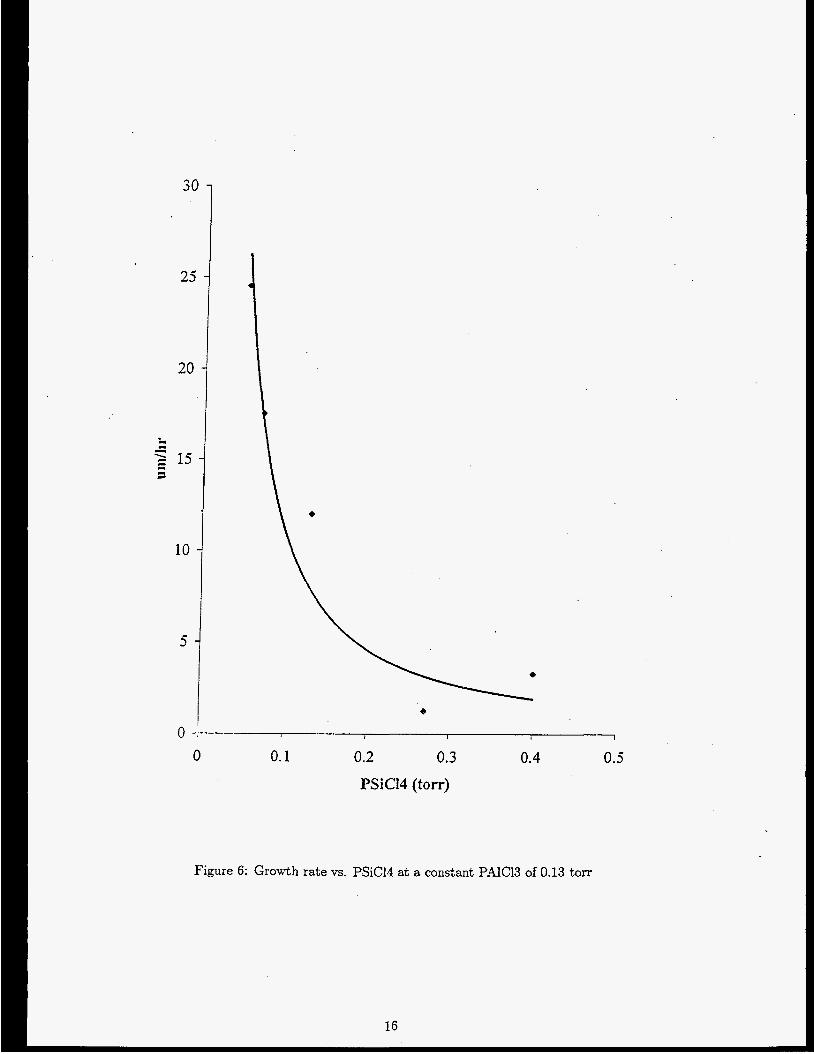
The final two methods of altering P M C ~ ~ investigated are altering either Psi c14 or P A I C ~ ~ and holding the
other constant. The growth rate decreases with increasing individual metal chloride concentration. These
trends are shown in Figures 5, G A critical value of P,4[C13 seems t o exist between 0.13 and 0.27 torr where
a dramatic decrease in growth rate takes place. Homogenous nucleation theory (Eqn. 1) exhibits a critical
supersaturation where a dramatic increase in homogenous nucleation occurs.
Input gas stoichiometry and reactant concentration have a tremendous effect upon the microstructure,
morphology, and growth rate of the resultant coating. Studies in this area are a continuation of previous
investigations 1161. These results have shown that the resultant coating is dependent upon both the input
AI/Si ratio and the concentrations of AlC13 and SiC14. The deposition system is not mass transport limited
with regard t o the metallic elements. A similar growth trend has been reported in the CVD A1203 system
deposited from AlC13, H2, C02 [33].
3.1.1 Gas Velocity and Uniformity
The uniformity of the deposited coating is an important issue, and one that is particularly sensitive in
CVD oxide coatings. Previous results have revealed that CVD mullite is susceptible t o non-uniformity due
to either gas-phase depletion or temperature differences on the deposition surface [34]. The dependence
between growth rate and the partial pressure of reactants reveals that powder formation is a significant issue
for the mullite system within the deposition environment. The kinetics of gas phase and surface reactants
are dominating the properties of the resultant coating. Reducing powder formation may be achieved through
Le’Chatelier’s Principle where small additions of products gases to the reactant mixture will decrease product
10

35.̂
30.1
25.(
A + 20.c 
a2 Y - d - - - s 2 15.0 U
10.0
5.0
4
4
4
4 * 4 *
* 8 0.0 ! I 0.0 0.5 1.0 1.5 2.0 2.5 3.0 3.5 4.0 4.5 5.0
AVSi
Figure 1: Growth Rate vs. Input Al/Si without regard for metal chloride concentration

0
0.1 0.2 0.3 3.4 0.5 3.5 0.7 3.8 0.9 PMClx (torr)
Figure 2: Growth rate vs. total input metal chloride concentration

e
+ e
0 0.5 1 1.5 . 2 2.5 3 3.5 4 d.5 5
AUSi .
Figure 3: Growth rate vs. Input Al/Si ratio with the input metal chloride concentration heId a t 0.40torr.

30 7 2:
2C
10
5
0 0 0.2 0.4 0.6
PMClx (torr) 0.8 1
Figure 4: Growth rate vs. Input metal chloride concentration with the input AI/% ratio held at 3.
14
12
10
8
6
4
2
0 0
I I i I 1
0.1 0.2 0.3
PAICW (torr)
0.4 0.5
Figure 5: Growth rate vs. PAlC13 a t a constant PSiCl4 of 0.13 torr
15
0.6
25
20
10
5
0 I 1 I I I
0 0.1 0.2 0.3 0.4 0.5 PSiCI4 (torr)
Figure 6: Growth rate vs. PSiCI4 at a constant PAIC13 of 0.13 torr

formation.
It is speculated that powder formation in this system is related to the reduction of the metal chlorides with
H2, forming HC1 and subsequent metal combination with H2O to form a metal oxide species. The addition
of HC1 t o the reactant gases may slow this gas phase formation reducing the thermodynamic driving force
for product formation. The overall reaction is given below in Eqn. 2 where the forward reaction constant
K, is determined by AG=-RTlnK, .
Experimental results reveal that slight additions of HC1 have drastically reduced the amount of gas phase
depletion and increased the uniformity of the coating. Figure 7 illustrates the effect of a 1.3 torr addition
of HCl. The samples were placed vertically within the reactor with the gas stream entering a t the bottom
of the sample and exiting at the top. The sample with the HCl added to the reactant mixture is uniform
in structure, morphology, and growth rate; whereas the sample without HC1 added is non-uniform. From
these results it can be concluded that a majority of the non-uniformity previously exhibited in this system
was due t o gas phase depletion and not temperature disparities on the deposition surface.
The second method of reducing homogenous nucleation is t o reduce residence time available for the
formation of critical nuclei. The effect of gas velocity on growth rate is shown in Figure 8. As the gas
velocity increases the growth rate decreases. This is another strong indication that the coating is within
the kinetically controlled regime as opposed t o mass transport control. Similar results have been reported
for both Si02 and Ala03 deposition using the same precursors [35, 361. The coatings grown at the higher
velocities are also more uniform with less gas phase nucleation occurring.
3.2 Microstructures of the CVD Mullite Coating
3.2.1 Mullite Coating on S i c Substrate
The kinetics of multi-component CVD coatings are complex. Critical kinetic reactions are occurring in
the gas phase (homogeneously) and on the substrate surface (heterogeneously). On an Si-based material
17

TOP Of Sample
Bottom Of Sample
Figure 7: a) Surface structure of the standard mullite coating on Sic at the top and bottom of the sample;
b) Surface structure of a mullite coating on Sic with a 1.3 torr addition of HCI

1.6 l-* 1 1.4
1.2 { 2 1 -
3 0.8 -
rn
2 W
0.6 -
0.4 -
0.2 -
I 0 1 1 I I 1
0 200 400 600 800
Gas Velocity (cm/sec)
Figure 8: Growth rate vs. Input gas velocity

' Input Al/Si Al/Si 63 boundary LT,
2 3.13 0.25 3 3.27 0.32
Table 4: Composition at the nano-crystalline-crystalline mullite boundary
the coating initiates as a nano-sized mixture of y-Al203 in an amorphous matrix. As the coating gows
away from the substrate the AI/Si ratio in the coating steadily increases. When the ratio reaches a critical
ratio of N 3/1 columnar mullite grains nucleate. An input Al/Si ratio of <3 results in a relatively thick
nano-crystalline layer, whereas an Al/Si ratio >3 results in a relatively thin nano-crystalline layer.
The unusual nucleation and growth evolution of CVD mullite on Si-based substrates has lead to an
investigation of this phenomenon. The results indicate that there is a kinetic dependence within the gas
phase and on the nucleating surface. These parallel kinetic dependencies has been observed for the deposition
of Si02 and Ala03 using the same precursors [35, 361. These parallel dependencies have been described as
the dependence on the water-gas shift reaction (Eqn. 3 ) . It is believed that the reaction between the metal
chlorides and H2O take place in the gas phase and on the deposition surface.
CO2 4- H2 --t H2O 4- CO (3)
The AI/Si variance of coatings grown with an input ratio of 2 and 3 were analyzed by STEM and it
was observed that the AI/% ratio of the coating increased as the coating grew way from the substrate. The
composition at the nano-crystalline/crystalline boundary was evaluated and is summarized in Table 4.. The
average Al/Si ratio at the boundary of the two samples is very close, a singlefactor variance analysis reveals
that the average values are the same for the two samples. Essentially the transition from nano-crystalline
y - AZ2O3 t o columnar mullite has taken place at the same composition point in the coating. The thickness
of the nano-crystalline layer changes with the input AI/Si ratio, but the transition to columnar mullite is
dependent upon the composition of the coating.
In general, composition, particle size, and degree of mixing of precursor materials are considered t o be the
most important factors for mullite formation. The formation of mullite depends on short distance diffusion or
re-arrangement of precursor a t o m for homogeneous mixing [24,25]. In the CVD process, multi-components
mix and react at the atomic or molecular level.
20
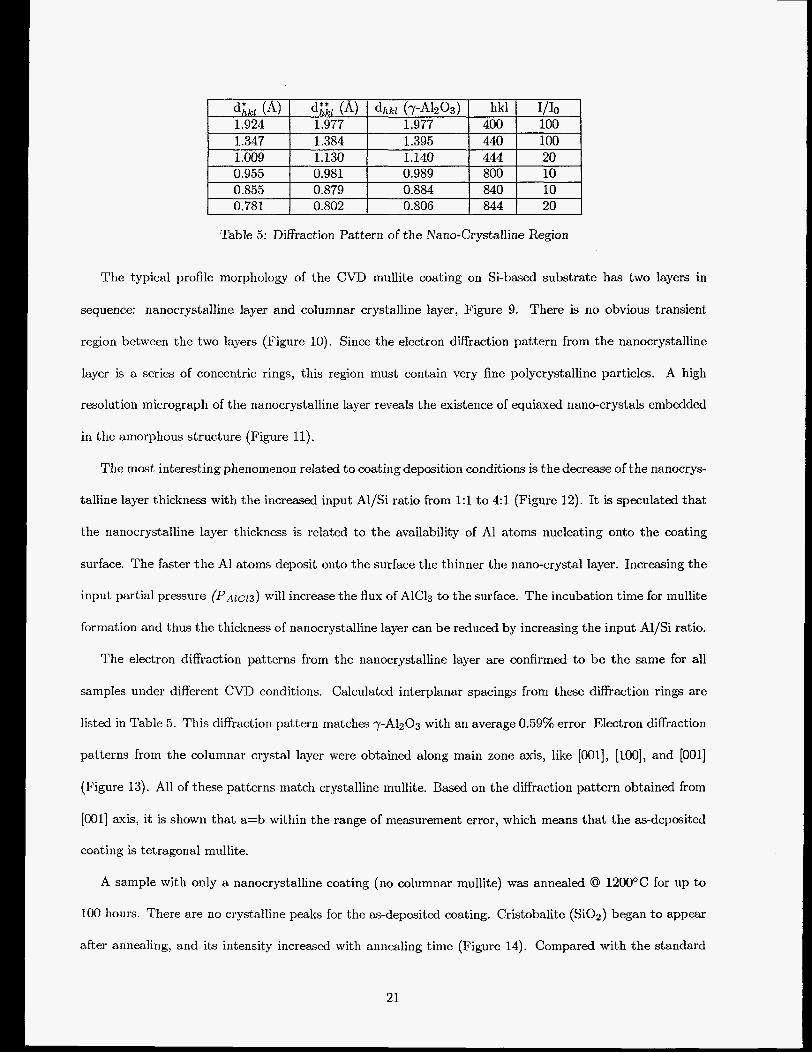
Table 5: Diffraction Pattern of the Nano-Crystalline Region
The typical profile morphology of the CVD mullite coating on Si-based substrate has two layers in
sequence: nanocrystalline layer and columnar crystalline layer, Figure 9. There is no obvious transient
region between the two layers (Figure 10). Since the electron diffraction pattern from the nanocrystalline
layer is a series of concentric rings, this region must contain very fine polycrystalline particles. A high
resolution micrograph of the nanocrystalline layer reveals the existence of equiaxed nano-crystals embedded
in the amorphous structure (Figure 11).
The most interesting phenomenon related to coating deposition conditions is the decrease of the nanocrys-
talline layer thickness with the increased input Al/Si ratio from 1:l t o 4:l (Figure 12). It is speculated that
the nanocrystalline layer thickness is related to the availability of A1 atoms nucleating onto the coating
surface. The faster t he AI atoms deposit onto the surface the thinner the nano-crystal layer. Increasing the
input partial pressure (P~ lc l3 ) will increase the flux of AlC13 to the surface. The incubation time for mullite
formation and thus the thickness of nanocrystalline layer can be reduced by increasing the input Al/Si ratio.
The electron diffraction patterns from the nanocrystalline layer are confirmed to be the same for all
samples under different CVD conditions. Calculated interplanar spacings from these diffraction rings are
listed in Table 5. This diffraction pattern matches 7-AI2O3 with an average 0.59% error Electron diffraction
patterns from the columnar crystal layer were obtained along main zone axis, like [OOl], [loo], and [OOl]
(Figure 13). All of these patterns match crystalline mullite. Based on the diffraction pattern obtained from
[Ool] axis, it is shown that a=b within the range of measurement error, which means that the as-deposited
coating is tetragonal mullite.
A sample with only a nanocrystalline coating (no columnar mullite) was annealed @ 1200°C for up to
100 hours. There are no crystalline peals for the as-deposited coating. Cristobalite (SiOa) began t o appear
after annealing, and its intensity increased with annealing time (Figure 14). Compared with the standard
21
spectrum of polycrystalline cristobalite powder, the average position of the peaks shifted to the left of the
strongest (101) peak of cristobalite by 26 =0.15". It might be caused by two reasons: (1) lattice distortion of
materials; (2) sample deviation from the center of the diffractometer. An experiment, in which the sample
was deliberately loaded 0.2 mm lower and higher off the diffractometer center, was designed to examine the
influence of the sample position. The result showed that the average shift of 26 was about 0.10" in our system.
It was, however in practical operation, improbable t o have such a large amount of deviation when loading
samples. Thus the shift of the peak is caused by the distortion of the crystal lattice. Some xSiOy(l-x)Alo03
phases may form at elevated temperature, which caused a slight dilation of the Si02 lattice. If a thin Al-rich
layer was deposited below or above the nanocrystalline layer, it will crystallize t o mullite after annealing
(Figurel5). Extra A1 must be available for the formation of crystalline mullite in the nanocrystalline layer.
3.2.2 Mullite Coatings on O t h e r Substrates
The substrate dependence upon the growth evolution of the coating has been investigated by comparing
coatings grown on sic, A1203, and mullite substrates. SEM micrographs of these coatings are given in
Figure 16. Using STEM and EDS it was determined that the CVD mullite on S i c has evolved as expected
beginning as a nano-crystalline layer of y-A1203 and amorphous Si02 . The CVD mullite grown on a solid
mullite substrate has grown as nanocrystalline mullite throughout the coating. The CVD mullite grown on
A1203 has an initial nanocrystalline layer that is rich in Al. The Si content steadily increases as the coating
grows away from the A1203 substrate. Once the ratio reaches an Al/Si ratio '3.1 the coating converts to
mullite with an increasing Al-content. The nucleation of the Si containing oxide is initially preferred on Si-
based substrates. The nucleation of mullite on mullite is preferred, and the nucleation of the AI containing
oxide is preferred on AIP03.
3.3 Post Exposure Coal Slag
After 300 hours of exposure during Test 1 (Table 3), the Illinois No. 6 slag formed a solid brown glassy
deposit completely covering each test sample, X-ray diffraction analysis of the gasified slag showed it t o be
predominantly amorphous. However, microprobe analysis revealed the microstructure of the slag t o be a
22

Figure 9: A typical TEM morphology of the CVD mullite coating on Sic

. . . . . . . . . . . . . . - . . . . - e . . . . . . . . . . . . . . . . . . . . . . . . .
. . . . . , . . . . . .. . .: : . . , . .. .. . . . . . . . . . . . .
. . . .
. . : . . . .. . : . . . . . . .
. .: . . . - . . :.
!

Figure 11: HREM of the nanocrystalline region
25

1 h 5 0.9 Y
O. 8
0.7
0.6
0.5
0.4
0.3
0.2
0.1
0 0 0.5 1 1.5 2 2.5
input AIlSi Ratio 3 3.5 4 4.5
Figure 12: Thickness dependence of the nanocrystalline layer on the input AlC13/SiCL ratio
26

Figure 13: Electron diffraction pattern of crystalline mullite along main zone axes

as-deposited coating
1% annealed at 1200 "C for 50 hours
101 (cristabolite)
h
40
150- annealed at 1200 "C for 100 hours
h
d m
lOl(cristabolite) 3' loo-
s i 0
> In c a) c
- -
15 20 25 30 35 2-Theta
Figure 1 4 Phase transformation of the nanocrystdiine layer after annealing at 1200 "C for 100 hours
28

annealed at 1300 'C for 50 hours
I 150 as-deposited coating
is annealed at 1300 'C for 50 hours 1 12012 lO(mullitc)
Ilqmullite)
annealed at 1200 'C for 100 hours 120/2 IO(mul1ite) ! 1 IO(mu1lite)

Mullite
I
30
Figure 16: Cross-section of mullite coatings gown on a)SiC, b)Alumina, c)mullite

mixture of crystallites and glass. Figure 17 and Table 2 illustrate the differing compositions and appearance
of the glass and crystal particles that compose the post-exposure slag matrix. Further analysis into the
composition of the molten slag has been discussed by other investigators [26]. Microprobe analysis suggests
that the principle crystalline phase of the slag is anorthite (CaO-Al203-2Si02) [27]. Microprobe analysis
also revealed trace quantities of vanadium contamination within the slag. Vanadium is not a component of
the burnt coal ash but a component of a fuel oil used in the gasification process [26]
3.4 Corrosion of A1203
Figure 18a is an electron micrograph of the interface between A1203 and Illinois No. 6 slag after Test 1.
The interface between the slag and the A1203 indicates that a corrosion product has formed at the interface.
This corrosion product is believed to be the spinel hercynite (Fe,Mg)O.(Al,Fe)zO3. This diffusional phase is
=7pm thick and has been observed by other researchers when Al203-based ceramics are exposed t o coal slag
[27]. This corrosion product may act as a diffusional barrier to further corrosion yet, significant cracking of
the substrate did occur presumably due t o the large CTE of Al2O3. These exact results were also observed
after Tests 2-4.
3.5 Corrosion of Mullite Substrate
The bulk mullite sample showed no signs of corrosion or pit formation during Tests 1-4. The electron
micrograph results from Test 1 show a clean and tightly bonded corrosion interface between the mullite and
slag layer (Figure 19). A compositional difference is observed in the coal slag as illustrated in the Fe dot map,
yet this diffusional phase has not appreciably degraded the mullite sample and no cracking was observed.
The slag did have a strong bond with the alumina and mullite substrates. A1203 and slag seemed t o
have formed the spinel phase hercynite, (Fe,Mg)O-(Al,Fe)203., at the slag-ceramic interface [27]. It appears
in Figure 19 that the bulk mullite sample acted as a nucleation site for the coal slag’s crystallization to
anorthite yet degradation of the mullite sample is not evident. Although alumina offered excellent slag
corrosion resistance, it is limited as a coal gasification heat exchanger material to due its low thermal
conductivity and susceptibility to thermal shock induced cracks and material failure. The calculated thermal
31

I Fe I Si I C Fe Corrosion Area I A t % I A t % I A t % FeSSi Fer;SiS
74.1 25.9 0.0 63.3 36.7 0.0 - - I GraDhite Corrosion Area 1 0.05 I 0.01 I 99.2 1
Table 6: Microprobe analysis of the 2-phase iron silicide corrosion product at the Sic-sIag interface
stress experienced by the alumina substrates in Tests 1-4 was greater than the maximum allowable tensile
strength. In addition, alumina is not a suitable S i c protective coating material as its CTE is almost twice as
great as Sic’s CTE (Table 8). The solid mullite sample’s effectiveness as a potential heat exchanger material
is limited by its extreme porosity and compositional inhomogeneities (Table 1).
3.6 Corrosion of S i c
After 300 hours of exposure t o coal slag at 1260°C in Test 1, the uncoated S i c sample was severely corroded
(Figure 20a). Optical and scanning electron microscopy revealed slag corrosion characterized by pit formation
and subsequent material loss. Pit depths ranged from 44 t o 284 p m with an average pit depth of 126 pm
into the substrate (Figure 24). The entire interface between the slag and S i c substrate was corroded leaving
no clean unaffected areas. The pit formation within the S i c substrate was characterized by white and black
corrosion regions (Figure 21a). EDS analysis revealed the white region t o have a high iron content and the
black region to have a high carbon content. The Fe dot maps and SEM micrographs show that the high iron
corrosion areas surround the corrosion pits and have a dense white appearance (Figure 21). The high carbon
region is typically found at the center of the corrosion pit and has a dark Aaky appearance. Further analysis
of the corrosion pit utilizing microprobe analysis indicated the high carbon region to be graphite and the
high iron region to consist of two phases of iron silicides (Table 6). Based on the quantitative elemental
compositional data found from the microprobe analysis of a corrosion pit, the two phases of iron silicides
formed were Fe3Si and FesSi3.
The corrosion rate constants in Table 7 are calculated according t o a parabolic diffusion mechanism given
in Eqn. 4 where X is corrosion depth, Kp is the parabolic constant, and t is exposure time [37].
X 2 = 2Kpt
32
(4)

Time (hr) S i c Bulk CVD CVD Mullite Mullite #1 Mullite #2
I I I
10 I 13.3 I 0 0 ( 0 20 117 l o 1.9 l o 40 I 23.75 I 0 - 1 0 300 I 126 I 0 I 7.6
1 Kp(pm2/hr) I 27.9 1 0 I 0.098 1 0
Table 7 Average slag pitting depth and parabolic corrosion rate constant
Previous research conducted on Illinois No.6 slag and siliconized S i c interaction, reported the formation of
graphite and a single phase iron silicide shown below in Eqn. 5 [38].
2S iC + Si+Fez03 - 2FeSi+Si02 + CO + C
AG = -470.3kJ/m01(1227~C)
(5)
The formation of the single phase iron silicide, FeSi, and graphite was also predicted as the equilibrium
corrosion products by the thermodynamic modelling program SOLGAS as shown in Eqn.6.
3 1 3 - F e + - Fe Si +- Si 0 2 + 2 C 2 2 2
2 Si C + Fe203 4
AG = -495.6kJ/moZ(126O0C)
Microprobe and SEM analysis revealed, however, the presence of two phases of iron silicide that were not
projected by the thermodynamic simulations due to the lack of thermodynamic data on these phases (Figure
22). The iron silicides were characterized as Fe3Si (75%Fe and 25%Si) and Fe5Si3 (63%Fe and 37%Si) (Table
6). Equilibrium diagrams of the FeSi system show that Fe5Si3 and FesSi are thermodynamically stable
products at the coal slag reaction conditions of Tets 1-4 [39]. Fe3Si is an a-phase with a wide solubility
and Fe5Si~ is a line compound. Equation 7 illustrates a possible reaction between the slag and Sic in Tests
1-4.
9 s i C + 4Fez03 - Fe3 Si +Fe5 Si3 +5 Si 0 2 + 7C + 2CO (7)
The two phase nature of the slag corrosion reaction was not predicted by SOLGAS as the phases are not
in the programs database. There is currently no thermodynamic curve fit data in existence for FesSis and
FeSSi within the temperature range of interest.
33

Uncoated S i c is not a suitable coal gasification heat exchanger material as it experienced severe corrosion
and material loss after only 300 hours of exposure.
3.7 Corrosion of CVD Mullite Coated S i c
The CVD mullite coated Si@ substrate exhibited excellent coal slag corrosion protection aker 300 hours
of exposure in Test l(Figure 20b). The corrosion interface was predominantly clean along the length of
the coating with sparse pitting in some areas ranging from 1.9 - 17.1 microns with an average pit depth
of 7.6 microns. EDS analysis and Al, Fe, and Si dot maps show the presence of an intact CVD mullite
coating which is unaffected by the presence of molten slag after 300 hours of exposure. The coating region
is characterized by high concentrations of Al, Si, and 0 (Figure 23). The mullite coating acted as a barrier
to the slag penetration. Microprobe analysis of the mullite coating/slag interface after Test 1 showed the
formation of a stable Fe(Mg)A1204 spinel phase. This spinel phase has been shown to form in certain A1203
composites (Figure 18) and has been predicted to act as a diffusion barrier t o further coal slag attack of the
ceramic surface [27]. The CVD mullite S i c substrates had clean non-pitted corrosion interfaces in all regions
with a uniform coating.
CVD mullite coatings protect S i c from coal slag corrosion. Altering the mullite deposition parameters
affects the resultant coating growth rate, morphology, and crystal structure. Preliminary results reveal that
uniform coatings (CVD mullite #2) completely protect the S i c surface from corrosion (Figure 23 & Table
7). A 300hr test is currently being run on CVD mullite #2. The CVD mullite coated Sic samples tested
had corrosion rates ranging from 0 - 0.0983 pm2/hr.
The formation of the Fe(Mg)A1,04 spinel phase at the surface of the CVD mullite sample in Test 1 has
been predicted for certain A1203 composites. The top surface of CVD mullite coatings on S i c are AlzOs-rich
making it possible for a similar reaction t o take place [30]. The formation of such a spinel reaction layer
has been theoretically predicted under similar conditions when the slag concentration contains =lo% MgO.
Microprobe analysis of the coal slag at the CVD mullite surface indicated that the MgO content was 9.9%.
The spinel reaction layer formed has also been shown t o act as a diffusion barrier t o corrosive coal slag [40].
Calculation of the stress magnitude caused by the expansion mismatch between the slag-ceramic may
34

I Ex106 I CTE I p l a I Tensile Strength I (Psi) I (x106) I I (MPa) I (MPa)
Slag I 11 1 4 I 0.25 I Sic I 59 I 4.7 I 0.14 I -45 I 138
I f I !
A1203 I 51 I 8.1 0.21 1 -283 I 255 Mullite I 16 I 5.05 0.23 I -58 I 110
I
CVD Mullite I 16 I 5.05 1 0.23 I -185 I Table 8: Stress in selected materials caused by thermal expansion mismatch with the coal slag.
explain the localized failure exhibited by some CVD mullite coatings. The slag properties given in Table 8
are estimated from a typical aluminosilicate glass. The stress caused by the coal slag (a) can be estimated
from Eqn.8.
4 Conclusions
Current studies have focuse, upon the development o CVD mullite coatings for corrosive environments.
Thermodynamic and kinetic investigations have resulted in uniform, stable, and protective coatings. CVD
mullite coatings are deposited within a kinetically limited regime. The substrate is extremely important in
determining the initial nucleation of the deposit, and thus the ultimate structure and morphology of the
coating.
Thermal studies reveal that mullite is stable in high temperature environments (>126OoC). A crystalliza-
tion of the nano-crystalline layer occurs when there is excess A1 present. Analysis of the structure indicates
that tetragonal mullite is deposited within areas of the coating. CVD mullite coated S i c exhibited excellent
coal slag corrosion resistance after 300 hours of exposure t o an acidic iron based Illinois No. 6 slag. The
CVD mullite coating's performance was dependent on the coating's microstructure and uniformity. CVD
mullite coating protection was based on its function as a diffusion barrier t o iron penetration and a physical
barrier t o liquid slag seepage into the S i c substrate. The uncoated S i c suffered severe material loss and
pitting due to coal slag corrosion. The corrosion of the S i c was based on the formation of two phase iron
silicides (Fe,Si,) and graphite within the S i c replacing the substrate material. The uncoated S i c exhibited
35
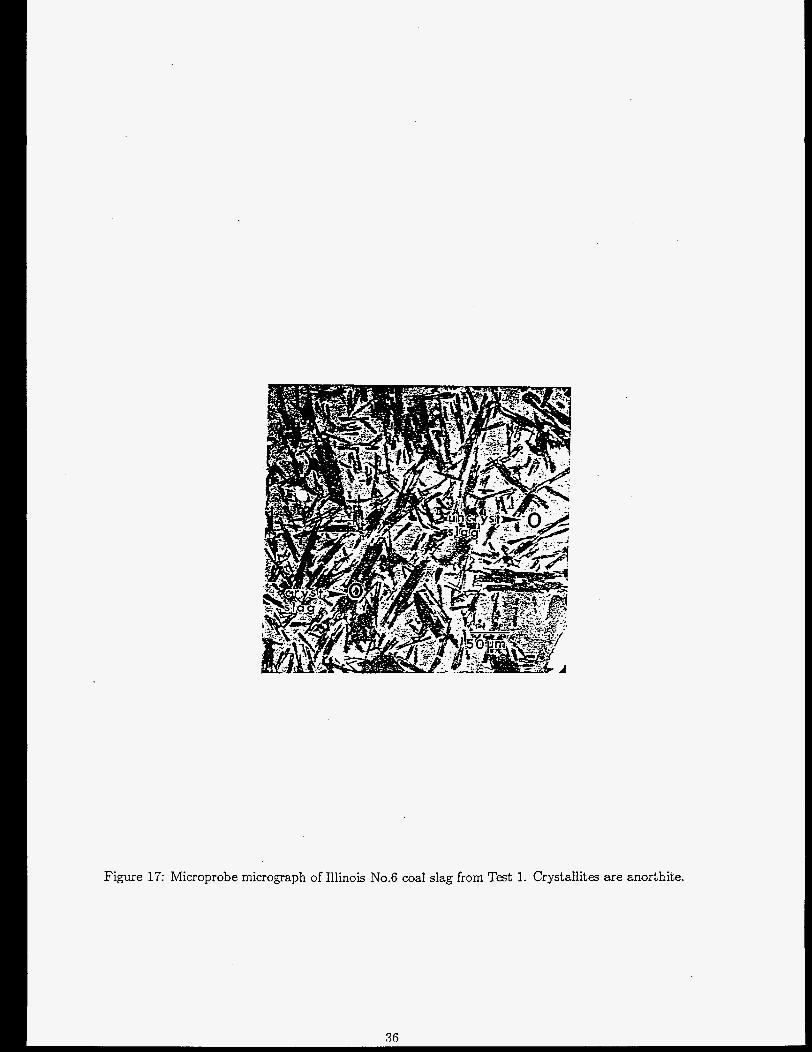
Figure 17: Microprobe micrograph of Illinois No.6 coaI slag from Test 1. Crystallites are anorthite.
I
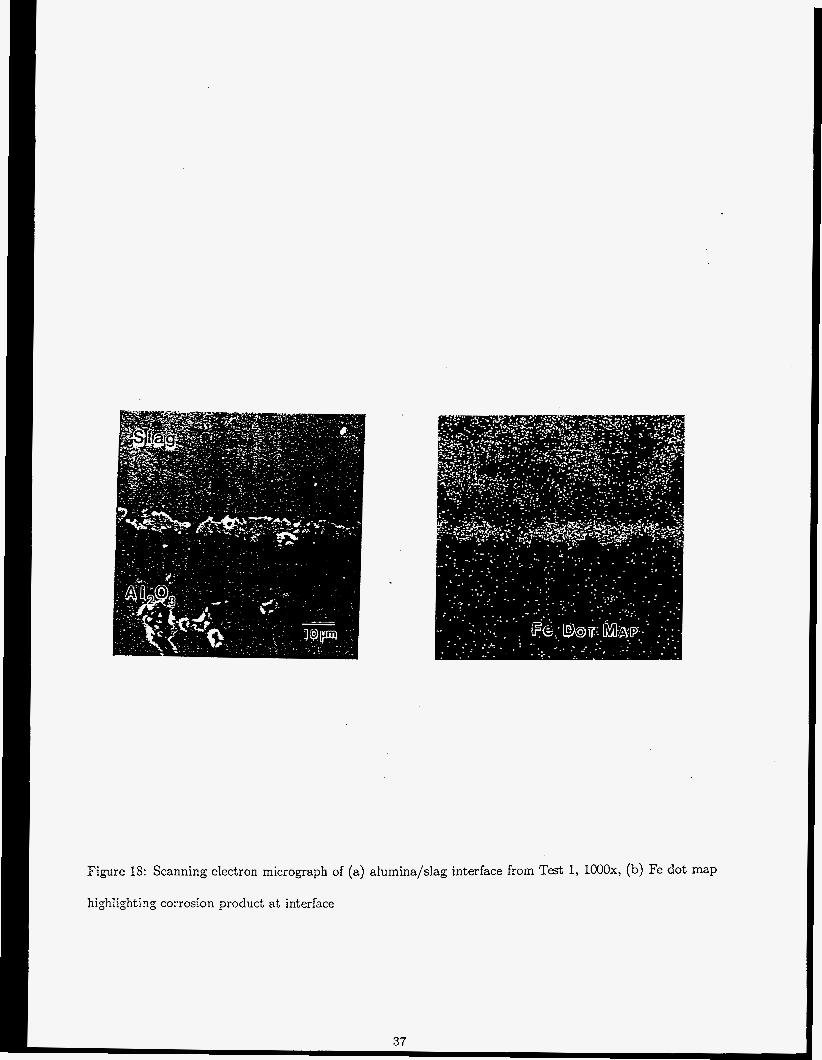
Figure 1s: Scanning electron micrograph of (a) aIumina/sIag interface from Test 1, loOOX, (b) Fe dot map
highlighting corrosion product at interface
I

. . .A$’
$- .; . I - . , ‘. . _ . . . . . .
Figure 19: Scanning electron micrograph of (a) bulk mullite/slag interface from Test 1, 50Ox, (b) Fe dot map
at interface
I

6------- - r
F i g r e 20: Optical micrographs of from Test 1: (a)Uncoated S i c corrosion interface, lCGx, (b) CVD mullite
coated S i c corrosion interface 1OOx.

Figure 21: Uncoated Sic corrosion pit from Testl: (a) SEM micrograph, 20Ox , (b) Fe dot map dot map(c)
Si dot map

Figure 22: Optical micrograph of 2-phase iron silicide corrosion region from Testl.

Figure 23: CVD mullite coating region from Testl: (a)SEM of slag/mullite/coating interfaces, 250OX (b) AI
dot map, (c) Fe dot map, (d) Si dot map.

1800
16001
1400(
12ooc
h
I H -
10000 - - E
a"
6
5 g 8000 ::
I-
6000
4000 ,
2000 I 0 50 100 EO 200 250 300 330
Time (hr)
Figure 24: Comparison of corrosion rates of Coated and Uncoated Sic

a corrosion rate of 27.90 pm2/hr as opposed to the CVD mullite coated S i c which exhibited virtually no
corrosion.
5 Acknowledgments
Research sponsored by the U.S.Department of Energy, Office of Fossil Energy, Advanced Research and Tech-
nology Development Materials Program, [DOE/FE AA 15 10 10 0, Work Breakdown Structure Element
BU-21, and by the U.S. Department of Energy, Assistant Secretary for Energy Efficiency and Renewable En-
ergy, Office of Transportation Technologies, Ceramic Technology Project of the Propulsion System Materials
Program under contract number DEAC05-960R22464 with Lockheed Martin Energy Research Corp.
References
[I] Coal and Synfuels Technology Report, February 7, 1994, Pasha Publications, Arlington, VA, (1994)
[2] Clean-CoaZ/Synfuels Letter, May 17,1993, McGraw-Hill, New York, (1993)
[3] US DOE, Assistant Secretary for Energy Efficiency and Renewable Energy, Office of Transportation
Technology Ceramic Technology Project of the Materials Program, and Fossil Energy AR&TD Materials
Program under contract DEAC05-840R21400 with Martin Marietta Energy Systems, Inc.
[4] M.K. Ferber, V.J. Tennery, "Behavior of Tubular Ceramic Heat Exchanger Materials in Acidic Coal
Ash from Coal-Oil-Mixture Combustion," Ceramic Bulletin 62(2), pp. 236-43, (1983)
[5] D.J.Seery, et.al., pp.356-63 in Proceedings from the Ninth Annual Coal Preparation, Utilization and En-
vironmental Control Contractors Conference Pittsburgh, PA, 1993. U.S. Department of Energy Pitts-
burgh Technology Center, Pittsburgh, PA, (1993)
[GI N.S. Jacobson and J.L. Smialek, J.Am. Ceram.Soc., 68(8), pp.432-39, (1985)
[7] I<. Breder, V.J. Tennery. J.Am. Ceram.Soc., 78( lo), pp.2837-40, (1995)
[8] J.I. Federer, J. Materials Engineering, 12, pp.141-149, (1990)
44

[9] I.A.Aksay, D.M. Dabbs, and M.Sarikaya, J. Am. Ceram. SOC., 74(10), pp.2343, (1991)
[lo] P.F.Becher,J.Am. Ceram. SOC., 74(2), pp.255, (1991)
[ll] s. Somiya and Y.Hirata, Am Ceram. SOC. BulZ.,70(10) pp.1624, (1991)
[12] R.D.Nixon, S.Chevacharoenku1, R.D.Davis, and T.N.Tiegs, in S. Somiya (ed), Ceramic ?hnsactions,
VoZ. 6, American Ceramic Society, Westerville, OH, pp. 579, (1990)
[13] JSchienle and J. Smyth, Final Report, ORNL/Sub/84-47992/1 (1987)
[14] K.Okada and N Otsuka, in S. Somiya (ed),pp. 425, Ceramic iirl-ansactions, VoZ. 6, American Ceramic
Society, Westerville, OH, (1990)
[15] O.Monteiro, Z.Wang, and 1.G Brown, J. Mater. Res., 12(9) pp.2401, (1997)
[16] M.L.Auger and V.I<.Sarin, Final Report, ORNL/Sub/94-SS110/02 (1997)
[17] R.P. Mulpuri, V.I<.Sarin, 19th Annual Cocoa Beach Conference and Exposition on Engineering Ceram-
ics, The American Ceramic Societg, Westerville, OH, (1995)
[lS] R.P. Mulpuri,V.I<.Sarin, J. Mater. Res., 11(6), pp. 1315-24, (1996)
[19] W.A.P. Claasen, J.Bloem, J. EZectrochem.Soc., 128(6), pp.1353, (1981)
[20] M.L.Auger and VKSar in , Surface & Coatings Tech., 94-95, pp.46-52, (1997)
[21] V.K. Sarin,R.P.Mulpuri U S . Patent Pending.
[22] Personal Communication John P. Hurley, Energy & Environmental Research Center, University of
North Dakota
[23] T.M.Strobe1, J.P.Hurley, KBreder, J.Holowczak, Proceedings of the 18th Annual Conference on Corn-
posites and Advanced Ceramic Materials -A, Cocoa Beach, Fl., Jan. 1994, American Ceramic Society,
Westerville, Ohio, (1994)
[24] Wen-Cheng Wei and John W.Halloran, J.Am. Ceram.Soc., 71 171 581-87 (1988).
45

[25] J.A.Pask,X.W.Zhang and A.P.Tomsia, J.Am. Cerarn.Soc., 70[10] pp.704707 (1987).
[26] M.K. Ferber, V.J. Tennery, Ceramic Bulletin 63(7), pp. 898-904, (1984)
[27] J.A.Bonar, C.R.Kennedy, and R.B.Swaroop, Ceramic Bulletin. 59(4), pp. 473-478, 1980
[28] G.Eriksson, Acta Chemica Scandanavia, 25(7), pp.2651-2658, (1971)
[29] F*A*C*Tver2.1, C.W.Bale, A.D.Pelton, W.T.Thompson, Ecole Polytechnique de Montreal/Royal Mil-
itary College, Canada, (July 1996)
[30] D.Doppalapudi, S.N. Basu, Material. Science and Engineering, A231, pp. 48-54, (1997)
1311 F.F. Abraham, Homogenous Nucleation Theory, The Pretransition Theory of Vapor Condensation,
Academic Press, New York and London, (1974)
[32] D.Miche1, L.Mazerolles, R.Portier, pp. 435-448, Ceramic Transactions, Vol. 6, American Ceramic Soci-
ety, Westerville, OH, (1990)
[33] Jae-Gon Kim, et.al., Thin Solid Films, 97, pp. 97-106 (1982)
[34] V.IC.Sarin, M.L.Auger, pp.33, in Proceedings of the X I Annual Conference on Conference on Fossil
Energy Materials, Fossil Energy AR&TD Materials Program, ORNL (1997)
[35] W.Steinmaier, J.Bloem, J.Electrochern. SOC. 111(2) pp206-209, (1964)
[3G] J.N. Lindstrom, K.G. Strenberg, pp. 169-182, in Proceeding 3rd European Conf. CVO, Edited by
J.O.Carlsson and J.Lindstrom, Uppsala, Sweden, (1985)
[37] N.Birkis and G.H.Meier, Introduction to High Temperature Oxidation o f Metals, Edward Arnold, (1983)
[38] K.Breder, J.Holowczak, J.P.Hurley, and T.M.Strobe1, Proceedings of the 19th Annual Conference on
Composites and Advanced Ceramic Materials -A,” American Ceramic Society, Westerville, Ohio, Cocoa
Beach, FI., Jan. 1995.
I391 W.G.Moffatt, The Handbook of Binary Phase Diagrams, Genium Publishing C o p , Schenectady, NY
(1984).

[40] G.J.Yurek, pp.271-99, in Proceedings of the Conference on Corrosion Erosion of Coal-Conversion Sys-
tems Materials, Ed. A.V.Levy.(Jan24-25, 1979) Berkeley, CA, (1979)
47

DISTRIBUTION
3M COMPANY Ceramic Materials Department 201-4N-01 3M Center, St . Paul, MN 55 144 M. A. Leitheiser
ARGONNE NATIONAL LABORATORY 9700 S. Cass Avenue Argonne, IL 60439 W. A. Ellingson
BABCOCK & WILCOX Domestic Fossil Operations 20 South Van Buren Avenue Barberton, OH 44023 M. Gold
BETHLEHEM STEEL CORPORATION Homer Research Laboratory Bethlehem, PA 180 16 B. L. Bramfitt J. M. Chilton
BOSTON UNIVERSITY Manufacturing Engineering 44 Cummington Street Boston, MA 022 15 V. Sarin
BRITISH COAL CORPORATION Coal Technology Development Division Stoke Orchard, Cheltenham Glocestershire, England GL52 4ZG J. Oakey
CANADA CENTER FOR MINERAL & ENERGY TECHNOLOGY 568 Booth Street Ottawa, Ontario Canada KIA OG1 R. Winston Revie Mahi Sahoo
DOE DOE OAK RIDGE OPERATIONS P. 0. Box 2008 Building 4500N, MS 6269 Oak Ridge, TN 2783 1 M. H. Rawlins
DOE DOE OAK RIDGE OPERATIONS P. 0. Box 2001 Oak Ridge, TN 3 783 1 Assistant Manager for Energy Research and Development
DOE Federal Energy Technology Center 3 6 1 0 Collins Ferry Road P.O. Box 880 Morgantown, WV 26507-0880 D. C. Cicero F. W. Crouse, Jr. R. A. Dennis N. T. Holcombe W. J. Huber T. J. McMahon J. E. Notestein
DOE Federal Energy Technology Center 626 Cochrans Mill Road P.O. Box 10940 Pittsburgh, PA 15236-0940 A. L. Baldwin G. V. McGurl U. Rao L. A. Ruth T. M. Torkos
DOE OFFICE OF FOSSIL ENERGY
1990 1 Germantown Road Gemantown, MD 20874-1290 F. M. Giaser
FE-72
DOE OFFICE OF BASIC ENERGY SCIENCES Materials Sciences Division
Washington, DC 20545 H. M. Kerch
ER-131 GTN
Page 1 of 3

Distribution Revised: July 1C, 7398
ELECTRIC POWER RESEARCH INSTITUTE P.O. Box 10412 34 12 Hillview Avenue Palo Alto, CA 94303 W. T. Bakker J. Stringer
PACIFIC NORTHWEST NATIONAL LABORATORY
Battelle Boulevard Richland, WA 99352 R N. Johnson
P. 0. BOX 999: K3-59
EUROPEAN COMMUNITIES JOINT RESEARCH CENTRE Petten Establishment P.O. Box 2 1755 ZG Petten The Netherlands M. Van de Voorde
GEORGIA INSTITUTE OF TECHNOLOGY Materials Science & Engineering (0245) Bunger-Henry Building, Room 276 Atlanta, GA 30332-0245 T. L. Starr
IDAHO NATIONAL ENGINEERING & ENVIRONMENTAL LABORATORY P. 0. Box 1625 Idaho Falls, ID 83415 B. H. Rabin
LAWRENCE BERKELEY NATIONAL LABORATORY University of California Berkeley, CA 94720 Ian Brown
NATIONAL MATERIALS ADVISORY BOARD National Research Council 2101 Constitution Avenue Washington, DC 204 1 8 K. M. Zwilsky
OAK RIDGE NATIONAL LABORATORY P.O. Box 2008 Oak Ridge, TN 37831 T. M. Besmann P. T. Carlson J. M. Crigger (4 copies) R. R. Judkins R. A. Lowden D. P. Stinton P. F. Tortorelli I. G. Wright
SHELL DEVELOPMENT COMPANY
P.O. Box 1380 Houston, TX 77251-1380 W. C. Fort
WTC R-1371
THE JOHNS HOPKINS UNIVERSITY Materials Science & Engineering Maryland Hall Baltimore, MD 21218 R. E. Green, Jr.
THE NORTON COMPANY High Performance Ceramics Division Goddard Road Northborough, MA 0 1532-1 545 N. Corbin
THE TORRINGTON COMPANY Advanced Technology Center 59 Field St. Torrington, CT 06790 W. J. Chmura
UNION CARBIDE CORPORATION Linde Division P.O. Box 44 175 East Park Drive Tonawanda, NY 14151-0044 Hany Cheung
UNITED TECHNOLOGIES RESEARCH CENTER MS 24, Silver Lane East Hartford, CT 06 108 K. M. Prewo
UNIVERSITY OF TENNESSEE Dept of Materials Science and Engineering Knoxville, TN 37996-2200 P. K. Liaw
Page 2 of 3
Page 3 of 3
Related Documents