1 Copyright © 2017 ORIX Corporation All rights reserved. Company Name ORIX Corporation Second Quarter Consolidated Financial Results For the Six-Month Period Ended September 30, 2017 Makoto Inoue President & CEO Kazuo Kojima Deputy President & CFO October 31, 2017 (TSE: 8591; NYSE: IX)

Welcome message from author
This document is posted to help you gain knowledge. Please leave a comment to let me know what you think about it! Share it to your friends and learn new things together.
Transcript

1Copyright © 2017 ORIX Corporation All rights reserved.
Company Name
※ テンプレートデザインの個別編集禁止
ORIX Corporation Second Quarter Consolidated Financial Results
For the Six-Month Period Ended September 30, 2017
Makoto Inoue President & CEO
Kazuo Kojima Deputy President & CFO
October 31, 2017
(TSE: 8591; NYSE: IX)

Copyright © 2017 ORIX Corporation All rights reserved. 2
✓ 166.0bn yen in net income, up by 17% YoY
✓ Annualized ROE at 13.0%
Overview(1)
Net Income* and ROE
*Net Income refers to Net Income Attributable to ORIX Corporation Shareholders
(JPY Bn)
161.3 142.2 166.0
14.7%
12.2%13.0%
0
50
100
150
200
16.3 H1 17.3 H1 18.3 H1
Net Income ROE (annualized)

Copyright © 2017 ORIX Corporation All rights reserved.
0
50
100
150
200
250
300
16.3 H1 17.3 H1 18.3 H1
Overseas Business
Retail
Investment and Operation
Real Estate
Maintenance Leasing
Corporate Financial Services
✓ Segment profits at 249.8bn yen, up by 17% YoY
✓ Significant growth in Overseas Business, Real Estate and Retail
✓ Corporate Financial Services and Maintenance Leasing performed steadily
✓ Decreased in Investment and Operation due to the absence of the large exit gain
Overview(2)
Segment Profits(JPY Bn)
244.8
214.0
249.8
3

Copyright © 2017 ORIX Corporation All rights reserved.
3.6%
3.2%3.0%
3.7%
-0.3%
0.2%
0.7%
1.2%
1.7%
2.2%
2.7%
3.2%
3.7%
4.2%
0
2
4
6
8
10
16.3 H1 17.3 H1 17.3 Q4 18.3 H1
Overseas Business
Retail
Investment and Operation
Real Estate
Maintenance Leasing
Corporate Financial Services
Segment ROA
4
✓ Segment assets at 9,116.2bn yen, up by 2% YTD
✓ Increased in Overseas Business, Investment and Operation and Maintenance Leasing
✓ Decreased in Retail assets due to the sale of investment securities by ORIX LifeInsurance (OLI) as well as run-off in HLIKK
Overview(3)
Segment Assets and ROA(JPY Tn)
(annualized and after-tax)

Copyright © 2017 ORIX Corporation All rights reserved.
8,956.9
295.0
15.1124.5
17.8 28.8 50.5
9,116.2
17.3 17.9
RESales of
investments
Securitization
Foreginexchange
impact
HLIKK
Existingoperation (incl.new
investees)
219.2
30.5
51.0
33.660.0
23.51.9
252.6
17.3 H1 18.3 H1
Existingoperation (incl. new investees)
Gains on sales of
investments and others
Gains on sales of
RE*Gains on sales of
investments and others
in FY17.3 H1
Gains on sales of
RE*in FY17.3
H1
* Gains on sales of real estate includes "gains on sales of rental property", "gains on investment securities" , "gains on sales of property under facil ity operations", "gains on sales of
subsidiaries and affiliates and liquidation losses", and "gains on sales of equity method affil iates"(excl. condominium related gains) under Real Estate segment
Foreginexchange
impact
5
Overview(4)
33.4bn yen increase YoY (+15%)
YoY Changes in Pretax Profits
(JPY Bn)
YTD Changes in Segment Assets
(JPY Bn)
159.3bn yen increase YTD(+2%)
Pretax profits: 33.4bn yen increase YoY (+15%) ✓ Positive contribution to the existing operation from aircraft and ship-related, concession, asset management,
environment and energy and banking business
✓ Gain on sales remained at similar level to FY17.3 H1
Segment assets: 159.3bn yen increase YTD (+2%)✓ Increased in aircraft and ship-related, environment and energy and banking business in existing operation

Copyright © 2017 ORIX Corporation All rights reserved.
5.0%
6.2%6.4%
0
30
60
90
120
16.3 H1 17.3 H1 18.3 H1
Equity Tangible Assets
Fixed Income ROA
4.9% 4.9%5.4%
0
30
60
90
120
16.3 H1 17.3 H1 18.3 H1
OthersMaintenance ServicesEnvironment/InfrastructureFinancial ServicesROA
1.8% 1.8% 1.7%
0
30
60
90
120
16.3 H1 17.3 H1 18.3 H1
Overseas Japan ROA
Performance in Three Categories
Segment Profits (3 Categories)
6
(JPY Bn)
OperationFinance Investment
(JPY Bn) (JPY Bn)
(*1) FY16.3 H1 Segment Profits in Operation excludes capital gains/valuation gains (c. 39.6bn yen) associated with the IPO of Houlihan Lokey and ordinary profit/loss contribution from HLIKK(*2) FY17.3 H1 Segment Profits in Operation excludes ordinary profit/loss contribution from HLIKK(*3) FY18.3 H1 Segment Profits in Operation excludes capital gain from the sale of Houlihan Lokey shares and ordinary profit/loss contribution from HLIKK
See P.37 for details on the three categories
✓ Operation: Profit growth in Robeco and contribution by BFIMGood performance in concession business, environment and energy business
✓ Investment: Strong profit growth in aircraft and ship-related business

Copyright © 2017 ORIX Corporation All rights reserved.
Businesses Major progress
Environment and Energy
• Mega solar power generation making good progress(as of the end of September, 990MW of capacity secured, of which 650MW already in operation)
• Investment in geothermal power generation company Ormat(22.1%、approx.70bn yen)
Concession• Consortium formed by ORIX, VINCI Airports and Kansai Airports acquired the operating rights of Kobe
Airport
Americas• Additional acquisition of transportation infrastructure service company (Beth’s Barricades) and
commercial mortgage banker (Lancaster Pollard)
PE Investment in Japan
• Acquisition : information processing service business • Exit : liquor wholesale business
Aircraft related Business
• Purchase 44 aircraft (incl. JV investment)• Plan to purchase total 70 aircraft in FY18.3 (mainly narrow body)
FY18.3 H1 Key Achievements✓ New investments of approximately 450bn yen in the “Operation” and “ Investment”
✓ Maintain solid investment pipeline
✓ Leverage outcome in various business areas for future growth
7
Copyright © 2017 ORIX Corporation All rights reserved.
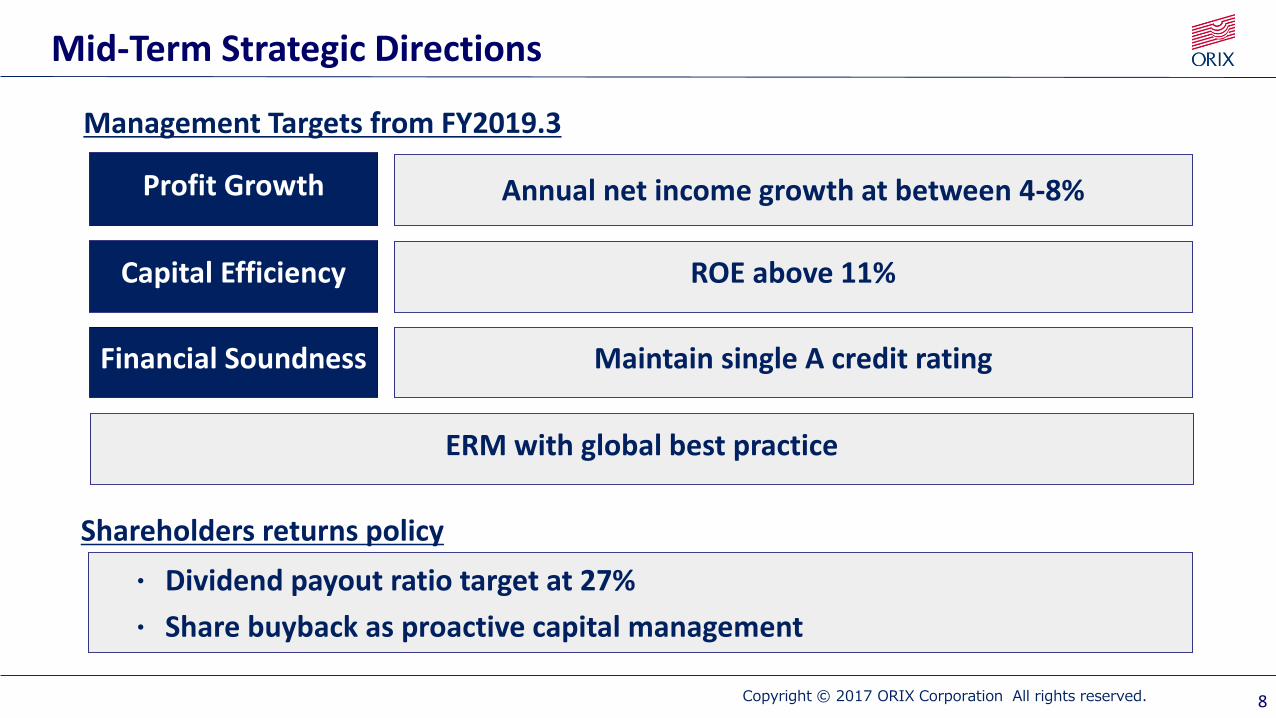
Management Targets from FY2019.3
Financial Soundness
Capital Efficiency
Maintain single A credit rating
ROE above 11%
Annual net income growth at between 4-8% Profit Growth
ERM with global best practice
・ Dividend payout ratio target at 27%
・ Share buyback as proactive capital management
Shareholders returns policy
Mid-Term Strategic Directions
8

Copyright © 2017 ORIX Corporation All rights reserved.
1323
36
22 23 27
23.7529.25
13%
16%
20%
23%25%
27%
-3%
2%
7%
12%
17%
22%
27%
0
10
20
30
40
50
60
70
13.3 14.3 15.3 16.3 17.3 18.3
Dividends and Payout Ratio
✓ Interim dividend at 27 yen per share, up by 17% YoY
✓ Dividend payout ratio at 27% for FY18.3
✓ Maintain the optimal balance between investment opportunities for sustainable future profit growth and stable dividend growth
Dividend per Share* and Payout Ratio
*Retrospectively adjusted to reflect share splits
Year end dividend
Interim dividend
(JPY)
9

Copyright © 2017 ORIX Corporation All rights reserved.
Summary
FY18.3 H1 net income achieved at 166.0bn yen, up 17% YoY,
annualized ROE at 13.0%
10
Optimal balance between sustainable growth and shareholders returns
Steady progress in various investments for further growth
Copyright © 2017 ORIX Corporation All rights reserved.
Appendix
11
Copyright © 2017 ORIX Corporation All rights reserved.
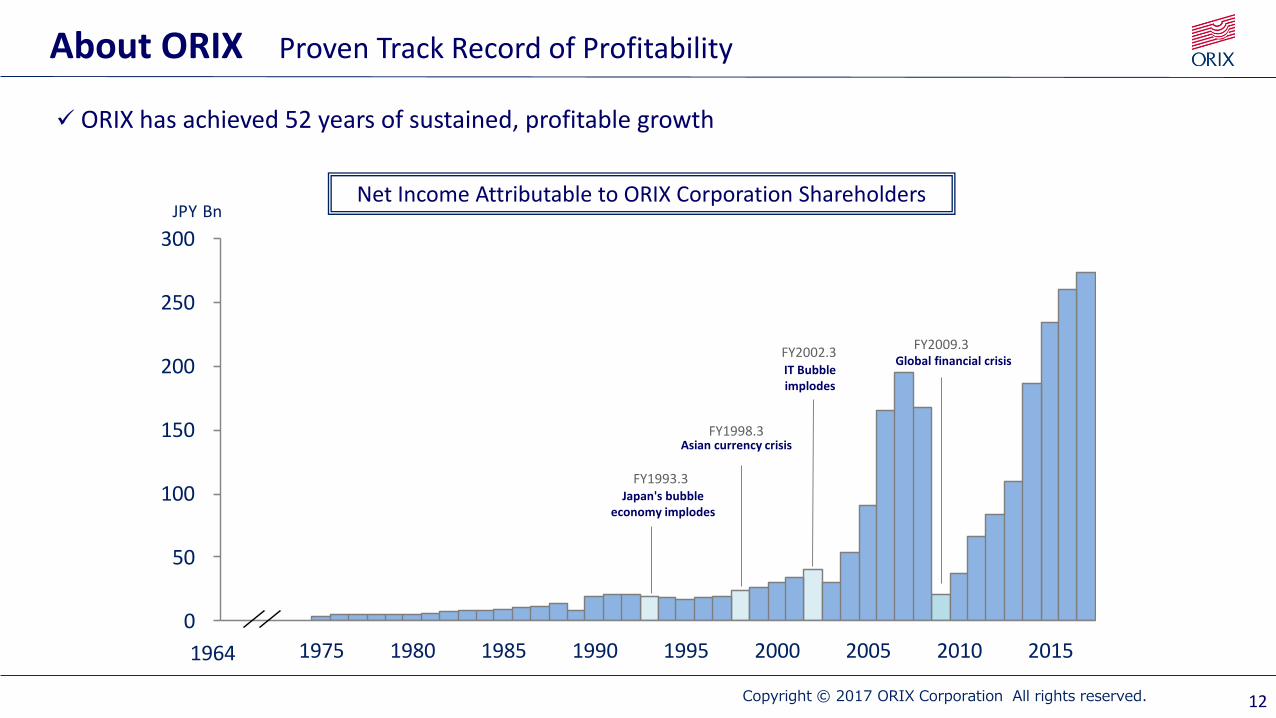
✓ ORIX has achieved 52 years of sustained, profitable growth
Net Income Attributable to ORIX Corporation Shareholders
About ORIX Proven Track Record of Profitability
0
50
100
150
200
250
300
1975 1980 1985 1990 1995 2000 2005 2010 20151964
JPY Bn
FY2002.3IT Bubbleimplodes
FY2009.3Global financial crisis
FY1998.3
FY1993.3
Asian currency crisis
Japan's bubbleeconomy implodes
12

Copyright © 2017 ORIX Corporation All rights reserved.
✓ ORIX will continue to enhance our experience in finance and tangible assets as we synergistically expand our businesses
About ORIX Evolving and Dynamic Portfolio
Infrastructure
13

Copyright © 2017 ORIX Corporation All rights reserved.
12%
8%
7%
9%
37%
27%
9%
10%
17%
20%
17%
27%
Segment Assets
9 tn yen
FY2017.3
✓ Our highly diversified company contains many complementary businesses, providing ample opportunity for synergies and knowledge sharing
About ORIX Business by Segment
Corporate Financial Services
Loan, Leasing, Fee businesses
Maintenance LeasingAutomobile leasing and rentals, Car sharing, Test and measurement instruments and IT-related equipment rentals and leasing
Real EstateReal estate development and rental, facility operation, REIT asset management, and real estate investment advisory services
Investment and Operation
Environment and energy business, Principal investment and Loan servicing, Concession
Retail Life insurance, Banking, Card loan
Overseas BusinessLeasing, Loan, Bond investment, Asset management, Aircraft and Ship-related operations
Segment Profits
421 bn yen
FY2017.3
14

Copyright © 2017 ORIX Corporation All rights reserved.
About ORIX Global Network
✓ ORIX has spread its business globally by expanding operations in 36 countries and regions worldwide
(As of 2017.3.31)
15

Copyright © 2017 ORIX Corporation All rights reserved.
✓ Contribute to society by identifying changes in society and markets to create new value
About ORIX Business Model
16

Copyright © 2017 ORIX Corporation All rights reserved.
Appendix(1) Performance Overview
(JPY Bn)
*1 Net Income Attributable to ORIX Corporation Shareholders
17
FY16.3 FY17.3 17.3 H1 18.3 H1Change
(YoY)
Total Revenues 2,369.2 2,678.7 1,221.1 1,517.8 124%
Net Income *1 260.2 273.2 142.2 166.0 117%
Segment Assets 8,972.4 8,956.9 8,536.2 9,116.2 107%
Total Assets 10,992.9 11,231.9 10,782.7 11,426.0 106%
Shareholders' Equity 2,310.4 2,507.7 2,365.0 2,610.7 110%
Shareholders' Equity Ratio 21.0% 22.3% 21.9% 22.8% +0.9%
ROE 11.7% 11.3% 12.2% 13.0% 0.8%
Return on Segment Assets (ROA) 2.87% 3.05% 3.25% 3.67% 0.42%
D/E Ratio
(Short and Long-Term Debt+Deposits)/Shareholders' Equity 2.5x 2.3x 2.3x 2.3x 0.0x
(Short and Long-Term Debt)/Shareholders' Equity 1.9x 1.7x 1.7x 1.6x -0.1x

Copyright © 2017 ORIX Corporation All rights reserved.
Appendix(2) Profits by Segment
(JPY Bn)
18
FY16.3 FY17.3 17.3 H1 18.3 H1Change
(YoY)
Corporate Financial Services 42.4 38.0 19.9 22.0 111%
Maintenance Leasing 42.9 39.8 19.7 20.4 104%
Real Estate 42.9 72.8 35.4 44.0 124%
Investment and Operation 57.2 85.0 52.0 38.9 75%
Retail 51.8 72.9 35.5 43.0 121%
Overseas Business 142.9 112.3 51.5 81.4 158%
Total Segment Profits 380.1 420.8 214.0 249.8 117%

Copyright © 2017 ORIX Corporation All rights reserved.
Appendix(3)Assets by Segment
(JPY Bn)
19
16.3 17.3 16.9 17.9Change
(YTD)
Corporate Financial Services 1,049.9 1,032.2 1,034.4 1,001.5 97%
Maintenance Leasing 731.3 752.5 724.2 782.5 104%
Real Estate 739.6 657.7 705.1 628.9 96%
Investment and Operation 704.2 768.7 695.8 863.6 112%
Retail 3,462.8 3,291.6 3,325.4 3,209.1 97%
Overseas Business 2,284.7 2,454.2 2,051.5 2,630.5 107%
Total Segment Assets 8,972.4 8,956.9 8,536.2 9,116.2 102%

Copyright © 2017 ORIX Corporation All rights reserved.
Appendix(4) Income Statement Data
(JPY Bn)
*1 Each revenue component deducted with corresponding costs and expenses
FY16.3 FY17.3 17.3 H1 18.3 H1Change
(YoY)Finance revenues 200.9 200.6 96.6 106.5 110%
Gains on investment securities and dividends 35.8 30.3 15.2 20.5 135%
Operating leases 128.8 155.1 74.8 72.7 97%
Life insurance premiums and related investment income 68.1 95.8 44.3 49.5 112%
Sales of goods and real estate 85.8 86.5 43.2 37.0 86%
Services income 289.8 286.6 145.0 158.5 109%
Gross Profits*1 809.2 854.9 419.1 444.7 106%
Interest expense 72.8 72.9 35.3 37.9 107%
Selling, general and administrative expenses 422.7 418.7 203.7 209.3 103%
Provisions/Impairments 29.7 38.4 14.4 9.9 69%
Other (income) and expense, net -3.7 -4.4 -0.7 -1.5 -
Operating Income 287.7 329.2 166.3 189.0 114%
Equity in Net Income of Affiliates 45.7 26.5 15.8 38.6 245%
Gains on Sales of Subsidiaries and Affiliates…etc 57.9 69.2 37.1 25.0 67%
Income before Income Taxes 391.3 425.0 219.2 252.6 115%
Net Income Attributable to ORIX Corporation Shareholders 260.2 273.2 142.2 166.0 117%
20
Copyright © 2017 ORIX Corporation All rights reserved.
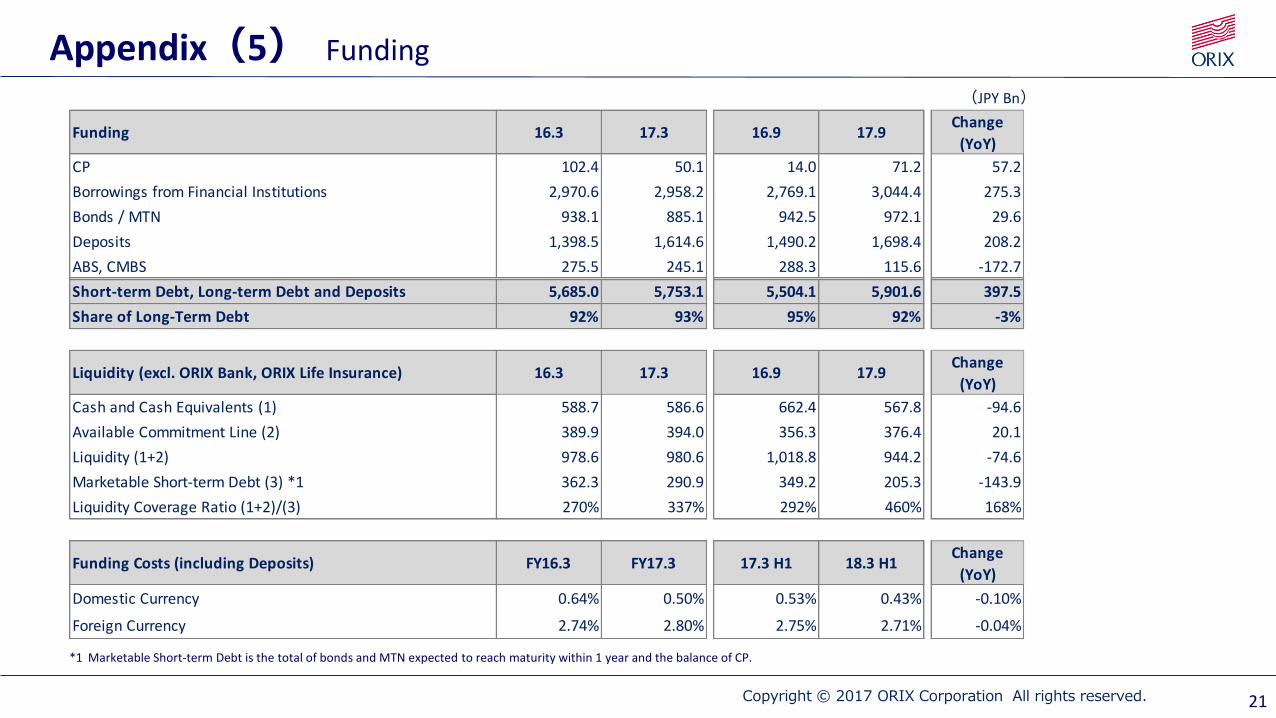
Appendix(5) Funding
(JPY Bn)
*1 Marketable Short-term Debt is the total of bonds and MTN expected to reach maturity within 1 year and the balance of CP.
21
Funding 16.3 17.3 16.9 17.9Change
(YoY)
CP 102.4 50.1 14.0 71.2 57.2
Borrowings from Financial Institutions 2,970.6 2,958.2 2,769.1 3,044.4 275.3
Bonds / MTN 938.1 885.1 942.5 972.1 29.6
Deposits 1,398.5 1,614.6 1,490.2 1,698.4 208.2
ABS, CMBS 275.5 245.1 288.3 115.6 -172.7
Short-term Debt, Long-term Debt and Deposits 5,685.0 5,753.1 5,504.1 5,901.6 397.5
Share of Long-Term Debt 92% 93% 95% 92% -3%
Liquidity (excl. ORIX Bank, ORIX Life Insurance) 16.3 17.3 16.9 17.9Change
(YoY)
Cash and Cash Equivalents (1) 588.7 586.6 662.4 567.8 -94.6
Available Commitment Line (2) 389.9 394.0 356.3 376.4 20.1
Liquidity (1+2) 978.6 980.6 1,018.8 944.2 -74.6
Marketable Short-term Debt (3) *1 362.3 290.9 349.2 205.3 -143.9
Liquidity Coverage Ratio (1+2)/(3) 270% 337% 292% 460% 168%
Funding Costs (including Deposits) FY16.3 FY17.3 17.3 H1 18.3 H1Change
(YoY)
Domestic Currency 0.64% 0.50% 0.53% 0.43% -0.10%
Foreign Currency 2.74% 2.80% 2.75% 2.71% -0.04%

Copyright © 2017 ORIX Corporation All rights reserved.
Segment Performance
22
Copyright © 2017 ORIX Corporation All rights reserved.
2.6% 2.6% 2.5%
3.0%
0.0%
1.0%
2.0%
3.0%
4.0%
0
200
400
600
800
1,000
1,200
16.3 H1 17.3 H1 17.3 Q4 18.3 H1
Direct financing leases Installment loans
Goodwill & other
intangible assets
Others
Segment ROA
0
5
10
15
20
25
16.3 H1 17.3 H1 18.3 H1
Yayoi
21.619.9
22.0
0.0
5.0
10.0
15.0
20.0
25.0
30.0
0
10
20
30
40
50
60
16.3 H1 17.3 H1 18.3 H1
Finance revenues Services income
Others Segment profits
Segment Performance(1)Corporate Financial Services
Segment Revenues/Profits Segment Assets/ROAServices Income
(JPY Bn)
(JPY Bn)
(JPY Bn)
(annualized and after-tax)
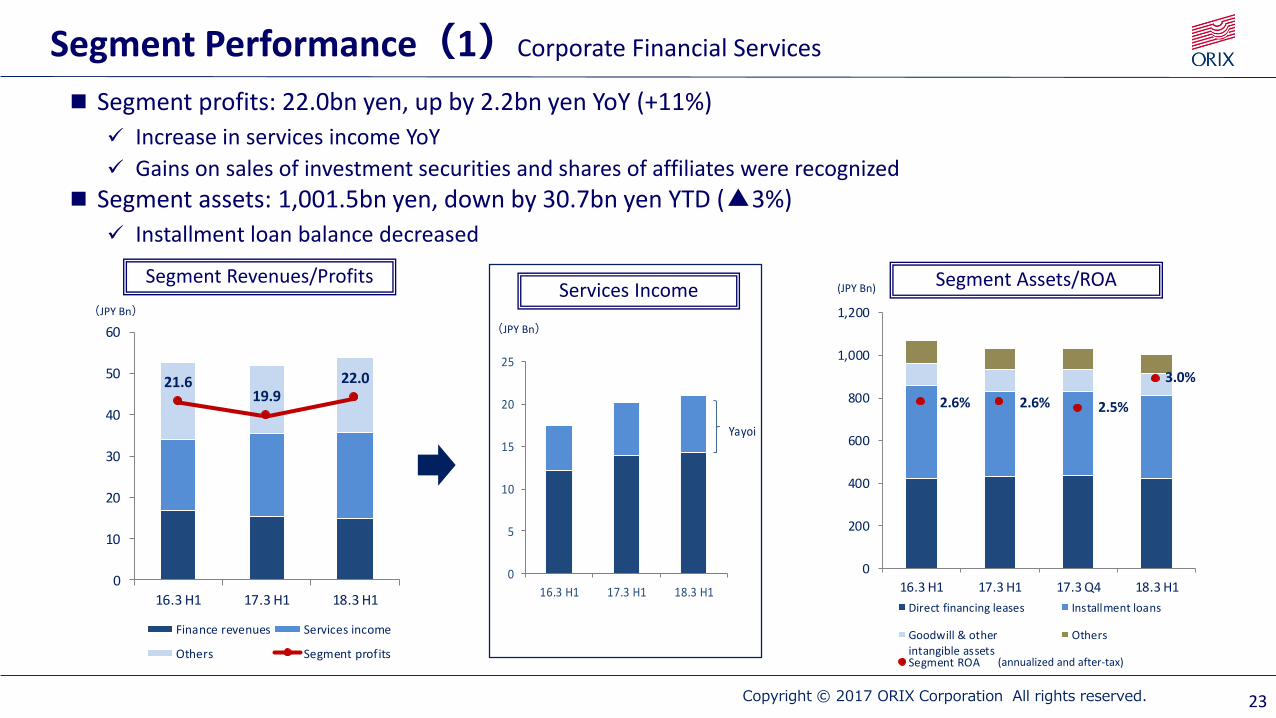
Segment profits: 22.0bn yen, up by 2.2bn yen YoY (+11%)
✓ Increase in services income YoY
✓ Gains on sales of investment securities and shares of affiliates were recognized
Segment assets: 1,001.5bn yen, down by 30.7bn yen YTD (▲3%)
✓ Installment loan balance decreased
23
Copyright © 2017 ORIX Corporation All rights reserved.
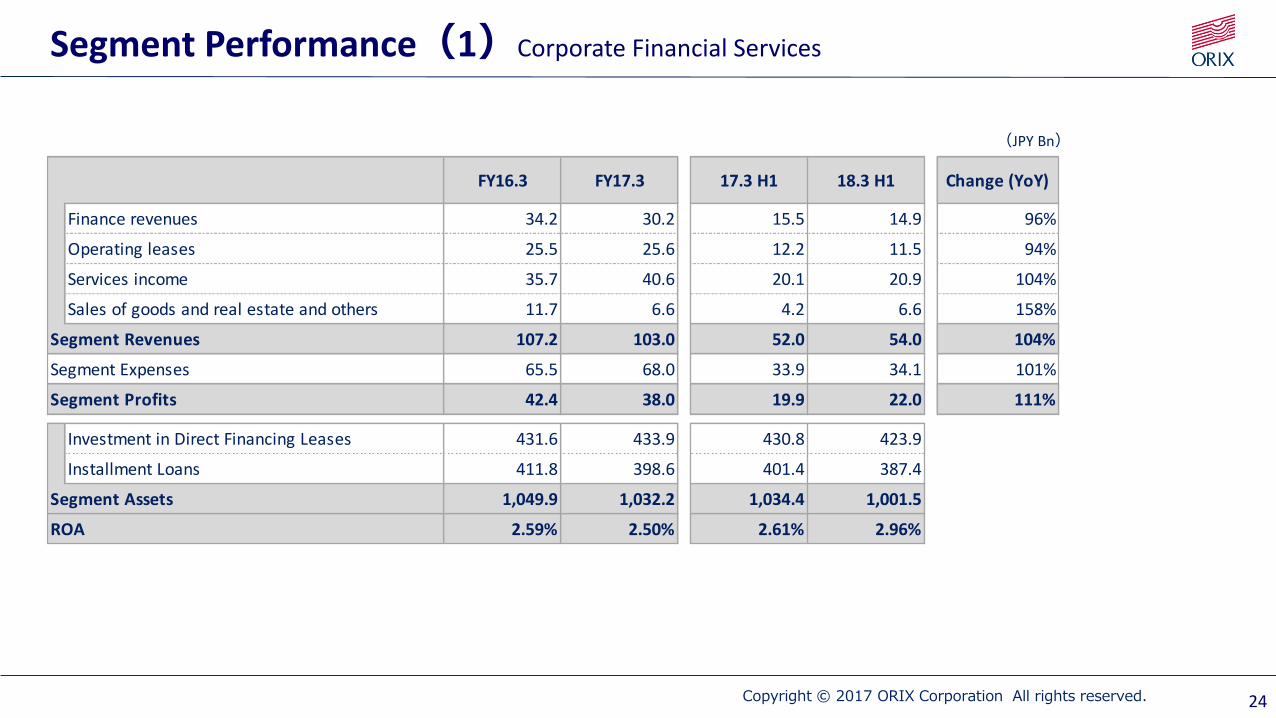
(JPY Bn)
FY16.3 FY17.3 17.3 H1 18.3 H1 Change (YoY)
Finance revenues 34.2 30.2 15.5 14.9 96%
Operating leases 25.5 25.6 12.2 11.5 94%
Services income 35.7 40.6 20.1 20.9 104%
Sales of goods and real estate and others 11.7 6.6 4.2 6.6 158%
Segment Revenues 107.2 103.0 52.0 54.0 104%
Segment Expenses 65.5 68.0 33.9 34.1 101%
Segment Profits 42.4 38.0 19.9 22.0 111%
Investment in Direct Financing Leases 431.6 433.9 430.8 423.9
Installment Loans 411.8 398.6 401.4 387.4
Segment Assets 1,049.9 1,032.2 1,034.4 1,001.5
ROA 2.59% 2.50% 2.61% 2.96%
Segment Performance(1)Corporate Financial Services
24
Copyright © 2017 ORIX Corporation All rights reserved.
4.5%
3.7% 3.7% 3.6%
0.0%
0.5%
1.0%
1.5%
2.0%
2.5%
3.0%
3.5%
4.0%
4.5%
5.0%
0
200
400
600
800
16.3 H1 17.3 H1 17.3 Q4 18.3 H1
Operating leases Direct financing leases
Others Segment ROA (annualized and after-tax)
23.1
19.7 20.4
0
40
80
120
160
16.3 H1 17.3 H1 18.3 H1Operating leases revenues Services income
Others Segment profits
Segment Performance(2)Maintenance Leasing
Segment Revenues/Profits Segment Assets/ROA(JPY Bn) (JPY Bn)
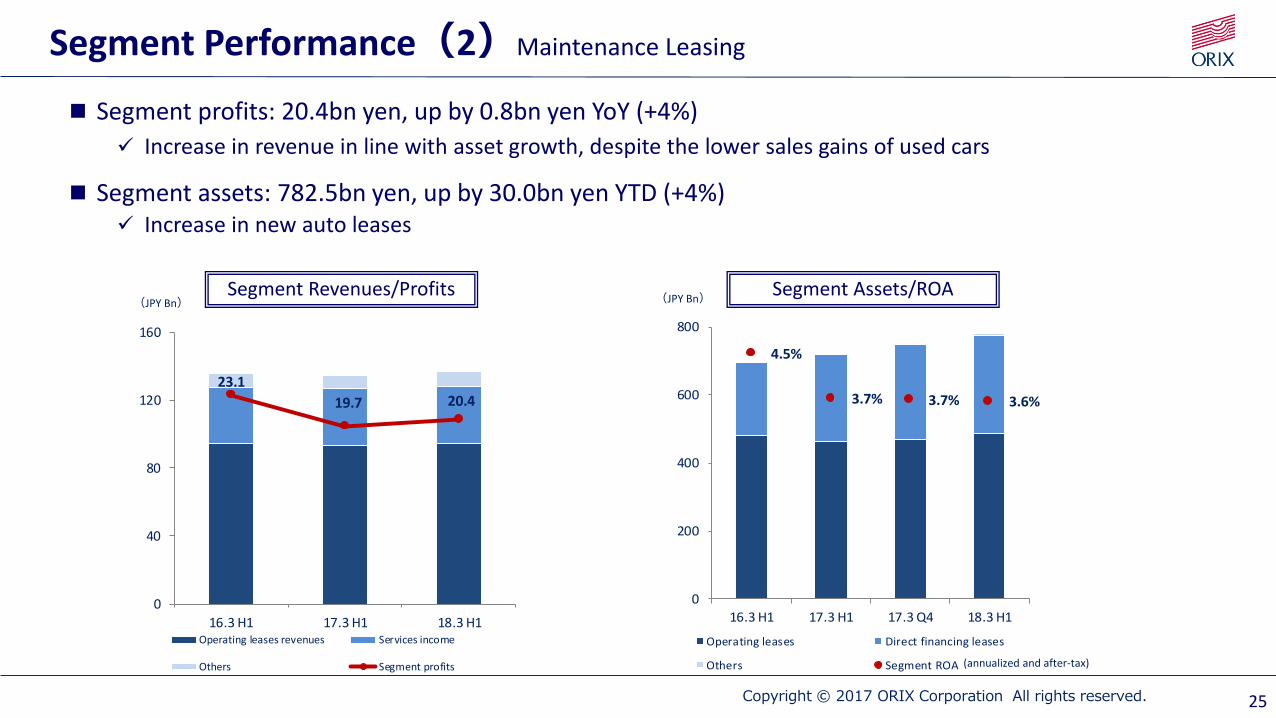
Segment profits: 20.4bn yen, up by 0.8bn yen YoY (+4%)
✓ Increase in revenue in line with asset growth, despite the lower sales gains of used cars
Segment assets: 782.5bn yen, up by 30.0bn yen YTD (+4%)✓ Increase in new auto leases
25

Copyright © 2017 ORIX Corporation All rights reserved.
(JPY Bn)
26
FY16.3 FY17.3 17.3 H1 18.3 H1 Change (YoY)
Finance revenues 12.1 13.0 6.4 7.0 110%
Operating leases 188.8 187.2 93.3 94.5 101%
Services income 66.8 66.3 33.3 33.7 101%
Segment Revenues 271.7 270.6 134.8 137.0 102%
Segment Expenses 228.7 230.8 115.2 116.4 101%
Segment Profits 42.9 39.8 19.7 20.4 104%
Investment in Direct Financing Leases 245.3 277.5 254.6 290.9
Investment in Operating Leases 481.0 469.8 464.6 486.7
Segment Assets 731.3 752.5 724.2 782.5
ROA 4.10% 3.66% 3.69% 3.64%
Segment Performance(2)Maintenance Leasing

Copyright © 2017 ORIX Corporation All rights reserved.
5.6%
6.7%7.1%
9.3%
0.0%
2.0%
4.0%
6.0%
8.0%
10.0%
12.0%
0
200
400
600
800
16.3 H1 17.3 H1 17.3 Q4 18.3 H1
Rental property Operating facil ities
Others Segment ROA
33.7 35.4
44.0
0
10
20
30
40
50
60
70
0
20
40
60
80
100
120
16.3 H1 17.3 H1 18.3 H1Gains on rental property sales Operating leases revenues
(excl. gains on rental property sales)
Services income Others
Segment profits
Segment Performance(3)Real Estate
Segment Revenues/Profits Segment Assets/ROA(JPY Bn)
(JPY Bn)
(annualized and after-tax)
Segment profits: 44.0bn yen, up by 8.5bn yen YoY (+24%)
✓ Realized gains from well-timed sales of real estate assets, solid contribution from facility operation business
Segment assets: 628.9bn yen, down by 28.8bn yen YTD (▲4%)✓ Assets decreased due to the sales of rental properties
27

Copyright © 2017 ORIX Corporation All rights reserved.
(JPY Bn)
FY16.3 FY17.3 17.3 H1 18.3 H1 Change (YoY)
Finance revenues 6.7 2.3 0.8 1.0 119%
Operating leases 60.3 88.2 43.3 30.1 70%
Gains on Rental Property Sales 16.1 49.7 23.0 12.6 55%
Services income 110.6 112.6 55.9 60.9 109%
Sales of goods and real estate and others 13.9 9.0 4.1 3.8 93%
Segment Revenues 191.5 212.1 104.1 95.8 92%
Segment Expenses 154.6 143.1 70.1 72.8 104%
Segment Profits 42.9 72.8 35.4 44.0 124%
Investment in Operating Leases 375.1 298.2 348.4 268.3
Property under Facility Operations 177.5 185.0 179.9 190.7
Advances for Investment in Operating Leases 38.5 18.6 22.5 17.2
Investment in Affiliates 91.0 99.3 91.0 93.2
Segment Assets 739.6 657.7 705.1 628.9
ROA 3.62% 7.12% 6.70% 9.34%
Segment Performance(3)Real Estate
28

Copyright © 2017 ORIX Corporation All rights reserved.
7.7%
10.2%
7.9%
6.5%
0.0%
2.0%
4.0%
6.0%
8.0%
10.0%
12.0%
0
300
600
900
16.3 H1 17.3 H1 17.3 Q4 18.3 H1
Loan servicing Principal investment
Environment and energy Othes (incl. Daikyo, Concession)
Segment ROA
36.5
52.0
38.9
0.0
10.0
20.0
30.0
40.0
50.0
60.0
0
150
300
450
600
750
900
16.3 H1 17.3 H1 18.3 H1
Others Services income
Sales of goods and real estate Segment profits
Segment Performance(4)Investment and Operation
Segment Revenues/Profits Segment Assets/ROA(JPY Bn)
(JPY Bn)
(annualized and after-tax)
Segment profits: 38.9bn yen, down by 13.1bn yen YoY (▲25%)✓ Profit from environment and energy business and concession business increased steadily, while the profit
in PE investment decreased due to the absence of the large capital gain
Segment assets: 863.6bn yen, up by 95.0bn yen YTD (+12%)✓ New investments in environment and energy business and domestic PE business
29

Copyright © 2017 ORIX Corporation All rights reserved.
(JPY Bn)
FY16.3 FY17.3 17.3 H1 18.3 H1 Change (YoY)
Finance revenues 12.6 10.7 5.3 4.6 86%
Gains on investment securities and dividends 10.3 13.0 6.2 4.4 70%
Sales of goods and real estate 718.9 938.4 377.4 601.8 159%
Services income 277.2 299.7 145.6 158.1 109%
Segment Revenues 1,028.4 1,272.0 539.0 774.4 144%
Segment Expenses 983.2 1,224.3 522.1 748.5 143%
12.1 37.3 35.1 13.1 37%
Segment Profits 57.2 85.0 52.0 38.9 75%
Installment Loans 76.0 56.4 64.8 54.7
Investment in Securities 71.7 51.5 59.9 39.2
Property under Facility Operations 130.6 187.7 161.4 185.0
Inventories 98.0 112.8 113.0 125.4
Investment in Affiliates 108.2 71.5 65.3 144.3
Segment Assets 704.2 768.7 695.8 863.6
ROA 5.58% 7.88% 10.16% 6.52%
Equity in Net Income of Affiliates and others
Segment Performance(4)Investment and Operation
30

Copyright © 2017 ORIX Corporation All rights reserved.
1.2%1.4% 1.5%
1.8%
-1.0%
-0.5%
0.0%
0.5%
1.0%
1.5%
2.0%
2.5%
0
1,000
2,000
3,000
4,000
16.3 H1 17.3 H1 17.3 Q4 18.3 H1
Banking and consumer finance Life Insurance HLIKK Segment ROA
-40
0
40
80
120
160
16.3 H1 17.3 H1 18.3 H1
HLIKK
portion32.135.5
43.0
0
10
20
30
40
50
0
40
80
120
160
200
240
16.3 H1 17.3 H1 18.3 H1Others Finance revenues
Life insurance premiums and
related investment income
Segment profits
Segment Performance(5)Retail
Segment Revenues/Profits Segment Assets/ROALife Insurance Premiums and Related Investment Income(JPY Bn)
(JPY Bn)
(JPY Bn)
(annualized and after-tax)
Segment profits: 43.0bn yen, up by 7.4bn yen YoY (+21%)✓ Finance revenue in banking business and Life insurance premiums increased ✓ Profits of HLIKK also increased YoY
Segment assets: 3,209.1bn yen, down by 82.5bn yen YTD (▲3%)✓ Assets decreased due to sales of bonds in OLI and run-off in HLIKK portfolio✓ Increased in installment loans in banking business
31
Copyright © 2017 ORIX Corporation All rights reserved.
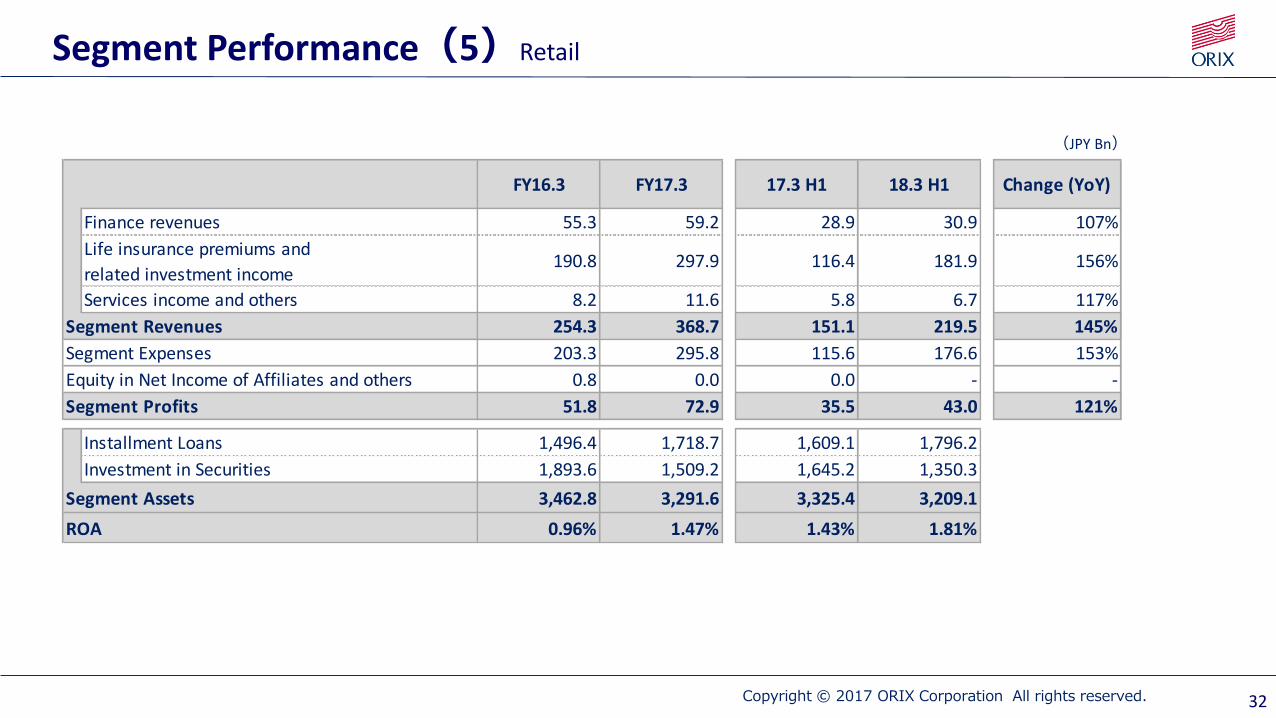
(JPY Bn)
FY16.3 FY17.3 17.3 H1 18.3 H1 Change (YoY)
Finance revenues 55.3 59.2 28.9 30.9 107%
Life insurance premiums and
related investment income190.8 297.9 116.4 181.9 156%
Services income and others 8.2 11.6 5.8 6.7 117%
Segment Revenues 254.3 368.7 151.1 219.5 145%
Segment Expenses 203.3 295.8 115.6 176.6 153%
0.8 0.0 0.0 - -
Segment Profits 51.8 72.9 35.5 43.0 121%
Installment Loans 1,496.4 1,718.7 1,609.1 1,796.2
Investment in Securities 1,893.6 1,509.2 1,645.2 1,350.3
Segment Assets 3,462.8 3,291.6 3,325.4 3,209.1
ROA 0.96% 1.47% 1.43% 1.81%
Equity in Net Income of Affiliates and others
Segment Performance(5)Retail
32

Copyright © 2017 ORIX Corporation All rights reserved.
6.0%
3.2% 3.2%
4.4%
1.5%
2.5%
3.5%
4.5%
5.5%
6.5%
7.5%
0
700
1,400
2,100
2,800
16.3 H1 17.3 H1 17.3 Q4 18.3 H1
The Americas Asia and AustraliaGreater China Middle East and EuropeRobeco Others (incl. Aircraft and Ships)Segment ROA
97.9
51.5
81.4
0
20
40
60
80
100
120
0
50
100
150
200
250
300
16.3 H1 17.3 H1 18.3 H1
Finance revenues Services income Operating leases
Others Segment profits
Segment Performance(6)Overseas Business
Segment Assets/ROASegment Revenues/Profits(JPY Bn) (JPY Bn)
(annualized and after-tax)
Segment profits: 81.4bn yen, up by 29.9bn yen YoY (+58%)✓ 4.1bn yen increased due to FX rate fluctuation✓ Profit growth in aircraft and ship-related business as well as Robeco and asset management business in Americas
Segment assets: 2,630.5bn yen, up by 176.3bn yen YTD (+7%)✓ 50.5bn yen increased due to FX rate fluctuation✓ Assets of aircraft and ship-related business increased largely✓ New investments in Americas
33

Copyright © 2017 ORIX Corporation All rights reserved.
(JPY Bn)
FY16.3 FY17.3 17.3 H1 18.3 H1 Change (YoY)
Finance revenues 75.0 81.3 37.9 46.6 123%
Gain on investment securities and dividends 16.1 13.3 5.6 11.3 202%
Operating leases 92.0 88.5 43.5 57.3 132%
Services income 250.1 216.7 105.9 117.0 111%
Segment Revenues 526.0 458.9 240.6 238.6 99%
Segment Expenses 452.2 386.8 197.1 180.5 92%
69.0 40.2 8.0 23.3 291%
-7.8 -2.3 -3.5 -2.0 -
Segment Profits 142.9 112.3 51.5 81.4 158%
Investment in Direct Financing Leases 351.0 357.7 311.4 374.7
Installment Loans 407.9 457.4 358.5 539.6
Investment in Operating Leases 375.4 420.2 325.1 457.8
Investment in Securities 383.2 465.9 355.3 423.7
Investment in Affiliates 305.7 332.2 276.7 338.8
Segment Assets 2,284.7 2,454.2 2,051.5 2,630.5
ROA 4.26% 3.24% 3.25% 4.37%
Equity in Net Income of Affiliates and othersNet Income Attributable to Redeemable Noncontrolling Interests
Segment Performance(6)Overseas Business
34

Copyright © 2017 ORIX Corporation All rights reserved.
■Overseas Business segment assets breakdown(JPY Bn)
By Region 16.3 17.3 16.9 17.9Change
(YTD)
The Americas 787.2 879.3 703.0 896.2 102%
Asia and Australia 592.3 593.6 551.1 638.6 108%
Greater China 260.3 315.6 239.9 327.6 104%
Middle East and Europe 49.3 36.5 42.7 33.3 91%
Robeco 340.9 317.3 301.5 357.6 113%
Aircraft and Ships 242.9 296.8 205.8 367.5 124%
Others 11.8 15.0 7.6 9.8 65%
Total 2,284.7 2,454.2 2,051.5 2,630.5 107%
Segment Performance(6)Overseas Business
35

Copyright © 2017 ORIX Corporation All rights reserved.
Business Portfolio in Three Categories
36

Copyright © 2017 ORIX Corporation All rights reserved.
Business Portfolio in Three Categories
Main Risk
Capital Requirement
Japan OverseasEnvironment/
Infrastructure
Financial
Services
Maintenance
ServicesOthers
Fixed
Income
Tangible
AssetsEquity
Corporate Financial
Services
Leasing, Loan, Fee
businessYayoi
New business
development
Maintenance
Leasing
ORIX Auto,
ORIX Rentec
Real Estate Facilities
operation
REIT,
RE investment
advisory
RE investment
Investment and
Operation
Environment and
energy,
Concession
Loan
servicing
PE investment,
Daikyo
RetailBanking,
Consumer finance,
Gurantee
Life insurance,
HLIKK
Overseas Business Leasing, Loan
Asset
Management,
Houlihan Lokey
Bond
investmentAircraft, Ships PE investment
Segments
Finance Operation Investment
Categories
Credit risk Operation/Business risk Market risk
Low Medium-High High
37
Copyright © 2017 ORIX Corporation All rights reserved.
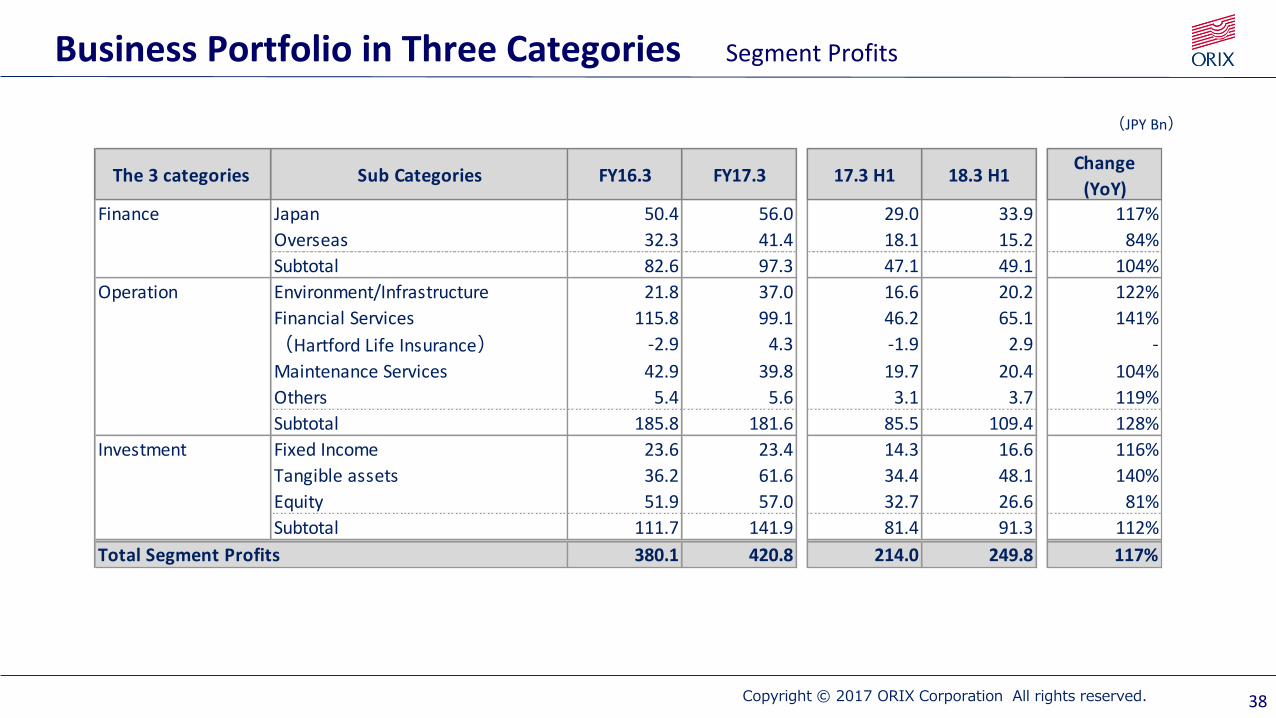
Business Portfolio in Three Categories Segment Profits
38
(JPY Bn)
The 3 categories Sub Categories FY16.3 FY17.3 17.3 H1 18.3 H1Change
(YoY)
Finance Japan 50.4 56.0 29.0 33.9 117%
Overseas 32.3 41.4 18.1 15.2 84%
Subtotal 82.6 97.3 47.1 49.1 104%
Operation Environment/Infrastructure 21.8 37.0 16.6 20.2 122%
Financial Services 115.8 99.1 46.2 65.1 141%
(Hartford Life Insurance) -2.9 4.3 -1.9 2.9 -
Maintenance Services 42.9 39.8 19.7 20.4 104%
Others 5.4 5.6 3.1 3.7 119%
Subtotal 185.8 181.6 85.5 109.4 128%
Investment Fixed Income 23.6 23.4 14.3 16.6 116%
Tangible assets 36.2 61.6 34.4 48.1 140%
Equity 51.9 57.0 32.7 26.6 81%
Subtotal 111.7 141.9 81.4 91.3 112%
Total Segment Profits 380.1 420.8 214.0 249.8 117%

Copyright © 2017 ORIX Corporation All rights reserved.
Business Portfolio in Three Categories Segment Asssets
39
(JPY Bn)
The 3 categories Sub Categories 16.3 17.3 16.9 17.9Change
(YTD)
Finance Japan 2,775.9 2,905.3 2,792.5 2,946.8 101%
Overseas 868.3 901.3 801.0 971.1 108%
Subtotal 3,644.2 3,806.6 3,593.6 3,917.8 103%
Operation Environment/Infrastructure 451.7 505.9 459.5 606.6 120%
Financial Services 2,143.7 1,855.8 1,942.8 1,757.7 95%
(Hartford Life Insurance) 957.2 739.6 847.3 615.1 83%
Maintenance Services 731.3 752.5 724.2 782.5 104%
Others 104.6 102.7 103.6 101.7 99%
Subtotal 3,431.4 3,216.9 3,230.1 3,248.5 101%
Investment Fixed Income 523.8 529.1 436.7 500.4 95%
Tangible Assets 788.4 762.0 711.4 801.2 105%
Equity 584.6 642.3 564.5 648.2 101%
Subtotal 1,896.9 1,933.4 1,712.6 1,949.8 101%
Total Segment Assets 8,972.4 8,956.9 8,536.2 9,116.2 102%

Copyright © 2017 ORIX Corporation All rights reserved.
15%
55%
30%
Finance Operation Investment
Employed Capital Ratio
Usage of Shareholders’ Equity
✓ Employed capital ratio* is controlled within the range meeting single A rating requirement
✓ Estimated employed capital ratio in FY18.3 is around 85%
Breakdown of Capital Employed
*ORIX calculation (Risk Capital/Shareholders’ Equity)
(JPY Bn)
17.9
40
17.9
Shareholders’ Equity 2,610.7
Employed 2,274.6
Unemployed 336.2
Employed Capital Ratio 87.1%

Copyright © 2017 ORIX Corporation All rights reserved.
These materials have been prepared by ORIX Corporation (“ORIX” or the “Company”) solely for your information and are subject to change without notice. The information contained in these materials has not been independently verified and its accuracy is not guaranteed. No representations, warranties or undertakings, express or implied, are made as to, and no reliance should be placed on, the accuracy, fairness, or completeness, or correctness of the information or the opinions presented or contained in these materials.
These materials contain forward-looking statements that reflect the Company’s intent, belief and current expectations about future events and financial results. These statements can be recognized by the use of words such as “expects,” “plans,” “will,” “estimates,” “projects,” “intends,” or words of similar meaning. These forward-looking statements are not guarantees of future performance. They are based on a number of assumptions about the Company’s operations and are subject to risks, uncertainties and other factors beyond the Company’s control. Accordingly, actual results may differ materially from these forward-looking statements. Factors that could cause such differences include, but are not limited to, those described under “Risk Factors” in the Company’s most recent annual report on Form 20-F filed with the U.S. Securities and Exchange Commission and under “Business Risk” of the securities report (yukashouken houkokusho) filed with the Director of the Kanto Local Finance Bureau.
Some of the financial information in these materials is unaudited.
The Company believes that it will be considered a “passive foreign investment company” for United States Federal income tax purpose in the year to which these consolidated financial results relate and for the foreseeable future by reason of the composition of its assets and the nature of its income. A U.S. holder of the shares or ADSs of the Company is therefore subject to special rules generally intended to eliminate any benefits from the deferral of U.S. Federal income tax that a holder could derive from investing in a foreign corporation that does not distribute all of its earnings on a current basis. Investors should consult their tax advisors with respect to such rules, which are summarized in the Company’s annual report.
ORIX Life Insurance has completed merger proceeding on its subsidiary Hartford Life Insurance K.K. on July 1, 2015 and is committed to continue serving its policy holders. ORIX Life insurance has no affiliation with The Hartford Financial Services Group, Inc. or its affiliates.
Nothing in this document shall be considered as an offer to sell or solicitation of an offer to buy any security, commodity or other instrument, including securities issued by the Company or any affiliate thereof.
Disclaimer
41

42Copyright © 2017 ORIX Corporation All rights reserved.
Company Name
※ テンプレートデザインの個別編集禁止
For the current IR materials and archives of past financial data please access our website
ORIX Websitehttp://www.orix.co.jp/grp/en/
IR Sectionhttp://www.orix.co.jp/grp/en/ir/
ORIX Corporation Corporate Planning DepartmentWorld Trade Center Building., 2-4-1, Hamamatsu-cho, Minato-ku, Tokyo 105-6135, Japan
Tel: +81-3-3435-3121 Fax: [email protected]
Related Documents