Origins of the Venn Diagram Deborah Bennett Abstract Venn diagrams have turned out to be visual tools that are enormously popular, but diagrams to help visualize relationships between classes or concepts in logic had existed prior to those of John Venn. The use of diagrams to demonstrate valid logical arguments has been found in the works of a few early Aristotelian scholars and appeared in the works of the famed mathematicians Gottfried Wilhelm Leibniz and Leonhard Euler. In a 1686 fragment (which remained unpublished for over 200 years), the universal genius Leibniz illustrated all of Aristotle’s valid syllogisms through circle drawings. In 1761, the much-admired master mathemati- cian Euler used almost identical diagrams to explain the same logical syllogisms. One hundred and twenty years later, John Venn ingeniously altered what he called “Euler circles” to become the familiar diagrams attached to Venn’s name. This paper explores the history of the Venn diagram and its predecessors. 1 Introduction Nearly everyone has seen the familiar overlapping circles created by John Venn. Advertisers use the diagrams to instruct their market; journalists use the diagrams to exhibit political and social interactions; and one pundit has said that USA Today could not exist without Venn diagrams. Venn diagrams have been a standard part of the curriculum of introductory logic, serving as a visual tool to represent relations of inclusion and exclusion between classes, or sets. When logic and sets entered the “new math” curriculum in the 1960s, the Venn diagram joined the mathematics curriculum as well, sometimes as early as elementary school where students first encountered sorting and classifying. But Venn’s diagrams did not simply appear on the mathematical horizon fully formed; they evolved from diagrams predating Venn. Long before their use for analyzing set relationships, Venn’s diagrams and diagrams similar to Venn’s were used to illustrate valid or invalid arguments in logic—in particular, arguments in the form of 3-line Aristotelian syllogisms. In his 1881 book Symbolic Logic, Venn D. Bennett () New Jersey City University, Jersey City, NJ, USA e-mail: [email protected] © Springer International Publishing Switzerland 2015 M. Zack, E. Landry (eds.), Research in History and Philosophy of Mathematics, DOI 10.1007/978-3-319-22258-5_8 105

Welcome message from author
This document is posted to help you gain knowledge. Please leave a comment to let me know what you think about it! Share it to your friends and learn new things together.
Transcript
Origins of the Venn Diagram
Deborah Bennett
Abstract Venn diagrams have turned out to be visual tools that are enormouslypopular, but diagrams to help visualize relationships between classes or concepts inlogic had existed prior to those of John Venn. The use of diagrams to demonstratevalid logical arguments has been found in the works of a few early Aristotelianscholars and appeared in the works of the famed mathematicians Gottfried WilhelmLeibniz and Leonhard Euler. In a 1686 fragment (which remained unpublishedfor over 200 years), the universal genius Leibniz illustrated all of Aristotle’s validsyllogisms through circle drawings. In 1761, the much-admired master mathemati-cian Euler used almost identical diagrams to explain the same logical syllogisms.One hundred and twenty years later, John Venn ingeniously altered what he called“Euler circles” to become the familiar diagrams attached to Venn’s name. This paperexplores the history of the Venn diagram and its predecessors.
1 Introduction
Nearly everyone has seen the familiar overlapping circles created by John Venn.Advertisers use the diagrams to instruct their market; journalists use the diagramsto exhibit political and social interactions; and one pundit has said that USA Todaycould not exist without Venn diagrams. Venn diagrams have been a standard part ofthe curriculum of introductory logic, serving as a visual tool to represent relationsof inclusion and exclusion between classes, or sets. When logic and sets enteredthe “new math” curriculum in the 1960s, the Venn diagram joined the mathematicscurriculum as well, sometimes as early as elementary school where students firstencountered sorting and classifying.
But Venn’s diagrams did not simply appear on the mathematical horizon fullyformed; they evolved from diagrams predating Venn. Long before their use foranalyzing set relationships, Venn’s diagrams and diagrams similar to Venn’s wereused to illustrate valid or invalid arguments in logic—in particular, arguments inthe form of 3-line Aristotelian syllogisms. In his 1881 book Symbolic Logic, Venn
D. Bennett (�)New Jersey City University, Jersey City, NJ, USAe-mail: [email protected]
© Springer International Publishing Switzerland 2015M. Zack, E. Landry (eds.), Research in History and Philosophy of Mathematics,DOI 10.1007/978-3-319-22258-5_8
105
106 D. Bennett
acknowledged that he had been anticipated in these ideas and devoted a chapterof historical notes on the evolution of the diagrams for analyzing propositions.With attribution to earlier influences, he stated that the “practical employment” ofthese diagrams dated to Leonhard Euler in 1761 (Venn 1881, p. 422). But prior toEuler, the foreshadowing of instructional diagrams of this sort has been credited toRaymond Llull (1232–1316?), Juan Luis Vives (1493–1540), Giulio Pace (1550–1635), and Gottfried Leibniz (1646–1716).
2 Early Influences
The thirteenth-century Majorcan monk and Aristotelian logician, Raymond Llull,utilized a variety of diagrams in his treatises. He wrote on topics as varied as thesciences, medicine, law, psychology, military tactics, grammar and rhetoric, mathe-matics, chivalry, ethics, and politics; he also wrote poems and erotic allegories. Llullwas variously referred to as Lull, Lul, Lullius, or Lully, and because he experiencedmystical visions of Christ, Llull also became known as Doctor Illuminatus. Atthe age of 83, when he refused to stop trying to convert Muslims to Christianitybased on logic and rational debate, he died after being stoned by an angry mob.Llull’s master project, which he deemed his “art,” was an attempt to relate allforms of knowledge by mechanically manipulating symbols and combinatorialdiagrams. Within his prolific works can be found numerous systems of organizingand classifying information using pictorial methods such as trees, ladders, andwheels (Gardner 1958).
Hints of Venn’s familiar overlapping circles were also to be found within acompilation of Llull’s work. In his works was found a diagram of four overlappingcircles, each with a different label: esse (existence or being), verum (truth), bonum(goodness), and unum (unity) (Llull 1609, p. 109). Was Llull trying to demonstratethe intersection of being, truth, beauty, and unity (God)? The use of two disjointcircles to indicate qualities with nothing in common, such as truth and falsity,was found frequently in other parts of his work. Llull’s “art” was but a steptowards his ambition to use logic as a semi-mechanical method of demonstrationtranslating across linguistic frontiers (Sales 2011; Dalton 1925). Llull was certainlycontroversial, but ultimately, very influential, his work studied for centuries after hisdeath (Gardner 1958).
Another early influence in the use of diagrams to visualize the validity of anAristotelian syllogism came from the Valecian scholar, Juan Luis Vives. Sometimesconsidered the “father” of modern psychology, Vives wrote on early medicine,emotions, memory, functions of the soul, the education of women, and relief ofthe poor. Of interest here is his 1555 work, De Censura Veri (On the Assessmentof Truth), a treatise discussing the Aristotelian proposition and the forms ofargumentation. Several histories have mentioned the triangles employed by Vivesto demonstrate an Aristotelian syllogism (Sales 2011; Nubiola 1993; Venn 1881).The three triangles (they really look like V’s) and their positioning with one inside
Origins of the Venn Diagram 107
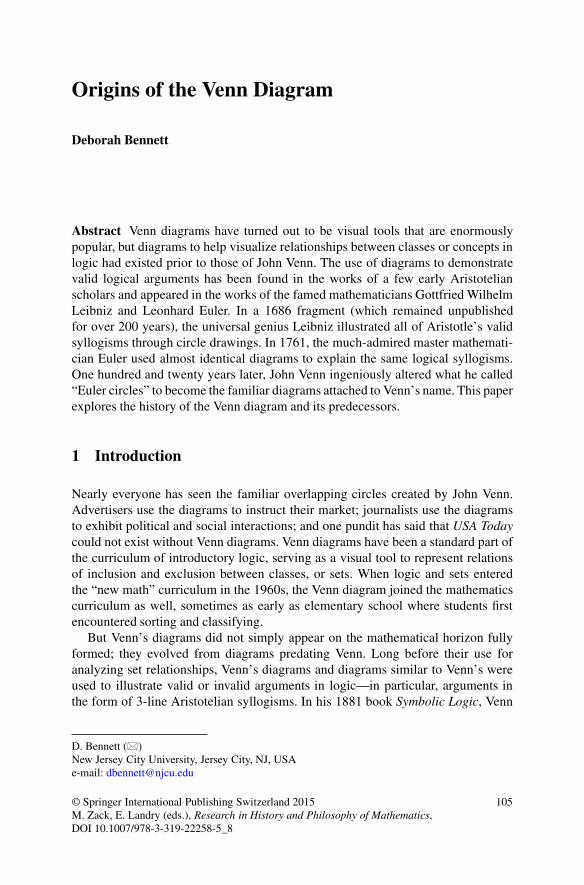
Fig. 1 Juan Luis Vives 1555De Censura Veri
B
A
C All A is B.All C is A.Therefore, All C is B.
the other very much suggested the three circles, one inside another, that were laterseen when Leibniz and Euler diagrammed this same syllogism. The Vives’s diagramis shown in Fig. 1. Next to the diagram, Vives wrote, “If some part of the first holdsthe whole of the second, and some part of the second holds the whole of the third,the whole of the third is held by the first: that is, if three triangles are drawn, ofwhich one, B, is the greatest and holds another (triangle) A, the third being thesmallest contained within A, which is C, and we say if all of the second is the firstand all of the third is the second, all of the third is the first” (translation by WaltJacob). Without the diagram, Vives’s argument would be very difficult to follow,but this is reported to be the only diagram of its kind in Vive’s work. De CensuraVeri went through hundreds of editions and translations and was widely read duringthe century after publication, so the diagram may have been noticed by others.
Although there is no evidence that Aristotle employed diagrams in this way,some historians have suggested that the Aristotelian scholar, Giulio Pace (Latinname Julius Pacius a Beriga), may have used such diagrams in his translationsof Aristotle. An Italian jurist and scholar, Pace was quite well known. In fact hisedition of Aristotle’s Organon, complete with commentary, became a standard,yielding 11 editions between 1584 and 1623. Pace incorporated extensive use ofsymbolism and diagrams to demonstrate Aristotle’s logic in his 1584 translationof the Organon. However, a thorough examination of a 1619 edition of Pace’stranslation and commentary revealed no Venn-like diagrams. Pace’s commentariesare filled with figures of all types—circles, semi-circles, trees, and triangles—butnone were used to enlighten the reader regarding the relationships among the termsof the propositions in the Aristotelian syllogisms (Aristotle 1619).
3 Leibniz
Unnoticed in John Venn’s 1881 historical notes, circle diagrams to illustrate allof the valid Aristotelian syllogisms had appeared in the 1686 papers of GottfriedWilhelm Leibniz. Having taught himself Latin when he was about 8 years old,Leibniz soon gained access to his father’s library (his father was a professor of

108 D. Bennett
philosophy at the University of Leipzig) where he studied logic in the Aristoteliantradition. Leibniz claimed that at age 13 or 14, he was “filling sheets of paperwith wonderful meditations about logic” (Leibniz 1966, p. x). Having entered theUniversity of Leipzig at age 14, Leibniz gained his first Bachelor’s degree at age 16;by age 21 he had completed a second Bachelor’s degree, a Master’s degree, and adoctorate in law.
As a courtier in the service of the Dukes of Hanover in Germany, Leibniz wasable to travel on a variety of scientific, political, and diplomatic projects wherehe sought out the great intellects of his time. Leibniz was a frequent visitor atAcadémie Royale des Sciences in Paris and traveled to London where he was electedto the Royal Society. Leibniz exchanged letters with most of the eminent scientistsand scholars; libraries that house Leibniz’s correspondence have estimated that thedocuments include about 15,000 letters from and to about 1100 correspondents.
In a fragment entitled De Formae Logicae Comprobatione per Linearum Ductus(On the proof of logical forms by the drawing of lines) Leibniz recorded a catalogof circle (or ellipse) diagrams for the entirety of the valid Aristotelian syllogisms(Leibniz 1903). Leibniz scholar and translator, G. H. R. Parkinson, judged that thisundated 18-page fragment was written around the same time as the 1686 documentGenerales Inquisitiones (Leibniz 1966, p. xxxviii). De Formae Logicae was notpublished until 1903 when it appeared in Opuscules et fragments inédits de Leibniz(Work and unedited fragments of Leibniz). Figure 2 illustrates one such diagram forthe proposition “All B is C.”
The circles, however, never seem to be the main point of Leibniz’s article—afterall, its title emphasized a method of drawing lines, not circles. The opening sentenceof the document read “I have recently been reflecting on the proof of LogicalForm by the drawing of lines” (translation by Walt Jacob). Each of Leibniz’s circlediagrams was accompanied by his line diagram method using parallel lines segmentsof different lengths; Leibniz did not discuss or explain the circles but seemed to bemore intent on exhibiting his line diagrams. In several other fragments, he providedextensive explanations of the line notation to illustrate logical arguments. However,another individual is credited with originating the logic line diagrams.
According to the Scottish philosopher Sir William Sterling Hamilton and JohnVenn (and others to this day), the Swiss mathematician, Johann Heinrich Lambert,originated the line-segment diagram method of displaying relationships betweenconcepts in propositions (Venn 1881, p. 430; Hamilton 1874, p. 256; Lambert 1764).
Fig. 2 Leibniz’s line diagrams alongside his circle diagrams circa 1686
Origins of the Venn Diagram 109
Lambert first published his linear methods in his 1764 Neues Organon, presumablynamed after Aristotle’s Organon. Lambert’s 1764 line diagrams and Leibniz’s 1686line diagrams were strikingly similar.
According to some historians, the use of circles to discover the validity ofa syllogism first entered the literature in the work of Johann Christoph Sturm,published in 1661 (preceding Leibniz’s papers). In Universalia Euclidea, Sturmused circles, not to prove, but to highlight evidence in Euclid’s propositions onproportions as he reproved them (Sholz 1961). Leibniz and Sturm were familiarwith each other’s work in philosophy and had the same professor, Erhard Weigel, atJena University in Germany where Leibniz had studied briefly one summer in 1663(Bullynck 2013).
Another individual mentioned as the possible “first” logician to use diagramsfor the demonstration of the whole of the Aristotelian syllogistics was ChristianWeise (1642–1708). In 1691, dramatist and Rector Christian Weise (1642–1708)published a booklet on Aristotelian syllogisms called Nucleus Logicae (Hamilton1874; Venn 1881; Sholz 1961). In 1712 after Weise was dead, the document wasrevised and republished as Nucleus logicae Weisianae under the supervision ofJohann Christian Lange, Professor of Philosophy at Giessen. Historians reporthaving seen only the Weise/Lange edition. Sir William Hamilton (1874) related thatcircles and squares were used to represent propositions in a syllogism. HistorianSholz (1961) confirmed having seen these diagrams and commented that Lange hadturned Weise’s insignificant 72-page booklet into an 850-page opus, hinting thatLange may have added the drawings to the 1712 edition. Lange dedicated the 1712Nucleus logicae Weisianae to the Berlin Academy, and historian Sholz suggestedthat this was a tribute to Leibniz, the Academy’s founder and first president (Sholz1961, p. 119).
Leibniz’s 1686 circle diagrams and line diagrams went unpublished (and possi-bly unnoticed) for over 200 years. Although Leibniz amassed an impressive quantityof papers and letters, little was published during his lifetime, and the publicationsof his mathematics and philosophical work after his death were often unorganizedand undated—leaving “a daunting impression of chaotic profusion” (Leibniz 1966,p. ix). Sir William Hamilton, in his 1874 Lectures on Logic stated,
That the doctrines of Leibnitz [sic], on this and other cardinal points of psychology, shouldhave remained apparently unknown to every philosopher of this country, is a matter not lessof wonder than of regret, and is only to be excused by the mode in which Leibnitz gavehis writings to the world. His most valuable thoughts on the most important subjects weregenerally thrown out in short treatises or letters, and these, for a long time, were to be foundonly in partial collections, and sometimes to be laboriously sought out, dispersed as theywere in the various scientific Journals and Transactions of every country of Europe; andeven when his works were at length collected, the attempt of his editor to arrange his papersaccording to their subjects (and what subject did Leibnitz not discuss?) was baffled by themultifarious nature of their contents (Hamilton 1874, p. 180).
However, the world did take notice when, in 1761, Leonhard Euler publishedalmost identical circle diagrams to explain the valid Aristotelian syllogisms (Euler1770). Euler did not claim originality; in fact, the diagrams were contained in studymaterials intended to represent the state of current knowledge.
110 D. Bennett
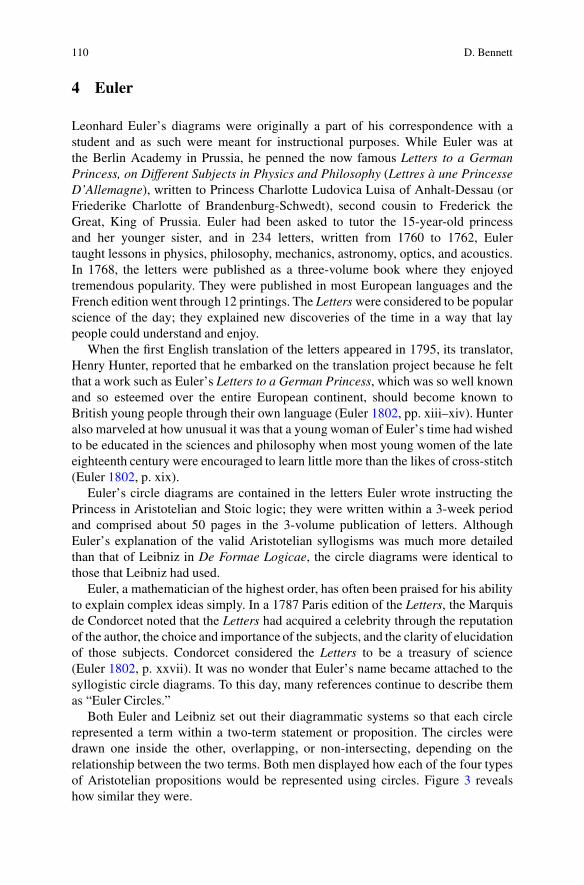
4 Euler
Leonhard Euler’s diagrams were originally a part of his correspondence with astudent and as such were meant for instructional purposes. While Euler was atthe Berlin Academy in Prussia, he penned the now famous Letters to a GermanPrincess, on Different Subjects in Physics and Philosophy (Lettres à une PrincesseD’Allemagne), written to Princess Charlotte Ludovica Luisa of Anhalt-Dessau (orFriederike Charlotte of Brandenburg-Schwedt), second cousin to Frederick theGreat, King of Prussia. Euler had been asked to tutor the 15-year-old princessand her younger sister, and in 234 letters, written from 1760 to 1762, Eulertaught lessons in physics, philosophy, mechanics, astronomy, optics, and acoustics.In 1768, the letters were published as a three-volume book where they enjoyedtremendous popularity. They were published in most European languages and theFrench edition went through 12 printings. The Letters were considered to be popularscience of the day; they explained new discoveries of the time in a way that laypeople could understand and enjoy.
When the first English translation of the letters appeared in 1795, its translator,Henry Hunter, reported that he embarked on the translation project because he feltthat a work such as Euler’s Letters to a German Princess, which was so well knownand so esteemed over the entire European continent, should become known toBritish young people through their own language (Euler 1802, pp. xiii–xiv). Hunteralso marveled at how unusual it was that a young woman of Euler’s time had wishedto be educated in the sciences and philosophy when most young women of the lateeighteenth century were encouraged to learn little more than the likes of cross-stitch(Euler 1802, p. xix).
Euler’s circle diagrams are contained in the letters Euler wrote instructing thePrincess in Aristotelian and Stoic logic; they were written within a 3-week periodand comprised about 50 pages in the 3-volume publication of letters. AlthoughEuler’s explanation of the valid Aristotelian syllogisms was much more detailedthan that of Leibniz in De Formae Logicae, the circle diagrams were identical tothose that Leibniz had used.
Euler, a mathematician of the highest order, has often been praised for his abilityto explain complex ideas simply. In a 1787 Paris edition of the Letters, the Marquisde Condorcet noted that the Letters had acquired a celebrity through the reputationof the author, the choice and importance of the subjects, and the clarity of elucidationof those subjects. Condorcet considered the Letters to be a treasury of science(Euler 1802, p. xxvii). It was no wonder that Euler’s name became attached to thesyllogistic circle diagrams. To this day, many references continue to describe themas “Euler Circles.”
Both Euler and Leibniz set out their diagrammatic systems so that each circlerepresented a term within a two-term statement or proposition. The circles weredrawn one inside the other, overlapping, or non-intersecting, depending on therelationship between the two terms. Both men displayed how each of the four typesof Aristotelian propositions would be represented using circles. Figure 3 revealshow similar they were.
Origins of the Venn Diagram 111
Euler Leibniz
A B
B
CA B
B C
All A are B. No A are B. All B are C. No B are C.
B C CBA AB B
Some A are B. Some A are not B. Some B are C. Some B are not C.
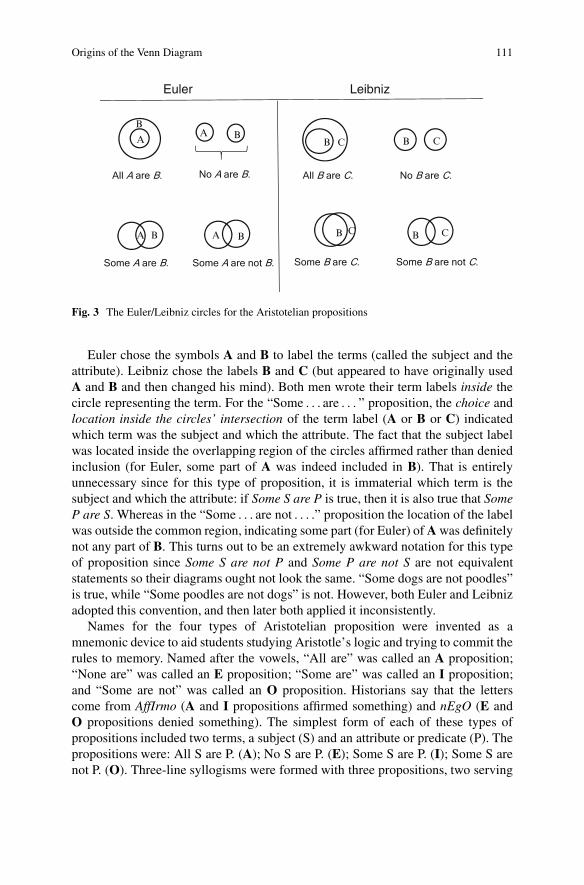
Fig. 3 The Euler/Leibniz circles for the Aristotelian propositions
Euler chose the symbols A and B to label the terms (called the subject and theattribute). Leibniz chose the labels B and C (but appeared to have originally usedA and B and then changed his mind). Both men wrote their term labels inside thecircle representing the term. For the “Some : : : are : : : ” proposition, the choice andlocation inside the circles’ intersection of the term label (A or B or C) indicatedwhich term was the subject and which the attribute. The fact that the subject labelwas located inside the overlapping region of the circles affirmed rather than deniedinclusion (for Euler, some part of A was indeed included in B). That is entirelyunnecessary since for this type of proposition, it is immaterial which term is thesubject and which the attribute: if Some S are P is true, then it is also true that SomeP are S. Whereas in the “Some : : : are not : : : .” proposition the location of the labelwas outside the common region, indicating some part (for Euler) of A was definitelynot any part of B. This turns out to be an extremely awkward notation for this typeof proposition since Some S are not P and Some P are not S are not equivalentstatements so their diagrams ought not look the same. “Some dogs are not poodles”is true, while “Some poodles are not dogs” is not. However, both Euler and Leibnizadopted this convention, and then later both applied it inconsistently.
Names for the four types of Aristotelian proposition were invented as amnemonic device to aid students studying Aristotle’s logic and trying to commit therules to memory. Named after the vowels, “All are” was called an A proposition;“None are” was called an E proposition; “Some are” was called an I proposition;and “Some are not” was called an O proposition. Historians say that the letterscome from AffIrmo (A and I propositions affirmed something) and nEgO (E andO propositions denied something). The simplest form of each of these types ofpropositions included two terms, a subject (S) and an attribute or predicate (P). Thepropositions were: All S are P. (A); No S are P. (E); Some S are P. (I); Some S arenot P. (O). Three-line syllogisms were formed with three propositions, two serving
112 D. Bennett
as premises and the third a concluding proposition. Aristotle showed that some3-line combinations of the statements lead to a valid argument and some do not.
The Aristotelian syllogisms can be discussed without any reference to the A, E,I, and O notation, and that is what Euler did in his first few letters on logic. Leibnizchose to include the notation with his diagrams and that seems to be the reason whyhe decided against using the term labels A and B and used B and C instead. Usingthe label A could cause confusion with the A-type proposition. In fact, in the 1903publication of Leibniz’s fragments, editor Louis Couturat indicated in footnotes thatLeibniz had, several times, slipped up by using the label A when he meant to usethe label C; Leibniz appeared to have changed his mind about which labels to usefor the terms in the diagrams (Leibniz 1903, p. 292).
Neither Leibniz nor Euler claimed credit for the circle diagrams (Leibniz didclaim invention of the line diagrams). And although Euler and Leibniz were notcontemporaries, the two men were connected through other mathematicians andcorrespondents. Two of Leibniz’s most enthusiastic followers were Jakob andJohann Bernoulli of Switzerland who disseminated his work throughout Europeafter his death in 1716 (Dunham 1990). Euler studied mathematics under JohannBernoulli and was a close friend of Bernoulli’s son, Daniel. Leibniz and Euler sharedcorrespondents in Johann Bernoulli and his nephew Nicolaus Bernoulli. Euler mayhave seen Leibniz’s circles through their common colleagues; or both men may haveseen the diagrams in the works of another. It is curious that neither of them treatedthe circle diagrams as if they were a new idea, yet the diagrams have not appearedin other scholarship of that period.
5 Venn
In the 1880s the English mathematical community was buzzing about the revolu-tionary symbolic logic methods put forward by George Boole in An Investigation ofthe Laws of Thought: On Which Are Founded the Mathematical Theories of Logicand Probabilities in 1854. In July of 1880, John Venn wrote an article entitled, “Onthe Diagrammatic and Mechanical Representation of Propositions and Reasonings,”that was published in The London, Edinburgh, and Dublin Philosophical Magazineand Journal of Science. In his article, Venn proposed a new kind of logic diagramwith definite advantages over the previous diagrams in analyzing logical statements.It was Venn’s goal that his diagrams would meet the demands of the new Booleanalgebra.
John Venn’s lectures in logic at Cambridge University formed the basis of his1881 book, Symbolic Logic, where he more fully described his new diagrammaticmethod. On the prevalence of contemporary diagrammatic methods Venn com-mented that of 60 logical treatises published during the last century that he had(rather haphazardly) consulted, 34 of them had appealed to the use of diagrams,nearly all making use of the Eulerian scheme (Venn 1881). John Venn was, ofcourse, referring to diagrams that had become known as Euler circles.
Origins of the Venn Diagram 113
S P* PS
* P S*
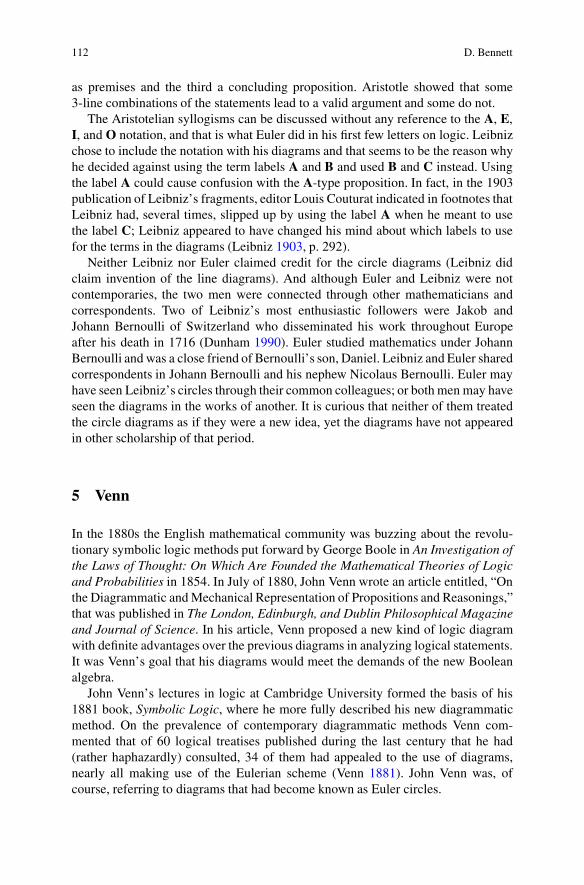
Fig. 4 Alternate possibilities for “Some S are P”
Venn enumerated several shortcomings of Eulerian circle diagrams as he intro-duced a new way of displaying the circles which he considered to be an improve-ment over the existing diagrammatic methods. Venn acknowledged that the use ofcircles is entirely arbitrary. Whatever the closed figure used, the purpose of thediagrams was always the same—an attempt to arrange the two or more closedfigures to illustrate the mutual relation of inclusion or exclusion of the classesdenoted by the terms employed in the syllogisms (Venn 1881, p. 52). One of Venn’sobjections to the Euler-type diagrams was that certain fairly simple propositions ledto more than one possible diagram. For example, if the proposition “Some S are P”was true, with imperfect knowledge it was possible that “All S are P” or All P are S”was also true. So to represent all possibilities, three diagrams ought to be drawn asin Fig. 4. Of the three possible diagrams only one represented the proposition, butwithout further information it was uncertain which diagram should be used. Three(or more) analyses might be required.
A second objection raised by Venn was that he wanted the diagrams to aid in thetask of working out a conclusion from premises, and he claimed that the Euler circlescould only be drawn after the problem had been solved. Furthermore, the analysisof syllogisms had evolved to encompass far more complicated syllogisms than the3-term, 2-premise syllogisms of Aristotle. The Eulerian system was not equippedto deal with disjunctive statements like, “All X is either Y and Z, or not-Y” and “Ifany XY is Z, then it is W” (Venn 1880, p. 13). Venn mentioned this deficiency, buthe indicated that the older system ought not be criticized for its failure to negotiatestatements more complicated than the ones for which the system was invented whenhe said, “it should be understood that the failure of the older method is simply dueto its attempted application to a somewhat more complicated set of data than thosefor which it was designed” (Venn 1880, p. 14).
In the system of Leibniz and Euler (depending on the type of propositionbeing made), each new set of premises required a completely different kind ofdrawing. Venn declared that this was an essential defect of these systems—thateach new proposition required a new diagram from the beginning. On the otherhand, every one of Venn’s diagrams began with the same drawing. Each of Venn’sdiagrams began with a number of circles equal to the numbers of terms (classes)to be analyzed in a syllogism. The circles, representing the classes, overlappedin such a way as to create compartments and each compartment represented aunique subclass. The underpinnings of Boole’s logic rested upon consideration of
114 D. Bennett
all combinations of the terms involved—combinations that Venn called subclasses.For two terms, say X and Y, there were four subclasses—things that were both Xand Y, things that were X but not Y, things that were Y but not X, and things thatwere neither X nor Y. For three terms, there were eight subclasses.
So, without needing to know the import of the proposition, every Venn diagram oftwo classes began with the exact same drawing of two overlapping circles, creatingcompartments for each of the four distinct subclasses. Since every diagram beganin exactly the same way, Venn’s compartmentalized circles served as “graph paper”from which the analysis of the syllogism could begin. Venn even suggested that astamp could be created so that the “graph paper” for the diagrams was ready-made(Venn 1880, p. 16).
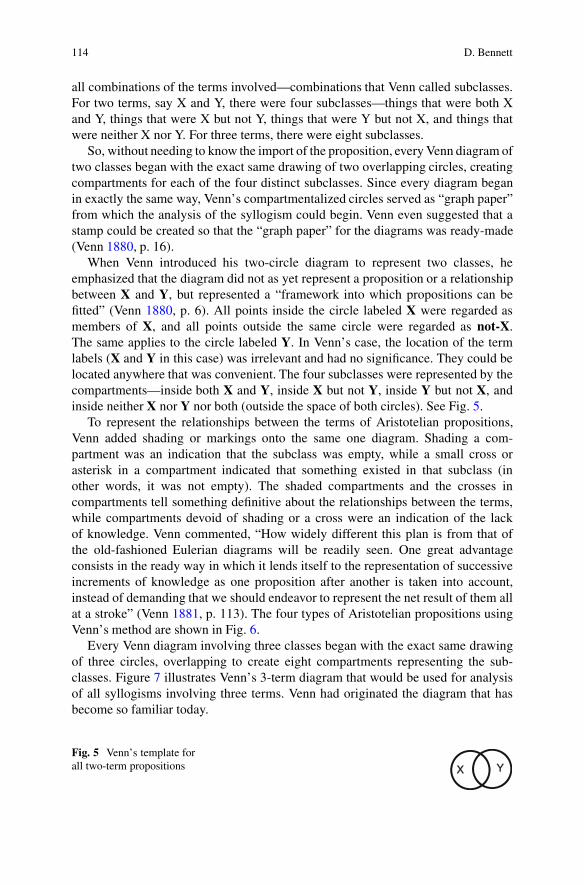
When Venn introduced his two-circle diagram to represent two classes, heemphasized that the diagram did not as yet represent a proposition or a relationshipbetween X and Y, but represented a “framework into which propositions can befitted” (Venn 1880, p. 6). All points inside the circle labeled X were regarded asmembers of X, and all points outside the same circle were regarded as not-X.The same applies to the circle labeled Y. In Venn’s case, the location of the termlabels (X and Y in this case) was irrelevant and had no significance. They could belocated anywhere that was convenient. The four subclasses were represented by thecompartments—inside both X and Y, inside X but not Y, inside Y but not X, andinside neither X nor Y nor both (outside the space of both circles). See Fig. 5.
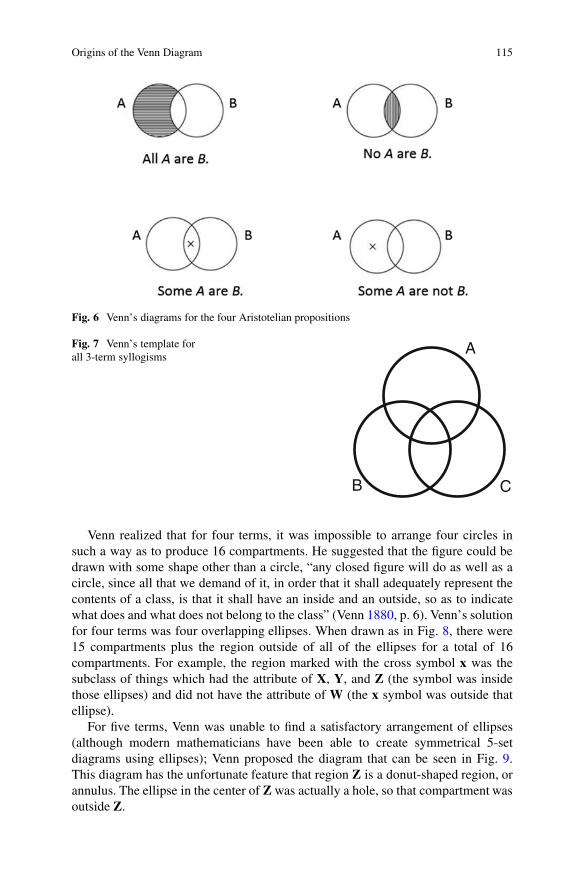
To represent the relationships between the terms of Aristotelian propositions,Venn added shading or markings onto the same one diagram. Shading a com-partment was an indication that the subclass was empty, while a small cross orasterisk in a compartment indicated that something existed in that subclass (inother words, it was not empty). The shaded compartments and the crosses incompartments tell something definitive about the relationships between the terms,while compartments devoid of shading or a cross were an indication of the lackof knowledge. Venn commented, “How widely different this plan is from that ofthe old-fashioned Eulerian diagrams will be readily seen. One great advantageconsists in the ready way in which it lends itself to the representation of successiveincrements of knowledge as one proposition after another is taken into account,instead of demanding that we should endeavor to represent the net result of them allat a stroke” (Venn 1881, p. 113). The four types of Aristotelian propositions usingVenn’s method are shown in Fig. 6.
Every Venn diagram involving three classes began with the exact same drawingof three circles, overlapping to create eight compartments representing the sub-classes. Figure 7 illustrates Venn’s 3-term diagram that would be used for analysisof all syllogisms involving three terms. Venn had originated the diagram that hasbecome so familiar today.
Fig. 5 Venn’s template forall two-term propositions XX YY
Origins of the Venn Diagram 115
Fig. 6 Venn’s diagrams for the four Aristotelian propositions
Fig. 7 Venn’s template forall 3-term syllogisms
A
B C
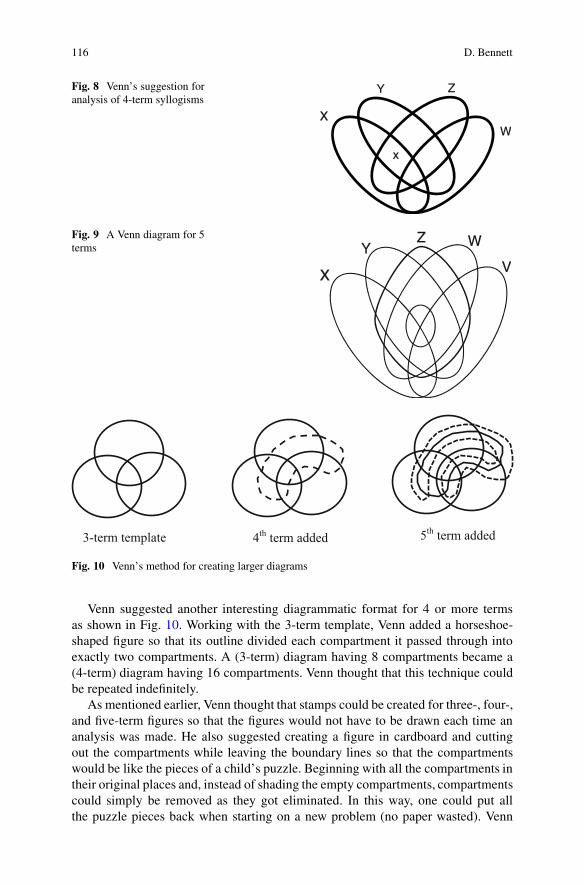
Venn realized that for four terms, it was impossible to arrange four circles insuch a way as to produce 16 compartments. He suggested that the figure could bedrawn with some shape other than a circle, “any closed figure will do as well as acircle, since all that we demand of it, in order that it shall adequately represent thecontents of a class, is that it shall have an inside and an outside, so as to indicatewhat does and what does not belong to the class” (Venn 1880, p. 6). Venn’s solutionfor four terms was four overlapping ellipses. When drawn as in Fig. 8, there were15 compartments plus the region outside of all of the ellipses for a total of 16compartments. For example, the region marked with the cross symbol x was thesubclass of things which had the attribute of X, Y, and Z (the symbol was insidethose ellipses) and did not have the attribute of W (the x symbol was outside thatellipse).
For five terms, Venn was unable to find a satisfactory arrangement of ellipses(although modern mathematicians have been able to create symmetrical 5-setdiagrams using ellipses); Venn proposed the diagram that can be seen in Fig. 9.This diagram has the unfortunate feature that region Z is a donut-shaped region, orannulus. The ellipse in the center of Z was actually a hole, so that compartment wasoutside Z.
116 D. Bennett
Fig. 8 Venn’s suggestion foranalysis of 4-term syllogisms
XX
x
Y Z
W
Fig. 9 A Venn diagram for 5terms
XX
Y WZ
V
3-term template 4th term added 5th term added
Fig. 10 Venn’s method for creating larger diagrams
Venn suggested another interesting diagrammatic format for 4 or more termsas shown in Fig. 10. Working with the 3-term template, Venn added a horseshoe-shaped figure so that its outline divided each compartment it passed through intoexactly two compartments. A (3-term) diagram having 8 compartments became a(4-term) diagram having 16 compartments. Venn thought that this technique couldbe repeated indefinitely.
As mentioned earlier, Venn thought that stamps could be created for three-, four-,and five-term figures so that the figures would not have to be drawn each time ananalysis was made. He also suggested creating a figure in cardboard and cuttingout the compartments while leaving the boundary lines so that the compartmentswould be like the pieces of a child’s puzzle. Beginning with all the compartments intheir original places and, instead of shading the empty compartments, compartmentscould simply be removed as they got eliminated. In this way, one could put allthe puzzle pieces back when starting on a new problem (no paper wasted). Venn
Origins of the Venn Diagram 117
Fig. 11 Venn’s plan for a“logic machine”
WW
Z Y
X
(3) No WX is YZ. Conclusion: No X is Y.
(1) All X is either both Y and Z or not-Y.
(2) If any XY is Z then it is W.
XX
Y Z
W
X
Y Z
W
X
Y Z
W
X
Y Z
W
Fig. 12 Venn’s demonstration of his method
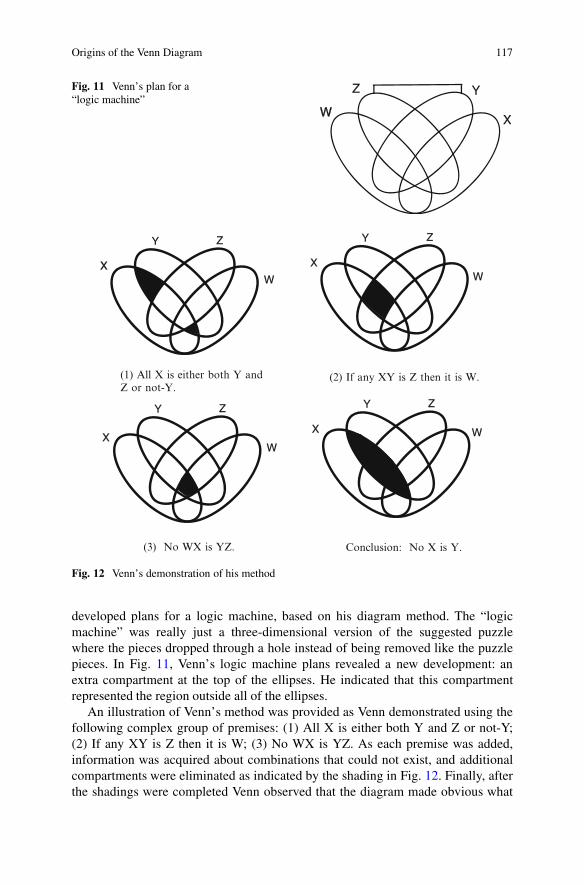
developed plans for a logic machine, based on his diagram method. The “logicmachine” was really just a three-dimensional version of the suggested puzzlewhere the pieces dropped through a hole instead of being removed like the puzzlepieces. In Fig. 11, Venn’s logic machine plans revealed a new development: anextra compartment at the top of the ellipses. He indicated that this compartmentrepresented the region outside all of the ellipses.
An illustration of Venn’s method was provided as Venn demonstrated using thefollowing complex group of premises: (1) All X is either both Y and Z or not-Y;(2) If any XY is Z then it is W; (3) No WX is YZ. As each premise was added,information was acquired about combinations that could not exist, and additionalcompartments were eliminated as indicated by the shading in Fig. 12. Finally, afterthe shadings were completed Venn observed that the diagram made obvious what
118 D. Bennett
the conclusion ought to be: X and Y are mutually exclusive or “No X is Y” (Venn1880, p. 13).
John Venn had modified the earlier logic circle diagrams so that his diagrammaticmethod would parallel Boole’s system and enable a visual representation of it.Today, the diagrams have evolved even further, modified through the use of colorand size (where color or size has additional meaning in the diagram). Venn (andthose before him) would probably be astounded that a small visual tool like thediagrams would have proliferated into so many spheres of society. A Googlesearch on “Venn Diagram” produces 1,470,000 hits, and a search through YouTube produces 16,500 videos on the Venn diagram. Searching an academic librarydatabase for “Venn diagram” produces applications well beyond the syllogism inareas as diverse as bioinformatics, mental health, and ethical reasoning. There isno doubt about the impact of the diagrams; they have become pervasive in popularculture.
References
Aristotle. (1619). Aristotelis Stagiritae Peripateticorum Principis Organum (Paris ed.), translatedby Julius Pacius a Beriga with commentary. Sebastianum Chappelet. http://books.google.com
Bullynck, M. (2013). Erhard Weigel’s contributions to the formation of symbolic logic. Historyand Philosophy of Logic, 34(1), 25–34.
Dalton, O. M. (1925). A portable dial in the form of a book, with figures derived from RaymondLul. Archaeologia, 74, 89–102.
Dunham, W. (1990). Journey through Genius. New York: Penguin.Euler, L. (1770). Lettres a une Princesse D’Allemagne sur divers sujets de physique et de
philosophie, Tome second. Mietau et Leipsic: Chez Steidel et compagnie. http://www.e-rara.ch/zut/content/pageview/2380250
Euler, L. (1802). Letters of Euler on different subjects in physics and philosophy addressed toa German Princess (CI–CVIII) (2nd ed.), translated by Henry Hunter. London: Murray andHighley.
Gardner, M. (1958). Logic machines and diagrams. New York: McGraw-Hill.Hamilton, S. W. (1874). Lectures on metaphysics and logic, Vol. III: Lectures on logic, Vol. I (3rd
ed.). Edinburgh and London: William Blackwood and Sons.Lambert, J. H. (1764). Neues Organon (Vol. 1, pp. 128–133). Leipzig.Leibniz, G. W. (1903). De Formae Logicae Comprobatione per Linearum Ductus, Phil., VII, B,
IV, 1–10. Opuscules et fragments inédits de Leibniz, extraits des ms. de la Bibliothèque royalede Hanovre par Louis Couturat. Paris, pp. 292–331. Bibliothèque Nationale in Paris Gallica,http://gallica.bnf.fr/ark:/12148/bpt6k68142b.r=Leibniz+Logicae.langEN
Leibniz, G. (1966). Logical papers. Translated and edited by G. H. R. Parkinson. Oxford:Clarendon Press.
Llull, R. (1609). Opera ea quae ad adinventam ab ipso artem universalem scientiarum.Sumptibus Lazarus Zetzne Bibliopola. Google Books: Bavarian State Library, p. 109. http://books.google.com/books?id=NxhCAAAAcAAJ&pg=RA4-PT875&dq=opera+ea+quae+ad+adinventam+ab+ipso+arte+lullius&hl=en&sa=X&ei=G7ApU_KmFOXA0gHa4oHwCg&ved=0CFAQuwUwBg#v=onepage&q&f=false
Nubiola, J. (1993). Juan Luis Vives y Charles S. Peirce. Anuario Filosófico, 26, 155–164.

Origins of the Venn Diagram 119
Sales, T. (2011). Llull as computer scientist, or Why Llull was one of us. In A. Fidora & C. Sierra(Eds.), Ramon Llull: From the Ars Magna to Artificial Intelligence (pp. 25–38). Barcelona,Spain: Artificial Intelligence Research Institute. http://www.iiia.csic.es/library.
Sholz, H. (1961). Abriss der Geschichte der Logik (Concise History of Logic), translated by KurtF. Leidecker. Philosophical Library, New York (Original work published 1931).
Venn, J. (1880). On the diagrammatic and mechanical representations of propositions andreasonings. The London, Edinburgh, and Dublin Philosophical Magazine and Journal ofScience, 9(59), 1–18.
Venn, J. (1881). Symbolic logic. London: Macmillan and Co. Forgotten Books 2012 reprint.
Related Documents


