Origins and Evolution of the Etruscans’ mtDNA Silvia Ghirotto 1 , Francesca Tassi 1 , Erica Fumagalli 1,2¤a , Vincenza Colonna 1,3 , Anna Sandionigi 4 , Martina Lari 4 , Stefania Vai 4 , Emmanuele Petiti 4 , Giorgio Corti 5¤b , Ermanno Rizzi 5 , Gianluca De Bellis 5 , David Caramelli 4 , Guido Barbujani 1 * 1 Department of Biology and Evolution, University of Ferrara, Ferrara, Italy, 2 Department of Biotechnologies and Biosciences, University of Milano-Bicocca, Milan, Italy, 3 Institute of Genetics e Biophysics ‘‘Adriano Buzzati-Traverso’’, National Research Council, Naples, Italy, 4 Department of Evolutionary Biology, University of Florence, Florence, Italy, 5 Institute for Biomedical Technologies, National Research Council, Segrate, Milan, Italy Abstract The Etruscan culture is documented in Etruria, Central Italy, from the 8 th to the 1 st century BC. For more than 2,000 years there has been disagreement on the Etruscans’ biological origins, whether local or in Anatolia. Genetic affinities with both Tuscan and Anatolian populations have been reported, but so far all attempts have failed to fit the Etruscans’ and modern populations in the same genealogy. We extracted and typed the hypervariable region of mitochondrial DNA of 14 individuals buried in two Etruscan necropoleis, analyzing them along with other Etruscan and Medieval samples, and 4,910 contemporary individuals from the Mediterranean basin. Comparing ancient (30 Etruscans, 27 Medieval individuals) and modern DNA sequences (370 Tuscans), with the results of millions of computer simulations, we show that the Etruscans can be considered ancestral, with a high degree of confidence, to the current inhabitants of Casentino and Volterra, but not to the general contemporary population of the former Etruscan homeland. By further considering two Anatolian samples (35 and 123 individuals) we could estimate that the genetic links between Tuscany and Anatolia date back to at least 5,000 years ago, strongly suggesting that the Etruscan culture developed locally, and not as an immediate consequence of immigration from the Eastern Mediterranean shores. Citation: Ghirotto S, Tassi F, Fumagalli E, Colonna V, Sandionigi A, et al. (2013) Origins and Evolution of the Etruscans’ mtDNA. PLoS ONE 8(2): e55519. doi:10.1371/journal.pone.0055519 Editor: John Hawks, University of Wisconsin, United States of America Received July 20, 2012; Accepted December 24, 2012; Published February 6, 2013 Copyright: ß 2013 Ghirotto et al. This is an open-access article distributed under the terms of the Creative Commons Attribution License, which permits unrestricted use, distribution, and reproduction in any medium, provided the original author and source are credited. Funding: Study supported by the Italian Ministry for Universities Funds PRIN 2008 to GB and DC and FIRB 2008 (RBFR08U07M) to ER, DC and GB, by the ‘‘Futuro in ricerca’’ grant RBFR08U07M to ML, ER, GC, GD and DC, by the Fondazione Cassa di Risparmio di Ferrara and by Associazione Archeologica Odysseus Casale di Pari. The funders had no role in study design, data collection and analysis, decision to publish, or preparation of the manuscript. Competing Interests: The authors have declared that no competing interests exist. * E-mail: [email protected] ¤a Current address: Department of Ecology and Evolution, University of Lausanne, Lausanne, Switzerland ¤b Current address: Institute for Cancer Research and Treatment, Candiolo (Turin), Italy Introduction The Etruscan culture is documented in Central Italy (current Tuscany and Northern Latium, formerly known as Etruria) between the 8 th and the 1 st century BC. Questions about the Etruscans’ origins and fate have been around for millennia. Herodotus and Livy regarded them as immigrants, respectively from Lydia, i.e. Western Anatolia, or from North of the Alps, whereas for Dionysius of Halicarnassus they were an autochtho- nous population [1]. Previous DNA studies, far from settling the issue, have raised further questions. The Etruscans’ mitochondrial DNAs (mtDNAs) appear similar, but seldom identical, to those currently observed in Tuscany [2,3]. Assuming reasonable effects of genetic drift and mutation, these levels of resemblance proved incompatible with the notion that modern Tuscans are descended from Etruscan ancestors [4,5]. Explanations for this result include the (extreme) possibility that the Etruscans became extinct, but also that their modern descendants are few and geographically dispersed, or that the ancient sample studied represents a small social elite rather than the entire population [4]. As for the Etruscans’ origins, ancient DNA is of little use, because pre- Etruscan dwellers of Central Italy, of the Villanovan culture, cremated their dead [1], and hence their genetic features are unknown. DNAs from modern humans and cattle in Tuscany show affinities with Near Eastern DNAs, which was interpreted as supporting Herodotus’ narrative [2,6], but in these studies modern Tuscans were assumed to be descended from Etruscan ancestors, in contrast with ancient DNA evidence [5]. The claim that systematic errors in the Etruscan DNA sequences led to flawed genealogical inference [2,7] is not supported by careful reanalysis of the data [8]. What previous studies overlooked is the potential genetic effect of population subdivision. If most Etruscans’ descendants lived in isolated communities in the last 2,000 years, their DNAs may still persist in some localities, but will escape detection unless they are sought at the appropriate (i.e., smaller) geographical scale. Indeed, previous work in another area of Italy [9] showed that modern populations separated by only tens of kilometers can differ sharply in their genealogical relationships with ancient populations. To investigate in greater geographical detail the biological relation- ships between contemporary and ancient populations, we thus sampled multiple burials in classical Etruria. MtDNA was extracted from bones, amplified and sequenced by a combination of classical methods and Next Generation Sequencing. After adding these sequences to the other Etruscan sequences produced in our lab [3] we compared them through methods of PLOS ONE | www.plosone.org 1 February 2013 | Volume 8 | Issue 2 | e55519

Welcome message from author
This document is posted to help you gain knowledge. Please leave a comment to let me know what you think about it! Share it to your friends and learn new things together.
Transcript

Origins and Evolution of the Etruscans’ mtDNASilvia Ghirotto1, Francesca Tassi1, Erica Fumagalli1,2¤a, Vincenza Colonna1,3, Anna Sandionigi4,
Martina Lari4, Stefania Vai4, Emmanuele Petiti4, Giorgio Corti5¤b, Ermanno Rizzi5, Gianluca De Bellis5,
David Caramelli4, Guido Barbujani1*
1Department of Biology and Evolution, University of Ferrara, Ferrara, Italy, 2Department of Biotechnologies and Biosciences, University of Milano-Bicocca, Milan, Italy,
3 Institute of Genetics e Biophysics ‘‘Adriano Buzzati-Traverso’’, National Research Council, Naples, Italy, 4Department of Evolutionary Biology, University of Florence,
Florence, Italy, 5 Institute for Biomedical Technologies, National Research Council, Segrate, Milan, Italy
Abstract
The Etruscan culture is documented in Etruria, Central Italy, from the 8th to the 1st century BC. For more than 2,000 yearsthere has been disagreement on the Etruscans’ biological origins, whether local or in Anatolia. Genetic affinities with bothTuscan and Anatolian populations have been reported, but so far all attempts have failed to fit the Etruscans’ and modernpopulations in the same genealogy. We extracted and typed the hypervariable region of mitochondrial DNA of 14individuals buried in two Etruscan necropoleis, analyzing them along with other Etruscan and Medieval samples, and 4,910contemporary individuals from the Mediterranean basin. Comparing ancient (30 Etruscans, 27 Medieval individuals) andmodern DNA sequences (370 Tuscans), with the results of millions of computer simulations, we show that the Etruscans canbe considered ancestral, with a high degree of confidence, to the current inhabitants of Casentino and Volterra, but not tothe general contemporary population of the former Etruscan homeland. By further considering two Anatolian samples (35and 123 individuals) we could estimate that the genetic links between Tuscany and Anatolia date back to at least 5,000years ago, strongly suggesting that the Etruscan culture developed locally, and not as an immediate consequence ofimmigration from the Eastern Mediterranean shores.
Citation: Ghirotto S, Tassi F, Fumagalli E, Colonna V, Sandionigi A, et al. (2013) Origins and Evolution of the Etruscans’ mtDNA. PLoS ONE 8(2): e55519.doi:10.1371/journal.pone.0055519
Editor: John Hawks, University of Wisconsin, United States of America
Received July 20, 2012; Accepted December 24, 2012; Published February 6, 2013
Copyright: � 2013 Ghirotto et al. This is an open-access article distributed under the terms of the Creative Commons Attribution License, which permitsunrestricted use, distribution, and reproduction in any medium, provided the original author and source are credited.
Funding: Study supported by the Italian Ministry for Universities Funds PRIN 2008 to GB and DC and FIRB 2008 (RBFR08U07M) to ER, DC and GB, by the ‘‘Futuroin ricerca’’ grant RBFR08U07M to ML, ER, GC, GD and DC, by the Fondazione Cassa di Risparmio di Ferrara and by Associazione Archeologica Odysseus Casale diPari. The funders had no role in study design, data collection and analysis, decision to publish, or preparation of the manuscript.
Competing Interests: The authors have declared that no competing interests exist.
* E-mail: [email protected]
¤a Current address: Department of Ecology and Evolution, University of Lausanne, Lausanne, Switzerland¤b Current address: Institute for Cancer Research and Treatment, Candiolo (Turin), Italy
Introduction
The Etruscan culture is documented in Central Italy (current
Tuscany and Northern Latium, formerly known as Etruria)
between the 8th and the 1st century BC. Questions about the
Etruscans’ origins and fate have been around for millennia.
Herodotus and Livy regarded them as immigrants, respectively
from Lydia, i.e. Western Anatolia, or from North of the Alps,
whereas for Dionysius of Halicarnassus they were an autochtho-
nous population [1]. Previous DNA studies, far from settling the
issue, have raised further questions. The Etruscans’ mitochondrial
DNAs (mtDNAs) appear similar, but seldom identical, to those
currently observed in Tuscany [2,3]. Assuming reasonable effects
of genetic drift and mutation, these levels of resemblance proved
incompatible with the notion that modern Tuscans are descended
from Etruscan ancestors [4,5]. Explanations for this result include
the (extreme) possibility that the Etruscans became extinct, but
also that their modern descendants are few and geographically
dispersed, or that the ancient sample studied represents a small
social elite rather than the entire population [4]. As for the
Etruscans’ origins, ancient DNA is of little use, because pre-
Etruscan dwellers of Central Italy, of the Villanovan culture,
cremated their dead [1], and hence their genetic features are
unknown. DNAs from modern humans and cattle in Tuscany
show affinities with Near Eastern DNAs, which was interpreted as
supporting Herodotus’ narrative [2,6], but in these studies modern
Tuscans were assumed to be descended from Etruscan ancestors,
in contrast with ancient DNA evidence [5]. The claim that
systematic errors in the Etruscan DNA sequences led to flawed
genealogical inference [2,7] is not supported by careful reanalysis
of the data [8].
What previous studies overlooked is the potential genetic effect
of population subdivision. If most Etruscans’ descendants lived in
isolated communities in the last 2,000 years, their DNAs may still
persist in some localities, but will escape detection unless they are
sought at the appropriate (i.e., smaller) geographical scale. Indeed,
previous work in another area of Italy [9] showed that modern
populations separated by only tens of kilometers can differ sharply
in their genealogical relationships with ancient populations. To
investigate in greater geographical detail the biological relation-
ships between contemporary and ancient populations, we thus
sampled multiple burials in classical Etruria. MtDNA was
extracted from bones, amplified and sequenced by a combination
of classical methods and Next Generation Sequencing. After
adding these sequences to the other Etruscan sequences produced
in our lab [3] we compared them through methods of
PLOS ONE | www.plosone.org 1 February 2013 | Volume 8 | Issue 2 | e55519

Approximate Bayesian Computation with those of relevant
ancient and modern human populations. These include Medieval
Tuscans (n = 27) [5], contemporary Tuscans from three sites in
historical Etruria (Casentino, n= 122; Murlo, n= 86; Volterra,
n = 114) [2] and from Florence [10] (n = 48) (Figure 1). The
sample from Florence here represents a control, since no special
relationships is expected between the DNAs of the Etruscans and
those of the inhabitants of a large city, after millennia of
immigration.
We thus tried to address two questions, namely (1) whether an
analysis at the small geographical scale can provide evidence of
a genealogical continuity between the Etruscans and some current
inhabitants of historical Etruria, and (2) whether the observed
degree of genetic resemblance between modern inhabitants of
Tuscany and Western Anatolia has anything to do with the
Etruscans’ origins. To answer, for each modern population we
designed and compared three demographic models differing for
the genealogical relationships with the ancient samples (see
Material and Methods for details). We identified the model best
fitting each set of the observed data, and then we moved to
estimating, under an isolation-with-migration (IM) framework, the
separation time between Tuscan and Anatolian populations [11],
evaluating whether the estimated time can be reconciled with an
Etruscan origin in Anatolia and a subsequent migration in Italy
around the 8th century BC.
Results
Ancient DNA SequencesWe could obtain amplifiable DNA from 14 Etruscan specimens.
Four of them, from Tarquinia, were analyzed in 2004 but were
still unpublished. Ten samples come from 18 initial bone samples
(each represented by two fragments of the right tibia) from a 3rd
century BC multiple burial in Casenovole, Southern Tuscany. The
bones were freshly excavated and collected according to the most
stringent ancient DNA criteria (see Materials and Methods) by one
of us (EP); they can safely be regarded as belonging to different
individuals. After a first round of DNA extraction, the 18
Casenovole samples were subjected to multiple PCRs, cloning
and cycle sequencing. In ten of them we could determine the
sequence of the complete mtDNAhypervariable region I (hereaf-
ter: HVR-I), whereas the remaining eight gave no results (Figure
S1). Their final consensus sequences (Table S1) were determined
by comparing results obtained using the standard procedures (575
clones overall) and Next Generation Sequencing (127,837 reads)
(Figure S2). We added to these the sequences of four individuals
from Tarquinia, (GenBank accession numbers: bankit1285669
GU186064; bankit1285680 GU186065; bankit1285699
GU186066; bankit1285702 GU186067).
The Etruscans in the Context of Modern and AncientGenetic DiversityWe analyzed four non-overlapping datasets (Table 1). The ETR
dataset comprises the 14 newly produced DNA sequences, along
with 16 already available sequences from necropoleis in historic
Etruria [3]; individuals from geographically distant Etruscan
populations, Adria and Capua, were excluded. The TUS dataset
comprises four modern Tuscan populations, i.e. Casentino, Murlo,
Volterra and Florence; the last mentioned is a forensic sample,
representing random members of a large city, to the exclusion of
recent immigrants (Figure 1). In addition, this dataset includes
a sample of Medieval Tuscans from Guimaraes et al. [5]. Finally,
the ANC dataset and the EUR dataset include, respectively, data
on ancient and modern populations from Europe and from the
Near East.
In Table 2 we show several statistics summarizing genetic
variation in the ETR and TUS datasets. Estimates of the internal
genetic diversity of the Etruscans, as expressed by their mean
pairwise difference (2.96661.560) and by haplotype diversity
(0.94360.032), appear close to those obtained in Vernesi et al. [3]
using a partly different dataset. We also calculated two measures of
genetic distance between the Etruscans (ETR) and modern
populations (EUR), namely Wright’s pairwise Fst and allele
sharing, the latter measured as the fraction of modern sequences
Figure 1. Geographic location of the samples considered in the ABC analysis. Triangles, Contemporary Tuscans (n = 370); Circles, MedievalTuscans: 1. Massa Carrara (n = 3); 2. Florence, (n = 10); 3. Pisa, (n = 6); 4. Livorno, (n = 3); 5. Siena, (n = 4); 6. Grosseto (n = 1); Squares, Etruscans: 1.Castelfranco di Sotto (n = 1); 2. Volterra (n = 3); 3. Casenovole (n = 10); 4. Castelluccio di Pienza (n = 1); 5. Magliano/Marsiliana (n = 6); 6. Tarquinia(n = 9).doi:10.1371/journal.pone.0055519.g001
Origins and Evolution of the Etruscans’ mtDNA
PLOS ONE | www.plosone.org 2 February 2013 | Volume 8 | Issue 2 | e55519
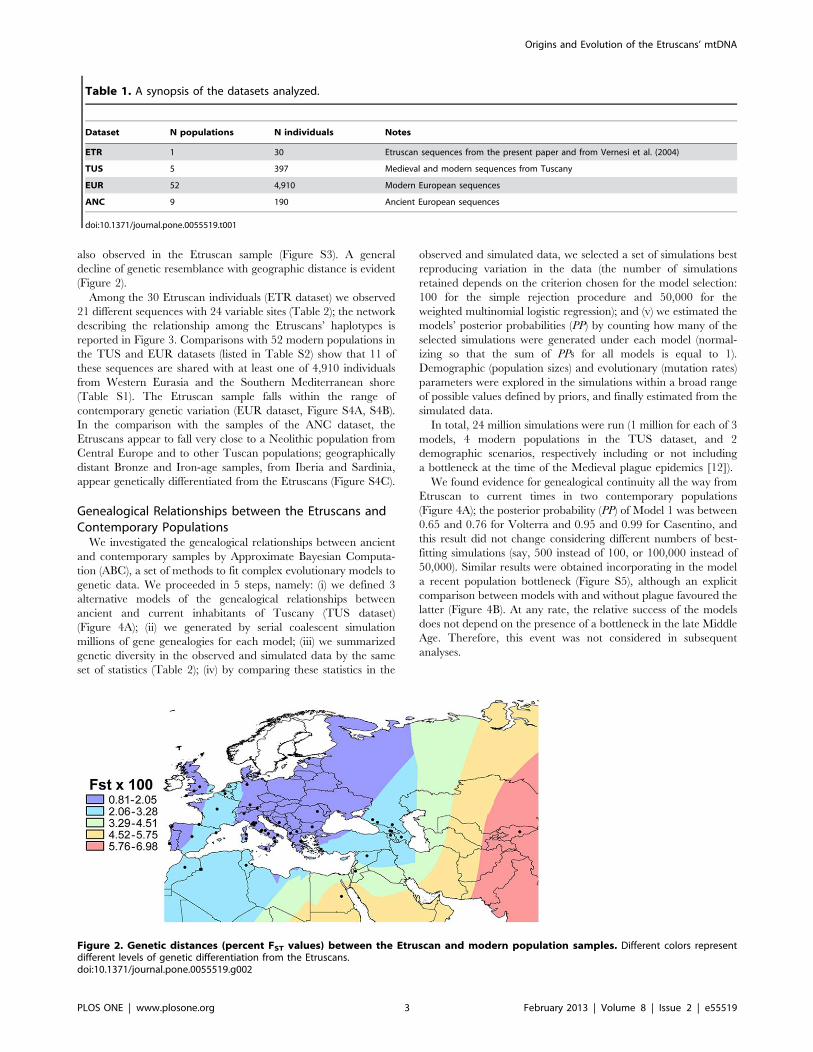
also observed in the Etruscan sample (Figure S3). A general
decline of genetic resemblance with geographic distance is evident
(Figure 2).
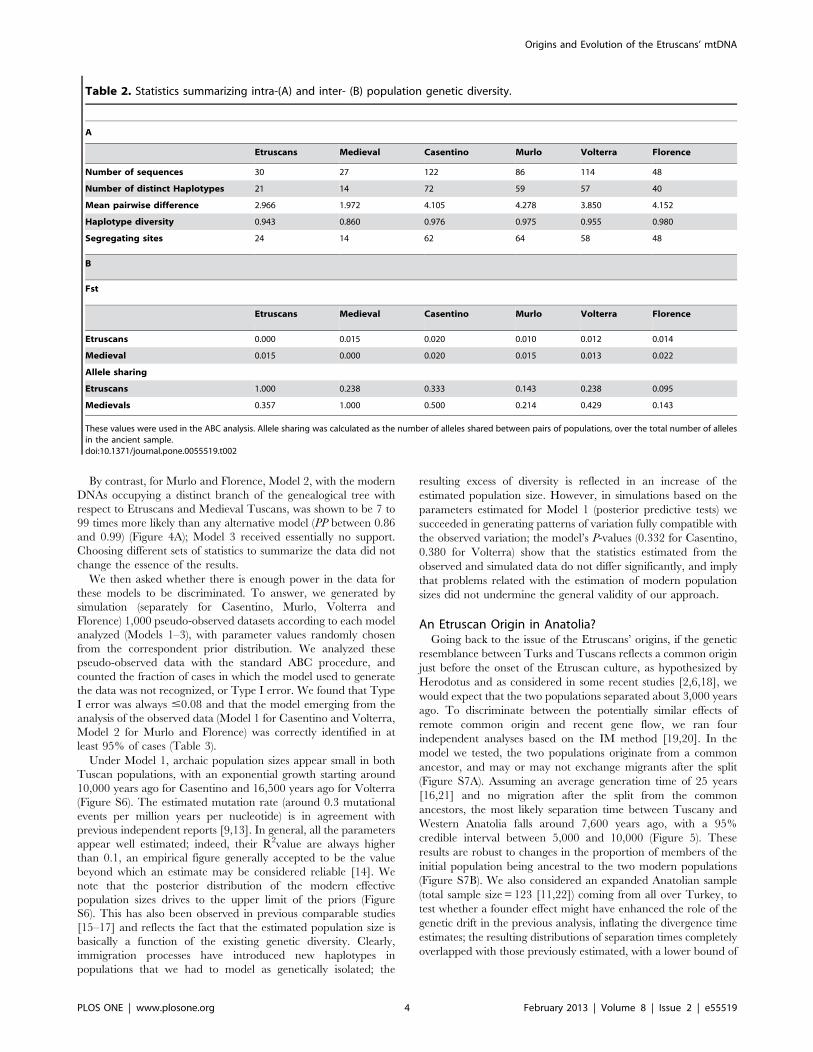
Among the 30 Etruscan individuals (ETR dataset) we observed
21 different sequences with 24 variable sites (Table 2); the network
describing the relationship among the Etruscans’ haplotypes is
reported in Figure 3. Comparisons with 52 modern populations in
the TUS and EUR datasets (listed in Table S2) show that 11 of
these sequences are shared with at least one of 4,910 individuals
from Western Eurasia and the Southern Mediterranean shore
(Table S1). The Etruscan sample falls within the range of
contemporary genetic variation (EUR dataset, Figure S4A, S4B).
In the comparison with the samples of the ANC dataset, the
Etruscans appear to fall very close to a Neolithic population from
Central Europe and to other Tuscan populations; geographically
distant Bronze and Iron-age samples, from Iberia and Sardinia,
appear genetically differentiated from the Etruscans (Figure S4C).
Genealogical Relationships between the Etruscans andContemporary PopulationsWe investigated the genealogical relationships between ancient
and contemporary samples by Approximate Bayesian Computa-
tion (ABC), a set of methods to fit complex evolutionary models to
genetic data. We proceeded in 5 steps, namely: (i) we defined 3
alternative models of the genealogical relationships between
ancient and current inhabitants of Tuscany (TUS dataset)
(Figure 4A); (ii) we generated by serial coalescent simulation
millions of gene genealogies for each model; (iii) we summarized
genetic diversity in the observed and simulated data by the same
set of statistics (Table 2); (iv) by comparing these statistics in the
observed and simulated data, we selected a set of simulations best
reproducing variation in the data (the number of simulations
retained depends on the criterion chosen for the model selection:
100 for the simple rejection procedure and 50,000 for the
weighted multinomial logistic regression); and (v) we estimated the
models’ posterior probabilities (PP) by counting how many of the
selected simulations were generated under each model (normal-
izing so that the sum of PPs for all models is equal to 1).
Demographic (population sizes) and evolutionary (mutation rates)
parameters were explored in the simulations within a broad range
of possible values defined by priors, and finally estimated from the
simulated data.
In total, 24 million simulations were run (1 million for each of 3
models, 4 modern populations in the TUS dataset, and 2
demographic scenarios, respectively including or not including
a bottleneck at the time of the Medieval plague epidemics [12]).
We found evidence for genealogical continuity all the way from
Etruscan to current times in two contemporary populations
(Figure 4A); the posterior probability (PP) of Model 1 was between
0.65 and 0.76 for Volterra and 0.95 and 0.99 for Casentino, and
this result did not change considering different numbers of best-
fitting simulations (say, 500 instead of 100, or 100,000 instead of
50,000). Similar results were obtained incorporating in the model
a recent population bottleneck (Figure S5), although an explicit
comparison between models with and without plague favoured the
latter (Figure 4B). At any rate, the relative success of the models
does not depend on the presence of a bottleneck in the late Middle
Age. Therefore, this event was not considered in subsequent
analyses.
Table 1. A synopsis of the datasets analyzed.
Dataset N populations N individuals Notes
ETR 1 30 Etruscan sequences from the present paper and from Vernesi et al. (2004)
TUS 5 397 Medieval and modern sequences from Tuscany
EUR 52 4,910 Modern European sequences
ANC 9 190 Ancient European sequences
doi:10.1371/journal.pone.0055519.t001
Figure 2. Genetic distances (percent FST values) between the Etruscan and modern population samples. Different colors representdifferent levels of genetic differentiation from the Etruscans.doi:10.1371/journal.pone.0055519.g002
Origins and Evolution of the Etruscans’ mtDNA
PLOS ONE | www.plosone.org 3 February 2013 | Volume 8 | Issue 2 | e55519
By contrast, for Murlo and Florence, Model 2, with the modern
DNAs occupying a distinct branch of the genealogical tree with
respect to Etruscans and Medieval Tuscans, was shown to be 7 to
99 times more likely than any alternative model (PP between 0.86
and 0.99) (Figure 4A); Model 3 received essentially no support.
Choosing different sets of statistics to summarize the data did not
change the essence of the results.
We then asked whether there is enough power in the data for
these models to be discriminated. To answer, we generated by
simulation (separately for Casentino, Murlo, Volterra and
Florence) 1,000 pseudo-observed datasets according to each model
analyzed (Models 1–3), with parameter values randomly chosen
from the correspondent prior distribution. We analyzed these
pseudo-observed data with the standard ABC procedure, and
counted the fraction of cases in which the model used to generate
the data was not recognized, or Type I error. We found that Type
I error was always #0.08 and that the model emerging from the
analysis of the observed data (Model 1 for Casentino and Volterra,
Model 2 for Murlo and Florence) was correctly identified in at
least 95% of cases (Table 3).
Under Model 1, archaic population sizes appear small in both
Tuscan populations, with an exponential growth starting around
10,000 years ago for Casentino and 16,500 years ago for Volterra
(Figure S6). The estimated mutation rate (around 0.3 mutational
events per million years per nucleotide) is in agreement with
previous independent reports [9,13]. In general, all the parameters
appear well estimated; indeed, their R2value are always higher
than 0.1, an empirical figure generally accepted to be the value
beyond which an estimate may be considered reliable [14]. We
note that the posterior distribution of the modern effective
population sizes drives to the upper limit of the priors (Figure
S6). This has also been observed in previous comparable studies
[15–17] and reflects the fact that the estimated population size is
basically a function of the existing genetic diversity. Clearly,
immigration processes have introduced new haplotypes in
populations that we had to model as genetically isolated; the
resulting excess of diversity is reflected in an increase of the
estimated population size. However, in simulations based on the
parameters estimated for Model 1 (posterior predictive tests) we
succeeded in generating patterns of variation fully compatible with
the observed variation; the model’s P-values (0.332 for Casentino,
0.380 for Volterra) show that the statistics estimated from the
observed and simulated data do not differ significantly, and imply
that problems related with the estimation of modern population
sizes did not undermine the general validity of our approach.
An Etruscan Origin in Anatolia?Going back to the issue of the Etruscans’ origins, if the genetic
resemblance between Turks and Tuscans reflects a common origin
just before the onset of the Etruscan culture, as hypothesized by
Herodotus and as considered in some recent studies [2,6,18], we
would expect that the two populations separated about 3,000 years
ago. To discriminate between the potentially similar effects of
remote common origin and recent gene flow, we ran four
independent analyses based on the IM method [19,20]. In the
model we tested, the two populations originate from a common
ancestor, and may or may not exchange migrants after the split
(Figure S7A). Assuming an average generation time of 25 years
[16,21] and no migration after the split from the common
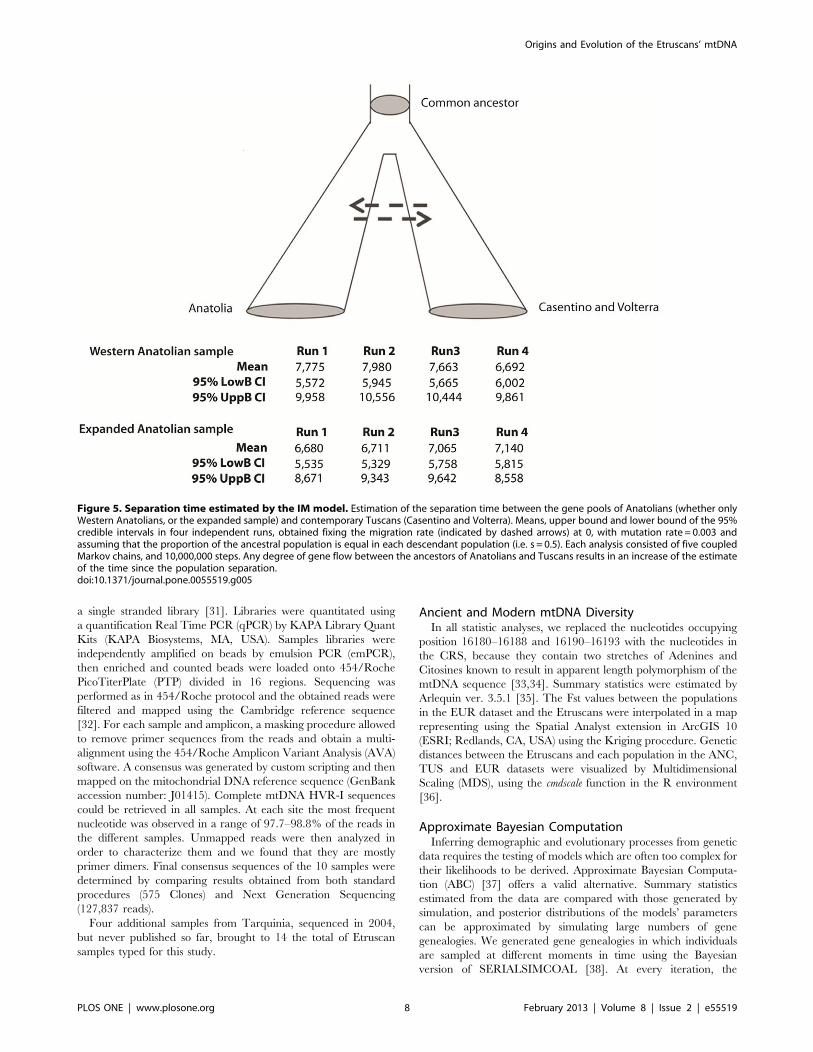
ancestors, the most likely separation time between Tuscany and
Western Anatolia falls around 7,600 years ago, with a 95%
credible interval between 5,000 and 10,000 (Figure 5). These
results are robust to changes in the proportion of members of the
initial population being ancestral to the two modern populations
(Figure S7B). We also considered an expanded Anatolian sample
(total sample size = 123 [11,22]) coming from all over Turkey, to
test whether a founder effect might have enhanced the role of the
genetic drift in the previous analysis, inflating the divergence time
estimates; the resulting distributions of separation times completely
overlapped with those previously estimated, with a lower bound of
Table 2. Statistics summarizing intra-(A) and inter- (B) population genetic diversity.
A
Etruscans Medieval Casentino Murlo Volterra Florence
Number of sequences 30 27 122 86 114 48
Number of distinct Haplotypes 21 14 72 59 57 40
Mean pairwise difference 2.966 1.972 4.105 4.278 3.850 4.152
Haplotype diversity 0.943 0.860 0.976 0.975 0.955 0.980
Segregating sites 24 14 62 64 58 48
B
Fst
Etruscans Medieval Casentino Murlo Volterra Florence
Etruscans 0.000 0.015 0.020 0.010 0.012 0.014
Medieval 0.015 0.000 0.020 0.015 0.013 0.022
Allele sharing
Etruscans 1.000 0.238 0.333 0.143 0.238 0.095
Medievals 0.357 1.000 0.500 0.214 0.429 0.143
These values were used in the ABC analysis. Allele sharing was calculated as the number of alleles shared between pairs of populations, over the total number of allelesin the ancient sample.doi:10.1371/journal.pone.0055519.t002
Origins and Evolution of the Etruscans’ mtDNA
PLOS ONE | www.plosone.org 4 February 2013 | Volume 8 | Issue 2 | e55519
the 95% credible interval never smaller than 5,300 years ago
(Figure 5).
For these tests we chose the mutation rate (m) estimated from the
data in the previous ABC analyses (very close to the figure
accounting for the time-dependency of the mitochondrial molec-
ular clock [13], m=0.003). Tests were also run using the value
incorporating a correction for the effects of purifying selection [23]
(m=0.0014), always finding that it results in a further increase of
the estimated separation times (Figure S7B). Only assuming very
high mutation rates, at least twice as large as estimated in Henn
et al. [13], was it possible to obtain separation times ,5,000 years
(Figure S7B). With both Anatolian samples, any degree of gene
flow after separation between the ancestors of Tuscans and
Anatolians resulted in more remote separation times.
Discussion
MtDNA data give much stronger support to a model of genetic
continuity between the Etruscans and some Tuscans than to any
other model tested, characterized by plausible population sizes and
mutation rates. However, this clear picture emerges only when
modern Tuscan communities are separately considered, highlight-
ing the importance of population structure even at the small
geographical scale. In a previous analysis of smaller samples we
found no evidence of genealogical continuity since Etruscan times
[5]. In this study, the larger sample sizes allowed us to separately
investigate the relationships of each modern population with the
Etruscans. A model of genealogical continuity across 2,500 years
thus proved to best fit the observed data for Volterra, and
especially Casentino, but not for another community dwelling in
an area also rich with Etruscan archaeological remains (Murlo),
nor (as expected) for the bulk of the current Tuscan population,
here represented by a forensic sample of the inhabitants of
Florence. Therefore, the present analysis indicates that the
Etruscan genetic heritage is still present, but only in some isolates,
whereas current Tuscans are not generally descended from
Etruscan ancestors along the female lines. It also shows that there
is no necessary correlation between the presence of archaeological
remains and the biological roots of the inhabitants of the areas
where these remains occur. Because Medieval Tuscans appears
directly descended from Etruscan ancestors, one can reasonably
speculate that the genetic build-up of the Murlo and Florence
populations was modified by immigration in the last five centuries.
As for the second question, the IM analysis shows that indeed
there might have been a genealogical link between modern
Tuscans and the inhabitants of what Herodotus considered the
Etruscans’ homeland, Western Anatolia. However, even under the
Figure 3. Median-joining network of the Etruscans’ haplotypes. The width of the circles is proportional to the frequency of that haplotype inthe Etruscan sample; the labels on the edges of the network indicate the position of the nucleotide substitution in the mtDNA reference sequence.The colour of each haplotype represents whether that sequence is also present in five modern populations from Tuscany and Anatolia.doi:10.1371/journal.pone.0055519.g003
Origins and Evolution of the Etruscans’ mtDNA
PLOS ONE | www.plosone.org 5 February 2013 | Volume 8 | Issue 2 | e55519

unrealistic assumption of complete reciprocal isolation for
millennia, the likely separation of the Tuscan and Anatolian gene
pools must be placed long before the onset of the Etruscan culture,
at least in Neolithic times; if isolation was incomplete, the
estimated separation must be placed further back in time.
Consistent with this view is the observation that Etruscan and
Figure 4. Alternative models of the genealogical relationships among past and present populations, and their posteriorprobabilities. Shaded areas represent the modern population (at 0 years ago on the Y axis), the Medieval population (900 years ago) and theEtruscans (at 2,500 years ago). Model 1 assumes genealogical continuity between ancient and modern samples, Model 2 assumes continuity onlybetween Etruscan and Medieval individuals, and in Model 3 the Etruscan lineage separates from the lineage leading to Medieval and Modern Tuscans.Under each model is the proportion of the best-fitting simulations supporting it, for the four modern populations considered, using the acceptancerejection (AR) and logistic regression (LR) methods [43]. (A) Comparison among Models 1–3 for four modern Tuscan populations. (B) Comparison ofthe fit of Model 1, with and without a bottleneck corresponding to the Plague epidemics at 625 BP [12].doi:10.1371/journal.pone.0055519.g004
Origins and Evolution of the Etruscans’ mtDNA
PLOS ONE | www.plosone.org 6 February 2013 | Volume 8 | Issue 2 | e55519
Neolithic mtDNAs are close to each other in the two-dimensional
plot of Figure S4C; however, a formal test would be necessary to
draw firm conclusions from the simple observation of a genetic
similarity. Separation times were very close when estimated both
using a sample from Western Anatolia, and an expanded sample
including individuals from much of Anatolia, and so the choice of
the Anatolian population does not seem to affect the results of this
analysis.
A general problem in ancient human DNA studies is the quality
of the data; errors resulting from contamination, or from poor
preservation of DNA in the specimens, are common. However,
there are several reasons to be confident that the Etruscan
sequences obtained in this study are authentic: (i) bones were
recovered from burials according to the most stringent existing
procedures and sent directly to the ancient DNA laboratory
without manipulations; (ii) the mtDNA HVR-I motifs of the
people who came in contact with the bones at any stage of the
analysis do not match those obtained from the ancient samples
(Table S1); (iii) the ancient samples were typed following the most
stringent standard criteria for ancient DNA authentication; (iv) we
used two different sequence determination procedures (classical
methodology and high throughput methodology) and the results
obtained from different extractions and different sequencing
methodologies are concordant except in the regions of homopol-
ymeric strings $5 bp that are problematic for the 454 pyrose-
quencing technology; in these cases, consensus sequences were
determined considering only the results of the standard sequencing
procedure; (v) sequences make phylogenetic sense, i.e. do not
appear to be combinations of different sequences, possibly
suggesting contamination by exogenous DNA.
Using such ancient DNA data for testing complex evolutionary
models has become possible with the development of ABC and
other recent Bayesian inference methods [24,25]. These models,
albeit more articulate than those that can be tested otherwise, are
still a necessarily schematic representation of the processes
affecting populations in the course of millennia. Many phenomena
that could not be incorporated in the models, such as immigration
from other sources or additional demographic fluctuations, most
likely occurred and left a mark in the patterns of genetic diversity.
In addition, specific phenomena may have involved mostly or
exclusively males, resulting in genetic changes that are not
recorded in mtDNA variation. Still, if we rule out the unlikely
hypothesis that the Etruscans’ and their descendants’ population
history was radically different for males and females, the picture
emerging from this study is rather clear. The additional tests we
ran (Type I error, Table 3) show that, at these sample sizes, we had
a high probability to identify the correct evolutionary model.
As also suggested by the analysis of skull diversity [26], contacts
between people from the Eastern Mediterranean shores and
Central Italy likely date back to a remote stage of prehistory,
possibly to the spread of farmers from the Near East during the
Neolithic period [27,28], but not necessarily so (we only estimated
a minimum separation time between gene pools). At any rate,
these contacts occurred much earlier than, and hence appear
unrelated with, the onset of the Etruscan culture (Figure 5). We
conclude that no available genetic evidence suggests an Etruscan
origin outside Italy. While their culture disappeared from the
records, the Etruscans’ mtDNAs did not; traces of this heritage are
still recognizable. However, most current inhabitants of the
ancient Etruscan homeland appear descended from different
ancestors along the female lines, as clearly shown by the analysis of
the urban (Florence) sample. Genetic continuity since the
Etruscan’s time is still evident only in relatively isolated localities,
such as Casentino and Volterra.
Materials and Methods
DNA Extraction and Characterization of the EtruscanSamplesWe obtained 18 bone samples (each represented by two
fragments of the right tibia) from a multiple burial from
Casenovole, Southern Tuscany, near Grosseto. Their approximate
age, based on archaeological evidence, is the 3rd century BC. The
permit to genetically characterize these fossil samples came from
Soprintendenza Archeologica per la Toscana (Archaeological
Authority for Tuscany), Siena. The bone fragments were freshly
excavated and collected according to the most stringent ancient
DNA criteria [29] by one of us (EP) and can safely be regarded as
belonging to different individuals (Minimum number of individ-
uals estimated in the burial = 21). These fragments were processed
in the ancient DNA facilities at the University of Florence using
standard ancient DNA procedures [30]. After a first round of
DNA extraction, the samples were subjected to multiple PCRs,
cloning and cycle sequencing.
In a successive step, DNA was independently reextracted from
the samples that had given positive results in the previous analysis.
In this case, after multiple PCRs, the amplicons were not cloned
but ligated to the appropriate adaptor sequences and directly
sequenced with 454/Roche technology. Low Molecular Weight
DNA (LMW DNA) 454/Roche protocol was applied and a final
procedure modification was added to increase the recovery of
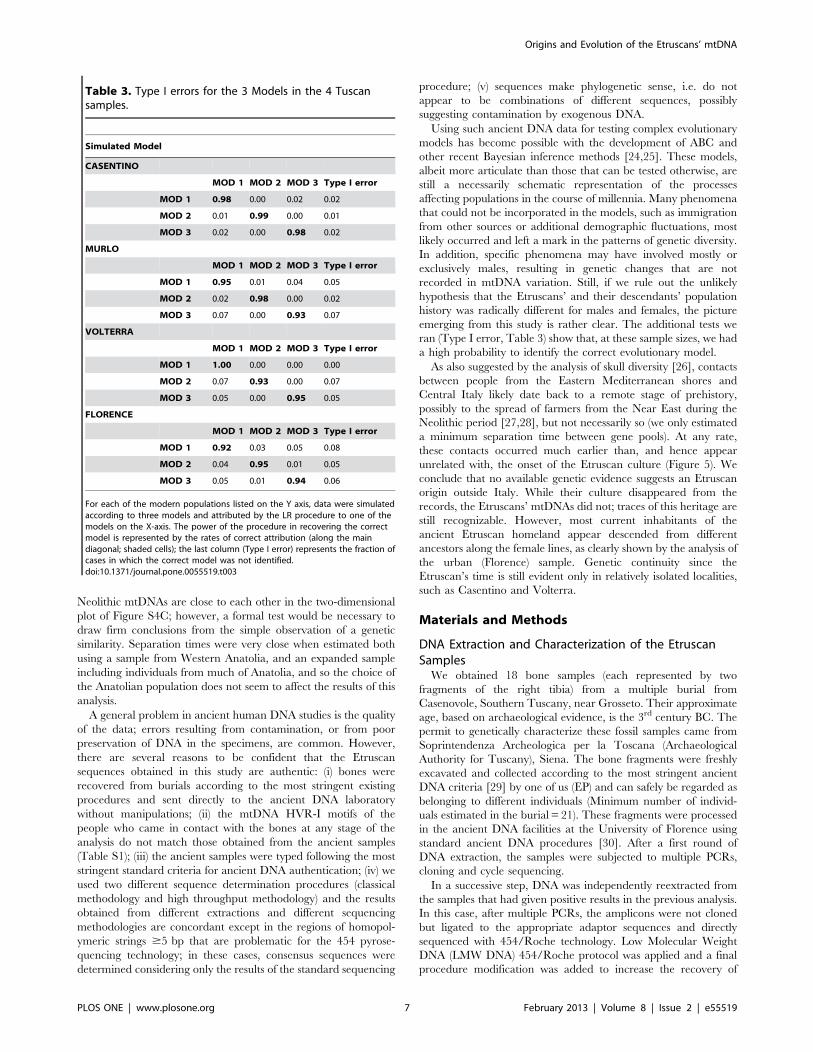
Table 3. Type I errors for the 3 Models in the 4 Tuscansamples.
Simulated Model
CASENTINO
MOD 1 MOD 2 MOD 3 Type I error
MOD 1 0.98 0.00 0.02 0.02
MOD 2 0.01 0.99 0.00 0.01
MOD 3 0.02 0.00 0.98 0.02
MURLO
MOD 1 MOD 2 MOD 3 Type I error
MOD 1 0.95 0.01 0.04 0.05
MOD 2 0.02 0.98 0.00 0.02
MOD 3 0.07 0.00 0.93 0.07
VOLTERRA
MOD 1 MOD 2 MOD 3 Type I error
MOD 1 1.00 0.00 0.00 0.00
MOD 2 0.07 0.93 0.00 0.07
MOD 3 0.05 0.00 0.95 0.05
FLORENCE
MOD 1 MOD 2 MOD 3 Type I error
MOD 1 0.92 0.03 0.05 0.08
MOD 2 0.04 0.95 0.01 0.05
MOD 3 0.05 0.01 0.94 0.06
For each of the modern populations listed on the Y axis, data were simulatedaccording to three models and attributed by the LR procedure to one of themodels on the X-axis. The power of the procedure in recovering the correctmodel is represented by the rates of correct attribution (along the maindiagonal; shaded cells); the last column (Type I error) represents the fraction ofcases in which the correct model was not identified.doi:10.1371/journal.pone.0055519.t003
Origins and Evolution of the Etruscans’ mtDNA
PLOS ONE | www.plosone.org 7 February 2013 | Volume 8 | Issue 2 | e55519
a single stranded library [31]. Libraries were quantitated using
a quantification Real Time PCR (qPCR) by KAPA Library Quant
Kits (KAPA Biosystems, MA, USA). Samples libraries were
independently amplified on beads by emulsion PCR (emPCR),
then enriched and counted beads were loaded onto 454/Roche
PicoTiterPlate (PTP) divided in 16 regions. Sequencing was
performed as in 454/Roche protocol and the obtained reads were
filtered and mapped using the Cambridge reference sequence
[32]. For each sample and amplicon, a masking procedure allowed
to remove primer sequences from the reads and obtain a multi-
alignment using the 454/Roche Amplicon Variant Analysis (AVA)
software. A consensus was generated by custom scripting and then
mapped on the mitochondrial DNA reference sequence (GenBank
accession number: J01415). Complete mtDNA HVR-I sequences
could be retrieved in all samples. At each site the most frequent
nucleotide was observed in a range of 97.7–98.8% of the reads in
the different samples. Unmapped reads were then analyzed in
order to characterize them and we found that they are mostly
primer dimers. Final consensus sequences of the 10 samples were
determined by comparing results obtained from both standard
procedures (575 Clones) and Next Generation Sequencing
(127,837 reads).
Four additional samples from Tarquinia, sequenced in 2004,
but never published so far, brought to 14 the total of Etruscan
samples typed for this study.
Ancient and Modern mtDNA DiversityIn all statistic analyses, we replaced the nucleotides occupying
position 16180–16188 and 16190–16193 with the nucleotides in
the CRS, because they contain two stretches of Adenines and
Citosines known to result in apparent length polymorphism of the
mtDNA sequence [33,34]. Summary statistics were estimated by
Arlequin ver. 3.5.1 [35]. The Fst values between the populations
in the EUR dataset and the Etruscans were interpolated in a map
representing using the Spatial Analyst extension in ArcGIS 10
(ESRI; Redlands, CA, USA) using the Kriging procedure. Genetic
distances between the Etruscans and each population in the ANC,
TUS and EUR datasets were visualized by Multidimensional
Scaling (MDS), using the cmdscale function in the R environment
[36].
Approximate Bayesian ComputationInferring demographic and evolutionary processes from genetic
data requires the testing of models which are often too complex for
their likelihoods to be derived. Approximate Bayesian Computa-
tion (ABC) [37] offers a valid alternative. Summary statistics
estimated from the data are compared with those generated by
simulation, and posterior distributions of the models’ parameters
can be approximated by simulating large numbers of gene
genealogies. We generated gene genealogies in which individuals
are sampled at different moments in time using the Bayesian
version of SERIALSIMCOAL [38]. At every iteration, the
Figure 5. Separation time estimated by the IM model. Estimation of the separation time between the gene pools of Anatolians (whether onlyWestern Anatolians, or the expanded sample) and contemporary Tuscans (Casentino and Volterra). Means, upper bound and lower bound of the 95%credible intervals in four independent runs, obtained fixing the migration rate (indicated by dashed arrows) at 0, with mutation rate = 0.003 andassuming that the proportion of the ancestral population is equal in each descendant population (i.e. s = 0.5). Each analysis consisted of five coupledMarkov chains, and 10,000,000 steps. Any degree of gene flow between the ancestors of Anatolians and Tuscans results in an increase of the estimateof the time since the population separation.doi:10.1371/journal.pone.0055519.g005
Origins and Evolution of the Etruscans’ mtDNA
PLOS ONE | www.plosone.org 8 February 2013 | Volume 8 | Issue 2 | e55519
parameters of the model (population sizes, mutation rates, timing
of demographic processes) were considered as random variables,
and their values were extracted from broad prior distributions;
ages and sizes of the samples were equal to those of the observed
samples. We then calculated a Euclidean distance between
observed and simulated statistics, and we ordered the simulations
according to this distance. In total, 24 million simulations were run
(1 million for each of 3 models, 4 modern populations in the TUS
dataset and two demographic scenarios, respectively including or
not including a recent bottleneck). All the procedures were
developed in the R environment [36] using scripts from [39]. We
selected the summary statistics via PCA, keeping for the ABC
analysis those statistics which have shown to be more correlated
with the parameters’ variance (Table S2).
Demographic Models and PriorsThe three demographic models tested differ for the relationships
between modern and ancient samples (Figure 4); under each
model, each population in the TUS dataset was independently
compared with the Etruscan and Medieval populations. All prior
distributions were uniform and wide. The effective modern
population size ranged between 100 and 200,000; for the time
of the onset of the expansion (under Model 1) and the separation
time (under Models 2 and 3) the priors ranged from 101 (one
generation before the Etruscans) to 1,500 generations ago. Priors
for the mutation rate encompassed the low value estimated from
phylogenies [40], and the high value estimated from pedigrees
[41], from 0.0003 to 0.0075 mutations per generation for HVR-I.
The Medieval and the Etruscan effective population sizes were
extracted from a prior distribution spanning from 100 to 50,000,
as suggested in Guimaraes et al. [5]. Ancestral population sizes
varied from 5 to 6,000 individuals. The entire procedure was
repeated under a demographic scenario including a population
bottleneck corresponding to the 14th century plague epidemics, in
which an estimated one-third of the population was lost [42].
Model Selection and Parameter EstimationThe posterior probabilities of the 24 combinations of models (3),
modern populations (4) and demographic scenarios (2), were
calculated either: (i) by a simple rejection procedure (AR) [43] for
which we retained the 100 simulations associated with the shortest
distance between observed and simulated statistics [44]; or (ii) by
a weighted multinomial logistic regression (LR) [44] for which we
retained the 50,000 simulations generating the shortest distance
between the observed and simulated statistics. In both cases, we
normalized the PPs so that their sum for all models being
compared is 1. The parameters of the best-fitting model were
estimated from the 2,000 simulations closest to the observed
dataset, after a logtan transformation of the parameters [45] and
according to Beaumont [37].
Additional Tests: Type I Error and Posterior PredictiveTestsWe estimated the probability that the true null hypothesis be
rejected by evaluating the Type I Error, i.e. the proportion of cases
in which 1,000 pseudo-datasets generated under each model are
not correctly identified by the ABC analysis. In addition, to test
whether the data can be actually reproduced under a specific
demographic model, we carried out a posterior predictive test
[9,25]. For that purpose, we simulated 10,000 datasets according
to the model with the highest probability using the estimated
posterior parameter distribution, and we calculated a posterior
predictive P-value for each statistic; these probabilities were then
combined into a global P-value, taking into account their non-
independence [46].
The Isolation with Migration (IM) ModelWe estimated the likely separation time between the Tuscan
and Anatolian gene pools by Isolation with Migration (IM),
a method generating posterior probabilities for complex models in
which populations need not be at equilibrium [19]. Seven
parameters were estimated from the data, namely the size of the
ancestral and daughter populations (NA, N1, N2), the rates of gene
flow between daughter populations (m1, m2), the time since the split
(t), and the proportion of the members of the ancestral population
giving rise to the first daughter population (s) [47]. Because any
degree of genetic exchange increases the t estimate, after some
preliminary tests we set to 0 the values of m1 and m2. Most tests
were run fixing the mutation rate at the value estimated in the
ABC analysis (0.003 mutational events per locus per generation),
but we repeated the whole IM analysis with both lower and higher
values (respectively, 0.0014 and 0.0060 mutational events per
locus per generation; [13,23]) under a Hasegawa-Kishino-Yano
(HKY; [48]) mutational model with inheritance scalar 0.25, as
recommended for mtDNA data. For each mutation rate tested we
ran several analyses starting from different random seeds, in order
to assess the consistency of the results; moreover, to improve the
exploration of the parameters’ space, and thereby the conver-
gence, we coupled the Markov chains, running simultaneously 5
chains per run.
Supporting Information
Figure S1 Amplicons of the 10 sequences from Case-novole. DNA sequences from the575 clones analysed for the 10
Casenovole Etruscan samples. The sequences of the external
primers are not reported in the figure. The Cambridge reference
sequence with the numbering of the nucleotide positions is at the
top. Nucleotides identical to the Cambridge reference sequence
are indicated by dots. The clones are identified by a code (from S1
to S17, indicating the individual), the first number is the
extraction, the second number is the PCR.
(PDF)
Figure S2 Results of the mapping step for the 10Etruscan samples analyzed. (A) The number of sequences
that map to the reference and those that do not map is plotted as
a histogram. Some samples had a large amount of unmapped
reads that were afterwards characterized as primers’ dimers. (B)
Frequency distribution (% on the Y axis) of the frequency of the
most frequent nucleotide for the 10 Etruscan samples analyzed
(the upper limits of the % intervals are reported in the legend). For
example, in sample S1 at around 84% of the positions the
frequency of the most frequent allele among reads is between 99%
and 100%.
(PDF)
Figure S3 Measures of genetic distance. Allele sharing (A)
and Fst (6100) (B) in 52 modern populations of Western Eurasia
and the Mediterranean basin. Population labels and sample sizes
are provided in Table S2. Allele sharing estimated as the number
of sequences shared between Etruscans and every modern
population, divided by the sample size of the modern sample.
(TIF)
Figure S4 Multi Dimensional Scaling. Multi Dimensional
Scaling summarizing genetic affinities between the Etruscans and
(A) 52 modern populations of Western Eurasia and the
Mediterranean basin; (B) Medieval and modern Italian popula-
Origins and Evolution of the Etruscans’ mtDNA
PLOS ONE | www.plosone.org 9 February 2013 | Volume 8 | Issue 2 | e55519

tions; (C) 9 ancient populations of Europe. Population labels and
sample sizes are provided in Table S2.
(PDF)
Figure S5 Results of model selection. Results of model
selection with or without a bottleneck representing the plague
epidemics at 625 BP, in Casentino, Murlo and Volterra. Dashed
lines represent the presence of plague epidemic that killed one
third of the population. For each sample we report the posterior
probabilities calculated comparing Models 1–3, either considering
or disregarding this demographic event.
(PDF)
Figure S6 Parameter estimates and posterior distribu-tions under Model 1, for Casentino (A) and Volterra (B).Upper panels: Prior distributions (all the priors were uniform),
median and mode estimates, the 95% of the highest posterior
density (lower and upper bound), and coefficient of determination
R2. The time is expressed in years, the mutation rate in number of
mutational events per generation per locus. Lower panels:
histograms and smoothed distributions of the parameters estimat-
ed.
(PDF)
Figure S7 IM model (A) and estimates (B) for theseparation time between Anatolians and Tuscans. N1
and N2: modern population size; NA: ancestral population size; m1
and m2: migration rates; s: proportion of the ancestral population
that founds descendent population 1; t: separation time. Different
mutation rates and proportions of the ancestral population
founding the descendant populations were considered.
(PDF)
Table S1 Consensus HVR-I Etruscans mtDNA andsequences of all the investigators. Upper panel: Consensus
HVR-I mtDNA sequences in 30 individuals from historical
Etruria. Tarq represents individuals from Tarquinia, Cas from
Casenovole, Vol from Volterra, Pie from Castelluccio di Pienza,
Sot from Castelfranco di Sotto and MM from Magliano and
Marsiliana. CRS is the Cambridge reference sequence [32]. The
HVR-I motif is the position (216,000) where substitution were
observed, with respect to the CRS; the observed transversions are
indicated with a capital letter. The haplotypes shared with EUR
dataset are in bold type. For the Casenovole sample, the labels of
the individuals used in Figure S1 are between parentheses. Lower
panel: Sequences of all the investigators who had direct contact
with the ancient specimens.
(DOCX)
Table S2 Detailed description of the samples in theEUR and ANC datasets.(DOC)
Acknowledgments
Computational support for the data analysis has been provided by
CINECA (Bologna) and CASPUR (Roma) HPC facilities. We thank Carlo
Previdere for sharing with us unpublished data, Sibelle Vilaca for her help
with the graphics, Alessandro Achilli, Andrea Benazzo, Mathias Currat,
Martin Richards and especially Stefano Mona for discussion and
suggestions.
Author Contributions
Conceived and designed the experiments: SG DC GB. Performed the
experiments: SG FT EF AS ML SV EP GC ER GDB. Analyzed the data:
SG FT EF VC. Wrote the paper: SG DC GB.
References
1. Barker G, Rasmussen T (1998) The Etruscans. Oxford: Blackwell.
2. Achilli A, Olivieri A, Pala M, Metspalu E, Fornarino S, et al. (2007)
Mitochondrial DNA variation of modern Tuscans supports the near eastern
origin of Etruscans. Am J Hum Genet 80: 759–768.
3. Vernesi C, Caramelli D, Dupanloup I, Bertorelle G, Lari M, et al. (2004) The
Etruscans: a population-genetic study. Am J Hum Genet 74: 694–704.
4. Belle EM, Ramakrishnan U, Mountain JL, Barbujani G (2006) Serial coalescentsimulations suggest a weak genealogical relationship between Etruscans and
modern Tuscans. Proc Natl Acad Sci U S A 103: 8012–8017.
5. Guimaraes S, Ghirotto S, Benazzo A, Milani L, Lari M, et al. (2009)Genealogical discontinuities among Etruscan, Medieval, and contemporary
Tuscans. Mol Biol Evol 26: 2157–2166.
6. Pellecchia M, Negrini R, Colli L, Patrini M, Milanesi E, et al. (2007) The
mystery of Etruscan origins: novel clues from Bos taurus mitochondrial DNA.Proc Biol Sci 274: 1175–1179.
7. Bandelt HJ (2004) Etruscan artifacts. Am J Hum Genet 75: 919–920; author
reply 923–917.
8. Mateiu LM, Rannala BH (2008) Bayesian inference of errors in ancient DNA
caused by postmortem degradation. Mol Biol Evol 25: 1503–1511.
9. Ghirotto S, Mona S, Benazzo A, Paparazzo F, Caramelli D, et al. (2010)Inferring genealogical processes from patterns of Bronze-Age and modern DNA
variation in Sardinia. Mol Biol Evol 27: 875–886.
10. Turchi C, Buscemi L, Previdere C, Grignani P, Brandstatter A, et al. (2008)Italian mitochondrial DNA database: results of a collaborative exercise and
proficiency testing. Int J Legal Med 122: 199–204.
11. Di Benedetto G, Erguven A, Stenico M, Castri L, Bertorelle G, et al. (2001)DNA diversity and population admixture in Anatolia. Am J Phys Anthropol 115:
144–156.
12. Livi-Bacci M (2007) A concise history of world population. Oxford: Blackwell.
13. Henn BM, Gignoux CR, Feldman MW, Mountain JL (2009) Characterizing thetime dependency of human mitochondrial DNA mutation rate estimates. Mol
Biol Evol 26: 217–230.
14. Neuenschwander S, Largiader CR, Ray N, Currat M, Vonlanthen P, et al.(2008) Colonization history of the Swiss Rhine basin by the bullhead (Cottus
gobio): inference under a Bayesian spatially explicit framework. Mol Ecol 17:
757–772.
15. Belle EM, Benazzo A, Ghirotto S, Colonna V, Barbujani G (2009) Comparing
models on the genealogical relationships among Neandertal, Cro-Magnoid and
modern Europeans by serial coalescent simulations. Heredity 102: 218–225.
16. Fagundes NJ, Ray N, Beaumont M, Neuenschwander S, Salzano FM, et al.(2007) Statistical evaluation of alternative models of human evolution. Proc Natl
Acad Sci U S A 104: 17614–17619.
17. Laval G, Patin E, Barreiro LB, Quintana-Murci L (2010) Formulating
a historical and demographic model of recent human evolution based onresequencing data from noncoding regions. PLoS One 5: e10284.
18. Brisighelli F, Capelli C, Alvarez-Iglesias V, Onofri V, Paoli G, et al. (2009) TheEtruscan timeline: a recent Anatolian connection. Eur J Hum Genet 17: 693–
696.
19. Hey J, Nielsen R (2004) Multilocus methods for estimating population sizes,
migration rates and divergence time, with applications to the divergence ofDrosophila pseudoobscura and D. persimilis. Genetics 167: 747–760.
20. Nielsen R, Wakeley J (2001) Distinguishing migration from isolation: a Markov
chain Monte Carlo approach. Genetics 158: 885–896.
21. Fenner JN (2005) Cross-cultural estimation of the human generation interval for
use in genetics-based population divergence studies. Am J Phys Anthropol 128:415–423.
22. Quintana-Murci L, Chaix R, Wells RS, Behar DM, Sayar H, et al. (2004)Where west meets east: the complex mtDNA landscape of the southwest and
Central Asian corrido. Am J Hum Genet 74: 827–845.
23. Soares P, Ermini L, Thomson N, Mormina M, Rito T, et al. (2009) Correcting
for purifying selection: an improved human mitochondrial molecular clock.Am J Hum Genet 84: 740–759.
24. Bertorelle G, Benazzo A, Mona S (2010) ABC as a flexible framework to
estimate demography over space and time: some cons, many pros. Mol Ecol 19:
2609–2625.
25. Gelman A, Carlin J, Stern H, Rubin D (2004) Bayesian Data Analysis. BocaRaton, Florida: CRC Press.
26. Claassen H, Wree A (2004) The Etruscan skulls of the Rostock anatomicalcollection–how do they compare with the skeletal findings of the first thousand
years B. C.? Ann Anat 186: 157–163.
27. Barker G (2006) The Agricultural revolution in prehistory: Why did foragers
become farmers?. Oxford: Oxford University Press.
28. Lacan M, Keyser C, Ricaut FX, Brucato N, Duranthon F, et al. (2011) Ancient
DNA reveals male diffusion through the Neolithic Mediterranean route. ProcNatl Acad Sci U S A 108: 9788–9791.
29. Caramelli D, Lalueza-Fox C, Condemi S, Longo L, Milani L, et al. (2006) A
highly divergent mtDNA sequence in a Neandertal individual from Italy. Curr
Biol 16: R630–632.
Origins and Evolution of the Etruscans’ mtDNA
PLOS ONE | www.plosone.org 10 February 2013 | Volume 8 | Issue 2 | e55519

30. Caramelli D, Milani L, Vai S, Modi A, Pecchioli E, et al. (2008) A 28,000 years
old Cro-Magnon mtDNA sequence differs from all potentially contaminating
modern sequences. PLoS One 3: e2700.
31. Maricic T, Paabo S (2009) Optimization of 454 sequencing library preparation
from small amounts of DNA permits sequence determination of both DNA
strands. Biotechniques 46: 51–52, 54–57.
32. Andrews RM, Kubacka I, Chinnery PF, Lightowlers RN, Turnbull DM, et al.
(1999) Reanalysis and revision of the Cambridge reference sequence for human
mitochondrial DNA. Nat Genet 23: 147.
33. Bandelt HJ, Kivisild T (2006) Quality assessment of DNA sequence data:
autopsy of a mis-sequenced mtDNA population sample. Ann Hum Genet 70:
314–326.
34. Bendall KE, Sykes BC (1995) Length heteroplasmy in the first hypervariable
segment of the human mtDNA control region. Am J Hum Genet 57: 248–256.
35. Excoffier L, Lischer HE (2010) Arlequin suite ver 3.5: a new series of programs
to perform population genetics analyses under Linux and Windows. Mol Ecol
Resour 10: 564–567.
36. R Development Core Team (2010) R: A Language and Environment for
Statistical Computing. http://www.R-project.org. Vienna, Austria: Foundation
for Statistical Computing. Accessed 2013 January 3.
37. Beaumont MA, Zhang W, Balding DJ (2002) Approximate Bayesian
computation in population genetics. Genetics 162: 2025–2035.
38. Anderson CN, Ramakrishnan U, Chan YL, Hadly EA (2005) Serial SimCoal:
a population genetics model for data from multiple populations and points in
time. Bioinformatics 21: 1733–1734.
39. PopABC website. Available at: http://code.google.com/p/popabc/source/
browse/#svn%2Ftrunk%2Fscripts. Accessed 2013 January 3.40. Pakendorf B, Stoneking M (2005) Mitochondrial DNA and human evolution.
Annu Rev Genomics Hum Genet 6: 165–183.
41. Howell N, Smejkal CB, Mackey DA, Chinnery PF, Turnbull DM, et al. (2003)The pedigree rate of sequence divergence in the human mitochondrial genome:
there is a difference between phylogenetic and pedigree rates. Am J Hum Genet72: 659–670.
42. Biraben J-N (1979) Essai sur l’evolution du nombre des hommes. Population
(French ed) 34: 13–25.43. Pritchard JK, Seielstad MT, Perez-Lezaun A, Feldman MW (1999) Population
growth of human Y chromosomes: a study of Y chromosome microsatellites.Mol Biol Evol 16: 1791–1798.
44. Beaumont M (2008) Joint determination of topology, divergence time andimmigration in population trees. Simulations, genetics and human prehistory.
Cambridge: McDonald Institute for Archaeological Research. 135–154.
45. Hamilton G, Stoneking M, Excoffier L (2005) Molecular analysis reveals tightersocial regulation of immigration in patrilocal populations than in matrilocal
populations. Proc Natl Acad Sci U S A 102: 7476–7480.46. Voight BF, Adams AM, Frisse LA, Qian Y, Hudson RR, et al. (2005)
Interrogating multiple aspects of variation in a full resequencing data set to infer
human population size changes. Proc Natl Acad Sci U S A 102: 18508–18513.47. Hey J (2005) On the number of New World founders: a population genetic
portrait of the peopling of the Americas. PLoS Biol 3: e193.48. Hasegawa M, Kishino H, Yano T (1985) Dating of the human-ape splitting by
a molecular clock of mitochondrial DNA. J Mol Evol 22: 160–174.
Origins and Evolution of the Etruscans’ mtDNA
PLOS ONE | www.plosone.org 11 February 2013 | Volume 8 | Issue 2 | e55519
Related Documents