Introduction In recent years, more attention had been given to the environmental problem of serve haze pollutions in China, where atmospheric fine particulate matter (PM) was the primary outdoor air pollutant [1]. However, indoor air pollutions may have more significant effects on human health than outdoor pollutions due to more personal exposure time [2]. According to statistic result, in modern society, people spend 90% of their time indoors [3]. Residents in Northeastern China spent longer time indoors due to higher latitudes and longer winter months with extra low outdoor temperatures. Pol. J. Environ. Stud. Vol. 30, No. 2 (2021), 1263-1277 Original Research Chemical Characteristic and Inhalational Carcinogenic Risk of PM 2.5 Exposure During Indoor Cooking in Northeastern China Hejie Li 1# , Sanchun Wang 1# , Xuelei Zhang 2# , Jingpu Yang 1 , Bo Teng 1 * 1 Department of Otolaryngology Head and Neck Surgery, The Second Hospital, Jilin University, Changchun, China 2 Key Laboratory of Wetland Ecology and Environment, Northeast Institute of Geography and Agroecology, Chinese Academy of Sciences, Changchun, China Received: 10 May 2020 Accepted: 18 July 2020 Abstract To analyze physicochemical characteristics of PM 2.5 from indoor cooking and to assess their health risks, the particulate concentrations and chemical compositions of indoor PM 2.5 under two cooking styles and four ventilation conditions were investigated in Northeastern China. The inhaled carcinogenic risks and non-carcinogenic risks of the heavy metals and polycyclic aromatic hydrocarbons (PAHs) were calculated, respectively. Our results showed that the cooking method of deep-frying produced higher concentrations of PM 2.5 than stir-frying, and the usage of window ventilation was faster than fresh air system (FAS) to decrease concentrations of indoor PM 2.5 . The proportions of chemical components of indoor PM 2.5 were only associated with cooking styles but not with ventilation conditions. The proportion in BbF, BaA, FL, Pyr of PAHs components and Cu, Cr, Pb of heavy metals in pan- seared fish were higher than that of stir-fried pork with cabbage. The total inhaled non-carcinogenic risks of heavy metals and PAHs are both below the safety level, but the health risks analysis indicated that heavy metals released from both cooking methods had potential adverse effects on human health. Therefore, we recommend that reducing deep-frying, enabling window ventilation and closing the kitchen door as the first choice for controlling indoor air pollution during the process of cooking in Northeastern China. Keywords: indoor air pollution, PM 2.5 , cooking styles, ventilation conditions, health risk assessment # These authors contributed equally to this work. *e-mail: [email protected] DOI: 10.15244/pjoes/125520 ONLINE PUBLICATION DATE: 2020-11-03

Welcome message from author
This document is posted to help you gain knowledge. Please leave a comment to let me know what you think about it! Share it to your friends and learn new things together.
Transcript
Introduction
In recent years, more attention had been given to the environmental problem of serve haze pollutions in China, where atmospheric fine particulate matter (PM)
was the primary outdoor air pollutant [1]. However, indoor air pollutions may have more significant effects on human health than outdoor pollutions due to more personal exposure time [2]. According to statistic result, in modern society, people spend 90% of their time indoors [3]. Residents in Northeastern China spent longer time indoors due to higher latitudes and longer winter months with extra low outdoor temperatures.
Pol. J. Environ. Stud. Vol. 30, No. 2 (2021), 1263-1277
Original Research
Chemical Characteristic and Inhalational Carcinogenic Risk of PM2.5 Exposure During
Indoor Cooking in Northeastern China
Hejie Li1#, Sanchun Wang1#, Xuelei Zhang2#, Jingpu Yang1, Bo Teng1*
1Department of Otolaryngology Head and Neck Surgery, The Second Hospital, Jilin University, Changchun, China2Key Laboratory of Wetland Ecology and Environment, Northeast Institute of Geography and Agroecology,
Chinese Academy of Sciences, Changchun, China
Received: 10 May 2020Accepted: 18 July 2020
Abstract
To analyze physicochemical characteristics of PM2.5 from indoor cooking and to assess their health risks, the particulate concentrations and chemical compositions of indoor PM2.5 under two cooking styles and four ventilation conditions were investigated in Northeastern China. The inhaled carcinogenic risks and non-carcinogenic risks of the heavy metals and polycyclic aromatic hydrocarbons (PAHs) were calculated, respectively. Our results showed that the cooking method of deep-frying produced higher concentrations of PM2.5 than stir-frying, and the usage of window ventilation was faster than fresh air system (FAS) to decrease concentrations of indoor PM2.5. The proportions of chemical components of indoor PM2.5 were only associated with cooking styles but not with ventilation conditions. The proportion in BbF, BaA, FL, Pyr of PAHs components and Cu, Cr, Pb of heavy metals in pan-seared fish were higher than that of stir-fried pork with cabbage. The total inhaled non-carcinogenic risks of heavy metals and PAHs are both below the safety level, but the health risks analysis indicated that heavy metals released from both cooking methods had potential adverse effects on human health. Therefore, we recommend that reducing deep-frying, enabling window ventilation and closing the kitchen door as the first choice for controlling indoor air pollution during the process of cooking in Northeastern China.
Keywords: indoor air pollution, PM2.5, cooking styles, ventilation conditions, health risk assessment
#These authors contributed equally to this work.*e-mail: [email protected]
DOI: 10.15244/pjoes/125520 ONLINE PUBLICATION DATE: 2020-11-03

Li H., et al.1264
Moreover, the indoor environment is relatively enclosed with less ventilation to keep house warming, which resulted in the indoor particulates produced by human daily activities are hard to be dispersed to outdoor environment, even under the conditions of forecasted outdoor air quality is relatively good.
With increasing awareness of environmental health, the impact of indoor air pollution on human health has been gotten more attention worldwide. A WHO report of 2014 estimated that outdoor pollution led to about 2.7 million deaths in worldwide, while about 4.3 million deaths were related to indoor pollution. Several studies had shown obviously evidence for the significant effects of outdoor gaseous pollutants (NOx, CO and O3) and ambient particulates (such as dust and biomass burning smoke) on asthma and allergic rhinitis, and demonstrated that temperature may had a key role in the exacerbation of asthma [4,5,6,7]. Recent studies found that indoor air pollution is positively correlated with the occurrence of asthma in children [8, 9] and exposure to indoor air pollution can increase the risk of chronic obstructive pulmonary diseases (COPD) exacerbation [10, 11]. Indoor PM2.5 can also aggravate children allergic rhinitis and asthma symptoms [12, 13]. The major chemical components of indoor particulates, such as heavy metals and organic carbons, are mainly concentrated in PM2.5. They can reach alveoli and cause a variety of health risks, which has attracted extensive attention from researchers [14]. Moreover, long-term exposure to indoor PM2.5 would increase the risk of lung cancer [15]. In the past two decades, with the development of low-cost sensors, these sensors had been used in indoor air quality monitoring and health evaluation of cooking on residents [16, 17]. More studies should focus on both polluted gases and particulates which released from indoor cooking and even their health effects via low-cost air quality senIors.
The primary sources of indoor PM2.5 include residential interior decoration, fuel burning, cooking fume, smoking, and diffusion from outdoors [18, 19, 20]. Cooking is one of the critical sources of indoor PM2.5 in urban areas of China [21]. Since people often cook meals at homes and are exposed to cooking fumes daily, cooking-generated PM2.5 can cause adverse effects on human health. The concentration of PM2.5 was an important factor that corelated to respiratory diseases. Fan et al. found that the relative risk for asthma is increased by 15% for every 10 μg/m3 increase of PM2.5 concentration [22]. Thus, it is crucial to understand the effect of potential correlative factors during cooking on indoor PM2.5.
The difference of cooking fuels and cooking methods had significant effects on the released PM concentrations and compositions. Previous study reported that indoor PM2.5 concentrations and inhalation exposure levels in households using coal for cooking were much higher than those using gas and electricity for cooking [23]. Another research also revealed that indoor PM2.5 concentrations were associated with
different cooking oils [24]. Compared with different cooking methods, the concentration of PM2.5 produced by deep-frying is higher and has a greater impact on the human body [25]. Furthermore, the emissions of different chemical compositions of fine particulate matter emitted from Chinese cooking are impacted significantly by the cooking ingredients [26].
Chinese cuisine has a wide range of twenty-four cooking styles and eight cuisines genres. Compared with the western, Chinese cuisine tends to produce more particulate matter [27]. In particular, in Northern China, high-fat diets are predominant in this region. Till now, however, there are only limited reports on the comprehensive effects of different cooking styles and ventilation conditions on indoor PM2.5 concentration, chemical composition, and even their health risk assessment. Therefore, a representative household in Changchun of Northeastern China, was selected to analyze the PM2.5 concentration variations and chemical composition of indoor PM2.5 based on two cooking styles (stir-frying and deep-frying) and four ventilation conditions, to assess the health risks of indoor PM2.5 on regional residents.
Materials and Methods
Instruments and Cooking Materials
Our experimental system includes one range hood with high-speed and low-speed modes, one set of fresh air system, stove and WH-B04 electronic scale (Guangzhou Weiheng Electronics Co., Ltd.). The instruments used for PM measurements are consisted of: Microcomputer-controlled laser duster (LD-5, Beijing Lvlin Huanchuang Technology Co., Ltd.) with capability of monitoring 4 different particle sizes, sampling flow rate was set to 2.0 L/min, and the measurement accuracy is 0. 001 mg /m3; Intelligent anemometer (ZRQF-D104, Beijing detection instrument factory) was applied for temperature measurements. High performance liquid chromatography (HPLC): Waters 600 system, UV detector (instrument model: waters 2487 Dual λ absorbance Detector); Agilent zorbax SBC18 column (5 μm, 4.6×150 mm); Aerosol sampler (Omni FT, BGI, USA), sampling flow rate was set to 5.0 L/min. The main cooking materials include cabbage, pork, fish (Larimichthys polyacti), soybean oil and salt (Table 1).
Experimental Location and Environment
This study has been conducted in Mar 3, 2018. The experimental site is located on the 6th floor of an apartment in Chaoyang District of Changchun City. The ventilation environment is excellent for the household. The experimental space was hermetic by close all doors and windows except for the kitchen and living room. The house floor plan and experimental
Chemical Characteristic and Inhalational... 1265
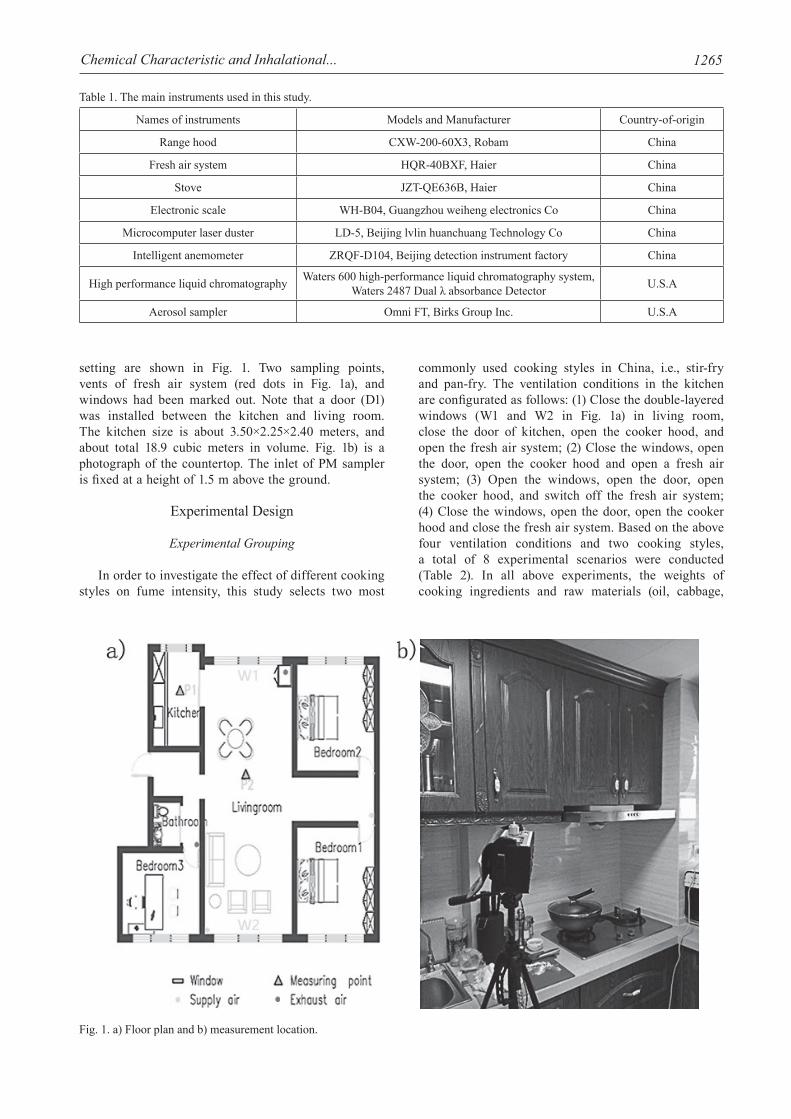
setting are shown in Fig. 1. Two sampling points, vents of fresh air system (red dots in Fig. 1a), and windows had been marked out. Note that a door (D1) was installed between the kitchen and living room. The kitchen size is about 3.50×2.25×2.40 meters, and about total 18.9 cubic meters in volume. Fig. 1b) is a photograph of the countertop. The inlet of PM sampler is fixed at a height of 1.5 m above the ground.
Experimental Design
Experimental Grouping
In order to investigate the effect of different cooking styles on fume intensity, this study selects two most
commonly used cooking styles in China, i.e., stir-fry and pan-fry. The ventilation conditions in the kitchen are configurated as follows: (1) Close the double-layered windows (W1 and W2 in Fig. 1a) in living room, close the door of kitchen, open the cooker hood, and open the fresh air system; (2) Close the windows, open the door, open the cooker hood and open a fresh air system; (3) Open the windows, open the door, open the cooker hood, and switch off the fresh air system; (4) Close the windows, open the door, open the cooker hood and close the fresh air system. Based on the above four ventilation conditions and two cooking styles, a total of 8 experimental scenarios were conducted (Table 2). In all above experiments, the weights of cooking ingredients and raw materials (oil, cabbage,
Names of instruments Models and Manufacturer Country-of-origin
Range hood CXW-200-60X3, Robam China
Fresh air system HQR-40BXF, Haier China
Stove JZT-QE636B, Haier China
Electronic scale WH-B04, Guangzhou weiheng electronics Co China
Microcomputer laser duster LD-5, Beijing lvlin huanchuang Technology Co China
Intelligent anemometer ZRQF-D104, Beijing detection instrument factory China
High performance liquid chromatography Waters 600 high-performance liquid chromatography system, Waters 2487 Dual λ absorbance Detector U.S.A
Aerosol sampler Omni FT, Birks Group Inc. U.S.A
Table 1. The main instruments used in this study.
Fig. 1. a) Floor plan and b) measurement location.
Li H., et al.1266
pork, fish) used in each time were kept in the same weights (namely, 20 ml of oil, 250 g of cabbage, 100 g of pork, and one fish of about 100 g).
Cooking and Sampling
Uniformly setting during all the cooking progresses, namely, the range hood was set to the high-speed mode with an average airflow rate of 2.14 L/sec, and the fire control button is located in the same position (middle level) for each scenario. Before cooking in each scenario, natural ventilation by opening all windows for 30 minutes was conducted to ensure the background concentration of indoor fine particles is equal to that of outdoor conditions. The background concentration of the particles was started to record before igniting the fire both in the kitchen and living room, respectively. One minute after starting the measurement, the gas range was turned on to start the preheating for 2 minutes. Then, oil was added into the pan immediately and heated for one minute, then followed by adding food materials and salts. The heat was turned off as soon as food was cooked. Aerosol sampling pumps were connected with two samplers: one was loaded with 47 mm quartz-fiber filter (QM-H, Whatman, USA) and the other with 47 mm borosilicate glass filter (EPM2000, Whatman, USA).
Chemical Composition Analysis
In laboratory, the collected borosilicate glass filter was taken out and placed in a Teflon beaker, wetted with a small amount of deionized water, and then added with a mixture of nitric acid and perchloric acid with fully immersed over the crushed filter, and finally covered with a watch glass. The graphite furnace was digested and heated to reflux for about 4 hours to near dryness. After cooling, the inner wall of the beaker and the watch glass were rinsed with deionized water, allowed to stand for 30 minutes, leached, filtered, and finally set to 100 ml. Inductively coupled helium synthesis plasma mass spectrometry (ICP-MS, Agilent 8800, USA) was used to measure nine heavy metal elements in PM2.5
samples, which were Cr, As, Cd, Pb, Ni, Mn, Zn, Cu and Ba. The vessels used in the experimental analysis were soaked in 15% nitric acid for more than 12 hours and then rinsed thoroughly with deionized water after three times of washing.
The detection method for organic components in PM2.5: The collected quartz-fiber filter was taken out and cut into a size of 1 × 1 cm, placed in a 10 ml EP tube, added with 5 ml of dichloromethane, and eluted at 4ºC for 12 h. Then it was extracted by ultrasonic shock for 10 min, 3 times. The digestive juice was centrifuged for 10 min at a rate of 3 000 r/min. The eluate was dried with high-purity nitrogen and dissolved in 700 μl of methanol. The treated extract was injected into the HPLC, quantitative analysis of 10 selected PAHs in the aerosol sample. Benz[a]anthracene (BaA), benzo[a]pyrene (BaP), benzo[b]fluoranthene (BbF), chrysene (CHR), indeno[1,2,3-c,d]pyrene (IND), phenanthrene (Phe), fluoranthene (FL), fluorene (Flu), pyrene (Pyr) and benzo[g,h,i]perylene (BghiP) were detected by a UV detector.
Risk Assessment
Inhalational carcinogenic or non-carcinogenic risk assessment of PM2.5 was calculated with the following equations, provided by the US Environmental Protection Agency [28]:
(1)
EC: carcinogenic or non-carcinogenic exposure concentration (μg/m3); C: arithmetic mean concentration of the carcinogenic or non-carcinogenic elements in PM2.5 (μg/m3); ET: exposure time (h/d); EF: exposure frequency (d/y); ED: exposure duration (y) ; AT: average time (h).
(2)
C: arithmetic mean concentration of the carcinogenic or non-carcinogenic elements in PM2.5 (μg/m3); t: time
Table 2. Fresh air systems and cooking styles used in the case studies.
Ventilation Kitchen door Airflow rate (m3/h) Cooking styles
Case 1 FAS + Range hood close 2.14 Stir-fried pork with cabbage
Case 2 FAS + Range hood close 2.14 Pan-seared fish
Case 3 Window + Range hood Open 2.14 Stir-fried pork with cabbage
Case 4 Window + Range hood Open 2.14 Pan-seared fish
Case 5 FAS + Range hood Open 2.14 Stir-fried pork with cabbage
Case 6 FAS + Range hood Open 2.14 Fried fish
Case 7 Range hood only Open 2.14 Stir-fried pork with cabbage
Case 8 Range hood only Open 2.14 Pan-seared fish
Chemical Characteristic and Inhalational... 1267
to return to initial concentration (min); n: daily cooking times; Ci: the initial concentration (μg/m3)
ELCR = EC × IUR (3)
...where ELCR is the excess lifetime cancer risk; IUR (m3/μg) is inhalation unit risk; and IUR was obtained from the US EPA.
HQ = EC/Rfc (4)
...where HQ is the hazard quotient; and Rfc is the inhalation chronic reference concentration (http://rais.ornl.gov/cgi-bin/tools/TOX_search?select=chem).
According to the parameters recommended by the “Exposure Factor Handbook” of the United States Environmental Protection Agency [31], combined with the actual conditions in the study, the relevant human exposure evaluation parameters were selected and summarized in Table 3. Based on the recommendations of the EPA and the U.S. Office of Occupational Safety and Health (OSHA), the range of acceptable lifetime carcinogenic risk values (ELCRs) for the general population is 1×10⁻⁶ to 1×10⁻⁴.
Results and Discussion
Variation of Indoor PM2.5 Concentrations by Cooking
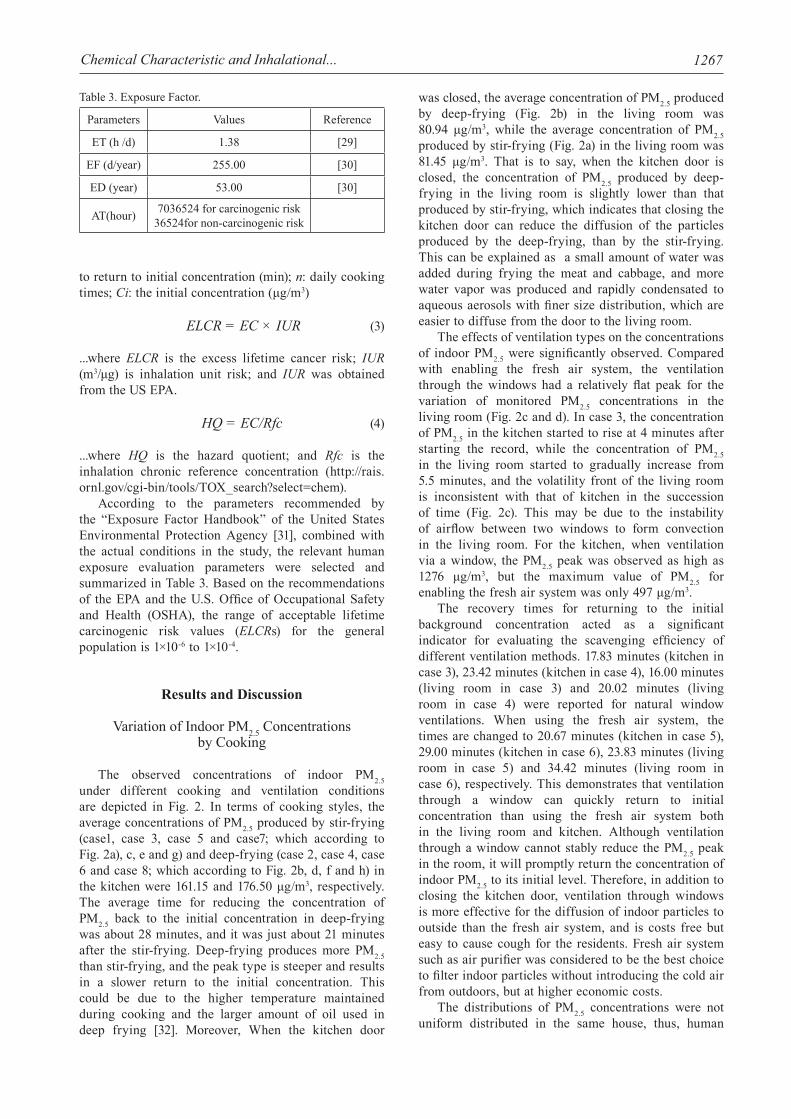
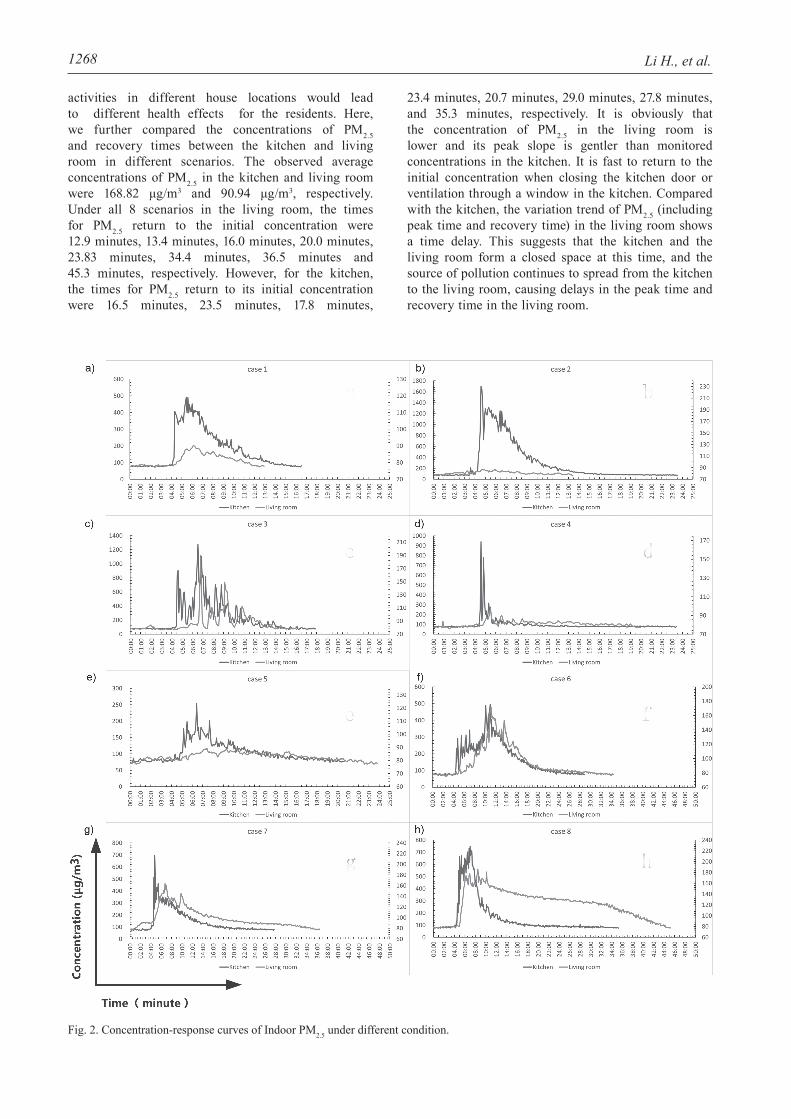
The observed concentrations of indoor PM2.5 under different cooking and ventilation conditions are depicted in Fig. 2. In terms of cooking styles, the average concentrations of PM2.5 produced by stir-frying (case1, case 3, case 5 and case7; which according to Fig. 2a), c, e and g) and deep-frying (case 2, case 4, case 6 and case 8; which according to Fig. 2b, d, f and h) in the kitchen were 161.15 and 176.50 μg/m3, respectively. The average time for reducing the concentration of PM2.5 back to the initial concentration in deep-frying was about 28 minutes, and it was just about 21 minutes after the stir-frying. Deep-frying produces more PM2.5 than stir-frying, and the peak type is steeper and results in a slower return to the initial concentration. This could be due to the higher temperature maintained during cooking and the larger amount of oil used in deep frying [32]. Moreover, When the kitchen door
was closed, the average concentration of PM2.5 produced by deep-frying (Fig. 2b) in the living room was 80.94 μg/m3, while the average concentration of PM2.5 produced by stir-frying (Fig. 2a) in the living room was 81.45 μg/m3. That is to say, when the kitchen door is closed, the concentration of PM2.5 produced by deep-frying in the living room is slightly lower than that produced by stir-frying, which indicates that closing the kitchen door can reduce the diffusion of the particles produced by the deep-frying, than by the stir-frying. This can be explained as a small amount of water was added during frying the meat and cabbage, and more water vapor was produced and rapidly condensated to aqueous aerosols with finer size distribution, which are easier to diffuse from the door to the living room.
The effects of ventilation types on the concentrations of indoor PM2.5 were significantly observed. Compared with enabling the fresh air system, the ventilation through the windows had a relatively flat peak for the variation of monitored PM2.5 concentrations in the living room (Fig. 2c and d). In case 3, the concentration of PM2.5 in the kitchen started to rise at 4 minutes after starting the record, while the concentration of PM2.5 in the living room started to gradually increase from 5.5 minutes, and the volatility front of the living room is inconsistent with that of kitchen in the succession of time (Fig. 2c). This may be due to the instability of airflow between two windows to form convection in the living room. For the kitchen, when ventilation via a window, the PM2.5 peak was observed as high as 1276 μg/m3, but the maximum value of PM2.5 for enabling the fresh air system was only 497 μg/m3.
The recovery times for returning to the initial background concentration acted as a significant indicator for evaluating the scavenging efficiency of different ventilation methods. 17.83 minutes (kitchen in case 3), 23.42 minutes (kitchen in case 4), 16.00 minutes (living room in case 3) and 20.02 minutes (living room in case 4) were reported for natural window ventilations. When using the fresh air system, the times are changed to 20.67 minutes (kitchen in case 5), 29.00 minutes (kitchen in case 6), 23.83 minutes (living room in case 5) and 34.42 minutes (living room in case 6), respectively. This demonstrates that ventilation through a window can quickly return to initial concentration than using the fresh air system both in the living room and kitchen. Although ventilation through a window cannot stably reduce the PM2.5 peak in the room, it will promptly return the concentration of indoor PM2.5 to its initial level. Therefore, in addition to closing the kitchen door, ventilation through windows is more effective for the diffusion of indoor particles to outside than the fresh air system, and is costs free but easy to cause cough for the residents. Fresh air system such as air purifier was considered to be the best choice to filter indoor particles without introducing the cold air from outdoors, but at higher economic costs.
The distributions of PM2.5 concentrations were not uniform distributed in the same house, thus, human
Parameters Values Reference
ET (h /d) 1.38 [29]
EF (d/year) 255.00 [30]
ED (year) 53.00 [30]
AT(hour) 7036524 for carcinogenic risk36524for non-carcinogenic risk
Table 3. Exposure Factor.
Li H., et al.1268
activities in different house locations would lead to different health effects for the residents. Here, we further compared the concentrations of PM2.5 and recovery times between the kitchen and living room in different scenarios. The observed average concentrations of PM2.5 in the kitchen and living room were 168.82 μg/m3 and 90.94 μg/m3, respectively. Under all 8 scenarios in the living room, the times for PM2.5 return to the initial concentration were 12.9 minutes, 13.4 minutes, 16.0 minutes, 20.0 minutes, 23.83 minutes, 34.4 minutes, 36.5 minutes and 45.3 minutes, respectively. However, for the kitchen, the times for PM2.5 return to its initial concentration were 16.5 minutes, 23.5 minutes, 17.8 minutes,
23.4 minutes, 20.7 minutes, 29.0 minutes, 27.8 minutes, and 35.3 minutes, respectively. It is obviously that the concentration of PM2.5 in the living room is lower and its peak slope is gentler than monitored concentrations in the kitchen. It is fast to return to the initial concentration when closing the kitchen door or ventilation through a window in the kitchen. Compared with the kitchen, the variation trend of PM2.5 (including peak time and recovery time) in the living room shows a time delay. This suggests that the kitchen and the living room form a closed space at this time, and the source of pollution continues to spread from the kitchen to the living room, causing delays in the peak time and recovery time in the living room.
Fig. 2. Concentration-response curves of Indoor PM2.5 under different condition.
Chemical Characteristic and Inhalational... 1269
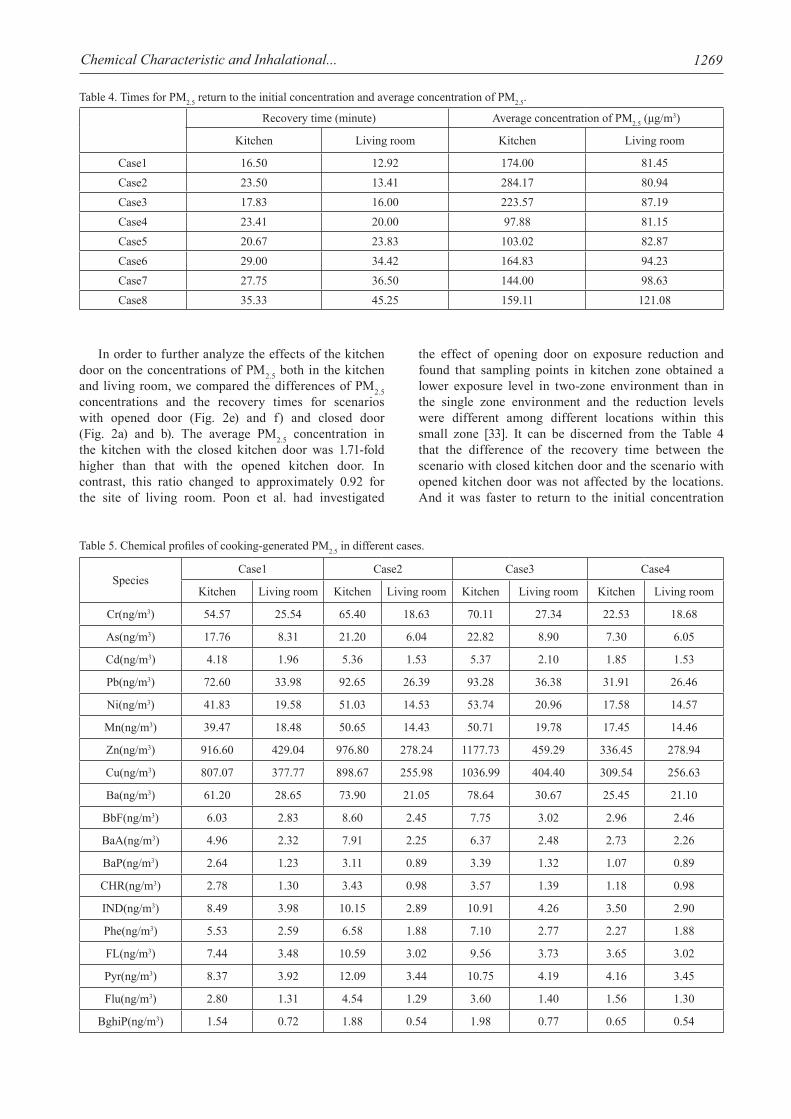
In order to further analyze the effects of the kitchen door on the concentrations of PM2.5 both in the kitchen and living room, we compared the differences of PM2.5 concentrations and the recovery times for scenarios with opened door (Fig. 2e) and f) and closed door (Fig. 2a) and b). The average PM2.5 concentration in the kitchen with the closed kitchen door was 1.71-fold higher than that with the opened kitchen door. In contrast, this ratio changed to approximately 0.92 for the site of living room. Poon et al. had investigated
the effect of opening door on exposure reduction and found that sampling points in kitchen zone obtained a lower exposure level in two-zone environment than in the single zone environment and the reduction levels were different among different locations within this small zone [33]. It can be discerned from the Table 4 that the difference of the recovery time between the scenario with closed kitchen door and the scenario with opened kitchen door was not affected by the locations. And it was faster to return to the initial concentration
Table 4. Times for PM2.5 return to the initial concentration and average concentration of PM2.5.
Recovery time (minute) Average concentration of PM2.5 (μg/m3)
Kitchen Living room Kitchen Living room
Case1 16.50 12.92 174.00 81.45Case2 23.50 13.41 284.17 80.94 Case3 17.83 16.00 223.57 87.19 Case4 23.41 20.00 97.88 81.15 Case5 20.67 23.83 103.02 82.87 Case6 29.00 34.42 164.83 94.23 Case7 27.75 36.50 144.00 98.63 Case8 35.33 45.25 159.11 121.08
Table 5. Chemical profiles of cooking-generated PM2.5 in different cases.
SpeciesCase1 Case2 Case3 Case4
Kitchen Living room Kitchen Living room Kitchen Living room Kitchen Living room
Cr(ng/m3) 54.57 25.54 65.40 18.63 70.11 27.34 22.53 18.68
As(ng/m3) 17.76 8.31 21.20 6.04 22.82 8.90 7.30 6.05
Cd(ng/m3) 4.18 1.96 5.36 1.53 5.37 2.10 1.85 1.53
Pb(ng/m3) 72.60 33.98 92.65 26.39 93.28 36.38 31.91 26.46
Ni(ng/m3) 41.83 19.58 51.03 14.53 53.74 20.96 17.58 14.57
Mn(ng/m3) 39.47 18.48 50.65 14.43 50.71 19.78 17.45 14.46
Zn(ng/m3) 916.60 429.04 976.80 278.24 1177.73 459.29 336.45 278.94
Cu(ng/m3) 807.07 377.77 898.67 255.98 1036.99 404.40 309.54 256.63
Ba(ng/m3) 61.20 28.65 73.90 21.05 78.64 30.67 25.45 21.10
BbF(ng/m3) 6.03 2.83 8.60 2.45 7.75 3.02 2.96 2.46
BaA(ng/m3) 4.96 2.32 7.91 2.25 6.37 2.48 2.73 2.26
BaP(ng/m3) 2.64 1.23 3.11 0.89 3.39 1.32 1.07 0.89
CHR(ng/m3) 2.78 1.30 3.43 0.98 3.57 1.39 1.18 0.98
IND(ng/m3) 8.49 3.98 10.15 2.89 10.91 4.26 3.50 2.90
Phe(ng/m3) 5.53 2.59 6.58 1.88 7.10 2.77 2.27 1.88
FL(ng/m3) 7.44 3.48 10.59 3.02 9.56 3.73 3.65 3.02
Pyr(ng/m3) 8.37 3.92 12.09 3.44 10.75 4.19 4.16 3.45
Flu(ng/m3) 2.80 1.31 4.54 1.29 3.60 1.40 1.56 1.30
BghiP(ng/m3) 1.54 0.72 1.88 0.54 1.98 0.77 0.65 0.54
Li H., et al.1270
SpeciesCase5 Case6 Case7 Case8 Average
Kitchen Living room Kitchen Living
room Kitchen Living room Kitchen Living
room Kitchen Living room
Cr(ng/m3) 32.31 25.99 37.93 21.69 45.16 30.93 36.62 27.87 45.58 24.58
As(ng/m3) 10.52 8.46 12.30 7.03 14.70 10.07 11.87 9.03 14.81 7.99
Cd(ng/m3) 2.48 1.99 3.11 1.78 3.46 2.37 3.00 2.28 3.60 1.94
Pb(ng/m3) 42.98 34.58 53.74 30.72 60.08 41.15 51.88 39.48 62.39 33.64
Ni(ng/m3) 24.76 19.92 29.60 16.92 34.62 23.71 28.57 21.74 35.21 18.99
Mn(ng/m3) 23.37 18.80 29.38 16.80 32.67 22.37 28.36 21.58 34.01 18.34
Zn(ng/m3) 542.67 436.53 566.57 323.90 758.57 519.57 546.93 416.21 727.79 392.71
Cu(ng/m3) 477.82 384.36 521.26 297.99 667.92 457.48 503.18 382.92 652.80 352.19
Ba(ng/m3) 36.23 29.15 42.86 24.50 50.65 34.69 41.38 31.49 51.29 27.29
BbF(ng/m3) 3.57 2.87 4.99 2.85 4.99 3.42 4.82 3.67 5.47 2.95
BaA(ng/m3) 2.93 2.36 4.59 2.62 4.10 2.81 4.43 3.37 4.75 2.56
BaP(ng/m3) 1.56 1.26 1.80 1.03 2.18 1.49 1.74 1.33 2.19 1.18
CHR(ng/m3) 1.65 1.33 1.99 1.14 2.30 1.58 1.92 1.46 2.35 1.27
IND(ng/m3) 5.03 4.05 5.89 3.37 7.03 4.81 5.68 4.33 7.09 3.82
Phe(ng/m3) 3.27 2.63 3.82 2.18 4.58 3.13 3.69 2.81 4.61 2.48
FL(ng/m3) 4.41 3.54 6.14 3.51 6.16 4.22 5.93 4.51 6.73 3.63
Pyr(ng/m3) 4.96 3.99 7.01 4.01 6.93 4.74 6.77 5.15 7.63 4.11
Flu(ng/m3) 1.66 1.34 2.63 1.51 2.32 1.59 2.54 1.93 2.70 1.46
BghiP(ng/m3) 0.91 0.73 1.09 0.62 1.27 0.87 1.06 0.80 1.30 0.70
Table 5. Continued.
Contaminant WOE Characterization TEFa IURb
(μg/ m3)RfCb
(mg/m3)
CrA for Cr(VI) 1.2 × 10⁻² 1 × 110-4
D for Cr(III) 1 × 110-4
As A 4.3 × 10⁻³ 1.5 × 10⁻⁵
Cd B1 1.8 × 10⁻³ 1 × 10⁻⁵
Pb B2 1.2 × 10⁻⁵ 0.8 × 10⁻⁴
Ni B2 2.4 × 10⁻⁴ 1.4 × 10⁻⁵
Mn D 5 × 10⁻⁵
Zn D ─
Cu D ─
Ba D 5 × 10⁻⁴
BbF B2 0.1 6 × 10⁻⁵ ─
BaA B2 0.1 6 × 10⁻⁵ ─
BaP B2 1 6 × 10⁻⁴ 2 × 10⁻⁶
CHR B2 0.01 6 × 10⁻⁷ ─
IND B2 0.1 6 × 10⁻⁵ ─
Table 6. The relative parameters of heavy metals/PAHs during cooking.
Chemical Characteristic and Inhalational... 1271
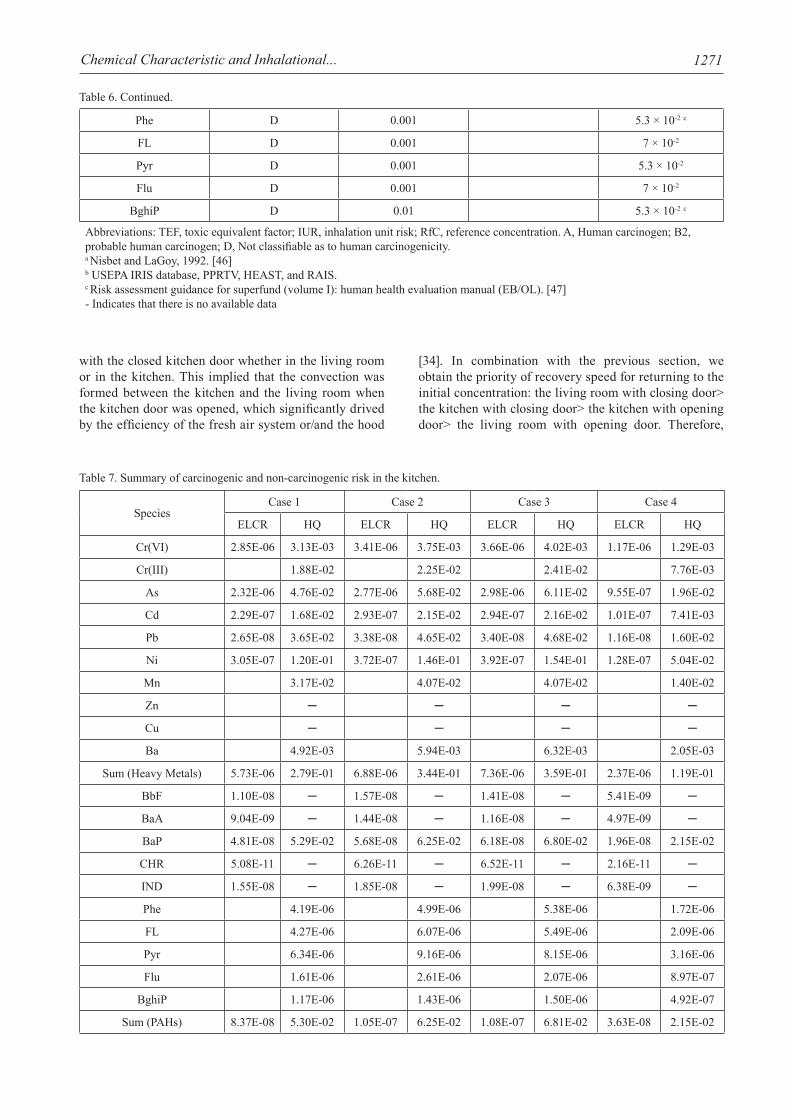
with the closed kitchen door whether in the living room or in the kitchen. This implied that the convection was formed between the kitchen and the living room when the kitchen door was opened, which significantly drived by the efficiency of the fresh air system or/and the hood
[34]. In combination with the previous section, we obtain the priority of recovery speed for returning to the initial concentration: the living room with closing door> the kitchen with closing door> the kitchen with opening door> the living room with opening door. Therefore,
Table 6. Continued.
Phe D 0.001 5.3 × 10⁻² c
FL D 0.001 7 × 10⁻²
Pyr D 0.001 5.3 × 10⁻²
Flu D 0.001 7 × 10⁻²
BghiP D 0.01 5.3 × 10⁻² c
Abbreviations: TEF, toxic equivalent factor; IUR, inhalation unit risk; RfC, reference concentration. A, Human carcinogen; B2, probable human carcinogen; D, Not classifiable as to human carcinogenicity.a Nisbet and LaGoy, 1992. [46]b USEPA IRIS database, PPRTV, HEAST, and RAIS.c Risk assessment guidance for superfund (volume I): human health evaluation manual (EB/OL). [47]- Indicates that there is no available data
Table 7. Summary of carcinogenic and non-carcinogenic risk in the kitchen.
SpeciesCase 1 Case 2 Case 3 Case 4
ELCR HQ ELCR HQ ELCR HQ ELCR HQ
Cr(VI) 2.85E-06 3.13E-03 3.41E-06 3.75E-03 3.66E-06 4.02E-03 1.17E-06 1.29E-03
Cr(III) 1.88E-02 2.25E-02 2.41E-02 7.76E-03
As 2.32E-06 4.76E-02 2.77E-06 5.68E-02 2.98E-06 6.11E-02 9.55E-07 1.96E-02
Cd 2.29E-07 1.68E-02 2.93E-07 2.15E-02 2.94E-07 2.16E-02 1.01E-07 7.41E-03
Pb 2.65E-08 3.65E-02 3.38E-08 4.65E-02 3.40E-08 4.68E-02 1.16E-08 1.60E-02
Ni 3.05E-07 1.20E-01 3.72E-07 1.46E-01 3.92E-07 1.54E-01 1.28E-07 5.04E-02
Mn 3.17E-02 4.07E-02 4.07E-02 1.40E-02
Zn ─ ─ ─ ─
Cu ─ ─ ─ ─
Ba 4.92E-03 5.94E-03 6.32E-03 2.05E-03
Sum (Heavy Metals) 5.73E-06 2.79E-01 6.88E-06 3.44E-01 7.36E-06 3.59E-01 2.37E-06 1.19E-01
BbF 1.10E-08 ─ 1.57E-08 ─ 1.41E-08 ─ 5.41E-09 ─
BaA 9.04E-09 ─ 1.44E-08 ─ 1.16E-08 ─ 4.97E-09 ─
BaP 4.81E-08 5.29E-02 5.68E-08 6.25E-02 6.18E-08 6.80E-02 1.96E-08 2.15E-02
CHR 5.08E-11 ─ 6.26E-11 ─ 6.52E-11 ─ 2.16E-11 ─
IND 1.55E-08 ─ 1.85E-08 ─ 1.99E-08 ─ 6.38E-09 ─
Phe 4.19E-06 4.99E-06 5.38E-06 1.72E-06
FL 4.27E-06 6.07E-06 5.49E-06 2.09E-06
Pyr 6.34E-06 9.16E-06 8.15E-06 3.16E-06
Flu 1.61E-06 2.61E-06 2.07E-06 8.97E-07
BghiP 1.17E-06 1.43E-06 1.50E-06 4.92E-07
Sum (PAHs) 8.37E-08 5.30E-02 1.05E-07 6.25E-02 1.08E-07 6.81E-02 3.63E-08 2.15E-02
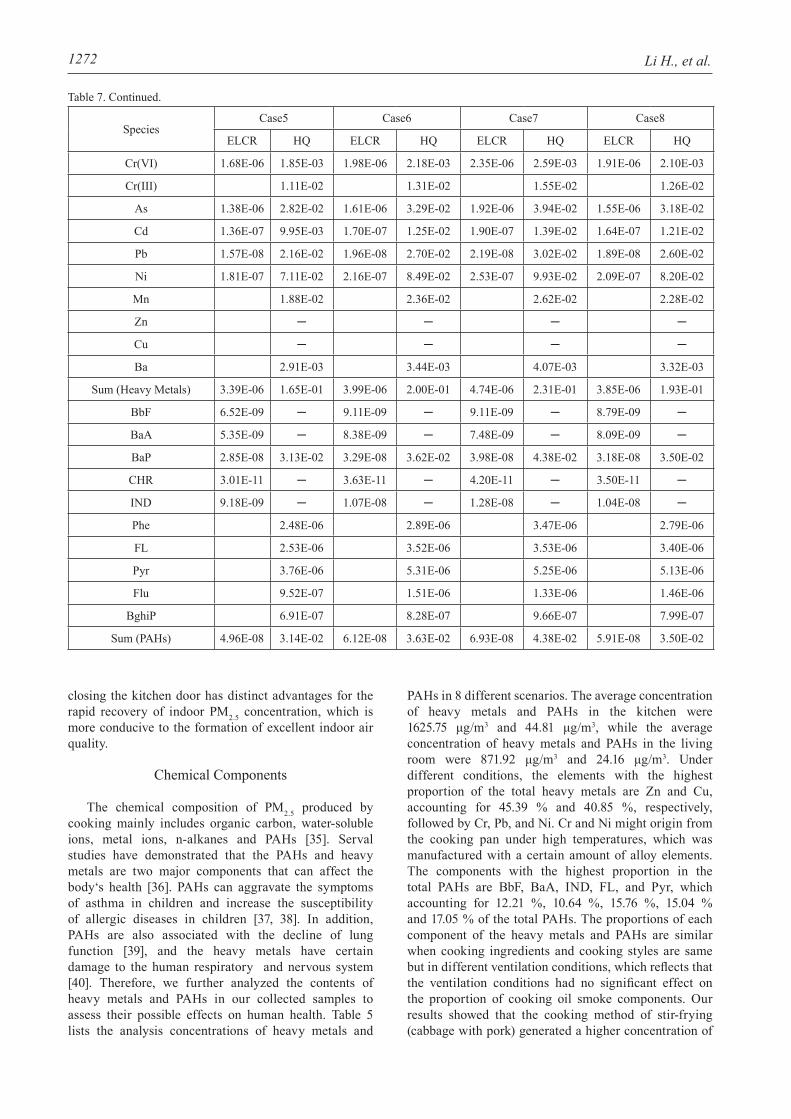
Li H., et al.1272
closing the kitchen door has distinct advantages for the rapid recovery of indoor PM2.5 concentration, which is more conducive to the formation of excellent indoor air quality.
Chemical Components
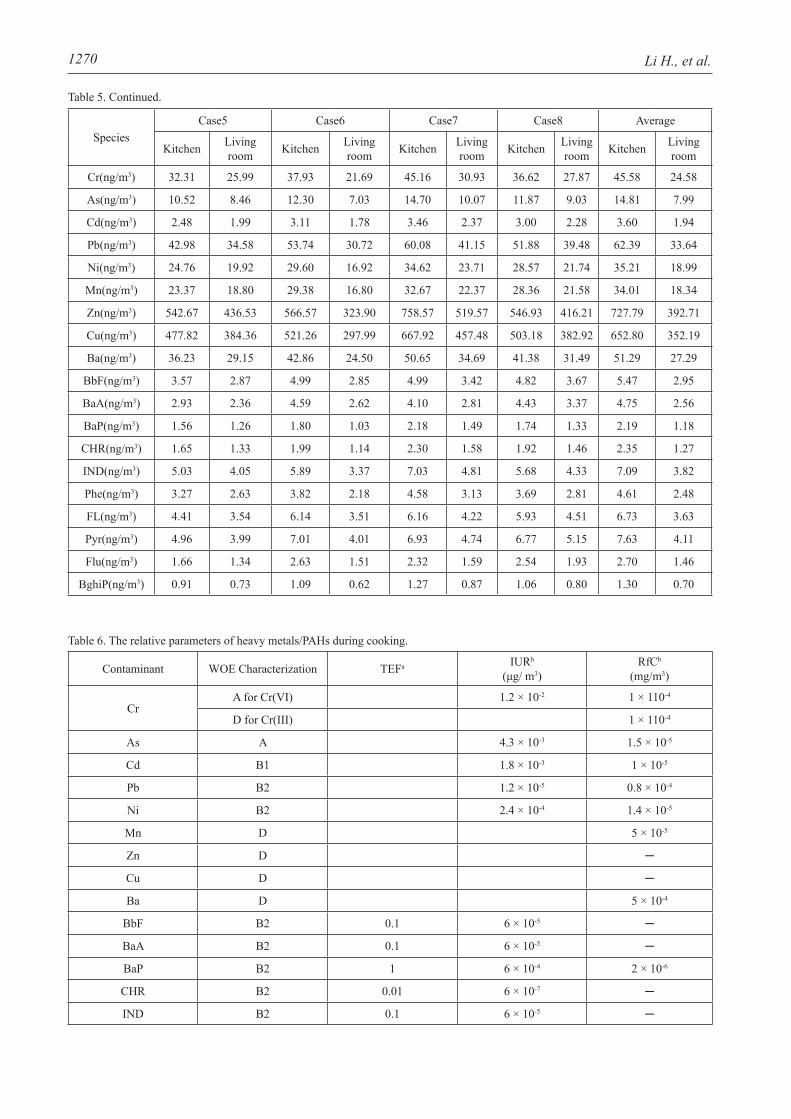
The chemical composition of PM2.5 produced by cooking mainly includes organic carbon, water-soluble ions, metal ions, n-alkanes and PAHs [35]. Serval studies have demonstrated that the PAHs and heavy metals are two major components that can affect the body‘s health [36]. PAHs can aggravate the symptoms of asthma in children and increase the susceptibility of allergic diseases in children [37, 38]. In addition, PAHs are also associated with the decline of lung function [39], and the heavy metals have certain damage to the human respiratory and nervous system [40]. Therefore, we further analyzed the contents of heavy metals and PAHs in our collected samples to assess their possible effects on human health. Table 5 lists the analysis concentrations of heavy metals and
PAHs in 8 different scenarios. The average concentration of heavy metals and PAHs in the kitchen were 1625.75 μg/m3 and 44.81 μg/m3, while the average concentration of heavy metals and PAHs in the living room were 871.92 μg/m3 and 24.16 μg/m3. Under different conditions, the elements with the highest proportion of the total heavy metals are Zn and Cu, accounting for 45.39 % and 40.85 %, respectively, followed by Cr, Pb, and Ni. Cr and Ni might origin from the cooking pan under high temperatures, which was manufactured with a certain amount of alloy elements. The components with the highest proportion in the total PAHs are BbF, BaA, IND, FL, and Pyr, which accounting for 12.21 %, 10.64 %, 15.76 %, 15.04 % and 17.05 % of the total PAHs. The proportions of each component of the heavy metals and PAHs are similar when cooking ingredients and cooking styles are same but in different ventilation conditions, which reflects that the ventilation conditions had no significant effect on the proportion of cooking oil smoke components. Our results showed that the cooking method of stir-frying (cabbage with pork) generated a higher concentration of
SpeciesCase5 Case6 Case7 Case8
ELCR HQ ELCR HQ ELCR HQ ELCR HQ
Cr(VI) 1.68E-06 1.85E-03 1.98E-06 2.18E-03 2.35E-06 2.59E-03 1.91E-06 2.10E-03
Cr(III) 1.11E-02 1.31E-02 1.55E-02 1.26E-02
As 1.38E-06 2.82E-02 1.61E-06 3.29E-02 1.92E-06 3.94E-02 1.55E-06 3.18E-02
Cd 1.36E-07 9.95E-03 1.70E-07 1.25E-02 1.90E-07 1.39E-02 1.64E-07 1.21E-02
Pb 1.57E-08 2.16E-02 1.96E-08 2.70E-02 2.19E-08 3.02E-02 1.89E-08 2.60E-02
Ni 1.81E-07 7.11E-02 2.16E-07 8.49E-02 2.53E-07 9.93E-02 2.09E-07 8.20E-02
Mn 1.88E-02 2.36E-02 2.62E-02 2.28E-02
Zn ─ ─ ─ ─
Cu ─ ─ ─ ─
Ba 2.91E-03 3.44E-03 4.07E-03 3.32E-03
Sum (Heavy Metals) 3.39E-06 1.65E-01 3.99E-06 2.00E-01 4.74E-06 2.31E-01 3.85E-06 1.93E-01
BbF 6.52E-09 ─ 9.11E-09 ─ 9.11E-09 ─ 8.79E-09 ─
BaA 5.35E-09 ─ 8.38E-09 ─ 7.48E-09 ─ 8.09E-09 ─
BaP 2.85E-08 3.13E-02 3.29E-08 3.62E-02 3.98E-08 4.38E-02 3.18E-08 3.50E-02
CHR 3.01E-11 ─ 3.63E-11 ─ 4.20E-11 ─ 3.50E-11 ─
IND 9.18E-09 ─ 1.07E-08 ─ 1.28E-08 ─ 1.04E-08 ─
Phe 2.48E-06 2.89E-06 3.47E-06 2.79E-06
FL 2.53E-06 3.52E-06 3.53E-06 3.40E-06
Pyr 3.76E-06 5.31E-06 5.25E-06 5.13E-06
Flu 9.52E-07 1.51E-06 1.33E-06 1.46E-06
BghiP 6.91E-07 8.28E-07 9.66E-07 7.99E-07
Sum (PAHs) 4.96E-08 3.14E-02 6.12E-08 3.63E-02 6.93E-08 4.38E-02 5.91E-08 3.50E-02
Table 7. Continued.
Chemical Characteristic and Inhalational... 1273
heavy metals, which were 1.5 times higher than that of deep-frying (pan-seared fish). This study also found that the percentages of BbF, BaA, FL, Pyr in PAHs and Cu, Cr, Pb in heavy metals for deep-frying were higher than that of stir-frying, which suggested that high temperature and abundant polyunsaturated fatty acids are associated with the mass production of PAHs [41, 42].
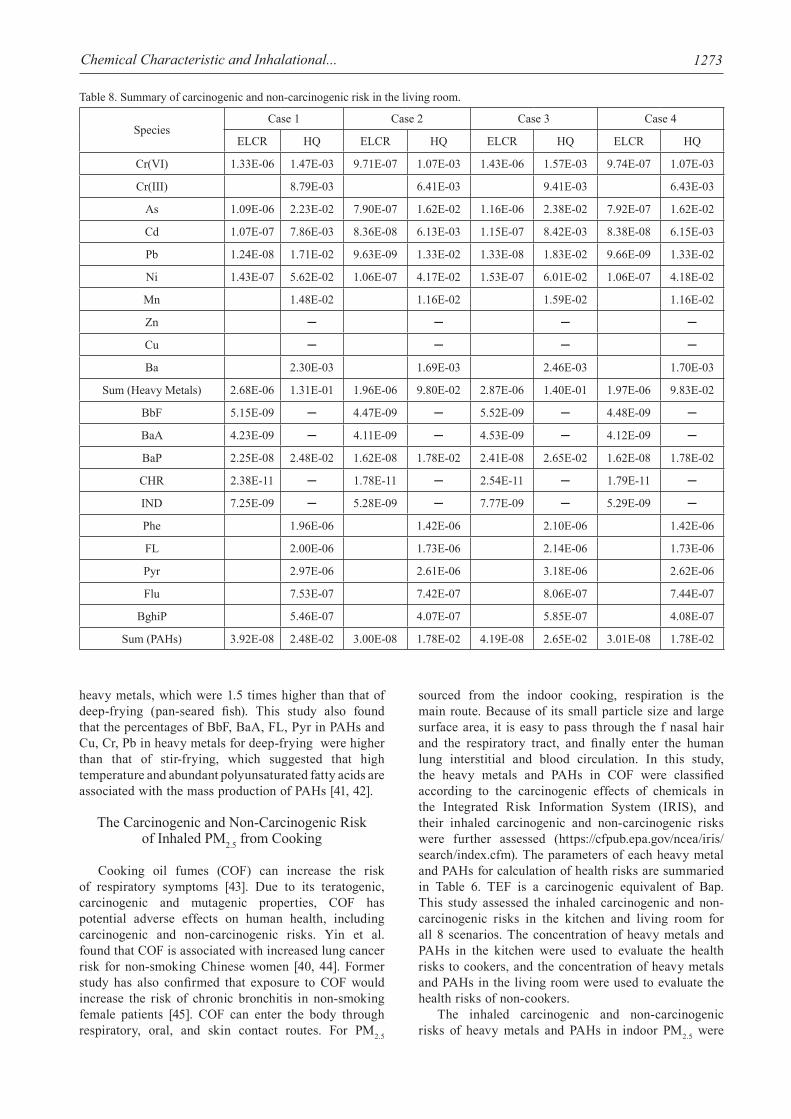
The Carcinogenic and Non-Carcinogenic Risk of Inhaled PM2.5 from Cooking
Cooking oil fumes (COF) can increase the risk of respiratory symptoms [43]. Due to its teratogenic, carcinogenic and mutagenic properties, COF has potential adverse effects on human health, including carcinogenic and non-carcinogenic risks. Yin et al. found that COF is associated with increased lung cancer risk for non-smoking Chinese women [40, 44]. Former study has also confirmed that exposure to COF would increase the risk of chronic bronchitis in non-smoking female patients [45]. COF can enter the body through respiratory, oral, and skin contact routes. For PM2.5
sourced from the indoor cooking, respiration is the main route. Because of its small particle size and large surface area, it is easy to pass through the f nasal hair and the respiratory tract, and finally enter the human lung interstitial and blood circulation. In this study, the heavy metals and PAHs in COF were classified according to the carcinogenic effects of chemicals in the Integrated Risk Information System (IRIS), and their inhaled carcinogenic and non-carcinogenic risks were further assessed (https://cfpub.epa.gov/ncea/iris/search/index.cfm). The parameters of each heavy metal and PAHs for calculation of health risks are summaried in Table 6. TEF is a carcinogenic equivalent of Bap. This study assessed the inhaled carcinogenic and non-carcinogenic risks in the kitchen and living room for all 8 scenarios. The concentration of heavy metals and PAHs in the kitchen were used to evaluate the health risks to cookers, and the concentration of heavy metals and PAHs in the living room were used to evaluate the health risks of non-cookers.
The inhaled carcinogenic and non-carcinogenic risks of heavy metals and PAHs in indoor PM2.5 were
Table 8. Summary of carcinogenic and non-carcinogenic risk in the living room.
SpeciesCase 1 Case 2 Case 3 Case 4
ELCR HQ ELCR HQ ELCR HQ ELCR HQ
Cr(VI) 1.33E-06 1.47E-03 9.71E-07 1.07E-03 1.43E-06 1.57E-03 9.74E-07 1.07E-03
Cr(III) 8.79E-03 6.41E-03 9.41E-03 6.43E-03
As 1.09E-06 2.23E-02 7.90E-07 1.62E-02 1.16E-06 2.38E-02 7.92E-07 1.62E-02
Cd 1.07E-07 7.86E-03 8.36E-08 6.13E-03 1.15E-07 8.42E-03 8.38E-08 6.15E-03
Pb 1.24E-08 1.71E-02 9.63E-09 1.33E-02 1.33E-08 1.83E-02 9.66E-09 1.33E-02
Ni 1.43E-07 5.62E-02 1.06E-07 4.17E-02 1.53E-07 6.01E-02 1.06E-07 4.18E-02
Mn 1.48E-02 1.16E-02 1.59E-02 1.16E-02
Zn ─ ─ ─ ─
Cu ─ ─ ─ ─
Ba 2.30E-03 1.69E-03 2.46E-03 1.70E-03
Sum (Heavy Metals) 2.68E-06 1.31E-01 1.96E-06 9.80E-02 2.87E-06 1.40E-01 1.97E-06 9.83E-02
BbF 5.15E-09 ─ 4.47E-09 ─ 5.52E-09 ─ 4.48E-09 ─
BaA 4.23E-09 ─ 4.11E-09 ─ 4.53E-09 ─ 4.12E-09 ─
BaP 2.25E-08 2.48E-02 1.62E-08 1.78E-02 2.41E-08 2.65E-02 1.62E-08 1.78E-02
CHR 2.38E-11 ─ 1.78E-11 ─ 2.54E-11 ─ 1.79E-11 ─
IND 7.25E-09 ─ 5.28E-09 ─ 7.77E-09 ─ 5.29E-09 ─
Phe 1.96E-06 1.42E-06 2.10E-06 1.42E-06
FL 2.00E-06 1.73E-06 2.14E-06 1.73E-06
Pyr 2.97E-06 2.61E-06 3.18E-06 2.62E-06
Flu 7.53E-07 7.42E-07 8.06E-07 7.44E-07
BghiP 5.46E-07 4.07E-07 5.85E-07 4.08E-07
Sum (PAHs) 3.92E-08 2.48E-02 3.00E-08 1.78E-02 4.19E-08 2.65E-02 3.01E-08 1.78E-02
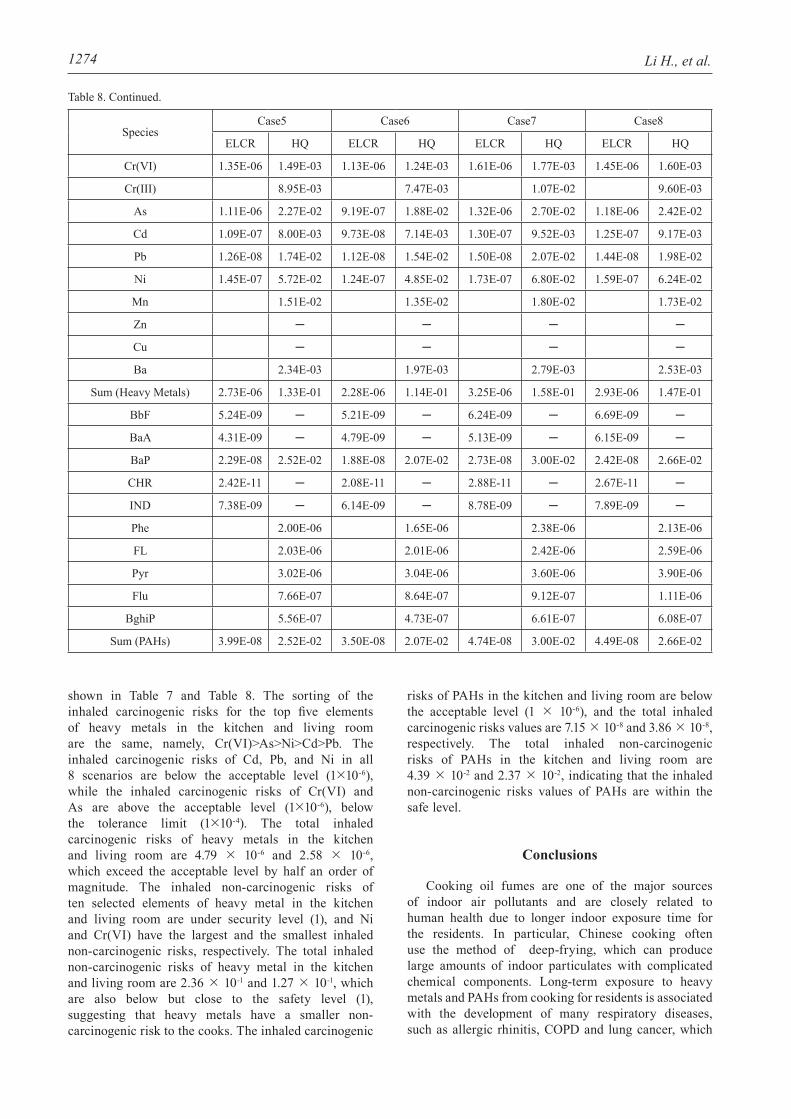
Li H., et al.1274
Table 8. Continued.
shown in Table 7 and Table 8. The sorting of the inhaled carcinogenic risks for the top five elements of heavy metals in the kitchen and living room are the same, namely, Cr(VI)>As>Ni>Cd>Pb. The inhaled carcinogenic risks of Cd, Pb, and Ni in all 8 scenarios are below the acceptable level (110-6),while the inhaled carcinogenic risks of Cr(VI) and As are above the acceptable level (110-6), below the tolerance limit (110-4). The total inhaled carcinogenic risks of heavy metals in the kitchen and living room are 4.79 10-6 and 2.58 10-6,which exceed the acceptable level by half an order of magnitude. The inhaled non-carcinogenic risks of ten selected elements of heavy metal in the kitchen and living room are under security level (1), and Ni and Cr(VI) have the largest and the smallest inhaled non-carcinogenic risks, respectively. The total inhaled non-carcinogenic risks of heavy metal in the kitchen and living room are 2.36 10-1 and 1.27 10-1, which are also below but close to the safety level (1), suggesting that heavy metals have a smaller non-carcinogenic risk to the cooks. The inhaled carcinogenic
risks of PAHs in the kitchen and living room are below the acceptable level (1 10-6), and the total inhaled carcinogenic risks values are 7.15 10-8 and 3.86 10-8,respectively. The total inhaled non-carcinogenic risks of PAHs in the kitchen and living room are 4.39 10-2 and 2.37 10-2, indicating that the inhaled non-carcinogenic risks values of PAHs are within the safe level.
Conclusions
Cooking oil fumes are one of the major sources of indoor air pollutants and are closely related to human health due to longer indoor exposure time for the residents. In particular, Chinese cooking often use the method of deep-frying, which can produce large amounts of indoor particulates with complicated chemical components. Long-term exposure to heavy metals and PAHs from cooking for residents is associated with the development of many respiratory diseases, such as allergic rhinitis, COPD and lung cancer, which
SpeciesCase5 Case6 Case7 Case8
ELCR HQ ELCR HQ ELCR HQ ELCR HQ
Cr(VI) 1.35E-06 1.49E-03 1.13E-06 1.24E-03 1.61E-06 1.77E-03 1.45E-06 1.60E-03
Cr(III) 8.95E-03 7.47E-03 1.07E-02 9.60E-03
As 1.11E-06 2.27E-02 9.19E-07 1.88E-02 1.32E-06 2.70E-02 1.18E-06 2.42E-02
Cd 1.09E-07 8.00E-03 9.73E-08 7.14E-03 1.30E-07 9.52E-03 1.25E-07 9.17E-03
Pb 1.26E-08 1.74E-02 1.12E-08 1.54E-02 1.50E-08 2.07E-02 1.44E-08 1.98E-02
Ni 1.45E-07 5.72E-02 1.24E-07 4.85E-02 1.73E-07 6.80E-02 1.59E-07 6.24E-02
Mn 1.51E-02 1.35E-02 1.80E-02 1.73E-02
Zn ─ ─ ─ ─
Cu ─ ─ ─ ─
Ba 2.34E-03 1.97E-03 2.79E-03 2.53E-03
Sum (Heavy Metals) 2.73E-06 1.33E-01 2.28E-06 1.14E-01 3.25E-06 1.58E-01 2.93E-06 1.47E-01
BbF 5.24E-09 ─ 5.21E-09 ─ 6.24E-09 ─ 6.69E-09 ─
BaA 4.31E-09 ─ 4.79E-09 ─ 5.13E-09 ─ 6.15E-09 ─
BaP 2.29E-08 2.52E-02 1.88E-08 2.07E-02 2.73E-08 3.00E-02 2.42E-08 2.66E-02
CHR 2.42E-11 ─ 2.08E-11 ─ 2.88E-11 ─ 2.67E-11 ─
IND 7.38E-09 ─ 6.14E-09 ─ 8.78E-09 ─ 7.89E-09 ─
Phe 2.00E-06 1.65E-06 2.38E-06 2.13E-06
FL 2.03E-06 2.01E-06 2.42E-06 2.59E-06
Pyr 3.02E-06 3.04E-06 3.60E-06 3.90E-06
Flu 7.66E-07 8.64E-07 9.12E-07 1.11E-06
BghiP 5.56E-07 4.73E-07 6.61E-07 6.08E-07
Sum (PAHs) 3.99E-08 2.52E-02 3.50E-08 2.07E-02 4.74E-08 3.00E-02 4.49E-08 2.66E-02
Chemical Characteristic and Inhalational... 1275
have decreased the life expectancy of people. This study investigates the concentration variations and chemical composition of indoor PM2.5 based on two cooking styles (stir-frying and deep-frying) combined with four ventilation conditions during cooking in Northeastern China, and the carcinogenic and non-carcinogenic risks of heavy metals and PAHs in cooking emitted aerosols were also evaluated. The results showed that closing the kitchen door can effectively block most of the fumes produced by deep-frying, and can significantly reduce the carcinogenic and non-carcinogenic risks of residents. But it has a less blocking effect on the smoke produced by stir-frying, as more fine aqueous particles are generated via water vapor condensation, and which are easier to diffusion from the kitchen to living room. Ventilation through convective windows can remove cooking fumes better than enabling the fresh air system, which is more beneficial to the health of residents. This study provided quantitative evidence that cooking-generated heavy metals have a potential adverse effect on human health. Therefore, avoiding deep-frying, ventilation through a window or using the fresh air system in winter, and closing the kitchen door are highly recommended measurements to control the indoor air pollutions generated by cooking in Northeastern China.
Acknowledgements
This work was supported by the National Natural Science Foundation of China (Grant No. 51772124, 41771071), National key R&D Plan of China (No. 2017YFC0212304),135 Breading Project of Chinese Academy of Sciences (Northeast Institute of Geography and Agroecology No. Y6H2081001) and grants from the Science and Technology Department of Jilin Province (No.20180414083GH).
Conflict of Interest
The authors declare no conflict of interest.
References
1. CHEN P., WANG T., XIE X., TANG L., XU S., WANG J. Source apportionment of fine particles based on combined numerical model and receptor model. Chinese Science Bulletin, 63 (18), 1829, 2018.
2. FRANCK U., HERBARTH O., RöDER S., SCHLINK U., BORTE M., DIEZ U., KRäMER U., LEHMANN I. Respiratory effects of indoor particles in young children are size dependent. The Science of the total environment, 409 (9), 1621, 2011.
3. KLEPEIS N.E., NELSON W.C., OTT W.R., ROBINSON J.P., TSANG A.M., SWITZER P., BEHAR J.V., HERN S.C., ENGELMANN W.H. The National Human Activity Pattern Survey (NHAPS): a resource for assessing exposure to environmental pollutants. Journal of exposure
analysis and environmental epidemiology, 11 (3), 231, 2001.
4. KHAMUTIAN R., NAJAFI F., SOLTANIAN M., SHOKOOHIZADEH, M.J., POORHAGHIGHAT, S., DARGAHI A., SHARAFI K., AFSHARI A. The association between air pollution and weather conditions with increase in the number of admissions of asthmatic patients in emergency wards: a case study in Kermanshah. Medical journal of the Islamic Republic of Iran, 29, 229, 2015.
5. KHAMUTIAN R., DARGAHI A., SOLTANIAN M., NAJAFI F., AFSHAR A. The relationship of air pollution and asthma patients admitted to hospitals in Kermanshah (2008-2009). Journal of KERMANSHAH University of Medical Sciences, 18 (10), 586, 2015.
6. TENG B., ZHANG X., YI C., ZHANG Y., YE S., WANG Y., TONG D., LU B. The association between ambient air pollution and allergic rhinitis: further epidemiological evidence from Changchun, Northeastern China. International journal of environmental research and public health, 14 (3), 226, 2017.
7. ZHANG X., ZHAO L., TONG D.Q., WU G., DAN M., TENG B. A systematic review of global desert dust and associated human health effects. Atmosphere, 7 (12), 158, 2016.
8. BREYSSE P.N., DIETTE G.B., MATSUI E.C., BUTZ A.M., HANSEL N.N., MCCORMACK M.C. Indoor air pollution and asthma in children. Proceedings of the American Thoracic Society, 7 (2), 102, 2010.
9. MCGWIN G., LIENERT J., KENNEDY J.I. Formaldehyde exposure and asthma in children: a systematic review. Environmental health perspectives, 118 (3), 313, 2010.
10. ASSAD N.A., BALMES J., MEHTA S., CHEEMA U., SOOD A. Chronic obstructive pulmonary disease secondary to household air pollution. In Seminars in respiratory and critical care medicine, Publisher: Thieme Medical Publishers, 36 (03), 408, 2015.
11. HANSEL N.N., MCCORMACK M.C., BELLI A.J., MATSUI E.C., PENG R.D., ALOE C., PAULIN L., WILLIAMS D.L., DIETTE G.B., BREYSSE P.N. In-home air pollution is linked to respiratory morbidity in former smokers with chronic obstructive pulmonary disease(Article). American journal of respiratory and critical care medicine, 187 (10), 1085, 2013.
12. KUMAR R., NAGAR J.K., GOEL N., KUMAR P., KUSHWAH A.S., GAUR S.N. Indoor air pollution and asthma in children at Delhi, India. Pneumonologia i alergologia polska, 83 (4), 275, 2015.
13. PARK H.K., CHENG K.C., TETTEH A.O., HILDEMANN L.M., NADEAU K.C. Effectiveness of air purifier on health outcomes and indoor particles in homes of children with allergic diseases in Fresno, California: A pilot study. The Journal of asthma: official journal of the Association for the Care of Asthma, 54 (4), 341, 2017.
14. SAITO E., TANAKA N., MIYAZAKI A., TSUZAKI M. Concentration and particle size distribution of polycyclic aromatic hydrocarbons formed by thermal cooking. Food chemistry, 153, 285, 2014.
15. HAMRA G.B., GUHA N., COHEN A., LADEN F., RAASCHOU-NIELSED O., SAMET M.J., VINEIS P., FORASTIERE F., SALDIVA P., YORIFUJI T., LOOMIS D. Outdoor particulate matter exposure and lung cancer: a systematic review and meta-analysis. Environmental health perspectives, 122 (9), 906, 2014.
16. JAIMINI U., BANERGEE T., ROMINE W., THIRUNARAYAN K., SHETH A., KALRA M.
Li H., et al.1276
Investigation of an indoor air quality sensor for asthma management in children. IEEE sensors letters, 1 (2), 1, 2017.
17. GONZALEZ A., BOIES A., SWANSON J., KITTELSON D. Measuring the effect of ventilation on cooking in indoor air quality by low-cost air sensors. International journal of environmental and ecological engineering, 13 (9), 568, 2019.
18. LAI A., HO Y. Spatial concentration variation of cooking-emitted particles in a residential kitchen. Building Environment, 43, 871, 2008.
19. ABT E., SUH H., ALLEN G., KOUTRAKIS P. Characterization of indoor particle sources: a study conducted in the metropolitan Boston area. Environmental health perspectives. 108, 35, 2000.
20. ABDEL-SALAM M.M. Investigation of PM2.5 and carbon dioxide levels in urban homes. Journal of the Air & Waste Management Association, 65 (8), 930, 2015.
21. KEARNEY J., WALLACE L., MACNEILL M., XU X., VANRYSWYK K., YOU H., KULKA R., WHEELER A.J. Residential indoor and outdoor ultrafine particles in Windsor, Ontario. Atmospheric environment, 45 (40), 7583, 2011.
22. FAN J., LI S., FAN C., BAI Z., YANG K. The impact of PM2.5 on asthma emergency department visits: a systematic review and meta-analysis. Environmental science and pollution research international, 23 (1), 843, 2016.
23. LI T., CAO S., FAN D., ZHANG Y., WANG B., ZHAO X., LEADERER B.P., SHEN G., ZHANG Y., DUAN X. Household concentrations and personal exposure of PM2.5 among urban residents using different cooking fuels. The Science of the total environment, 548, 6, 2016.
24. LI S., GAO J., HE Y., CAO L., LI A., MO S., CHEN Y., CAO Y. Determination of time- and size-dependent fine particle emission with varied oil heating in an experimental kitchen. Journal of environmental sciences (China), 51 (1), 157 2017.
25. LEE T., GANY F. Cooking oil fumes and lung cancer: a review of the literature in the context of the U.S. population. Journal of immigrant and minority health, 15 (3), 646, 2013.
26. ZHAO Y., HU M., SLANINA S., ZHANG Y. Chemical compositions of fine particulate organic matter emitted from Chinese cooking. Environmental science & technology, 41 (1), 99, 2007.
27. LEE S.C., LI W.M., CHAN L.Y. Indoor air quality at restaurants with different styles of cooking in metropolitan Hong Kong. The Science of the total environment, 279 (1-3), 181, 2001.
28. US EPA O.O.S.W.E.R., ASSESSMENT W.A.C.R. Risk Assessment Guidance for Superfund (RAGS), Volume I: Human Health Evaluation Manual (Part E, Supplemental Guidance for Dermal Risk Assessment) Interim, 2009.
29. ZHOU J., JIAN Z., HAN B., BAI Z., YOU Y., ZHANG J., NIU C., LIU Y., ZHANG N., HE F., DING X., LU B,. HU Y. Particle Exposure Assessment for Community Elderly (PEACE) in Tianjin, China: Mass concentration relationships. Atmospheric environment, 49, 77, 2012.
30. CHEN J.W., WANG S.L., HSIEH D.P., YANG H.H., LEE H.L. Carcinogenic potencies of polycyclic aromatic hydrocarbons for back-door neighbors of restaurants with cooking emissions. The Science of the total environment, 68, 417, 2012.
31. US EPA NATIONAL CENTER FOR ENVIRONMENTAL ASSESSMENT W.D.C., ANALYSIS E., GROUP R.C., MOYA J. Exposure Factors Handbook, 1997.
32. LICINA D., MELIKOV A., PANTELIC J., SEKHAR C., THAM K.W. Human convection flow in spaces with and without ventilation: personal exposure to floor-released particles and cough-released droplets. Indoor air, 25 (6), 672, 2015.
33. POON C., WALLACE L., LAI A.C.K. Experimental study of exposure to cooking emitted particles under single zone and two-zone environments. Building & Environment, 104, 122, 2016.
34. JUNTARAWIJIT C., JUNTARAWIJIT Y. Cooking smoke and respiratory symptoms of restaurant workers in Thailand. BMC pulmonary medicine, 17 (1), 41, 2017.
35. HASSANVAND M.S., NADDAFI K., FARIDI S., NABIZADEH R., SOWAT M.H., MOMEHIHA F., GHOLAMPOUR A., ARHAMI M., KASHANI H., ZARE A., NIAZI S., RASTKARI N., NAZMARA S., GHANI M., YUNESIAN M. Characterization of PAHs and metals in indoor/outdoor PM10/PM2.5/PM1 in a retirement home and a school dormitory. The Science of the total environment, 527, 100, 2015.
36. KARIMI P., PETERS K.O., BIDAD K., STRICKLAND P.T. Polycyclic aromatic hydrocarbons and childhood asthma. European journal of epidemiology, 30 (2), 91, 2015.
37. JERZYNSKA J., PODLECKA D., POLANSKA K., HANKE W., STELMACH I., STELMACH W. Prenatal and postnatal exposure to polycyclic aromatic hydrocarbons and allergy symptoms in city children. ALLERGOLOGIA ET IMMUNOPATHOLOGIA, 45 (1), 18, 2017.
38. SINGH A., NAIR C.K., KAMAL R., BIHARI V., GUPTA M.K., MUDIAM M.K.R., SATYANARAYANA G.N.V., RAJ A., HAQ I., SHUKLA N.K., KHAN A.H., SRIVASTAVA A.K. Assessing hazardous risks of indoor airborne polycyclic aromatic hydrocarbons in the kitchen and its association with lung functions and urinary PAH metabolites in kitchen workers. Clinica chimica acta; international journal of clinical chemistry, 452, 204, 2016.
39. FANG G.C., HUANG Y.L., HUANG J.H. Study of atmospheric metallic elements pollution in Asia during 2000-2007. Journal of hazardous materials, 180 (1-3), 115, 2010.
40. YIN Z., CUI Z., REN Y., ZHANG H., YAN Y., ZHAO Y., MA R., WANG Q., HE Q., ZHOU B. Genetic polymorphisms of TERT and CLPTM1L, cooking oil fume exposure, and risk of lung cancer: A case-control study in a Chinese non-smoking female population(Article). Medical oncology, 31 (8), 114, 2014.
41. CHEN B.H., CHEN Y.C. Formation of polycyclic aromatic hydrocarbons in the smoke from heated model lipids and food lipids. Journal of agricultural and food chemistry, 49 (11), 5238, 2001.
42. URIARTE P.S. Formation of toxic alkylbenzenes in edible oils submitted to frying temperature: Influence of oil composition in main components and heating time. Food research international, 43 (8), 2161, 2010.
43. ZHANG N., HAN B., HE F., XU J., ZHAO R., ZHANG Y., BAI Z. Chemical characteristic of PM2.5 emission and inhalational carcinogenic risk of domestic Chinese cooking. Environmental pollution, 227, 24, 2017.
44. YIN Z.H., CUI Z.G., REN Y.W., SU M., ZHOU B.S. TP63 Gene Polymorphisms, Cooking Oil Fume Exposure and Risk of Lung Adenocarcinoma in Chinese Non-smoking Females. Asian Pacific Journal of Cancer Prevention Apjcp, 14 (11), 6519, 2013.
45. CHEN H.C., WU C.F., CHONG I.W., WU M.T. Exposure to cooking oil fumes and chronic bronchitis in nonsmoking

Chemical Characteristic and Inhalational... 1277
women aged 40 years and over: a health-care based study. BMC public health, 18 (1), 246, 2018.
46. NISBET I.C., LAGOY P.K. Toxic equivalency factors (TEFs) for polycyclic aromatic hydrocarbons (PAHs).
Regulatory toxicology and pharmacology: RTP, 16 (3), 290, 1992.
47. EMERGENCY E.P.A.O.O., RESPONSE. R. Risk assessment guidance for superfund. 804 (7), 636, 1989.

Related Documents