ORIGINAL PAPER Use of Orange Peel Waste for Arsenic Remediation of Drinking Water Mazhar I. Khaskheli • Saima Q. Memon • Ali N. Siyal • M. Y. Khuhawar Received: 17 January 2011 / Accepted: 25 June 2011 / Published online: 12 July 2011 Ó Springer Science+Business Media B.V. 2011 Abstract Arsenic is a toxic element and is found in natural waters throughout the globe. The purpose of present study is to demonstrate the As (V) uptake by orange peel from real ground water samples through adsorption. Dif- ferent parameters such as pH, shaking speed, contact time, adsorbent dosage, concentration, volume and temperature etc, were optimized. The maximum uptake capacity was observed at pH-7. The sorption was found to be time dependent and the kinetics followed well by the Morris- weber, Pseudo second order and Elovich equations. The Freundlich, Langmuir, Dubinin Redushkevich and Flory– Huggins isotherm were used to model the adsorption behavior of arsenic retention. Thermodynamic parameters calculated from these isotherms show that the adsorption was spontaneous and endothermic in nature. Orange peel was found to be effective (*85%) for arsenic removal from real water systems containing concomitant ions. Keywords Arsenic removal Orange peel Biosorption Isotherm modeling Kinetics of biosorption Introduction The shortage of drinking water is increasing continuously in the world. It is estimated that approximately one-third of the world’s population use ground water for drinking purposes [1]. Heavy metal especially arsenic contaminated drinking water has been emerging as a problematic issue around the globe. Arsenic, one of the world’s most haz- ardous chemical, is found to exist within the shallow zones of ground water of many countries like Argentina (3,810 lgl -1 ), Bangladesh (1,000 lgl -1 ), India (3,700 lg l -1 ), Pakistan (Muzaffargarh 906 lgl -1 ), Mexico, Mon- golia, Germany, Thailand, China, Chile, USA, Canada, Hungry (5,800 lgl -1 ), Romania, Vietnam, Nepal, Myan- mar, Cambodia, etc in various concentrations [2]. The arsenic contamination has been acknowledged as a ‘‘major public health issue’’ (WHO 1999). Arsenic classified as a group A and category 1 human carcinogen by the US Environmental Protection Agency (US EPA 1997) and the International Association For Research on Cancer (IARC 2004), respectively [3]. Arsenic exists in numerous oxidation states from -3, 0, ?3 and ?5[2, 4]. Two forms are common in natural waters: arsenite (AsO 3 -3 ) and arsenate (AsO 4 -3 ), referred to as arsenic (III) and arsenic (V). Pentavalent inorganic arsenic compounds predominate and are stable in oxygen rich aerobic environments. Trivalent arsenates pre- dominate in moderately reducing anaerobic environments such as deep ground water [5]. Long term drinking water exposure causes skin, lungs, bladder, kidney cancer as well as pigmentation changes, skin thickening (hyperkeratosis), neurological disorders, muscular weakness, loss of appetite, and nausea [6, 7]. This differs from acute poisoning, which typically causes vomiting, esophageal and abdominal pain, and bloody ‘‘rice water’’ diarrhea[8, 9] First case of drinking water arsenic poisoning was reported in Taiwan in 1968 [2]. M. I. Khaskheli S. Q. Memon (&) M. Y. Khuhawar Institute of Advance Research Studies in Chemical Sciences, University of Sindh, Jamshoro, Pakistan e-mail: [email protected] M. I. Khaskheli e-mail: [email protected] A. N. Siyal M.A. Kazi Institute of Chemistry, University of Sindh, Jamshoro, Pakistan e-mail: [email protected] 123 Waste Biomass Valor (2011) 2:423–433 DOI 10.1007/s12649-011-9081-7

Welcome message from author
This document is posted to help you gain knowledge. Please leave a comment to let me know what you think about it! Share it to your friends and learn new things together.
Transcript
ORIGINAL PAPER
Use of Orange Peel Waste for Arsenic Remediationof Drinking Water
Mazhar I. Khaskheli • Saima Q. Memon •
Ali N. Siyal • M. Y. Khuhawar
Received: 17 January 2011 / Accepted: 25 June 2011 / Published online: 12 July 2011
� Springer Science+Business Media B.V. 2011
Abstract Arsenic is a toxic element and is found in
natural waters throughout the globe. The purpose of present
study is to demonstrate the As (V) uptake by orange peel
from real ground water samples through adsorption. Dif-
ferent parameters such as pH, shaking speed, contact time,
adsorbent dosage, concentration, volume and temperature
etc, were optimized. The maximum uptake capacity was
observed at pH-7. The sorption was found to be time
dependent and the kinetics followed well by the Morris-
weber, Pseudo second order and Elovich equations. The
Freundlich, Langmuir, Dubinin Redushkevich and Flory–
Huggins isotherm were used to model the adsorption
behavior of arsenic retention. Thermodynamic parameters
calculated from these isotherms show that the adsorption
was spontaneous and endothermic in nature. Orange peel
was found to be effective (*85%) for arsenic removal
from real water systems containing concomitant ions.
Keywords Arsenic removal � Orange peel � Biosorption �Isotherm modeling � Kinetics of biosorption
Introduction
The shortage of drinking water is increasing continuously
in the world. It is estimated that approximately one-third of
the world’s population use ground water for drinking
purposes [1]. Heavy metal especially arsenic contaminated
drinking water has been emerging as a problematic issue
around the globe. Arsenic, one of the world’s most haz-
ardous chemical, is found to exist within the shallow zones
of ground water of many countries like Argentina
(3,810 lg l-1), Bangladesh (1,000 lg l-1), India (3,700 lg
l-1), Pakistan (Muzaffargarh 906 lg l-1), Mexico, Mon-
golia, Germany, Thailand, China, Chile, USA, Canada,
Hungry (5,800 lg l-1), Romania, Vietnam, Nepal, Myan-
mar, Cambodia, etc in various concentrations [2].
The arsenic contamination has been acknowledged as a
‘‘major public health issue’’ (WHO 1999). Arsenic classified
as a group A and category 1 human carcinogen by the US
Environmental Protection Agency (US EPA 1997) and the
International Association For Research on Cancer (IARC
2004), respectively [3]. Arsenic exists in numerous oxidation
states from -3, 0, ?3 and ?5 [2, 4]. Two forms are common
in natural waters: arsenite (AsO3-3) and arsenate (AsO4
-3),
referred to as arsenic (III) and arsenic (V). Pentavalent
inorganic arsenic compounds predominate and are stable in
oxygen rich aerobic environments. Trivalent arsenates pre-
dominate in moderately reducing anaerobic environments
such as deep ground water [5]. Long term drinking water
exposure causes skin, lungs, bladder, kidney cancer as well
as pigmentation changes, skin thickening (hyperkeratosis),
neurological disorders, muscular weakness, loss of appetite,
and nausea [6, 7]. This differs from acute poisoning, which
typically causes vomiting, esophageal and abdominal pain,
and bloody ‘‘rice water’’ diarrhea[8, 9] First case of drinking
water arsenic poisoning was reported in Taiwan in 1968 [2].
M. I. Khaskheli � S. Q. Memon (&) � M. Y. Khuhawar
Institute of Advance Research Studies in Chemical Sciences,
University of Sindh, Jamshoro, Pakistan
e-mail: [email protected]
M. I. Khaskheli
e-mail: [email protected]
A. N. Siyal
M.A. Kazi Institute of Chemistry, University of Sindh,
Jamshoro, Pakistan
e-mail: [email protected]
123
Waste Biomass Valor (2011) 2:423–433
DOI 10.1007/s12649-011-9081-7
The maximum contaminant level (MCL) of arsenic has been
reduced to 10 and 7 lg l-1 by European Commission and
National Health & Medical Research committee (NHMRC)
of Australia respectively [2].
Viewing the grim situation of arsenic contaminated
drinking water, many techniques such as physio-chemical
techniques (adsorption, ion exchange, precipitation, coagu-
lation, membrane filtration, permeable reactive methods),
and biological techniques (phytoremediation biological
treatment with living microbes/bio-filtration) have been used
[2]. Among all these techniques adsorption has become
known as a cost effective and environmental friendly alter-
native. Various low cost adsorbents have been used for the
removal of arsenic such as, methylated yeast biomass [10],
iron oxide coated fungal biomass [11], residue rice polish
[12], modified fungal biomass [13], acid-washed crab shells
[14], modified cotton cellulose [15], modified coconut coir
pith [16], bone char [17], chemically modified saw dust of
spruce (Picea abies) [18], shrimp shells [19], HDTMA-
modified zeolite [20], surfactant-modified zeolite [21] and
iron-coated zeolite [22]. Many of these materials need some
type of physical or chemical treatment and do not state
effectiveness of adsorbent at very low concentrations.
Therefore, in present study we aim to develop a cost effective
and locally available biosorbent orange peel (family Ruta-
ceae, genus Citrus, specie aurantium, and botanical name
citrus sinesis) commonly known as bitter orange without any
modification to reduce the concentration of arsenic to below
the acceptable value for drinking water. Orange peel has
been used to remove arsenic from real samples in order to
check its practical applicability.
Experimental
Reagents and Equipments
Stock solution (1,000 mg l-1, of As (V) was prepared by
dissolving arsenic Na3AsO4. 12 H2O, (Merck, Germany) in
de-ionized water. Working solutions for experiment were
freshly prepared from the stock solution. For adjusting the
pH buffers of acetic acid, sodium acetate, potassium
chloride, hydrochloric acid and sodium hydroxide were
used. Reducing agent for arsenic was prepared by mixing
the NaBH4 (0.2% w/v) in NaOH (0.05% w/v). All reagents
used were of analytical grade or equivalent.
All pH measurements were carried out at Thermo Sci-
entific Orion 5 Star (pH. ISE. Cond. DO Benchtop,
8102BNUWP; made in USA) PH-meter. Shaking Incubator
Model 1-40000 Irmeco GmbH (Geesthacht/Germany) were
used for batch adsorption experiments. Atomic Absorption
Spectrometer (Analyst 800, Perkin Elmer, USA) connected
with Flow Injection System for hydride generation (FIAS
100 Perkin Elmer, USA) were used to measure concentration
of arsenic. AAS was equipped with a hallow cathode lamp
having current mA 18, wavelength nm 193.7, energy 40,
band width 0.7 nm (made in Singapore) and Quartz Tube
Atomizer (Universal QAT, part number B300-0350, USA)
were used.
Adsorbent: Collection and Preparation
Orange peels were collected from fresh fruit juice sellers of
local market, Hyderabad Sindh, Pakistan. Peels were
washed several times with de-ionized water in order to
remove adherent dirt particle and air dried peels were kept
in incubator at 60�C for 6 h. Dried and grinded peels were
passed through electrical sieve shaker (100 mesh). COD
(chemical oxygen demand) and pH of effluent was moni-
tored. Initially it was observed that COD was greater than
the WHO recommended level therefore the adsorbent were
washed many times till the effluent became colorless and
its COD became within the range of WHO recommended
safe limit. Washed adorbent was air dried and kept in an
incubator at 60�C for 24 h.
Characterization of Adsorbent (EDX and FTIR)
Orange peel was characterized by FTIR as well EDX. For
EDX analysis BRUKER X-FLASH 4010 133 eV Germany
was used. Orange peel was analyzed for detection of sur-
face elements, before and after arsenic adsorption. EDX
showed the presence of carbon, oxygen, sodium, aluminum
and calcium on the surface of orange peel. A small peak of
arsenic appears on peel after its adsorption onto the surface
confirming the presence of arsenic on the surface.
FT-IR- Interpretation
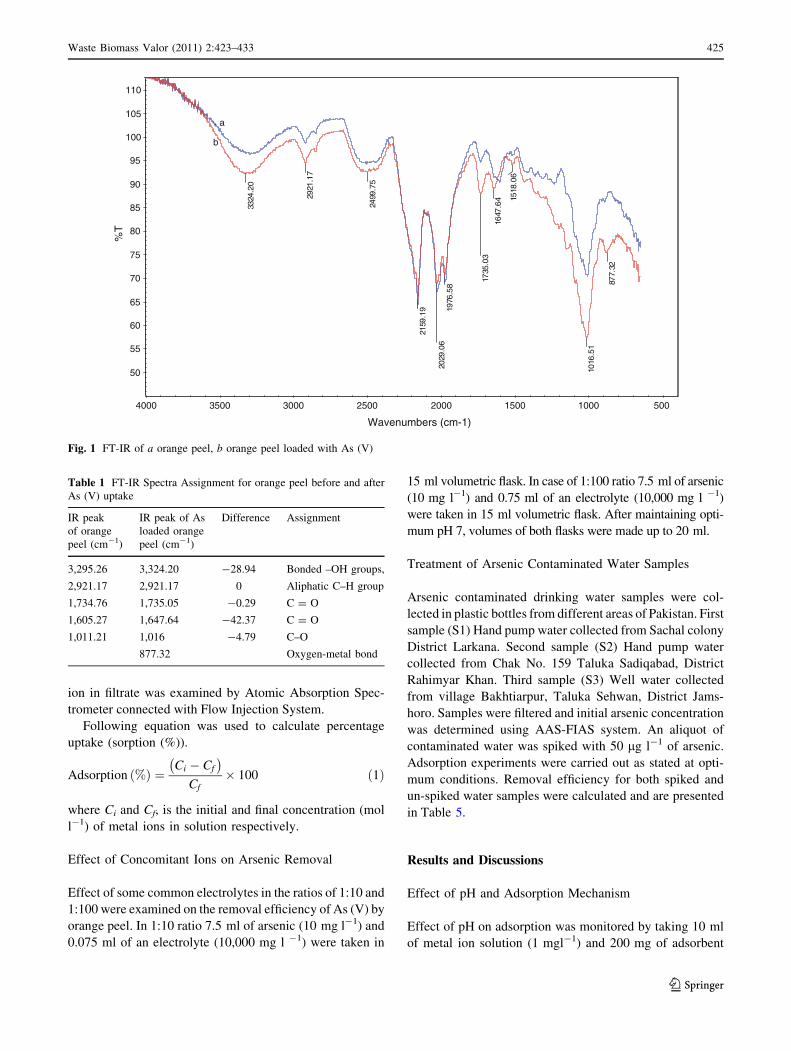
The FTIR analysis of dried orange peel before and after As
(V) adsorption is given in Fig. 1. Assignment of spectra in
Fig. 1 is listed in Table 1. Analysis of FTIR spectrum after
As (V) adsorption showed there was a major shift on 28.94
and -42.37 cm-1 in absorption wave number of peaks at
3,295.26 and 1,605.27 cm-1 respectively indicative of a
fact that these groups play a role in biosorption process. As
(V) loaded orange peel show a small peak at 877.32 cm -1
may attributed to the metal oxygen bond [23].
Batch Equilibrium Studies of Adsorption of As (V)
The metal adsorption behavior of orange peel adsorbent was
investigated using batch equilibrium experiments. The vol-
ume (20 ml) of arsenic (0.01–50 mg l-1), pH (7), adsorbent
(200 mg) was agitated (100 rpm) at temperature (25�C) for
2 h. The adsorbent was filtered and concentration of metal
424 Waste Biomass Valor (2011) 2:423–433
123
ion in filtrate was examined by Atomic Absorption Spec-
trometer connected with Flow Injection System.
Following equation was used to calculate percentage
uptake (sorption (%)).
Adsorption ð%Þ ¼Ci � Cf
� �
Cf� 100 ð1Þ
where Ci and Cf, is the initial and final concentration (mol
l-1) of metal ions in solution respectively.
Effect of Concomitant Ions on Arsenic Removal
Effect of some common electrolytes in the ratios of 1:10 and
1:100 were examined on the removal efficiency of As (V) by
orange peel. In 1:10 ratio 7.5 ml of arsenic (10 mg l-1) and
0.075 ml of an electrolyte (10,000 mg l -1) were taken in
15 ml volumetric flask. In case of 1:100 ratio 7.5 ml of arsenic
(10 mg l-1) and 0.75 ml of an electrolyte (10,000 mg l -1)
were taken in 15 ml volumetric flask. After maintaining opti-
mum pH 7, volumes of both flasks were made up to 20 ml.
Treatment of Arsenic Contaminated Water Samples
Arsenic contaminated drinking water samples were col-
lected in plastic bottles from different areas of Pakistan. First
sample (S1) Hand pump water collected from Sachal colony
District Larkana. Second sample (S2) Hand pump water
collected from Chak No. 159 Taluka Sadiqabad, District
Rahimyar Khan. Third sample (S3) Well water collected
from village Bakhtiarpur, Taluka Sehwan, District Jams-
horo. Samples were filtered and initial arsenic concentration
was determined using AAS-FIAS system. An aliquot of
contaminated water was spiked with 50 lg l-1 of arsenic.
Adsorption experiments were carried out as stated at opti-
mum conditions. Removal efficiency for both spiked and
un-spiked water samples were calculated and are presented
in Table 5.
Results and Discussions
Effect of pH and Adsorption Mechanism
Effect of pH on adsorption was monitored by taking 10 ml
of metal ion solution (1 mgl-1) and 200 mg of adsorbent
877.
32
1016
.51
1518
.06
1647
.64
1735
.03
1976
.58
2029
.06
2159
.19
2499
.75
2921
.17
3324
.20
50
55
60
65
70
75
80
85
90
95
100
105
110
a
b
%T
500 1000 1500 2000 2500 3000 3500 4000
Wavenumbers (cm-1)
Fig. 1 FT-IR of a orange peel, b orange peel loaded with As (V)
Table 1 FT-IR Spectra Assignment for orange peel before and after
As (V) uptake
IR peak
of orange
peel (cm-1)
IR peak of As
loaded orange
peel (cm-1)
Difference Assignment
3,295.26 3,324.20 -28.94 Bonded –OH groups,
2,921.17 2,921.17 0 Aliphatic C–H group
1,734.76 1,735.05 -0.29 C = O
1,605.27 1,647.64 -42.37 C = O
1,011.21 1,016 -4.79 C–O
877.32 Oxygen-metal bond
Waste Biomass Valor (2011) 2:423–433 425
123
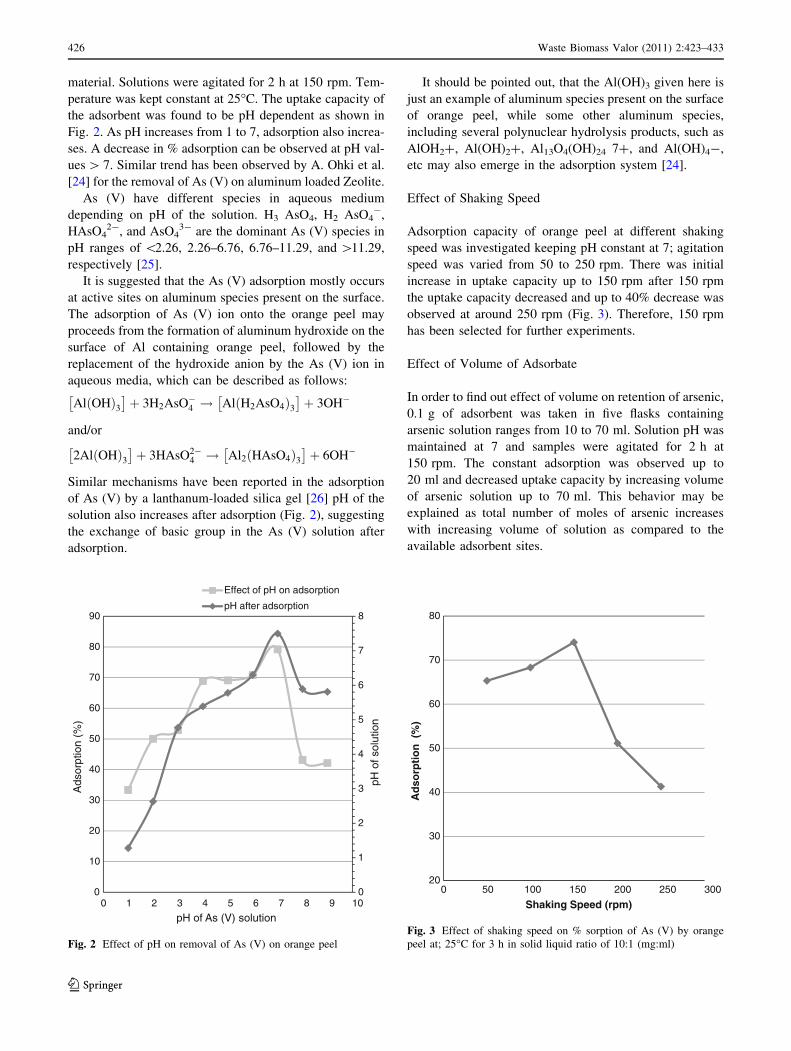
material. Solutions were agitated for 2 h at 150 rpm. Tem-
perature was kept constant at 25�C. The uptake capacity of
the adsorbent was found to be pH dependent as shown in
Fig. 2. As pH increases from 1 to 7, adsorption also increa-
ses. A decrease in % adsorption can be observed at pH val-
ues [ 7. Similar trend has been observed by A. Ohki et al.
[24] for the removal of As (V) on aluminum loaded Zeolite.
As (V) have different species in aqueous medium
depending on pH of the solution. H3 AsO4, H2 AsO4-,
HAsO42-, and AsO4
3- are the dominant As (V) species in
pH ranges of \2.26, 2.26–6.76, 6.76–11.29, and [11.29,
respectively [25].
It is suggested that the As (V) adsorption mostly occurs
at active sites on aluminum species present on the surface.
The adsorption of As (V) ion onto the orange peel may
proceeds from the formation of aluminum hydroxide on the
surface of Al containing orange peel, followed by the
replacement of the hydroxide anion by the As (V) ion in
aqueous media, which can be described as follows:
AlðOHÞ3� �
þ 3H2AsO�4 ! AlðH2AsO4Þ3� �
þ 3OH�
and/or
2AlðOHÞ3� �
þ 3HAsO2�4 ! Al2ðHAsO4Þ3
� �þ 6OH�
Similar mechanisms have been reported in the adsorption
of As (V) by a lanthanum-loaded silica gel [26] pH of the
solution also increases after adsorption (Fig. 2), suggesting
the exchange of basic group in the As (V) solution after
adsorption.
It should be pointed out, that the Al(OH)3 given here is
just an example of aluminum species present on the surface
of orange peel, while some other aluminum species,
including several polynuclear hydrolysis products, such as
AlOH2?, Al(OH)2?, Al13O4(OH)24 7?, and Al(OH)4-,
etc may also emerge in the adsorption system [24].
Effect of Shaking Speed
Adsorption capacity of orange peel at different shaking
speed was investigated keeping pH constant at 7; agitation
speed was varied from 50 to 250 rpm. There was initial
increase in uptake capacity up to 150 rpm after 150 rpm
the uptake capacity decreased and up to 40% decrease was
observed at around 250 rpm (Fig. 3). Therefore, 150 rpm
has been selected for further experiments.
Effect of Volume of Adsorbate
In order to find out effect of volume on retention of arsenic,
0.1 g of adsorbent was taken in five flasks containing
arsenic solution ranges from 10 to 70 ml. Solution pH was
maintained at 7 and samples were agitated for 2 h at
150 rpm. The constant adsorption was observed up to
20 ml and decreased uptake capacity by increasing volume
of arsenic solution up to 70 ml. This behavior may be
explained as total number of moles of arsenic increases
with increasing volume of solution as compared to the
available adsorbent sites.
0
1
2
3
4
5
6
7
8
0
10
20
30
40
50
60
70
80
90
0 1 2 3 4 5 6 7 8 9 10
Effect of pH on adsorption
pH after adsorption
pH of As (V) solution
pH o
f sol
utio
n
Ads
orpt
ion
(%)
Fig. 2 Effect of pH on removal of As (V) on orange peel
20
30
40
50
60
70
80
0 50 100 150 200 250 300
Ad
sorp
tio
n (
%)
Shaking Speed (rpm)
Fig. 3 Effect of shaking speed on % sorption of As (V) by orange
peel at; 25�C for 3 h in solid liquid ratio of 10:1 (mg:ml)
426 Waste Biomass Valor (2011) 2:423–433
123
Effect of Amount of Adsorbent
Amount of adsorbent has basic importance in adsorption
experiments. It is generally believed that those adsorbents
are considered to be efficient whose small amount show
maximum uptake capacity. Therefore, its effect on removal
efficiency have been investigated by varying amount of
adsorbent from 100 to 700 mg, keeping pH 7, temperature
25�C, agitation speed 150 rpm and time 2 h. From the
results it was observed that adsorption capacity increases
slightly with increasing amount of adsorbent. This trend
may be explained on basis of increasing binding sites with
increasing amount of adsorbent. Capacity difference of
around 13% was observed while changing amount from
100 to 200 mg but up to 700 mg the change was only 8%,
therefore for further experiments 200 mg of adsorbent were
selected.
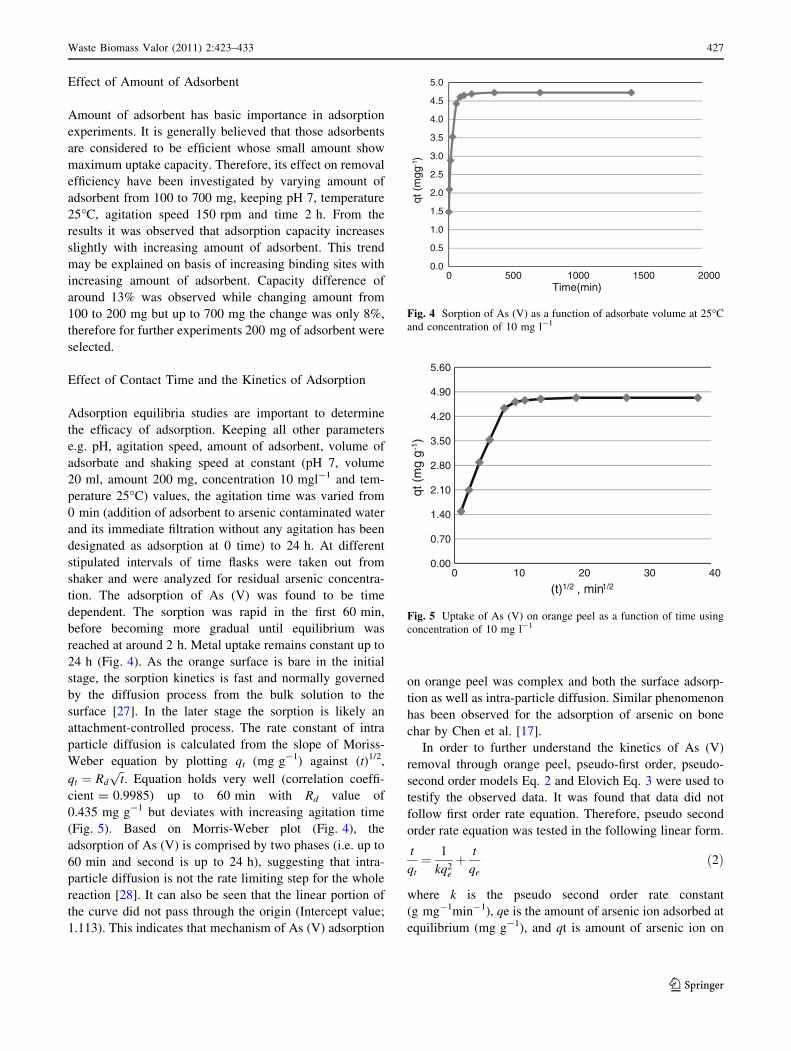
Effect of Contact Time and the Kinetics of Adsorption
Adsorption equilibria studies are important to determine
the efficacy of adsorption. Keeping all other parameters
e.g. pH, agitation speed, amount of adsorbent, volume of
adsorbate and shaking speed at constant (pH 7, volume
20 ml, amount 200 mg, concentration 10 mgl-1 and tem-
perature 25�C) values, the agitation time was varied from
0 min (addition of adsorbent to arsenic contaminated water
and its immediate filtration without any agitation has been
designated as adsorption at 0 time) to 24 h. At different
stipulated intervals of time flasks were taken out from
shaker and were analyzed for residual arsenic concentra-
tion. The adsorption of As (V) was found to be time
dependent. The sorption was rapid in the first 60 min,
before becoming more gradual until equilibrium was
reached at around 2 h. Metal uptake remains constant up to
24 h (Fig. 4). As the orange surface is bare in the initial
stage, the sorption kinetics is fast and normally governed
by the diffusion process from the bulk solution to the
surface [27]. In the later stage the sorption is likely an
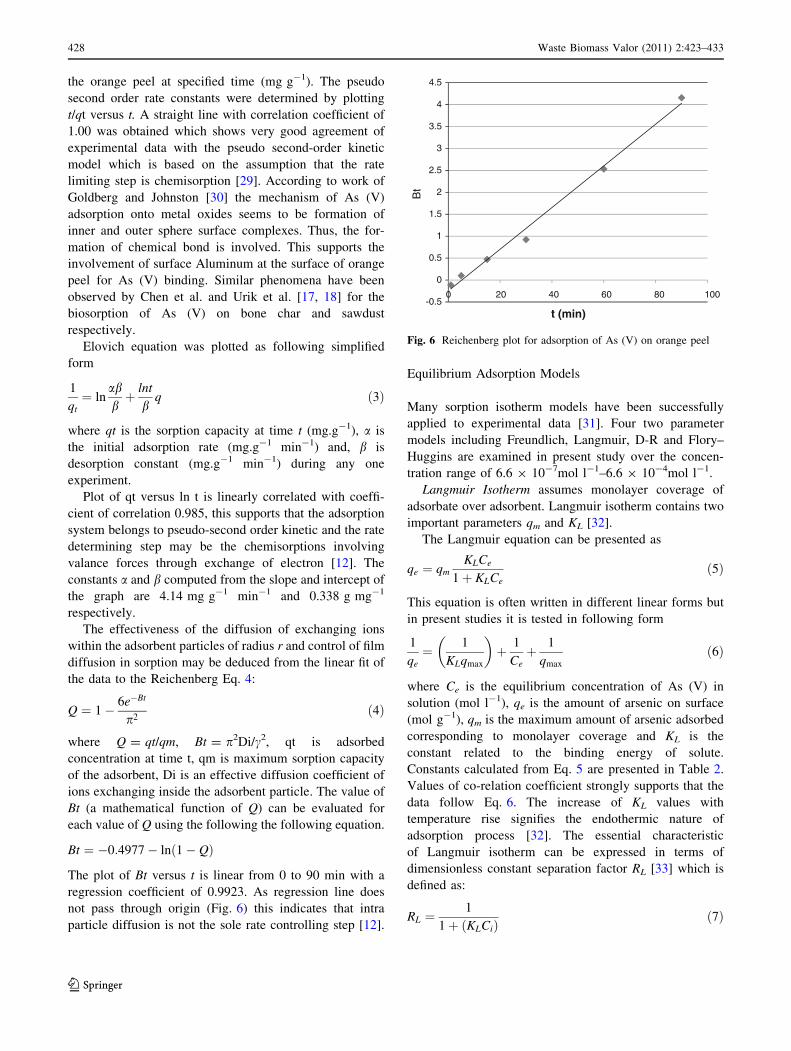
attachment-controlled process. The rate constant of intra
particle diffusion is calculated from the slope of Moriss-
Weber equation by plotting qt (mg g-1) against (t)1/2,
qt ¼ Rd
ffiffitp
. Equation holds very well (correlation coeffi-
cient = 0.9985) up to 60 min with Rd value of
0.435 mg g-1 but deviates with increasing agitation time
(Fig. 5). Based on Morris-Weber plot (Fig. 4), the
adsorption of As (V) is comprised by two phases (i.e. up to
60 min and second is up to 24 h), suggesting that intra-
particle diffusion is not the rate limiting step for the whole
reaction [28]. It can also be seen that the linear portion of
the curve did not pass through the origin (Intercept value;
1.113). This indicates that mechanism of As (V) adsorption
on orange peel was complex and both the surface adsorp-
tion as well as intra-particle diffusion. Similar phenomenon
has been observed for the adsorption of arsenic on bone
char by Chen et al. [17].
In order to further understand the kinetics of As (V)
removal through orange peel, pseudo-first order, pseudo-
second order models Eq. 2 and Elovich Eq. 3 were used to
testify the observed data. It was found that data did not
follow first order rate equation. Therefore, pseudo second
order rate equation was tested in the following linear form.
t
qt¼ 1
kq2e
þ t
qeð2Þ
where k is the pseudo second order rate constant
(g mg-1min-1), qe is the amount of arsenic ion adsorbed at
equilibrium (mg g-1), and qt is amount of arsenic ion on
0.0
0.5
1.0
1.5
2.0
2.5
3.0
3.5
4.0
4.5
5.0
0 500 1000 1500 2000Time(min)
qt (
mgg
-1)
Fig. 4 Sorption of As (V) as a function of adsorbate volume at 25�C
and concentration of 10 mg l-1
0.00
0.70
1.40
2.10
2.80
3.50
4.20
4.90
5.60
0 10 20 30 40
(t)1/2 , min1/2
qt (
mg
g-1
)
Fig. 5 Uptake of As (V) on orange peel as a function of time using
concentration of 10 mg l-1
Waste Biomass Valor (2011) 2:423–433 427
123
the orange peel at specified time (mg g-1). The pseudo
second order rate constants were determined by plotting
t/qt versus t. A straight line with correlation coefficient of
1.00 was obtained which shows very good agreement of
experimental data with the pseudo second-order kinetic
model which is based on the assumption that the rate
limiting step is chemisorption [29]. According to work of
Goldberg and Johnston [30] the mechanism of As (V)
adsorption onto metal oxides seems to be formation of
inner and outer sphere surface complexes. Thus, the for-
mation of chemical bond is involved. This supports the
involvement of surface Aluminum at the surface of orange
peel for As (V) binding. Similar phenomena have been
observed by Chen et al. and Urik et al. [17, 18] for the
biosorption of As (V) on bone char and sawdust
respectively.
Elovich equation was plotted as following simplified
form
1
qt¼ ln
abbþ lnt
bq ð3Þ
where qt is the sorption capacity at time t (mg.g-1), a is
the initial adsorption rate (mg.g-1 min-1) and, b is
desorption constant (mg.g-1 min-1) during any one
experiment.
Plot of qt versus ln t is linearly correlated with coeffi-
cient of correlation 0.985, this supports that the adsorption
system belongs to pseudo-second order kinetic and the rate
determining step may be the chemisorptions involving
valance forces through exchange of electron [12]. The
constants a and b computed from the slope and intercept of
the graph are 4.14 mg g-1 min-1 and 0.338 g mg-1
respectively.
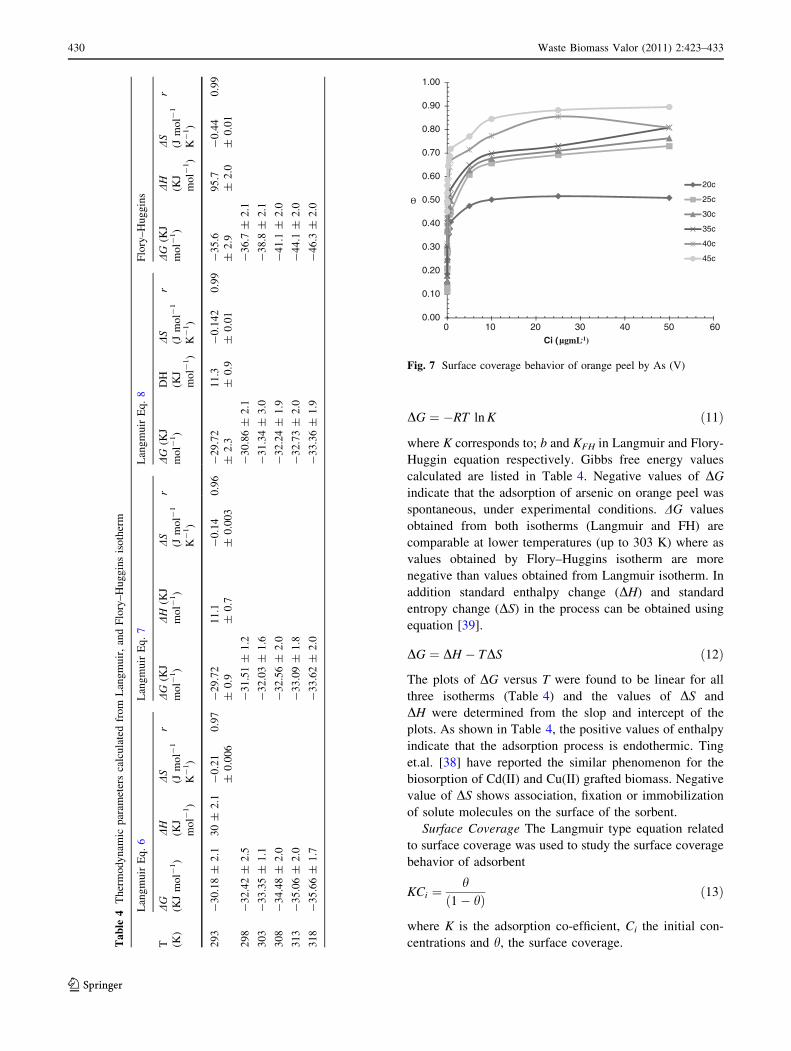
The effectiveness of the diffusion of exchanging ions
within the adsorbent particles of radius r and control of film
diffusion in sorption may be deduced from the linear fit of
the data to the Reichenberg Eq. 4:
Q ¼ 1� 6e�Bt
p2ð4Þ
where Q = qt/qm, Bt = p2Di/c2, qt is adsorbed
concentration at time t, qm is maximum sorption capacity
of the adsorbent, Di is an effective diffusion coefficient of
ions exchanging inside the adsorbent particle. The value of
Bt (a mathematical function of Q) can be evaluated for
each value of Q using the following the following equation.
Bt ¼ �0:4977� ln 1� Qð Þ
The plot of Bt versus t is linear from 0 to 90 min with a
regression coefficient of 0.9923. As regression line does
not pass through origin (Fig. 6) this indicates that intra
particle diffusion is not the sole rate controlling step [12].
Equilibrium Adsorption Models
Many sorption isotherm models have been successfully
applied to experimental data [31]. Four two parameter
models including Freundlich, Langmuir, D-R and Flory–
Huggins are examined in present study over the concen-
tration range of 6.6 9 10-7mol l-1–6.6 9 10-4mol l-1.
Langmuir Isotherm assumes monolayer coverage of
adsorbate over adsorbent. Langmuir isotherm contains two
important parameters qm and KL [32].
The Langmuir equation can be presented as
qe ¼ qmKLCe
1þ KLCeð5Þ
This equation is often written in different linear forms but
in present studies it is tested in following form
1
qe¼ 1
KLqmax
� �þ 1
Ceþ 1
qmax
ð6Þ
where Ce is the equilibrium concentration of As (V) in
solution (mol l-1), qe is the amount of arsenic on surface
(mol g-1), qm is the maximum amount of arsenic adsorbed
corresponding to monolayer coverage and KL is the
constant related to the binding energy of solute.
Constants calculated from Eq. 5 are presented in Table 2.
Values of co-relation coefficient strongly supports that the
data follow Eq. 6. The increase of KL values with
temperature rise signifies the endothermic nature of
adsorption process [32]. The essential characteristic
of Langmuir isotherm can be expressed in terms of
dimensionless constant separation factor RL [33] which is
defined as:
RL ¼1
1þ KLCið Þ ð7Þ
-0.5
0
0.5
1
1.5
2
2.5
3
3.5
4
4.5
0 20 40 60 80 100
Bt
t (min)
Fig. 6 Reichenberg plot for adsorption of As (V) on orange peel
428 Waste Biomass Valor (2011) 2:423–433
123

According to the value of RL, the isotherm shape can be
interpreted as RL [ 1, unfavorable; RL = 1, linear;
RL = 0 Irreversible and 0 \ RL \ 1 favorable [33]. The
RL values calculated for the adsorption of arsenic on
orange peel was in the range of 0.00015–0.99 at all
temperatures investigated (Table 2) showing the favor-
able nature of adsorption.
Freundlich Adsorption Isotherm is an empirical equa-
tion and is most widely used. Freundlich Equation can be
plotted in following linear form:
log qe ¼ log KF þ1
nlog Ce ð8Þ
where KF and 1n are Freundlich constants representing
adsorption capacity and adsorption intensity respectively;
qe and Ce are as previously described. The values of 1n
obtained from Freundlich isotherm (Table 3) are greater
than unity (n, less than unity) suggest the presence of a
concave isotherm [34], similar values of n for biosorption
studies have been reported in literature [34–36]. Igwe et al.
[37] have reported n value of 0.38 for the adsorption of Cd
(II) on maize husk. It is suggested that this type of curve is
likely to be caused by complex nature of adsorbent material
and its varied multiple active sites [32].
D-R Adsorption Isotherm D-R isotherm was also used
to fit the experimental data. This isotherm assumes no
homogeneous surface of the adsorbent and takes the
form
lnqe ¼ lnKD�R � be2 ð9Þ
e is Polanyi potential and is equal to RT ln (1 ? 1/Ce), T is
temperature and R is general gas constant; b is related to the
mean free energy of adsorption per mole of the adsorbent
when it is transferred from infinite distance in the solution to
the surface of the solid. qe and Ce are as previously described;
A linear relationship would be obtained in a plot of lnqe
versus e2. Evaluated data provides good correlation at all
temperatures investigated (Table 3). Magnitude of energy of
adsorption up to 308 K is 7.62–7.96 kJ mol-1 suggesting the
sorption process may be physical where as at temperatures
higher than 308 value of E is [ 8 (Table 2) attributed to the
chemical nature of adsorption [12].
Flory–Huggins Isotherm is chosen to account for the
surface coverage [32]. The FH isotherm has the linear
form:
loghCi¼ log KFH þ nFH log 1� hð Þ ð10Þ
where h = 1-Ce/Ci., Table 3 shows Flory–Huggins (FH)
constants calculated at different temperatures. In general it
may be argued that the fit between experimental adsorption
data and the isotherm model is only mathematically
meaningful and does not provide any evidence of the
actual adsorption mechanism nevertheless, some parameters
(e.g. Langmuir adsorption capacity) are important for design-
ing an adsorption system. Additionally, the thermodynamic
parameters such as the Gibbs free energy (DG) can also be
deduced from the Langmuir and Flory–Huggins isotherm
[38]. Following equation can be used to calculate DG
Table 2 Estimated Langmuir
equation constants for the
adsorption of As (V) on orange
peel
Temperature (K) Constants r
RL KL 9 105(l g-1) qm (lg g-1)
293 0.0006–0.98 2.41 ± 0.001 35.9 ± 1.1 0.999
298 0.00026–0.99 4.83 ± 0.0012 36.81 ± 1.1 0.961
303 0.00027–0.99 5.62 ± 0.0011 37.50 ± 1.2 0.990
308 0.00021–0.98 7.04 ± 0.0012 37.55 ± 1.5 0.980
313 0.00026–0.99 7.09 ± 0.0013 75 ± 1.1 0.992
318 0.0003–0.98 7.20 ± 0.001 132 ± 0.9 0.994
Table 3 Freundlich, D-R and Flory–Huggins constants for the adsorption of As (V) on orange peel
Temperature (K) Freundlich D-R Flory–Huggins
Capacity (mg g-1) 1/n r Capacity (mg g-1) E (KJ mol-1) r KFH 106 nFH r
293 0.17 ± 0.007 1.26 0.99 12.7 ± 0.05 7.62 ± 1.0 0.96 2.2 ± 0.0005 8.61 ± 0.8 0.98
298 0.42 ± 0.009 1.37 0.99 12.7 ± 0.05 7.49 ± 1.1 0.98 2.7 ± 0.0003 6.06 ± 0.6 0.99
303 0.52 ± 0.008 1.34 0.99 12.7 ± 0.07 7.76 ± 1.0 0.99 4.7 ± 0.0001 6.03 ± 0.8 0.99
308 0.63 ± 0.01 1.32 0.99 12.8 ± 0.09 7.96 ± 1.0 0.99 9.2 ± 0.0003 5.9 ± 0.3 0.98
313 0.74 ± 0.008 1.3 0.99 13.1 ± 0.05 8.22 ± 1.2 0.98 23 ± 0.0005 5.45 ± 0.3 0.97
318 0.89 ± 0.005 1.31 0.99 13.4 ± 0.09 8.45 ± 1.2 0.97 40 ± 0.0001 4.7 ± 0.3 0.96
Waste Biomass Valor (2011) 2:423–433 429
123
DG ¼ �RT ln K ð11Þ
where K corresponds to; b and KFH in Langmuir and Flory-
Huggin equation respectively. Gibbs free energy values
calculated are listed in Table 4. Negative values of DG
indicate that the adsorption of arsenic on orange peel was
spontaneous, under experimental conditions. DG values
obtained from both isotherms (Langmuir and FH) are
comparable at lower temperatures (up to 303 K) where as
values obtained by Flory–Huggins isotherm are more
negative than values obtained from Langmuir isotherm. In
addition standard enthalpy change (DH) and standard
entropy change (DS) in the process can be obtained using
equation [39].
DG ¼ DH � TDS ð12Þ
The plots of DG versus T were found to be linear for all
three isotherms (Table 4) and the values of DS and
DH were determined from the slop and intercept of the
plots. As shown in Table 4, the positive values of enthalpy
indicate that the adsorption process is endothermic. Ting
et.al. [38] have reported the similar phenomenon for the
biosorption of Cd(II) and Cu(II) grafted biomass. Negative
value of DS shows association, fixation or immobilization
of solute molecules on the surface of the sorbent.
Surface Coverage The Langmuir type equation related
to surface coverage was used to study the surface coverage
behavior of adsorbent
KCi ¼h
1� hð Þ ð13Þ
where K is the adsorption co-efficient, Ci the initial con-
centrations and h, the surface coverage.Ta
ble
4T
her
mo
dy
nam
icp
aram
eter
sca
lcu
late
dfr
om
Lan
gm
uir
,an
dF
lory
–H
ug
gin
sis
oth
erm
Lan
gm
uir
Eq
.6
Lan
gm
uir
Eq
.7
Lan
gm
uir
Eq
.8
Flo
ry–
Hu
gg
ins
T (K)
DG
(KJ
mo
l-1)
DH
(KJ
mo
l-1)
DS
(Jm
ol-
1
K-
1)
rD
G(K
J
mo
l-1)
DH
(KJ
mo
l-1)
DS
(Jm
ol-
1
K-
1)
rD
G(K
J
mo
l-1)
DH
(KJ
mo
l-1)
DS
(Jm
ol-
1
K-
1)
rD
G(K
J
mo
l-1)
DH
(KJ
mo
l-1)
DS
(Jm
ol-
1
K-
1)
r
29
3-
30
.18
±2
.13
0±
2.1
-0
.21
±0
.00
6
0.9
7-
29
.72
±0
.9
11
.1
±0
.7
-0
.14
±0
.00
3
0.9
6-
29
.72
±2
.3
11
.3
±0
.9
-0
.14
2
±0
.01
0.9
9-
35
.6
±2
.9
95
.7
±2
.0
-0
.44
±0
.01
0.9
9
29
8-
32
.42
±2
.5-
31
.51
±1
.2-
30
.86
±2
.1-
36
.7±
2.1
30
3-
33
.35
±1
.1-
32
.03
±1
.6-
31
.34
±3
.0-
38
.8±
2.1
30
8-
34
.48
±2
.0-
32
.56
±2
.0-
32
.24
±1
.9-
41
.1±
2.0
31
3-
35
.06
±2
.0-
33
.09
±1
.8-
32
.73
±2
.0-
44
.1±
2.0
31
8-
35
.66
±1
.7-
33
.62
±2
.0-
33
.36
±1
.9-
46
.3±
2.0
0.00
0.10
0.20
0.30
0.40
0.50
0.60
0.70
0.80
0.90
1.00
0 10 20 30 40 50 60
20c
25c
30c
35c
40c
45c
Ci (µgmL-1)
Fig. 7 Surface coverage behavior of orange peel by As (V)
430 Waste Biomass Valor (2011) 2:423–433
123
The fraction of orange peel surface covered by As
(V) was studied by plotting the surface coverage values (h)
against As (V) concentration. The data presented in Fig. 7
shows increase in initial metal concentration, increases the
surface coverage until the surface is nearly fully covered
with a monomolecular layer. Surface coverage ceases
significantly with concentration of As (V) at higher levels
and the reaction rate become independent of As (V) con-
centration. Similar trends have been reported for the bio-
sorption of Ni(II) golden shower biomass [40].
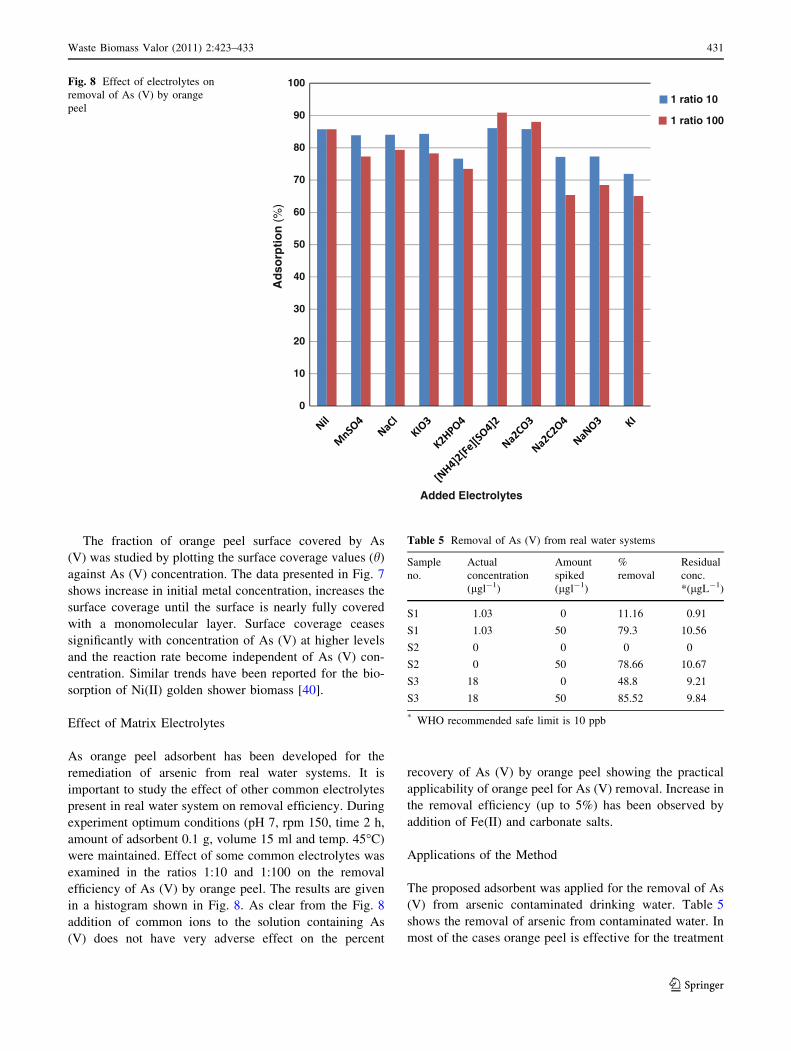
Effect of Matrix Electrolytes
As orange peel adsorbent has been developed for the
remediation of arsenic from real water systems. It is
important to study the effect of other common electrolytes
present in real water system on removal efficiency. During
experiment optimum conditions (pH 7, rpm 150, time 2 h,
amount of adsorbent 0.1 g, volume 15 ml and temp. 45�C)
were maintained. Effect of some common electrolytes was
examined in the ratios 1:10 and 1:100 on the removal
efficiency of As (V) by orange peel. The results are given
in a histogram shown in Fig. 8. As clear from the Fig. 8
addition of common ions to the solution containing As
(V) does not have very adverse effect on the percent
recovery of As (V) by orange peel showing the practical
applicability of orange peel for As (V) removal. Increase in
the removal efficiency (up to 5%) has been observed by
addition of Fe(II) and carbonate salts.
Applications of the Method
The proposed adsorbent was applied for the removal of As
(V) from arsenic contaminated drinking water. Table 5
shows the removal of arsenic from contaminated water. In
most of the cases orange peel is effective for the treatment
0
10
20
30
40
50
60
70
80
90
100
1 ratio 10
1 ratio 100
Ad
sorp
tio
n (
%)
Added Electrolytes
Fig. 8 Effect of electrolytes on
removal of As (V) by orange
peel
Table 5 Removal of As (V) from real water systems
Sample
no.
Actual
concentration
(lgl-1)
Amount
spiked
(lgl-1)
%
removal
Residual
conc.
*(lgL-1)
S1 1.03 0 11.16 0.91
S1 1.03 50 79.3 10.56
S2 0 0 0 0
S2 0 50 78.66 10.67
S3 18 0 48.8 9.21
S3 18 50 85.52 9.84
* WHO recommended safe limit is 10 ppb
Waste Biomass Valor (2011) 2:423–433 431
123
of contaminated water with the residual concentration up to
WHO safe limit.
Conclusions
It can be concluded that orange peel can be effectively used
for the treatment of arsenic contaminated water. Adsorbent
is effective even at very low arsenic concentrations and in
the presence of concomitant ions. Kinetic and adsorption
isotherm models suggest the multiple types of adsorption
sites and complex mechanism of adsorption. In order to
realize its potential as a commercial adsorbent for indus-
trial as well as household filters, uptake of arsenic under
continuous conditions must be evaluated. Currently such an
investigation is being undertaken.
Acknowledgments Authors are very thankful to International
Foundation for Science (IFS) for providing funds to carry out this
research.
References
1. Nickson, R.T., Mc Arthur, J.M., Shrestha, B., Kyaw-Myint, T.O.,
Lowry, D.: Arsenic and other drinking water quality issues,
Muzaffargarh District. Pak. Appl. Geochem. 20, 55–68 (2005)
2. Mondal, P., Majumuder, C.B., Mohanty, B.: Laboratory based
approaches for arsenic remediation from contaminated water:
recent developments. J. Hazard. Mater. 137, 464–479 (2006)
3. Pandy, P.K., Choubey, S., Verma, Y., Pandy, M., Chandrashe-
khar, K.: Biosorptive removal of arsenic from drinking water.
Bioresour. Technol. 100, 634–637 (2009)
4. Smedley, P.L., Nicolli, H.B., Macdonald, D.M.J., Barros, A.J.,
Tullio, J.O.: Hydro geochemistry of arsenic and other inorganic
constituents in ground waters from La Pampa, Argentina. Appl.
Geochem. 17(3), 259–284 (2002)
5. Mandal, B.K., Suzuki, K.T.: Arsenic round the world: a review.
Talanta 58, 201–235 (2002)
6. Jain, C.K., Ali, I.: Arsenic: occurrence, toxicity and speciation
techniques. Water Res. 34, 4304–4312 (2000)
7. WHO (World Health Organization): Environmental Health Cri-
teria, 18: Arsenic. World Health Organization, Geneva (1981)
8. Kiping, M.D.: Environment and man. In: Lenhan, J., Fletcher,
W.W. (eds.) Arsenic, The Chemical Environment, vol. 6. Glas-
gow (1997)
9. Ng, J.C., Wang, J., Shraim, A.: A global health problem caused
by arsenic from natural sources. Chemosphere 52(9), 1353–1359
(2003)
10. Seki, H., Suzuki, A., Maruyama, H.: Biosorption of chromium
(VI) and arsenic (V) onto methylated yeast biomass. J. Colloid
Interf. Sci. 281, 261–266 (2005)
11. Pokhrel, D., Viraraghavan, T.: Organic arsenic removal from
aqueous solutions by iron-oxie coated fungal biomass: an analysis of
factors influencing adsorption. Chem. Eng. J. 140, 165–172 (2008)
12. Ranjan, D., Talat, M., Hasan, S.H.: Biosorption of arsenic from
aqueous solution using agricultural residue rice polish. J. Hazard.
Materi. 166, 1050–1059 (2009)
13. Loukidou, M.X., Kostas, A.M., Anastasios, I.Z., Maria, L.K.:
Removal of As (V) from waste waters by chemically modified
fungal biomass. Water Res. 37, 4544–4552 (2003)
14. Niu, C.H., Volesky, B., Cleiman, D.: Biosorption of arsenic
(V) with acid washed crab shells. Water Res. 41, 2473–2478
(2007)
15. Zhao, Y., Huang, M., Wei, W., Wei, J.: Synthesis of the cotton
cellulose based Fe(III)-loaded adsorbent for arsenic (V) removal
from drinking water. Desalination 249, 1006–1011 (2009)
16. Anirudhan, T.S., Unnithan, M.R.: Arsenic (V) removal from
aqueous solutions using an anion exchanger derived from coconut
coir pith and its recovery. Chemosphere 66, 60–66 (2007)
17. Chen, Y.N., Chai, L.Y., Shu, Y.D.: Study of arsenic (V) adsorp-
tion on bone char from aqueous solution. J. Hazard. Mater. 160,
168–172 (2008)
18. Urik, M., Littera, P., Sevc, J., Kolencik, M., Cernasky, S.:
Removal of arsenic (V) from aqueous solutions using chemically
modified sawdust of spruce (Picea abies): kinetics and isotherm
studies. Int. J. Environ. Sci. Tech. 6, 451–456 (2009)
19. Chio, C.P., Lin, M.C., Liao, C.M.: Low-cost farmed shrimp shells
could remove arsenic from solutions kineticslly. J. Hazard. Mater.
171, 859–864 (2009)
20. Yusof, A.M., Nik Malek, N.A.N.: Removal of Cr(VI) and As
(V) from aqueous solutions by HDTMA-modified zeolite Y.
J. Hazard. Mater. 162, 1019–1024 (2009)
21. Chutia, P., Kato, S., Kojima, T., Satokawa, S.: Adsorption of As
(V) on surfactant-modified natural zeolite. J. Hazard. Mater. 162,
204–211 (2009)
22. Jeon, C.S., Baek, K., Park, J.K., Oh, Y.K., Lee, S.D.: Adsorption
Characteristics of As (V) on iron-coated zeolite. J. Hazard. Mater.
163, 804–808 (2009)
23. Socrates G.: Infrared Characteristic Group Frequencies. Wiley-
Interscience Publication, NY (1980)
24. Xu, Y., Nakajima, T., Ohki, A.: Adsorption and removal of
arsenic(V) from drinking water by aluminum-loaded Shirasu-
zeolite. J. Hazard. Mater. B92, 275–287 (2002)
25. Su, T., Guan, X., Tang, Y., Gu, G., Wang, J.: Predicting com-
petitive adsorption behavior of major toxic anionic elements onto
activated alumina: a speciation-based approach. J. Hazard. Mater.
176, 466–472 (2010)
26. Wasay, S.A., Haron, M.D.J., Tokunaga, S.: Adsorption of fluo-
ride, phosphate, and arsenate ions on lanthanum-impregnated
silica gel. Water Environ. Res. 68, 295–300 (1996)
27. Morris, W.J., Weber, C.: Kinetics of adsorption on carbon from
solution. J. Sanita Eng. Division ASCE 89, 31–59 (1963)
28. Basha S., Murthy Z.V.P.: Kinetic and equilibrium models for
biosorption of Cr(VI) on chemically modified seaweed, Cys-
toseira indica. Process Biochem. 42, 1521–1529 (2007)
29. Ho, Y.S.: Second order kinetic model for the sorption of cad-
mium onto tree fern: a comparison of linear and non-linear
models. Water Res. 40(1), 119–125 (2006)
30. Goldberg, S., Johnston, C.T.: Mechanism of arsenic adsorption
on amorphous oxides evaluated using microscopic measurements,
vibrational spectroscopy, and surface complexation modeling.
J. Colloid Interf. Sci. 234, 204–216 (2001)
31. Foo, K.Y., Hameed, B.H.: Insights into the modeling of adsorp-
tion isotherm systems. Chem. Eng. J. 156, 2–10 (2010)
32. Febrianto, J., Kosasih, A.N., Sunarso, J., Ju, Y.H., Indraswati, N.,
Ismadji, S.: Equilibrium and kinetic studies in adsorption of
heavy metals using biosorbent: a summary of recent studies.
J. Hazard. Mater. 162, 616–645 (2009)
33. Memon, S.Q., Memon, N., Solangi, A.R., Memon, J.R.: Sawdust:
a green and economical sorbent for thallium removal. Chem. Eng.
J. 140, 235–240 (2008)
34. Delle Site, A.: Factors affecting sorption of organic compounds in
natural sorbent/water systems and sorption coefficients for selected
pollutants. A review. J. Phys. Chem. Ref. Data 30, 187–439 (2001)
35. Popuri, S.R., Jammala, A., Reddy, K.V.N.S., Abburi, K.: Bio-
sorption of hexavalent chromium using tamarind (Tamarindus
432 Waste Biomass Valor (2011) 2:423–433
123

indica) fruit shell—a comparative study. Electron. J. Biotechnol.
10, 358–367 (2007)
36. Gokhale, S.V., Jyoti, K.K., Lele, S.S.: Kinetic and equilibrium
modeling of chromium (VI) biosorption on fresh and spent Spi-rulina platensis/Chlorella vulgaris biomass. Bioresour. Technol.
99, 3600–3608 (2008)
37. Igwe, J.C., Abia, A.A.: Equilibrium sorption isotherm studies of
Cd(II), Pb(II)and Zn(II) ions detoxification from waste water
using unmodified and EDTA modified maize husk. Electron.
J. Biotechnol. 10, 536–548 (2007)
38. Deng, S., Ting, Y.P.: Fungal biomass with grafted poly(acrylic
acid) for enhancement of Cu(II) and Cd (II) biosorption. Lang-
muir 21, 5940–5948 (2005)
39. Genc-Fuhrman, H., Tjell, J.C., Mc Conchie, D.: Adsorption of
arsenic from water using activated neutralized red mud. Environ.
Sci. Technol. 38, 2428–2434 (2004)
40. Hanif, M.A., Nadeem, R., Bhatti, H.N., Ahmed, N.R., Ansari,
T.M.: Ni(II) biosorption by Cassia fistula (golden shower) bio-
mass. J. Hazard. Mater. B139, 345–355 (2007)
Waste Biomass Valor (2011) 2:423–433 433
123
Related Documents