-v UnIilll(llllll¥lulJIllllIllHllll 00001 772l1l(M ORIGINAL Transcript Exhibitfs) Docks* #(s): 4-nl<IS-I/4 ~l0 -bIO"1 Arizona Corporation Commission DOCKETED FEB 82017 DOCKETED BY ___.@t> 's > __ Qr ._» ©5) -n Ag Q xzow m'oFc'; I -4 CO of mom o f z m 'U -139 mu: 'N ow I I -6 Exhib§1;#j z \ M 8 A 8~10i!£,11 I 1 l 174 Z Q93 I I

Welcome message from author
This document is posted to help you gain knowledge. Please leave a comment to let me know what you think about it! Share it to your friends and learn new things together.
Transcript
- v
UnIilll(llllll¥lulJIllllIllHllll00001 772l1l(MORIGINAL
Transcript Exhibitfs)
Docks* #(s): 4-nl<IS-I/4 ~l0 -bIO"1
Arizona Corporation Commission
DOCKETED
FEB 82017
DOCKETED BY
___.@t>
's >__ Q r._» ©5)-n A gQ xzow
m'oFc';I -4 COof mom
o fz m'U -139mu:'N owII -6Exhib§1;#j z
\
M 8 A
8~10i!£,11
I
1l
174 Z Q93
I
I
EXHIBIT no. A-3
SUPPLEMENTALTARIFF SHEETSll
l!
EXHIBIT
z 43 "1

.
soumwesr E115 IURPIIIIIITIIIII45May 12, 2016
Arizona Corporation CommissionDocket Control1200 West Washington StreetPhoenix, AZ 85007-2996
Re: Docket No. G-01551A-16-0107
Southwest Gas Corporation respectfully submits the following substitute tariff sheets to itsgeneral rate case application filed May 2, 2016.
If you have any questions, please do not hesitate to contact me at 602-395-4058.
Respectfu y submitted,
hew D. errMRegulatory Manager/Arizona
Cc: Service List
1600 E. Northern Avenue / Phoenix Arizona 85020-3982
P.O. Box 52075 / Phoenix, Arizona 85072-2075 / (877) 860-6020www.swgas.oom
.
BEFORE THE ARIZONA CORPORATION COMMISSION
COMMISSIONERS
1
2
3
4
5
DOUG LITTLE - ChairmanBOB STUMPBOB BURNSTOM FORESEANDY TOBIN
DOCKET NO.: G-01551 -A-16-0107
SUPPLEMENTAL FILING
In the Matter of the Application ofSouthwest Gas Corporation for theEstablishment of Just and ReasonableRates and Charges Designed to Realize aReasonable Rate of Return on the FairValue of the Properties of Southwest GasCorporation Devoted to its ArizonaO rations
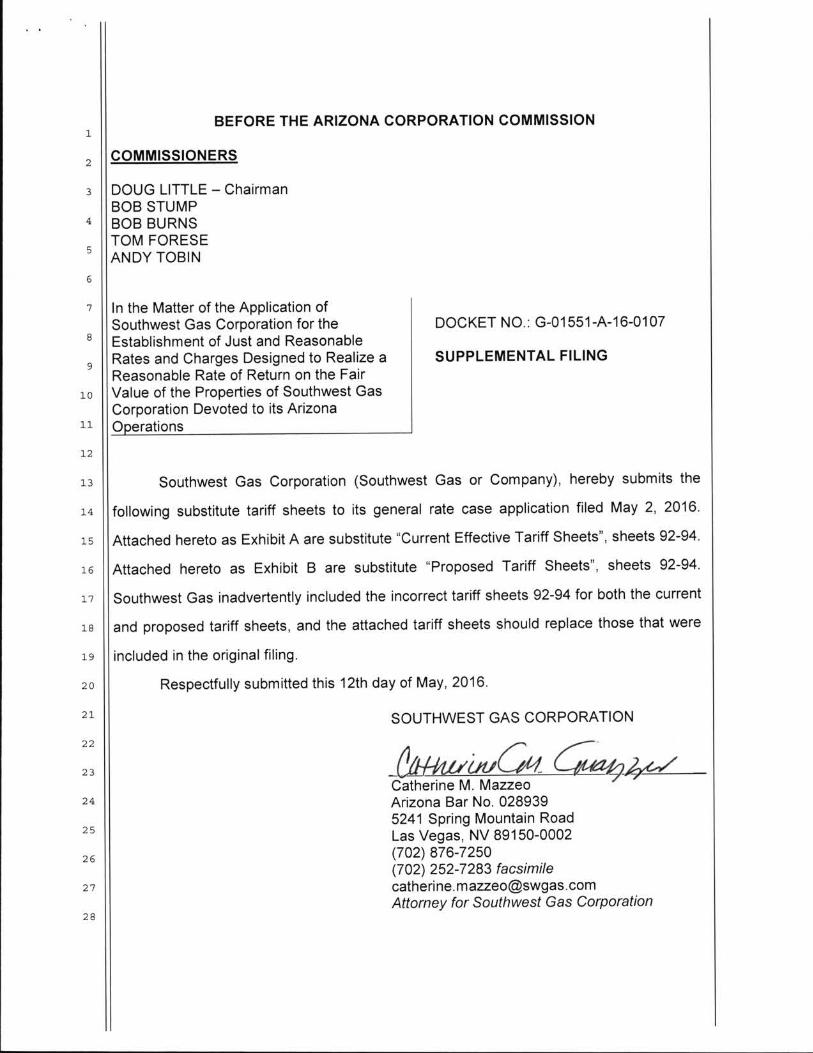
Southwest Gas Corporation (Southwest Gas or Company), hereby submits the
following substitute tariff sheets to its general rate case application filed May 2, 2016.
Attached hereto as Exhibit A are substitute "Current Effective Tariff Sheets", sheets 92-94.
Attached hereto as Exhibit B are substitute "Proposed Tariff Sheets", sheets 92-94.
Southwest Gas inadvertently included the incorrect tariff sheets 92-94 for both the current
and proposed tariff sheets, and the attached tariff sheets should replace those that were
included in the original filing.
Respectfully submitted this 12th day of May, 2016.
SOUTHWEST GAS CORPORATION
01/Q4Catherine M. Mazzeo 6 /Arizona Bar No. 0289395241 Spring Mountain RoadLas Vegas, NV 89150-0002(702) 876-7250(702) 252-7283 [email protected] for Southwest Gas Corporation
6
7
8
9
10
l l
12
13
14
15
16
17
18
19
20
21
22
23
24
25
26
27
28

1Original and 13 copies of the foregoing were filedthis 12'" day of May, 2015 with:
Docket ControlArizona Corporation Commission1200 West Washington StreetPhoenix, Arizona 85007
2
3
4
5
6
7
Copies of the foregoing were hand-delivered/mailedthis 12"' day of May, 2016 to:
8
9
10
l l
Dwight D. NodesChief Administrative Law JudgeHearing DivisionArizona Corporation Commission1200 West Washington StreetPhoenix, Arizona 85007
12
13
14
15
Janice AlwardChief CounselLegal DivisionArizona Corporation Commission1200 West Washington StreetPhoenix, Arizona 85007
16
17
18
Thomas M. Broderick, DirectorUtilities DivisionArizona Corporation Commission1200 West Washington StreetPhoenix, Arizona 85007
19
20
21
David Tenney, DirectorResidential Utility Consumer Office1110 West Washington Street, Ste. 220Phoenix, Arizona 85007
22
23Richard Gayer526 West Wilshire DrivePhoenix, Arizona 8500324
25
26 By:
27
28
2

Exhibit A
i
SUBSTITUTE CURRENT EFFECTIVE TARIFF SHEETS
A.C.C. Sheet No.A.C.C. Sheet No.
9292
SOUTHWEST GAS CORPORATIONP.O. Box 98510Las Vegas Nevada 89193-8510Arizona Gas Tariff No. 7Arizona Division
4th Revised.Canceling
SPECIAL SUPPLEMENTARY TARIFFENERGY EFFICIENCY ENABLING PROVISION
APPLICABILITY
The Energy Efficiency Enabling Provision (EEP) applies to residential Rate Schedule Nos.G-5, G-6, G-10 and G-11 and to General Service Schedule Nos. G-25(Small), G-25(Medium),G-25(Large-1) and G-25(Large-2) included in this Arizona Gas Tariff. The EEP specifies theaccounting procedures and rate setting adjustments necessary to assure the Utility neitherover-recovers, nor under-recovers, the margin-per-customer amounts authorized in its mostrecent general rate case proceeding.
EEP WEATHER ADJUSTMENT
N
N
T
/N
TT
D
The EEP Weather Adjustment is a monthly adjustment applicable during the winter seasonmonths of November through April. For bills that include only a part of the winter season,only the portion of customer usage occurring during the winter season months will be subjectto the EEP Weather Adjustment. For example, for a billing period that included October andNovember consumption, the EEP Weather Adjustment would only apply to the customer'susage occurring in November. The EEP Weather Adjustment accounts for variationsbetween the actual temperatures and normal temperatures for each winter day in thecustomer's billing cycle. When actual temperatures are colder than normal, the DeliveryCharge (as shown in the Statement of Rates) or Usage Charge portion of customer bills willbe adjusted downward to reflect what the customer would have used under normaltemperature conditions. When actual temperatures are warmer than normal, the DeliveryCharge portion of customer bills will be adjusted upward to reflect what the customer wouldhave used under normal temperature conditions. Weather is quantified in Heating DegreeDays (Hoe). HDD is defined as the difference between 65 degrees Fahrenheit and theaverage daily temperature when the average daily temperature is below 65 degrees. Whenthe average daily temperature is equal to or greater than 65 degrees, there are zero Hoe.Two analyses are performed to determine customers' weather sensitive use, an analysis ofthe customer's current billing cycle and an analysis of the customer's multi-season billingdata.
BILLING CYCLE ANALYSIS1)
The billing cycle analysis uses the customer's current billing cycle HDD variance and billingcycle use per HDD to determine weather-sensitive gas use and to calculate the billing cycleanalysis volume adjustment.
A. Determine Billing Cycle HDD Variance
Normal HDD
Actual HDD
The sum of the ten-year average HDDs for each dayin the customer's billing cycleThe sum of the actual HDDs for each day in thecustomer's billing cycleNormal HDDs less the Actual HDDsHDD Variance
Effective 4 1Decision No. 74780
Issued byJustin Lee BrownVice President
Issued OnDocket No. - - -

SUBSTITUTE CURRENT EFFECTIVE TARIFF SHEETS
9393
SOUTHWEST GAS CORPORATIONP.O. Box 98510Las Vegas, Nevada 89193-8510Arizona Gas Tariff No. 7Arizona Division
5th Revised A.c.c. Sheet No.4 R i A.C.C. Sheet No.Canceling
SPECIAL SUPPLEMENTARY TARIFFENERGY EFFICIENCY ENABLING PROVISION
(Continued)
B. Determine Bi lling Cycle Use per HDD
Bi lling cyc le use per HDD is ca lcula ted for each cus tomer bi ll by subtrac t ing thecus tomer 's bi lling cyc le base load vo lume f rom current monthly metered use anddividing the difference by the billing cycle actual HDDs.
Bi lling cycle base load volume is equal to the customer's base load volume per daymult iplied by the number of days in the customer's bi lling cyc le. Base load volumeper day for each customer is used to establish monthly non-temperature sens i t iveusage. The base load vo lume per day is equal to the cus tomer 's lowes t averagedai ly use for the May through October summer bi lling periods. Average dai ly use isthe customer's total monthly use div ided by the number of days in the bi lling cyc le.For new customers, base load volume per day will be the average base load volumeper day in the customer's operating district.
c . Calculate Bi lling Cycle Analysis Volume Adjustment
The bi l l i ng c y c le a na ly s i s v o lume a djus tme nt i s c a lc ula te d by mult i p ly i ng t hecustomer's bi lling cycle HDD variance by the billing cycle use per HDD.
MULTI-SEASON ANALYSIS2)
TTIN
The mult i -season analys is uses winter bi lling data from the prev ious 24 months todetermine weather-sens i t i ve gas use and to ca lcula te the mult i -season ana lys isvo lume adjus tment . W inte r bi ll i ng da ta inc ludes cus tomer bi lls dur ing the winte rseason months of November through Apri l, exc luding bi lls that conta in both winterand non-winte r use . Bi l ls tha t i nc lude only a po r t i on o f the winte r season, fo rexample a bi lling period that inc luded October and November consumption, are notused in the mult i -season ana lys is . Thus , the mult i -season ana lys is inc ludes 10winter months of bi lling data from the previous 24 months.
ll
T/N
In order to determine the results of the multi-season analysis, a linear regression isut i li zed. A linear regress ion compares the cus tomer's his tor ica l monthly metereduse to the actual weather in each bi lling cycle to establish the correlat ion betweenthe customer's gas use and the actual weather. The result of the linear regression isthe customer's weather sens i t ive use per HDD. The mult i -season analys is volumeadjus tment is ca lculated by mult iply ing the cus tomer's bi lling cyc le HDD varianceby the customer's multi-season weather sensitive use per HDD.
1l1ll
L
EffectiveDecision No.
Issued byJustin Lee Brown
Vice PresidentMay 14. 2015
74780Issued On May 14 2015Docket No. - - -

SUBSTITUTE CURRENT EFFECTIVE TARIFF SHEETS
A.C.C. Sheet No.A.C.C. Sheet No.
9494
SOUTHWEST GAS CORPORATIONP.O. Box 98510Las Vegas Nevada 89193-8510Arizona Gas Tariff No. 7Arizona Division
4th Revised.Canceling
SPECIAL SUPPLEMENTARY TARIFFENERGY EFFICIENCY ENABLING PROVISION
(Continued)
BILL ADJUSTMENT3) TL
NIN
The EEP Weather Adjustment for each customer bill is calculated by multiplyingthe applicable volume adjustment by the Delivery Charge component (as shown in theStatement of Rates) of the customer's Commodity Charge. The EPP WeatherAdjustment will be applied to the customer's Delivery Charge or Usage Chargerevenue calculated on metered volumes. For each customer, the applicable volumeadjustment is whichever of the following three quantities is the closest to zero: 1) thebilling cycle analysis volume adjustment, 2) the multi-season analysis volumeadjustment or 3) the customer's current monthly metered use.
However, in instances where the customer's billing cycle base load volume is greaterthan the customer's current monthly metered use or the sum of the actual HDDs in thecustomer's current billing cycle is equal to zero, the volume adjustment will be equal tozero and there will be no EEP Weather Adjustment to the customer's bill.
EEP ANNUAL ADJUSTMENT
The EEP Annual Adjustment recovers or refunds any differences between the Utility's billedmargin and the margin amounts authorized in its most recent general rate case proceeding.The process is set forth below.
1) EEP BALANCING ACCOUNT
The Utility shall maintain accounting records that accumulate the difference betweenauthorized and actual billed margin. Entries shall be recorded to the EEP BalancingAccount (EEPBA) each month as follows:
A. A debit or credit entry equal to the difference between authorized margin and actualbilled margin for each rate schedule subject to this provision. Authorized margin isthe product of the monthly margin-per-customer authorized in the Utility's lastgeneral rate case, as stated below, and the actual number of customers billed duringthe month.
G-11G-10G-5 Qt
A
A
34.9531.3125.5220.0116.8416.6815.1114.3614.6314.9916.6126.79
51.3344.9834.1623.5317.3616.5814.9114.0414.3715.1717.9836.56
$
$
$
$
S
$
$
$
$
$
$
$
31.3328.5424.4820.3517.8317.4616.1215.4715.8116.2117.5925.32
$
$
$
$
$
$$
$
$
s
$
$
55.3347.8338.0426.8520.5819.7817.8916.9317.4418.4820.8039.58
$
$
$
$
s
$
$
S
$
$
$
$
$
$
$$
$$
$
$
S
$
$
$
january
February
March
prim
May
ume
f l y
august
September
October
November
December
EffectiveDecision No.
Issued byJustin Lee Brown
Vice President
May 14 201574780
Issued OnDocket No.
May 14, 2015_ _ _
l

Exhibit B
II
I
I
!
i
\
l
SUBSTITUTE PROPOSED TARIFF SHEET
A.C.C. Sheet No.A.C.C. Sheet No.
SOUTHWEST GAS CORPORATIONP.O. Box 98510Las Vegas, Nevada 89193-8510Arizona Gas Tariff No. 7Arizona Division
9292Canceling
SPECIAL SUPPLEMENTARY TARIFFENERGY EFFICIENCY ENABLING PROVISION
APPLICABILITY
The Energy Efficiency Enabling Provision (EEP) applies to residential Rate Schedule Nos.G-5, G-6, G-10 and G-11 and to General Service Schedule Nos. G-25(Small), G-25(Medium),G-25(Large-1) and G-25(Large-2) included in this Arizona Gas Tariff. The EEP specifies theaccounting procedures and rate setting adjustments necessary to assure the Utility neitherover-recovers, nor under-recovers, the margin-per-customer amounts authorized in its mostrecent general rate case proceeding.
EEP WEATHER ADJUSTMENT
TID
T
T
C
C
The EEP Weather Adjustment is a monthly adjustment applicable during the Winter Season.For bills that include only a part of the Winter Season, only the portion of customer usageoccurring during the Winter Season months will be subject to the EEP Weather Adjustment.For example, for a billing period that included November and December consumption, theEEP Weather Adjustment would only apply to the customer's usage occurring in December.The EEP Weather Adjustment accounts for variations between the actual temperatures andnormal temperatures for each winter day in the customer's billing cycle. When actualtemperatures are colder than normal, the Delivery Charge (as shown in the Statement ofRates) or Usage Charge portion of customer bills will be adjusted downward to reflect whatthe customer would have used under normal temperature conditions. When actualtemperatures are warmer than normal, the Delivery Charge portion of customer bills will beadjusted upward to reflect what the customer would have used under normal temperatureconditions. Weather is quantified in Heating Degree Days (HDD). HDD is defined as thedifference between 65 degrees Fahrenheit and the average daily temperature when theaverage daily temperature is below 65 degrees. When the average daily temperature is equalto or greater than 65 degrees, there are zero Hoe. Two analyses are performed to determinecustomers' weather sensitive use, an analysis of the customer's current billing cycle and ananalysis of the customer's multi-season billing data.
1) BILLING CYCLE ANALYSISII.i.
The billing cycle analysis uses the customer's current billing cycle HDD variance and billingcycle use per HDD to determine weather-sensitive gas use and to calculate the billing cycleanalysis volume adjustment.
A. Determine Billing Cycle HDD Variance
Normal HDD
Actual HDD
The sum of the ten-year average HDDs for each dayin the customer's billing cycleThe sum of the actual HDDs for each day in thecustomer's billing cycleNormal HDDs less the Actual HDDsHDD Variance
EffectiveDecision No.
Issued byJustin Lee BrownVice President
Issued OnDocket No.

\
SUBSTITUTE PROPOSED TARIFF SHEET
A.C.C. Sheet No.A.C.C. Sheet No.
9393
SOUTHWEST GAS CORPORATIONP.O. Box 98510Las Vegas Nevada 89193-8510Arizona Gas Tariff No. 7Arizona Division Canceling
SPECIAL SUPPLEMENTARY TARIFFENERGY EFFICIENCY ENABLING PROVISION
(Continued)
B. Determine Billing Cycle Use per HDD
D
Billing cycle use per HDD is calculated for each customer bill by subtracting thecustomer's billing cycle base load volume from current monthly metered use anddividing the difference by the billing cycle actual HDDs.
Billing cycle base load volume is equal to the customer's base load volume per daymultiplied by the number of days in the customer's billing cycle. Base load volumeper day for each customer is used to establish monthly non-temperature sensitiveusage. The base load volume per day is equal to the customer's lowest averagedaily use for the Summer Season billing periods. Average daily use is the customer'stotal monthly use divided by the number of days in the billing cycle. For newcustomers, base load volume per day will be the average base load volume per dayin the customer's operating district.
c. Calculate Billing Cycle Analysis Volume Adjustment
The billing cycle analysis volume adjustment is calculated by multiplying thecustomer's billing cycle HDD variance by the billing cycle use per Hob.
MULTI-SEASON ANALYSIS2)D
D
The multi-season analysis uses billing data from the previous 24 months todetermine weather-sensitive gas use and to calculate the multi-season analysisvolume adjustment.
l
l
i
i
ll
In order to determine the results of the multi-season analysis, a linear regression isutilized. A linear regression compares the customer's historical monthly metereduse to the actual weather in each billing cycle to establish the correlation betweenthe customer's gas use and the actual weather. The result of the linear regression isthe customer's weather sensitive use per HDD. The multi-season analysis volumeadjustment is calculated by multiplying the customer's billing cycle HDD varianceby the customer's multi-season weather sensitive use per HDD.
l
l
l
lII
EffectiveDecision No.
Issued byJustin Lee BrownVice President
Issued OnDocket No.
SUBSTITUTE PROPOSED TARIFF SHEET
A.C.C. Sheet No.A.C.C. Sheet No.
9494
SOUTHWEST GAS CORPORATIONP.O. Box 98510Las Vegas, Nevada 89193-851 oArizona Gas Tariff No. 7Arizona Division Canceling
SPECIAL SUPPLEMENTARY TARIFFENERGY EFFICIENCY ENABLING PROVISION
(Continued)
BILL ADJUSTMENT3)
DDD
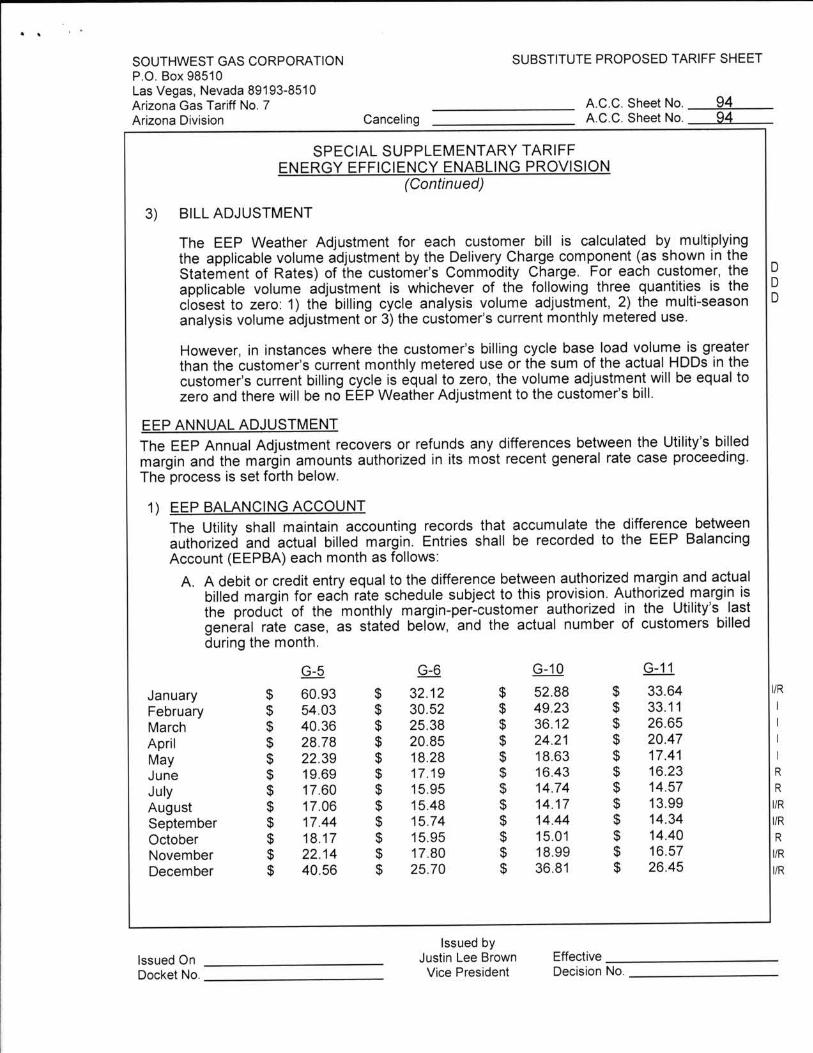
The EEP Weather Adjustment for each customer bill is calculated by multiplyingthe applicable volume adjustment by the Delivery Charge component (as shown in theStatement of Rates) of the customer's Commodity Charge. For each customer, theapplicable volume adjustment is whichever of the following three quantities is theclosest to zero: 1) the billing cycle analysis volume adjustment, 2) the multi-seasonanalysis volume adjustment or 3) the customer's current monthly metered use.
However, in instances where the customer's billing cycle base load volume is greaterthan the customer's current monthly metered use or the sum of the actual HDDs in thecustomer's current billing cycle is equal to zero, the volume adjustment will be equal tozero and there will be no EEP Weather Adjustment to the customer's bill.
EEP ANNUAL ADJUSTMENTThe EEP Annual Adjustment recovers or refunds any differences between the Utility's billedmargin and the margin amounts authorized in its most recent general rate case proceeding.The process is set forth below.
1) EEP BALANCING ACCOUNTThe Utility shall maintain accounting records that accumulate the difference betweenauthorized and actual billed margin. Entries shall be recorded to the EEP BalancingAccount (EEPBA) each month as follows:
A. A debit or credit entry equal to the difference between authorized margin and actualbilled margin for each rate schedule subject to this provision. Authorized margin isthe product of the monthly margin-per-customer authorized in the Utility's lastgeneral rate case, as stated below, and the actual number of customers billedduring the month.
G-11G-10MQQ33.6433.1126.6520.4717.4116.2314.5713.9914.3414.4016.5726.45
52.8849.2336.1224.2118.6316.4314.7414.1714.4415.0118.9936.81
$$$$$$$$$$$$
32.1230.5225.3820.8518.2817.1915.9515.4815.7415.9517.8025.70
l l
I
I
I
I
R
R
AIR
AIR
R
IlR
IlR
$$$$$$$$$$$$
60.9354.0340.3628.7822.3919.6917.6017.0617.4418.1722.1440.56
$$$$$$$$$$$$
JanuaryFebruaryMarchAprilMayJuneJulyAugustSeptemberOctoberNovemberDecember
$$$$$$$$s$$$
EffectiveDecision No.
Issued byJustin Lee BrownVice President
Issued OnDocket No.

I
EXHIBIT no. A-4
DIRECT TESTIMONY - CARLA D. AYALA
I
II
EXHIBIT
I /4 ;.._
IN THE MATTER OF
SOUTHWEST GAS CORPORATION
DOCKET no. G-01551A-16-0107
PREPARED DIRECT TESTIMONY
OF
CARLA D. AYALA
I
III
ION BEHALF OF
SOUTHWEST GAS CORPORATIONI
II
II
i
May 2, 2016

Table of Contentsof
Prepared Direct Testimonyof
CARLA D. AYALA
Paqe No.Description
1
2
...3
8
v...9
ll. METHODOLOGY USED TO DEVELOP BILLING DETERMINANTS.................
Ill. ADJUSTMENTS TO RECORDED NUMBER OF BILLS AND VOLUMES...............
IV. RESIDENTIAL CONSUMPTION PER CUSTOMER
NORMAL HEATING DEGREE DAY UPDATE TO THE MONTHLY WEATHERADJUSTMENT CALCULATION
Appendix A - Summary of Qualifications of Carla D. Ayala
Exhibit No.__(CDA-1)
Exhibit NO.__(CDA-2)
II
i
I
IIII

1 Southwest Gas CorporationDocket No. G-01551A-16-0107
2
BEFORE THE ARIZONA CORPORATION COMMISSION3
4 Prepared Direct Testimonyof
CARLA D. AYALA5
i. INTRODUCTION6
17 o .
1A.8
g
210 Q.
211 A.
12
313 Q.
Please state your name and business address.
My name is Carla D. Ayala. My business address is 5241 Spring Mountain
Road, Las Vegas, Nevada 89150.
By whom and in what capacity are you employed?
I am employed by Southwest Gas Corporation (Southwest Gas or the
Company) in the Systems Planning department. My title is Economist.
Please summarize your educational background and relevant business
14 experience.
relevant business experience are315 A. My educational background and
16
417 Q.
summarized in Appendix A to this testimony.
Have you previously testified before any regulatory commission?
418 A. Yes. I have previously testif ied before the California Public Utilities
Commission .19
520 Q.
521 A.
22
What is the purpose of your prepared direct testimony in this proceeding?
I sponsor the Company's adjustments to the recorded test year bills and
volumes, to derive the test period billing determinants.
623 o . Please summarize your prepared direct testimony.
624 A. My prepared direct testimony consists of the following key issues:
l2 5
l
l
l
-1_ ll
1
2
3
The adjustments made by Southwest Gas to the test year number of bills and
volumes to derive test period billing determinants.
Residential consumption per customer in Southwest Gas' Arizona rate
4
5
6
jurisdiction.
Recommendation to annually update the ten-year normal heating degree
days used to calculate the Energy Efficiency Enabling Provision (EEP)
7 weather adjustment.
II. METHODCLOGY USED TO DEVELOP BILLING DETERMINANTS8
7 Please describe the methodology Southwest Gas utilized to develop the test9 Q.
10
711 A.
12
13
period billing determinants.
The development of the billing determinants commenced with the compilation
of the monthly recorded number of bills and volumes by rate schedule for the
test year - the 12 months ended November 30, 2015. ll
1 4 After compiling the recorded number of bills and volumes for the test year,
Southwest Gas made the following adjustments to derive the adjusted test15
16.II
period billing determinants: (1) billing adjustments, (2) customer-specific
reclassifications, (4) weather17 volume annualizations, (3) customer
18
19
20
821 Q.
normalizations, and (5) customer annualizations. The details supporting these
adjustments are set forth more fully below, and are shown in the Schedule
H-2 Workpapers.
Why are adjustments made to the recorded test year number of bills and
volumes?22
823 A.
24
25
Adjustments are made to recorded bills and volumes to more accurately
ref lect the billing determinants that Southwest Gas would expect to
experience during the rate effective period under normal weather conditions
-2-

91 Q.
2
93 A.
4
5
6
7
8
Has Southwest Gas made any changes to the general methodology for
developing the billing determinants for the test period?
No. In fact, Southwest Gas utilized the same general methodology to develop
the billing determinants for its 2000 (Docket No. G-01551A-00-0309), 2004
(Docket No. G-01551A-04-0876), 2007 (Docket No. G-015551A-07-0504),
and 201 o (Docket No. G-01551A-10-0458) general rate cases in Arizona, and
this methodology was approved in Decision Nos. 64172, 68487, 70665 and
72723, respectively.
ill. ADJUSTMENTS TO RECORDED NUMBER OF BILLS AND VOLUMES9
1010 Q.
1011 A.
12
13
14
15
16
17
18
19
20
1121 Q.
1122 A.
Please explain Southwest Gas' proposed billing adjustments.
After compiling recorded test year billing determinants, significant billing
anomalies are investigated to ensure that the correct consumption level is
reflected for each month in the test year. A majority of the corrections for the
billing adjustments involve restating the monthly consumption levels for
customer bills to reflect actual monthly usage. These adjustments are
typically adjustments between months and do not impact the total test year
sales. This adjustment is necessary to ensure that the monthly adjusted
volumes accurately reflect actual test year consumption. Otherwise, distorted
monthly values would reduce the reliability of the regression analysis
associated with the weather normalization adjustments.
Please explain Southwest Gas' proposed volume annualization adjustments.
After completing the corrections for billing adjustments, customer-specific
23 volume annualization adjustments are performed to reflect a full year of
24 consumption for each active customer (excluding residential and small
commercial customers) billed during November 2015. The process involves25
-3-

1
2
3
estimating additional consumption for months during the test year where a
new customer was not on-line or was clearly in a start-up phase, as well as
removing consumption attributable to specific customers who discontinued
4
125 Q. proposed customer reclassification
service during the test year.
Please explain Southwest Gas'
6
127 A.
adjustments.
Customer reclassification adjustments move customers and their associated
8
9
10
consumption volumes between rate schedules. Reclassification adjustments
are required when a customer changes rate schedules during the test year.
For example, a general service customer whose consumption increases or
11
12
13
14
15
1316 Q.
1317 A.
18
decreases may qualify for a different rate schedule. These adjustments are
performed to ensure that customer-specific consumption reflects a full 12-
months of usage under the correct rate schedule at the end of the test year.
Reclassification adjustments do not impact the overall number of bills or
volumes for the test year.
Please explain Southwest Gas' proposed weather normalization adjustments.
Weather normalization adjustments are made to address warmer or colder
than normal weather during the test year and provide a more accurate
19 depiction of test period volumes under normal (average) weather conditions.
To the extent that weather for the test year deviates from normal weather20
21
22
conditions, heat-sensitive consumption per customer should be adjusted to
represent monthly test year volumes under normal weather conditions.
23
24
For the test year in this case, actual billing cycle heating degree days
were approximately 26 percent warmer than normal in Tucson and
25 approximately 31 percent warmer than normal in Phoenix. As a result of these
-4-

1 deviations from normal weather, adjustments to test period volumes were
2 computed to reflect anticipated volumes under normal weather conditions.
3 Weather normalization adjustments were completed for the following
4
5
6
7
8
9
10
rate schedules: G-5 Single Family Residential, G-6 Multi-Family Residential,
G-10 Single Family Low Income Residential, G-11 Multi-Family Low Income
Residential, G-15 Special Residential, G-20 Master-Metered Mobile Home
Park, G-25 Small, Medium, Large l and Large ll Master-Metered Apartments;
G-25 Small, Medium, Large I, and Large ll Small Commercial, and G-25 Large
I, Large ll and Transportation Eligible (TE) Large Commercial; G-25 Small,
Medium, Large I, Large ll and Transportation Eligible (TE) Armed Forces.
1411 Q. What heating degree day normal did Southwest Gas use to weather
normalize the heat-sensitive volumes for the test period?12
1413 A.
14
Southwest Gas used a ten-year average (120 months ended November
2015) of heating degree days, to represent normal weather conditions for the
15
1516 Q.
test period.
Is the use of ten-year average heating degree days to weather normalize the
heat-sensitive volumes consistent with Southwest Gas' prior practices for17
18
15
general rate cases in Arizona?
Yes. Southwest Gas has consistently utilized ten-year average heating19 A.
20
21
22
degree days to weather normalize test period volumes in every general rate
case filed in Arizona since 1986 (see Docket Nos. U-1551-86-300, U-1551-
86-301, U-1551-89-102, U-1551-89-103, U-1551-90-322, U-1551-92-253, u-
23 1551 -93-272, U-1551 -96-596, G-01551 A-00-0309, G-01551A-04-0876, G-
015551A-07-0504, G-01551A-10-0458 and Decision Nos. 60352, 64172,24
\
IiIi 25 68487, 70665 and 72723.)
-5-\ili
i
161 Q.
2
Please explain Southwest Gas' procedure for calculating the weather
normalization adjustments.
163 A. Southwest Gas conducts a regression analysis to quantify the historical
4
heat-sensitive customer5
relationships between actual monthly consumption per customer and heating
degree days for each class. The monthly
day factors (regression coefficients)6 consumption per heating degree
7
8
9
1710 Q.
quantified in the regression analysis are then applied to monthly heating
degree day deviations from normal to quantify the corresponding adjustments
to consumption per customer.
What was the impact of the weather normalization adjustments upon the test
11 year volumes?
The net result of the weather normalization adjustments was an increase in1712 A.
13 test year volumes of 60,419,523
1814 Q. Please explain Southwest Gas' proposed customer annualization
15
1816 A.
17
18
adjustments.
Customer annualization adjustments were computed for the following rate
schedules: G-5 Single Family Residential, G-6 Multi-Family Residential, G-10
Single Family Low Income Residential, G-11 Multi-Family Low income
and G-25 Small, Medium, Large I , and Large ll SmallResidential,19
Commercial.20
1921 Q.
1922 A.
23
What method was used to develop the customer annualization adjustments?
Southwest Gas utilized the same methodology adopted by the Commission
in Southwest Gas' last five general rate cases (see Docket Nos. U-1551-96-
24 596, G-01551A-00-0309, G-01551A-04-0876, G-015551A-07-0504, G-
01551A-10-0458 and Decision Nos. 60352, 64172, 68487, 70665 and25
_6-

1
2
3
4
5
6
7
8
9
10
11
2012 Q.
72723). This method captures the seasonal nature of test year customer
growth by comparing the number of customers in the last month of the test
year, November 2015, to the same month of the prior year, November 2014.
The growth in customers is then prorated across the test year in declining
intervals with 11/12ths of the adjustment in the first month of the test year
(December 2014), 10/12ths in the second month (January 2015) and so forth.
Adjustments to annualize volumes are made by multiplying the monthly
customer additions by the respective monthly weather-adjusted average use
per customer. Customer and volume adjustments are then added to the
weather-normalized monthly bills and volumes to produce annualized test
period monthly bills and volumes.
Why were the customer annualization adjustments only performed for the
residential and small commercial customer classes?13
All rate schedules other than residential and small commercial were2014 A.
15
16
17
18
19
20
21
22
annualized by individual customers, based upon customer-specific
information. These customer-specific annualization adjustments are covered
under the volume annualization adjustments discussed in Q/A 11. Because
of the sheer magnitude of the number of customers in the residential and
small commercial customer classes, which includes thousands of billing
records, tracking each customer's billing history to perform customer-specific
billing or annualization adjustments is impractical. Accordingly, customer
annualization adjustments are performed using the outlined methodology for
the residential and small commercial customer classes.23
24
25
_7-
211 Q.
2
213 A.
4
5
Please summarize the impact of the adjustments performed for the
preparation of the annualized number of bills and volumes for the test period.
The impacts of each of the adjustments upon the number of bills and volumes
included in the test year are indicated by rate schedule in Schedule H-2,
sheets 5-8. All of the adjustments (billing adjustments, customer-specific
volume annualizations, customer reclassifications, weather normalization and6
7
8
customer annualizations) were conducted to ensure the accuracy and
propriety of the number of bills and volumes used to establish rates.
iv. RESIDENTIAL CONSUMPTION PER CUSTOMER9
Please describe the historical trend in residential consumption per customer2210 Q
in Arizona.11
2212 A.
13
14
15
2316 Q.
17
2318 A.
Over the last 30 years, Southwest Gas has experienced significant declines
in residential consumption per customer. However, since its 2010 general rate
case (Docket No. G-01551A-10-0458), Southwest Gas has experienced a
slight increase in residential consumption per customer.
Were the declines in residential consumption per customer reflected in past
general rate cases filed by Southwest Gas?
Yes. In each general rate case filed in Arizona since 1986, weather-
per customer was lower than thenormalized residential consumption19
20
2421 Q.
22
previous rate case.
What are the primary reasons for the long-term downward trend in residential
consumption per customer?
2423 A.
24
The long-term downward trend in residential consumption per customer
occurred primarily because of continued improvements in the dwelling and
25 appliance efficiencies of Southwest Gas' customer base. Improvements in
-8-

I
1
2
3
254 Q.
energy efficiencies are reflected in both new customer growth and the
replacement, by existing customers, of older appliances with newer, more
efficient appliances.
What are the primary reasons for the slight increase in residential use per
customer since Southwest Gas' last rate case?5
256 A
7
8
g
Weather-normalized residential consumption per customer increased slightly
from 297 therms in the Company's last rate case to 302 therms in this
proceeding. Plausible factors for this subtle change from the long-term
downward trend in residential consumption per customer includes fewer
vacant homes on the market and Arizona's continued recovery from the10
11
12
13
14
economic impact of the recession. Another factor that should be considered
when comparing these numbers is that the weather-normalized residential
consumption from the last rate case included volumes from July 2009 to June
2010 - a time period in which Arizona was among the leaders in foreclosure
15 rates. The long-term trends in annual residential consumption per customer
16
17
utilized in each of Southwest Gas' general rate case proceedings since 1986
are graphically presented in Exhibit No._(CDA-1).
NORMAL HEATING DEGREE DAY UPDATE TO THE MONTHLY WEATHER18 v.
ADJUSTMENT CALCULATION19
2620 Q.
21
What is the effect of the Company's proposal to annually update the ten-year
normal heating degree days used in calculating the monthly weather
22
2623 A
24
adjustment?
The Company's proposal, as discussed in the prepared direct testimony of
Company witness Edward Gieseking, will provide a more accurate and timely
25
-g-
l
1 representation of recent trends in heating degree days and actual weather
2
273 Q.
4
275 A.
6
7
8
9
10
2811 Q.
experienced by customers.
What ten-year normal is currently being used in the monthly weather
adjustment and what modifications will be made to the calculation?
Southwest Gas has utilized a ten-year normal which was calculated in the
2010 Rate Case (Docket No. G-01551A-10-0458). As depicted in Exhibit
No._(CDA-2), there has been a significant decline in ten-year normals from
one rate case to another. Moving forward, Southwest Gas will annually
calculate a new ten-year normal at the end of each heating season and use
the new normal for the upcoming heating season.
How will the change in monthly weather adjustment heating degree days
benefit customers?12
2813 A. Comparing weather sensitive consumption to a more recent ten-year average
should result in a more precise monthly weather adjustment for our14
15
16
17
18
2919 Q.
customers. To the extent that a customer's change in gas use is attributable
to trending normal weather, updating the normal weather in the monthly
adjustment will more closely align the monthly weather adjustment with
changes in the customer's weather sensitive consumption.
Does this conclude your prepared direct testimony?
Yes.2920 A.
21
22
23
24
25
_10-

q
Appendix APage 1 of 1
SUMMARY OF QUALIFICATIONSCARLA D. AYALA
I graduated from New Mexico State University, Las Cruces, New Mexico, with a
Bachelor of Arts degree in Economics in 2003. Thereafter in December 2004, I graduated
from New Mexico State University, Las Cruces, New Mexico with a Master of Arts degree in
Economics with a specialization in Public Utility Regulation.
In 2005, I joined Southwest Gas as an Analyst in the Demand Planning Department.
In December 2009, I was promoted to Analyst Ill/Demand Planning and in November 2013, I
was promoted to Economist also within the Demand Planning Department. I am responsible
for performing bill frequency analysis for general rate case filings. I am also responsible for
the development of weather normalized billing determinants for rate cases, the development
of short- and long-range demand forecasts for rate cases and systems planning, analysis and
monitoring of the regional economy in each of Southwest Gas' rate jurisdictions and assorted
load research activities.
Additionally, I am a member of the National Association of Business Economics.

Noo f
3§l1J2'°<.>
oN
| \mN
' T 1 -
< o
8;-| 9d Q.
z
§L1J
2° ooN
r:,Q.cx
UJ
Nm(*)
v(v)
I
ofofof
nrUJE9
@3o»»8we(D
53<§z»z¢E8oUJDNn"'</>w- z§9o8(DO:-
_I
_
g§ L |J
2'50oN
plozoV
F
LU
s 2|..Z OLUQ Ew <Lu MM .I
<3zz<
Fl&LU
23 0oN
oLO
22280mQ -
2fLU
28 0oN
c oIOLD
2fLU
23 0COv
oLDN
omIf)
oo(O
o8 8 2 °2 §(swu3Hi) HBWOLSUO 83d NOlldWf1SNOO
2f LU
28 0m9 -

A
oofof
1 -
<72< 0Oo
LUU)<OL1J|-8
~8>.Isa
oz
u>.o>oofQ-
co1-oN
:
8.cXLU
1 -
om .5
Cq)o.cD.
l.lJ(D<OLU|-8o1-oN
Co(Do3
|-
LUw<o
ii'é>-m
Lu(D<OLU
8l\ooN
(D_I<EMOz>-<ou.l
<8¢z8 gUnQ.- 1~Mao<2°pm
<mI
I| -zOEM<OzLU_ |<oM<LU
>.o1 -
<rOF
3oLON
oLOv
oLDof
oLO(O
oLDNW
ou>o1-
oLO©1'
oLTW1-
SAVG 338930 SNllV3H

EXHIBIT no. A-5
DIRECTTESTIMONY- BYRON c. WILLIAMS
l
l
I
EXHIBIT
I 45

IN THE MATTER OF
SOUTHWEST GAS CORPORATION
DOCKET no. G-01551A-16-0107
PREPARED DIRECT TESTIMONY
OF
BYRON c. WILLIAMS
ON BEHALF OF
SOUTHWEST GAS CORPORATION
MAY 2, 2016
Table of Contentsof
Prepared Direct Testimonyof
BYRON c. WILLIAMS
Page No.Description
1INTRODUCTION|.2II. PROPERTY TAX TRUE-UP MECHANISM
6ill. PROTECTING AMERICANS FROM TAX HIKES ("PATH") ACT OF 2015 OR TAXEXTENDERS BILL....
7IV. ARIZONA CORPORATE STATE INCOME TAX
Appendix A - Summary of Qualifications of Byron C. Williams
1 Southwest Gas CorporationDocket No. G-01551A-16-0107
2
BEFORE THE ARIZONA CORPORATION COMMISSION3
4 Prepared Direct Testimonyof
BYRON c. WILLIAMS5
| INTRODUCTION6
17 Q.
18 A.
9
210 Q.
211 A.
12
Please state your name and business address.
My name is Byron C. Williams. My business address is 5241 Spring Mountain
Road, Las Vegas, Nevada 89150.
By whom and in what capacity are you employed?
I am employed by Southwest Gas Corporation (Southwest Gas or the Company)
in the Tax department. My title is Director/Tax.
313 o . Please summarize your educational background and relevant business
14
315 A.
16
417 Q.
experience.
My educational background and relevant business experience are summarized
in Appendix A to this testimony.
Have you previously testified before any regulatory commission?
Federal Energy Regulatory418 A. Yes. I have previously testif ied before the
Commission.19
520 Q.
521 A.
22
23
624 Q.
625 A.
What is the purpose of your prepared direct testimony in this proceeding?
My testimony supports the Company's request for a Property Tax True-up
mechanism. It also addresses certain post-test year changes to federal and
state income tax laws and explains how they impact the cost of service.
Please summarize your prepared direct testimony.
My prepared direct testimony consists of the following key issues:
-1-
1
2
3
4
The Company's request for a Property Tax True-up mechanism ,
Relevant tax provisions included in the Protecting Americans from Tax Hikes
(PATH) Act of 2015 or "tax extenders bill"; and
The applicable Arizona corporate state income tax rate.
ii. PROPERTY TAX TRUE-UP MECHANISM5
76 Q. Please describe the Property Tax True-up mechanism the Company is
7
78 A.
g
10
11
12
813 Q.
814 A.
15
16
requesting.
Southwest Gas is requesting authority to establish a Property Tax True-up
mechanism to track 100 percent of the change in the Arizona property tax
expense above or below the test year level. Please refer to the prepared direct
testimony of Company witness Edward Gieseking for detail on the calculation of
the surcharge associated with the Property Tax True-up mechanism.
What are some key factors related to property taxes in Arizona?
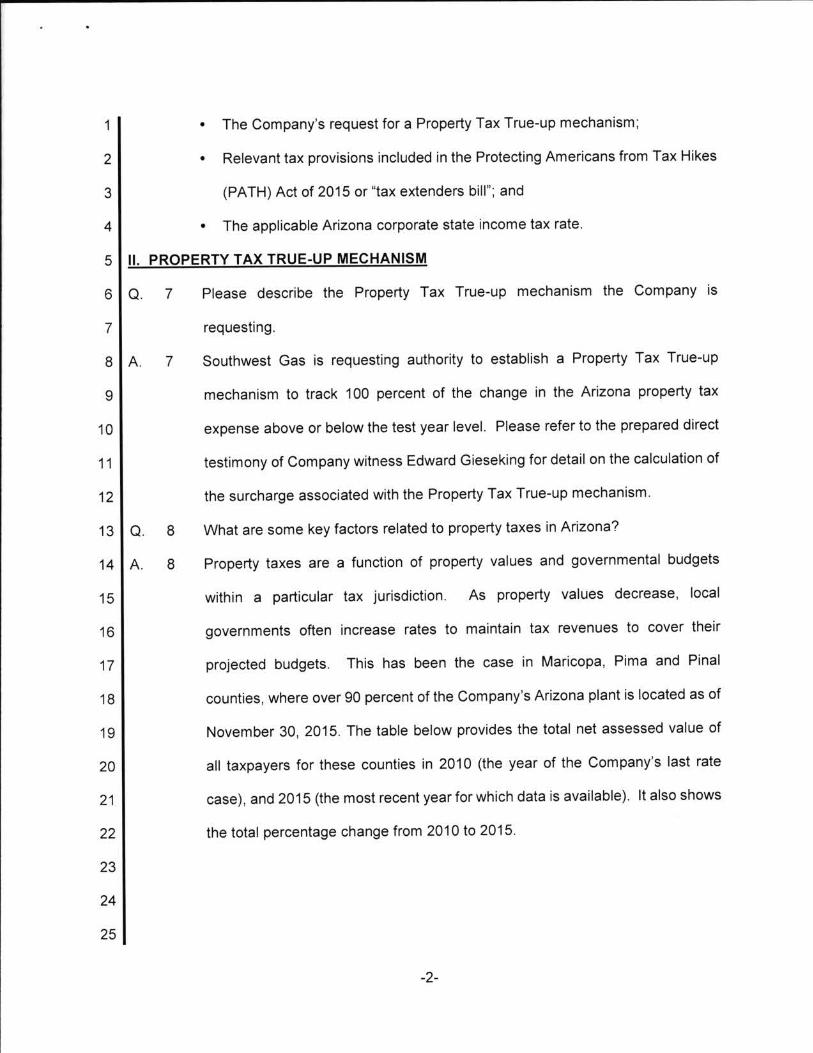
Property taxes are a function of property values and governmental budgets
within a particular tax jurisdiction. As property values decrease, local
governments often increase rates to maintain tax revenues to cover their
17
18
19
20
21
22
projected budgets. This has been the case in Maricopa, Pima and Pinal
counties, where over 90 percent of the Company's Arizona plant is located as of
November 30, 2015. The table below provides the total net assessed value of
all taxpayers for these counties in 2010 (the year of the Company's last rate
case), and 2015 (the most recent year for which data is available). It also shows
the total percentage change from 2010 to 2015.
23
24
25
-2_
1Pinal CountyPima CountyMaricopa County
Pinal %
Change
Pima %
Change
Tax
Year
Maricopa %
Change2
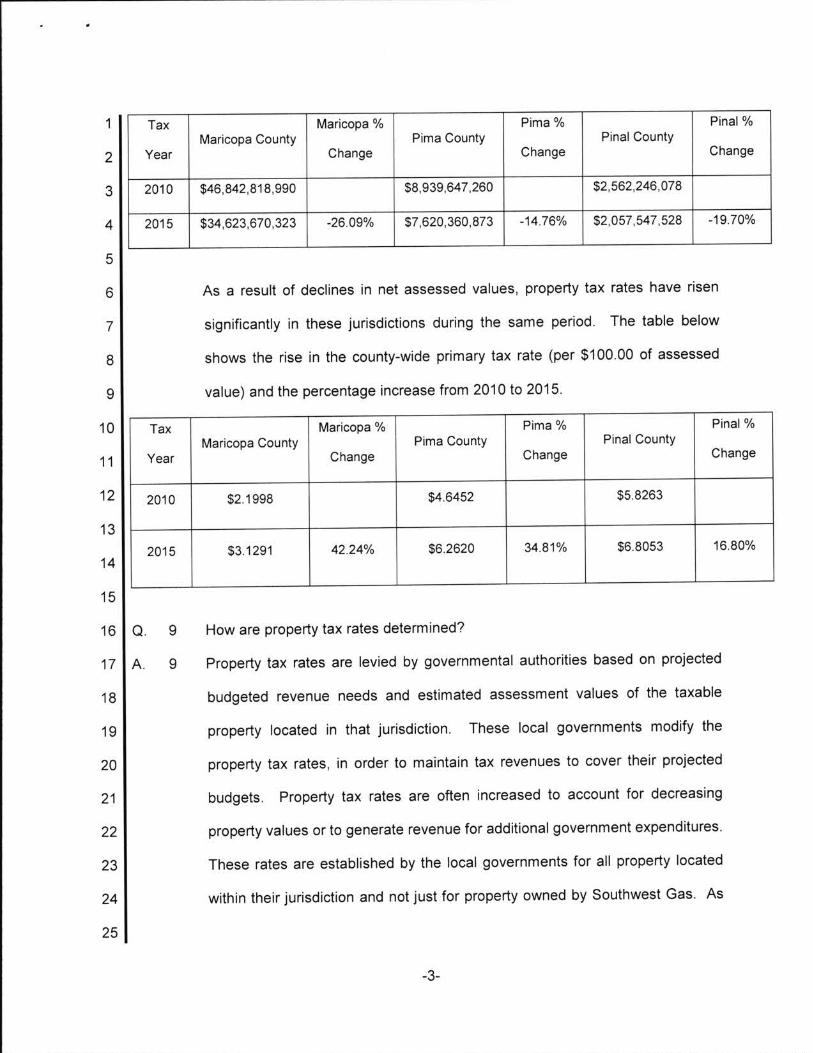
$2562246078$8,939,647,2602010 $46,842.8189903 - - --19.70%-14.76% $2057547,528-26.09% $7,620360,8732015 $34623,6703234
5
6
7
8
9
As a result of declines in net assessed values, property tax rates have risen
significantly in these jurisdictions during the same period. The table below
shows the rise in the county-wide primary tax rate (per $100.00 of assessed
value) and the percentage increase from 2010 to 2015.
10Pinal CountyPima CountyMaricopa County
Pinal %
Change
Pima %
Change
Tax
Year
Maricopa %
Change11
12 $58263$46452$219982010
1316.80%$6805334.81%$6262042.24%$3.12912015
14
15
916 Q.
17 A. 9
18
19
20
21
22
23
How are property tax rates determined?
Property tax rates are levied by governmental authorities based on projected
budgeted revenue needs and estimated assessment values of the taxable
property located in that jurisdiction. These local governments modify the
property tax rates, in order to maintain tax revenues to cover their projected
budgets. Property tax rates are often increased to account for decreasing
property values or to generate revenue for additional government expenditures.
These rates are established by the local governments for all property located
24 within their jurisdiction and not just for property owned by Southwest Gas. As
25
-3-

1 such, the determination of the Company's property tax expense is really beyond
2
103 Q.
the control of the Company.
Why has Southwest Gas' property tax rate changed significantly since its last
Arizona rate case?4
105 A.
6
7
A significant reason for the recent increase is the reduced property values,
particularly for personal residences. As noted above, as property values decline,
local governments increase the property tax rate to maintain or increase tax
8
9
10
revenues. In general, many taxpayers may be indifferent to lower values and
higher tax rates, as this may not significantly change the taxpayer's total tax
liability. However, the assessed value for Southwest Gas is primarily based on
the net book value of its fixed assets. Since the net book value of Southwest11
12 Gas property has increased (unlike residential values), when a local government
13
14
also increases rates, the Company's total property tax liability is
disproportionately affected. In addition, the majority of the Company's taxable
15
16
17
18
property is located in major population centers (e.g., Maricopa, Pima and Pinal
counties). The overall composite tax rates in these major population centers are
generally higher than those of less populated Arizona counties. Therefore, the
Company's composite rate is higher than the same type of business in more
rural areas of the state.19
1120 Q.
21
1122 A.
23
Are there other reasons why Southwest Gas' property tax liability increased
significantly since its last Arizona rate case?
Yes. In addition to the increased property tax rates calculated by the local
governments, the Company's Arizona property tax liability has increased since
24
25
the last Arizona rate case because of additional capital expenditures, primarily
for the replacement of natural gas infrastructure. These replacement
-4-

1 Company's overall assessed value, with noexpenditures increased the
2
3
124 Q.
125 A.
6
7
8
significant change in the capacity or mileage of the distribution system, and
without any increased revenues from customers.
Why is the Company proposing a Property Tax True-up mechanism?
In recent years, the Company's total Arizona property tax liability has varied
significantly from year to year without a direct correlation to the change in the
total fair cash value of the Company's property. This volatility creates a
significant difference between the property tax component in the authorized cost
of service and the actual property tax expense paid by the Company. For9
10
11
example, the Company's proposed Annualized Property Tax Expense per
Adjustment No. 15 in the instant proceeding is $41.6 million, compared to the
This is an increase of12 previously authorized recovery of $27.2 million.
13
14
15
16
17
approximately 53%, even though the full cash value of the Company's property
increased by only 27% over the same period. This imbalance is a result of a
number of factors, including significant increases in the property tax rates, which
are set by local governments. Southwest Gas believes that this volatility will
continue and that the test year level of property tax expense will be significantly
different than the actual tax payments during the years that rates from this18
19 proceeding are effective.
What are the benefits of the Company's proposed Property Tax True-up1320 Q.
mechanism?21
1322 A.
23
24
25
The proposed Property Tax True-up mechanism helps the Company address
the volatility associated with the Arizona property tax liability between rate cases.
As the determination of property tax rates are determined by local governments
and beyond the control of the Company, it is appropriate for changes in property
-5-

1
2
3
4
5
taxes to be deferred and collected or refunded in a surcharge. The Property Tax
True-up mechanism is a symmetrical mechanism, therefore, as the Arizona
property tax expense increases, there will be a surcharge to customers and as
the Arizona property tax expense decreases, there will be a credit to customers.
The idea is to ensure customers never pay more than the actual property tax
6
147 Q.
expense that is paid by the Company.
Have other Arizona utilities requested property tax adjustment mechanisms?
148 A. Yes. Both Arizona Public Services Company (Aps) in Docket No. E-01345A-
9
10
1511 Q.
11-0224 and UNS Electric, Inc. (UNSE) in Docket No. E-04204A-15-0142
requested property tax adjustment mechanisms.
Did the Arizona Corporation Commission (Commission) grant either of these
12
1513 A.
14
requests?
Yes. The Commission approved a property tax deferral for APS in Decision No.
73183 (May 24, 2012) as part of a settlement agreement. The UNSE request is
15 currently pending before the Commission, however, Staff recommends
16
17
accepting UNSE's proposed property tax recovery mechanism and states that it
"allows recovery for items that are beyond the control of the Company and
balances the interests of consumers and shareholders."'18
ill. PROTECTING AMERICANS FROM TAX HIKES ("PATH") ACT OF 2015 OR TAX19
EXTENDERS BILL20
1621 Q.
22
Have there been any significant federal income tax law changes that occurred
after the close of test year in this proceeding?
23
24
25 1 Direct Testimony of Donna H Mullinax, Docket No. 15-0142, at p. 34, II 2-4.
-6-

161 A. Yes. In December 2015, Congress passed and President Obama signed the
2 Protecting Americans from Tax Hikes (PATH) Act of 2015, sometimes referred
to as the "tax extenders be".3 This bill, among other things, extended 50 percent
4
5
17
bonus depreciation through 2017. and applied the bonus deduction retroactively
to depreciable property placed in service during all of 2015.
How did Southwest Gas treat the subsequent retroactive extension of 20156 Q.
7
178 A.
9
10
11
12
13
bonus depreciation for purposes of the current rate case?
Although the retroactive extension of bonus depreciation occurred after the close
of the Company's test year, the Company has adjusted its Accumulated
Deferred Income Tax (ADIT) balances to reflect 50 percent bonus depreciation
for all depreciable property placed in service in 2015. Please see the discussion
of Adjustment No. 20 in the prepared direct testimony of Company witness Randi
L. Cunningham. This is consistent with what will be filed in the Company's 2015
consolidated federal income tax return.14
18 Did Southwest Gas claim bonus depreciation on all eligible property placed in15 Q.
service since its last rate case?16
1817 A.
18
Yes, the Company has claimed bonus depreciation on all eligible assets since
the last rate case and that bonus depreciation is reflected in the ADIT balances
19 included in the instant filing.
IV. ARIZONA CORPORATE STATE INCOME TAX RATES20
1921 Q. What Arizona corporate income tax rate is the Company utilizing in the cost of
service calculation for the rate case?22
1923 A. The Company is utilizing a 5.5 percent Arizona corporate income tax rate in the
cost of service calculation for this proceeding (see Schedule C-3, Sheet 2). The24
25 5.5 percent rate is the Arizona statutory rate for the 2016 calendar tax year (as
l
i
il
-7-
l
1
2
3
4
5
stated in Ariz. Rev. Stat. §43-1111). This is a reduction from the 2015 calendar
tax year rate of 6.0 percent. In the Company's prior rate cases, the Commission
authorized post-test period adjustments when applicable events are known or
reasonably certain to occur and are measurable prior to hearing. By using the
2016 state corporate income tax rate, the cost of service more accurately reflects
6 the level of expenses and costs Southwest Gas will incur when rates approved
7
208 Q.
in the current proceeding go into effect.
Does this conclude your prepared direct testimony?
Yes.209 A.
10
11
12
13
14
15
16
17
18
19
20
21
22
23
24
25
-8-

Appendix APage 1 of 1
SUMMARY OF QUALIFICATIONSBYRON c. WILLIAMS
I am a graduate of Brigham Young University having received a Bachelor of Sciences
in Accounting in 2001. In 2003, I earned a Master's in Business Taxation from the University
of Southern California.
In 2002, joined the tax department of PricewaterhouseCoopers LLP in Los Angeles,
California. In 2010, ljoined the Las Vegas office and was promoted to Director in 2011. In
2013, I joined Southwest Gas as Director/Tax. l am responsible for all phases of the
Company's taxes, including preparation of all federal, state, and local tax returns and tax
provisions, researching tax matters and preparation of tax-related testimony and exhibits for
rate proceedings, including rate cases.
I have been licensed as a Certified Public Accountant by the state of California since
2007. In 2011, l was also licensed as a Certified Public Accountant by the state of Nevada.
I am also a member of the American Institute of Certified Public Accountants, as well as thei
iNevada Society of CPAs.
I
I
I
i|1
I
I
EXHIBIT no. A-6
DIRECTTESTIMONY- KRISTIEN M. TARY
EXHIBIT
I 1%
IN THE MATTER OF
SOUTHWEST GAS CORPORATION
DOCKET no. G-01551A-16-0107
PREPARED DIRECT TESTIMONY
OF
KRISTIEN m. TARY
ON BEHALF OF
SOUTHWEST GAS CORPORATION
MAY 2, 2016

Table of Contentsof
Prepared Direct Testimonyof
KRISTIEN m. TARY
Paqe No.Description
1I. INTRODUCTION2II. PURPOSE OF A CLASS COST OF SERVICE STUDY (CCOSS)3III. DEVELOPMENT OF THE CCOSS
Appendix A - Summary of Qualifications of Kristien M. Tary
i
1 Southwest Gas CorporationDocket No. G-01551A-16-0107
2
BEFORE THE ARIZONA CORPORATION COMMISSION3
4 Prepared Direct Testimonyof
KRISTIEN M. TARY5
| INTRODUCTION6
17 Q.
18 A.
9
210 Q.
211 A.
Please state your name and business address.
My name is Kristien M. Tary. My business address is 5241 Spring Mountain
Road, Las Vegas, Nevada 89150.
By whom and in what capacity are you employed?
I am employed by Southwest Gas Corporation (Southwest Gas or the Company)
12
313 Q.
in the Rates and Regulatory Analysis department. My title is Analyst ii.
Please summarize your educational background and relevant business
14
315 A.
16
417 Q.
experience.
My educational background and relevant business experience are summarized
in Appendix A to this testimony.
Have you previously testified before any regulatory commission?
No.418 A.
519 Q.
520 A.
21
22
23
What is the purpose of your prepared direct testimony in this proceeding?
I sponsor the Company's Class Cost of Service Study (CCOSS) reflected in
Schedule G and the associated work papers. I am also sponsoring certain
portions of Schedules A, C and E as identified in the Table of Contents for
Volume Ill of the Application.
624 Q.
625 A.
Please summarize your prepared direct testimony.
My prepared direct testimony consists of the following key issues:
-1-
1 The purpose of a CCOSS and summary of the schedules supporting the
2
3
Company's CCOSS in this proceeding; and
The process used to develop the Company's CCOSS.
4 ll. PURPOSE OF A CLASS COST OF SERVICE STUDY (CCOSS)
75 Q.
76 A.
7
8
9
10
11
What is the purpose of a CCOSS?
The purpose of a CCOSS is to allocate the cost-of-service, or revenue
requirement, to the appropriate customer rate classes, and determine the
resulting rate of return for each customer class included in the study. In this case,
the results of the CCOSS are used as a guide in establishing proposed class
revenues and developing proposed rates for each customer class. These topics
are discussed more fully in the prepared direct testimony of Company witness
12
813 o.
814 A.
Christy M. Berger.
How is this accomplished?
First, the Company's system and operations are analyzed to determine cost
causation factors. Once the causation factors are determined, each customer15
class is examined to determine their proportionate responsibility to each16
17
18
19
20
causation factor. Based on the proportionate responsibility of each customer
class, allocation factors are developed to use in the allocation of the Company's
costs. After each cost is allocated across customer classes, the allocated
amounts are summed, resulting in an allocation of revenue requirement to each
customer class. The sum of the revenue requirement allocated to each customer21
22
923 Q.
g24 A.
25
class will equal the Company's total revenue requirement.
Please describe the CCOSS schedules you are supporting.
I sponsor the CCOSS schedules summarized in Schedules G-1 and Schedule
G-2, Sheets 1 and 2. The CCOSS summarized in Schedule G-1 was performedi
l
_2-!
iI
l
l

1
2
using Southwest Gas' currently effective rates and rate schedules. Schedule G-
2, Sheet 1 reflects, by customer class, the rate of return requested in the
3
4
Company's Application. Schedule G-2, Sheet 2 reflects the rate of return at
Southwest Gas' proposed rates for each customer class.
III. DEVELOPMENT OF THE CCOSS5
106 Q. Please describe the process for developing the CCOSS.
107 A. The Company utilizes a three-step process to develop the CCOSS, where costs
8 are: 1) functionalized; 2) classified, and 3) allocated to the customer classes
9
1110 Q.
1111 A.
12
included in Southwest Gas' proposed rate design.
What is meant by cost fictionalization?
Cost fictionalization is the assignment of plant investment costs and expenses
to the appropriate operating functions. Southwest Gas' fictionalization follows
13
14
15
the Federal Energy Regulatory Commission (FERC) uniform system of
accounts. The major functions are production, storage, transmission, and
distribution. Since Southwest Gas currently has no production, storage or
transmission facilities in its Arizona service areas, all costs are appropriately16
functionalized as distribution.17
1218 Q.
1219 A.
20
21
22
23
24
What is meant by cost classification?
Cost classification is the process of identifying whether Southwest Gas' plant
investment costs and incurrence of expenses are related to: 1) providing
capacity, i.e. sizing its facilities to serve customers' maximum demands; 2) the
annual volume of gas actually delivered; or 3) providing customers with access,
including related meter reading and billing expenses, to Southwest Gas' service
irrespective of the amount of gas used. These are commonly referred to as
25 demand, commodity and customer classifications, respectively.
-3-

131 Q.
132 A.
3
What is meant by cost allocation?
Cost allocation is the process of apportioning costs classified as demand,
commodity or customer to each rate class based on distinct characteristics of
4 class demand, class consumption and number of customers associated with
each class. Demand-related allocations are based on relative customer class5
6
7
8
9
10
14
capacity demands. Commodity allocations are based on relative customer class
annual natural gas consumption. Customer allocations are related to the number
of customers in each class. A weighted customer class allocator is also
developed to recognize cost variations in providing service, such as meter and
service cost and billing expenses.
Is this the same process Southwest Gas has utilized in prior general rate cases?11 Q.
14 Yes. The Company has utilized, and the Commission has accepted, this12 A.
13 methodology for performing the CCOSS in the Company's past several rate
cases.14
15 Does this conclude your prepared direct testimony?15 Q.
Yes .1516 A.
17
18
19
20
21
22
23
24
25
_4-

Appendix APage 1 of 1
SUMMARY OF QUALIFICATIONSKRISTIEN M. TARY
I hold a Bachelor of Arts degree in Communication Studies from the University of
Nevada, Las Vegas.
In 2000, I began my career at Southwest Gas Corporation (Southwest Gas or
Company) as an Intern in the Corporate Communications Department. In 2001, I was hired
by the Company as a Professional Staff Entry in the Corporate Communications Department.
In 2004, I was promoted to Communications Representative. From 2001 to 2009, my primary
responsibilities included representing the Company both internally and externally regarding
communications, media relations, and consumer and community af fairs, providing
communications support for low income programs and regulatory/compliance items,
providing expertise and resources to create and execute strategic communications plans.
In 2009, I was promoted to Analyst ll in the State Regulatory Affairs Department. In
this position, my primary responsibility was to monitor and manage regulatory proceedings in
Arizona, California and Nevada, as well as ensure the Company met its regulatory
compliance obligations. In this role, l also facilitated and managed the data request process,
provided regulatory perspective when responding to customer inquiries, and acted as a
liaison with the state regulatory agencies and consumer advocates, when appropriate. In
addition, I collaborated with regulatory representatives from other utilities regarding statewide
initiatives, and assisted with legislative activities.
In October 2014, l transitioned into my current position as Analyst ll in the Rates and
Regulatory Analysis Department. In this role, I am responsible for handling various rate and
revenue requirement analysis for the Company's Arizona, California and Nevada ratemaking
jurisdictions. I primarily support the Arizona jurisdiction by calculating and implementing
customer rates, overseeing tariff administration, conducting economic feasibility analysis for
customer bypass, as well as preparing forecasted results of operations and developing
recommendations to management in support of corporate financial and regulatory goals. In
addition, I maintain complex and technical analyses of multiple components for the
Company's Arizona cost of service and rate design allocation model.
EXHIBIT no. A-7
DIRECTTESTIMCNY- KEVIN M. LANG
EXHIBIT
I -1
IN THE MATTER OF
SOUTHWEST GAS CORPORATION
DOCKET no. G-01551A-16-0107
PREPARED DIRECT TESTIMONY
OF
KEVIN M. LANG
ON BEHALF OF
SOUTHWEST GAS CORPORATION
MAY 2, 2016
Table of Contentsof
Prepared Direct Testimonyof
KEVIN m. LANG
Pace No.Description
1INTRODUCTION|.2
5
ll. CUSTOMER OWNED YARD LINES (COYL) EXPANSION ..
III. PRE-1970 VINTAGE STEEL PIPE REPLACEMENT AND OTHER AGINGINFRASTRUCTURE
Appendix A - Summary of Qualifications of Kevin M. Lang

1 Southwest Gas CorporationDocket No. G-01551A-16-0107
2
BEFORE THE ARIZONA CORPORATION COMMISSION3
4 Prepared Direct Testimonyof
KEVIN M. LANG5
I. INTRODUCTION6
17 Q.
18 A.
9
210 Q.
211 A.
12
Please state your name and business address.
My name is Kevin Lang. My business address is 5241 Spring Mountain Road,
Las Vegas, Nevada 89150.
By whom and in what capacity are you employed?
I am employed by Southwest Gas Corporation (Southwest Gas or the Company)
in the Engineering Staff department. My title is Director/Engineering Staff.
3 Please summarize your educational background and relevant business13 Q.
14
315 A.
16
417 Q.
418 A.
519 Q.
520 A.
21
22
23
624 Q.
625 A.
experience.
My educational background and relevant business experience are summarized
in Appendix A to this testimony.
Have you previously testified before any regulatory commission?
Yes. I have previously testified before the California Public Utilities Commission.
What is the purpose of your prepared direct testimony in this proceeding?
I sponsor from an operations perspective, the Company's proposal to expand
its Customer Owned Yard Line (COYL) program, and the Company's proposal
to accelerate the replacement of pre-1970 vintage steel pipe as part of its Gas
Infrastructure Modernization (GIM) mechanism.
Please summarize your prepared direct testimony.
My prepared direct testimony consists of the following key issues:
-1_
i
1 An operational overview of Southwest Gas' current COYL program, and the
2
3
proposed expansion of the COYL program, and
An operational overview of the Company's proposed program to replace pre-
4 1970 vintage steel pipeline and other aging infrastructure.
5 ii. CUSTOMER OWNED YARD LINES (COYL) EXPANSION
76 Q.
77 A.
Please provide a brief history of Southwest Gas' COYL program.
As part of Decision No. 72723 in Southwest Gas' 2010 general rate case, the
8
9
10
11
12
13
14
Commission approved the Company's COYL program consistent with the terms
of a Settlement Agreement involving the Company, the Commission's Utilities
Division Staff (Staff), and other parties to the docket. For the purpose of this
program, the Company defines a COYL as the customer-owned exterior gas
piping that connects at the meter and continues to where the gas piping enters
the customer's premise. The Company originally proposed a COYL program
after noticing an upward trend in odor calls related to COYLs. Prior to the COYL
15
16
17
program, a customer's only option for remedying a leaking COYL was to pay
Southwest Gas to replace the COYL with Southwest Gas facilities and relocate
the gas meter, hire a licensed plumber to repair the leak or replace the COYL,
18 or discontinue natural gas service to the customer. Through settlement
19
20
21
22
23
24
negotiations, the settling parties were able to negotiate a settlement that
included a COYL program designed to replace all COYLs within its service
territory - subject to customer approval.
As initially designed, the COYL program authorized the Company to leak
survey COYLs and provide those customers with leaking COYLs the opportunity
to replace their COYLs with facilities owned and operated by Southwest Gas.
As discussed in more detail below, the Commission authorized Southwest Gas25
-2-

1
2
3
4
to expand its COYL program in January 2014 (Decision No. 74304). This
expansion allows the Company to replace COYLs in conjunction with its other
pipe replacement activities, and regardless of whether or not the COYLs are
leaking.
85 Q.
86 A.
7
8
g
10
11
12
13
14
15
16
917 Q.
g18 A.
19
20
21
1022 Q.
Why was the COYL program modified in Decision No. 74304?
The original COYL program, as approved in Decision No. 72723, allowed the
Company to relocate the gas meter and replace the COYL only in those
instances where the COYL is found to be leaking. The proposal to modify the
program was driven by the Company's estimate that at the replacement rates
experienced, it could take up to 50 years to completely remove all Arizona
COYLs. The modification to the program in Decision No. 74304 included the
proactive approach of offering to replace the COYL (with the customer's
consent) in coordination with the Company's major pipe replacement projects
regardless of whether or not they are leaking. The intent was to accelerate the
replacement activity to ensure a more timely removal of all COYL from the
Southwest Gas system .
What is the current status of the Southwest Gas COYL program?
Southwest Gas provides annual COYL reports each February to the
Commission. These reports document the continued success of the Company's
COYL program. As of December 31, 2015, Southwest Gas replaced a total of
8,518 COYLs with facilities that are owned and operated by the Company.
What is the Company proposing in this rate case with respect to the COYL
23
1024 A.
25
program?
To build upon the success of the existing COYL program, the Company
proposes to expand the program to include a proactive, systematic approach to
-3-

1
2
3
4
5
6
117 Q.
replacing COYLs, regardless of whether or not they are leaking. This would allow
the Company to focus resources to replace COYLs, giving considerations to leak
rates, COYL concentration, acceptance rates, customer demographics, etc.,
regardless of whether the COYL is leaking or not. The Company also proposes
to slightly modify leak survey commitments to allow more flexible scheduling of
leak surveys.
Why is the Company requesting expansion of the COYL program in this
8
11g A.
10
11
12
13
proceeding?
Consistent with the goal of replacing all Arizona COYLs, the Company
recognizes that there are still certain COYL customers that cannot take
advantage of the replacement aspect of the program because their COYL is not
leaking or they do not live in the vicinity of a planned replacement program by
the Company. The Company estimates that approximately 86,205 total COYLs
exist as of December 31, 2015. When combined with the other aspects of the14
15 current program, the proposed expansion would allow the Company to reach
those additional customers and will lead to eliminating all remaining COYLs in16
17 Arizona in a more timely fashion.
1218 Q.
1219 A.
20
21
22
23
24
25
Please describe the proposed change to the leak survey frequency?
To effectuate the intent that each known COYLs in the Company's system be
inspected once every three calendar years (i.e., that a COYL surveyed in year
1 of the program is surveyed again in year 4 of the program), Decision No. 72723
requires the Company to leak survey approximately one-third of its COYLs each
year. In light of both the recent and proposed expansions of the COYL program,
which allow for the replacement of COYLs regardless of whether they are
leaking, modifying the "approximately one-third" requirement would provide
-4-
1
2
3
4
5
6
Southwest Gas greater flexibility to manage its COYL leak surveys. Accordingly,
the Company proposes that the requirement to leak survey approximately one-
third of its COYL inventory each year be restated as a requirement that the
Company leak survey each known COYL once every three calendar years. This
change will better accommodate the current state of the COYL program while
continuing to satisfy the original intent of Decision No. 72723.
PRE-1970 VINTAGE STEEL PIPE REPLACEMENT AND OTHER AGINGIll.7
INFRASTRUCTURE8
13g Q. How has industry focus evolved on pipeline safety since the last general rate
case?10
1311 A.
12
13
14
15
16
17
18
19
20
21
1422 Q.
23
1424 A.
Since the test period in the Company's last general rate case (June 2010), there
has been several large profile incidents that have heightened industry focus on
replacing aging infrastructure to enhance pipeline safety efforts. Several of these
efforts consist of modernizing pipeline systems to ensure natural gas operators
meet modern requirements for record keeping and documentation regarding
pipeline construction practices, material selection, material and pipeline testing,
and other key elements of modern pipeline construction requirements. In
addition, modernizing pipeline systems gain the benefit from the substantial
enhancements to pipe quality and performance standards, steel pipe coating
systems, and other construction and testing standards that have evolved over
the past several decades.
What is the Company proposing with respect to modernizing its distribution
system through the replacement of pre-1970's vintage steel pipe in Arizona?
Southwest Gas is proposing to accelerate the replacement of pre-1970's vintage
steel distribution and transmission pipe. Pre-1970's vintage steel pipe is defined25
-5_

1
2
(for the purposes of this proposal) as all pipe with known installation dates prior
to January 1, 1970. The Company seeks to include this accelerated replacement
3
4
155 Q.
in its proposed GIM mechanism. The GIM mechanism is discussed in the
prepared direct testimony of Company witness Edward Gieseking.
How much pre-1970's vintage steel distribution and transmission pipe does
Southwest Gas have in its Arizona service territories?6
157 A.
8
9
10
11
Southwest Gas has approximately 193 miles of transmission pipe and 5,741
miles of distribution pipe that are pre-1970's vintage steel in Arizona. This
represents approximately 63% of the total transmission mileage and
approximately 82% of the total distribution steel pipe mileage in Arizona
respectively. 1
1612 Q.
1613 A.
14
15
16
17
What is the significance of pre-1970's vintage steel pipe?
Prior to 1970, federal and state pipeline safety code requirements had not been
formally established for pipeline construction practices, material selection,
material and pipeline testing, cathodic protection requirement, recordkeeping
requirements, and other key elements of modern pipeline construction
requirements. Older pipelines do not have all of the safety features associated
18
19
20
21
with modern pipelines such as improved coatings, enhancements to steel pipe
quality and performance standards, more comprehensive welding procedures,
and enhanced testing requirements. Prior to the promulgation of state and
federal pipeline safety regulations, operators utilized industry consensus
standards and other industry practices of the time to govern pipeline construction22
23
24
25
1 Percentages based upon comparison to 2015 Pipeline and Hazardous Materials Safety Administration(PHMSA) Annual Report data for Southwest Gas Corporation mileage within Arizona for total transmissionand total distribution steel.
-6-
!
1 practices, material selection, and material and pipeline testing. These
2 consensus standards were voluntary and not as comprehensive as the
3
4
5
6
7
8
9
10
11
mandatory pipeline safety standards in place today.
Steel pipe is prone to corrosion which can lead to leaks in a piping system.
Corrosion can be mitigated through the adequate application of cathodic
protection on steel pipe. Cathodic protection is achieved through the
combination of a protective coating system and the application of an electric
current in order to modify the electric potential of the metal surface to prevent
corrosion. Federal and state pipeline safety rules mandated the cathodic
protection of all steel pipe after 1970. The possible lack of cathodic protection
on pre-1970's vintage steel pipe therefore presents a potential corrosion risk to
12
13
14
the pipe
In addition, before the implementation of state and federal pipeline safety
codes, pipeline installation records were not as complete as they are today, and
15
16ll
17
were not always retained for the same length of time as they are today. The
Pipeline and Hazardous Materials Safety Administration (PHMSA) recently
issued a Notice of Proposed Rulemaking (NPRM) to address pipe testing, lack li
18i
19
20
21
of adequate material records, and the establishment of Maximum Allowable
Operating Pressure (MAOP) for steel transmission pipelines? This NPRM
proposes numerous provisions, including but not limited to requirements that
operators identify and remediate vintage steel transmission lines that were not
constructed or tested to current standards. This includes circumstances where22
23lII
24 2 Cn April 8, 2016, PHMSA released the Safety of Gas Transmission and Gathering Lines Proposed Rulein the Federal Register under PHMSA Docket No. PHMSA-2011-0023.
25
_7-

1
2
3
4
5
6
the MAOP was established based upon Historical Operating Pressure (HOP)
pursuant to the grandfather clauses of the federal pipeline safety code.
The NPRM also proposes verification of pipeline materials where an
operator's data may not be complete, requirements to verify MAOP through
several proposed methods in the event MAOP was established utilizing the
grandfather clause, and other key improvements and enhancements to the
all of which will require operators to make7 federal pipeline safety code
8
g
10
11
12
13
14
1715 Q.
16
1717 A.
18
19
20
21
significant investments in their systems to ensure compliance. Although a final
rule has not yet been issued, the Company's proposal takes into account the
potential replacement of pre-1970's vintage transmission steel pipe that would
be necessitated by the promulgation of this proposed regulation.
The accelerated replacement of pre-1970's vintage steel pipe will address
all of these factors by allowing the Company to bring all of its steel system up to
modern construction and recordkeeping standards.
Is Southwest Gas proposing to accelerate the replacement of pre-1970's vintage
steel distribution or transmission pipe because they are unsafe to operate?
No. The pre-1970's vintage steel distribution or transmission pipe in Southwest
Gas' system do not present an immediate safety concern and the Company
maintains vigorous programs to ensure the distribution system is operated in a
safe and reliable manner. To the contrary, the Company's proposal seeks to
proactively replace this aging infrastructure before it becomes unsafe.
22
23
24
25
3 PHMSA Advisory Bulletin ADB-2012-06 describes the grandfather clause as a "method (which) allowspipelines that had safely operated prior to the pipeline safety MAOP regulations to continue to operateunder similar conditions without retroactively applying recordkeeping requirements or requiring pressuretests". This provision was promulgated in the federal pipeline safety code in 49 CFR Part 192.619(C).
-8-
1
2
3
4
However, a portion of Southwest Gas' pre-1970's distribution system in
Arizona was installed by other operators and later acquired by the Company.
This further compounds the challenges of the completeness of pipeline records
and the operations and maintenance history of these facilities.
What does Southwest Gas do to address the unsafe pipe in its system?185 Q.
is replaced immediately in186 A. Unsafe pipe, regardless of age or pipe type,
accordance with7 Company's Operations Manual.the The Company's
distribution and transmission integrity management programs work to identify8
g
10
those pipelines that may represent a safety concern and address those concerns
through additional or accelerated actions and preventative and mitigative
11
12
13
1914 Q.
1915 A.
16
17
18
measures. Furthermore, Southwest Gas' integrity management programs and
Operations Manual are designed to meet or exceed current federal and state
pipeline safety requirements.
Please describe the Company's distribution integrity management program.
The Company's distribution integrity management program involves a risk-
based process to gather and evaluate information about the Company's
distribution system and to prioritize and implement actions based upon that
information to maintain the safety and integrity of those systems. Southwest Gas
conducts an annual evaluation and assessment that assists in the determination19
20
21
20
of whether to schedule a particular pipe segment for replacement or whether to
implement other risk control practices such as additional leak surveys.
Please describe the Company's transmission integrity management program.22 Q.
2023 A. The Company's transmission integrity management program addresses
in locations where people gather, called high24 transmission pipelines
25 consequence areas. Pipelines in high consequence areas are inspected beyond
-9-
1 normal levels of operations and maintenance. These inspections, called
2 assessments, are repeated on a regular interval, for an increased level of
awareness and maintenance.3
214 Q.
5
Does the proposed accelerated replacement of pre-1970's vintage steel pipe
replace the processes established through the Company's integrity
6
217 A.
8
g
10
11
12
management programs?
No, it complements them. The Company's integrity management programs will
continue to identify and address potential safety concerns through normal
operations. The accelerated replacement of pre-1970's vintage steel pipe will
complement and build upon the success of the Company's integrity
management plans by combining the risk based approach of integrity
management with a comprehensive and proactive approach to modernize the
13
22Q.14
15
16
17
2218 A.
19
20
21
Company's infrastructure.
Why is Southwest Gas proposing to accelerate the replacement of pre-1970's
vintage steel pipe if no safety concern exists and the Company has a functional
integrity management program that addresses potential safety concerns in its
system?
As mentioned previously, Southwest Gas has nearly 6,000 miles of pre-70's
vintage steel pipe in Arizona. Given the large amount of pre-1970's vintage steel
pipe in Arizona, Southwest Gas recommends a program be developed to start
working towards modernizing these facilities in a systematic and methodical
22 approach that does not unduly burdensome Southwest Gas or its customers. In
23
24
25
addition, the proposed accelerated replacement of pre-1970's vintage steel pipe
will accomplish a number of key operational objectives including: (1) the
modernization of the Company's steel pipe facilities to current industry safety
-10-
1
2
3
4
5
6
237 Q.
8
9
standards, and (2) the elimination of vintage steel pipelines with MAOPs
established based upon HOP. Further, this modernization program will also
provide enhanced safety and reliability of the distribution and transmission
systems through enhanced record keeping and documentation regarding
pipeline construction practices, material selection, material and pipeline testing,
as well as improved pipe quality and performance standards of newer facilities.
If Southwest Gas does not receive approval to recover the costs of accelerated
replacement of pre-1970's vintage steel pipe through the GIM mechanism, will
the Company proceed with its plans to replace this pipe on an accelerated
basis?10
2311 A.
12
13
14
2415 Q.
No. Without the rate making support provided by the GIM mechanism, the
Company will not be able to accelerate the replacement of this aging
infrastructure and will rely solely on the traditional approach of budgeting
replacement work with the timing of rate case activity.
Does this conclude your prepared direct testimony?
Yes .2416 A.
17
18
19
20
21
22
23
24
25
-11-

Appendix APage 1 of 2
SUMMARY OF QUALIFICATIONSKEVIN M. LANG
Kevin M. Lang is the director/Engineering Staff for Southwest Gas Corporation
(Southwest Gas). He directs and coordinates support to five operating divisions for pipeline
safety code compliance, right-of-way support, material specif ications and approval,
environmental policies and procedures, proper energy measurement, pipeline cathodic
protection, SCADA support, project design, and the training and qualification of technical
services personnel. He previously oversaw the Company's distribution integrity management
program and laboratory services under the same capacity.
Mr. Lang joined Southwest Gas in 2003 as an engineer in Victorville, eA. He was
subsequently promoted to distribution engineer in 2005, supervisor/Engineering in 2006 and
During this period, Mr. Lang oversaw the design ofmanager/Engineering in 2007.
transmission and distribution facilities for new business, franchise and system
reinforcements, PVC pipeline replacements, pipeline safety code compliance, MAOP studies
and requalification programs, and preparation of short and long-term capital budgets.
He was promoted to director/Gas Operation Support Staff in 2011 where he directed
the Company's technical skills training, Operator Qualification (OQ) training and testing, tool
and equipment evaluations, operations-related procedures manuals, Incident Command
System training and operation of the Emergency Response Training Facilities in Tempe and
Las Vegas. Mr. Lang was subsequently promoted to director/Engineering Staff in November
of 2012.
He holds a Bachelor of Science degree in Mining Engineering from Virginia Tech. He
is a registered Professional Engineering in the state of Nevada with a proficiency in Civil

Appendix APage 2 of 2
Engineering. Mr. Lang currently serves on the American Gas Association's Operations Safety
Regulatory Action Committee.

EXHIBIT no. A-8
DIRECTTESTIMONY- BRIAN T. HOLMEN
EXHIBIT
8I

I
I
3I
II
II
II
IN THE MATTER OF
SOUTHWEST GAS CORPORATION
DOCKET no. G-01551A-16-0107
PREPARED DIRECT TESTIMONY
OF
BRIAN T. HOLMEN
I ON BEHALF OF
SOUTHWEST GAS CORPORATION
May 2, 2016

iTable of Contentsof
Prepared Direct Testimonyof
Brian T. Holmen
Paqe No.Description
i
il
l
I
I
i
li
1
5 lI
11
17
ll. OVERVIEW OF THE COMPANY'S EXECUTIVE COMPENSATION PROGRAMS
III. HAY GROUP'S ASSESSMENT OF THE COMPANY'S EXECUTIVECOMPENSATION .
IV. COMPENSATION INCLUDIBLE IN CUSTOMER RATES UNDER APPLICABLEI
I
Appendix A .- Summary of Qualifications of Brian T. Holmen
Confidential Exhibit No._(BTH-1)
II
I
iI
1 Southwest Gas CorporationDocket No. G-01551A-16-0107
2
BEFORE THE ARIZONA CORPORATION COMMISSION3
4 Prepared Direct Testimonyof
Brian Holmen5
I. INTRODUCTION6
17 o.
18 A.
9
Please state your name and business address.
My name is Brian Holmen. My business address is 2 Park Plaza, Suite 250,
Irvine, California 92614.
210 Q.
211 A.
12
13
By whom and in what capacity are you employed?
I am an executive compensation consultant employed by Korn Ferry Hay Group
(Hay Group) as the West Region Leader for Board Solutions. My title is Senior
Principal.
314 Q. Please summarize your educational background and relevant business
15
316 A.
17
418 Q.
experience.
My educational background and relevant business experience are summarized
in Appendix A to this testimony.
Have you previously testified before any regulatory commission?
No.419 A.
520 Q.
521 A.
22
2:3
24
25
What is the purpose of your prepared direct testimony in this proceeding?
The purpose of my testimony is threefold. First, I provide an overview of the
executive compensation programs and incentive plans offered by Southwest
Gas Corporation (Southwest Gas or the Company) and describe the changes
made to the incentive plans since the Company's last rate application to the
Arizona Corporation Commission (Commission) in 2010. Second, Hay Group
-1_
I
1
2
performed an objective assessment of the competitive positioning of the
Company's executive compensation pay levels and design relative to the market
for nineteen senior executives who hold the title of Vice President (VP) or a more3
4
5
6
senior title (collectively, the Executives), the results of which I summarize in my
testimony. Third, I provide my opinion on the portion of the Company's executive
compensation costs and incentive program costs that I believe should be
7 recovered through customer rates.
68 Q. In reviewing the competitive positioning of the Executives' compensation
9
610 A.
programs, what aspects of compensation did Hay Group analyze?
Hay Group analyzed the following elements of executive compensation in its
market review:11
12 Base Salary
Target Total Cash Compensation (TCC)13
o Each Executive's TCC is comprised of base salary plus the cash portion14
15
16
•
of the Executive's target annual incentive granted pursuant to the
Company's Management Incentive Plan (MIP).
Target Total Direct Compensation (TDC)17
18
19
o For survey data comparisons, TDC for each Executive is equal to TCC
plus the target value of equity awards granted to the Executive pursuant
to the MIP and the Company's Restricted Stock Unit Plan (RSUP).20
21
22
23
24
25
_2-

I|
1 o For proxy data comparisons, TDC for each Executive is equal to TCC
2 plus grant date fair value of equity awards granted the Executive
1
3
4
pursuant to the MIP and RSUP.
Supplemental Executive Retirement Proqram (SERP)
5 o Hay Group reviewed the design and benefit levels among the Company's
6
7
•
public-company peer group with respect to supplemental executive
retirement programs for purposes of evaluating the SERP.
Executive Deferral Plan (EDP)8
Og
10
Hay Group reviewed the EDP design and benefit levels compared to
survey data in Hay Group's 2014 Executive Benefits Survey and Towers
Watson's 2013 Executive Retirement Survey.11
i
il712 Q. Did Hay Group prepare a written report of its assessment?
i(BTH-713 A. Yes. A copy of Hay Group's report is attached as Confidential Exhibit
14
815 o.
8
i
ili
l3
16 A.
lW
1) to my testimony.
Please summarize your prepared direct testimony.
My prepared direct testimony sets forth my analysis to support the following
conclusions:17
•18
19
The Company's executive compensation programs and incentive programs
are similar in design to those described in the Company's last rate application
filed with the Commission in 2010, subject to updates to the designs of the20 i
21 Company's MIP and RSUP.
22
23
24
25
1 The different methodologies for determining TDC are a function of how data is reported in surveys versusproxies. Proxy summaries disclose grant date fair value of long-term equity awards and Hay Group usedthis methodology for both the Company and the proxy peer companies to obtain a consistent comparison.
-3-.i
i

1
2
3
4
5
Based on its review of the competitive market, Hay Group concludes as
follows: the aggregate compensation paid to the Executives is generally
within or below the range of competitive compensation levels relative to the
comparator markets that we reviewed (proxy and survey data), the
performance metrics used within the MlP and RSUP are in-line with common
6 market practices among the Company's public-company peer group
7
8
companies, the SERP is in line with programs provided by the Company's
public-company peer group companies with respect to both design and level
of benefits, and the EDP is in line with survey data on executive retirementg
10
•11
12
13
14
practices as set forth in Hay Group and Towers Watson surveys.
The following executive compensation costs should be recovered through
customer rates as reasonable and necessary costs to attract and retain
qualified Executives and employees who are delivering superior results for
the Company's customers:
o 100% of the Executives' base salaries15
16
17
18
19
20
21
22
23
24
25
o 100% of the Company's MIP award costs, except for the MIP costs
associated with awards payable to the Company's President and CEO,
its CFO and its SVP, Corporate Development, with respect to whom 90%
of the Company's MIP award costs should be recovered
o 100% of the Company's RSUP award costs, except for the RSUP costs
associated with the awards payable to the Company's President and
CEO, its CFO and its SVP, Corporate Development, with respect to
whom 90% of the Company's RSUP award costs should be recovered
o 100% of the Company's costs relating to the SERP
o 100% of the Company's costs relating to the EDP
_4-

ll. OVERVIEW OF THE COMPANY'S EXECUTIVE COMPENSATION PROGRAMS1
92 Q.
93 A.
4
Please describe the components of each Executive's TDC.
TDC for each Executive is comprised of three components: (i) base salary, (ii)
annual cash incentive opportunity granted pursuant to the MIP and (iii) annual
5 equity award grants made pursuant to the MIP and RSUP.
Please describe the MIP.106 Q.
7 A. 10 The MIP is an annual incentive program that provides Executives and other
8
g
participating employees with an opportunity to receive variable, at-risk pay
based upon the achievement of specific benchmarks that are critical to the short-
i10 term and long-term success of the Company and that reward superior
11
12
13
14
15
16
17|I
18
19
20
21
performance for the Company's customers. For each participating Executive
and employee (other than the Company's President and CEO, its CFO and its
SVP, Corporate Development) the MIP includes the following five performance
metrics: (i) Customer Satisfaction, (ii) Customer-to-Employee Ratio, (iii) Safety,
(iv) Return on Equity and (v) Operating Cost Containment. Each performance
metric is equally weighted at 20%, and actual performance may vary from 70%
to 140% of the target incentive opportunity with respect to each metric based on
performance relative to the target. No MIP awards are paid in any year unless
dividends on the Company's common stock for that year equal or exceed the
prior year's dividends. The five metrics are designed to reward participants for
the following performance:
Customer Satisfaction.22
23
Designed to reward success in achieving a
predetermined customer satisfaction percentage.
24 Customer-to-Emolovee Ratio. Designed to reward success in improving the
25 customer-to-employee ratio.
-5-

1
2
•3
4
•5
Safety. Designed to reward success in minimizing damages per 1,000
tickets and incident response time.
Operating Cost Containment. Designed to reward success in achieving a
predetermined percentage of cost containment or operating costs.
Return on Equity (ROE). Designed to reward success in achieving the
6
7
8
g
10
11
12
13
14
15
16
average authorized return on equity.
The MIP awards granted to the Company's President and CEO, its CFO
and its SVP, Corporate Development include a sixth metric, Construction
Services, which is tied to the Company's non-regulated construction services
segment. For each of these three executives, the Construction Services metric
represents 10% of the target MIP opportunity, ROE represents 10% of the target
MIP opportunity, and the remaining four MIP metrics each represent 20% of the
target MIP opportunity.
Sixty percent of the total award earned under the MIP is paid in cash
following the financial close of the most recent calendar year. The remaining
40% of the total award earned under the MIP is issued as performance shares
in the form of restricted stock units, with the number of units calculated based17
18
19
20
21
22
1123 Q.
on the average price of the Company's common stock on the NYSE for the first
five trading days of the month in which the award is granted. The performance
shares vest with respect to 40 percent one year following the date of grant and
with respect to 30 percent on each of the second and third anniversaries of the
date of grant.
Has the MIP design changed since the Company's last rate application to the
Commission in 2010?24
25
-6-

111 A. Yes. Prior to the 2015 plan year, the MIP included the following equally-
2
3
4
5
6 applies to three
weighted metrics for all plan participants: (i) Customer Satisfaction, (ii)
Customer-to-Employee ratio, (iii) Return on Equity and (iv) Operating Cost
Containment. Beginning with the 2015 plan year, the Company added a new
metric to the MIP, Safety, which applies to all plan participants, and a second
metric, Construction Services, which Executives (the
7
8
g
10
11
12
13
14
15
Company's President and CEO, its CFO and its SVP, Corporate Development).
The Company added the new Safety metric to underscore its emphasis on safety
as this metric is directly linked to incidents in the Company's gas distribution
system. The Company also added the new Construction Services metric as it is
linked to the Company's non-regulated construction services segment and
incentivizes the three Executives who will be actively involved in the oversight
of this segment. Beginning with the 2015 plan year, the Company also altered
the form of payment for earned MIP awards from 40% cash and 60% equity to
60% cash and 40% equity in the form of performance shares.
Please describe the RSUP.1216 Q.
12A.17
18
19
The RSUP is a long-term incentive (LTI) plan designed to reward sustained
performance with respect to the metrics that the MIP measures on an annual
basis. The determination of whether to grant an RSUP award and the value of
20
21
22
23
24
25
RSUP grants is based upon the average MIP payout for the three years
immediately preceding the RSUP award determination date. The target is set at
an average MIP payout percentage of 100%, with a threshold award of 50% of
target and maximum award of 150% of target, in each case depending on the
average MIP layouts for the last three fiscal years relative to the target layouts
under that plan. No RSUP award will be granted in a plan year unless the
-7-
1
2
3
4
5
average MIP payout for the prior three years is at or above 90%. Earned RSUP
awards are granted in the form of restricted stock units based on the average
price of the Company's common stock on the NYSE for the first five trading days
of the month in which the award is granted. RSUP awards vest with respect to
40 percent one year following the date of grant and 30 percent on each of the
second and third anniversaries of the date of grant.6
137 Q. Has the RSUP design changed since the Company's last rate application to the
Commission in 2010?8
13g A.
10
11
12
13
14
15
16
Yes. The Company's revised MIP metrics (including the addition of the Safety
and Construction Services metrics), which are discussed in my testimony above,
will impact RSUP awards granted beginning in 2016. The new metrics will apply
to the 2015 MIP awards, which is one of the three years that will be averaged to
determine the 2016 RSUP award (i.e., the 2013-2015 MIP award layouts). As
noted above, the Construction Services metric applies to three senior
Executives (the Company's President and CEO, CFO and VP, Corporate
Development) and that metric applies solely to the RSUP awards granted to
those Executives.17
14 Please describe the components of the Company's executive retirement benefit18 Q.
19
1420 A.
21
programs.
The Company maintains two retirement benefit programs that are made
available solely to Executives, the EDP and the SERP.
Please describe the EDP.1522 o.
1523 A.
24
25
The Company maintains a tax-qualified defined contribution (401(k)) plan that is
available to all of its employees, the Southwest Gas Corporation Employees'
investment Plan (EIP). The EIP permits participants to contribute between 2 and
-8-
1
2
3
4
5
60 percent of their base salaries to the plan and receive a corresponding
Company matching contribution up to 3.5% of a participant's annual salary.
Participant contributions to the EIP are subject to annual IRC limits that apply to
the plan, which is $18,000 for 2016 plus an additional $6,000 in catch-up
contributions for participants who are age 50 or older. Executives are not eligible
6
7
8
9
10
11
12
13
1 4
15
16
17
18
to receive Company matching contributions under the EIP.
The EDP supplements salary deferral opportunities for Executives by
permitting them to defer annually up to 100% of base salary and non-equity
incentive compensation. The Company also provides matching contributions
under the EDP that parallel the contributions it makes to other participants under
the EIP, up to 3.5% of a participating Executive's base salary. Deferred
contribution amounts and Company matching contributions bear interest at
150% of the Moody's Seasoned Corporate Bond Rate. The EDP is a non-
qualified plan under which participating Executives are general unsecured
creditors of the Company with respect to benefits payable under the plan.
Additionally, base salary deferred under the EDP is not included in the formula
used to calculate an Executive's pensionable benefit under the Company's tax-
qualified defined benefit retirement plan (Retirement Plan), described in Q&A16.
Please describe the SERP.1619 Q. i
162 0 A .i
21
22
2 3
The Company maintains a tax-qualified defined benefit retirement plan
(Retirement Plan), which is available to all Company employees under which
benefits are based on an employee's years of service, up to a maximum of 30
years, and the 12-month average of the employee's highest five consecutive l
i
l
i
24 years' salaries, excluding bonuses, within the final 10 years of service. Thei
25 Internal Revenue Code (IRC) places a limit on the annual compensation that
-g-I

1
2
3
4
may be considered in determining benefits under this plan, for 2016, the annual
limit is $265,000. The annual limit is adjusted over time to reflect cost-of-living
increases established by the Internal Revenue Service. As noted above, base
salary amounts deferred by executives under the EDP are not included for
5
6
7
8
g
10
11
12
purposes of determining pensionable benefits under the Retirement Plan.
The SERP is designed to supplement the Retirement Plan for participating
Executives by providing a normal retirement benefit at a level of 50% to 60% of
base salary without regard to the IRC limits that apply to the Retirement Plan.
To qualify for a normal retirement benefit under the SERP, which is based on
the 12-month average of an Executive's highest consecutive 36 months' salary,
an Executive must have reached age 55 with 20 years of service or age 65 with
10 years of service. There are currently seven Executives whose base salary
exceeds the annual IRC limit and who would be eligible to receive a normal13
retirement benefit under the SERP.14
15
16
17
18
l
l
l
19
209l
l21
22
l
1l
l
l
il23
The SERP also provides a limited retirement benefit for Executives who
defer base salary under the EDP but who do not qualify for a normal retirement
benefit under the plan. The limited benefit supplements the Retirement Plan by
accounting for base salary amounts that are deferred under the EDP and that
are not included in calculating pensionable benefits under the Retirement Plan.
The SERP is a non-qualified plan under which participating Executives are
general unsecured creditors of the Company with respect to benefits payable
under the plan and benefits payable under the SERP are offset by benefits
payable under the Retirement Plan to avoid double payment of benefits to
Executives.24l
25
-10-
171 Q.
172 A.
3
4
5
Please describe the purpose of the EDP and SERP.
The Company maintains the EDP and SERP to attract and retain qualified
executives in a competitive marketplace in which the majority of the Company's
peer companies offer comparable executive retirement programs. The SERP
and EDP also provide participating Executives with an opportunity to receive
retirement benefits that are available to other Company employees under the6
Retirement Plan and EIP that are not otherwise available to the Executives due7
8
9
to applicable IRC limits. The SERP and EDP therefore help put Executives on
par with other Company employees with respect to the level of benefits they
receive at retirement. The SERP and EDP also align the Executives' interests10
11
12
with the long-term interests of the Company as general unsecured creditors of
the Company with respect to their benefits under those plans.
III. HAY GROUP'S ASSESSMENT OF THE COMPANY'S EXECUTIVE COMPENSATION13
PROGRAMS14
1815 Q. Please describe your understanding of the Company's compensation
16
1817 A.
18
19
20
21
22
23
24
25
philosophy.
The Compensation Committee (the Committee) of the Company's Board of
Directors aims to implement executive compensation programs that elicit strong
performance by the Company's senior Executives (those who hold a title of
Senior Vice President (SVP) or a more senior title), that attract, retain and
motivate superior talent; and that provide a direct link between pay and
performance. In establishing levels of pay for senior Executives, the Committee
benchmarks base salaries at approximately 50"' percentile of the amounts paid
by the public-company peer group (median), with overall compensation for each
senior Executive generally targeted between 35th and 65th percentile of the peer
-11-
1
2
3
4
5
196 Q.
197 A.
8
9
10
11
12
group (i.e., plus or minus 15 percent from the median, which represents a
competitive range). The Company's compensation philosophy for the remaining
Executives (those who hold the title of VP) is consistent with the philosophy of
the Committee, with base salaries targeted at approximately the median of the
market and overall compensation levels that are competitive within the market.
How does the Company determine the appropriate level of compensation?
The Committee reviews the compensation payable to Executives who hold the
title of SVP or a more senior title, which in 2015 included seven executives
(President and CEO, Executive Vice President (Evp), and five SVPs) by
evaluating multiple sources. A primary source of comparison is the
compensation paid by companies within the Company's public-company peer
group that is comprised of utilities deemed to be of comparable size and to have
a similar basic structure and operational complexity as the Company. The13
14
15
Committee also reviews the design of the Company's incentive programs and
executive retirement programs relative to the designs of the Company's public
In addition to reviewing peer group data, the Committee16 company peers.
17
18
reviews numerous compensation surveys, which typically include surveys
prepared by the Towers Watson, American Gas Association, Mercer and/or Hay
an outside compensation consultant,19 Group. The Committee works with
20 currently Pay Governance, in performing its executive compensation review.
For Executives who hold the title of VP, which included twelve executives21
22 in 2015, the Company evaluates their compensation using Hay Group's job
The Company23 evaluation methodology, described in Q8<A 20 below.
24
25
supplements Hay Group's analysis by reviewing the survey data that the
Committee reviews for the Company's more senior executives.
_12-

201 Q.
2
Please explain the process employed by Hay Group to evaluate the Company's
Executive compensation levels and design of the Company's compensation
3
20A.4
5
programs.
Hay Group utilized several sources to evaluate the reasonableness of the
Executives' compensation and the competitiveness of the Company's
6
7
8
9
10
11
12
13
compensation programs. The first source was the Company's public-company
peer group identified in its 2015 proxy with the exception of one company, UNS
Energy, which was acquired by Fortis in August 2014.2 Hay Group evaluated
the level of pay for the peer companies' top five executive officers (the named
executive officers or NEOs) as well as the design of those companies' incentive
plans and SERPs for purposes of comparison to the programs maintained by
the Company. In reviewing competitive pay levels for the Company's NEOs, Hay
Group compared the applicable Executives to the market as follows:
•14
15
16
The Company's CEOS was compared to median compensation for peer
group CEOs
The Company's CFO was compared to median compensation for peer group
CFOs17
18
19
The Company's President was compared to median compensation within the
peer group for the highest-paid NEO other than the CEO and CFO
20
21
22
23
24
25
2 The Company's peer group is identified in Hay Group's report attached as Confidential Exhibit__(BTH-1) to this testimony.s The Company's current President and CEO, John Hester was promoted to President in August 2014and CEO in March 2015. For purposes of evaluating CEO compensation for FY 2014, the most recentproxy data available as of the date of my testimony for most of the Company's peer-group companies,Hay Group reviewed the compensation paid to the Company's prior CEO Jeffrey Shaw, in FY 2014. Wecompared the compensation paid to Mr. Hester in FY 2014 against the highest-compensated NEO amongpeer group companies excluding the CEO and CFO.
-13-
1
2
3
4
The Company's EVP was compared to median compensation within the peer
group for the second-highest paid NEO other than the CEO and CFO
The Company's SVP, Corporate Development was compared to median
compensation within the peer group for the third-highest paid NEO other than
the CEO and CFO5
6
7
8
9
Hay Group also evaluated the compensation for each Executive who holds
a title of SVP or higher, excluding the Company's SVP, Corporate Development
(i.e., six of the Company' seven senior Executives), utilizing Towers Watson's
2015 CDB Energy Services Executive Compensation Survey. The Committee
utilizes Towers Watson data for these roles and Hay Group concluded that the10
11
12
compensation levels in the Towers Watson survey are representative of the
market and are in line with the public company peer group data for the top five
Hay Group matched the Executives' titles with13 Executives (the NEos).
14
15
16
17
18
19
20
21
22
comparable positions in the Towers Watson Survey except with respect to the
SVP, Corporate Development, for whom no comparable position exists within
the survey, to benchmark this position, Hay Group relied solely on proxy data
comparisons. In matching the Company's senior Executives to Towers Watson
data, Hay Group applied a premium or discount, as applicable, to reflect the size
of the applicable Company position relative to the survey title match (i.e., in
instances in which the benchmarked Company position entails additional
responsibilities or lesser responsibilities to the matched role in the Towers
Watson survey).
23
24
Hay Group also evaluated the compensation for each Executive who holds
the title of VP (twelve Executives) by utilizing its job evaluation methodology to
measure the internal value of each position's contribution to the organization to25
-14_

1
2
3
4
5
6
7
link that value to external market data. The output of Hay Group's job evaluation
is a measurement of job size in terms of points, with the following as the three
most significant factors in determining a job's size: (i) required knowledge and
skills (the required "inputs" for the job), (ii) the kind of thinking needed to solve
problems (the required "throughput" for the job) and (iii) the job's impact and end
results (the required "outputs" of the job). By assigning evaluation points to each
position, Hay Group was able to compare the compensation payable for
8
g
positions in the external marketplace that require similar experience,
management scope and accountabilities as the surveyed position within the
10
11
12
13
14
Company. Sizing the jobs permits Hay Group to review market data that is often
a closer fit to the surveyed position than would be achieved by relying solely on
title matching the relevant position to comparable titles in the market. Finally,
Hay Group reviewed Hay Group and Towers Watson survey data on executive
retirement practices to evaluate the terms and benefit levels provided under the
EDP.15
2116 o. Please describe Hay Group's practice for evaluating a client's compensation
17 levels relative to comparator markets.
2118 A.
19
20
21
22
In interpreting a client's compensation levels relative to the market Hay Group
typically considers base salary to be competitive if it falls within 10 percent of
the market median. Hay Group typically considers TCC and TDC to be
competitive if it falls within 15 percent of the market median. It is unusual for
individuals' compensation levels to match the market median and reviewing
23
24
25
compensation levels relative to a competitive market range is standard industry
practice. In instances in which an individual's compensation level falls outside of
the competitive market range individual factors applicable to that individual may
-15-
1
2
3
impact his or her compensation relative to the market, such as tenure and/or
performance levels. The relationship between pay and tenure is an important
factor for the Company as the average tenure of the Company's Executives is
4
5
24 years. The Company has a long-tenured and stable executive team who, as
discussed below, are delivering superior performance for the Company's
customers .6
227 Q. What were Hay Group's findings based on its assessment of the Company's
8
229 A.
public company peer group?
As a group, the Company's NEOs are below the competitive market range
relative to the median with respect to TDC. With respect to base salaries, the10
11
12
13
14
NEOs' base salaries in the aggregate are slightly below the peer-group median
(6.1% below median) but within the competitive market range. Aggregate TCC
and TDC for the Company's NEOs are below the competitive market range of
+/-15% of the median (21.9% below median and 29.6% below median,
15 respectively).
16
17
18
19
20
With respect to MIP and RSUP design, the plans are consistent with peer
group incentive plans and include market-competitive terms. The MIP differs
from many of the Company's peer group companies in that it pays a portion of
the benefit in stock (a majority of peer group companies pay all annual incentive
amounts in cash). The mix of financial and non-financial performance metrics
21
22
23
24
i
ii
i
in the MIP is a common design among peer group annual incentive plans.
However, the Company's RSUP is different in that a majority of peer-company
plans include primarily f inancial and shareholder metr ics whereas the
Company's RSUP grants are based on a combination of financial and customer-
focused metrics.25 l
ll
-15-

1 The Company's SERP is in line with competitive practices in terms of
2
3
benefit levels and design relative to its peer group companies. Ten of the
Company's fifteen peer group companies (66%) offer some form of SERP to
their executives, the SERP's benefit levels and accrual rates are consistent with4
5
236 o.
7
238 A.
g
10
11
12
13
market terms among the Company's peers.
What were Hay Group's findings based on its survey data review for the
Executive positions?
As a group, the Company's Executives are below the competitive market range
relative to the survey data with respect to TDC (27.3% below median in the
aggregate). With respect to base salaries the Executives are within competitive
market range (9.2% below median in the aggregate) and with respect to TCC
the Executives are slightly below the competitive market range in the aggregate
(16% below median). With respect to the EDP, Hay Group and Towers Watson
14
15
16
survey data indicates that a majority of participating companies in each survey
provide an employer matching contribution in executive non-qualified deferred
compensation plans and a majority of those plans permit deferrals of base salary
17 plus annual incentives. These features are consistent with the EDP.
COMPENSATION INCLUDIBLE IN CUSTOMER RATES UNDER APPLICABLEIV.18 \
GUIDANCE19
Should the costs associated with the Company's executive compensation2420 o.
21
2422 A.
23
24
programs be included in customer rates?
Yes. As a threshold matter, I note that the Executives' TDC and the executive
retirement plans (SERP and EDP) maintained by the Company constitute part
of the Total Remuneration ("Total R") package that the Company provides to its
Executives. When evaluating the reasonableness of a company's compensation25
-17-
1
2
3
4
5
6
7
8
9
10
11
program, it is important to do so in the context of the Company's Total R
package. For example, companies may offer lower incentive opportunities or
base salaries in exchange for enhanced benefits such as a defined benefit plan
and a SERP. When Hay Group evaluates Total R for its clients we view these
programs holistically - how does Total R compare to the market within the
context of the client's overall compensation philosophy? Under this approach,
we look at individual components of Total R to determine reasonableness of
each component but we also evaluate how that component fits within the context
of the Total R package." For companies that provide significant benefit programs
- such as SERPs and deferred compensation plans - losing or reducing one
component of Total R, such as reduced incentive benefits, impacts the analysis
12 of whether the remaining components of Total R are "reasonable" and
13
14
15
16
17
18
19
20
21
22
competitive within the market. For example, as noted above, the majority of the
Company's public-company peers offer SERP benefits to their executives; if the
Company opted to freeze its SERP and cease providing these benefits going
forward, its competitive pay package to attract new talent (and retain existing
talent) would lack a key retention program that is prevalent in the market and, in
my experience, such a loss would typically be reflected through the
enhancements of other Total R components such as higher pay
lt is critical to frame my testimony in the following Q8tAs regarding
individual components of the Company's executive compensation and benefit
programs in the broader context of the aggregate Total R package. Hay Group's
23
24
25
4 See Benchmark total remuneration, Improve the health of your reward benchmarking Hay Group,http://atrium.haygroup.com/downloads/marketingps/ww/HayGroup_lmprove_the__health_of_your_reward__benchmarking.pdf. (December 2010).
-18-

1
li
Wii
l
i2l
i
study shows that the Company's Executive compensation programs and
retirement programs are at or below competitive market levels in the aggregate
and are reasonable and well-balanced relative to the market and reflect3 l
l
i
4 competitive market practices. As noted below, the existing Executive team isl
l
Given these facts, the5 providing superior performance for its customers.il
6 ll
7
8 ll
9
10
11
12
l13
Company's recovery of 100% of its reasonable compensation and benefit costs
through customer rates to incentivize and retain talent that is delivering superior
results for the Company's customers is fair to customers and would not
represent a burden to them. Therefore, it is my opinion that, with the exception
of 10% of the Company's MIP costs and RSUP costs for awards payable to the
Company's President and CEO, its CFO and its SVP, Corporate Development
(which awards costs are associated with a non-regulated business segment that
is unrelated to the Company's utility customers), 100% of the Company's costs
associated with its Executive TDC costs, its MIP and RSUP costs and the costs14illil15
16
for its Executive retirement programs (EDP and SERP) are recoverable through
customer rates. This approach is consistent with the Commission's recentl
17
18
19
guidance in reviewing a request from EPCOR Water Arizona, Inc. (EPCOR) to
recover compensation costs: "If overall compensation for employees is
reasonable, it should be allowed assuming the allocation methods are
" 5reasonable.20
2521 Q. Is there any data to confirm whether the Company is delivering high-quality
customer service?22
23
24
25s Decision No. 75268, 2015 Ariz. PUC LEXIS 138 at *58-'59 (September 28 2015). I address thisguidance in more detail below.
-1g-
l
251 A.
2
3
4
Yes. The existing Executive team has demonstrated superior customer
performance as reflected in high engagement rates of the Company's customers
relative to the market. The Company's superior performance for its customers
was recently confirmed in an independent, third-party report prepared by Market
The 2015 report, entitled Utility Trusted Brand 8.5 Strategies International.
6
7
8
Customer Engagement Study: Residential, summarized the results of inter/iews
with 50,000 utility customers nationwide regarding Brand Trust, Operational
Satisfaction and Product Experience (the report focused on residential electric
g
10
11
12
26
utilities, natural gas utilities and utilities that provided a combination of the two
services). The report identified Southwest Gas as one of three "Customer
Champion" natural gas utilities in the West and ranked the Company number 6
out of 38 gas utilities that it reviewed nationally for the survey.
Are there additional factors that support the inclusion of MIP costs in customer13 Q.
rates?14
2615 A. Yes. The MlP costs, excluding those associated with the Construction Services
16 metric, should be included in customer rates as the MIP incentives provide a
direct link between Executive and employee compensation and customer17
18 service. The MIP incentivizes management to operate the Company in an
efficient manner that minimizes customer rates while maximizing customer19
20 satisfaction and safety as follows:
•21
22
23
Customer Satisfaction. This metric is explicitly tied to customer satisfaction
and benefits the Company's customers. If the Company's management
chose to delay investment in infrastructure to improve its performance on the
24
25
ROE or Operating Cost Containment metrics, management would risk
diminished performance with respect to the Customer Satisfaction metric -
_20-

1
2
and Safety metric - and consequently the MIP payout with respect to those
factors would decline. The Customer Satisfaction metric (as well as the
3
4
5
6
7
8
9
Safety metric) therefore aligns with the MIP financial metrics to ensure that
management focuses on financial performance that is enhanced through
improved customer welfare. Put another way, if management chooses to
emphasize the Company's financial performance to the detriment of its
customers, the MIP is designed to penalize management through lower
performance on other metrics and lower performance under the MIP over
time will further impact performance under the RSUP.
• This metric provides a direct benefit to10 Customer-to-Employee Ratio.
11
12
13
14
15
16
17
18
19
20
21
22
23
24
customers: as the Company improves its customer-to-employee ratio it
controls costs, which helps it maintain lower rates.
8141. This metric provides a direct benefit to customers by focusing on the
Company's response time and damages per 1,000 tickets in providing
services. The Company added this metric subsequent to its last rate
application to the Commission in 2010. The Safety metric enhances the
MIP's focus on customers beyond the MIP design in place during the
Company's last rate application with the Commission. The MIP's focus on
the Company's gas distribution system benefits in senior Executives'
incentive programs helps ensure that safety is a priority throughout the
organization.
Operatinq Cost Containment. Similar to the ROE metric discussed below,
this provides a direct benefit to customers by focusing management on
controlling costs, which helps the Company keep rates competitive.
25
-21-
i
I
1 Return on Equitv (ROE). Provides a direct benefit to customers because the
2 return metric focuses the Company's management on the efficiency of thel
3 By controlling its costs (for example, aggressiveCompany's operations. il
such as automated meter reading) the4 pursuit of operational efficiencies,
5 Company has kept its rates lower for customers while also creating cash for l
linvestment in its infrastructure. In short, the Company's eff iciency in6
7 operations, as measured through ROE, benefits customers.
278 Q. How does the Company's position with respect to recoverable MIP costs
l9 compare to that of the Commission's Utilities Division Staff (Staff) and
10
2711 A.
Residential Utility Consumer Office (RUCO) in previous proceedings?
In seeking recovery of 100% of its MIP costs, the Company's position varies from
12 prior positions taken by Staff and RUCO, which each concluded that the
13 Company should be limited to recovery of 50% of its MlP costs. Staff and RUCO
14 proffered variations on two distinct arguments in the Company's past rate
15 applications in proposing a 50 percent disallowance of the Company's MIP
16 costs: (i) the MIP includes at-risk pay that may vary from the costs accrued
17 during the test year (and any reduction in future MIP payments would still require
18 customers to pay for that component of compensation in their rates to the benefit
19 of shareholders) and (ii) the MIP includes financial metrics that primarily benefit
shareholders.5 On the second factor, Staff has argued that "[e]nhanced earnings20
levels can sometimes be achieved by short-term management decisions that21
22
23
24
25
e See. e.q., Decision No. 70665, 2008 Ariz. PUC LEXIS 237 (December 24 2008) at *27*28 ("Staffwitness Smith stated that shareholders and ratepayers stand to benefit from the performance goals butadded that there is no assurance that the award levels achieved during the test year will be repeated infuture years" and "RUCO witness Rodney Moore testified that the MIP criteria include elements related tofinancial performance and cost containment goals, which are goals that primarily benefit shareholders.").
-22-
1 may not encourage the development of safe and reliable utility service at the
For example, some maintenance can be temporarily2
But delaying maintenance can lead to3
lowest long-term cost ..
deferred, thereby boosting earnings
197
4
5
safety concerns or higher subsequent 'catch-up' costs. The Commission has
found these arguments to be persuasive.8 In my opinion, the following three
factors warrant reconsideration of the Commission's prior rulings on this issue6
7 with respect to the MIP.
First, the MIP metrics cannot be viewed in isolation in determining whether8
9 they benefit customers. While the inclusion of financial metrics in the MIP
10 clearly benefits shareholders, the mix of MIP metrics incentivizes
11
12
1:3
14
15
16
17
18
management to achieve financial performance through corporate practices
that benefit customers by controlling costs and maximizing efficiency while
simultaneously maintaining high customer satisfaction and safety ratings. If
management pursued a policy of delaying infrastructure improvements to
minimize costs (which would potentially improve the MIP financial metrics in
the short run) the Company risks deteriorating customer satisfaction and
safety ratings, which would impact current and/or future MIP payments and
crucially would also impact future RSUP payments, which are based on MIP
19
20
performance over time. In short, focusing on financial performance metrics
in isolation to support the argument that they potentially encourage corporate
actions that are detrimental to customers does not account for the integrated21
22 design of the MIP's performance metrics, whereby customer-focused metrics
23
24 1See e.q., Decision No. 69663, 2007 Ariz PUC LEXIS 126 at '74 (June 28 2007) (Arizona Public ServiceCo. rate application).8See Decision No. 70665, 2008 Ariz. PUC LEXIS 237 at *29 n.4 (citing Decision No. 69663 favorably).25
-23-

l
1 provide a clear incentive to management to maximize financial performance
in a manner that also maximizes customer welfare. The Mlp's integrated2
3 performance metrics also benefit customers because the Executives'
4 incentive to pursue operational efficiencies will be reflected in future rate
5 cases through lower overall rate increases.
I further note that the Commission previously approved recovery of6
100% of Arizona Public Service Company's (Aps) requested annual7
8 incentive plan costs when the plan design clearly linked performance to
customer benefit, which is consistent with the MIP's design of integrated9
In a more recent decision addressing a rate10 performance metrics.9
11 application from EPCOR, the Commission approved recovery of 90% of
EPCOR's annual incentive plan costs, concluding as follows:12
13
14
15
16
17
The real issue in evaluating incentive compensation is whether totalcompensation, including the incentive pay, is reasonable. If overallcompensation for employees is reasonable, it should be allowedassuming the allocation methods are reasonable. The evidencein the record does not indicate that the overall compensationrequested by EPCOR is excessive or unreasonable. Rather, Staffand RUCO argue that placing a label of "incentive" on a portion oftotal wages is sufficient to require the disallowance of some or all ofthat compensation... 10
18
19
20
21
22
23
24
25
9 §e_e Decision No. 69663 2007 Ariz. PUC LEXIS 126 at *72*75 (adopting Staff recommendation that"the costs of the cash-based incentive plan be included in rates because the [test year] level of thosecosts was tied to performance measures that benef it Aps customers" notwithstanding the fact that"corporate earnings serve as a threshold or precondition to the payoutIo Decision No. 75268 2015 Ariz. PUC LEXIS 138 at *58-'59 (September 28, 2015). The Commission'sanalysis is consistent with the approach taken by the California Public Utilities Commission (CPUC), whichreviews the Companys rate applications for costs associated with its California operations. For example,in a rate case decision that addressed incentive compensation cost recovery requested by Pacific Gas 8tElectric Company the CPUC concluded that incentive pay is part and parcel o f the overallcompensation scheme" and further cited favorably to the conclusions reached in a workshop held byCPUC staf f : "The consensus reached in the workshop was that the [CPUC] should not attempt tomicromanage utility incentive compensation programs. Instead of adopting a 'cookie cutter' approach,workshop participants recommend that the [CPUC] review incentive compensation programs utility byutility as a component of the total cash compensation requested in each utility's general rate case. Theyproposed moreover, that the allocation of total cash compensation between salaries and incentivesshould be left to each utility's discretion." Decision N0.92-12-057 1992 Cal. PUC LEXIS 971 (December16 1992) at*126-"127.
-24-

1
2
3
4
5
6
7
As noted above, the Company is not seeking to recover its MIP and
RSUP costs that are associated with a non-regulated business segment; I
believe the remaining MIP costs are recoverable and the plan's design is
consistent with the incentive plan at issue in the APS rate case because the
performance measures are aligned to benefit customers."
The second factor that justifies a result different from the Commission's prior
rulings is that the Company added a new Safety metric to the MIP that has
8 a target weighting of 20% for all partic ipants. This change further
and customer benefit, asg strengthens the link between performance
10
11
12
13
14
15
16
17
18
19
20
21
•22
23
discussed above. Therefore even if the Commission accepts the position that
financial metrics primarily benefit shareholders to the potential detriment of
customers (which I do not believe to be the case for the MIP for the reasons
set forth above) the current MIP design places greater weighting on non-
financial metrics than the MIP design reviewed by the Commission in the
Company's last rate application in which the Commission approved recovery
of 50% of the Company's MIP costs. The Commission's recent decisions
approving recovery of all costs associated with non-financial metrics suggest
that the Company should be entitled to recover more than 50% of its costs
associated with the MIP (i.e., the percentage approved by the Commission
in the Company's last rate application) in light of the design updates since its
last rate application.
A third factor that justifies a result different from the Commission's prior
rulings is that historical performance indicates that, while MIP layouts vary
24
25 11 See Decision No. 69663 2007 Ariz. PUC LEXIS 126 at *75-"76.
-25-

1
2
3
4
5
6
7
8
from year-to-year, annual MIP payments over time typically equal or exceed
target performance and there is no material risk of a windfall to shareholders
by having customers pay for incentive payments in rates that may be
materially lower in future years. For example, during the 10-year period
covering plan years 2005-2014, the average MIP payout was approximately
110.9% of target. Historical performance suggests that recovery of the
Company's MIP costs will not result in a windfall to shareholders over a multi-
year period.
g
10
11
12
13
In sum, it is my professional opinion that the MIP metrics cannot be
viewed in isolation in determining the incentives that the metrics provide to
Executives and employees and, reviewing the metrics as a whole, they
provide a clear incentive to MIP participants to maximize financial
performance in a manner that also benefits customers. The MIP has been
14 enhanced since the Company's last rate application to further focus on
Finally, pastcustomer welfare with the inclusion of a Safety metric.15
16
17
18
performance under the MIP strongly suggests that permitting recovery of MIP
costs does not present a material risk of a windfall to shareholders by having
customers pay for incentive payments that may be materially lower in future
19 years. Given these factors and the fact that the MlP constitutes part of a
20
21
22
reasonable compensation package for Company Executives and is
reasonable in design, l believe the costs associated with the MlP are
recoverable through customer rates.'2
23
24
25
12 As noted above the Companys MIP costs associated with the Construction Services performancemetrics for three senior Executives (weighted at 10% of their target MIP award opportunity) should beexcluded from recovery through customer rates.
-26-
281 Q. Are there additional factors that support the inclusion of RSUP costs in customer
rates?2
283 A. Yes. Before addressing the additional factors that I believe warrant recovery of
4 the Company's RSUP costs I note that Staff and RUCO have taken the position
5 in the Company's past rate cases that 100% of the Company's RSUP costs should
6
7
8
9
10
11
be disallowed, relying in part on past Commission rulings to the effect that "stock
performance incentive goals have the potential to negatively affect customer
service, and ratepayers should not be required to pay executive compensation that
is based on the performance of the Company's stock price."'3 The Commission has
agreed with this position and disallowed recovery of RSUP costs in the Company's
past rate applications."' For the reasons set forth below, it is my opinion that the
RSUP design mitigates the concerns articulated by the Commission in its past12
13rulings.
The first factor that differentiates the RSUP design from the majority of stock-14
based LTI awards is that RSUP award amounts are determined based upon15
past performance under the MlP versus prospective performance measures16
that potentially implicate the concerns articulated by the Committee with17
18
20
21
23
24
25
19 13 _ Testimony of Ben Johnson Ph.D., on Behalf of the Residential Utility Consumer Office, DocketNo. G-01551A-10-0458 (June 10, 2011) at 42 (citing Commission Decision No. 64172 at 16 n.4), AgQS Public Direct Testimony of Ralph C. Smith on Behalf of the Utilities Division Staff Arizona CorporationCommission Docket No. G-01551A10-0458 (June 10 2011) at 31 (citing a prior Commission ruling that"[w]e agree with Staff that Aps' stock-based compensation expense should not be included in the cost ofservice used to set rates. Contrary to APS' argument that we should not look at how compensation isdetermined we do not believe rates paid by ratepayers should include costs of a program where an
22 employee has an incentive to perform in a manner that could negatively affect the Company's provisionof safe reliable utility service at a reasonable rate.") (citing Decision No. 69663 at 36).14 See e.q. Decision No. 70665, 2008 Ariz. PUC LEXIS 237 at *29 n.4 ("On the same basis, we will alsodisallow 100 percent of the Southwest Gas stock incentive plan ("SIP") [the Company's equity plan]. Thecosts related to similar incentive plans were recently rejected for APS and UNS Electric. As was notedin the APS case, stock performance incentive goals have the potential to negatively affect customerservice, and ratepayers should not be required to pay executive compensation that is based on theperformance of the Companys stock price.").
-27-

1
2
3
respect to a performance-vested LTI award (e.g., financial and/or
shareholder-focused performance metrics that potentially incentivize
corporate behaviors that are detrimental to customers). The RSUP rewards
4
5
6
7
8
g
10
11
12
Executives and employees for sustained performance with respect to MIP
performance metrics and the Commission has consistently concluded the
MIP metrics provide some benefit to the Company's customers.15 The fact
that the RSUP rewards Executives and employees for performance with
respect to the e MIP incentive metrics that the Commission has
determined benefit customers supports the conclusion that the Company's
RSUP program also benefits the Company's customers and at least some
portion of the costs associated with the program should be recoverable
through customer rates.
13
14
15
16
17
18
19
The RSUP design is very unique in this respect, as demonstrated by
a review of the LTI programs maintained by the Company's public-company
peers. The performance equity awards of the peer-group companies focus
almost entirely on prospective shareholder returns and financial metrics such
as Earnings per Share (Eds) and EPS Growth.16 The peer-companies'
prospective LTI performance metrics, which are tied largely to the future
stock performance, are much closer in design to the concerns expressed by
20 the Commission regarding stock awards than Southwest Gas' RSUP
21
22
performance metrics.
A second, related, factor regarding the RSUP is that the Company's
compensation costs for both the stock-based MIP awards and the RSUP awards23
24
25 16See Confidential Exhibit15See. ea. Decision No. 70665, 2008 Ariz. PUC LEXIS 237 at '27'29
(BTH-1).
-28_
lW11
1
1
2
3
4
5
6
7
8
9
10
11
12
is fixed on the date of grant under FASB Account Standards Codification Topic
718 (ASC 718). This is critical because the stock-related costs that the
Company is seeking to recover from Customers with respect to the RSUP are
unrelated to the Company's financial performance following the date of grant (as
contrasted with the LTI awards granted by a s igni f icant majori ty of the
Company's public-company peers with market-based vesting terms that will
impact the compensation costs accrued for the awards)." In this respect the
Company's stock-related costs with respect to the RSUP are determined in the
same manner as its costs for the MIP. Given that the majority of MIP awards
were payable through stock when the Commission previously reviewed the MIP
costs and the Commission permitted the Company to recover 50% of its MIP
costs,'" the Commission has already permitted the Company to recover some
of its stock-based compensation costs under an arrangement that is identical to
13
14
the RSUP (that is, time-vested restricted stock units).
Finally, it is my experience that restricted stock units provide strong retention
15incentives for participants who receive those awards. Because the awards
16are not tied to performance metrics, which may or may not be achieved, a
17participant knows that the award will deliver value in the future based on
18continued service. For this reason time-vested awards such as restricted
19stock units are often granted by companies as part of a portfolio of long-term
20
21
22
23
24
25
17 For a discussion of the application of ASC 718 to equity awards, see Accounting for StockCompensation under FASB ASC Topic 718, Frederic W. Cook 81 Co. Inc. (September 2 2009) link athttp://fwcook.com/alert_Ietters/09-02-09_ORIGINALLY-4-29-05_-Accounting-forStock-Compensation-Under-FASB-ASC-Topic-718.pdf. I note that, under ASC 718, the Company must reverse expenses forany RSUP awards that are forfeited due to failure to satisfy the service vesting condition following thedate of grant. The Company's average Executive tenure of 24 years indicates that historical forfeitures oftime-vested RSUP awards are minimal.18 For example in Decision No. 70665 the Commission approved recovery of 50% of the Company's MIPcosts and the majority of the Companys MIP costs (60%) were incurred with respect to the stockcomponent of the MIP. die 2008 Ariz. LEXIS PUC 237 at *27-*29.
-29-

1
2
3
4
5
6
7
8
9
incentive vehicles that balance performance and retention considerations,
this is a common approach taken by the Company's public peer group.'9 In
light of these considerations, I believe the RSUP design benefits the
Company's customers by providing significant retention incentives for the
Company's high performing Executives and employees. while the Company
could presumably revise its program to pay cash awards based on prior
performance under the MIP (thereby avoiding the Commission's concerns
regarding stock-based compensation under the RSUP) I believe such a
design would hurt, rather than help, customers due to the loss of retention
incentives.10
11
12
13
Based on the foregoing and the fact that the RSUP constitutes part of a
reasonable total compensation package for the Executives, I believe that the
Company's RSUP costs should be recoverable through customer rates as a
reasonable and necessary component o f the Company's overall14
Hay Group's study concluded that these pay15 compensation package.
16 components are reasonable and in line with the market, as noted above. At
a minimum, the RSUP costs should be recoverable to the same extent the17
18
2919 Q.
Company is permitted to recover MIP costs.
Are there additional factors that support the inclusion of the Company's costs
associated with the EDP and SERP in customer rates?20
Yes. As discussed above, the Company has long-tenured executives who have29A.21
22 demonstrated high performance for the Company's customers. The EDP and
23
24
25
19 As noted in Hay Group's study of the LTI designs among the Companys public-company peer group,the majority of peer group companies grant both performance-vested units and time-vested restrictedstock units as part of a portfolio of equity vehicles.
-30-

1 SERP allow the Company to attract and retain these high performing individuals
2 by providing supplemental retirement benef its as part of a competitive
For example, the average age and tenure of the3 compensation package.
4
5
6
7
8
g
10
Company's Executives (age 52 with 24 years of service, respectively) makes the
SERP a strong retention tool for the Executive team to remain employed with
the Company to vest in their SERP benefits. This continuity of service benefits
the Company's customers and the EDP and SERP, which constitute part of the
Company's reasonable compensation program for its Executives, should be
recoverable through customer rates. Permitting the Company to recover at least
some portion of its EDP and SERP costs would be consistent with recent
11
12
guidance issued by the regulatory commissions in the Company's Nevada and
California jurisdictions.20
3013 Q. Does this conclude your prepared direct testimony?
Yes .3014 A.
15
16
17
18
19
20
21
22
23
24
25
20 Docket Nos. 12-02019 and 12-04005 2012 Nev. PUC LEXIS 214 at '114-*117 (permitting theCompany to recover the portion of its SERP costs that restore benefits that Executives lose under theCompany's qualified retirement plans due to IRC limits and disallowing recovery of SERP benefits inexcess of the IRC limits, under the rationale that "the SERP benefit which allows executive personnel toreceive a retirement benefit, as a percentage of salary equal to other employees, to be a fair cost forrecovery in rates."); Decision No. 1406-028, ALTERNATE PROPOSED DECISION ADOPTING TESTYEAR 2014 GENERAL RATE INCREASES FOR SOUTHWEST GAS CORPORATlON'S SOUTHERNCALIFORNIA, NORTHERN CALlFORNlA AND SOUTH LAKE TAHOE RA TE JURISDICTIONS (June 12,2014) at 53-55 (concluding that 50% of the Companys SERP and EDP costs are recoverable throughrates as beneficial to both ratepayers and shareholders and noting about the SERP that "[t]hese plansprovide ratepayers with the benefit of having a continuity of executives and managers who are familiarwith the corporate culture and the policies and objectives of the companies. For those reasons, it isreasonable and appropriate for ratepayers and shareholders to equally share in these costs".).
-31-

Appendix APage 1 of 2
SUMMARY OF QUALIFICATIONSBRIAN T. HOLMEN
Brian Holmen serves as the West Region Leader of Hay Group's Board Solutions
group, which advises Boards of Directors and management on all facets of director and
executive compensation and governance issues. In this role, Brian assists a variety of entities
with benchmarking of executive compensation levels, determining appropriate pay structures,
designing incentive compensation programs and advising with respect to governance and
Brian also advises clients with respect to tax, accounting and legaldisclosure issues.
implications of compensation arrangements, including with respect to ERISA and state
employment laws. Brian has over 13 years of experience advising clients regarding
compensation arrangements.
Prior to joining Hay Group, Brian served as an executive compensation partner with
the global law firm Jones Day. Brian also served as a compensation and benefits attorney
with Morrison 8t Foerster LLP and clerked for a federal district court judge in Virginia. He is a
veteran of the U.S. Navy.
Brian is a frequent speaker on executive compensation issues, including recent events
hosted by NASDAQ/Equilar, Global Equity Organization (GEO), Financial Times Outside
Director Exchange (FT-ODX), and the Advanced Employment Issues Symposium (AEls). He
is also a member of the Board of Directors of the Orange County chapter of the National
Association of Stock Plan Professionals (NASPP) and is a member of the National
Association of Corporate Directors (NACD).
Brian received a Bachelor's degree in Economics with Highest Honors from the
University of California, Santa Cruz, and received his Juris Doctorate from the College of
William 8< Mary. Brian served as the Editor-in-Chief of the William 8. Mary Law Review and
graduated with Order of the Coif honors, which is reserved for the top ten percent of the

Appendix APage 2 of 2
graduating class. Brian holds a Certified Executive Compensation Professional (CECP)
certification through WorldatWork.
Exhibit BTH-1
Exhibit BTH-1
CONFIDENTIAL
Filed Under Seal
EXHIBIT no. A-9
DIRECTTESTIMONY- DANE A. WATSON
EXHIBIT
I 95
IN THE MATTER OF
SOUTHWEST GAS CORPORATION
DOCKET no. G-01551A-16-0107
PREPARED DIRECT TESTIMONY
OF
DANE A. WATSON
ON BEHALF OF
SOUTHWEST GAS CORPORATION
MAY 2, 2016

Table of Contentsof
Prepared Direct Testimonyof
DANE A. WATSON
Paqe No.Description
1INTRODUCTIONI3PURPOSE OF DIRECT TESTIMONYll.8III. SOUTHWEST GAS - ARIZONA DEPRECIATION STUDY
12IV. SOUTHWEST GAS - SYSTEM ALLOCABLE DEPRECIATION STUDY13CONCLUSIONV
Exhibit No. (DAW-1 )
Exhibit No. (DAW-2)
Exhibit No. (DAW-3)
Exhibit No. (DAW-4)

1 Southwest Gas CorporationDocket No. G-01551A-16-0107
2
BEFORE THE ARIZONA CORPORATION COMMISSION3
4 Prepared Direct Testimonyof
DANE A. WATSON5
I. INTRODUCTION6
17 Q.
18 A.
9
10
Please state your name and business address.
My name is Dane A. Watson, and my business address is 1410 Avenue K, Suite
1105B, and Plano, Texas 75074. I am a Partner of Alliance Consulting Group.
Alliance Consulting Group provides consulting and expert services to the utility
11
212 o .
2
industry.
What is your educational background?
I hold a Bachelor of Science degree in Electrical Engineering from the University13 A.
14 of Arkansas at Fayetteville and a Master's Degree in Business Administration
15 from Amberton University.
316 Q. Are you certified as a depreciation expert?
317 A. Yes. The Society of Depreciation Professionals (the Society) has established
18 national standards for depreciation professionals. The Society administers an
examination and has certain required qualifications to become certified in this19
20 field. I have met all requirements and have been recognized as a Certified
21
422 Q.
423 A.
24
25
Depreciation Professional (cap).
Please outline your experience in the field of depreciation.
Since graduation from college in 1985, I have worked in the area of depreciation
and valuation. I founded Alliance Consulting Group in 2004 and am responsible
for conducting depreciation, valuation and certain accounting-related studies for
-1-
iI
g
li
ll
lJ
i
i
l
l
1
2
3
4
5
6
utilities in various industries. My duties relate to preparing depreciation studies
and include (1) assembling and analyzing historical and simulated data, (2)
conducting field reviews, (3) determining service life and net salvage estimates,
(4) calculating annual depreciation, (5) presenting recommended depreciation
rates to utility management for its consideration, and (6) supporting such rates
before regulatory bodies.
7
8
g
My prior employment from 1985 to 2004 was with Texas Utilities (TXU).
During my tenure with TXU, I was responsible for, among other things,
conducting valuation and depreciation studies for the domestic TXU companies.
10
11
12
13
14
15
16
17
During that time, I sewed as Manager of Property Accounting Services and
Records Management in addition to my depreciation responsibilities.
I have twice been Chair of the Edison Electric Institute (EEl) Property
Accounting and Valuation Committee and have been Chairman of EEl's
Depreciation and Economic Issues Subcommittee. I am a Regis tered
Professional Engineer (PE) in the State of Texas and, as previously noted, have
meet the requirements for the Certified Depreciation Professional. I am a Senior
Member of the Institute of Electrical and Electronics Engineers (IEEE) and have
held numerous offices on the Executive Board of the Dallas Section, Region and18
I have served as President of the Society ofWorld-wide offices of IEEE.19
20
521 Q.
Depreciation Professionals twice, most recently in 2015.
Have you previously testified before any regulatory commissions?
522 A. Yes. I have appeared before numerous state and federal agencies in my 31
23
24
year career in performing depreciation studies. I have conducted more than 150
depreciation studies, filed written testimony and/or testified before 30 regulatory
25
-2-
1 commissions. My Statement of Qualifications, along with a complete listing of
(DAW-1).2 my testimony appearances is found in Exhibit No.
ii. PURPOSE OF DIRECT TESTIMONY3
64 Q.
65 A.
6
77 Q.
What is the purpose of your direct testimony in this proceeding?
I sponsor and support the depreciation study performed for Southwest Gas
Corporation (Southwest Gas or the Company).
Are you sponsoring any exhibits in this proceeding?
78 A. Yes. I sponsor the following exhibits;
Dane A. Watson Statement of Qualif ications and TestimonyDAW-1g
10 Appearances
DAW-2 - Southwest Gas - Arizona Depreciation Rate Study at December11
12 31, 2015
13 DAW-3 - Southwest Gas System Allocable Depreciation Study
DAW-4 - Existing Versus Approved System Allocable Depreciation Rates14
8 Were these exhibits prepared by you or under your supervisions and control?15 Q.
Yes.816 A.
917 Q.
g18 A.
19
20
When did the last changes in the Company's depreciation rates occur?
A depreciation study was filed for the Company's Southern Arizona and Central
Arizona rate jurisdictions using data as of December 1988. These rates were
effective January 1990. In Decision No. 60352, the Commission authorized the
consolidation of the Southern and Central Arizona rate jurisdictions into the21
22 current Arizona rate jurisdiction. A weighted average of the existing depreciation
23
24
25
rates by jurisdiction was used to develop the depreciation rates for the new
combined Arizona rate jurisdiction. These rates were effective September 1997.
No depreciation study has been filed since the 1988 study.
-3-
101 Q. Do the depreciation studies you sponsor in this case reflect the most current
data available for Southwest Gas' assets?2
Yes. The data used reflects the most recent experience and future expectations103 A.
4 for life and net salvage characteristics for assets in Southwest Gas' Arizona rate
5
116 o .
7
118 A.
9
jurisdiction as of December 31, 2015.
What definition of depreciation did you use for the purposes of conducting a
depreciation study and preparing your testimony?
The term "depreciation," as used herein, is considered in the accounting sense,
that is, a system of accounting that distributes the cost of assets, less net
10 salvage (if any), over the estimated useful life of the assets in a systematic and
rational manner.11
12
Depreciation is a process of allocation, not valuation.
Depreciation expense is systematically allocated to accounting periods over the
13
14
15
life of the properties. The amount allocated to any one accounting period does
not necessarily represent the loss or decrease in value that will occur during that
particular period. Thus, depreciation is considered an expense or cost, rather
than a loss or decrease in value. The Company accrues depreciation based on16
17 the original cost of all property included in each depreciable plant account. Upon
18
19
1220 Q.
1221 A.
22
23
24
retirement, the full cost of depreciable property, less the net salvage amount, if
any, is charged to the depreciation reserve
Please describe your depreciation study approach.
I conducted the depreciation studies in four phases as shown in my Exhibit
No._(DAW-2). The four phases are: Data Collection, Analysis, Evaluation,
and Calculation. During the initial phase of the study, I collected historical data
to be used in the analysis. After the data was assembled, l performed analyses
to determine the life and net salvage percentage for the different property groups25
-4-
1 As part of this process, I conferred with field personnel,being studied.
2
3
4
5
engineers, and managers responsible for the installation, operation, and
removal of the assets to gain their input into the operation, maintenance, and
salvage of the assets. The information obtained from field personnel, engineers,
and managerial personnel, combined with the study results, was then evaluated
to determine how the results of the historical asset activity analysis, in6
7
8
13g Q.
conjunction with the Company's expected future plans should be applied. Using
all of these resources, I then calculated the depreciation rate for each function.
What depreciation methodology did you use in calculating the proposed rates
10
13A.11
12
13
1414 Q.
1415 A.
16
for Arizona plant?
The straight-line (method), Average Life Group (ALG) (procedure), and
remaining-life (technique) depreciation system was employed to calculate
annual and accrued depreciation in these studies.
How are the depreciation rates determined using the ALG procedure?
In the ALG system, the annual depreciation expense for each account is
computed by dividing the original cost of the asset, less allocated depreciation
The17 reserve, less estimated net salvage, by its respective remaining life.
18
19
20
21
22
23
(DAW-2), Appendix B. The24
resulting annual accrual amount of depreciable property within an account is
divided by the original cost of the depreciable property in the account to
determine the depreciation rate. The calculated remaining lives and annual
depreciation accrual rates were based on attained ages of plant in service and
the estimated service life and salvage characteristics of each depreciable group.
For each of the studies, the comparison of the current and recommended annual
depreciation rates is shown in my Exhibit No.
25
-5-
1
No.2
153 Q.
remaining life calculations are discussed below and are shown in Exhibit
(DAW-2), Appendix A.
What factors influence the depreciation rates for an account?
4 A. 15
5
6
167 Q.
8
The primary factors that influence the depreciation rate for an account are: (1)
the remaining investment to be recovered in the account, (2) the depreciable life
of the account, and (3) the net salvage for the account.
Please describe the Company's request in regards to the amortization of reserve
deficit for general plant amortized assets.
169 A. The Company seeks to implement "Vintage Group Amortization" in this
10
1711 Q.
1712 A.
13
14
15
16
depreciation study.
Please describe the Vintage Group methodology.
For general plant in accounts 391-398, the Company is requesting to implement
to use a vintage year accounting method approved by the FERC in Accounting
Release Number 15 ("AR-15"), Vintage Year Accounting For General Plant
Accounts, dated January 1, 1997. AR-15 allowed utilities to use a simplified
method of accounting for general plant assets, excluding structures and
17 improvements (referred to as "general plant"). The AR-15 release allowed high-
18 volume, low cost assets to be amortized over the associated useful life,
eliminated the need to track individual assets, and allows a retirement to be19
20
21
22
23
24
25
booked at the end of the depreciable life. This method is often referred to as
"amortization of general plant."
Adopting the method of accounting allowed in AR-15 changes the level of
detail maintained in the asset records and performs the depreciation calculation
at a vintage level rather than at a total account level. The plant asset balances
will be maintained by vintage installed with the retirement being recorded when
-6_

1
2
3
4
5
book depreciation has been completed. The empirical retirement data for
actuarial or semi-actuarial analysis will no longer be reliable, however, the
determination of useful life can be made appropriately with the use of market
forces, manufacturer expected life, technological obsolescence, business
planning, known causes of retirement, and changes in expected future
utilization.6
7
8
g
The depreciation calculation uses a useful life applied to a vintage versus
the entire account. The depreciation recovery is complete when the vintage
accumulated depreciation is equal to the vintage plant adjusted for estimated
10
1811
salvage and removal costs.
Please describe the methodology or technique employed in analyzing the life ofQ.
12
1813 A.
14
15
Vintage Group property.
I performed actuarial life analysis on each account. The results of the actuarial
life analysis, together with my professional judgment, formed the basis of the
proposed life for these accounts. The lives being proposed reflect more recent
16
17
1918 Q.
1919 A.
20
21
22
23
24
experience and Company information and set an appropriate recovery period
for the assets going forward.
Please describe the results of the Vintage Group depreciation study.
The Company's current depreciation rates were compared to the Depreciation
Study recommendations in Appendix B of the depreciation studies. The rates
proposed for Vintage Group Arizona property are an increase of $1.5 million
based on plant balances as of December 31, 2015 when compared with the
Company's current depreciation rates. The relevant computations are shown in
Appendix A-1 of Exhibit No.__(DAW-2).
25
-7-
201 Q. Please summarize your conclusions.
202 A.
3
4
The Southwest Gas depreciation studies and analysis that I have performed
support establishing depreciation rates at the level recommended in my
testimony. The Arizona depreciation rate study is attached to my testimony as
Exhibit No.5 (DAW-2). The Arizona study shows that a decrease in the annual
6
7
8
9
10
11
depreciation expense for Southwest Gas' assets of approximately $42.0 million
per year is needed to ensure that the appropriate amount of depreciation
expense is collected by the Company. The increase in life and decrease in
removal cost experienced by the Company in Account 376 Mains and the
increase in life for Account 380 Services and decrease in its removal cost, along
with the resulting change in the reserve position are the primary drivers for the
12
13
14
15
decrease in expense.
These depreciation expense amounts in my Depreciation Study were
determined by comparing the calculated depreciation expense using the current
rates and the proposed rates as shown in Appendix B of Exhibit No.___
16 (DAW-2).
Ill. SOUTHWEST GAS - ARIZONA DEPRECIATION STUDY17
2118 Q.
2119 A.
20
21
22
23
24
What property is included in the depreciation study?
There are two general classes, or functional groups, of depreciable property:
Distribution Plant and General Plant property. The Distribution Plant functional
group primarily consists of lines and associated facilities used to distribute gas
within the areas served by Southwest Gas Arizona. General Plant property, both
depreciated and amortized, is not location specific but is used to support the
overall distribution of gas to its customers.
25
-8-
221 Q. Do you have an initial observation about Southwest Gas' Arizona depreciation
2 expense?
223 A. Yes. The Arizona depreciation expense is decreasing from previously approved
levels as shown on Exhibit No.4 (DAW-2), Appendix B. Appendix B shows the
5 approved and proposed annual depreciation rates and accruals for each
account.6
237 Q.
238 A.
Why is Southwest Gas' Arizona depreciation expense decreasing?
Minor adjustments in life and net salvage factors for various accounts influenced
g the deprec iation expense change as discussed later and in Exhibit
No.10 (DAW-2). The most significant changes in the accrual amount were seen
in Accounts 376 and 380. The increase in life and decrease in cost of removal11
for Distribution Account 376, Mains, and the increase in life for Distribution12
13
14
2415 Q.
Account 380, Services along with the resulting reserve position, are the primary
reasons for the decrease in depreciation expense.
W hat method did you use to analyze his tor ical data to determine life
characteristics?16
2417 A.
18
In much the same manner as human mortality is
All accounts were analyzed using the retirement rate method (actuarial) analysis
to estimate the life of property. This is the most appropriate method when aged
retirement data is available.19
20
21
22
analyzed by actuaries, depreciation analysts use models of property mortality
characteristics that have been validated in research and empirical applications.
Further detail is found in the life analysis section of Exhibit No. (DAW-2).
2523 o .
2524 A.
25
How did you determine the average service lives for each asset group?
Specifically, the service life for each account within the Distribution and General
functional groups was determined by using the actuarial method of life analysis.
-g-
1 Graphs and tables supporting the actuarial analysis and the chosen Iowa Curves
2
No.3
4
used to determine the average service lives for each account are found in Exhibit
(DAW-2) and my depreciation study workpapers. A summary of the
depreciable life for each account is shown in Exhibit No. (DAW-2),
5
266 o.
Appendix C.
What is the significance of an asset's useful life in your depreciation study?
An asset's useful life was used to determine the remaining life over which the267 A.
8
g
remaining cost (original cost plus or minus net salvage, minus accumulated
depreciation) can be allocated to normalize the asset's cost and spread it ratably
10
27
over future periods.
Please describe some of the changes in the average service lives for the various11 Q.
accounts?12
2713 A. The detailed analysis of each account is described fully in Exhibit No.
14
15
(DAW-2). Examples of some of the changes in average service lives are:
The largest decrease was a change in life of 18 years for two accounts:
Distribution Account 381 - Meters and Account 394 Tools, Shop and Garage16
17 Equipment.
•18
19
•
The largest increases were a change in life of 15 years in Accounts 374.20 -
Rights of Way and 378-Measuring and Regulating Station Equipment.
Overall, 8 accounts experienced some level of decrease in average service20
21 life while 8 accounts experienced a lengthening of average service life. Thel
22 remaining accounts were unchanged.
2823 Q.
28A.24
25
What is net salvage?
while discussed more fully in the study itself, net salvage is the difference
between the gross salvage (what the asset was sold for) and the removal costl
_10-
3
l
Salvage and removal cost1 (cost to remove and dispose of the asset).
2
3
4
5
6
percentages are calculated by dividing the current cost of salvage or removal by
the original installed cost of the asset. Some plant assets can experience
significant negative removal cost percentages due to the amount of removal cost
and the timing of the addition versus the retirement. For example, a Distribution
asset in FERC Account 376 with a current installed cost of $500 (2015) would
have had an installed cost of $41231 in 1962. If one were to calculate removal7
8
g
10
11
cost as a percent of current cost, a removal cost of $50 for the asset would only
have a -10 percent removal cost ($50/$500). This would be incorrect. A correct
removal cost calculation would show a negative 121 percent removal cost for
that asset ($50/$41.23). Inflation from the time of installation of the asset until
the time of its removal must be taken into account in the calculation of the12
13
14
2915 Q.
2916 A.
17
18
19
20
removal cost percentage because the depreciation rate, which includes the
removal cost percentage, will be applied to the original installed cost of assets.
How did you determine the net salvage percentages for each asset group?
The net salvage as a percent of retirements for various bands (i.e. groupings of
years such as the three-year, five-year or 10-year average) for each account is
shown in my Exhibit no._(DAw-2), Appendix D. The historical experience,
input from Company experts and judgment were used to select a net salvage
percentage that represents the future expectations for each account.
Is this a reasonable method for determining net salvage rates?3021 o.
Yes. The method used to establish appropriate net salvage percentages for3022 A.
each account was determined by using the same methodology which is the basis23
24
25 'Using the Handy-Whitman Bulletin No. 182 G-5 line 44 $41.23 = $500 x 63/764.
-11-

1
2
for the current approved rates used by Southwest Gas. It is also a methodology
commonly employed throughout the industry and is a method recommended in
authoritative texts.3
314 Q. Please describe some of the changes in the net salvage percentages for the
various accounts.5
316 A. The detailed analysis of each account is described fully in Exhibit No.
7
8
g
10
(DAW-2). Examples of some of the changes in net salvage are:
The largest increases (i.e. less negative) in net salvage were in Distribution
Accounts 380 - Services and 376 - Mains. Net salvage moved from a
negative 96 percent to negative 45 percent for Account 380 and from a
11
12
13
14
15
negative 60 percent to a negative 30 percent for Account 376.
The largest decrease (i.e. more negative or less positive) is in Distribution
Account 393 - Stores Equipment This change is due to a 20 percent net
salvage as existing and to 0 percent net salvage.
Overall, 8 accounts experienced some level of increase (less negative) in net
16
17
salvage while 4 accounts experienced a decrease (more negative or less
positive) in net salvage. The remaining accounts were unchanged.
IV. SOUTHWEST GAS - SYSTEM ALLOCABLE DEPRECIATION STUDY18
3219 Q. Please describe the depreciation study the Company is using for its system
20 allocable plant.
3221 A. The Company is utilizing the System Allocable depreciation study that was filed
22 in the Company's most recent Nevada general rate case in Docket No. 12-
04005.23 Utilizing the System Allocable depreciation study that is prepared
24
25
pursuant to the Nevada requirement, that depreciation studies be filed at least
once every six years, is consistent with prior Arizona rate cases.
-12-

331 Q. Did you sponsor the system allocable depreciation study filed in Docket No.
12-04005?2
333 A.
(DAW-3) and4
Yes, I did. A schedule showing the previous versus approved depreciation rates
and the study related to those rates are attached as Exhibit No.
Exhibit No.5 (DAW-4), respectively.
v. CONCLUSION6
347 Q. What account depreciation rates are you proposing, and how do they compare
with the current rates?8
34g A. The current depreciation rates and the rates I am now proposing related to
10 (DAW-2). Detailed calculations
(DAW-2).
Arizona are found in my study, at Exhibit No.
of these rates are also included at Exhibit No.11
3512 Q. Do you have any concluding remarks?
3513 A. Yes. The depreciation study and analysis performed under my supervision fully
14
15
support setting depreciation rates at the level I have indicated in my testimony.
The depreciation study for Southwest Gas' Arizona depreciable property as of
December 31, 2015 describes the extensive analysis performed and the16
17
18
resulting rates that are now appropriate for Company property. Depreciation
rates set at my recommended amounts will allow the Company the opportunity
to recover its total investment in property over the estimated remaining life of the19
assets.20
3621 Q. Does this conclude your prepared direct testimony?
Yes .3622 A.
23
24
25
-13-
Exhibit no._<DAw1)Page 1 of 13
Statement of Qualifications
Dane A. Watson
I hold a Bachelor of Science degree in Electrical Engineering from the University
of Arkansas at Fayetteville and a Master's Degree in Business Administration from
Amberton University.
The Society of Depreciation Professionals ("the Society") has established
The Soc iety adminis ters annational standards for depreciation professionals.
examination and has certain required qualif ications to become certif ied in this field. I
met all requirements and have become a Certified Depreciation Professional ("CDP").
l have been a member of the Society of Depreciation Professionals Training
I developed and teach the capstone c lass, "Preparing andFaculty since 2005.
Defending a Depreciation Study" and "Engineering Aspects of a Depreciation Study". I
also teach depreciation to participants from the American Gas Association and Edison
Electric Institute and for the Michigan State University Regulatory Conference. I have
also provided training to state commissions at the request of various regulatory bodies.
Since graduation from college in 1985, I have worked in the area of depreciation
and valuation. I founded Alliance Consulting Group in 2004 and am responsible for
conducting depreciation, valuation and certain accounting-related studies for utilities in
various industries. My duties relate to depreciation studies include the assembly and
analysis of historical and simulated data, conducting field reviews, determining service
calculating annual depreciation, presentinglife and net salvage estimates,
recommended depreciation rates to utility management for its consideration, and
supporting such rates before regulatory bodies.

Exhibit No. (DAW1)Page 2 of 13
").My prior employment from 1985 to 2004 was with Texas Utilities ("TXU During
my tenure with TXU, I was responsible for, among other things, conducting valuation
and depreciation studies for the domestic TXU companies. During that time, I sewed as
Manager of Property Accounting Services and Records Management in addition to my
depreciation responsibilities.
l have twice been Chair o f the Edison Elec tr ic Ins ti tute ( "EEl") Proper ty
Accounting and Valuation Committee and have been Chairman of EEl's Depreciation
and Economic Issues Subcommittee. I am a Registered Professional Engineer ("PE") in
the State of Texas and a Certified Depreciation Professional. I am a Senior Member of
l
the Institute of Electrical and Electronics Engineers (IEEE) and have held numerous
offices on the Executive Board of the Dallas Section, Region and World-wide offices of
IEEE. l currently serve as Treasurer of the Member and Geographic Unit Business Unit
and serve on the IEEE Finance Committee. l have served as President of the Society
of Depreciation Professionals twice, most recently in 2015.
Over the course of my career, I have testif ied in more than 125 proceedings
before 30 regulatory bodies, both state commissions and FERC. A list of my testimony
appearances before various regulatory bodies is provided below.

l
Exhibit n<>.__(DAw1)Page 3 of 13
Dane Watson Testimony Appearances
YearCommission DescriptionAsset Location CompanyDocket (IfA liable
201645414Texas Sharyl and
201616A-0231 EColorado
ElectricDepreciation
StudElectric
DepreciationStud
Public UtilityCommission
Of TexasColorado Public
UtilitiesCommission
201516-453-000FERCMulti-State NEUS
ElectricDepreciation
Studyl
PublicService ofColoradoNortheast
TransmissionDevelopment,
LLC
2015I5-098-UArkansasCounterPoint
Arkansas
Gas DepreciationStudy and Cost ofRemoval Stud
ll2015SPSNMl 5-00296-UTNew Mexicoi
ElectricDepreciation
Study
i
201514-00146 i
iAt nos
TennesseeAt nos EnergyCorporation
Natural GasDepreciation
Stud
l
201515-00261-UTNew Mexico
ElectricDepreciation
Studyl
PublicService
Company ofNew Mexico
2015KansasAt nosKansas
l6-ATMG-079-RTS
Gas DepreciationStudy
l
201544704TexasEnergyTexas
ArkansasPublic ServiceCommissionNew Mexico
PublicRegulation
CommissionTennesseeRegulatoryAuthorit
New MexicoPublic
RegulationCommission
KansasCorporationCommissionPublic UtilityCommission
of Texas
2015U-l5-089Alaska
FairbanksWater andWastewater
RegulatoryCommission
of Alaska
ElectricDepreciation
StudWater and Waste
WaterDepreciation
Stud
201515-031-uArkansasSource GasArkansas
UndergroundStorage Gas
Depreciation Study
Arkansas PublicService
Commission
2015SPS NMI5-00139-UTNew Mexico
ElectricDepreciation
Study
New MexicoPublic
RegulationCommission
l
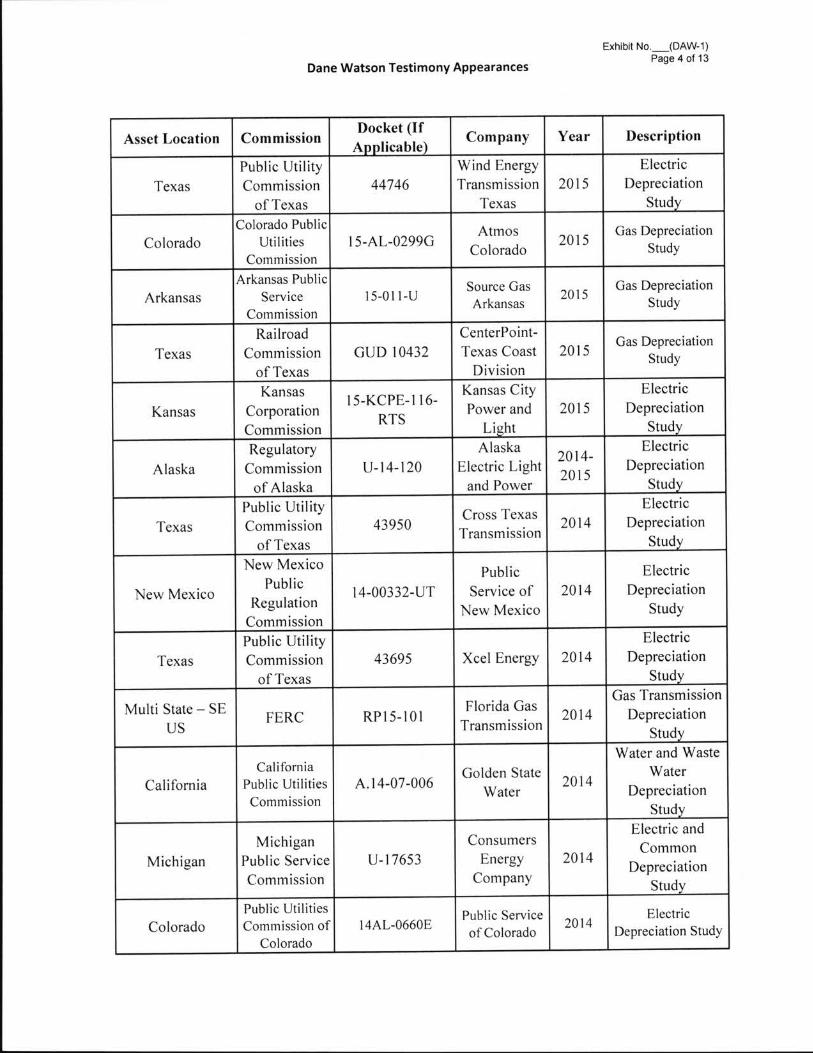
Exhibit NO.___(DAW1)Page 4 of 13
Dane Watson Testimony Appearances
YearCo mmi s s i o n Descr ip t ionAsset Location C o m p a n yDocket (IfA liable
2 0 1 54 4 7 4 6T e xa s
Ele c t r i cDe p re c ia t io n
Stu d
Wi n d En e r g yT ra n smiss io n
T e xa s
2 0 1 5I 5-AL-0299GCo l o r a d oGas Depreciation
StudyAt n o s
Co l o r a d o
2015I 5 - o l l - UArkansasSource Gas
ArkansasGas Depreciation
Study
2 0 1 5G U D 1 0 4 3 2TexasGas Depreciation
Study
2 0 1 5Kansas1 5 - KCPE- I 1 6 -
R T Su
U-I4-120Al a s k a2 0 1 4 -
2 0 1 5
Ce n te rPo in t -Texas Coas t
D i v i s i o nKa n sa s Ci t y
Pow er andL i h t
Al a s k aEle c t r i c L i g h t
and Pow er
2 0 1 44 3 9 5 0T e xa sCross Texas
T ra n smiss io n
Ele c t r i cDep rec ia t ion
Stu dEle c t r i c
De p re c ia t io nStu d
Ele c t r i cDe p re c ia t io n
Stu d
2 0 1 414-00332-uTNew Mexico
Pu b l i cSe rv ice o f
N e w M e x i c o
Ele c t r i cDe p re c ia t io n
Stu d y
2 0 1 44 3 6 9 5 Xc e l En e r g yT e xa s
Pu b l i c Ut i l i t yCo mmi s s i o n
o f T e xa sColorado Public
Ut i l i t iesCommiss ion
Arkansas PublicService
Commiss ion
Ra i l r o a dCo mmi s s i o n
o f T e xa sKansas
Co r p o r a t i o nCo mmi s s i o n
Re g u la to ryCo mmi s s i o n
o f Al a s k a
Pu b l i c Ut i l i t yCo mmi s s i o n
o f T e xa sN e w M e x i c o
Pu b l i cRe g u la t io n
Co mmi s s i o n
Pu b l i c Ut i l i t yCo mmi s s i o n
Of Texas
S E 2 0 1 4RPl 5 -1 0 1F E R CF lo r id a Ga s
T ransmiss ionM u l t i St a t e -
U S
2 0 1 4A.l4-07-006CaliforniaGo lden Sta te
Wa t e r
Cal i fo rn iaPublic Uti l i t ies
Commiss ion
2 0 1 4U- 1 7 6 5 3MichiganM i c h i g a n
Pub l i c Se rv iceCo mmi s s i o n
Co n s u me r sEn e rg y
Co mp a n y
Ele c t r i cDe p re c ia t io n
St u dGas T ransmiss ion
De p re c ia t io nSt u d
Wate r and Was teWa t e r
De p re c ia t io nStu d
Elec t r ic andC o m m o n
De p re c ia t io nStu d
2014l 4AL-0660ECo l o r a d oPublic Serviceof Colorado Electr ic
Depreciation Study
Publ ic Ut i l i t iesCommiss ion o f
Colorado
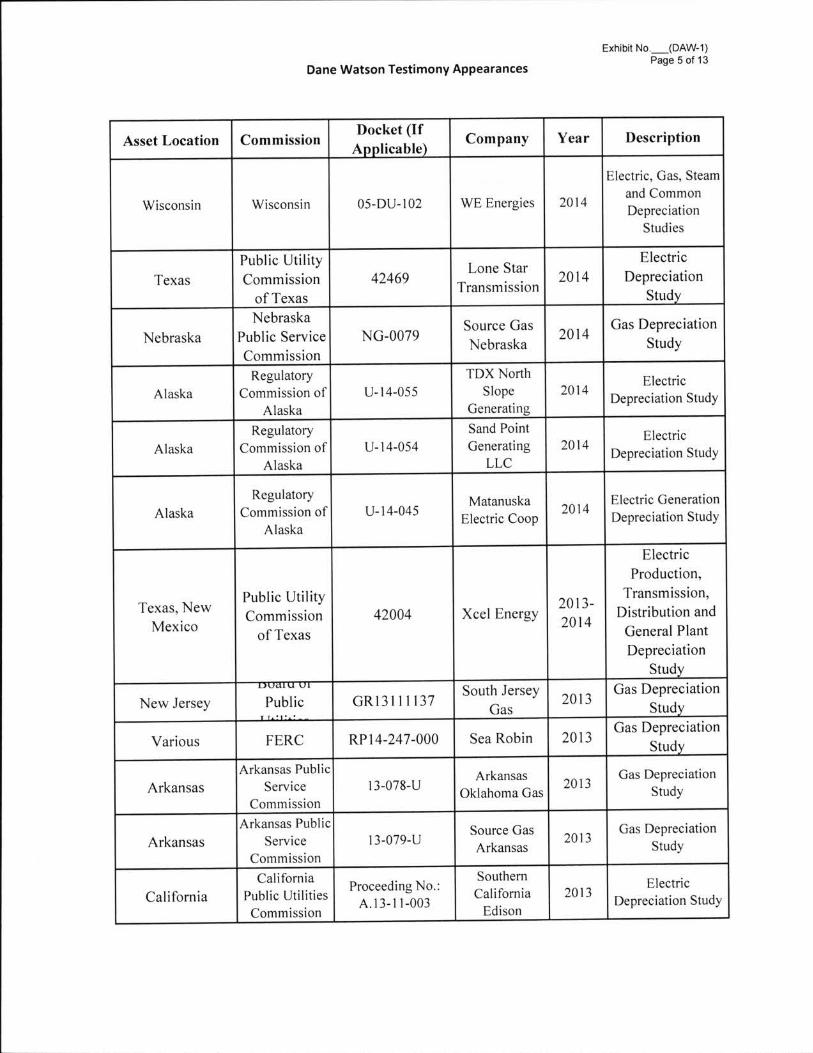
Exhibit NO.__(DAW1)Page 5 of 13
Dane Watson Testimony Appearances
YearCommissionAsset Location CompanyDocket (If
A l i a b l e
201405-Du-102WisconsinWisconsin WE Energies
Electric, Gas, Steam
and CommonDepreciation
Studies
201442469TexasLone Star
Transmission
E lectricDepreciation
Stud
2014N G -0079NebraskaSource GasNebraska
Gas DepreciationStudy
2014U-I4-055AlaskaElectric
Depreciation Study
2014U-l4-054AlaskaElectric
Depreciation Study
TDX NorthSlope
Generating
Sand PointGenerating
L L C
Publ ic U t i l i tyCommission
of TexasNebraska
Public ServiceCommission
RegulatoryCommission of
AlaskaRegulatory
Commission ofAlaska
2014U-i 4-045AlaskaElectric GenerationDepreciation Study
MatanuskaElectric Coop
RegulatoryCommission of
Alaska
42004 Xcel Energy2013-2014
Texas, NewM exico
Publ ic U t i l i tyCommission
Of Texas
2013GRl3 l 11 137PublicNew JerseySouth Jersey
Gas
2013Sca RobinRPl 4-247-000FERCVarious
E lectricProduction,
Transmission,D istr ibution and
General PlantDepreciation
StudGas Depreciation
StudGas Depreciation
Stud
2013I 3078-UArkansasArkansas
Oklahoma Gas
Gas Depreciation
Study
2013I 3079-UArkansasSource Gas
Arkansas
Gas Depreciation
Study
2013Cal i forniaElectric
Depreciation StudyProceeding No.:
A. 131 1-003
SouthernCalifornia
Edison
Arkansas PublicService
Commission
Arkansas PublicService
Commission
CaliforniaPublic Utilities
Commission

Exhibit no._(oAw1)Page 6 of 13
Dane Watson Testimony Appearances
YearCommission DescriptionAsset Location CompanyDocket (IfA livable
2013ERl3-1313FERCElectric
Depreciation Study
ProgressEnergyCarolina
NorthCarolina South
Carolina
20134220-DU-108Wisconsin
NorthernStates Power-
Wisconsin
Public ServiceCommissionofWisconsin
201341474Texas Sharyland
Electric, Gas andCommon
Transmission,Distribution and
GeneralElectric
DepreciationStud
20132013-00148KentuckyGas Depreciation
Studyl
201313-252MinnesotaElectric
Depreciation Study
At nosEnergy
Cor orationAllete
MinnesotaPower
2013DE 13-063New HampshireLibertyUtilities
ElectricDistribution and
General
201310235TexasWest Texas
GasGas Depreciation
Study
2012U-12-154AlaskaTelecommunication
s Utility
AlaskaTelephoneCompany
2012SPS12-00350-UTNew MexicoElectric
Depreciation Study
201212AL-1269STColoradoPublic Serviceof Colorado Gas and Steam
Depreciation Study
201212AL-1268GColoradoPublic Serviceof Colorado Gas and Steam
Depreciation Study
Public UtilityCommission
of TexasKentucky
Public ServiceCommission
MinnesotaPublic UtilitiesCommission
NewHampshire
Public ServiceCommission
RailroadCommission
of TexasRegulatory
Commission ofAlaska
New MexicoPublic
RegulationCommission
Colorado PublicUtilities
CommissionColorado Public
UtilitiesCommission
2012U-12-149AlaskaElectric
Depreciation Study
RegulatoryCommission of
Alaska
MunicipalPower and
Light City ofAnchorage

Exhibit no._(DAw1)Page 7 of 13
Dane Watson Testimony Appearances
YearCommission DescriptionAsset Location CompanyDocket (IfA liable
201240824Texas Xcel EnergyElectric
Depreciation Study
2012South CarolinaElectric
Depreciation StudyDocket 20 l 2-384-
E
ProgressEnergy
Carolina
2012Ui2-141AlaskaTelecommunication
s Utility
2012U-l7l04MichiganGas Depreciation
Study
InteriorTelephoneCompany
Michigan GasUtilities
Corporation
2012E-2 Sub 1025North CarolinaElectric
Depreciation Study
Progress
EnergyCarolina
201240606TexasElectric
Depreciation Study
Wind EnergyTransmission
Texas
201240604TexasElectric
Depreciation StudyCross TexasTransmission
Texas PublicUti li ty
Commission
Public ServiceCommission
of SouthCarolina
RegulatoryCommission of
Alaska
MichiganPublic ServiceCommission
NorthCarolina
UtilitiesCommission
Texas PublicUti li ty
Commission
Texas PublicUti li ty
Commission
201212-858Minnesota
MinnesotaNorthern
States Power
MinnesotaPublic
UtilitiesCommission
Electric, Gas andCommon
Transmission,
Distribution andGeneral
2012lol70TexasGas Depreciation
StudyAt nos Mid-
Tex
2012lol 74TexasGas Depreciation
StudyAt nos West
Texas
2012lol 82TexasGas Depreciation
Study
2012KansasElectric
Depreciation Studyl 2-KCPE-764-
RTS
Center PointBeaumont/East TexasKansas CityPower and
Li 'hi»
RailroadCommission
of Texas
RailroadCommission
of TexasRailroad
CommissionoflTexas
KansasCorporationCommission
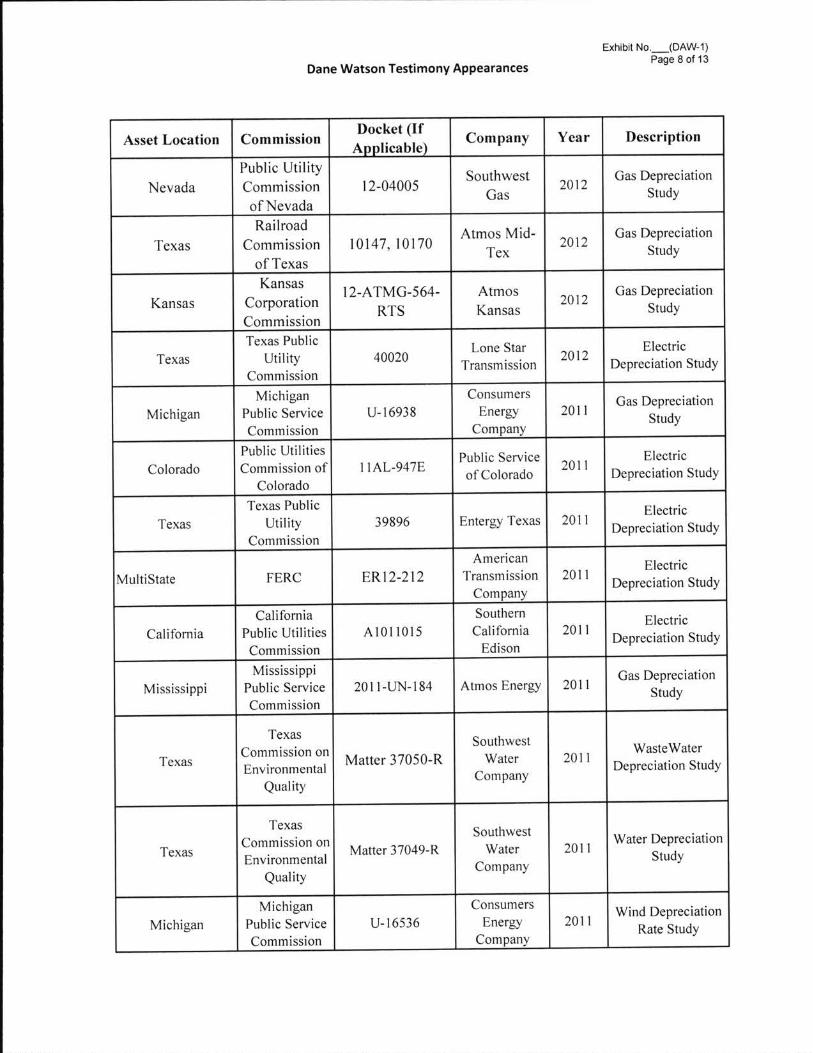
Exhibit No. (DAW1)Page 8 of 13
Dane Watson Testimony Appearances
YearCommission DescriptionAssct Location CompanyDocket (IfA liable
201212-04005NevadaSouthwest
Gas
Gas Deprec iation
Study
201210147, 10170TexasAt nos Mid-
TexGas Deprec iation
Study
2012KansasAt nosKansas
Gas Deprec iation
Study
12-ATMG-564-RTS
201240020TexasLone Star
Transmission
Elec tr ic
Deprec iation Study
201 1U- 16938MichiganGas Deprec iation
Study
Consumers
Energy
Company
201 11 1 AL-947EColor adoPublic Serviceof Colorado Elec tr ic
Deprec iation Study
201 l39896 Energy TexasTexasElec tr ic
Deprec iation Study
Public UtilityCommissionof NevadaRailroad
Commissionof Texas
KansasCorporationCommissionTexas Public
UtilityCommission
MichiganPublic ServiceCommission
Public UtilitiesCommission of
Colorado
Texas PublicUtility
Commission
201 IERl 2-212F E RCMultiStateElec tr ic
Deprec iation Study
201 lAl011015CaliforniaElec tr ic
Deprec iation Study
Amer i c an
Transmission
Company
Southern
Cali f or ni a
Edison
2011201 1-UN-184 At nos EnergyMississippiGas Deprec iation
Study
CaliforniaPublic Utilities
Commission
MississippiPublic ServiceCommission
2011Matter 37050-RTexasW asteW ater
Deprec iation Study
Southwest
W ater
Company
TexasCommission onEnvironmental
Quality
201 1Matter 37049-RTexasW ater Deprec iation
Study
Southwest
W ater
Company
TexasCommission onEnvironmental
Quality
201 1U- 16536MichiganW ind Deprec iation
Rate Study
MichiganPublic ServiceCommission
Consumers
Energy
Company
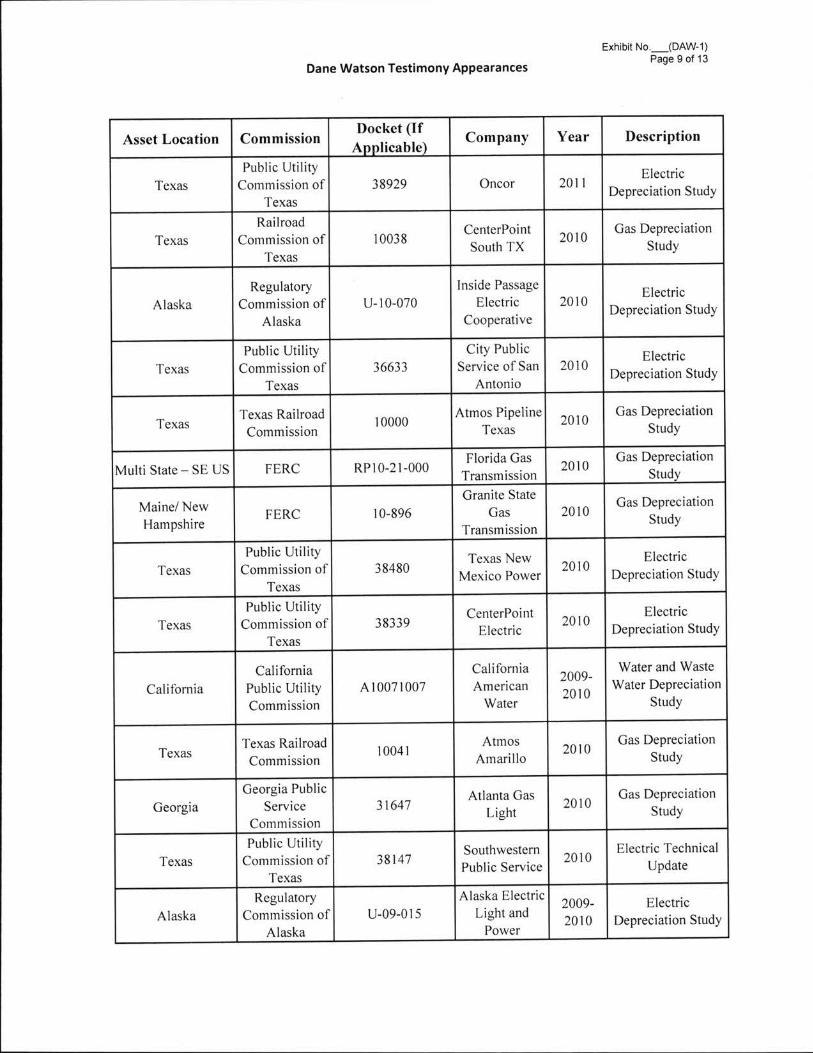
Exhibit no.__(DAw1)Page 9 of 13
Dane Watson Testimony Appearances
YearCommission DescriptionAsset Location CompanyDocket (If
A l i a b l e
2011Oncor38929TexasElectric
Depreciation Study
201010038TexasCenterPointSouth TX
Gas Depreciation
Study
Public UtilityCommission of
Texas
RailroadCommission of
Texas
2010U l 0 - 070AlaskaElectric
Depreciation Study
RegulatoryCommission of
Alaska
Inside PassageElectric
Cooperative
201036633TexasElectric
Depreciation Study
City PublicService of San
Antonio
Public UtilityCommission of
Texas
201010000TexasAt nos Pipeline
Texas
Gas DepreciationStudy
Texas Railroad
Commission
2010Rpi0_2I-000FERCMulti State - SE USGas Depreciation
Study
201010896FERCGas Depreciation
StudyMaine/ NewHampshire
Florida GasTransmission
Granite State
GasTransmission
201038480TexasTexas New
Mexico PowerElectric
Depreciation Study
201038339TexasCounterPoint
Electric
ElectricDepreciation Study
Public UtilityCommission of
TexasPublic Utility
Commission ofTexas
Al0071007California2009-2010
CaliforniaAmerican
Water
Water and Waste
Water DepreciationStudy
CaliforniaPublic UtilityCommission
201010041TexasAt nos
AmarilloGas Depreciation
StudyTexas Railroad
Commission
201031647GeorgiaGas Depreciation
StudyAtlanta Gas
Light
201038147TexasSouthwesternPublic Service
Electric Technical
Update
U-09-015Alaska2009-2010
ElectricDepreciation Study
Alaska ElectricLight and
Power
Georgia Public
ServiceCommission
Public UtilityCommission of
TexasRegulatory
Commission ofAlaska

Exhibit No. (DAW1)Page 10of13
Dane Watson Testimony Appearances
YearCo mmi s s i o nAsset Locat ion Descr ip t io nC o m p a n yDocket (IfA liable
U- I0 - 0 4 3Alaska2009-2010
Uti l i ty Servicesof Alaska Water DepreciationStudy
RegulatoryCommiss ion o f
Alaska
U-16055Mich igan2009-2010
Mich iganPublic ServiceCommiss ion
Ludington PumpedStorage
Depreciation Study
ConsumersEnergy /DTE
Energy
U-16054Mich igan2009-2010
Electr icDepreciation Study
ConsumersEnergy
2009U- l 5 9 6 3Mich iganGas Depreciation
Study
Mich iganPublic ServiceCommiss ion
Mich iganPublic ServiceCommiss ion
2009U-l 5989Mich iganElectr ic
Depreciation Study
Mich iganPublic ServiceCommiss ion
Michigan GasUt i l i t ies
Corporation
UpperPeninsula
PowerCompany
20099869 At nos EnergyTexasShared Services
Depreciation Study
200909-UN-334MississippiGas Depreciation
Study
20099902TexasGas Depreciation
Study
CenterPointEnergy
Mississippi
CenterPointEnergy
Houston
Source Gas30022-148-GRl0Wy o min g2009-2010
Gas DepreciationStudy
20090 9 AL -2 9 9 EColoradoPublic Serviceof Colorado Electr ic
Depreciation Study
2009l 1-00144TennesseePiedmont
Natural GasGas Depreciation
Study
2008Cleco lU-30689LouisianaElectr ic
Depreciation Studyl
RailroadCommiss ion o f
Texas
MississippiPublic ServiceCommiss ion
RailroadCommiss ion o f
Texas
Wy o min gPublic ServiceCommiss ion
Colorado PublicUt i l i t ies
Commiss ion
TennesseeRegulatoryAuthor i ty
LouisianaPublic ServiceCommiss ion
l
ll
l
lll
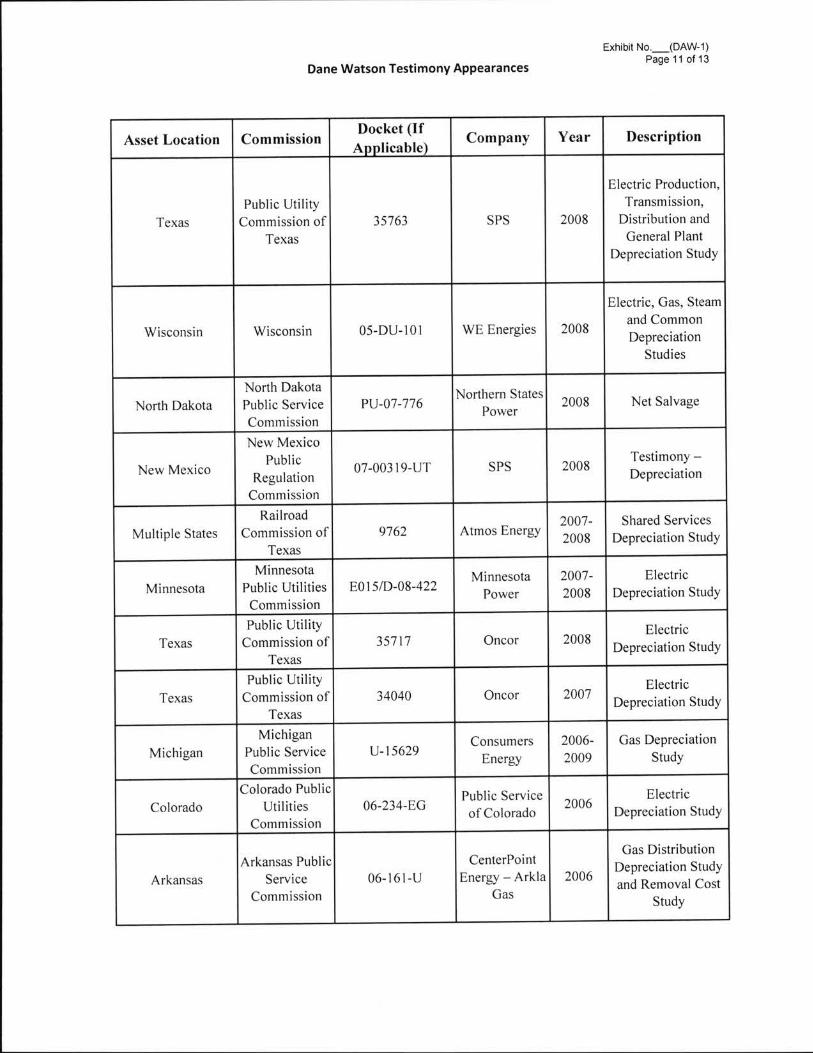
Exhibit n<>._(oAw1)Page 11 of 13
Dane Watson Testimony Appearances
YearCommission DescriptionAsset Location CompanyDocket (IfA licablc
2008SPS35763TexasPublic Utility
Commission ofTexas
Electric Production,Transmission,
Distribution andGeneral Plant
Depreciation Study
200805-DU-lolWisconsin WE EnergiesWisconsin
Electric, Gas, Steamand CommonDepreciation
Studies
2008PU-07-776 Net SalvageNorth DakotaNorthern States
Power
2008SPS07-003 I9-UTNew MexicoTestimony .-Depreciation
9762 At nos EnergyMultiple States2007-2008
Shared ServicesDepreciation Study
EOl 5/D08-422Minnesota2007-2008
MinnesotaPower
ElectricDepreciation Study
2008Oncor35717TexasElectric
Depreciation Study
2007Oncor34040TexasElectric
Depreciation Study
Ul5629Michigan2006-2009
Gas DepreciationStudy
ConsumersEnergy
200606-234-EGColoradoPublic Service
of ColoradoElectric
Depreciation Study
North DakotaPublic ServiceCommission
New MexicoPublic
RegulationCommission
RailroadCommission of
Texas
MinnesotaPublic UtilitiesCommission
Public UtilityCommission of
Texas
Public UtilityCommission of
Texas
MichiganPublic ServiceCommission
Colorado PublicUtilities
Commission
200606-l6l-UArkansas
CenterPointEnergy - Ark la
Gas
Arkansas PublicService
Commission
Gas DistributionDepreciation Studyand Removal Cost
Study

Exmbnno_oAurnPage 12of13
Dane Watson Testimony Appearances
YearCommissionAsset Location DescriptionCompanyDocket (IfA liable
32766 Xcel Energy2005-2006
Public UtilityTexas, New Mexico Commission of
Texas
Electric Production,
Transmission,Distribution and
General PlantDepreciation Study
9670/9676Texas2005-2006
Gas DistributionDepreciation Study
At nos Energy
Corp
TXU Gas9400Texas2003-
2004
Gas Distribution
Depreciation Study
2002TXU Gas9313TexasGas Distribution
Depreciation Study
2002TXU Gas9225TexasGas Distribution
Depreciation Study
Line Losses2001TXU24060Texas
Line Losses2001TXU23640Texas
TXU Gas9145-9148Texas2000-
2001
Gas DistributionDepreciation Study
TXU22350Texas2000-2001
ElectricDepreciation Study,
Unbundling
8976Texas TXU PipelinePipeline
Depreciation StudyM1999TXU20285Texas
Fuel CompanyDepreciation Study
1998TXUl 8490TexasTransition toCompetition
1997TXU16650TexasCustomerComplaint
RailroadCommission of
Texas
RailroadCommission of
Texas
RailroadCommission of
Texas
RailroadCommission of
Texas
Public UtilityCommission of
Texas
Public UtilityCommission of
Texas
RailroadCommission of
TexasPublic Utility
Commission ofTexas
RailroadCommission of
TexasPublic Utility
Commission ofTexas
Public UtilityCommission of
TexasPublic Utility
Commission ofTexas

Exhibit no.__(DAw1)Page 13 of 13
Dane Watson Testimony Appearances
Y e a rCo mmi s s i o n Descr ip t ionC o m p a n yAsset Locat ionDo c k e t ( I f
A Amicable
T X U15195TexasMin ing Company
Depreciaiton StudyM1993T X U12160Texas
Fuel CompanyDepreciation Study
l 993Texas T X Ul 1735Electr ic
Depreciation Study
Pub l ic Ut i l i tyCommiss ion o f
Texas
Publ ic Ut i l i tyCommiss ion o f
Texas
Publ ic Ut i l i tyCommiss ion o f
Texas
l
l
l
i
ll
l
l
i

Exhibit No. (DAW-2)Page 1 of 64
SOUTHWEST GAS CORPORATION
ARIZONA RATE JURISDICTION
DEPRECIATION RATE STUDY
AT DECEMBER 31, 2015
>*4;ALLI ANCEACONSULTING GROUP
http:ll .utilityaIIiance.com

Exhibit No. (DAW-2)Page 2 of 64
SOUTHWEST GAS CORPORATION
ARIZONA RATE JURISDICTION
DEPRECIATION RATE STUDY
EXECUTIVE SUMMARY
i
li
ll
Southwest Gas Corporation ("Southwest Gas" or "Company") engaged
Alliance Consulting Group to conduct a depreciation study of the Company's
Arizona utility plant depreciable assets as of December 31, 2015.
This study was conducted under the traditional depreciation study
approach. The net salvage analysis in this study paralleled the approach
previously used by Southwest Gas in its existing depreciation rates, using broad
group, average life remaining life depreciation.
Life and net salvage characteristics show change from the existing
depreciation rates. Eight accounts show an increase in life, and eight accounts
show a decrease in life, with the rest being unchanged. Eight accounts showed
an increase in net salvage, and four accounts showed a decrease in net salvage.
The Company's largest accounts in the distribution function show a less negative
net salvage.
This study proposed to adopt FERC Accounting Release 15 ("AR-15")
issued by the Federal Energy Regulatory Authority ("FERC") for many of the
Company's general plant accounts. Appendix A-1 demonstrates those
computations in depreciation expense.
This study recommends an overall decrease of $42.0 million in annual
depreciation expense compared to the depreciation rates currently in effect.
Appendix B demonstrates the change in depreciation expense for the various
accounts.
l.
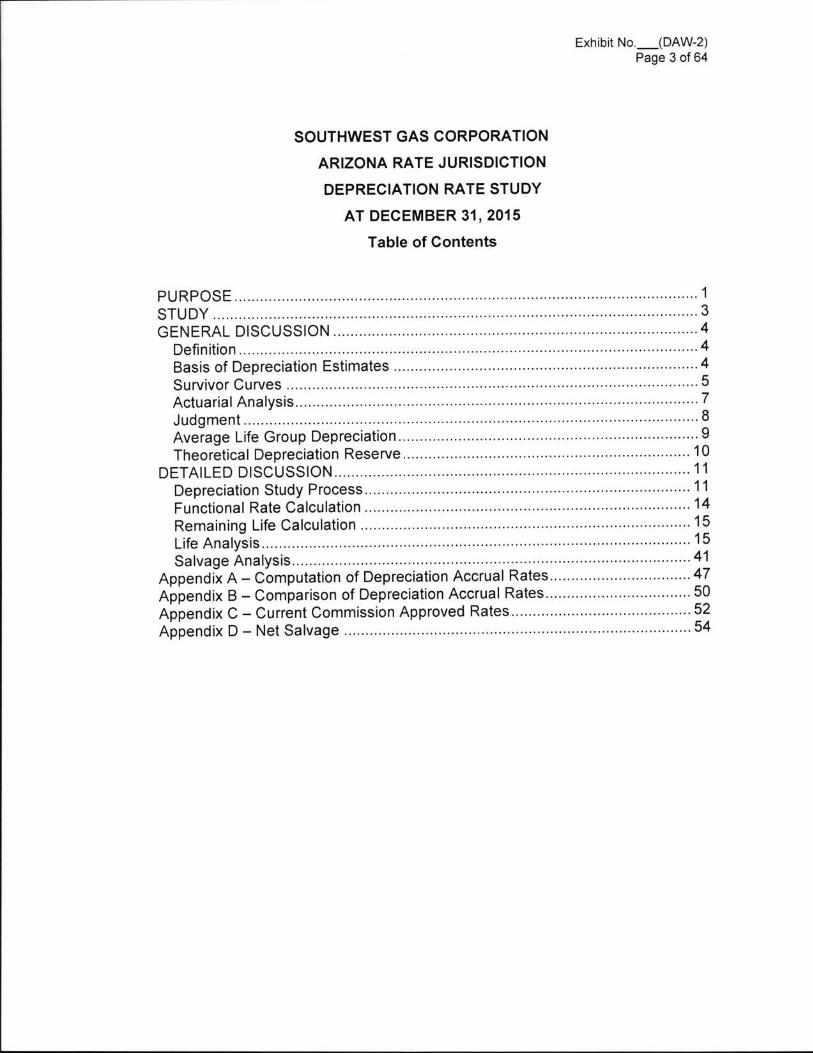
Exhibit No. (DAW-2)Page 3 of 64
SOUTHWEST GAS CORPORATION
ARIZONA RATE JURISDICTION
DEPRECIATION RATE STUDY
AT DECEMBER 31, 2015
Table of Contents
1
4445789
1011111415154147505254
GENERAL DISCUSSION
Basis of Depreciation EstimatesSurvivor CurvesActuarial
Average Life GroupTheoretical Depreciation
DETAILEDDepreciation StudyFunctional Rate CalculationRemaining Life CalculationLifeSalvage
Appendix A - Computation of Depreciation AccrualAppendix B - Comparison of Depreciation AccrualAppendix C - Current Commission ApprovedAppendix D Net Salvage

Exhibit No. (DAW-2)Page 4 of 64
PURPOSE
The purpose of this study is to develop depreciation rates for the
depreciable property as recorded on Southwest Gas' books at December 31,
2015 for its Arizona rate jurisdiction. The account based depreciation rates were
designed to recover the total remaining u depreciated investment, adjusted for
net salvage, over the remaining life of Arizona property on a straight-line basis.
Non-depreciable property and property which is amortized such as intangible
software were excluded from this study.
The Arizona rate jurisdiction of Southwest Gas provides local gas
distribution service to municipalities in Arizona. Southwest Gas owns distribution
mains, and various other plant assets. Southwest Gas' assets consist of a
complex system of intermediate and low pressure distribution networks located
across the service area. There are a number of receipt points throughout the
system where gas is delivered by the transmission system. Once gas is metered
into individual cities, the pressure is reduced through regulators in order to meet
system requirements as determined by pressure and volume needs. Then gas is
delivered to customers for burner tip consumption.
Southwest Gas is the largest distributor in Arizona, selling and
transporting natural gas in most of central and southern Arizona, including the
Phoenix and Tucson metropolitan areas. The Arizona rate jurisdiction
encompasses the central and southern regions of the state including the
metropolitan areas of Phoenix and Tucson. The Arizona rate jurisdiction has
approximately $2.8 billion in gross depreciable assets and includes more than
one million services and 19,000 miles of mains. Distribution mains and
services are more than $2.3 billion. There are approximately 5,500 miles of
steel mains.
The gas plant investment history for Southwest Gas Arizona consists
primarily of two acquisitions, plus additions since those acquisitions. In 1979,
the Company acquired the gas properties of Tucson Gas and Electric
1

Exhibit No. (DAW-2)Page 5 of 64
Company (TEPCO) and in 1984 it acquired the gas properties of Arizona
Public Service (Aps). In the more than 30 years since these two acquisitions,
the Company has increased the gas plant investment significantly. In
1979, the TEPCO acquisition was combined with the existing Arizona
properties to form the southern Arizona rate jurisdiction. In 1984, the APS
acquisition formed the central Arizona rate jurisdiction. Subsequent
additions to each jurisdiction were based on geographical
boundaries. A depreciation study was filed for each jurisdiction using data
as of December 1988. These rates were effective January 1990. In the
mid-1990s, the two jurisdictions were combined into the current Arizona
rate jurisdiction. A weighted average of the existing depreciation rates by
jurisdiction was used to develop the depreciation rates for the new combined
rate jurisdiction. These rates were effective September 1997. No depreciation
study has been filed since that time.
2
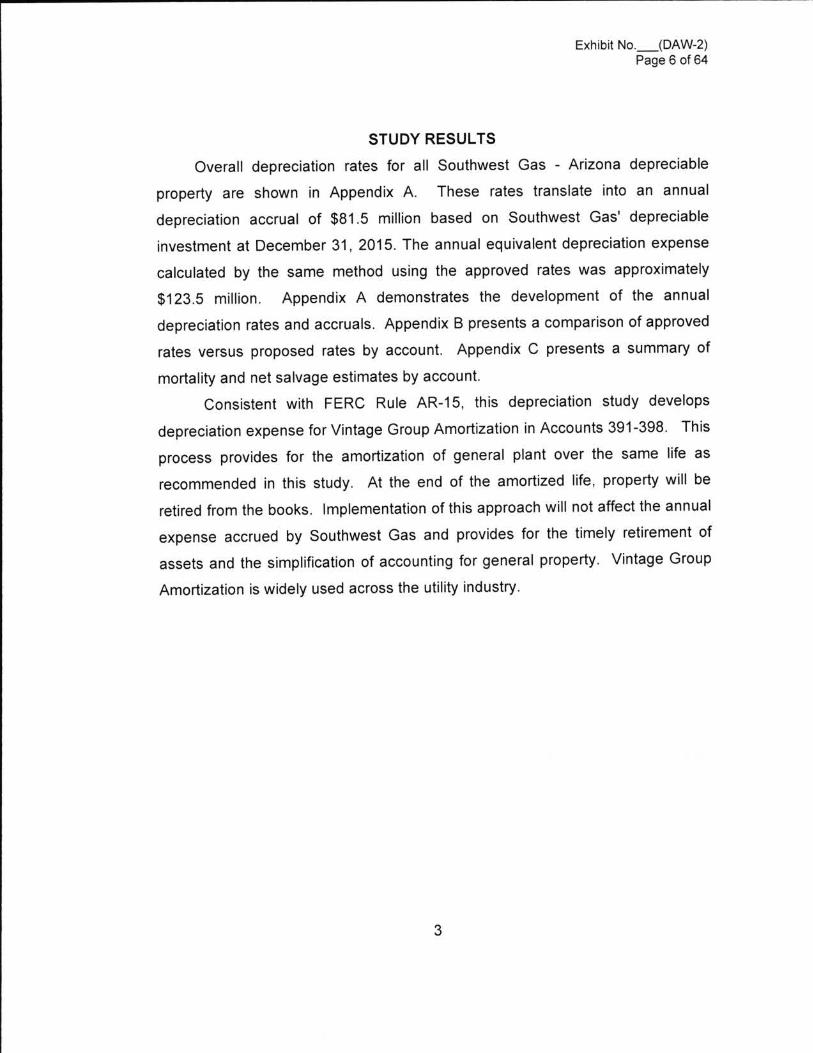
Exhibit No. (DAW2)Page 6 of 64
STUDY RESULTS
Overa ll deprec ia t ion ra tes fo r a ll Southwes t Gas - Ar i zona deprec iable
pro pe r t y a re s ho wn i n Appe ndi x A. Thes e ra tes t rans la te i nto an annua l
deprec ia t ion acc rua l o f $81 .5 mi ll i on based on Southwes t Gas ' deprec iable
investment at December 31, 2015. The annual equivalent depreciat ion expense
ca lcula ted by the same method us ing the approved ra tes was approximate ly
$123.5 mi llion. Appe ndi x A de mo ns t ra t e s t he de v e lo pme nt o f t he a nnua l
depreciation rates and accruals. Appendix B presents a comparison of approved
rates versus proposed rates by account. Appendix c presents a summary o f
mortality and net salvage estimates by account.
Cons i s tent wi th FERC Rule AR-15 , thi s deprec ia t i on s tudy dev e lops
depreciation expense for Vintage Group Amortization in Accounts 391-398. This
process prov ides fo r the amort i za t ion o f genera l plant over the same li fe as
recommended in this s tudy . At the end o f the amort ized li fe , property wi ll be
retired from the books. Implementation of this approach will not affect the annual
expense accrued by Southwest Gas and prov ides for the t imely re t i rement o f
assets and the s impli f icat ion of accounting for general property . Vintage Group
Amortization is widely used across the utility industry.
3

Exhibit no._(DAw-2)Page 7 of 64
GENERAL DISCUSSION
Definition
The term "deprec iation" as used in this s tudy is cons idered in the
accounting sense, that is, a system of accounting that distributes the cost of
assets, less net salvage (if any), over the estimated useful life of the assets in a
systematic and rational manner. It is a process of allocation, not valuation. This
expense is systematically allocated to accounting periods over the life of the
properties. The amount allocated to any one accounting per iod does not
necessarily represent the loss or decrease in value that will occur during that
particular period. The Company accrues depreciation on the basis of the original
cost of all depreciable property included in each functional property group. On
retirement the full cost of depreciable property, less the net salvage value, is
charged to the depreciation reserve.
Basis of De recitation Estimates
The straight-line, broad (average) life group, remaining-life depreciation
system was employed to calculate annual and accrued depreciation in this study.
In this system, the annual depreciation expense for each group is computed by
dividing the original cost of the asset less allocated depreciation reserve less
estimated net salvage by its respective average life group remaining life. The
resulting annual accrual amounts of all depreciable property within a function
were accumulated, and the total was divided by the original cost of all functional
depreciable property to determine the depreciation rate. The calculated
remaining lives and annual depreciation accrual rates were based on attained
ages of plant in service and the estimated service life and salvage characteristics
of each deprec iable group. The computations of the annual func tional
depreciation rates are shown in Appendix A and remaining life calculations are
shown in Appendix B.
Actuarial analysis was used with each account within a function where
suff icient data was available, and judgment was used to some degree on all
accounts.
4
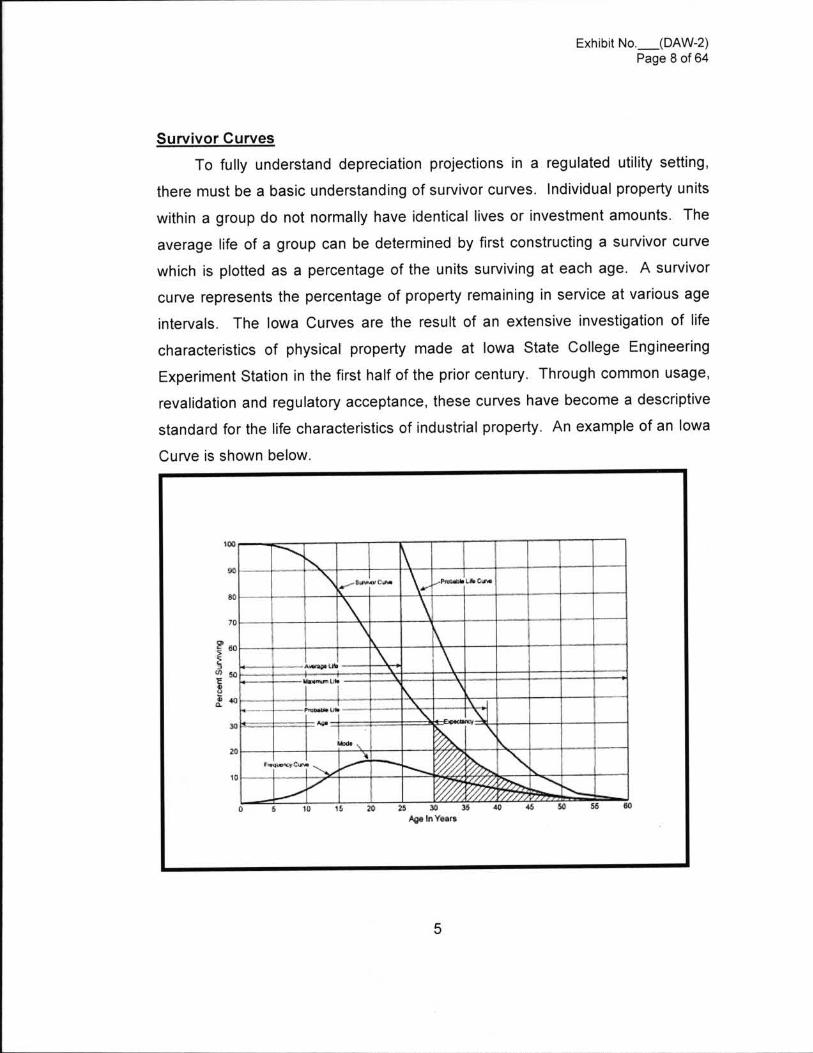
Exhibit No. (DAW-2)Page 8 of 64
Surv ivor Curves
To fully unders tand deprec iat ion project ions in a regulated ut i li ty sett ing,
there must be a basic understanding of survivor curves. Individual property units
wi thin a group do not normally have ident ical lives or investment amounts. The
average li fe of a group can be determined by f i rs t constructing a surv ivor curve
which is plotted as a percentage of the uni ts surv iv ing at each age. A surv ivor
curve represents the percentage of property remaining in service at various age
intervals. The Iowa Curves are the result o f an extens ive invest igat ion of li fe
charac ter is t ics o f phys ica l property made a t Iowa Sta te College Engineer ing
Experiment Station in the f i rst half of the prior century. Through common usage,
revalidation and regulatory acceptance, these curves have become a descriptive
standard for the li fe characteristics of industrial property. An example of an Iowa
Curve is shown below.
*mo
90rwnnuuucva
a0
70
- - -e5ne§l _ -
Ur- anus
RIUIUIUD
M
mean
%._%W
=n{l~IIlIllll EYE --_-lIImlmlIII=llnlullmill l11--!l m - - l - l__§i1l11II -_ III:EESEE wall!_4H--- ' ~
as 40 46 so 56 GO
2' so
8 5 0
8 on
w
20
10
0 5 ID 15 to 25 10Aqelnye\n
5
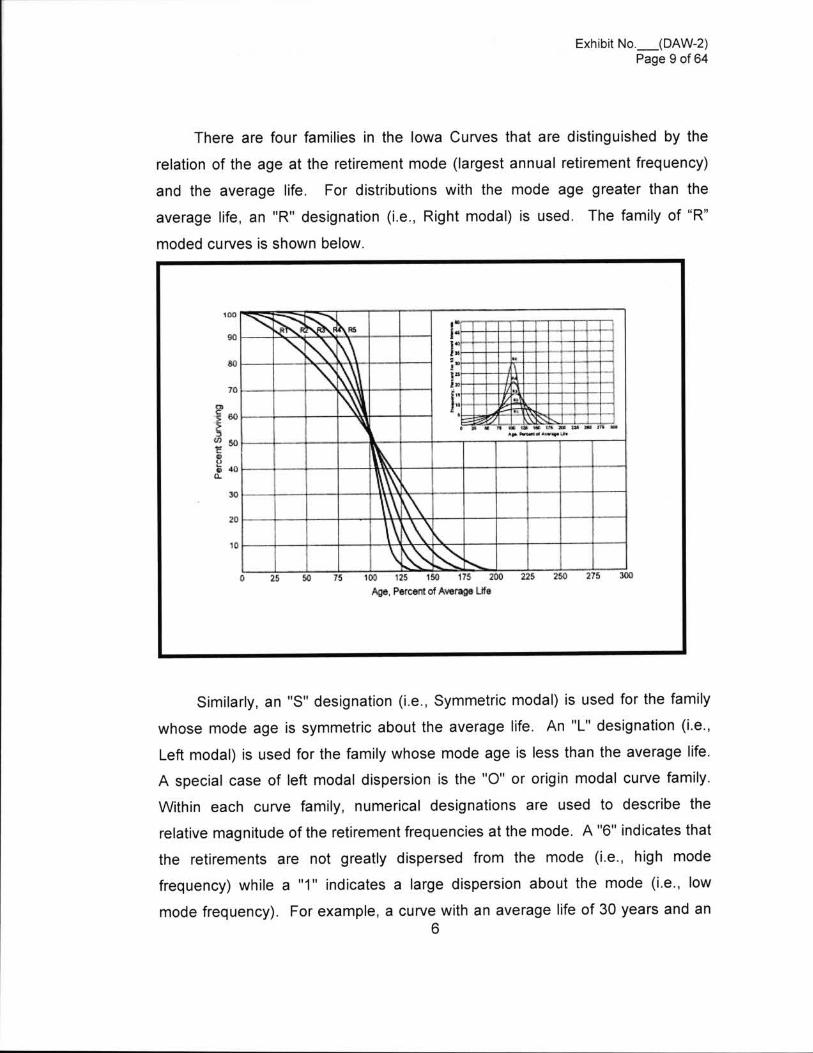
Exhibit No.__(DAW-2)Page 9 of 64
There are four families in the Iowa Curves that are distinguished by the
relation of the age at the retirement mode (largest annual retirement frequency)
and the average life. For distributions with the mode age greater than the
average life, an "R" designation (i.e., Right modal) is used. The family of "R"
coded curves is shown below.
100
90
a0
§ .
Ki1.
k4486°
8,°840
l l- L 'I- .l l l l_--li-1111m1111l11_--_ 11111111111 11111111111n~111111111118811111
so
2D
ID
0 25 50 75 100 125 150 175 200 225 250 275 sao
Ago Percent of Average Lila
ii
Similarly, an "S" designation (i.e., Symmetric modal) is used for the family
whose mode age is symmetric about the average life. An "L" designation (i.e.,
Left modal) is used for the family whose mode age is less than the average life.
A special case of left modal dispersion is the "O" or origin modal curve family.
Within each curve family, numerical designations are used to describe the
relative magnitude of the retirement frequencies at the mode. A "6" indicates that
the retirements are not greatly dispersed from the mode (i.e., high mode
frequency) while a "1" indicates a large dispersion about the mode (i.e., low
mode frequency). For example, a curve with an average life of 30 years and an6
Exhibit No. (DAW-2)Page 10 of 64
"L E " d i s pe r s i o n i s a mo de r a t e ly d i s pe r s e d, le f t mo da l c ur v e t ha t c a n be
designated as a 30 LE Curve. An SQ, or square, survivor curve occurs where no
dispersion is present (i.e., units of common age retire simultaneously).
Most property groups can be closely fi tted to one lowa Curve with a unique
average service li fe. The blending of judgment concerning current condi t ions
a nd f u t ur e t r e nds a lo ng w i t h t he ma t c h i ng o f h i s t o r i c a l da t a pe r mi t s t he
depreciation analyst to make an informed selection of an account's average li fe
and retirement dispersion pattern.
Ac tua r i a l Analysis
illllli
Actuarial analysis (retirement rate method) was used in evaluating historical
asset re t i rement experience where v intage data were avai lable and suf f ic ient
retirement activ i ty was present. In actuarial analysis, interval exposures (total
property subject to retirement at the beginning of the age interval, regardless of
v intage) and age interval ret i rements are calculated. The complement o f the
rat io of interval ret i rements to interval exposures establishes a surv ivor rat io.
The survivor ratio is the fraction of property surviv ing to the end of the selected
age inte rva l, given tha t i t has surv ived to the beginning o f tha t age inte rva l.
Survivor ratios for all of the avai lable age intervals were chained by successive
multiplications to establish a series of survivor factors, collectively known as an
observed li fe table. The observed li fe table shows the experienced morta li ty
characteristic of the account and may be compared to standard mortali ty curves
such as the Iowa Curves. W here data was avai lable, accounts were analyzed
us ing this method. Placement bands were used to i l lus t ra te the compos i te
hi s to ry o v e r a s pe c i f i c e ra , a nd e xpe r i e nc e ba nds we re us e d t o f o c us o n
ret i rement his tory for a ll v intages during a set period. The results f rom these
analyses for those accounts which had data suff ic ient to be analyzed using this
method are shown in the Life Analysis section of this report.
7I
Exhibit No. (DAW-2)Page 11 of 64
Judqment
Any depreciation study requires informed judgment by the analyst
conducting the study. A knowledge of the property being studied, company
policies and procedures, general trends in technology and industry practice, and
a sound basis of understanding depreciation theory are needed to apply this
informed judgment. Judgment was used in areas such as survivor curve
modeling and selection, depreciation method selection, simulated plant record
method analysis, and actuarial analysis.
Judgment is not defined as being used in cases where there are specific,
significant pieces of information that influence the choice of a life or curve.
Those cases would simply be a reflection of specific facts into the analysis.
Where there are multiple factors, activities, actions, property characteristics,
statistical inconsistencies, implications of applying certain curves, property mix in
accounts or a multitude of other considerations that impact the analysis
(potentially in various directions), judgment is used to take all of these factors
and synthesize them into a general direction or understanding of the
characteristics of the property. Individually, no one factor in these cases may
have a substantial impact on the analysis, but overall, may shed light on the
utilization and characteristics of assets. Judgment may also be defined as
deduction, inference, wisdom, common sense, or the ability to make sensible
decisions. There is no single correct result from statistical analysis, hence, there
is no answer absent judgment. At the very least for example, any analysis
requires choosing which bands to place more emphasis.
The establishment of appropriate average service lives and retirement
dispersions for the Distribution and General Plant accounts requires judgment to
incorporate the understanding of the operation of the system with the available
accounting information analyzed using the Retirement Rate actuarial methods.
The appropriateness of lives and curves depends not only on statistical analyses,
but also on how well future retirement patterns will match past retirements.
8

Exhibit No. (DAW-2)Page 12 of 64
Current applicat ions and trends in use of the equipment a lso need to be
fac tored into li fe and surv ivor curve choices in order for appropriate morta li ty
characteristics to be chosen.
Averaqe L i fe Group Deprec ia t ion
Southwest Gas was authorized to use the average li fe group ("ALG") in i ts
exis t ing deprec iat ion rates . At t he r e que s t o f So ut hwe s t Ga s , t h i s s t udy
cont inues to use ALG deprec iat ion procedure to group the assets wi thin each
account. After an average serv ice li fe and dispers ion were selected for each
account, those parameters were used to est imate what port ion of the surv iv ing
investment of each vintage was expected to retire. The depreciation of the group
cont inues unt i l a ll investment in the v intage group is ret i red. ALG groups are
defined by their respective account dispers ion, li fe, and salvage est imates. A
s tra ight- line ra te for each ALG group is ca lcula ted by comput ing a compos i te
remaining li fe for each group across a ll v intages wi thin the group, div iding the
remaining inves tment to be recovered by the remaining li fe to f ind the annual
deprec ia t i on expens e and di v i di ng the annua l deprec ia t i on expens e by the
surv iv ing investment. The resultant ra te fo r each ALG group i s des igned to
recover a ll re t i rements less net sa lvage when the las t uni t re t i res . The ALG
procedure recovers net book cos t over the li fe o f each account by averaging
many components.l
l
l
l
lll
l
l
l
l
l
g
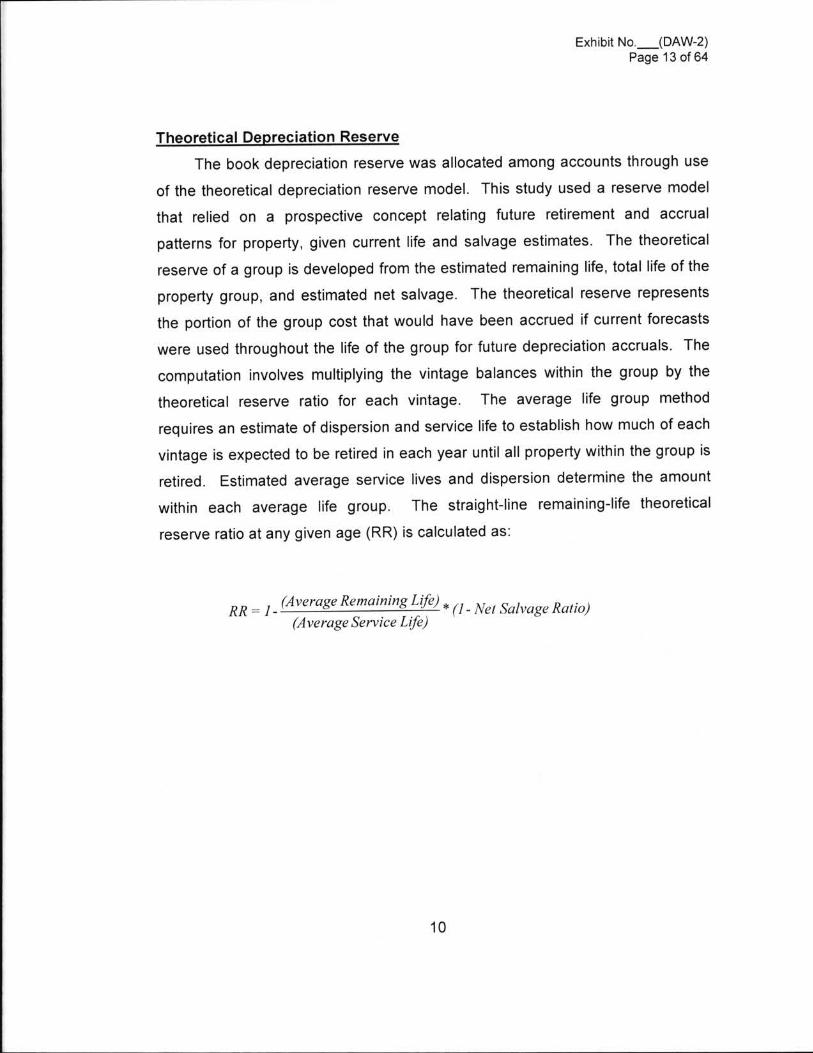
Exhibit No. (DAW-2)Page 13 of 64
Theoretical Depreciation Reserve
The book depreciation reserve was allocated among accounts through use
of the theoretical depreciat ion reserve model. This study used a reserve model
tha t re l i ed on a pros pec t i v e c onc ept re la t i ng future re t i rement and ac c rua l
patterns for property, given current li fe and salvage estimates. The theoretical
reserve of a group is developed from the estimated remaining li fe, total li fe of the
property group, and est imated net salvage. The theoret ical reserve represents
the port ion of the group cost that would have been accrued i f current forecasts
were used throughout the li fe of the group for future depreciat ion accruals. The
computat ion invo lves mult iply ing the v intage balances wi thin the group by the
theoret ica l reserve ra t io for each v intage. The a v e ra ge l i f e gro up me tho d
requires an estimate of dispersion and service li fe to establish how much of each
vintage is expected to be retired in each year unti l all property within the group is
retired. Est imated average serv ice lives and dispers ion determine the amount
wi thi n eac h av e rage l i f e group. The s tra ight- line remaining-li fe theoret ica l
reserve ratio at any given age (RR) is calculated as:
R R = 1 -A R . . L .r verage emarnrng re) *(1-n@/ Salvage Ratio)
(A verge Service LM2)
10
Exhibit No. (DAW-2)Page 14 of 64
lDETAILED DISCUSSION
Depreciation Study Processl
where the initial data analysis occurred.
This depreciation study encompassed four distinct phases. The first
phase involved data collection and field interviews. The second phase was
The third phase was where the
information and analysis was evaluated. Once the first three stages were
complete, the fourth phase began. This phase involved the calculation of
deprecation rates and the documenting the corresponding recommendations.
During the Phase I data collection process, historical data was compiled
from continuing property records and general ledger systems. Data was
validated for accuracy by extracting and comparing to multiple financial system
sources. Audit of this data was validated against historical data from prior
periods, historical general ledger sources, and field personnel discussions. This
data was reviewed extensively to put in the proper format for a depreciation
study. Further discussion on data review and adjustment is found in the Salvage
Considerations Section of this study. Also as part of the Phase I data collection
process, numerous discussions were conducted with engineers and field
operations personnel to obtain information that would assist in formulating life
and salvage recommendations in this study. One of the most important elements
of performing a proper depreciation study is to understand how the Company
utilizes assets and the environment of those assets. Interviews with engineering
llII!Ii
and operations personnel are important ways to allow the analyst to obtain
information that is beneficial when evaluating the output from the life and net
salvage programs in relation to the Company's actual asset utilization and
environment. Information that was gleaned in these discussions is found both in
the Detailed Discussion of this study in the life analysis and salvage analysis
sections and also in workpapers.
11

l
Exhibit No. (DAW-2)Page 15 of 64
Phase 2 and 3
characteristics.
Phase 2 is where the actuarial analysis is performed.
overlap to a significant degree. The detailed property records information is used
in phase 2 to develop observed life tables for life analysis. These tables are
visually compared to industry standard tables to determine historical life
It is possible that the analyst would cycle back to this phase
based on the evaluation process performed in phase 3. Net salvage analysis
consists of compiling historical salvage and removal data by functional group to
determine values and trends in gross salvage and removal cost This information
Depreciation Systemsz
was then carried forward into phase 3 for the evaluation process.
Phase 3 is the evaluation process which synthesizes analysis, interviews,
and operational characteristics into a final selection of asset lives and net
salvage parameters. The historical analysis from phase 2 is further enhanced by
the incorporation of recent or future changes in the characteristics or operations
of assets that were revealed in phase 1. Phases 2 and 3 allow the depreciation
analyst to validate the asset characteristics as seen in the accounting
transactions with actual Company operational experience.
Finally, Phase 4 involved the calculation of accrual rates, making
recommendations and documenting the conclusions in a final report. The
calculation of accrual rates is found in Appendix A. Recommendations for the
various accounts are contained within the Detailed Discussion of this report. The
depreciation study flow diagram shown as Figure 11 documents the steps used in
conducting this study. page 289 documents the same
basic processes in performing a depreciation study which are: Statistical
analysis, evaluation of statistical analysis, discussions with management,
forecast assumptions, and document recommendations.
'Introduction to Depreciation for Public Utilities 81 Other Industries, AGA EEl 20132 Depreciation Svstems, by W. C. Fitch and F.K.Wolf, Iowa State Press 1994 page 289.
12
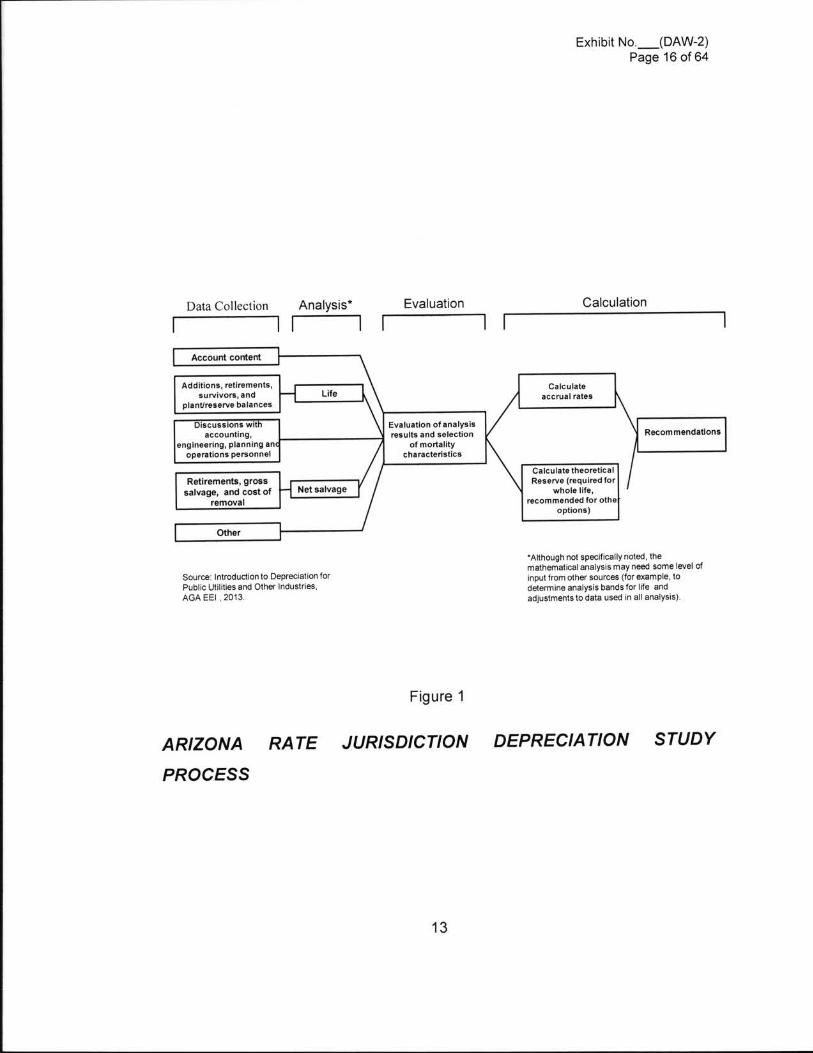
Exhibit No. (DAW-2)Page 16 of 64
CalculationEvaluation
IIData Collection Analysis*
I I I IAccount content
LifeCalculate
accrual ratesAdditions retirements
survivors andplant/resewe balances
Recommendationso
Evaluation otanalysisresults and selection
of moralitycharacteristics
Discussions withaccounting
engineering planning anoperations personnel
Net salvageRetlrements gross
salvage and cost ofremoval
Calculate theoreticalReserve (required for
whole liferecommended for Ethe
options)
Source: Introduction to Depreciation forPublic Utilities and Other IndustriesAGA EEl 2013.
Although not specifically noted themathematical analysis may need some level ofinput loom other sources (for example todetermine analysis bands for life andadjustments to data used in all analysis).
Figure 1
STUDYDEPRECIA TIONJURISDICTIONRA TEARIZONA
PROCESS
13

Exhibit No. (DAW-2)Page 17 of 64
De recitation Rate Calculation
Annual depreciation expense amounts for the depreciable accounts of -the
Arizona Rate Jurisdiction were calculated by the straight line, average li fe group,
and remaining li fe procedure.
In a whole life representation, the annual accrual rate is computed by the
following equation,
AnnualA ccrualRare(l 00% - NeISa1vagePercent)
AverageServiceLw
Use of the remaining life depreciation system adds a self-correcting
mechanism, which accounts for any differences between theoretical and book
depreciation reserve over the remaining life of the group. With the straight line,
remaining li fe, average life group system using Iowa Curves, composite
remaining lives were calculated according to standard broad group expectancy
techniques, noted in the formula below:
Composite Re mainingLy'eZ ()riginalCost - Theoretical Re serve
Z WholeLwAnnualA ccruol
AnnualDepreciaIionExpense =
For each plant account, the difference between the surviving investment,
adjusted for estimated net salvage, and the allocated book depreciation reserve,
was divided by the composite remaining life to yield the annual depreciation
expense as noted in this equation.
OriginalCos1 - Book Re .verve - (Origina1Cost) * (I - NetSa1vage%)
Composite Re mainingL
where the Net Salvage% represents future net salvage.
14

Exhibit n<>._(oAw-2)Page 18 of 64
Within a group, the sum of the group annual depreciation expense
amounts, as a percentage of the depreciable original cost investment summed,
gives the annual depreciation rate as shown below:
Z Annua1DeprecialionExpenseAnnualDepreciationRale =
Z OriginalCos1
These calculations are shown in Appendix A. The calculations of the
theoretical depreciation reserve values and the corresponding remaining life
calculations are shown in workpapers. Book depreciation reserves were
reallocated from individual accounts based on the theoretical reserve
computations. Theoretical reserve computations were also used to compute a
composite remaining life for each account.
Remaininq Life Calculation
The establishment of appropriate average service lives and retirement
dispersions for each account within a functional group was based on engineering
judgment that incorporated available accounting information analyzed using the
Retirement Rate actuarial methods. After establishment of appropriate average
service lives and retirement dispersion, remaining life was computed for each
account. Theoretical depreciation reserve with zero net salvage was calculated
using theoretical reserve ratios as defined in the theoretical reserve portion of the
General Discussion section. The dif ference between plant balance and
theoretical reserve was then spread over the ALG depreciation accruals.
Remaining life computations are found for each account in Appendix B.
Life Analysis
The retirement rate actuarial analysis method was applied to all accounts
for -the Arizona Rate Jurisdiction. For each account, an actuarial retirement rate
analysis was made with placement and experience bands of varying width. The
histor ical observed life table was plotted and compared with var ious lowa
Survivor Curves to obtain the most appropriate match. A selected curve for each
15

Exhibit NO. (DAW-2)Page 19 of 64
account is shown in the Life Analysis Section of this report. The observed life
tables for all analyzed placement and experience bands are provided in
workpapers.
For each account on the overall band (i.e. placement from earliest vintage
year which varied for each account through 2015), approved survivor curves
were used as a starting point. Then using the same average life, various
dispersion curves were plotted. Frequently, visual matching would confirm one
specific dispersion pattern (i.e. L, S. or R) as an obviously better match than
others. The next step would be to determine the most appropriate life using that
dispersion pattern. Then, after looking at the overall experience band, different
experience bands were plotted and analyzed: in increments of approximately ten
years, for instance 1986-2015, 1996-2015, 2006-2015, etc. Next placement
bands of varying width were plotted with each experience band discussed above.
Repeated matching usually pointed to a focus on one dispersion family and small
range of service lives. The goal of visual matching was to minimize the
differential between the observed life table and lowa curve in top and mid-range
of the plots. These results are used in conjunction with all other factors that may
influence asset lives.
i
16
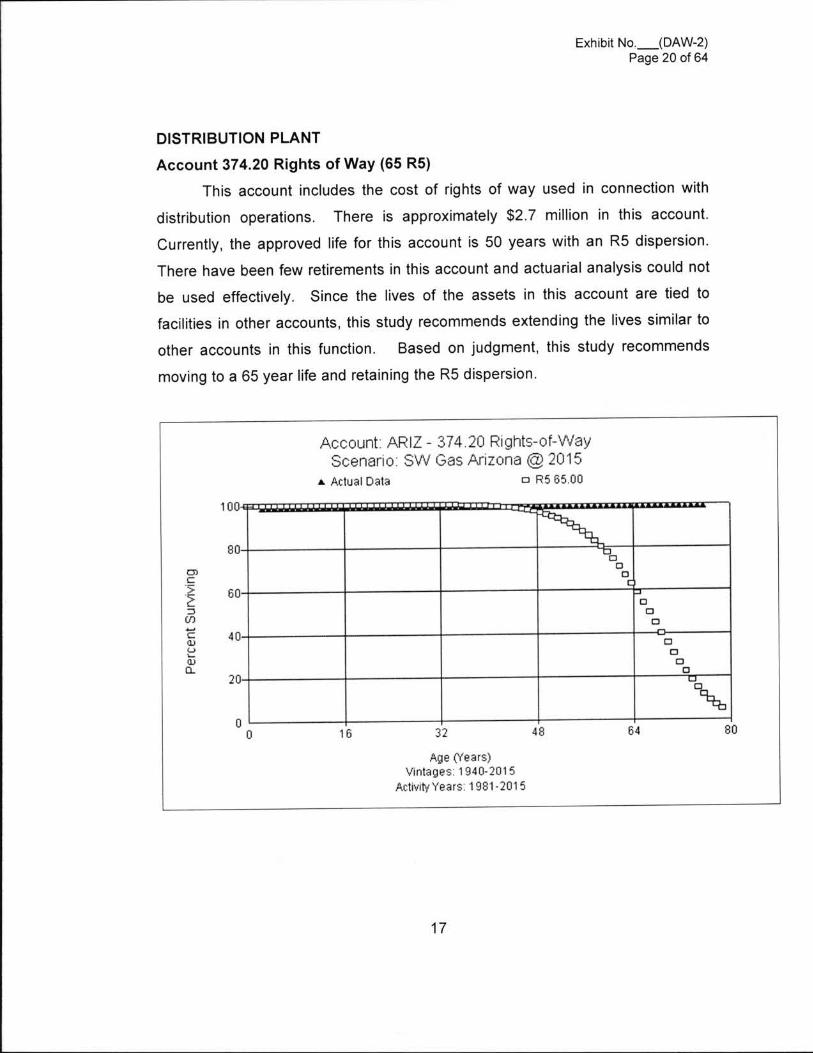
Exhibit No. (DAW-2)Page 20 of 64
DISTRIBUTION PLANT
Account 374.20 Rights of W ay (65 R5)
Since the li ves o f the assets in this account are t ied to
This account inc ludes the cost of r ights of way used in connect ion wi th
distribution operations. There i s approximate ly $2 .7 mi ll i on in thi s account .
Current ly , the approved li fe for this account is 50 years wi th an R5 dispers ion.
There have been few retirements in this account and actuarial analysis could not
be used effectively.
faci li t ies in other accounts, this study recommends extending the lives similar to
other accounts in this funct ion. Based on judgment , this s tudy recommends
moving to a 65 year life and retaining the R5 dispersion.
Accounts ARIZ - 374.20 Rights-of-wayScenarios so Gas Arizona @ 2015
A Actual Data a RE 65.00
100
80
60
40 DDoD
mc
s3cm4 - 4
CGJL )uG)O.
20
°°b
..*
_ - - -8064483216
00
Age (Years)Vintages: 19402015
Activity Years; 19812015
17
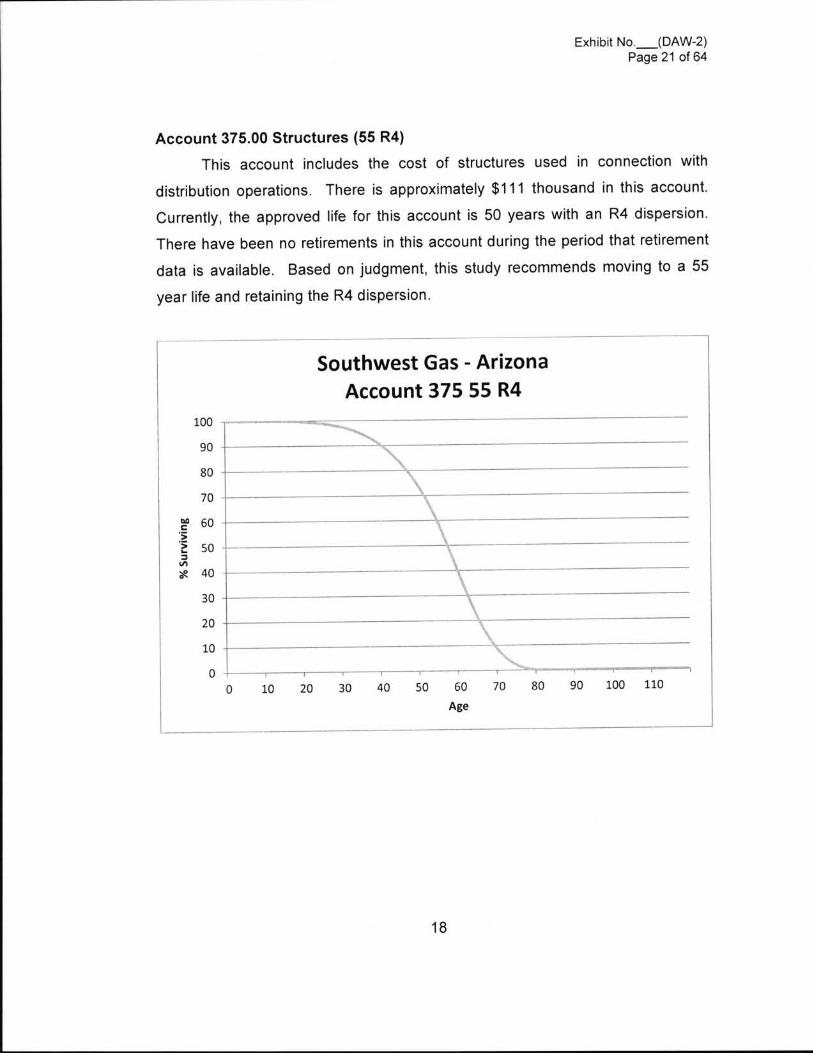
l
Exhibit No. (DAW-2)Page 21 of 64
Account 375.00 Structures (55 R4)
This account includes the cost of structures used in connection with
distribution operations. There is approximately $111 thousand in this account.
Currently, the approved life for this account is 50 years with an R4 dispersion.
There have been no retirements in this account during the period that retirement
data is available. Based on judgment, this study recommends moving to a 55
year life and retaining the R4 dispersion.
Southwest Gas - ArizonaAccount 375 55 R4
50
._
_100 1109080705040302010
100
90
80
70
60>E3mah 40 .
30
20
10
0
0 60
Age
18

l
l
I
:
iExhibit No. (DAW2)
Page 22 of 64li
ll
Account 376.00 Distribution Mains (53 R1.5)
illi
l
This account includes the cost of all types and various sizes of mains,
valves and other related equipment used in connection with distribution
operations. The mains could be made of steel, plastic, or PVC. There is
approximately $1.7 billion in this account. Currently, the approved life for this
account is 45 years with an R4 dispersion. The Company initiated early vintage
plastic replacement program which is a 20 year program and will end by 2026.
About 440 miles of PVC is still on the system. The Company is starting PVC
replacements and will complete by 2026. PVC was installed from 1965-1974 and
now the PVC solvent is breaking down and fittings leaking. The Company is
proposing to accelerate the replacement of pre-1970s vintage steel in the
testimony of Company witness Kevin Lang. Many of the acquired facilities were
not protected. The oldest operating steel is 1934 or 1935 vintage, but most of
the steel is in vintages in the 1950s and 1960s. The distribution pipeline
integrity program was a leak driven program. Some larger pipe (operated as
transmission) is having seam issues and 15-20 miles has been replaced.
Capacity needs can also cause replacement of assets. Based on the consistent
curve and life indications across the bands analyzed and the excellent fits (see
below) along with information from Company personnel, this study recommends
moving slightly from the approved 45 year life to a 53 year life and from an R4
dispersion to an R1.5 dispersion. An observed life table is graphed for this
account below.
19
ii
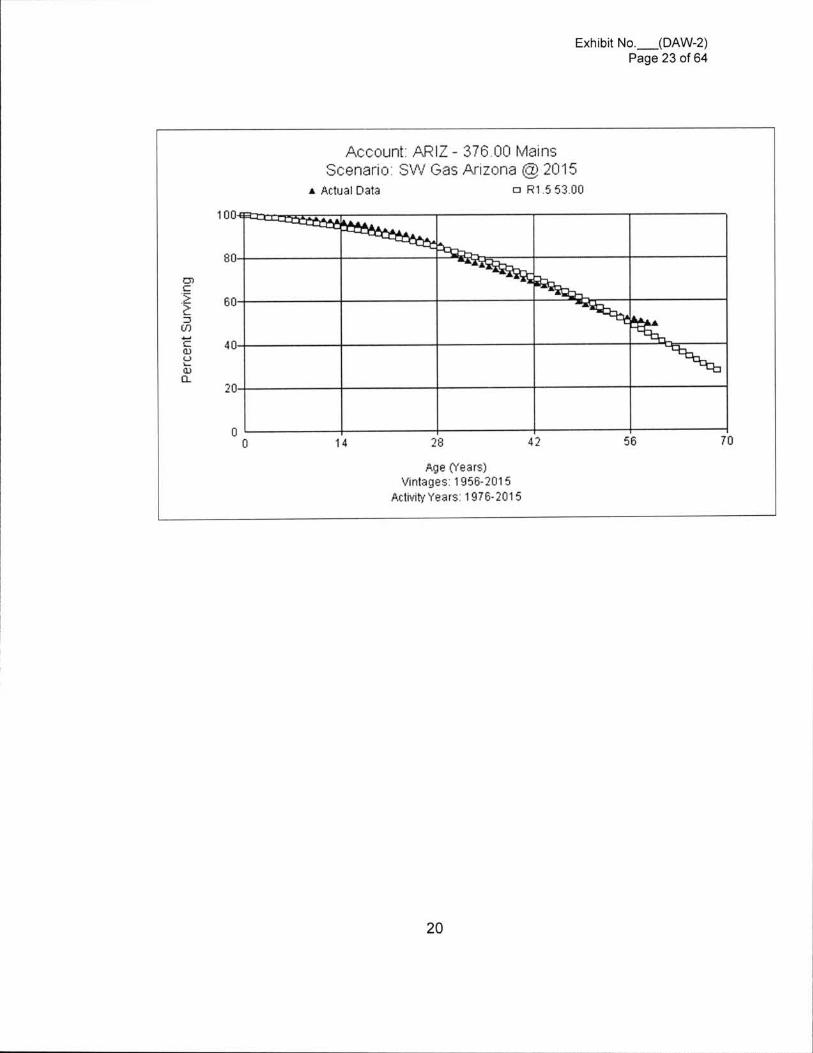
Exhibit No. (DAW-2)Page 23 of 64
Account: ARIZ - 376.00 MainsScenario; SW Gas Arizona @ 2015
A Actual Data oz R15 53.00.___ ----- '. ':;go
i
" " " ; :___
iQEZ3(D
705614
100
80
G)C
50
*3 40
8G.)O.
20
00 4228
Age (Years)Vintages: 19562015
Activity Years: 1976-2015
K!
Exhibit No. (DAW-2)Page 24 of 64
Account 378.00 Measuring and Regulating Station Equipment (33 L0.5)
i
I
This account consists of costs associated with tap assemblies, regulator
stations, meters, ball valves, filter separator, vaults, and other equipment used in
distribution measuring and regulating operations. There is approximately $75
million of investment in this account. The currently approved curve for this
account is the 50 R4. Company personnel report that many measuring and
regulating district regulator stations did not have adequate documentation and/or
did not meet current standards. Most district regulator stations have been
replaced in the last 15 years associated with other projects. Many stations were
replaced during the HP steel replacement program. Company personnel also
report that when district regulator stations were installed, generally they were
placed close to roads and corners. Now some stations have had to be relocated
earlier than physically necessary due to munic ipal improvements. Some
upgrades to city Gates have occurred but there have been but no replacements
of the full Gates. Based upon the analysis indications and discussions with
Company personnel indicating Company is proactively replacing or moving
stations where issues are present, this study recommends moving to a 33 year
life and L0.5 dispersion for this account. An observed life table is graphed for
this account below.
Il
|
I
21
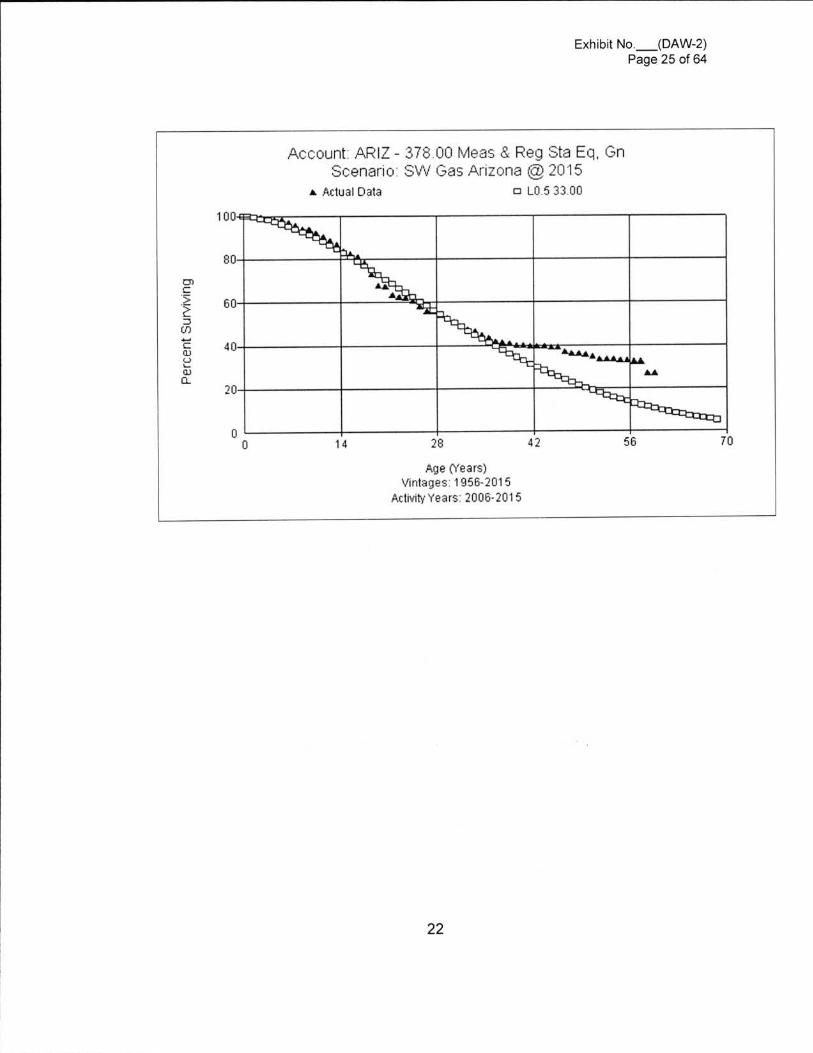
Exhibit No. (DAW-2)Page 25 of 64
Account; ARIZ - 378.00 Meas 8< Reg Sta Et. GrScenarios SW Gas Arizona @ 2015
A D L0.5 33.00Actual Data
-
6 0 _I I_
4 -CQ)u;GJ
a
1
W\'-gg;- - - ' I l1
7056
100
80
mC12a3w
40
20
00 14 4228
Age (Years)Vintages; 1956.2016
Activity years: 2006201 s
II 22

IExhibit No. (DAW-2)
Page 26 of 64
Account 380.00 Services (44 L1.5)
Company personnel, this study recommends a 44 year life while moving to a
L1.5 dispersion for this account. An observed life table is graphed for this
This account consists of services used in distribution operations. The
material could be plastic, steel, or plc. There is approximately $836 million of
investment in this account. The currently approved curve for this account is the
42 LO. The Company is making replacement of isolated steel services a higher
priority than other assets. The Company is also abandoning inactive facilities
(services and stubs). Company personnel think the life of services will be shorter
than Account 376, Mains. Based on actuarial analysis, judgment, and input from
account below.
Account; ARIZ - 380.00 ServicesScenario: SW Gas Arizona @ 2015
A Actual Data U L1.5 44.00
100 _» QQQQQDDD0666
in80
m 609960
Do:: loan
40
: iU )4 -CQ.)u;GJQ .
20
50403020100
0
Age (Years)Vintages; 19762015
Activity Years; 19762015
23
lll
i.

Exhibit No. (DAW-2)Page 27 of 64
Account 381 .00 Meters (30 S0.5)
This account inc ludes the cost of meters used in measur ing gas to
customers. There is approximately $293 million in plant in this account. The
currently approved life is 48 years with an R1.5 dispersion. The company is
experiencing a shorter life for its meters than experienced in the past. Based on
the majority of the bands analyzed, discussions with Company personnel, and
the visual matching across many bands the 30 S0.5 curve is the best fit over all
bands and is the study recommendation for this account. An observed life table
is graphed for this account.
Account; ARIZ - 381 .00 MetersScenario : SW Gas Arizona @ 2015
A Actual Data o S0.5 30.00
i;:.
100
80
60
l
ll
ls
l_
i
l
mC
s3cmA-4Cmu0)Q.
40
20
l l - . . -
t n - -
70564214 280
0
Age (Years)
Vintages: 19562015
Activity years: 19952015
24
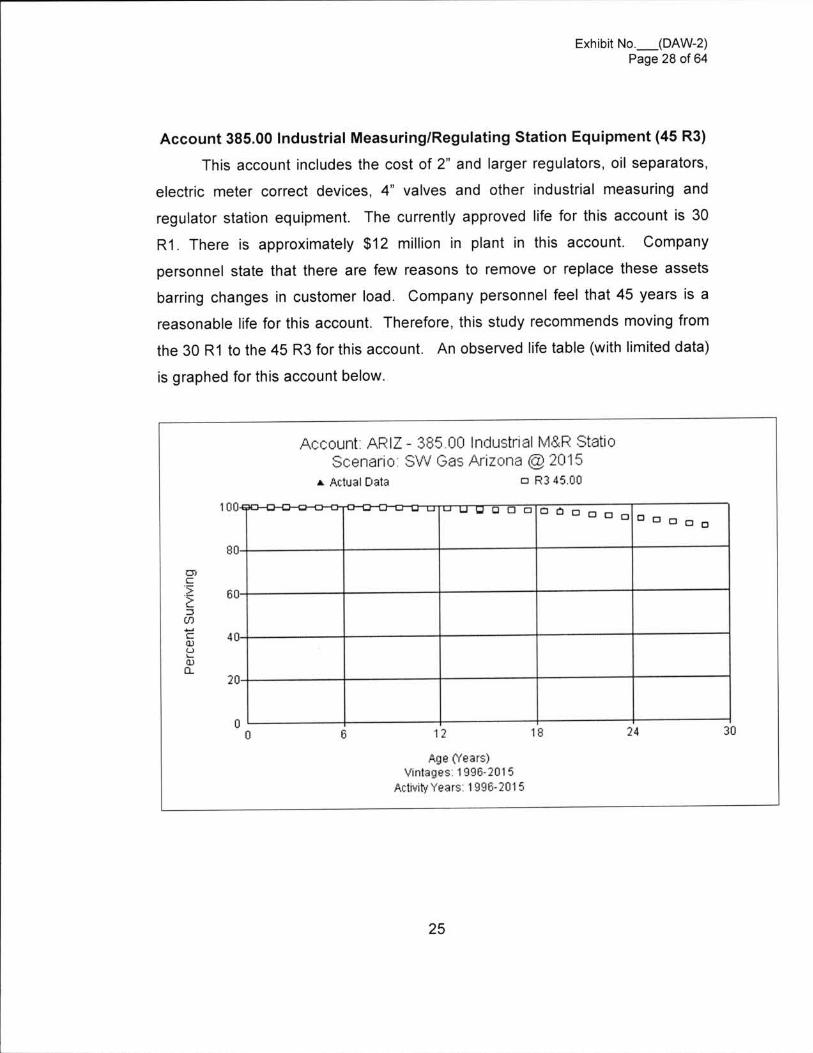
Exhibit No. (DAW-2)Page 28 of 64
Account 385.00 Industrial Measuring/Regulating Station Equipment (45 R3)
This account includes the cost of 2" and larger regulators, oil separators,
electric meter correct devices, 4" valves and other industrial measuring and
regulator station equipment. The currently approved life for this account is 30
RE. There is approximately $12 million in plant in this account. Company
personnel state that there are few reasons to remove or replace these assets
barring changes in customer load. Company personnel feel that 45 years is a
reasonable life for this account. Therefore, this study recommends moving from
the 30 RE to the 45 RE for this account. An observed life table (with limited data)
is graphed for this account below.
ll1
l
100 1l
Account: ARIZ - 385.00 Industrial M8<R StatioScenarios SW Gas Arizona @ 2015
A Actual Data a RE 45.00
a a o D D U D cs Q G Dl
80 l
l
ll
50
mC.Zz3m
ll4 1CGJu0)D.
40
20
3024181250
0
Age (Years)Vintages; 19962015
Activity years; 19962015
25

Exhibit No. (DAW-2)Page 29 of 64
GENERAL PLANT DEPRECIATED
Account 390.10 Structures - Owned (42 Re)
This account includes the cost of office and warehouses, parking lots,
HVAC, control systems, security systems and other general structures and
improvements used to support utility service. There is approximately $50.1
million in this account. The current life for this account is a 45 RE. The building
in Tempe and several other buildings were not in the data in the 1988 study.
Several smaller buildings were retired since that point and a number of smaller
replacements of components (e.g. replaced gas chillers - retired 2014, Tucson,
HVAC replacement, lighting replacement) have occurred. Some roofing
replacement starting in 2016. Company personnel feel that 42 years is a
reasonable for this account. Based actuarial analysis, opinions of company
personnel, and judgment, this study recommends moving to a 42 RE at this
time.
Accounts ARIZ - 390.10 Structures & ImprovedScenario; SW Gas Arizona @ 2015
A Actual Data D RE 42.00
100 00DD 3AA DoA 444 A;QQQQgDD
80
60
mC.>_a3
cm
DDLA UAAQQ
DD
DD
a40
4-4CCDQL.(DQ.
20
50403020100
0
Age (Years)Vintages: 19142015
Activity Years: 1976201 s
26
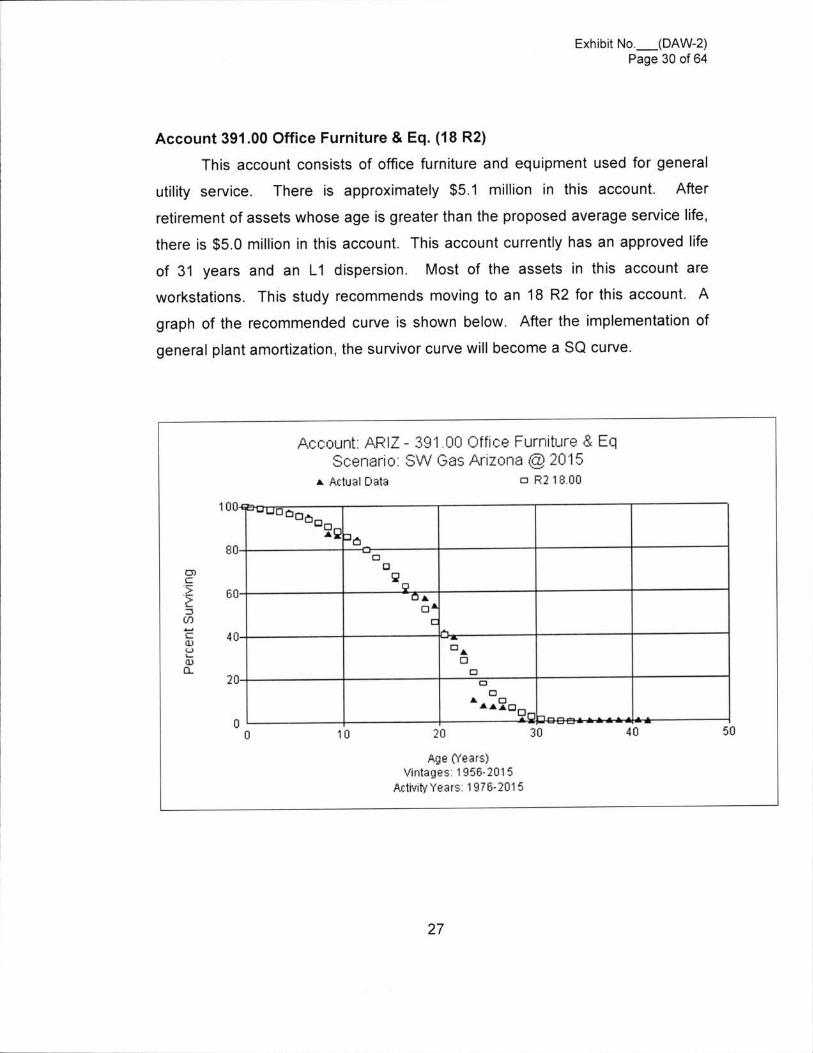
I Exhibit No. (DAW-2)Page 30 of 64
Account 391.00 Office Furniture & Eq. (18 R2)
This account consists of office furniture and equipment used for general
utility service. There is approximately $5.1 million in this account. After
retirement of assets whose age is greater than the proposed average service life,
there is $5.0 million in this account. This account currently has an approved life
of 31 years and an LI dispers ion. Most of the assets in this account are
workstations. This study recommends moving to an 18 R2 for this account. A
graph of the recommended curve is shown below. After the implementation of
general plant amortization, the survivor curve will become a SQ curve.
Account: ARIZ - 391 .00 Office Furniture 8 EqScenario: SW Gas Arizona @ 2015
A Actual Data o RE 18.00
AQ
orc
3cm
100
80
60
40
DA DD
A A Q' D
5040302010
'EG.)emO.
20
00I
I
III
.
.
Age (Years)Vintages: 1956201 5
Activity Years; 19762015
27
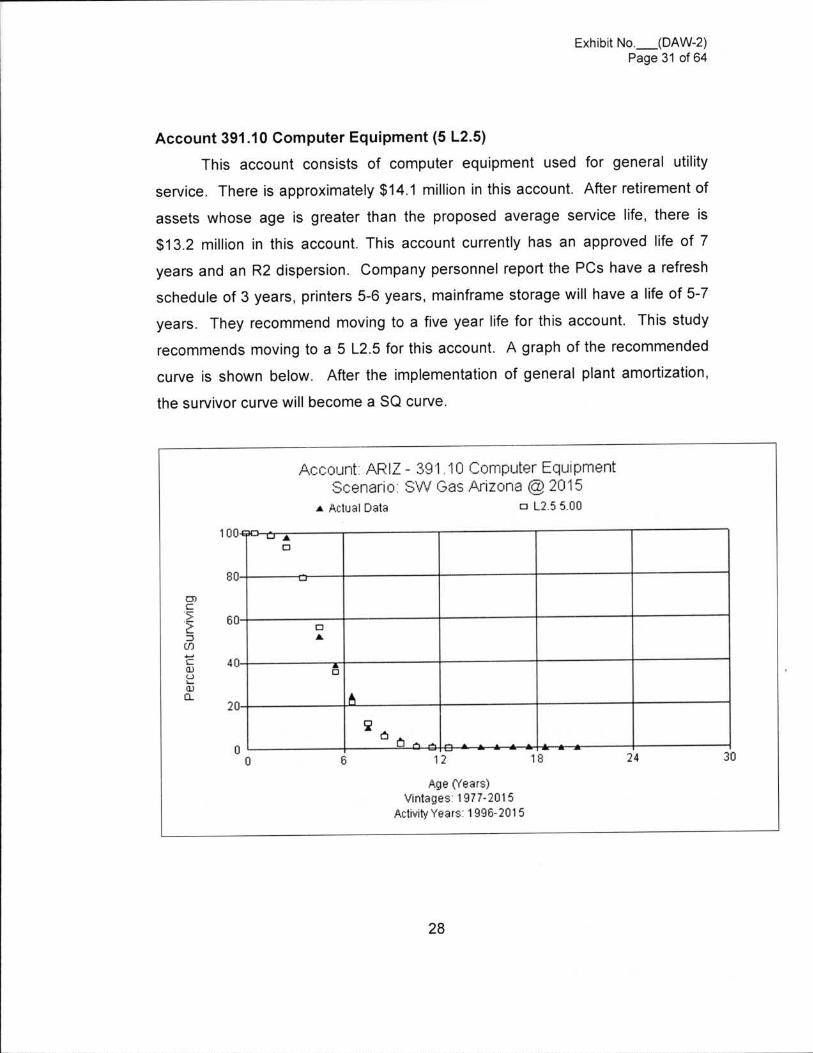
Exhibit no._(DAw~2)Page 31 of 64
Account 391 .10 Computer Equipment (5 L2.5)
l
Wl1llll
l
il
llili
l
W
This account consists of computer equipment used for general utility
service. There is approximately $14.1 million in this account. After retirement of
assets whose age is greater than the proposed average service life, there is
$13.2 million in this account. This account currently has an approved life of 7
years and an RE dispersion. Company personnel report the PCs have a refresh
schedule of 3 years, printers 5-6 years, mainframe storage will have a life of 5-7
years. They recommend moving to a five year life for this account. This study
recommends moving to a 5 L2.5 for this account. A graph of the recommended
curve is shown below. After the implementation of general plant amortization,
the survivor curve will become a SQ curve.
Accounts ARIZ - 391 .10 Computer EquipmentScenario: SW Gas Arizona @ 2015
A Actual Data 1:1 L2.s 5.00
100
80
60
cm
8
3U)
40
1
A-Icmu
0.)a
20
3024181260
0
Age (Years)vintages 19772015
Activitvyears: 1996201 s
9l
9
28

Exhibit No. (DAW-2)Page 32 of 64
Account 392.11 Transportation Equipment - Light (8 L2.5)
This account consists of light transportation equipment used for general
utility service. There is approximately $22 million in this account. After
retirement of assets whose age is greater than the proposed average service life,
there is $19.5 million in this account. This account currently has an approved life
of 8 LE. Company personnel report that light vehicles are normally retired at 8
years or 80K miles. At times, they retire assets based on mileage which may
work out to 5 or 6 years. The higher mileage vehicles are generally used in the
customer service function. Based on life analysis and opinions of Company
personnel, this study recommends moving to an 8 L2.5 for this account. A graph
of the recommended curve is shown below. After the implementation of general
plant amortization, the survivor curve will become a SQ curve.
Account: ARIZ - 392.11 Transportation EquipScenario: aw Gas Arizona @ 2015
A Actual Data cm L2.5 8.00
100
80
60
COC.>23U)
404-4Cmu
G JQ .
20
201612840
0
Age (Years)Vintagesi 2006-2015
Activitvyears; 2006201 s
29

Exhibit No. (DAW-2)Page 33 of 64
Account 392.12 Transportation Equipment- Heavy (12 L3)
This account consists of heavy transportation equipment used for general
utility service. There is approximately $14.9 million in this account. After
retirement of assets whose age is greater than the proposed average service life,
there is $13.6 million in this account. This account currently has an approved life
of 8 L2. Company personnel state that most of the heavy trucks are diesels
which are generally operated for 12 years or 120K miles. Company personnel
state that these assets usually retire around the 12 years or slightly shorter.
Light vehicles are being sold at a shorter life and are well maintained. This study
recommends moving to a 12 LE for this account. A graph of the proposed curve
is shown below. After the implementation of general plant amortization, the
survivor curve will become a SQ curve.
l
l
l
l
30

Exhibit No. (DAW-2)Page 34 of 64
Account: ARIZ - 392.12 Transl Equip, HeavyScenario: SW Gas Arizona @ 2015
A Actual Data D LE 12.00
m
3U )4 4cG Jus ..G.)
O .
306 18
100
80
60
40
20
00 12 24
Age (Years)Vintages; 1985.201 5
Activity years: 19962015
31
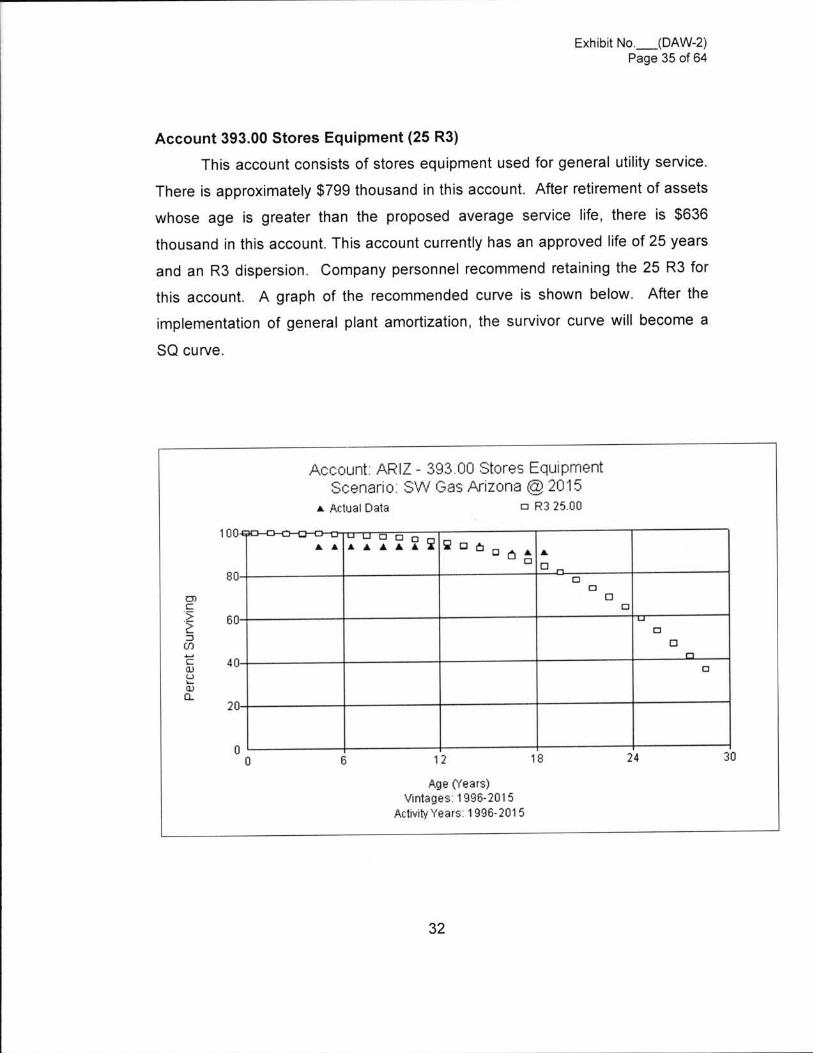
Exhibit No. (DAW-2)Page 35 of 64
Account 393.00 Stores Equipment (25 RE)
This account consists of stores equipment used for general utility service.
There is approximately $799 thousand in this account. After retirement of assets
whose age is greater than the proposed average service life, there is $636
thousand in this account. This account currently has an approved rife of 25 years
and an RE dispersion. Company personnel recommend retaining the 25 RE for
this account. A graph of the recommended curve is shown below. After the
implementation of general plant amortization, the survivor curve will become a
SQ curve.
Account: ARIZ - 393.00 Stores EquipmentScenario: aw Gas Arizona @ 2015
A Actual Data D RE 25.00
100 D Q DA A A A A 9 9 cl cl cl CJ 6
80 DD
UD
60
40
U)
3U)A-C(DuG)G.
20
3024181260
0
Age (Years)Vintages: 19962015
Activity Years; 1996201 s
32

Exhibit No. (DAW-2)Page 36 of 64
Account 394.00 Tools, Shop & Garage (15 R1.5)
This account consists of tools, shop and garage equipment used for
general utility service. There is approximately $9.6 million in this account. After
retirement of assets whose age is greater than the proposed average service life,
there is $8.3 million in this account. This account currently has an approved life
of 33 years and an RE dispersion. Company personnel state that the tools in this
account have an array of dif ferent lives: tools like gas detection equipment,
fus ion equipment etc . wi ll have a fa ir ly shor t li fe of around 10-15 years ,
electrofusion 10 years, butt fusion 15-20 years, gas detection equipment 5-10
years, and pipe locators 10-15 years. Other equipment like boring equipment will
have a long life, portable air compressors are estimated at 5 years, and welding
equipment is estimated at 10-15 years. Company personnel recommend moving
to a 15 year life. This study recommends moving to a 15 R1 .5 for this account. A
graph of the recommended curve is shown below. After the implementation of
general plant amortization, the survivor curve will become a SQ curve.
33
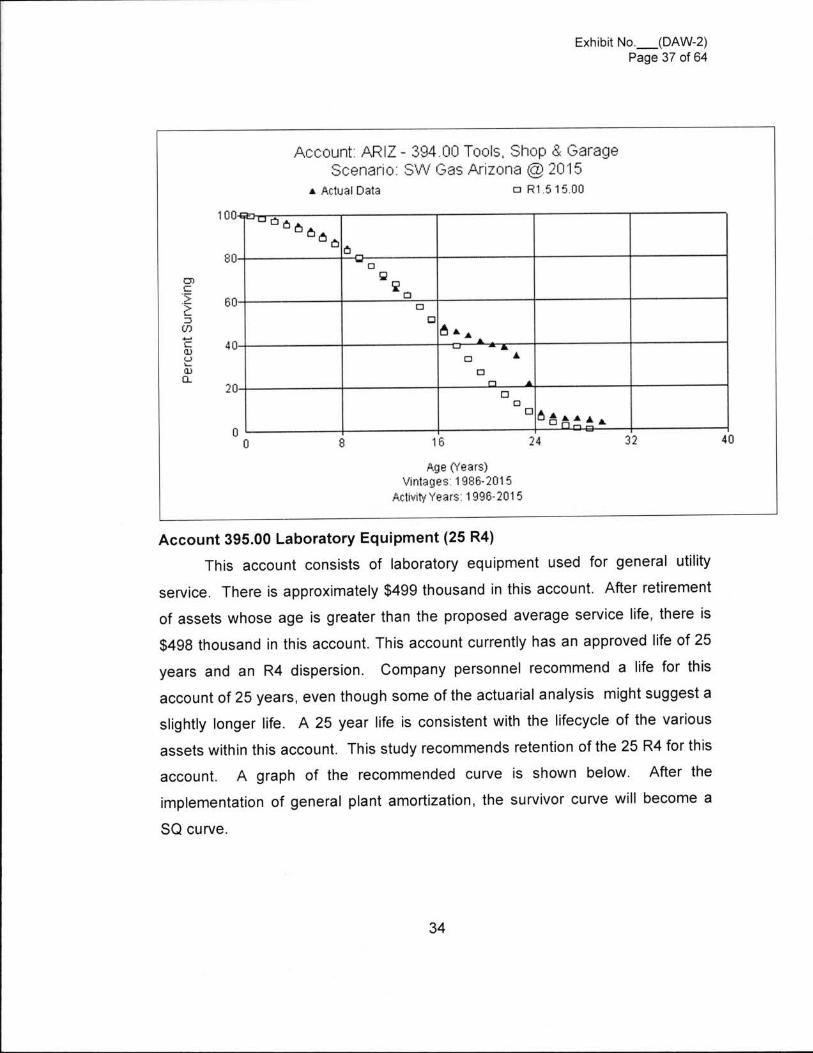
Exhibit NO. (DAW-2)Page 37 of 64
Account; ARIZ - 394.00 Tools Shop 8< GarageScenario: SW Gas Arizona @ 2015
A Actual Data D R1.515.U0
100 Dao¢¢
O80
UQ
QD
60
onC.Za3cm
404-0c(Du1..0.)Q.
20
4032241680
0
Age (Years)Vintages; 19852015
Activity years: 19952015
Account 395.00 Laboratory Equipment (25 R4)
This account consists of laboratory equipment used for general utility
service. There is approximately $499 thousand in this account. After retirement
of assets whose age is greater than the proposed average service life, there is
$498 thousand in this account. This account currently has an approved life of 25
years and an RE dispersion. Company personnel recommend a life for this
account of 25 years, even though some of the actuarial analysis might suggest a
slightly longer life. A 25 year life is consistent with the lifecycle of the various
assets within this account. This study recommends retention of the 25 R4 for this
account. A graph of the recommended curve is shown below. After the
implementation of general plant amortization, the survivor curve will become a
SQ curve.
34
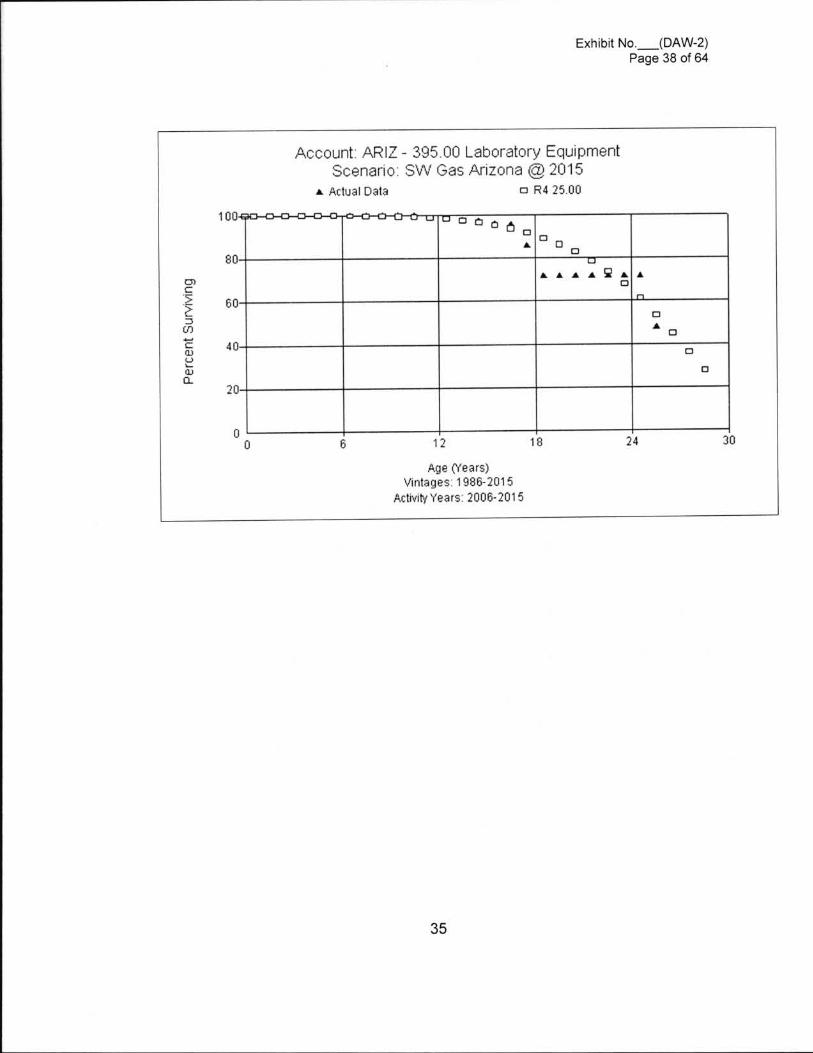
Exhibit No. (DAW-2)Page 38 of 64
Aooounti ARIZ - 395.00 Laboratory EquipmentScenario: SW Gas Arizona @ 2015
A Actual Data U RE 25.00
a O O lg, D
A
mc15a3w4 -cGJu
G JO .
6 1812
100
80
60
40
20
0 0 30
Age (Years)Vintages; 19862015
Activity years: 20062015
24
35
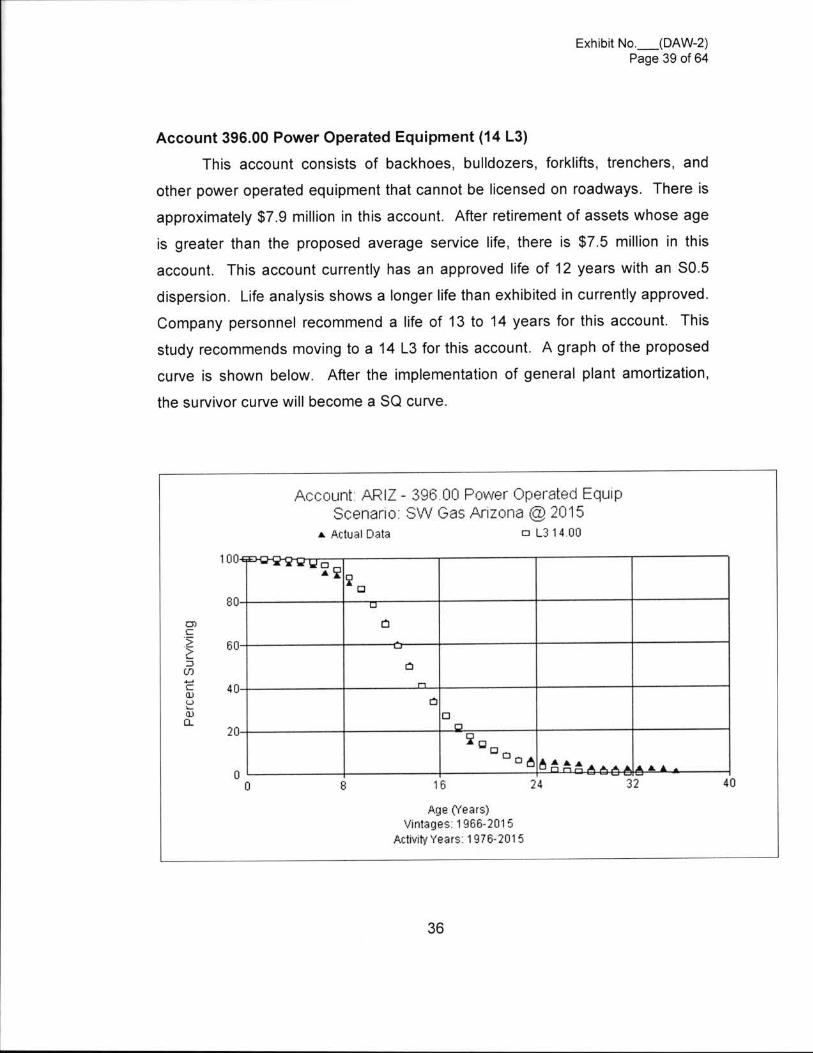
Exhibit No. (DAW-2)Page 39 of 64
Account 396.00 Power Operated Equipment (14 L3)
This account consists of backhoes, bulldozers, forklifts, trenchers, and
other power operated equipment that cannot be licensed on roadways. There is
approximately $7.9 million in this account. After retirement of assets whose age
is greater than the proposed average service life, there is $7.5 million in this
account. This account currently has an approved life of 12 years with an S0.5
dispersion. Life analysis shows a longer life than exhibited in currently approved.
Company personnel recommend a life of 13 to 14 years for this account. This
study recommends moving to a 14 LE for this account. A graph of the proposed
curve is shown below. After the implementation of general plant amortization,
the survivor curve will become a SQ curve.
Account ARIZ - 396.00 Power Operated EquipScenario; so Gas Arizona @ 2015
A Actual Data I:1 LE 14.00
100
80
60
40
mc.2a3U)4-1cGJu;G.)CL
20 9 QDDD6
4032241680
g
Age (Years)Vintages: 1 g65.201 s
Activity Years: 19762015
36
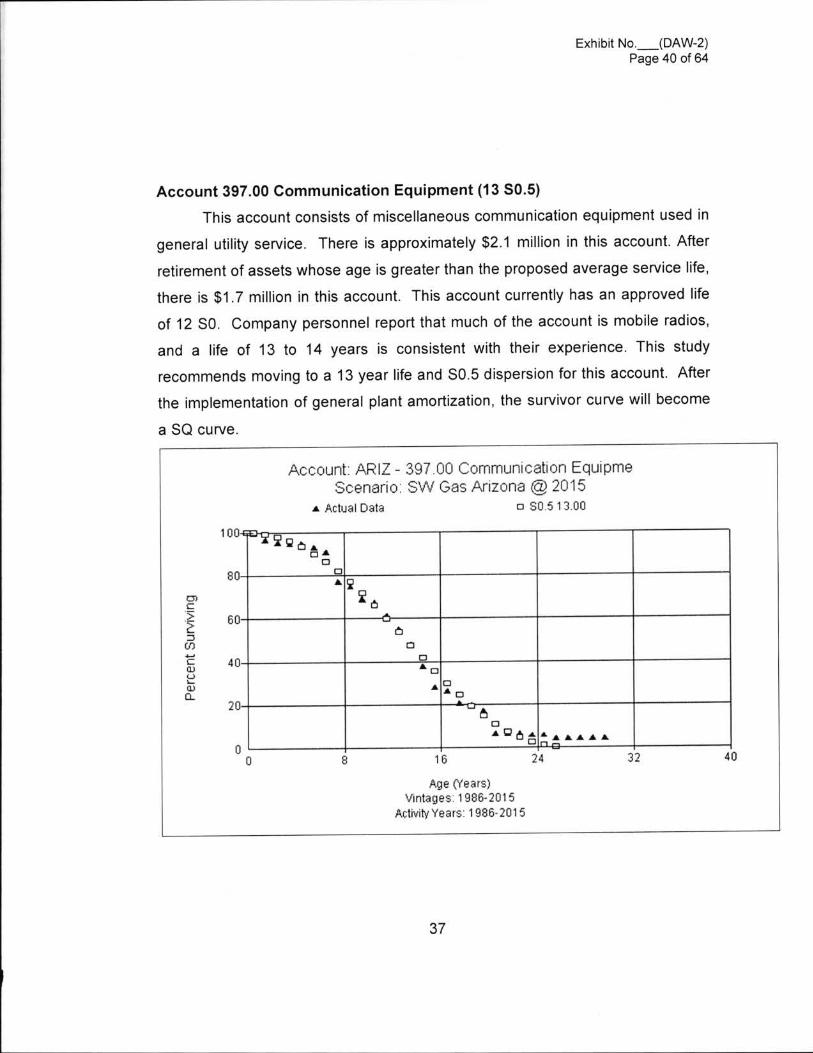
IiI
Exhibit No. (DAW-2)Page 40 of64
Account 397.00 Communication Equipment (13 S0.5)
This account consists of miscellaneous communication equipment used in
general utility service. There is approximately $2.1 million in this account. After
retirement of assets whose age is greater than the proposed average service life,
there is $1 .7 million in this account. This account currently has an approved life
of 12 S0. Company personnel report that much of the account is mobile radios,
and a life of 13 to 14 years is consistent with their experience. This study
recommends moving to a 13 year life and S0.5 dispersion for this account. After
the implementation of general plant amortization, the survivor curve will become
a SQ curve.
Account: ARIZ - 397.00 Communication Equip reScenario: SW Gas Arizona @ 2015
A Actual Data Cr S05 13.00
1009:16 4
D
U80
60
cmc82: icm
404 -C(Du;GJQ .
20 aaA 906
4032241680
0
Age (Years)Vintages; 19862015
Activitvyears: 19862016
37
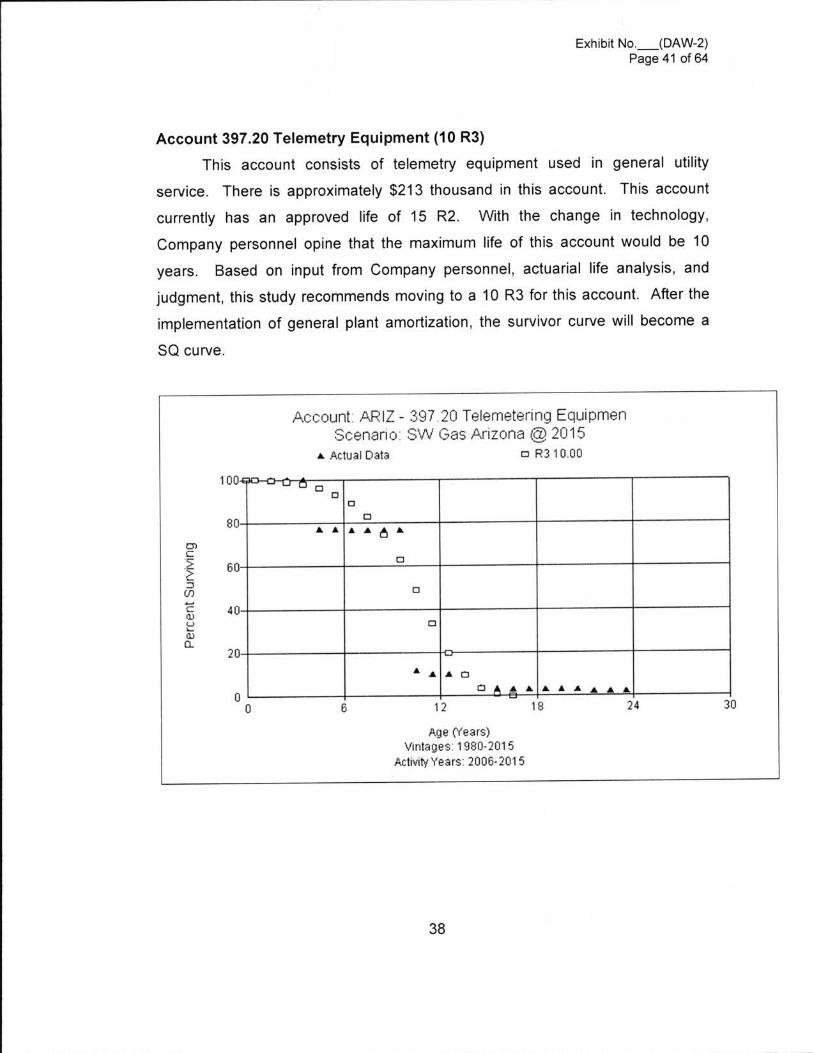
Exhibit No. (DAW-2)Page 41 of 64
Account 397.20 Telemetry Equipment (10 RE)
This account consists of telemetry equipment used in general utility
service. There is approximately $213 thousand in this account. This account
currently has an approved life of 15 R2. With the change in technology,
Company personnel opine that the maximum life of this account would be 10
years. Based on input from Company personnel, actuarial life analysis, and
judgment, this study recommends moving to a 10 RE for this account. After the
implementation of general plant amortization, the survivor curve will become a
SQ curve.
Account; ARIZ - 397.20 Telemetering EquipmentScenario : SW Gas Arizona @ 2015
4 Actual Data 1:1 RE 10.00
100
80
60
U)c.2a3cm
404 -CG)u
GJO .
20
3024181260
0
Age (Years)vintages: 1980201 s
Activity years: 2006-2015
38
Exhibit No. (DAW-2)Page 42 of 64
Account 398.00 Miscellaneous Equipment (16 R1)
This account consists of miscellaneous equipment used in general utility
service. There is approximately $1.1 million in this account. After retirement of
assets whose age is greater than the proposed average service life, there is $1 .1
million in this account. This account currently has an approved life of 20 L2.
Company personnel report that the Company recently upgraded the Emergency
Operations Center (EOC) in 2015. Based on the types of assets (predominantly
electronic), Company personnel believe the life of the account is approximately
15 years. Based on input from Company personnel, actuarial life analysis, and
judgment, this study recommends moving to a 16 R1 dispersion for this account.
After the implementation of general plant amortization, the survivor curve will
become a SQ curve.
lll
il
i
39
ll
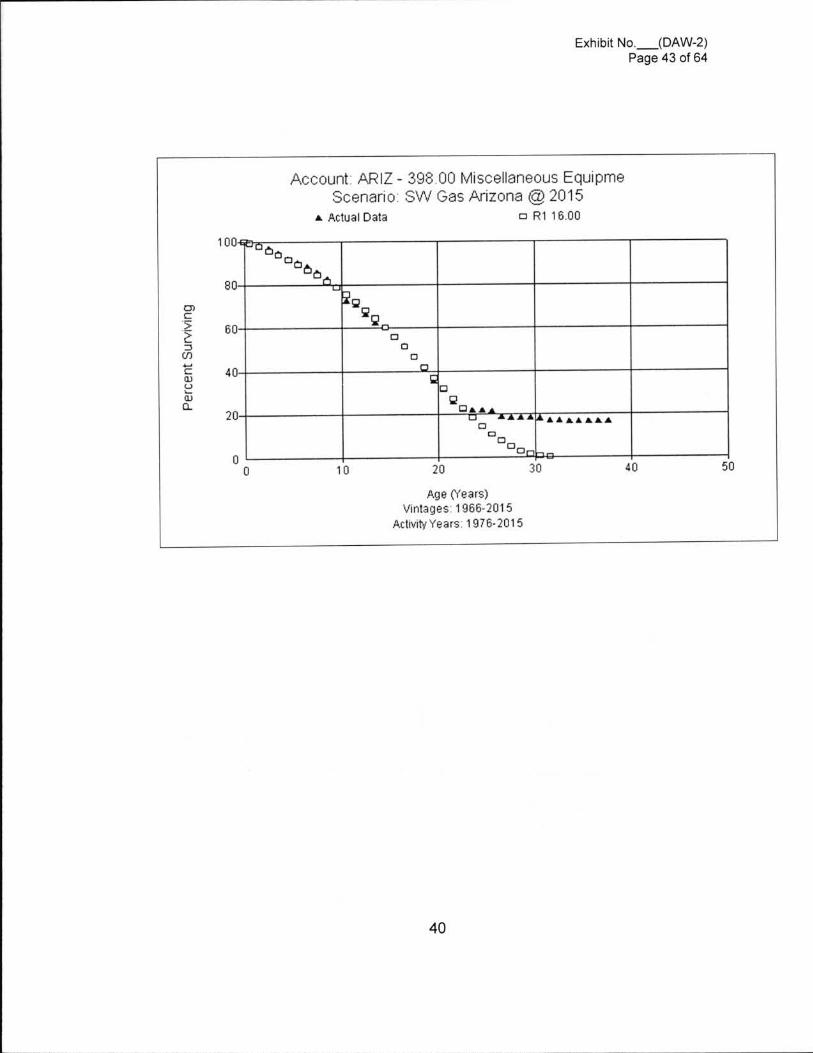
Exhibit No. (DAW-2)Page 43 of 64
Account; ARIZ - 398.00 Miscellaneous Equip reScenario: SW Gas Arizona @ 2015
A Actual Data o R1 16.00
cmC.2z3(D4-4CQ.)u
GJa
4010
DQ DID
20 30
100 CI00366
80
60
40
20
00 50
Age (Years)Vintagesi 19662015
Activity Years: 19762015
40
l
il
WlExhibit No. (DAW-2)
Page 44 of 64
Salvaqe Analysisl
l
\l
When a capital asset is retired, physically removed from service and finally
disposed of, terminal retirement is said to have occurred. The residual value of a
terminal retirement is called gross salvage. Net salvage is the dif ference
between the gross salvage (what the asset was sold for) and the removal cost
(cos t to remove and dispose of the asset) . Salvage and removal cost
percentages are calculated by dividing the current cost of salvage or removal by
the original installed cost of the asset. Some plant assets can experience
significant negative removal cost percentages due to the timing of the original
addition versus the retirement. For example, a Distr ibution asset in FERC
Account 376 with a current installed cost of $500 (2015) would have had an
installed cost of $41233 in 1962. A removal cost of $50 for the asset calculated
(incorrectly) on current installed cost would only have a -10 percent removal cost
($50/$500). However, a correct removal cost calculation would show a negative
121 percent removal cost for that asset ($50/$41 .23). Inflation from the time of
installation of the asset until the time of its removal must be taken into account in
the calculation of the removal cost percentage because the depreciation rate,
which inc ludes the removal cost percentage, will be applied to the original
installed cost of assets.
The net salvage analysis uses the history of the individual accounts to
estimate the future net salvage that Southwest Gas can expect in its operations.
As a result, the analysis not only looks at the historical experience of Southwest
Gas, but also takes into account recent and expected changes in operations that
could reasonably lead to different future expectations for net salvage than were
experienced in the past. Recent experience is more heavily weighted in making
net salvage recommendations than experience several years in the past.
Salvage Characteristics
For each plant account, data for retirements, gross salvage, and cost of
$500 X 63/764,s Using the Handy-Whitman Bulletin No. 182, G~5, line 44, $41.2341l

Exhibit No. (DAW-2)Page 45 of 64
removal for each plant account group adjusted as discussed above was derived
from 1993-2015. Moving averages, which remove timing differences between
retirement and salvage and removal cost, were analyzed over periods varying
from one to 10 years.
42
Exhibit No. (DAW-2)Page 46 of 64
DISTRIBUTION PLANT
Account 374.20 Rights of Way (0 °/,)
This account includes any salvage and removal cost related to land rights
used in connection with distribution operations. Generally, little or no removal
cost is incurred and no salvage is received at the retirement of land rights. The
existing net salvage is 0 percent, is supported by the historical data for this
account. Therefore, this study recommends retaining the approved 0 percent net
salvage for this account.
Account 375.00 Structures & Improvements (0%)
This account consists of any salvage and removal cost related to small
structures and associated assets on the distribution system. The approved net
salvage is a 0 percent net salvage rate for this account. There has been no
retirement activity in this account from 1993-2015. Based on judgment, this
study recommends retaining the approved 0 percent net salvage for this account.
Account 376.00 Mains (negative 35%)
This account consists of any salvage and removal cost related to Mains of
all material types. The authorized net salvage rate for this account is negative 60
percent. The moving averages from 5 to 10 years range from negative 55
percent to negative 38 percent, suggesting cost of removal has decreased from
the levels experienced when the approved rates were established. The overall
moving average f rom 1993 to 2015 is negative 32 percent. This study
recommends changing the negative 60 percent net salvage rate to negative 35
percent rate at this time.
Account 378.00 Measuring & Regulating Station Equipment (negative 25%)
This account includes any salvage and removal cost related to installed
equipment used in regulating gas at entry points to the distribution system. The
43

Exhibit No. (DAW2)Page 47 of 64
currently authorized net salvage is negative 48 percent. The moving averages
from 5 to 10 years range from negative 27 percent to negative 24 percent,
suggesting cost of removal has decreased from the levels experienced when the
approved rates were established. The overall moving average from 1993 to
2015 is negative 35 percent. Based on these indications, this study recommends
moving to negative 25 percent net salvage for this account.
Account 380.00 Services (negative 55%)
This account includes any salvage and removal cost related to services
related to distribution operations. Service lines are the pipes and accessories
leading from the main to the customers' premises. The authorized net salvage
rate for this account is negative 96 percent. Generally, pipe is abandoned in
place. However, removal cost is still incurred even when abandoning the pipe in
place. For pipe that is abandoned in place, activities such as isolating the old
pipe, cutting the old pipe, purging or foaming the old pipe and capping the old
pipe are charged as removal costs. When the pipe is not being abandoned in
place, in addition to the above activities, dispatching a crew, uncovering the pipe,
recovering the hole and repairing the surface are additional activities charged to
removal cost. The net salvage ratio in transaction year 2015 is negative 266
percent. Since that is much higher than any other year, the focus was on moving
averages from transaction year 2014 and prior. In 2014, the moving averages
ranged from negative 69 percent to negative 43 percent. The overall moving
average from 1993 to 2015 is negative 69 percent. To consider the recent
trends, this study recommends moving to retention of the existing negative 55
percent net salvage for this account.
Account 381 .00 Meters (0%)
This account includes any salvage and removal cost related to meters
used in measuring gas to residential customers. The currently authorized net
salvage rate is negative 7 percent. The moving averages from 5 to 10 years
44
Exhibit n<>.__(oAw-2-Page 48 of 64
range from positive 1 percent to negative 0 percent, suggesting cost of removal
has changed from the levels experienced when the approved rates were
established. The overall moving average from 1993 to 2015 is negative 1
percent. No salvage or cost of removal is expected on a consistent basis so this
study recommends 0 percent net salvage for this account.
Account 385.00 Industrial Measuring 8\ Regulating Station Equipment
(negative 15%)
This account includes any salvage and removal cost related to industrial
measuring and regulating station equipment used in measuring gas to residential
customers. The currently authorized net salvage rate is negative 30 percent.
The overall moving average from 1993 to 2015 is negative 17 percent. Based on
historic activity and judgment, this study recommends moving from the approved
negative 30 percent net salvage to a negative 15 percent net salvage for this
account
GENERAL PLANT
Account 390.10 Structures 8= Improvements(0%)
This account includes any salvage and removal cost related to structures
and improvements used for general utility operations. The currently authorized
net salvage rate for this account is 15 percent. The moving averages from 5 to
10 years range are negative 1 percent. The overall moving average from 1993
to 2015 is negative 1 percent. Based on the overall analysis, expectations, and
judgment, this study recommends a 0 percent net salvage for this account.
Account 391.00 OfficeFurniture & Eq. (0%)
This account includes any salvage and removal cost related to office
furniture and equipment used for general utility operations. The currently
authorized net salvage rate for this account is 6 percent. The moving averages
from 5 to 10 years range are 0 percent. The overall moving average from 1993
45

Exhibit No. (DAW~2)Page 49 of 64
to 2015 is 0 percent. Based on the overall analysis, expectations and judgment,
this study recommends a 0 percent net salvage for this account.
Account 391 .10 Computer Equipment (0%)
This account includes any salvage and removal cost related to computer
equipment used for general utility operations. The currently authorized net
salvage rate for this account is 0 percent. Generally computer equipment has
little net salvage. Based on the overall analysis, expectations and judgment, this
study recommends retention of the 0 percent net salvage for this account.
Account 392.11 Transportation Equipment - Light (25%)
This account includes any salvage and removal cost related to light
transportation equipment used in general operations. The currently authorized
net salvage rate for this account is 14 percent. The moving averages from 5 to
10 years range from positive 25 to positive 18 percent. The overall moving
average from 1993 to 2015 is positive 19 percent. Based on the overall analysis,
expectations and judgment, moving to 25 percent net salvage is recommended
for this account.
Account 392.12 Transportation Equipment - Heavy (18%)
This account includes any salvage and removal cost related to heavy
transportation equipment used in general operations. The currently authorized
net salvage rate for this account is 14 percent. Data in 2015 shows a much
smaller gross salvage than prior years. For that reason, more focus was given to
moving averages ending in 2014. For 2014, moving averages from 5 to 10 years
range from positive 18 to positive 15 percent. Based on the overall analysis,
expectations and judgment, moving to an 18 percent net salvage is
recommended for this account.
Account 393.00 Stores Equipment (0%)
46

i Exhibit No. (DAW-2)Page 50 of 64
This account includes any salvage and removal cost related to stores
equipment. The currently authorized net salvage rate for this account is 20
percent. Very small amounts of gross salvage have been received over the
period 1993-2015. Based on the overall analysis, expectations, and judgment,
moving to 0 percent net salvage is recommended for this account.
Account 394.00 Tools, Shop, andGarage Equipment (0%)
This account includes any salvage and removal cost related to various
items or tools used in shop and garages such as air compressors, grinders,
mixers, hoists, and cranes. The currently authorized net salvage rate for this
account is 0 percent. The moving averages from 5 to 10 years range from 0
percent to positive 1 percent. The overall moving average from 1993 to 2015 is
negative 0 percent. Based on the overall analysis, expectations and judgment,
retention of 0 percent net salvage is recommended for this account.
Account 395.00 Laboratory Equipment(0%)
This account includes any salvage and removal cost related to laboratory
equipment. The currently authorized net salvage rate for this account is 0
percent. Over the period from 1993 to 2015, no gross salvage or removal cost
has been experienced in this account. The overall moving average from 1993 to
Based on the overall analysis, expectations and judgment,2015 is 0 percent.
retention of 0 percent net salvage is recommended for this account.
Account 396.00 Power Operated Equipment (30%)
This account includes any salvage and removal cost related to bulldozers,
forklifts, trenchers, and other power operated equipment that cannot be licensed
on roadways. The currently authorized net salvage rate for this account is 18
percent. The moving averages from 5 to 10 years range from positive 32 to
positive 30 percent. The overall moving average from 1993 to 2015 is positive
30 percent. Based on the overall analysis, expectations and judgment, an
47
Ii

Exhibit No.__(DAW2)Page 51 of 64
increase to 30 percent is recommended for this account.
Account 397.00 Communication Equipment (0%)
This account inc ludes any sa lvage and remova l cos t re la ted to
miscellaneous communication equipment. The currently authorized net salvage
rate for this account is 0 percent. Over the period from 1993 to 2015, no gross
salvage or removal cost has been experienced in this account. The overall
moving average f rom 1993 to 2015 is 0 percent. This study recommends
retaining the approved net salvage of 0 percent for this account.
Account 397.20 Telemetry Equipment (0%)
This account includes any salvage and removal cost related to telemetry
equipment. The currently authorized net salvage rate for this account is 0
percent. Over the period from 1993 to 2015, no gross salvage or removal cost
has been experienced in this account. The overall moving average from 1993 to
2015 is 0 percent. This study recommends retaining the approved net salvage of
0 percent for this account.
Account 398.00 Miscellaneous Equipment (0%)toThis account inc ludes any salvage and removal cost related
miscellaneous equipment. The currently authorized net salvage rate for this
account is 2 percent. Little salvage or removal cost is expected for these assets.
The moving averages from 5 to 10 years range from positive 4 to positive 2
percent. The overall moving average from 1993 to 2015 is positive 1 percent.
Based on the overall analysis, expectations and judgment, a 0 percent net
salvage is recommended for this account.
48
Exhibit No. (DAW-2)Page 52 of 64
APPENDIX A
Computation of Depreciation Accrual Rate
49
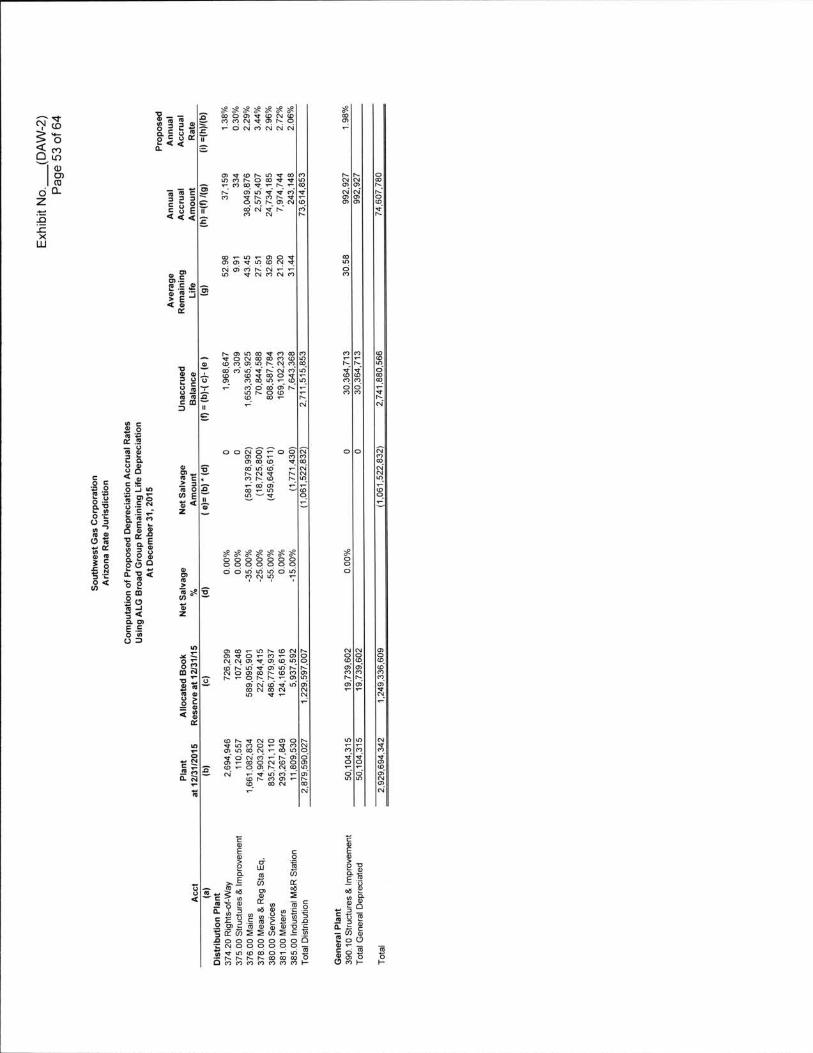
82of°1-
$888888saassmsédNéN~N
3-- 3(U8532:°E,,n.:8<<1 II° r :
- vm
3 6< mO m
mlm. mo m
r~r~N N°z°zN Nma>mm
oof'wNo¢av1~
38383838- n ea v - |\ - ofm N 3 v m vm 8 |\ v 'N r~ m N w
ml~Dri€r~m N
_ - 33 Lu : =: E 8 c: u E ll< < < E
x
z:8LLu
mvo.om
®FWF¢O$m crvuvw wr~|c»nr~n--ID v m n m mon85m : 4: »~5 ._ »- 57
ea EJ ..>< ea
or
3
n n- -N v~88m m6 6n m
ww~fzoofet-Q'EN
gggwgggg'Q"Z°l 8 ' i°£"Z9mm\n¢r~n¢ann
m U)v° 0¢>omG»r~-~nr~o¢o -<o nov- r~- N
._u 8o f:.gou n w0 _m a nc m *D u
SW
o f Nmsq8IN;8-.
¢96"`o 6`no f FU50v- mn°a°Q=Q vaq9 8 g or~°.m8. 9p®9 r -wru> gm-v_, V -V
-828888'DEF§'@
886
3989898988338 0 0 0 0 0 8o o o o oQ Q f) \D \O O ID
<1>~."<* T
:=882888 1
:MyEv a:a
s ~3 :=s88m
eaoniv>1588in .'5z
8 585- §g r38
8: . -.g.a1n398u E285b E _8 w8"E34v88888°Ev?83g M
83:<a mGsAg
dm
N N mo f 8w emmmm 3N N F)
c>F - vn.-
m@-\n|~¢on|~L v o m - m oq q q q q q q q88"8°398r~- 8 r~R- e m o
mo: nor@N 8N Nnm v - N-
m
: C
88-3.-8. 28 :28
M
a d
D m N33 388 3- - <9
i iD D NQN
< o r ~ n e uronV 0 3 O F 3 @ No r ma o w - m o
a°ssa~g3-~°*Q°1'\93<=Q~QN 833828Q Mn Q- N
10-o£ Qm§5`_ ..° N
-
ncy
l
9l
1l
W..c
a- cy848 god w< ~ E . v»N*4)
l
l
\l
l
W
EoE
33E_3"a"1 op a€=-
£981 :-(D§2§ _=6-888 8
8o e 83 m g
(5> § <7> a:
8 5
53- 38 853 m .=:§38€§§§8 . Q ; N 0 $ 0 8 €3 K1/)§§ E - E. o o o o o o o g nb w o o o o o TIggggggfwgOco ncw maaggr-
WW1ll
lll
l1

88888888888<ooooc>or~ooo>o~n~QQ<'2°QQ<QQQ<QQ<~4ng=noo1cov<ov\nl~o¢.oN N F
c9 0
3=
e'<8'*B E
<
o o o o o o o o o o owmmvmwonwvwmow nmwmnumt 4Q§m4mQ<QQmm WNW' mho~;§8°a 88n0nu- -
- og38:6~§s°'=» woe
- vm
a s< 4gm
mIo.m0 4z9:8.cxm
8oor -| »`
m m8 A <anvo<
¢ F womm wmmv°wmmmmmooFmnzmmomvmmmas:mvmmmm-nnnm4ouvmmmmhwmm1 - P F
mv -8858
_ m ocu 6"o6m"o§u><*>ool~:Sl~ct7><':lnnu>-r~¢1 -nOEfwcqeqm m<° N'<
o o o o o o o o o o o o o mocogooov -
o>oivZ(UW
bs a082
a.
088SEE4 1Kb"
w m wm m mm v m o w- - N - N - F P -w-vmvwmmomnom# #NOG3 mQw3§mQQwo >\nm l~l~n ~ 0 l~ r~ h@©QvQN Q@@®NU>*Q¢ '>¢*)v- ° O lO* l0ml~oo~n v N
U3 wo ::4_1o5
o.
71 Ino W 1-:ea »`5 4) ` UQ W 1' `¢40"= m1- 1-
:2s
88¢4¢ 92 °we
m y
g=a<gso
8:-oElo -88o :Q :
-982°§ugm*8Eu"Eo(D
momommmnmmw w m m m m mwm wmF n mw v m mm qqmm vvwmmwvw°<g'°N-moo>o l~-nEv-O(D\DNC'l f>*"\9m W
mU) 1-z o988
--voov-rnoooocow~nr~ou1v¢o¢-r~noc><o\nr~<o-c>vr~<~>no-cmnmr~r~n \0maoo-c>n8v<oc>ooNmv-oom<'>-wln-lf?n orn v N
o2IV Q . . .u N |\ mm° 338
oQas3233I1'
.Nfllnr;- F
B88°b E:mL o UM_w* Q Qo Hc2<P o4 5 .gm°3E<°mQc3
uc2Q.
-"E 888°8C8'$gyvqv-Q -MCDQW)4 moo>4c>ov ¢*)O - U > & N \D V C 7 " N *s n v - v ea r ~n Pwa v
noun <*>\n|\mcooor~ 1-uveo ocmoomoomcooooow v w m m w w - m a n
w w co v <o l~ r~ v o> r~ n° neo mo > c>r~o>o¢~>ml`8 §Q-1Q©~<Qm-Q-unmmcfa to - Q-8 1--1-
mo 1-°8g Ru ; .aI! NiN
F
E- 8m
£~98 Ecwo~- w5 E Q 9 0 » g : ° e
ww8:_8EmU"§8m S88uMG)- 3 ¢C¢ 4UO=Lu.....°Q.ME <6m 3
voQE
Qsn o.Q. Ul1J=88wU m : 83859 .- LIJ<2Ee
8 588J Q. Q.a. Ur m cmE§ G.) Vi 0
.Q8928
c .- ._8388-W m
E anam-ca>
. cua> m o 15 E Eo
civea _
w B.m<om:Boo<z3LL4
ooncwE8=wz
.Ur<
. ¢.5,:,,5 .88g8o>c>c>8a>o>ca
E? "m9% E_| QE8 4
° o . ° :88cE - alum:D 9 -593o _ o 88888U 3 q ) u t u . c o C w c< ~OOWW O:§QE'
88 C C M " 3o mOO®-O P WP4lOPof n o o o oo o oQs wOQQOONC. > m
m m m m m m m mm mm
3§ E~ a._ Q) C_II E °éq)c°" o. we a&'EQ Q Q.
al IJWJD .°"E88E"NwG aa(D
" . 8 4 3o»~0 ._ c.n =°a"8< : o ' i € ° £ o ¢ . E C~4"° Wm- :
c 88v4"2 - E € € ' - - g 3 E 2mtoQS28 mo m -- OFPWP4&OP20°~~3g3888gq;0Fv- - .Cé NNdéW¢RRwWm mm wm mm m m m mW w mm mm mm mm mm
Exhibit nQ._(DAw-2)Page 55 of 64
APPENDIX B
Comparison of Depreciation Accrual Rates
51
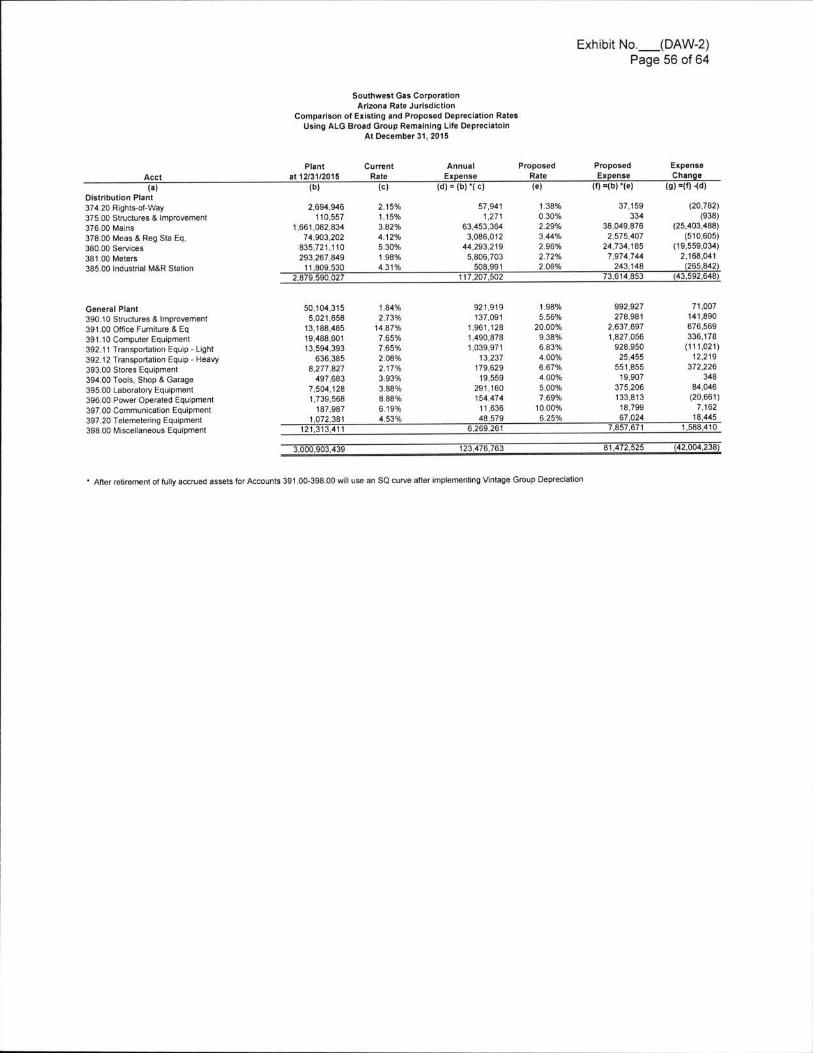
Exhibit No. (DAW-2)Page 56 of 64
Southwest Gas CorporationArizona Rate Jurisdiction
Comparison of Existing and Proposed Depreciation RatesUsing ALG Broad Group Remaining Life Deprociatoln
At December 51 2015
ProposedExpense
if) =(b) (1)
ExpenseChange
(g) =m 4¢)
ProposedRate
(et
AnnualExpense
(4) : (b) ( c)
CurrentRate
(¢)
Plantat 1212\1/2015
(bl
1.38%0.30%2.29%3.44%2.96%2.72%2.06%
2.15%1.15%3.82%4.12%5.30%1.98%4.31%
Acctto)
Distribution Plan!374.20 Rightsofway375.00 Structures 8. Improvement376.00 Mains378.00 Meas & Reg Sta Eq.380.00 Services381.00 Meters385.00 Industrial M&R Station
37159334
38.049.8762.575.407
24734185/974744243148
73.614.853
579411271
634533643.086.012
442932195806703
508991117207502
(20782)(938)
(25403488)(510605)
(19.559.034)2168.041(265842)
(43592648)
2694946110557
1661 .0B283474903202
835l2111029326784911.B09530
2879590027
1 .98%5.56%
20.00%9.38%6.83%4.00%6.67%4.00%500%7.69%
10.00%6.25%
1 .84%2.73%
14.87%7.65%7.65%208%2.17%3.93%3.88%858%649%4.53%
71 .007141.890676569336178
(111 .021 )12219
372.226348
84.046(20681)
716218.445
1.588410
992.927278.981
26376971 .827056
92895025455
551 .85519907
375.206133.81318.79967.024
7857671
921.919137.091
196112814908781039971
13237179.62919559
2911601544741163648579
6269261
501043155021658
131884851948B.60113594393
6363858277827
49768375041281739568
1879871072381
121 313411
General Plant390.10 Structures & Improvement391 .00 Office Fumiiure a. Eq391.10 Computer Equipment392.11 Transportation Equip . Light392.12 Transportation Equip Heavy393.00 Stores Equipment394.00 Tools. Shop & Garage395.00 Laboratory Equipment396.00 Power Operated Equipment397.00 Communication Equipment397.20 Tele metering Equipment398.00 Miscellaneous Equipment
81 472.525123476763 (42.004238)3000903439
After retirement at fully accrued assets for Accounts 391 .00398.00 will use an SQ curve after implementing Vantage Group Depreciation
ll
ll
I:
Exhibit No. (DAW-2)Page 57 of 64
APPENDIX C
Current Commission Approved Rates
l
i
l
l
53
i
i

Exhibit No. (DAW-2)Page 58 of 64
Southwest Gas CorporationArizona Rate Jur isdic tion
Rates at December 31, 2015Life and Net Salvage Parameters
ProposedExisting DifferenceNet
Salvage%ASL
NetSalvage
°/>Curve
NetSalvage
% ASLCurveASL
0%0%
35%25%55%
0%15%
65 R555 R453 R1.533 L0.544 L1530 S0.545 R3
0%0%
60%48%96%
7%30%
50 R550 R445 R450 R442 L048 R1.530 R1
Account DescriptionDistr ibution Plant374.20 RightsofWay375.00 Structures & Improvement376.00 Mains378.00 Meas & Reg Sta Eq380.00 Services381 .00 Meters385.00 Industrial M&R Station
1558
172
1815003
132040
1802154
0%0%
25°/o23%41%
7%15%0%0%
-15%-6%0%
11%4%
-20%0%0%
12%0%0%2%
0%0%0%
25%18%0%0%0%
30%0%0%0%
42 RE18 R2
5 L2.58 L2.5
12 LE25 RE15 R1.525 R414 LE13 S0.510 RE16 R1
15%6%0%
14%14%20%0%0%
18%0%0%2%
45 RE31 L1
7 R28 LE8 L2
25 RE33 RE25 R412 S0.512 S015 R220 L2
General plant390.10 Structures 81 Improvement391.00 Office Furniture & Eq391 .10 Computer Equipment392.11 Transportation Equip Light392.12 Transportation Equip - Heavy393.00 Stores Equipment394.00 Tools, Shop & Garage395.00 Laboratory Equipment396.00 Power Operated Equipment397.00 Communication Equipment397.20 Telemetering Equipment398.00 Miscellaneous Equipment
C Accounts 391 .00 398.00 will use an SQ curve after implementing Vintage DepreciationDepreciation.
llW
l
lllll
l
lili
II

Exhibit No. (DAW-2)Page 59 of 64
Appendix D
Net Salvage
55
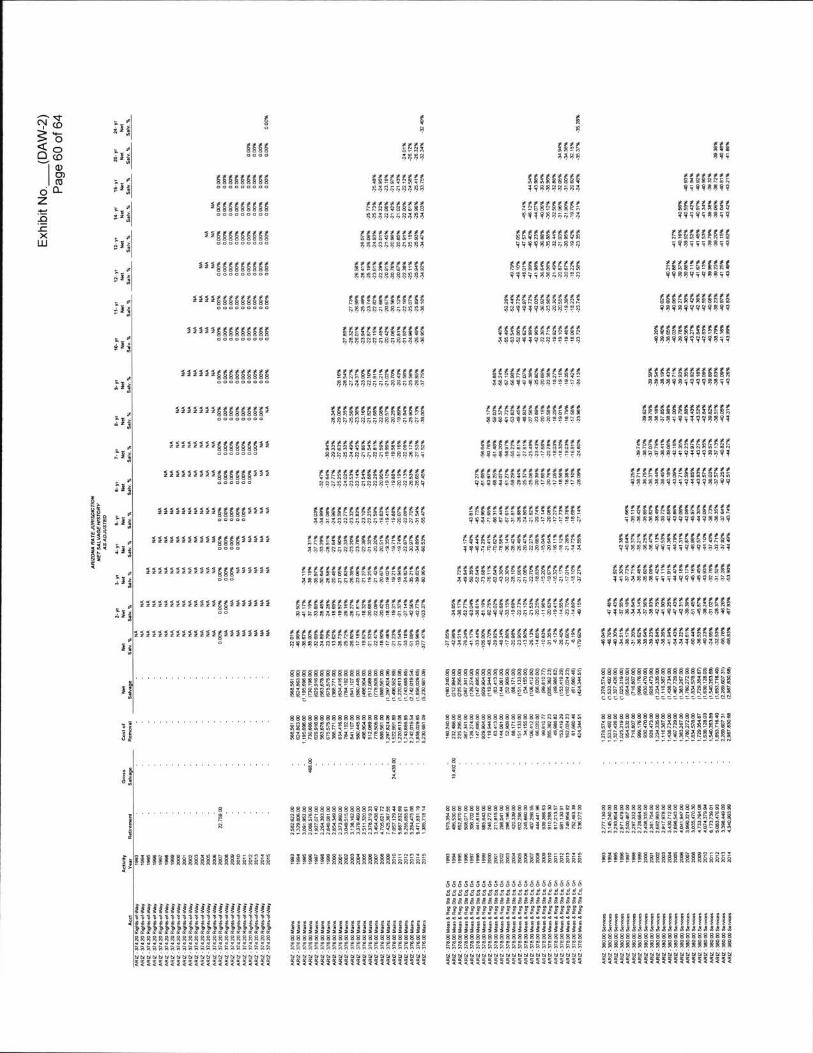
g98 E
4an8888 89;
$§844388
I I583;8888
888888888 ssssssssq;qqggq9
3§8E5!§!E889849499
'~<r'Fro
O -
38€1<0
wla6 cL2:
'888888888 §§sass§ssq9;q;qg;q
s§§s§§§§§493338584
S8E§$§§§§£9149884444
EE§§9§§£§§89498894838 :
£ 3. Cx
55838888888U J548555858849849=8899
§84£§§!8§8§49998894929
E88858§88§E88438834484
r§!§
***§§§§§§§§§E88§!£8§58S¢9ggq;qgg;q
ssss§s§:ssssq9q;;gg;gggg
assasassssss889888388884
; I
e t ;
5,9a asig
4 v,,4
3,3
'*"§§§§§§§§§ s;ssssa§§4;ss§8£89~88~NR88
§i§E§$i§§£E598989999?8?9
sssasgsasasas3qqq;q8gggg;gEYE
==§=§§§§§§§§§§ggggggggggggg988989?WW989?
¥5§§E§§§EE5#§$§¥3$Y5V99?9??$
i§£§£$$5§8§i$§;ggggg;g;g;4g;: I
eire
§§=§§=§§§§§§§§§ssssssassssassggqgqg;qqqg3;9
§£§§EE$E$§£§§S3483$1;qgggg;g;;
;;sa§4as§ss§;as8$8388E§E$$$$8821;
§§§§i§§§E§§§§§§§ assssssssassa§aegg;g;q;;qqggq;
E§£E§8§§i§§£§E§§¥$3;3qq;ggg?$¥99
s§§§§sas§££ss§§§ggggggggggggggggRx;
§§§§§§§§§§§§§§§§§ !§§§2§§£EEE§£5§£$8$Z8$9¥9§9?899¥
ss§§s§:ass§s§§sss¥$6¥$$8$$$?3¥??¥4
sasassaasssasseasggggggggggggggggqRx;
i§§§§§§§§§§§§§§§§§ zssassésssaaasas;?88¥$899§9§99#999
EyE£E££§é§S$§§§§§§W$$¥$$$$9$$9$F¥??8
E§E£§5§§§§§§§$35§$gggggggggggggggggqa
Ex;
§§§§§§§§§§§§§§§§§§§ §§S§S$Ei§§§E§E$§§S;3gg3ggqqqqq;qgg;Q
$5§§£§£8§§$$$§£3§!!7¥3€¥3$6848$?$???¥3
£§§§§5§§§§§§€§£§§§€3368$98$9$§???3998$
§§§i!!§§§§§§§§§§§§§§ §§EE£E£§§E§E§£!$§§$99#$$89V?¥¥9VV¥545¥
§ssssss4s4sa§§s§s§s§;qs;ggggggggggggg;;;
;ssas§ssssas;asss;sa4$3¥$8$§984B8???$93$
38 Rx;
51;
és
8 9
83.i§§§§§i§§§§§§§§§ii§i§ E§EE5£i6§£€§E§5§!$§$
¥?549939¥?¥9799988$3E£$§§€3§§§§§EE§E§€£§Sa!$a@4#v48a49=?¢?s??4
ssasassssssassssssssa;gg8gg;;gg;g;gggg;g3g
xi;
1§§§§§§§§§§§§§§§§§§§§§§of
33§!SS§§£§£5£&5E£$$§§=4 a»44aswav=4asv8asv¢
§!é§8§E§§5§£§§£§5!§E§84 assa=s99a:msas4s=:4:w
§ssss§sa§saaassaa;;§s4gqgggggggggggggggggqqg
§E§£€§$§£§£§582S§§§§E5¥¥94858¥8V39$¥¥¥898981
asa§assss§§§§§ssaasssss$93¥93§7$??$$?8¥?3'§G'E
£§E§§iE§EEi§5E€§5§§§iiE9 V¥$8¥8?¥$8?$E$?9$$359E
21;§§§§§§§§§§§i§§§§§§§§§§§
I; o
awsaa§s€e4§zezsa§szsasa2as8&&§sse9aa§§a§sas§=§§§§§§§§§§§§8§§§5§§£§§§*§2i=aa1=i ; g g . 288§§§§g8 z8za8a!a§§!83;§*s
§§§§§§§§§§§§§§§§S§i58§
gggggggggggggggggggggg
§§§§§§§§§§§§§§§§§i§i$i§
£8§§E3E8§éi3!8§!§=§§§§§
aaesasssaaasssaennsnsvz39§ia¥ii=s§=3¥=§;i§as§i§E§§5§§;s!$s§x§x1£w3g;585
assaaassasaaasesaastasi¥68§§88S3§55EEE§§i5E§E§§§i2!§¥§395§§iE8§3§§
sesessssasaeaaaaaasaxnaii§§3€£E§E§¥i8§ii§838§i§as2s§snaas§ssa§§§§33a§
.8 ..................§
8s
.sg
85
84R
saaasssasssssssasasaane§§§§§33§3i!§§l§i§§£8i3EE¥9§§i¥!£§E3§£53§§E§3E§
aasasssaseeaesaanzaaal8§i€5§i§§R5Eii§8E5ZEggE3§§§§§8§§§3§§§§8§§§58
sssaaasesssasnirazssse:E§§3§ia!ia§l§a5un55§¥8:§3§§5§38§§8§5§3¥§§§§833
Is
¥§§!§§§§E§3i§§8§8§§3§§§!!§§§§§§§8§E8§B§3§3§§€!!§!§!!§§E§§8§8§§3§§8§8g1!!§!§!!§§3§§§E§§83§§8§§II
I
I
gggggggggggggggggggggg8888888888888888888888ggggggggggggggggggggggggggggggggggg8gggggggg
8888885§668688535888888zxzsszszssssssassssszsaaaaaaaaaassaanaaaaasaaasssssszssssszssssssssss1 l l '4ill!1l41¢¢4l11ll0:
iiiiiiiiiiiiiiiiiiiiiii88888888888888888888888aassasaaasasaasaasasasa
ggggggggggggggggggggggg
§55§§§§§§§5§§§§§§§§§§3§8888888888s888888888888E§EEE5EE3EEE§§§8$8$$§$§
ggggggggggggggggggggggg
I 55§5§5£5¥¥iii£i£i££¥
3§§§3l3§§§8§§§3§§§§E§ilggg9ggg38882gggggggggg9gggggggggggggggggggggggggggggggggggggggggggggg

8
888§
88s§§
sq
:sis1999*sIii.
£8885§§8§£8§Ew4414°°wsssasssss
481114496sssasasaagg;$$?¥9vgas
§§§§§8388888883nsssaassssB839899"?'
:»§l§
|.'
:=;l§
£28888§§§€E§§§§§§
425§i§28584411119989
!5IE5E§E5£Eqs-gqqggqqq
era;8: 15g g . -, ¢ o
cml m
. mo Q .z:8:£3J:xUP
ii£IEE8§§E5$8369???$3'
n,-8158
§§§§§§§§§§§§3§§§§§§8888888558584441-119§°°°
sssssssassssggggqgggggvvs *V
5154
88888888Eiigggggiilgg1949?!1199°°° §§§§§§§§§§§§§ssissiasaasss
g;;g9g;;qgQvv#E
figs
888858888Si!§£§£!i!iBi§v6¢W 1111196°°° §3§§§3§§§§§§§8£E§i§E5£E8i§5§
!9889$88¥?*'"°5
iii'
8888888888€l5§5!i£!£§5§3£v444v-1-ee 9084 §§8§§§§§§§§§§§§!E£l!§EE!§£§§§§
$$¥89Ei8$¥¥'""",s
Ixia
88888888888§§§3§§§§§§§§§§§§£§EE§!£!E£El§I§£114999:-g?qqqoco§§i!!iI!§§§§i§§58$84i 8H9$8?'""""
88888888885858§§83§5§§§8§§888 !I§£§!S££!§S8§i£§ggg;§q;;g5g4vv@~v
8888888888888
EQ888888888888888
§§§§§§§§§§§§§§§§§§Eii5!!££&§!2E$!Ii§1414?44-11999w4°°°
§5EE§§§E§£§$i§§§i§$6$5¥9¥$$!89"""°9
L 45all'
. 4=¥§§
,.sall?
§§§§§§E§§§§§§§E§§§§§§§§§E§§§§§§§€sssssssssssssssssss4w¢v4w441¢¢9vQ§9--u
£lE£§$!SE!E§§!E5£§§%$3;|q¥;gggg;v w¢°w
z
ll!§8§§§§§§§§§§§§§§8€§§§§§§§§§§§§§§§§€§§§E§€E§§8§EE§$£§5£i
'$88$63?¥$$F¥8'"'°°'ssh;s§sssasa§sssssasg1v¢¢w¢ww¢v¢9Q¢9°--°
483a n
go§§§§§§§§§§§§§§§§a8§s;§§sss§§§§§§§£§§£
r§an;¢¢DQDQOD6D99¢B¢§3§§§§§§§§8§33§§§3§§§ §s§§§§8ess§ss§ssssas§Qw88;;¥g33ggwg§49¢994
i§§§§§§§§§§§§§§§§s£ssas§§§§§§§§§§§§s§§s8-n9 go°oeooonooooooe4§§§§§§3§§§§§§§§§E§§§§§
sssss;§§§2sss;a;s§ss§§"¥'43$4°494¥*?$§°°'°°'
§1§§
5 x§§
31§§
H88§€§§§§§§§§§§§§§§§§§§§§§£§§§§§§§§§§§§§§§§§Ag~o$*oooeo¢aaoaoaoeeqE£5§§§§5i3§§§£§SEE§£$£§qw»90~~¢4v9¢94Qw9°°~-4
s§s§ssss§§§§§s§ss§as§§sv;;1;924°3§9°?§q:°¢w°°1
,s!in
. g asgs9 Q
§3
§§§§§§§§.§§§.§§§§.§E85éE§§!: sos 8888 83:e°c51e 388 ca
8§8.§§.ass 59s=~ 88
§§§§§§§§§§§§§§§§583;8§8i§§§!§8E§§§E!§5§§§s§§§§asa@esssasaa;szaa§*=n§;
8lag
is.. .. ... ......8!
88888888 8888.82QQQQ as
a98
.ass.§§e¥!@3' egg
BB28ng
assesssaaassaasssaaiinn3E§!!§a5§8§E§§i§§5@§§§i31583l£R8B¥2!§2W22!5gi23;
" i
n:...S.
9.88 .Gs8
3aeqa
5aQ8
!36§8§§§3334$8E!§5§85¥!8888ss88888asa888:=:a2l§83§i£28aS§3n!§§£§$u§9ax°:nnn~~-:°nn°-°¢saie a
aesaasesassassseau§§§§E3€5§§i¥E£i9l!gne~~a;§§aaa"s35=°
ea8ms8ss8eessaemnzaesna8$3!§!§!§Q5§3gi§i§8g§!Qe°=~§§§@w=""a=saa§§=§=z
sssssssaaaaasasseluausn
siisi8!a§£as3s92§§§3;§§
iiuin
§3¥§§!!§§S883§E8§3§!¥!§¥!§8§§3§§§§83§3§é383¥§§§!SEE§§§§88E3§E8é8!!§!§!!§§§§i3E8§§3§8§§§£13g>
aazzszzzzsazsazazz
gggggggg8ggggggggggggggggggggggggggg
§3§3§§33833§8§§§8§
gggggggggggggggggg
EEEEEEEEEEEEEEEEEEEEEEE
g;g;83§§8g3;§gg§§g;3§§§
i§é§§i§§iii§i£§£3!§§i§i
8§3383a8§§§§§s§83§3§§§§
§l3§333l33§3§§§§§§§3§§3
8833§33333¥§4¥¥3§¥33¥33ggggggggggggggggggggggg
's§§§ll§li§i§§§§§§§§§§§§§§§§§§§§9§§§§§§§§§§§§§§§;48ggqgggqgg88g88§99gq8
ggggggggggggggggggggggg
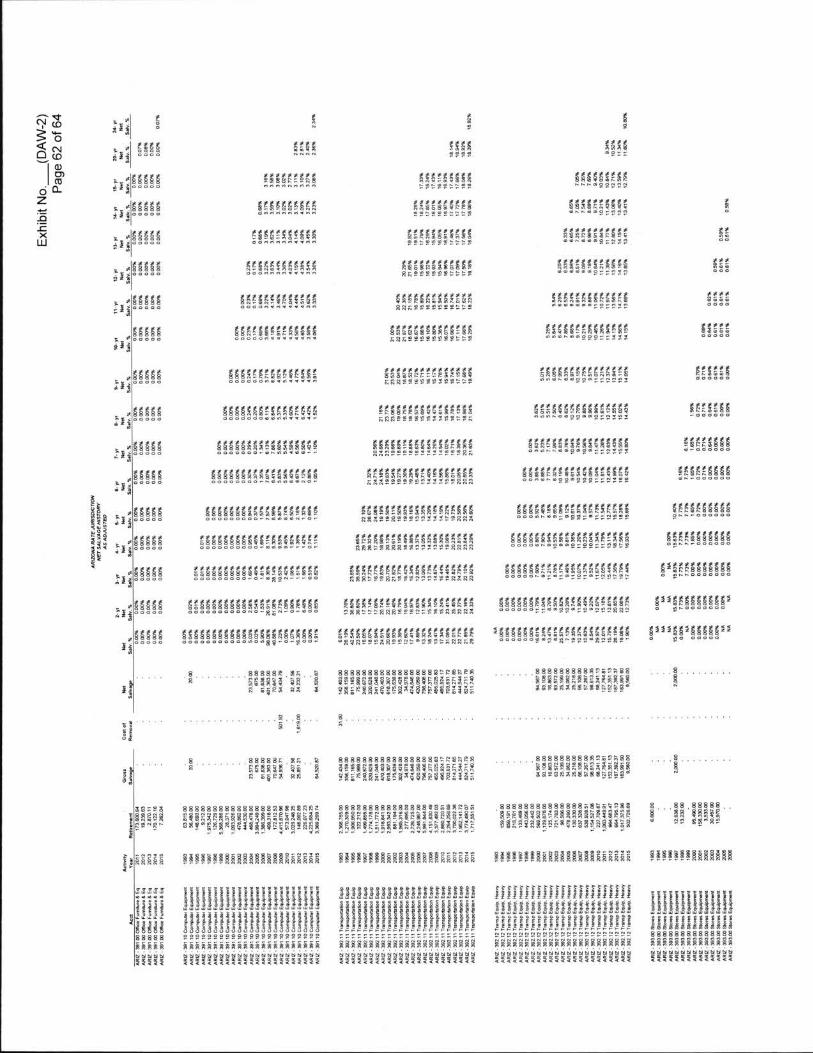
E8s.
sos:....$835no-I£388
§§§3§§§§E
o
§8§§§§§§§
§§§§§88588 §§§£§£S£E§. u~»uo~» ~o
,§§§85 §§§§§5§§!§§
§§§§§§3§§
8858339883
8888888888388883833853
67858: 75<1 cuE 1 4 0
cml m
. mo Q .2:82£3.cxUJ
$28alagggggggggggg 888888888888saasaa§§as§s8a°*=922====
:;| §ii8l £888
8:§l!§!§§
;,;ls§ss!
81il°°°°°
§,3§ss!s
gee#..cacne8888888855898 3555358888988m ...... a:n1n51858£5§§53§88n;!9gmnnu~~gs 4585584 l1n¢ao¢
iii§§:§:§§§§§§§§§§§§§§- -;~5§£!iiI'!£§ii§
oooéonnnuunqnu §§§§§§§§§§§§§5s -§§§§§415
1 as§;§::§££§§5£5£$§EE§§§
§§§§EE§§§§!§§§8 §sss§ss§ssss4as5R§2¢owg9~g!~~°s 485888
all
§83§§§8§§§§§§§§§§§€§§§§§§§§§§§§§5§§E§§§ !E§§E£§§§E£i§8§8igno2u¢»£v1m2»¢&n 455855dlsaooco
88833888§§§§§§E§§§§§§§§§§§§§E§S£!.!$5I§§E§o°oooaowo~n¢1¢|--ill{iE§§§§£§§E§§£8&N2!s 2s:::!:2°8;
§§§§3§§§§§§§§§§§i§§§§§§§§§§§§§§§§5E§§§§!§§§§§ ssss§ss§ssss§§s§ss=:§2e:e2e"::'"°§22
Hgggggg
s 488888all
§§§§§§§§§§§§§§§§§§§§§§;§5§§§§§§§§§§§3§§§§§§§§§§§ssssssss4s§ss4ss§§s§#l22222222!!II22§§81588858
888888888888888888888888888888§88888888888888888888
gif18£83
'as§8s8§s8s8sa§ssss§ss§nnn~s22ase~~:°ee2scnL #88888§9 air
s*§§§§§§§§§§§§§§§§;g§g§;§a§§§;5§§§§£EE§§§ES§§§§E§§5E§£nna=:ez;e2°~c":senzan
££§§§§§§§sss§§§s§8§a§x ,ggggga §§°°°°°
§**§§§§§§§§§'§§§§§§§§§§§§§§§8§§§§§§ssssssssssazs§ss§:s;sanon~~~gugln¢n:¢wwgmuk;§§§§§§§§§§g383§§§§§§§§R ,gggggé;§°°°°°
§**'§§'§§§§§*'=§§§§§§£§s£a4§ss£s£sss§QO060¢¢l0¢nh¢Uel8NW§Dv
£!$§§E££§£§8§§55Ei§§E$E°nvns=":z°°~~°»°»=;au;n§§§§§§§§§§§§§§§§E§§5§§3,§§§§§
13°
....8........sa..s93 g
88sssa8aan::ca9si§§5!Ea§Eaai4i§il 82B8I28$8lR$B8°
8 s8888888888a8a88~rs=en8!§i$§38§§5£!§§§§i§§i533§8"2§i§38§*E9EWW¥§3§§i
.a8888:.$85335 52n :523 so*s
8a5
8. ......... 8 .. . a
q,.EE
§!i§!§8§E8i!§¥i§.saa
.82
.8888888888252k88
anesnxnsansgggg'
sa8aa88a8ss88s8sa~ru::naasssszaaasssavssiiixss!3E*2§i€3E§*5S§E9¥E83§i
sa8sa:.x:ssaaaa iin 552: an§
S3.
.8a.8ass8go Qsaas:M is°aeE§§E§EEi§§8¥Eii§sEz§§i§
c
38:2855888n:~g~
sssaassasasssassaascal§§E!§9§§52§§§§H§§$3E=E§aaa9as§§a=seaa§a8ii3§
aaassssaaassssslsaaacsa
i§§siE3§ist;£g§§§§8§§§§
sasaasssasassassasnszn:83i8iE§a§§§E2§aaaa3§Ei§8$!°£8§*§E3¥i§§EQa§!§§l- 0 - n- n ..I
§§Q;§s§§ssaasa§!§§§!!§88§8§§E§§3§E§§38§£!E§§§E8§§8§E§§3§§§§§§!!!§§!8§E§8E§§§§E§§8é§:noun
ggsaaea
§sss§a§asssss§ssssasss§
l3l§§§;§§§§l§l
3i3533£§§i3ii§
33§3383§333§§§
gggggggggggggg
iiiiiiiiiiiiiiiiifliiii§§§§§§§§§§§§§§§§§§§§§!§
ggmgsgggggggegggsgsgg
§g§§§§gg§g§§§§§§§g§§gg§ggggggggggggggggggggggg
Eéiiiiiiiiliiiiiiiiiiii
§§§§§§E§§§§§§§§§§§§§§§§
ggggggggggggggggggggggg
3§88§§§§§§§§§§§§3lS§§3§
33§33§§333§3§§3§38§3§3§
,§§§§§
£8558
;;8;8
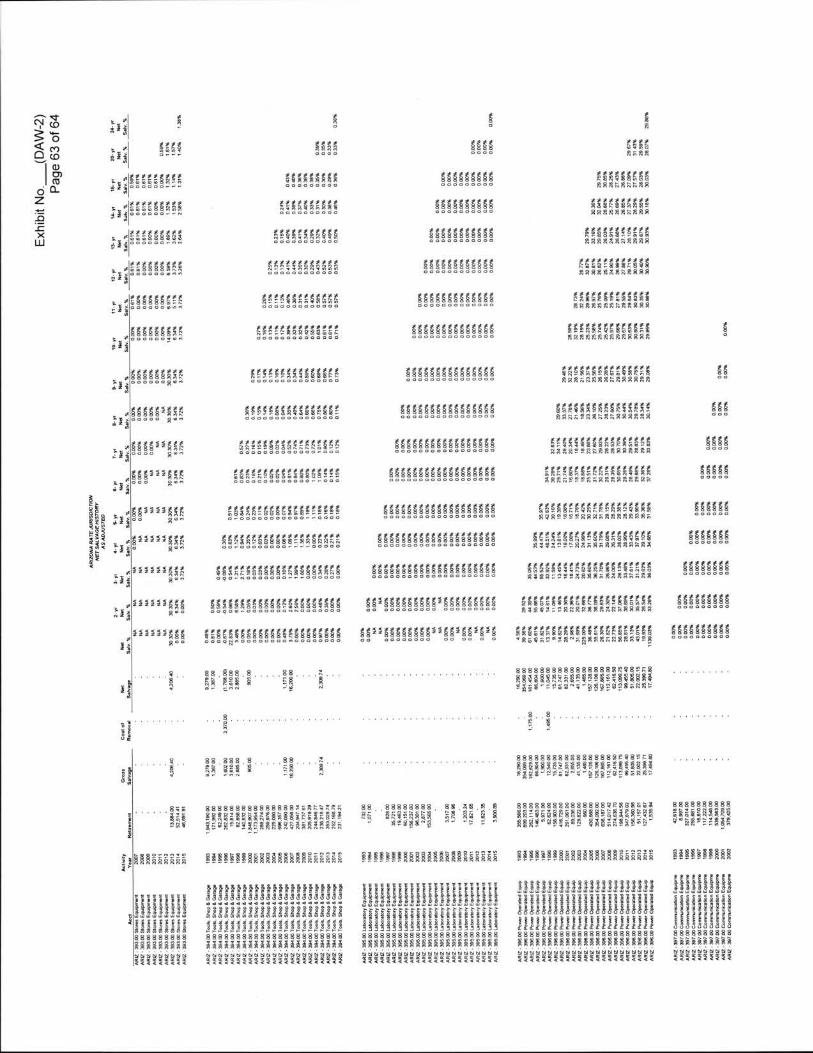
s5g ss
n A, 4
88885888 £5888388§££§1 u
¢l3
888888888888588585§§55£EE§§nnszxnnas
'~<r'F Ia3: 15<(<4C3<o
CDl m
. mo Q.2:
8888888888s:sass;§a4o a o oaeoonaassssaasasauznnxazna
888858885888855338888888888885858nnsszzazens
3:£3.CxUJ
; ;§asas§ss;
s 4888888888, § § ~ ° » » - - ~
318888888885
888888888888888888888888sess8§sss8s§nuannznzzasan 4328888858~I30889990
8888888888888888888885885060099886696008888888885588aunznnnnanasag 4888888888§§=¢°°°°.»»
888888888888888§§§3§5§§§§§3§§§§!£§5$E§é§§£5nusnnnnnsxaaan. ,ggggggggg
$85 '
8§§§§§§§§§§§§§§§§ ¢ss§;;¢aaas§sa§zaxzncsnznaxame§§3§§§8§8§E§§§§,§§§§§§sis§!§°°°°°°*°"
888§§§§§§§§§§§§§§§§ sassassassasasasz2:;°nz=z=naan=a§s;§4ss§ssss§§ssoooaaaooooesoeoe£ 4888585838iXjnooo gen
8888§§§§§§§§§§§§§§§§§ssssss§sasassasssaxsasennszasasznn§§3§§§§§§§§§§8§§§»§§§s==§8§
85855§§§§§§§§§§§§§§§§§§;sssss§;sss§aass§sxazassenaazsszzrza3§§§§§§§§§§§§§§§3§Gan
§15°°=°
*§§§§i§§i£s Ecoall
5888888888888888888888888 E§8S§E§5§EE8£§$$§§$naaeesesauannnznnna888883888888888888§§§;;;;;»;§x§=° g r
888888888888888888888888888 §§E£8§§5§E§!§£§E5§§in:s;°2~8:aaasxsnn=na§sssas§ass§ss§a§ss2san-oooooco _.. oooao
,§§§§;§§;8Gan
§
gE
§8§§§§§§§§§§§§§§§§§§§§§§§§§§§ §&§s§sss£$§£§s§ss§£s§£839:222&R2!32§88338l$§i8$§§§§§§§§i§§§3§§§
§1§°
454445 ais; §i§
888888888§§'§§§§§§§§§'§§§§§§§§§&$§EE§§§§8EE§5§€§££E$£8389$22§2HR38§NRR9989§§§§§§§§§§§§§§§§§§§§§§
,a§§§4§§§§355
888888888888"88888888"88*88§8'88888§§88888888888888888§!§§§§§§§
Hoe8§£58§§£E§S§¥5§8E§E388§'s;9;"°:n~a§nnz;zsnaQ=g13
Q...*...n
...9..8
88.
8888§88.8
88 838 §
sssssaasssssasasarssezs§§§§§88:43!¥8§§9€§¥§§ii2§§8'-2:s~=;§;:8:a;nn=
*s8 8g §
.s2qnEl
»
d88.888 e88 888 E
9g
88
88saesasssesssssaasnssezs2§E§§385§§8¥§§i=¥§9§§ii2§§8'EE53"$'§§§¥02lE§R2
83
§§83E§EE§§§§§§53§iEl§8§ea.£8
as.zu.n.a
88 go g g
8saa8ssssa8a88a¢2:s:s::
8§§!"d8§888 g8888g58:5=
8=slaics
.assesses84924858res;x~g
85888888888i8i85Xi§3~°aa=2eags
88888888888s888::nn=:r:8iE8i§§a&a5§n§§a:a!a§!!3:98-8!!E!§§¥Ew§s§i§3%nE
3
¥i¥!§!§§EE8§¥§§§§§8E8§§§§§8E§§3§3§!¥!§!!3§E3§E8E§83§§§§§ggggggggggggggggggggggg§3§88§88§é3l
§§§8185§§§
lm I'll§ §;llllllggglil§lll3 8888888888iiiiazaziaéé&ééé&éé&ssssssssss
§§§§§§§§§§§§§§§§§§§§§§§
i§E8§i§i1££§i}3§§§3§ii3
3}.3£3}§H3£3¥¥132§§§I23
§3§3§3§88§§383§3333§§33ggggggggggggggggggggggg
§llil§8§§§3§3§§ll§S§§§§
e Siiiifif I E iii
§§§83§33§§§§§8§§§§2§§§3
ggggggggggggggggggggggg
§§§§§§3§3§§§§§§§§§§33l§
ggggggggggggggggggggggg3353333333§§!3!§833333388a88888888888888888888¥34i4%i%4%444%554¥4i4%4ggggggggggggggggggggggg
,33§§El§8
858888888gggggggggggggggggg

*t6§<08;
ga
s==§~~o a o o
8
8388
8
8888
888888888
8888888885
888888888
8888888888
888888888
8888888888
;,9
3,8
ft
3,9
888888888888888888888888888888888
15<1 <rcm Ia
u>l m
. mo n .2:r:AE.cXup 383
888888888888888888888888
88888888888888888888888888
n ,'§§§i§§si§sss~*s oeoeoeeaoaoo
x #88§§§§§§§§§§8!§eoca¢aaooocoo
8888888888888888888888888888n »8888888888888835
888888888888888888888888888888S ,§§§§§§s§§§§§§iieoaoooooeocan
88888888888888888888888888888888; :§§8§8§§§§888§il3G¢99¢DO¢¢°¢G9
8888888888888880888888888888888888
888888888888888888888888888888888888
8!§8888888888888
f8888888888888835
8888888888888888888
88888888888888888888
8888888888888888888
88888888888888888888
8 :§§9°g¢66905¢g¢°
4,3532
8888888888888888888888888888888888'8888888
88 »§§§§§§§§888§§
,.8888888888888Gs 4 3
1 2,§8888888888888
888888888888888888888888888*8888888'*8888888
'88§8**888888"'8§88888 888'8888888888888888888
l 4§§8§§8§§8§8§§!j o o a o e ceeo¢oo o
»8888888888888kg °
8
858.
*s
ETa
88§
8
88.85 8
888888
saasaassaasascseuaaE9=3§E£§5§1§5§§EQ8!a~v5§ezss:n:2n:s="z
A 93828I !§E118 Se°~§
.ssaaasQaiiaakg=a§~
s 888aa:B&s8aa8!§§3i6i§§38§§i§w§e!§**E§§i=
88888!888888888888883§88!88§888888888888883§888!888888888§888
8§l§§§8§§§l*lllllll""333§3§8""
Hli8888333§§88i§li;U8=3l3 I Lil
§§§8§§§§8§8l8ll§§§§§§§§
8883883
1512: s
88888888888888888888883
WWWUW u 8 WW 83888'8' gr
88884 t I 8::::!».. .,83§3»,...2 ana2z2es8aee2aznasseaaiaa§ixa§§ai§naaaxxaaa§aééééééééééééééééééééééasssssssssssssssssszssss
§885888888888
as 3388
m 8 8 8 0 8 8 8 m
Exhibit No. (DAW-3)Page 1 of 44
SOUTHWEST GAS CORPORATIONSYSTEM ALLOCABLE
DEPRECIATION RATE STUDY
AT DECEMBER 31, 2011
3.28.12
ALLIANCEc o n s u l m n l l i a m o u r
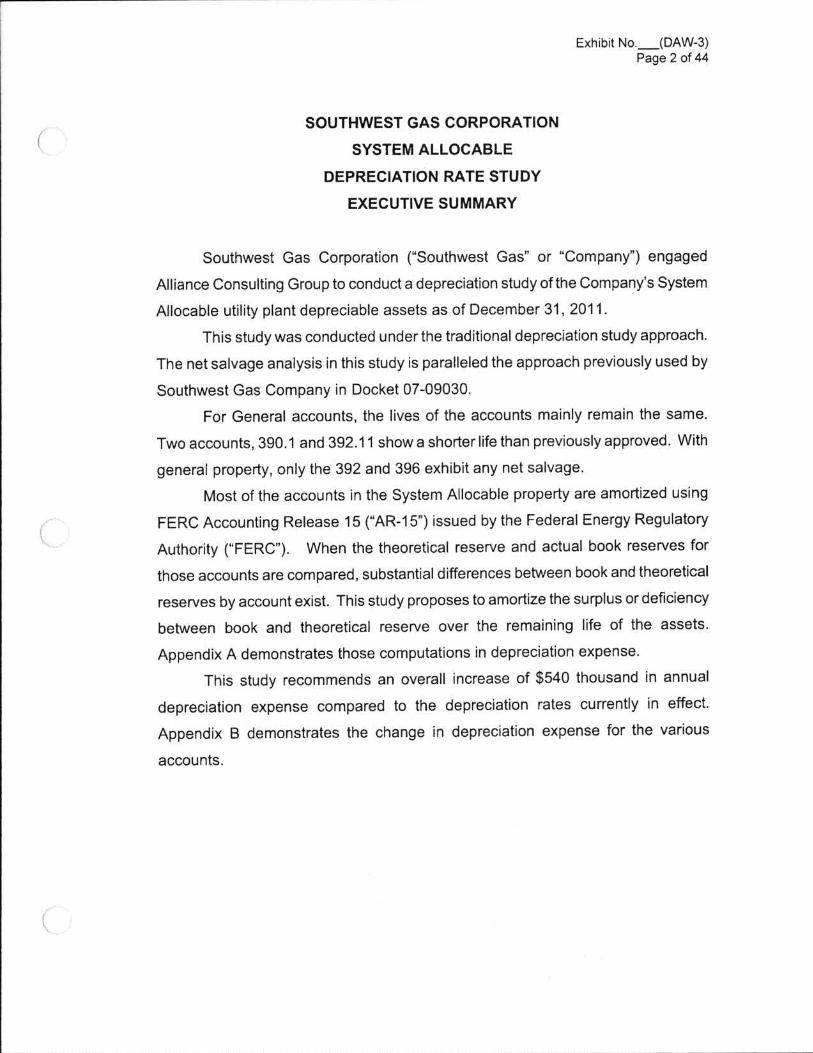
Exhibit No.__(DAW-3)Page 2 of 44
SOUTHW EST GAS CORPORATION
SYSTEM ALLOCABLE
DEPRECIATION RATE STUDY
EXECUTIVE SUMMARY
Southwes t Gas Corpora t ion ("Southwes t Gas" or "Company") engaged
Alliance Consulting Group to conduct a depreciation study of the Company's System
Allocable utility plant depreciable assets as of December 31, 2011 .
This study was conducted under the traditional depreciation study approach.
The net salvage analysis in this study is paralleled the approach previously used by
Southwest Gas Company in Docket 07-09030.
For General accounts, the lives of the accounts mainly remain the same.
Two accounts, 390.1 and 392.11 show a shorter life than previously approved. With
general property, only the 392 and 396 exhibit any net salvage.
Most of the accounts in the System Allocable property are amortized using
FERC Accounting Release 15 ("AR-15") issued by the Federal Energy Regulatory
Authori ty ("FERC"). When the theoretical reserve and actual book reserves for
those accounts are compared, substantial differences between book and theoretical
reserves by account exist. This study proposes to amortize the surplus or deficiency
between book and theore t i ca l reserve over the remaining li fe o f the asse ts .
Appendix A demonstrates those computations in depreciation expense.
This s tudy recommends an overall increase of $540 thousand in annual
deprec ia t ion expense compared to the deprec ia t ion ra tes current ly in e f fec t .
Appendix B demonstrates the change in deprec ia t ion expense for the various
accounts.

Exhibit No. (DAW-3)Page 3 of 44
Index for Statements A, B & C
Statement A (1)(a) see Appendix A on page 27 and Appendix C on page 31.
Statement A (1)(b) see Appendix C on page 31.
Statement A (1)(c) see Appendix C on page 31.
Statement A (1)(d) see Appendix B on page 29.
Statement B see pages 3 through 9.
Statement C see pages 15 through 27.
l
ill
i
l
l
ii
l
l
lllllil
ll
Exhibit No. (DAW-3)Page 4 of 44
SOUTHWEST GAS CORPORATION
SYSTEM ALLOCABLE
DEPRECIATION RATE STUDY
AT DECEMBER 31, 2011
Table of Contents
GENERAL 3Definition 3Basis of Depreciation Estimates 3Survivor Curves 4Actuarial 6
7Average Life Group DepreciationTheoretical Depreciation Reserve
DETAILED DISCUSSION 10Depreciation Study Process 10Functional Rate 13Remaining Life Calculation 15Life 15Salvage 22
Appendix A - Computation of Depreciation Accrual Rates........................... 27Appendix B - Comparison of Depreciation Accrual Rates............................29Appendix C - Current Commission Approved 31Appendix D - Net Salvage 33
ExMWt No (DAWLPage 5 of 44
PURPOSE
The purpose of this study is to develop depreciation rates for the depreciable
property as recorded on Southwest Gas' books at December 31, 2011 for the
System Allocable Division. The account based depreciation rates were designed to
recover the total remaining u depreciated investment, adjusted for net salvage, over
the remaining life of System Allocable Division's property on a straight-line basis.
Non-depreciable property and property which is amortized such as intangible
software were excluded from this study.
System Allocable contains general property that supports the operations of
Northern Nevada and Southern Nevada Divisions of Southwest Gas.
1

Exhibit No. (DAW3)Page 6 of 44
STUDY RESULTS
Overall depreciation rates for all Southwest Gas System Allocable depreciable
property are shown in Appendix A. These rates translate into an annual
depreciation accrual of $4.8 million based on Southwest Gas' depreciable
investment at December 31, 2011. The annual equivalent depreciation expense
calculated by the same method using the approved rates was $4.3 million.
Appendix A demonstrates the development of the annual depreciation rates and
accruals. Appendix B presents a comparison of approved rates versus proposed
rates by account. Appendix C presents a summary of mortality and net salvage
estimates by account.
Consis tent with FERC Rule AR-15, this depreciation study develops
depreciation expense for Vintage Group Amortization in Accounts 391, 393-395, and
397-398.00. This process provides for the amortization of general plant over the
same life as recommended in this study (with a separate amortization to allocate
deficit or excess reserve). At the end of the amortized life, property will be retired
from the books. Implementation of this approach did not affect the annual expense
accrued by Southwest Gas and provides for the timely retirement of assets and the
simplification of accounting for general property. The Public Utilities Commission of
Nevada ("PUCN") approved this approach in the Company's last case.
l
I\2
Exhibit No. (DAW-3)Page 7 of 44
GENERAL DISCUSSION
Definition
ll
The term "depreciation" as used in this study is considered in the accounting
sense, that is, a system of accounting that distributes the cost of assets, less net
salvage (i f any), over the estimated useful li fe of the assets in a systematic and
rat ional manner. I t is a process of allocat ion, not valuat ion. This expense is
systematically allocated to accounting periods over the li fe of the properties. The
amount allocated to any one accounting period does not necessarily represent the
loss or decrease in value that will occur during that particular period. The Company
accrues depreciation on the basis of the original cost of all depreciable property
inc luded in each func t iona l proper ty group. On re t i re me nt t he f ul l c o s t o f
depreciable property, less the net salvage value, is charged to the depreciation
reserve.
Basis of De recitation Estimates
i
I
The s tra ight- line, broad (average) li fe group, remaining-li fe deprec iat ion
system was employed to calculate annual and accrued depreciation in this study. In
this system, the annual depreciation expense for each group is computed by dividing
the original cost of the asset less allocated depreciation reserve less estimated net
salvage by i ts respective average li fe group remaining li fe. The result ing annual
accrual amounts of all depreciable property within a function were accumulated, and
the total was divided by the original cost of all functional depreciable property to
determine the deprec iat ion rate. The ca lcula ted remaining li ves and annua l
depreciation accrual rates were based on attained ages of plant in service and the
estimated service life and salvage characteristics of each depreciable group. The
computations of the annual functional depreciation rates are shown in Appendix A
and remaining li fe calculations are shown in Appendix B.
Ac tuar ia l ana lys is was used wi th each account wi thin a func t ion where
suf f i c ient da ta was ava i lable , and judgment was used to some degree on a ll
accounts.
Q 3
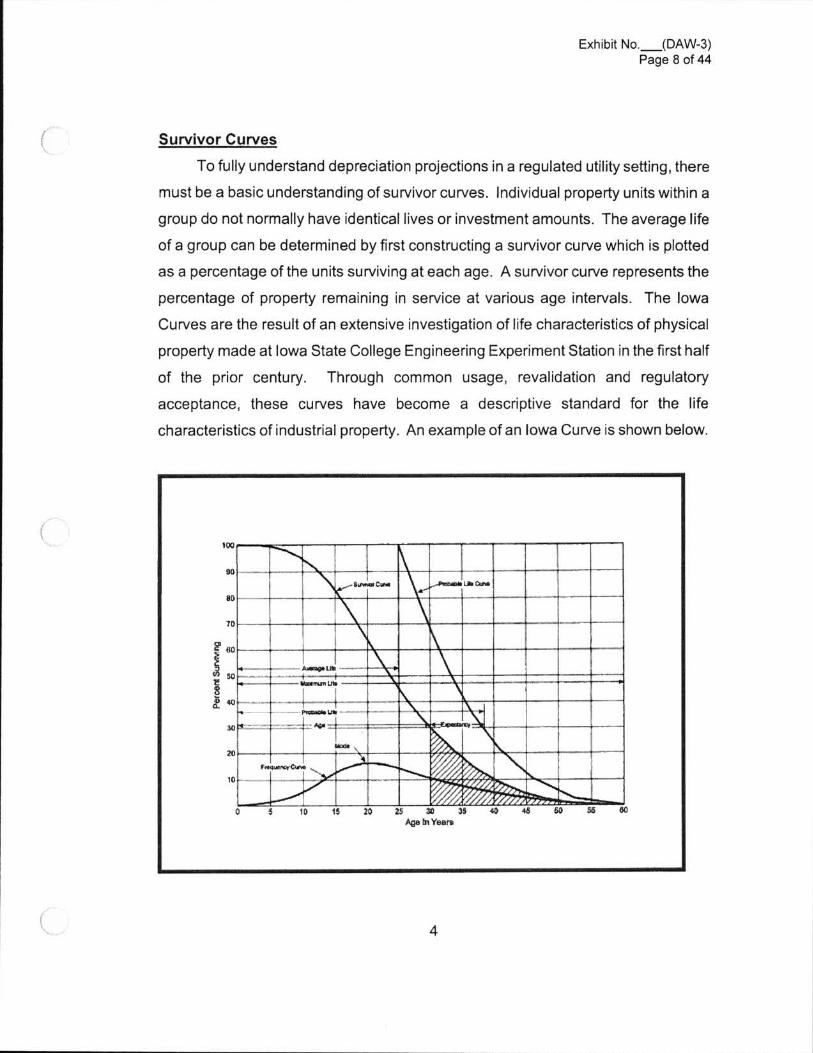
Exhibit No. (DAW-3)Page 8 of 44
Survivor Curves
To fully understand depreciation projections in a regulated utility setting, there
must be a basic understanding of survivor curves. Individual property units within a
group do not normally have identical lives or investment amounts. The average life
of a group can be determined by first constructing a survivor curve which is plotted
as a percentage of the units surviving at each age. A survivor curve represents the
percentage of property remaining in service at various age intervals. The lowa
Curves are the result of an extensive investigation of life characteristics of physical
property made at Iowa State College Engineering Experiment Station in the first half
of the pr ior century. Through common usage, revalidation and regulatory
acceptance, these curves have become a descriptive standard for the life
characteristics of industrial property. An example of an Iowa Curve is shown below.
l
lq 4
W
.- v o - - IA lugnuh
www__ |
I
in:-anus
Ae-
una:
4._.
. k4%_ in `%%%z,,,...§ _
Ei§85fE8EI'E===9=£====E:E E =====. n* =§ `~=1l11lE. =§g9Eg==g,_ills 1as 40 45 50 as to
wa
so
an10
2 ea§so8no
so20
fn~aue~wC~nn\10 _
0 5 10 is to 25 38Ago MYeln
4

Exhibit No. (DAW-3)Page 9 of 44
There are four families in the Iowa Curves that are distinguished bathe relation
of the age at the retirement mode (largest annual retirement frequency) and the
average life. For distributions with the mode age greater than the average life, an
"R" designation (i.e., Right modal) is used. The family of "R" coded curves is shown
below.
'aT l2.i. l
i
,iIn\14-
\ \
E//A i\9_
\§-'g IEEEEEEEEEEE41 ::EE"iE§EI-EEu :== 14455;-
nu nm• I I 11 ll 11 m -4;nl-nun-_nh
"To
too
90
to
70
g 00w
8
l
l
1l
l.l
'w
mum'WS
B l lln§nlll l l l-l-»--l=1\'ll ll --11-1-llll ----=-=lll _--_ lill lllll--l-l\_!l---
225 250 275 300
i
\
50
'é40
30
20
10
0 25 so 75 100 125 150 175 200mope1cantofAvoragoL!fa
i
l
l
lll
l1
l
l
l
l1
l
lil
Similarly, an "S" designation (i.e., Symmetric modal) is used for the family
whose mode age is symmetric about the average life. An "L" designation (i.e., Left
modal) is used for the family whose mode age is less than the average life. A
special case of left modal dispersion is the "O" or origin modal curve family. Within
each curve family, numerical designations are used to describe the relative
magnitude of the retirement frequencies at the mode. A "6" indicates that the
retirements are not greatly dispersed from the mode (i.e., high mode frequency)
while a "1 " indicates a large dispersion about the mode (i.e., low mode frequency).
For example, a curve with an average H; of 30 years and an "LE" dispersion is a

Exhibit No. (DAW-3)Page 10 of 44
moderately dispersed, left modal curve that can be designated as a 30 LE Curve.
An SQ, or square, survivor curve occurs where no dispersion is present (i.e., units of
common age retire simultaneously).
Most property groups can be closely fi tted to one Iowa Curve with a unique
average service li fe. The blending of judgment concerning current conditions and
future trends along with the matching of historical data, permits the depreciation
analyst to make an informed selection of an account's average life and retirement
dispersion pattern.
Actuarial Analysis
Actuarial analysis (retirement rate method) was used in evaluating historical
asset re t i rement experience where v intage data were avai lable and suf f ic ient
retirement activ i ty was present. In actuarial analysis, interval exposures (total
property subject to retirement at the beginning of the age interval, regardless of
vintage) and age interval retirements are calculated. The complement of the ratio of
interval retirements to interval exposures establishes a survivor ratio. The survivor
ratio is the fraction of property surviving to the end of the selected age interval, given
that it has survived to the beginning of that age interval. Survivor ratios for all of the
available age intervals were chained by successive multiplications to establish a
series of surv ivor fac tors , co llec t ive ly known as an observed li fe table. The
observed life table shows the experienced mortality characteristic of the account and
may be compared to standard mortali ty curves such as the lowa Curves. Where
data was available, accounts were analyzed using this method. Placement bands
were used to i llustrate the composite history over a specific era, and experience
bands were used to focus on retirement history for all vintages during a set period.
The results from these analyses for those accounts which had data sufficient to be
analyzed using this method are shown in the Life Analysis section of this report.
6

Exhibit No. (DAW-3)Page 11 of 44
Judqment
Any depreciation study requires informed judgment by the analyst conducting
the s tudy. A knowledge o f the property be ing s tudied, company po lic ies and
procedures, general trends in technology and industry practice, and a sound basis of
understanding deprec iat ion theory are needed to apply this informed judgment.
Judgment was used in a reas such as surv ivor curve mode ling and se lec t ion,
deprec ia t ion method se lec t ion, s imula ted plant record method ana lys is , and
actuarial analysis.
Judgment is not def ined as being used in cases where there are speci f ic ,
significant pieces of information that influence the choice of a life or curve. Those
cases would simply be a reflection of specific facts into the analysis. Where there
a re mult i ple f ac to rs , activities, actions, property characterist ics, statistical
inconsistencies, implications of applying certain curves, property mix in accounts or
a multitude of other considerations that impact the analysis (potentially in various
directions), judgment is used to take all of these factors and synthesize them into a
general direction or understanding of the characteristics of the property. Individually,
no one factor in these cases may have a substantial impact on the analysis, but
overall, may shed light on the uti lization and characteristics of assets. Judgment
may also be defined as deduction, inference, wisdom, common sense, or the ability
to make sens ible dec is ions. There is no s ingle correct result f rom s tat is t ica l
analysis, hence, there is no answer absent judgment. At the very least for example,
any analysis requires choosing which bands to place more emphasis.
The es tabli shment o f appropr ia te average serv ice li ves and re t i rement
dispersions for the General Plant accounts requires judgment to incorporate the
unders tanding o f the opera t i on o f the sys tem wi th the ava i lable account ing
i nfo rma t i o n a na ly ze d us i ng t he Re t i re me nt Ra te a c tua r i a l me tho ds . The
appropriateness of lives and curves depends not only on statistical analyses, but
also on how well future retirement patterns will match past retirements.
7

Exhibit No. (DAW-3)Page 12 of 44
I Current applications and trends in use of the equipment also need to be
factored into life and survivor curve choices in order for appropriate mortality
characteristics to be chosen.
Avera eLite Grou De recitation
l
Southwest Gas was authorized to use the average life group ("ALG")
depreciation procedure in Nevada Docket 7-09030. At the request of Southwest
Gas, this study continues to use the ALG depreciation procedure to group the
assets within each account. After an average service life and dispersion were
selected for each account, those parameters were used to estimate what portion of
the surviving investment of each vintage was expected to retire. The depreciation of
the group continues until all investment in the vintage group is retired. ALG groups
are defined by their respective account dispersion, life, and salvage estimates. A
straight-line rate for each ALG group is calculated by computing a composite
remaining life for each group across all vintages within the group, dividing the
remaining investment to be recovered by the remaining life to and the annual
depreciation expense and dividing the annual depreciation expense by the surviving
investment. The resultant rate for each ALG group is designed to recover all
retirements less net salvage when the last unit retires. The ALG procedure recovers
net book cost over the life of each account by averaging many components.lli
8
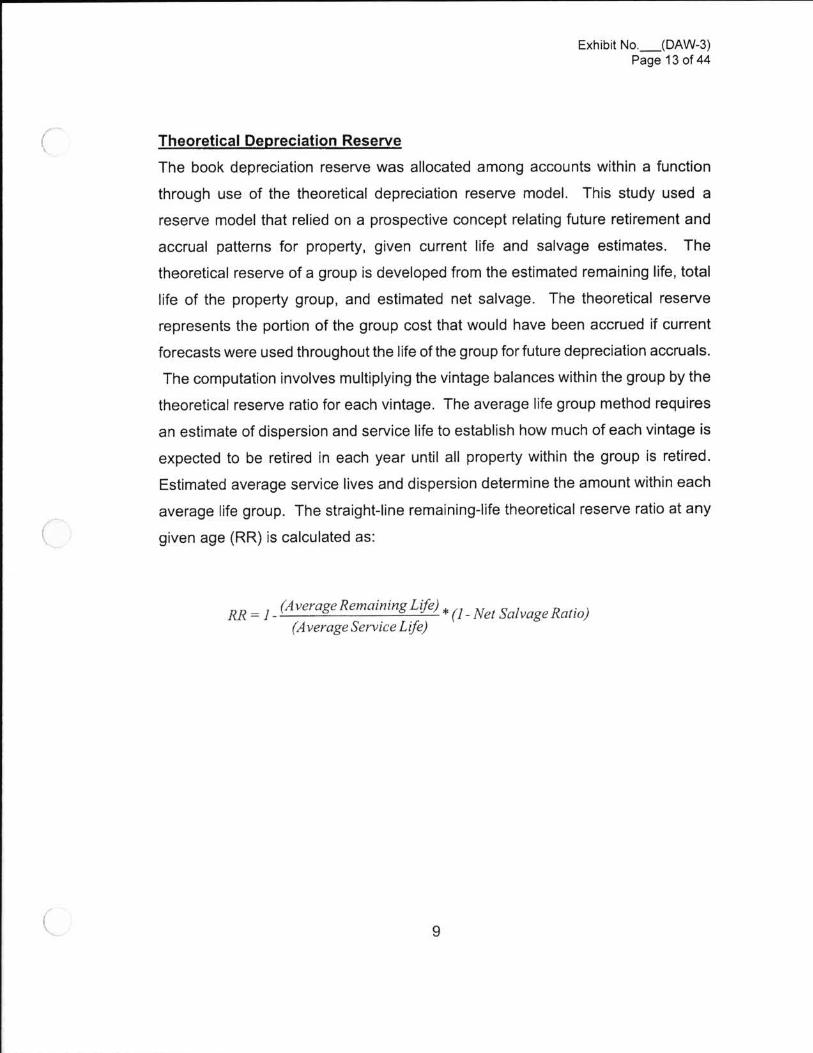
Exhibit No. (DAW-3)Page 13 of 44
Theoretical Depreciation Reserve
The book depreciat ion reserve was allocated among accounts within a function
through use of the theoret ical deprec iat ion reserve model. This s tudy used a
reserve model that relied on a prospective concept relating future retirement and
accrua l pat terns for property , given current li fe and sa lvage es t imates . The
theoretical reserve of a group is developed from the estimated remaining life, total
li fe of the property group, and est imated net salvage. The theoretical reserve
represents the portion of the group cost that would have been accrued i f current
forecasts were used throughout the life of the group for future depreciation accruals.
The computation involves multiplying the vintage balances within the group by the
theoretical reserve ratio for each vintage. The average life group method requires
an estimate of dispersion and service life to establish how much of each vintage is
expected to be ret i red in each year unti l a ll property within the group is ret i red.
Estimated average service lives and dispersion determine the amount within each
average life group. The straight-line remaining-life theoretical reserve ratio at any
given age (RR) is calculated as:
R R = ] -A R . . L .
( verge emazmng l f ) *(1-NetSczlvageRatzo)(A verge ServiceL ire)
9
III
lIl
Exhibit No. (DAW-3)Page 14 of 44
lI
DETAILED DISCUSSION
Depreciation Study Process
I
I
:r|
I
I
This depreciation study encompassed four distinct phases. The first phase
involved data collect ion and f ie ld interv iews. The second phase was where the
init ial data analysis occurred. The thi rd phase was where the informat ion and
analysis was evaluated. Once the f i rs t three stages were complete, the fourth
phase began. This phase involved the calculat ion of deprecat ion rates and the
documenting the corresponding recommendations.
During the Phase l data collection process, historical data was compiled from
continuing property records and general ledger systems. Data was validated for
accuracy by extracting and comparing to multiple financial system sources. Audit of
this data was validated against historical data from prior periods, historical general
ledger sources , and f ie ld personne l discuss ions . Thi s da ta was rev iewed
extensively to put in the proper format for a depreciation study. Further discussion
on data review and adjustment is found in the Salvage Considerations Section of
thi s s tudy . Als o a s pa r t o f t he Pha s e I da ta c o l le c t i o n pro c e s s , nume ro us
discussions were conducted with engineers and field operations personnel to obtain
information that would assist in formulating life and salvage recommendations in this
study. One of the most important e lements of performing a proper deprec iat ion
study is to understand how the Company uti lizes assets and the environment of
those assets. Interviews with engineering and operations personnel are important
ways to allow the analyst to obtain information that is beneficial when evaluating the
output from the li fe and net salvage programs in relation to the Company's actual
asse t ut i l i za t ion and env i ronment . I nfo rma t i o n t ha t wa s gle a ne d i n t he s e
discussions is found both in the Detailed Discussion of this study in the life analysis
and salvage analysis sections and also in workpapers.
10

Exhibit No. (DAW-3)Page 15 of 44
Phase 2 is where the actuarial analysis is performed. Phase 2 and 3 overlap
to a significant degree. The detailed property records information is used in phase 2
to develop observed life tables for life analysis. These tables are visually compared
to industry standard tables to determine historical life characteristics. It is possible
that the analyst would cycle back to this phase based on the evaluation process
performed in phase 3. Net salvage analysis consists of compiling historical salvage
and removal data by functional group to determine values and trends in gross
salvage and removal cost. This information was then carried forward into phase 3
for the evaluation process.
Phase 3 is the evaluation process which synthesizes analysis, interviews, and
operational characteristics into a final selection of asset lives and net salvage
parameters. The historical analysis from phase 2 is further enhanced by the
incorporation of recent or future changes in the characteristics or operations of
assets that were revealed in phase 1. Phases 2 and 3 allow the depreciation
analyst to validate the asset characteristics as seen in the accounting transactions
with actual Company operational experience.
Finally, Phase 4 involved the calculation of accrual rates , making
recommendations and documenting the conclusions in a f inal report. The
calculation of accrual rates is found in Appendix A. Recommendations for the
various accounts are contained within the Detailed Discussion of this report. The
depreciation study flow diagram shown as Figure 11 documents the steps used in
conducting this study. Depreciation Systems. page 289 documents the same basic
processes in performing a depreciation study which are: Statistical analysis,
evaluation of s tatis tical analys is , discussions with management, forecast
assumptions, write logic supporting forecasts and estimation, and write final report.
1 Public Utility Finance 8t Accounting A Reader
11

Exhibit no._(DAw-3)Page 16 of 44
CalculationData Collection
Book Depreciation Study Flow Diagram
Analysis EvaluationI II I
numuns umdswxvivms
c d zu l mxc aualxm s
ac :cum comm;
ncammnuv Oimiauu0 8 m
ev 1bmiainm ofumxlysxs resultsMd sehnim°fl1°°wliiY
chtmuinics•discussions wihucoumrxg,4\d1¢¢lil€.Pl#4\l\i1\¢ n d
epanimu pusoamel i n booknsexve posiinu*
sxlv ugzGoss hedvige l ed< on dx mavnl
'ana l innahh¢&n\am nknhsl|ow \ :Pul&0 lEnna& Anaou&(A XIAM
Figure 1
SOUTHWEST GAS DEPRECIA TION STUDY PROCESS
ll
ll
i
12
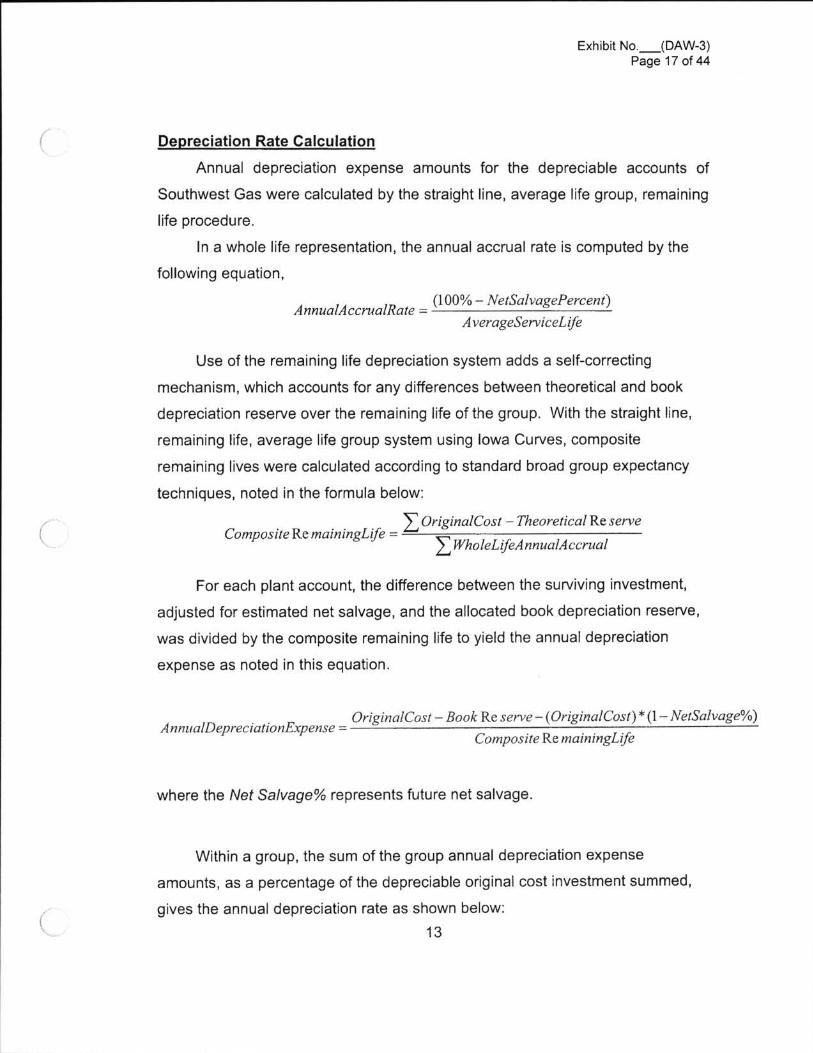
Exhibit No. (DAW-3)Page 17 of 44
De recitation Rate Calculation
Annua l deprec ia t ion expense amounts fo r the deprec iable accounts o f
Southwest Gas were calculated by the straight line, average life group, remaining
life procedure.
In a whole life representation, the annual accrual rate is computed by the
following equation,
AnnuaIAccrualRate(100% - NetSalvagePercent)
AverageServiceL{fe
Use of the remaining life depreciation system adds a self-correcting
mechanism, which accounts for any differences between theoretical and book
depreciation reserve over the remaining life of the group. With the straight line,
remaining li fe, average life group system using lowa Curves, composite
remaining lives were calculated according to standard broad group expectancy
techniques, noted in the formula below:
lComposite Re mainingLife =i
Z Origina1Cosl - Theoretical Re serve
Z WholeLifeA nnualA accruall
i
For each plant account, the difference between the surviving investment,
adjusted for estimated net salvage, and the allocated book depreciation reserve,
was divided by the composite remaining life to yield the annual depreciation
expense as noted in this equation.
AnnzIa1DepreciationExpenseOriginc11Co5t - Book Re serve - (Origina1Cost) * (l - NetSalvage%)
Composite Re mainingL 1fe
where the Net Salvage% represents future net salvage.
4
Within a group, the sum of the group annual depreciation expense
amounts, as a percentage of the depreciable original cost investment summed,
gives the annual depreciation rate as shown below:
13
Exhibit No.__(DAW-3)Page 18 of 44
2 AnnualDepreciationExpenseAnnualDepreciationRate =
Z Originc1lCost
These calculations are shown in Appendix A. The calculations of the
theoretical depreciation reserve values and the corresponding remaining life
calculations are shown in workpapers. Book depreciation reserves were reallocated
from an account level based on the theoretical reserve and the theoretical reserve
computation was used to compute a composite remaining life for each account.l
i
i
1i
ili
iiill
14
li
:Exhibit no._(DAw-3)
Page 19 of 44
i Remaininq Life Calculation
The establishment of appropriate average service lives and retirement
dispersions for each account within a functional group was based on engineering
judgment that incorporated available accounting information analyzed using the
Retirement Rate actuarial methods. After establishment of appropriate average
service lives and retirement dispersion, remaining life was computed for each
account. Theoretical depreciation reserve with zero net salvage was calculated
using theoretical reserve ratios as defined in the theoretical reserve portion of the
General Discussion section. The difference between plant balance and theoretical
reserve was then spread over the ALG depreciation accruals. Remaining life
computations are found for each account in Appendix B.
Life Anal sis
i
I.Ii
The retirement rate actuarial analysis method was applied to all accounts for
Southwest Gas. For each account, an actuarial retirement rate analysis was made
with placement and experience bands of varying width. The historical observed life
table was plotted and compared with various lowa Survivor Curves to obtain the
most appropriate match. A selected curve for each account is shown in the Life
Analysis Section of this report. The observed life tables for all analyzed placement
and experience bands are provided in workpapers.
For each account on the overall band (i.e. placement from earliest vintage
year which varied for each account through 2011 ), approved survivor curves from
Nevada Docket No. 7-09030 were used as a starting point. Then using the same
average life, various dispersion curves were plotted. Frequently, visual matching
would confirm one specific dispersion pattern (i.e. L, S. or R) as an obviously better
match than others. The next step would be to determine the most appropriate life
using that dispersion pattern. Then, after looking at the overall experience band,
dif ferent exper ience bands were plotted and analyzed: in increments of
approximately ten years, for instance 1982-2011, 1992-2011 , 2002-2011, etc. Next
placement bands of varying width were plotted with each experience band
discussed above. Repeated matching usually pointed to a focus on one dispersion
15

Exhibit No. (DAW-3)Page 20 of 44
i' family and small range of service lives. The goal of visual matching was to minimize
the differential between the observed life table and Iowa curve in top and mid-range
of the plots. These results are used in conjunction with all other factors that may
intiuence asset lives.
16
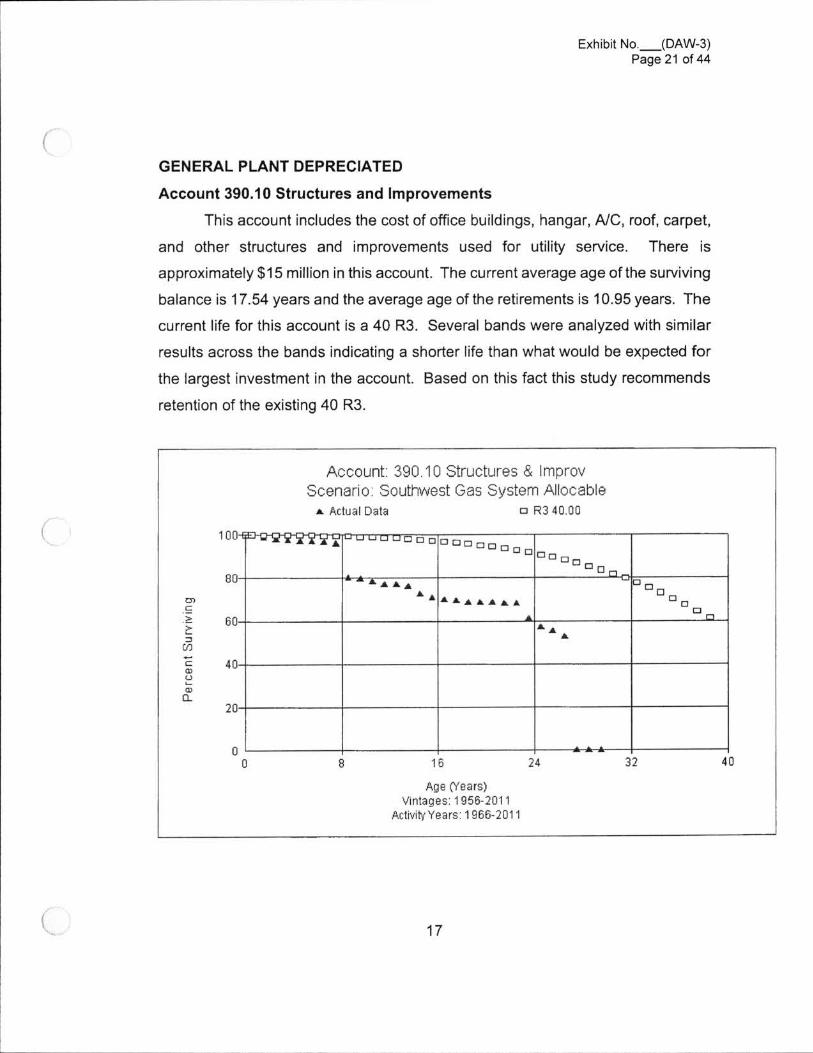
Exhibit No. (DAW-3)Page 21 of 44
(TGENERAL PLANT DEPRECIATED
Account 390.10 Structures and Improvements
This account includes the cost of office buildings, hangar, A/C, roof, carpet,
and other structures and improvements used for utility service. There is
approximately $15 million in this account. The current average age of the surviving
balance is 17.54 years and the average age of the retirements is 10.95 years. The
current life for this account is a 40 RE. Several bands were analyzed with similar
results across the bands indicating a shorter life than what would be expected for
the largest investment in the account. Based on this fact this study recommends
retention of the existing 40 RE.
Account: 390.10 Structures & ImproveScenario: Southwest Gas System Allocable
A Actual Data in RE 40.00
l I I l100
B0
UP
D CJ6JU 30095Ur: D Cl
DDuD
UD
60.z>:CD
40.-:mL)L.G)
O.20
4032241680
0
Age (Years)
Vintages: 1955201 1
Activity Years: 19662011
r
i17
!
I
I
|
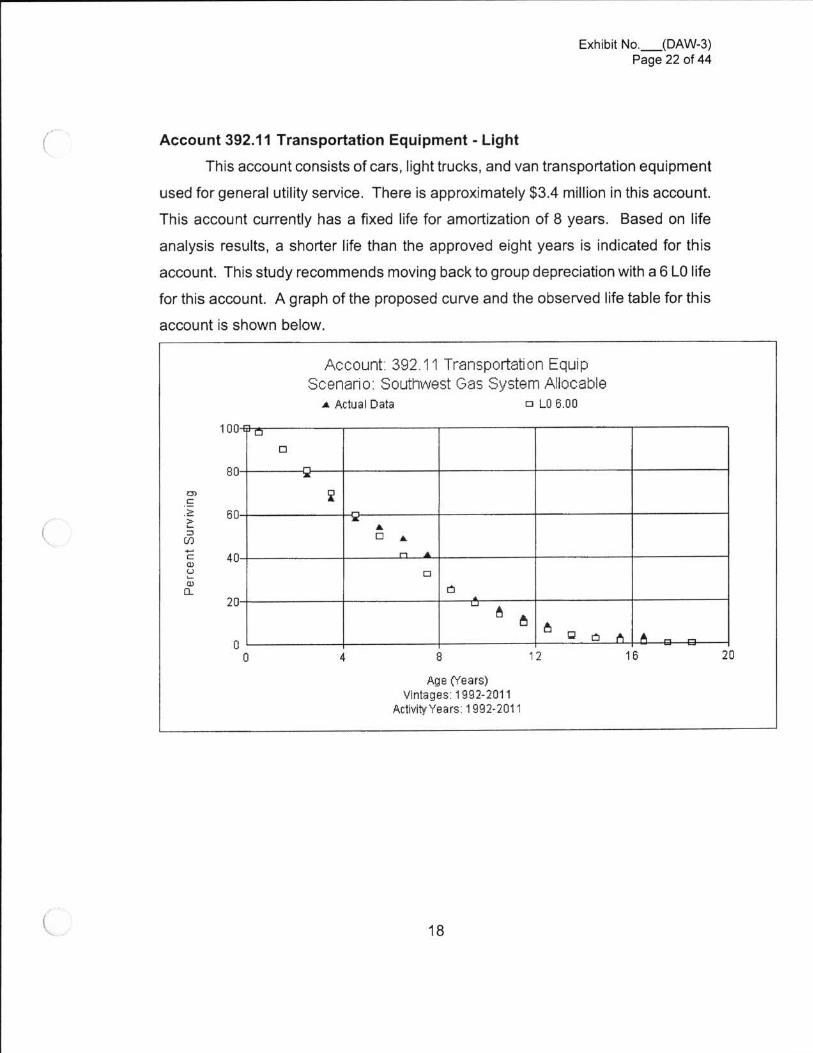
Exhibit No. (DAW-3)Page 22 of 44
Account 392.11 Transportation Equipment - Light
This account consists of cars, light trucks, and van transportation equipment
used for general utility service. There is approximately $3.4 million in this account.
This account currently has a fixed life for amortization of 8 years. Based on life
analysis results, a shorter life than the approved eight years is indicated for this
account. This study recommends moving back to group depreciation with a 6 L0 life
for this account. A graph of the proposed curve and the observed life table for this
account is shown below.
Account; 392.11 Transportation EquipScenario; Southwest Gas System Ailocable
A Actual Data D LT 6.00
100
B0
50
5)c.a>5
3cm
404-CQ)oi .m
a
20
l " -- 2 "W -
201612840
0
Age (Years)Vintages: 1992-2011
Activity Years: 1992-2011
18Q.

I
Exhibit No. (DAW-3)Page 23 of 44
Ac c o unt 392.12 Transportation Equipment - Heavy
This account consists of heavy transportation equipment used for general
uti li ty service. There is approximately $86 thousand in this account. This account
currently has a fixed life for amortization of 8 years. The life analysis results indicate
a different life than the approved eight years. This study recommends moving back
to group depreciation with an 11 L4 li fe for this account. A graph of the proposed
curve and the observed life table for this account is shown below.
A
Account : 392 .12 Trans l Equip HeavyScenario; Southwest Gas System Allocable
Actual Data I: LE 1100
GJu_
2016124 8
100
80
G O
c
2 so3
UP'E 40
o.>
Q
20
00
Age (Years)Vintages: 10882011
Actlvilyyears: 1000-2011
l
19
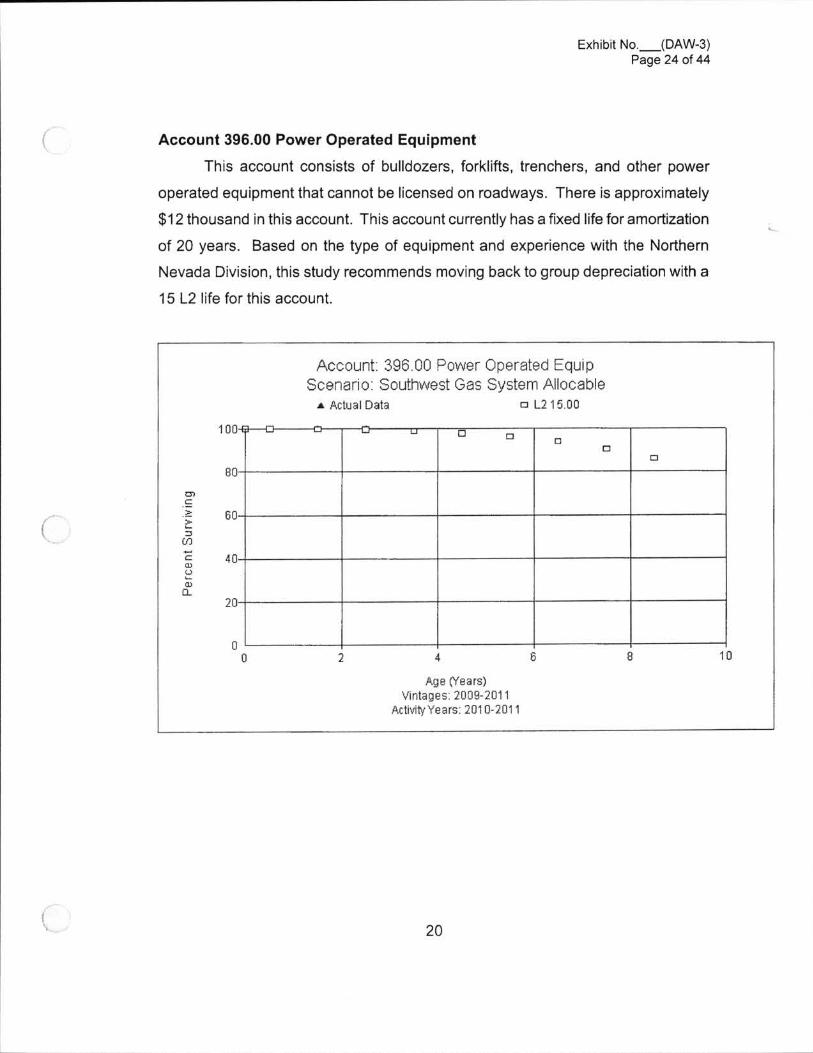
i Exhibit no._(DAw-3)Page 24 of 44
Account 396.00 Power Operated Equipment
This account consists of bulldozers, forklifts, trenchers, and other power
operated equipment that cannot be licensed on roadways. There is approximately
$12 thousand in this account. This account currently has a fixed life for amortization
of 20 years. Based on the type of equipment and experience with the Northern
Nevada Division, this study recommends moving back to group depreciation with a
15 L2 life for this account.
4
Account: 396.00 Power Operated EquipScenario: Southwest Gas System Allocable
Actual Data 13 LE 15.00
60cl
108542
100
80
I a:
8z3U]
E 402GJO.
20
00
Age (Years)Vintagesz 20092011
Activity/years: 2010-2011
20I

Exmbn No. IDAWWPage 25 of 44
GENERAL PLANT AMORTIZED
Account 391.00 Off ice Furniture and Equipment
This account consists of miscellaneous office furniture such as desks, chairs,
filing cabinets, and tables used for general utility service. There is approximately
$7.6 million in this account. This account currently has a fixed life for amortization of
15 years. This study recommends retaining the 15 year amortization life for this
account.
Account 391.10 Computer Equipment
This account consists of computer equipment used for general utility service. There
is approximately $12.6 million in this account. This account currently has a fixed life
for amortization of 5 years. This study recommends retaining the 5 year
amortization life for this account.
Account 392.21 Aircraft Equipment
This account consists of aircraft used for general utility service. There is
approximately $8.2 million in this account. This account currently has a fixed life for
amortization of 10 years. There is no retirement history for this account, and this
study recommends retaining the 10 year amortization life for this account.
Account 393.00 Stores Equipment
This account consists of stores equipment used for general utility service.
There is approximately $35 thousand in this account. This account currently has a
fixed life for amortization of 15 years. This study recommends retaining the 15 year
amortization life for this account.
Account 394.00 Tools, Shop, and Garage Equipment
This account consists of various items or tools used in shop and garages
such as air compressors, gr inders, mixers, hoists, and cranes. There is
approximately $402 thousand in this account. This account currently has a fixed life
2 1

Exhibit No. (DAW-3)Page 26 of 44
This study recommends retaining the 15 yearfor amortization of 15 years.
amortization life for this account.
Account 395.00 Laboratory Equipment
This account consists of laboratory equipment used in general utility service. There
is approximately $410 thousand in this account. This account currently has a fixed
life for amortization of 20 years. This study recommends retaining the 20 year
amortization life for this account.
Account 397.00 Communication Equipment
This account consists of miscellaneous communication equipment used in
general utility service. There is approximately $5.3 million in this account. This
account currently has a fixed life for amortization of 15 years. This study
recommends retaining the 15 year amortization life for this account.
< Account 397.20 Telemetry Equipment
This account consists of telemetry equipment used in general utility service.
There is approximately $345 thousand in this account. This account currently has a
fixed life for amortization of 6 years. This study recommends retaining the 6 year
amortization life for this account.
Account 398.00 Miscellaneous Equipment
This account consists of miscellaneous equipment used in general utility
service. There is approximately $792 thousand in this account. This account
currently has a fixed life for amortization of 15 years. This study recommends
retaining the 15 year amortization life for this account.
Salvaqe Analysis
When a capital asset is retired, physically removed from service and finally
disposed of, terminal retirement is said to have occurred. The residual value of a
22
Exhibit No. (DAW-3)Page 27of44
terminal retirement is called gross salvage. Net salvage is the difference between
the gross salvage (what the asset was sold for) and the removal cost (cost to
remove and dispose of the asset). Salvage and removal cost percentages are
calculated by dividing the current cost of salvage or removal by the original installed
cost of the asset.
The net salvage analysis uses the history of the individual accounts to
estimate the future net salvage that Southwest Gas can expect in its operations.
As a result, the analysis not only looks at the historical experience of Southwest
Gas, but also takes into account recent and expected changes in operations that
could reasonably lead to different future expectations for net salvage than were
experienced in the past. Recent experience is generally more heavily weighted
in making net salvage recommendations than experience several years in the
past.
Salvage Characteristics
<Q For each account, data for retirements, gross salvage, and cost of removal
for each plant account adjusted as discussed above was derived from 1987-2011 .
Moving averages, which remove timing differences between retirement and salvage
and removal cost, were analyzed over periods varying from one to 10 years.
GENERAL PLANT
The accounts within the general plant have been split into two categories,
depreciated and amortized. For accounts that are depreciated 1390401 account
analysis discussions are presented first. For amortized accounts (391 .00 - 398.00)
they all have a 0 percent net salvage factor, except for 391.10. Individual net
salvage analysis for each account is found in Appendix D.
De reciated Accounts
Account 390.10 Structures-Owned
This account includes any salvage and removal cost related to structures
23

Exhibit No. (DAW-3)Page 28 of 44
used for general utility operations. The currently authorized net salvage rate for this
account is 0 percent. This study recommends retaining the existing 0 percent net
salvage rate for this account.
Account 392.11 Transportation Equipment - Light
This account inc ludes any salvage and removal cost related to light
transportation equipment used in general operations. The currently authorized net
salvage rate for this account is 20 percent. Based on the overall analysis,
expectations ad judgment, a 17 percent net salvage is recommended for this
account
Account 392.12 Transportation Equipment - Heavy
This account includes any salvage and removal cost related to heavy
transportation equipment used in general operations. The currently authorized net
salvage rate for this account is 20 percent. Based on the overall analysis,
expectations and judgment, a 10 percent net salvage is recommended for this
account
Account 396.00 Power Operated Equipment
This account includes any salvage and removal cost related to bulldozers,
forklifts, trenchers, and other power operated equipment. The currently authorized
net salvage rate for this account is 0 percent. Based on the experience in other
divisions of Southwest Gas, this study recommends 15 percent net salvage for this
account
Amortized Accounts
Account 391.00 Office Furniture and Equipment
llll
l
This account includes any salvage and removal cost related to miscellaneous
office furniture such as desks, chairs, filing cabinets, and tables. The currently
authorized net salvage rate for this account is 0 percent Based on the overall
24
ll
l
l
l
1
ll
lWl
l
llll

Exhibit No. (DAW-3)Page 29 of 44
analysis, expectations and judgment, a 0 percent net salvage is recommended for
this account.
Account 391.10 Computer Equipment
This account includes any salvage and removal cost related to computer
equipment used in general operations. The currently authorized net salvage rate for
this account is 0 percent. The overall analysis would indicate a 0 percent net
salvage or barely 1 percent. Based on discussions and analysis that some salvage
can be received and for consistency with the South and North recommendations,
this study recommends moving to 1 percent net salvage at this time.
iiAccount 392.21 Aircraft Equipment
This account consists of aircraft used for general utility service. Based on
information from aircraft manufacturers, this study recommends a 60 percent
positive net salvage for this account.
Account 393.00 Stores Equipment
This account includes any salvage and removal cost related to stores
equipment. The currently authorized net salvage rate for this account is 0 percent.
Based on the overall analysis, expectations and judgment, a 0 percent net salvage
is recommended for this account.
Account 394.00 Tools, Shop, and Garage Equipment
This account includes any salvage and removal cost related to various items
or tools used in shop and garages such as air compressors, grinders, mixers, hoists,
and cranes. The currently authorized net salvage rate for this account is 0 percent.
Based on the overall analysis, expectations and judgment, a 0 percent net salvage
is recommended for this account.
25

Exhibit No. (DAW3)Page 30 of 44
Account 395.00 Laboratory Equipment
This account includes any salvage and removal cost related to laboratory
equipment. The currently authorized net salvage rate for this account is 0 percent.
Based on the overall analysis, expectations and judgment, a 0 percent net salvage
is recommended for this account.
Account 397.00 Communication Equipment
This account includes any salvage and removal cost related to miscellaneous
communication equipment. The currently authorized net salvage rate for this
account is 0 percent. This study recommends retention of the 0 percent net salvage
for this account.
Account 397.20 Telemetry Equipment
This account includes any salvage and removal cost related to telemetry
equipment. The currently authorized net salvage rate for this account is 0 percent.
This study recommends retaining the approved 15 percent net salvage for this
account
Account 398.00 Miscellaneous Equipment
This account includes any salvage and removal cost related to miscellaneous
equipment. The currently authorized net salvage rate for this account is 0 percent.
Little salvage or removal cost is expected for these assets. Based on the overall
analysis, expectations and judgment, a 0 percent net salvage is recommended for
this account.
t 26
i
Exhibit No. (DAW-3)Page 31 of 44
i
l\i
ii
i
1i
APPENDIX A
Computation of Depreciation Accrual Rates
I!! 27
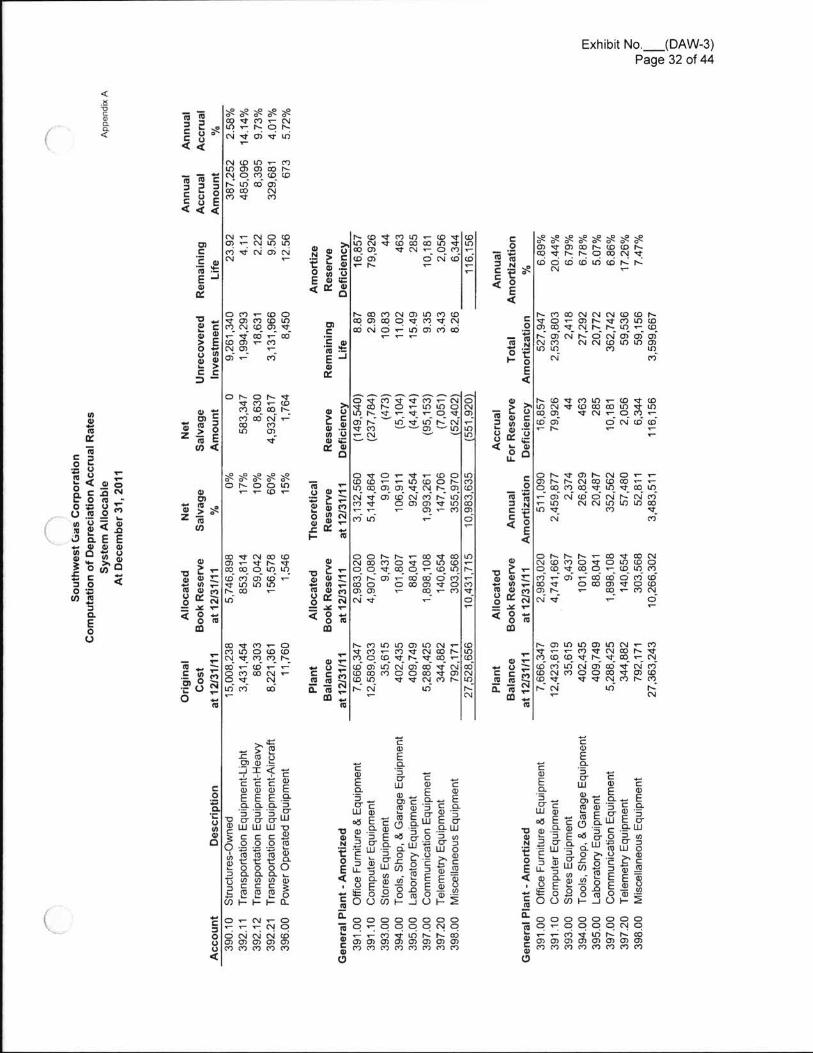
Exhibit No. (DAW-3)Page 32 of 44
<.Eoc4)aQ.<
$'88$$WWW!-N101-NONa nvcavln
1 -
(" 88\ .c uc o
< <
N<*>
N co ID v mm m au of r~;;NQQQ©
3 3 N ID @ UpQ ® WC E CW WE: 5
u< < <
m - Cal ID m g 8 8 8 8 8 8 8m v r~ N o co N <r.9*
:
l~f.ovc~>u1-covco>mn<mwmmvmQWO3 WCV-OFDwomww
- P
v -
o .c c o oz
g U ) - NW;:
:_ mycncov~<o¢ol~cu coc<o<o1.ncor~r~
c N *c<o
an.E'3 .-
oE 8 4 1< o
N - N o mU) . . . . .c 8 q n g 7 nC q; -E w-Ewms
§o
E<
v o Q- o> l~ <r of 10 (Do4:g4:>o
.1 8 et -7 <5co 1- ¢">N CO °O7 1' CW
Cr~moonnn<ocor~.9°z°Q<t~.~'~~Q-<4' é n m w n o w m m mn e W n m w m m m
m m of: LO
N m
N of c*> N o> m m (Dm QQ9QqQqNc co N o - an au of ofE ea v- P3 go;E . Ia»m
o m 1 - w o4 :% m ca w m8 N co o> v
ETOo w2 >
c cD . .
E_g oE<
Q)aan
l~<ovc*>l.n\-<o8<o> m n v © w w m IDceoow v r ~ | - o < " > -
v04,4oo5V 8 * 6 of <6 <61 ' -
1-mz>
A A Ao v z * 7 - n o
> 3 8 8 ~ m m o ng W 1 - 4 1 - 0 4 0 7
c a n u > v \ n | ~ n \ -v m @ m- N - IN
O l~ o 1~ 8W (9 1-<*z co et 'uF) ® 1-co <>m Q
v
Q adms- 8N¢n<
Q
¢Zum o8%
D
w3 E O:~,8u M g:< 6 w
IL
Lm of m m 9 N N cm <9 og g g g gONOOU)1 - v- (D 1 -N N LO IO m m
(")v- lD10 v
of
OWOF 1-(DOIO1 " (D©1-p (DONE)
01" . . . . . . . . .;nvo >¢ .o n<~>l~u><~9
m y o o a c r v v a m- 1-(*)07* O
P
= 8 | ~ v a > | ~ n o - -C CDMPQ-_ Q°Q<'1°Q<;~Qw=Q\Qg ° , ; < - o > n < o o n l ~ n m
Nc vc N<
m~9m > 8Z i
w
l*)8 N " vQ 1 (*} 10as OF
cy
S8 au
ov.c|-
EoE<
O O N * ® 3 @ l On o o m o v o (DI-o o < m o v - < o m r ~
t -
vsm~9 1 '
s°"' m§»
a r E8 8w
°>8(D4<
co v N o f wU) v- N gof co o IDco m m ro -v LD LD ID
on f\ co v- ® 1* (') N1 -
O N N N 1 ' @ 8 ® Nn c o m o g o (DOo w v o o ,.gQ\.0(*)gq,.¢; l -w®Q¢v);gc o w o w m v o m031\ -
N m o-
o co m v o of' w 1- () v1" O
'
1'sTG o Sa W q-N Q (qgm= .1 1-
o< o am
ou p - . - . . . . .9 U : N ® F ® © @ fo(; V h F ® OQ GDQQCWO0 8 N n < r= ¥ ! '
o<08m
1 -g3 8 :o
8°'o m N m= X 1-
o< o <6m
m28EcTE
O *cu oa<_e3°"o aow.1a88o; m-
5 :: oo CaWE
:aEoo
v m 1- (q <r N w f~ IDm o go v r\ v co 1- co
O Jc_Rul r v
onc2D.
N m4 <r N m r~ co
m r~N
© m m o o o f v CO Nco iv v N m r~ 10
m N
l~a >\ n\ nc ur>n m? _ v - 1 - ("} ( Y @ ; V,Q©wq wqq
o ` m m m n m m: ; 8 ( ' 3 0 © @ 8 (DN N NNmf. 1-N
|..o
r ~ m u > L o m u > n - < ov
ww- .. . . . . . .u ; < o c > u > n o > o o < n wgmi N &m... *
m
m v m f - o, m u n o m c o
_ , _ nv m r ~ > r ~N ` ® 1 - ( D p p5§589"8"ea . . .- Q a t g g q of
* v -
Eu
u»m
C c
EozEa.:uLU m
acE" EQ m : m-
m
a>
co8o.coV)o
D 8 o
a>
Q.3 4Um c
v m 8 cN ad d l ° (§ u l
O.Jo CUJ w o
D ._¢8=n ., Q. upt c w 3 Q.8 8
(5
: .93
._ QUO3 ._5 .8 3
" L uasa>
GJavoG)o'CS
3 3 Eo
3 m
Eo z IaE no
:Q. 8 v;
o .9o
r-99£ 10 8
i I < ° &... ......a,a>8a>EE E E a. 9 0 . o . 3: H z
U U U U U Jg Lu lu uJ u
c c ...l o g
w m a>m Q.t i u88880888
\- W W W ;4 \ - L _
c a r - » - I - a
0488 *.
c 4E 8 :8E9~E
3 4 :8 g E @ § 8 E U
<1>°5D u E u po G)U88§w82§§8mn ._
< 8 a 2 , 6 E E 8E 2
44 go ._§OOW 4O82
EG.)
8c Sc rdE LU q) 8
8 2 gan aa.-- < ° & ° & 8°5 E§(9°UJ a.uJ3 °60 § 8 E u.Q 8.<3
t i 3 0 3 0 a>o 5 % ; , u 4 : b aE u _ . - L U ( / 5 2 3 2< E ~€E
_... Q;E 880".-EOD(/)}-_|O}E>§
- " 1' N O(0
o o o o o o o oO 1 - O O Q O N O.- -<<>8u1 r~r~com u m m m m mm r w c o m m m m c n
E Q \ - n w - O3 . . . . .o o n n n ©
m m m m mu n c o m m o n<
Q.
Emcvo
° o o o o o o o or u ° * Q 0 Q Q ° ! Q;-1-c~>8nnl~l \oo: m u m m m m mv m m m m m nm mo
Exhibit No. (DAW3)Page 33 of 44
APPENDIX B
Comparison of Depreciation Accrual Rates
29
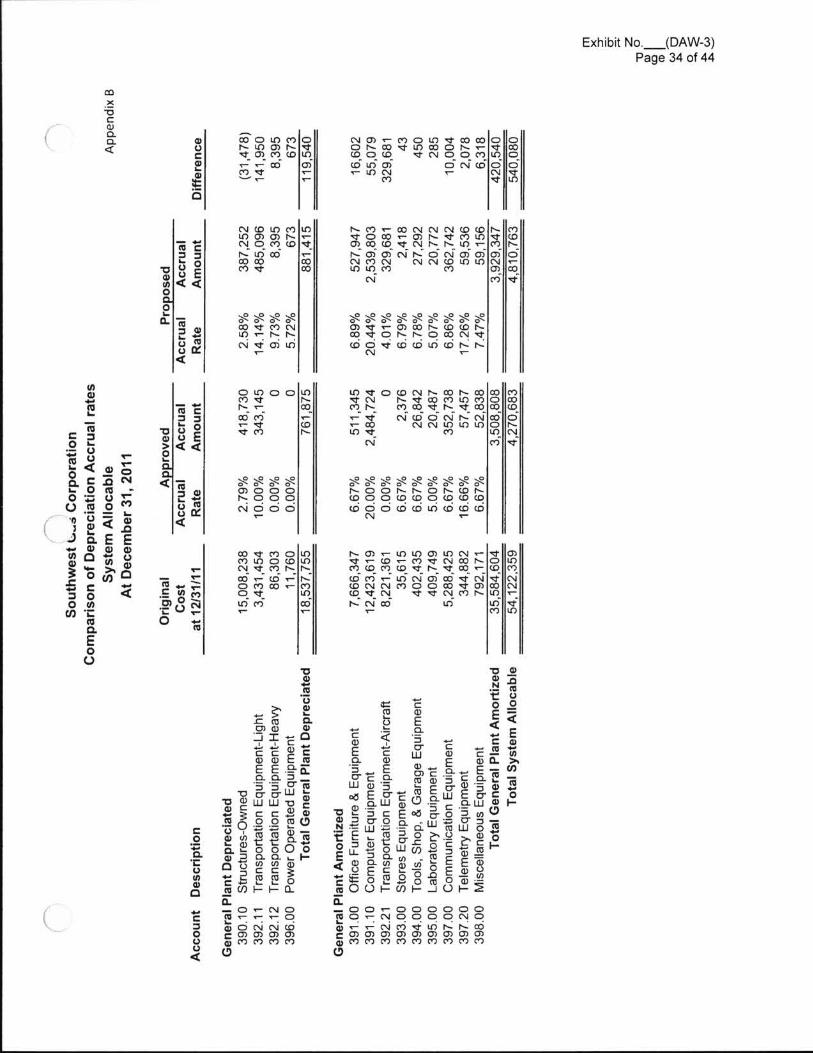
Exhibit No. (DAW-3)Page 34 of 44
mxCcQ)D.Q.<
of o u> co or\ LD OF r~ vv m of w LDv 1- ® O)m W F- 1 - 1-
L o wm
n o v - m o u v v o o o o o oo r ~ o o < r u ' > m o r ~ \ - w o ow o w v n o o < ~ > u > om u m o m c o o o1- 1- n g
v
a>ucanLea
8o
1-ofof
N no u> <> 'DLO m c> r~ PN o c*> co <rl \ lD wco ofc*> <r
r e c ~ o - o o n n n c o c o l \ m< ro o o \ - o > r~ v c ' > u > v < oo u o o c o w n r~ r~ u > - c f > r~r ~ c > c n n ~ o n c > c n m om u m n c v c o u n m n m v
G0 Q Qm y
m LO ofN
g cJ* o38&
in < <ooE _m=25 cuo m
§ §sv N
LO *' N NN v m LD
1 -
888888888® g p @ ® N © © Net . Q ~ ~ Q Q n vcoQ<rco<ou><or~r~
C\I 1 '<
w0+I2
f~etT '
(Dr~
Q LG o o LD(q <rN_ *_of c~>* vv m
LD v o co N N of l\ co ofv Nof 'E1 " vv° ©LO W_
N
cor~8coc~>u>mocom v n v oo oo non co o n r~ cv oo oncvuumouuo
m ~Q<~4m y
mofg
o8888'WQQQnoon
1 -
888888888r \ o o r ~ l ~ o v ~ < o r ~<QQQ=Q<QQ<Q<°.©.w o c w m m w m w
( N 1 -
eg :3* o' c u
228oL .
< 8: Q
5 ;Q M<
® ¢ ( - 0 u )<*)LDO(DlD°{"i"2'i'Eoo 1-co1-|\© ( W ® 1 - F )iv_m m1*
LQofv -
l ~o>=-u>u>o>Lr>n-<ro>v s - < o \ - c o w n a o r ~ o u w<*><o<~f>Lovl\vco--<oc*>c o m f - u > n o > o o v n v nc o m w c v v o o w v o u o o mc o v e v < n m | ~ u > \ -| ~ n c o LD m y
v' ¢")1/7
iv8 35 8 *8<23g . C . Q ~n O *O . : o " '0 . 2 2" > _ m° : 8 < . 9J 4 E E# W W W8o88* > .E O w Q# C * 's o <o m(D E
m
1 -1 -
goc ' J o 5
3 , o NC 0 1-o Qa
Eoo
8oo41.E
II |a)Q . -- a
o . : _U m
EQ.
32LUm
mQ)m
cuofh a )45
<
o wo.Nmc
S O( Em 8 2 2So,E -Q S -3 9
n m° ) : c E ° 5 0 0 W E
U 5 5 3 - 9E . 5 o ? 8 W 8 3s . ; . _3 t u . c g ? c
q)oLum*6 ...ml-
E 3.8 Emo
o4- o'=-3 8 oo E
E .* Q.<+4 U ' E
8 w g mE ° ' * o . . . . Iaa 988:8_§Eo8 £8u UCO°°§ul§<D.9UJ wr-
35 :CDco , oE L L : Q u ) 3 q ) . =8°8Q"IEE8
* E o ' " 0 0 - . wc om awmOO'II5l-_sOn-E
uo
2 8 a. g m 0_ 1 I - Q4- 4 - C *é'C Ca> aJ E m8 88 8
U c c ' L * J "u g uJ uJ u ¢~ 3 g g ~ °
. - - Q U" < 3 E ¢ D ' r ,°"'t1:Cl
o o O ° 586%86
C CEQQQ3M r/ J I - I - Q .
:.94 1D.cummD E E
- 0 9 1 - 0 0 0 0 0 CE 0 1 - N O O O O N OQ p F M W W N Wgcvcuouomcuouoa ovoaw co m m m m m oo m m(D
_ O 1- (\| O8 1- 1- 1- OQ o N N (Oc O? CD U) U)qs UP CW CW CWo
0 4c3ooo<

Exhibit No. (DAW-3)Page 35 of 44
APPENDIX C
Current Commission Approved Rates
31
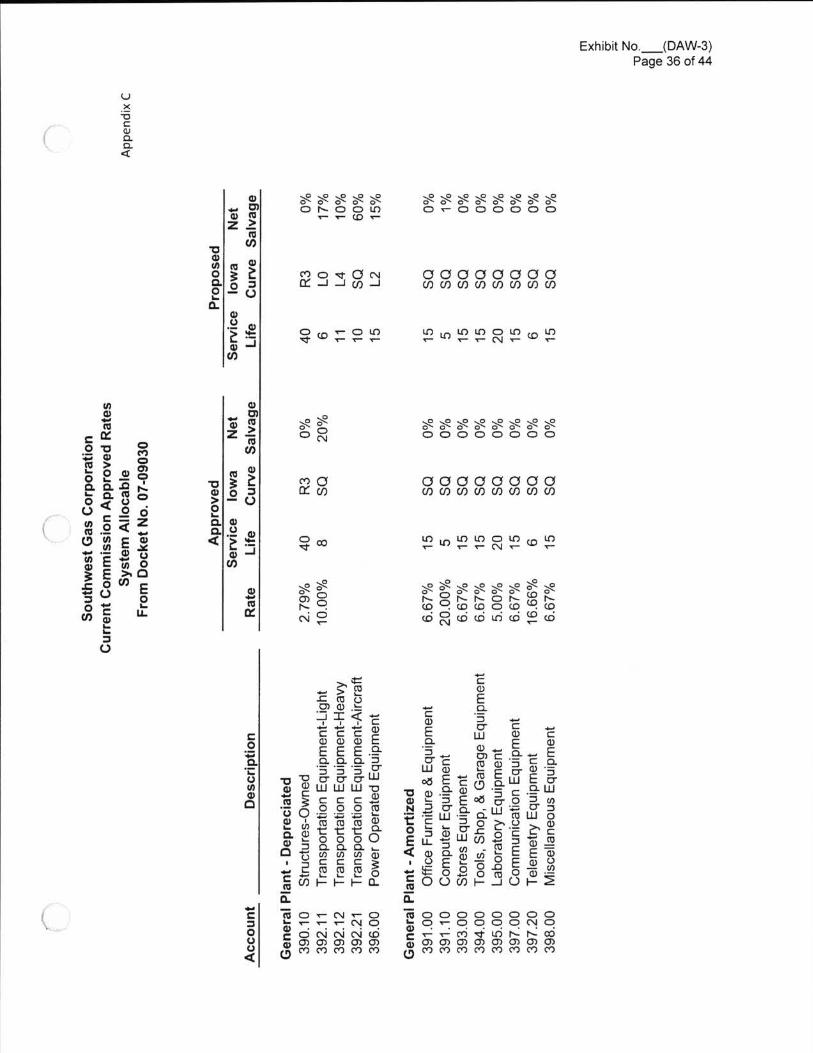
Exhibit No. (DAW-3)Page 36 of 44
UX
' ocQ)D.Q.<
88888888of-ooooooLD§§§§*1 - 1-©\-
o v C\|of" _I _1 8 _1 OOOOOOOOmwwwwwmw
w
88- o
£ 0 1 -o LOco v- P 1_LoLD u> LD o LD LD1- v- CN 1-
O Pq 1 -8
.J
wm
' 6 Nz .z8U
ea(DoD.on .
4mo
zmen
( 0w4 1m 88888888o o o o o oo o
$ 8oOf:
c o o o o o o ow w w w w w w mm gM m
(Dof _ mLD LD u> o LT LDv ' 1 " ( N Q - 1 -
83 c uz Z
cy(D
so anu 3 E825oi nQ o< z o
v8
q,_lcm
QW 8s< 8r ~ 8 l ~ r ~ r\
o+1m
M
8 8m o
9of -
oo >o 8
no .(D (D o £0 . c ono 8 no no Lm co co no
Mc23 3* o88mm8539r~8 0 . ' ° oo<8 o
c =W o< z855345.22%¢ E 09 0. c ; E > D
av §Ag »Wm u.I .B:o
. c
E::.Lco5Q.:uwmD
4»N._
3m
om m m m a>
U 4-C
Q
LU Q) a> 8E 0 '
a> o. q) .o. UJ
Q. .. LIJ._ ._ QC LU 3 Q q)
L..Q . 3 CUmD
u. ut :oE<in cm cm as
I
W em oO D'E (U m cu
Eo
LL 3 cmo an
o 2G)a>
E0.)8
C . _
an 3 8'E LU an.5 <°-8 3b E 38.5EQ
U 'wEE8§w._ 8 :
°388"°%88o _ag8-§¢§:m -
mo. ~EET»_ E L . - O3: o m -.u>Ooc/)|-_10l-2
; %4 1
m oova:1.2
c : ° E " E ° >m a > a > EE E E EQ Q Q 85 :
U u u 8 u Jg>uJuJluog c c c . .98888w Q.c t r9 o o 0 O8 Q.Q.Q\.° c c : 34- \_ \_ L. 0C / 3 l - l - l - 4
40:..~D.
0 1:
24
N Qi
m moo
o o o o o o o o1-OOOONO1-1-C')¢|D N Wmmmmmmmmmmmmmmmm
O 1 - N 1 - O1- 1- Qo N N Cal gom m mm of : of of m
mn.mcmC)
cuL4:cm<9
+c:o
<u

Exhibit No.___(DAW-3)Page 37 of 44
(
l1
Appendix D
Net Salvage
I
I
I
33

Exmbn No. (DAVV8)Page 38of44
xu-a
. _ og_W 0)p
1
8888888¢n8om-Lnq .Q~vn1-OOOOOD
$$8$£$$$$$8£8$£ovm uumooooomwomwn w v w m m q q oo ov coot<omo<ovvvooooo~7~7qlq4I328988988882:>mnon-unowoc>mr~vn --FGQOOQG
$ £ 8 $ $ $ $ $ $ 8 $ 8 8 8 $ 8on- \nr~=nooo8oor~c1vnl~f~=Q<r~Q~4Q=zQ .QS~Q~tcocozocoevoooooo-cvqlq;
888388838883¢DQll>NG»("lp\-(\lv~<.oooar~r~v»-o-v- - o o o o o o
8££$a3$$a9$$$a3a9$$$$a9o n n - u > r ~ 8 o o o o o o v v v m~~~Qv© .¢QQ°QQ°4---cowcowmovoooooooqamcycy
8828888328833OP¢Dlf) ' G 1 V O N N<'z=QQQ°efw'>~.QQ_ _ _ 1 . 0 Q ¢ Q Q Q
ass$xsssss$sx$sss$ONf \|N 'lOOQ0008000VlO\D~nQvQoQoq.oQmq-q
828888888888vmo>¢ou>non8no°=z<?'>¢Q<=r°?°Q~z .QQO - - - vO Q Q Q Q Q3333$$$$$a833a9$$$$$£$$$Qnnnn-oooooooogourwocv® N WDOOOOOQQ ¢*3 '"wwmwwwooooooooocymmn
NIr
£$8$83$$$£a$$$Com -ov-8¢*JeO0>vQQ°zQ<?<=Q'>.°2<zQQQQQ " - - " - 8 0 0 9 9 9
8$$32£$$33$'8533$$$$8$$82$onnnnnoooo8oooo8-owzoQS>>~~QQQQ .QQQQ .calv-Qzqowwwwwoooooooooocyqaqv-v.
$ .68.é22* som$ .382 38
$ .58. .Hz;8
3 .38viz;
ivmn>15$4522N
vo
$ .381523ivw
8888888888888r~nmnr~vm-oomoooon<ommr~o<n-oooqv'v'0'***QOOOOQ$468é2>3VJ
8<a8$$$S$'38$8233$$$$$$Bl'8£oznnnno8ooooo888o8m-vo QNNNO ooooo o omo <o 4o¢o¢oooooooooooo<poon|8.ggazggagggzggeggggmom m v o w mmooooooqcq¢qqo1v~r~-v-sooo*'OQ*p -COCOOOD
$138.ans
E(D
< < <o z < w ~ n o Z o o o o o o o o o o r ~ - n oQ Q ~ Q QQQQQQQQQQQWYQo w w w o o o o o o ooo o om m oWWW
$$$88£$$$$$$$£$man<oov~\nr~r~vooooovnomo¢*>a>\n--Qooqo-;\l-QO1-1-(vgQ0QQQQQ9.382422
som
Qo o o o$£8$$8888938$33$a¥$$$or~nu>o mom oQ"?*4 QQ8;.t*.Q188888QO¢\lQ-OO-NOQOQOOOO
3822mw
$§§§$$$§§$£$$$$$$$88$$$8 393 88383383333933
§§§§§§§§§§§§§§§§§§§§§§§§o to . Qoqq .m .o co o coco OOQOOgO o
w
o N Om OQ-o o o o o o o g ooo o oooo
w 8~myQwRaoqof-
-w _z 19
UP
o o o o o o o o o o o o o o o oooooowoooooooooooooogoooQm-
v'Ecor~-
Qw>.J<
z zQ <I-1ug m
0§g .1¢<OU)01-ww<zWeI-.IWmW <ETl-_ ID.Jo <WEUJ|-m>-w
19>°6° oE aIaz
Qv-o o o o o o o ooo o ooo ooOno of oIa ea qrcow
o o o o o g o o o o o o o o o o o o o o o o o o"QNv-N
go_>Nin81m o o o m zo o o o mm o o ao ruo o o o o o o
av _¢7gq cw cv m o o co us ocf>»nv~msnnao mN v - ( V ~nmv~m \D
m..cvEvoa8588
\»s>
E-80-vovl~vmr~o>\n-mgw 3 < 8 3 " " R ° 8 ° 3 " 9 § 3 wEv.dimr<<~Iv~u$dddm6l<c§6m.nN- \n__8|n|n¢4)@gv)¢q)g3@3 un-n.-asococ :Nmwe§'<E3338'""'§88888888*=ma»mmc>88 ma>o>a>moooE.--1-.-.-v---.--.-»--nnn3u.
Evu<8to
,nm too-0 . .g.. ca o>¢>n-E m N nmm>QO.Emcxo-c\|m8Lra¢nr~moao-nm8Ln<o~mouo-=u°°°°°'°'88¢>3°'888»'8888¢88888E8as cm om oa mwwwwrrwFwwwwvNNNNNNNNWNNNQ:..o§(D
1 - r -1- - -1- - - - v - 1 - - 8 ¢ c °m m m w m m m m m m mmmm m m m m m n m m m m m m m m m m(~.
vvwrrvrwvwrrrwwwrvrvrvww8888888§§§§8§§8%383§8§@~uMLu\L
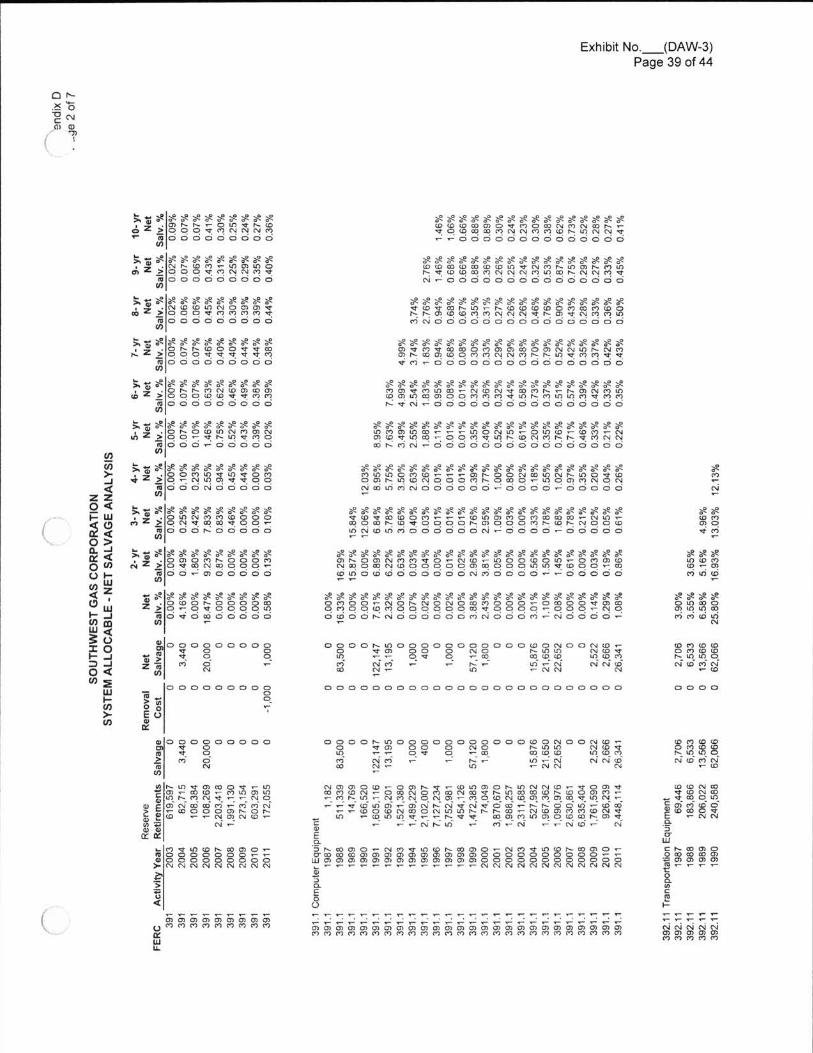
Exhibit No. (DAW-3)Page 39of44
o l
Qr~X»-UC m.ax U)'nI1
H z-
wwgmmovmocowmuoonwYQ .QQwnnww@ w ~ n ¢- - o o o o o o o o o o o o o o.u»r~r~-our>vr~<DzQQQ<r<2°4~.~~>.mm o o o o ooco o
;,zgaegggggggazaegggaeaeae<o1.omsoooo<o\nvnmr~u>oar~m\nh ©QQ n n ~w@@~~n 4 1n - o o o o o o o o o o o o o o o
;;$sssssss$s.~r~v.om-nnmmozQQQv¢w~wv8 0 0 0 0 9 9 0 0 0
H zaeg gggggae gge ae ggggggvLovoor~va-r~<o¢.o<omommm4oo
~QQ@ ~~~v> v www4m w o ooooooooo o o o o o o
8 8 8 8 8 8 8 8 8 8 8 8N@@WND@®§_>QQQq:qm.m.oq .8 0 0 0 0 0 9 9 9 9
4I
8 8 8 8 8 8 8 8 8 8 8 8 8 8 8 8 8 8 8c>vm8aocooma>a>moo»nn=nr~n¢*>°z'>==a Q Q Q 9 n n n 9 q Q Q q qv v o o o o o o o o o o o o o o o o
3988088888889.Q NWOOVWMflzz=aQQ~zv<z<rv=2wruooooocooo
$a8$$Z2$a3$a9$$8882$$$898'82mmv<*>mw-n¢on88mv~-r~o:nm\n<qqu;9qQqm.<qcq . '=<'1~4~f1"'2<r"'<'zr ~ v n - o o o o o o o o o o o o o o o o3 3 $ $ $ 8 $ $ 8 9 $ 8 $2$88888$388w _ . . . . . . . . .8 0 0 0 0 0 0 Q O O
832a8$a3$$$$8£$£8$£$32882a9nnmmmmv--.-mommn-o\n<n-r.o<'>-nm¢ov¢nm-ooe>v\nr~<onmr~v~vmnnM r ~ m n - o o o o o o o o o o o o o o o o
; ; $ s s s $ s $ s s sz .or~o<o¢nn:ummm >OO -VNIDWFSOwnooo - o o o o oI
H z8832a9$$$$'$$£$2383£$'B2a9a9$8$Nmmomww~wm 8 on mmn mo¢ woc>l~\n<nnoooc'>r~ movuaooamcvown m \ n m n o o o o o o - o o o o - o o o o o
5 8 8 8 8 8 8 8 8 8 8 8o o m 10 8 m v o m3qw49.qqQo8 o o o N o o o o o
h> . 3 $ s s s s £ s s . ; 2. zmggggggggggggggggggggggg88;e83868528888m282a885Wn©6dddddddnéd6ddéddddéPF
3.2RaPN-
8232m m° ?Qa m-L
.o m w m cw co o o o_ > o n v m m v o o -w NOOONOOOOOI
83289mum<.o-cr?wanna.-
$ $ $ 8 $ $ $ 8 8 $ $ $ $ $ 8 $ $ $ $ £ $ $ $ $mr~oc>nmmvo-n19-u>oo8sm-ommcoNQQQNQQQQQQQQQQQ ..<z=°°°-Q< o \ n o ¢ o ¢ o o o o o o o n mo o o c - - o o o o o-v-
' s g s sa f sa e sa e s s sZ 0¢3('7NCOC¢'3N _>ov NQQQQQ-m o o - m o o o o omv
$88833$a989a3$$$a2a8$8a989££$8a8$$Qgqgg-(qQII~8ng@gqQQQpQ@QQQ8®Qcqqqcqcqqqq .QQ°=z°:QQQQ-QQQ1 .qDWOQNNDDOOOOMNOODMFNDOOQF<-
88883333mcQQ8
38888888888Z i a - o v o o o3 6 4 6 8 6 6 6 6 6.-
D 6ow-ID m9 'Q 'QIN - N' N N
8 9 so coVu sq 3N <o of N- co
OOOONIDOQOOQOQOODQWONOQCNIWw¢a» 8 n o n 498- - vw mmnm Q v- - NNQQN - ID N-
o-Qo:m
M 00O8000D9- " 8 o 8"3 dZn Nm
o o o Qo c o o o o o o o o o o o o o o o o o o o o o o oCOOOQOQ08Q-.
:
i532E uwK
Qm>.J<28gmg oo f82
w8,_w e< zo»3w mW <ETr - . ID Jo <W :
LIJ| -w>cm
o fi v Q-
w wwomcowN 990n<.omn1-LD
o o o o n m o o o o o o o o o o o w o m o o w w -8 vm o NO r~\n1n 6108v- - -® ooww m ym nm r r Mq ' n nn<om (\|- ID - n n N-
o o o o o o o oov3<~1 oN
I
co m m 10 m Q w m r~ m v- W N co .-
nmc>o<.o -cmr~v -<o \no>or~\nnn<o-ggcvvaom<on-oaono¢>mc\4aovr~\naooo<ol~<o l ) --mr~m-nmwo wm-v a o c o wznc a mmmv mmww-v <o =nc >-mnr~nv nv o c o -v ~v ~o 3 \n-c o w--¢oo¢onwor~un\nr~v~r~ao-n<oc> cf>v.onvin v -s o nnmv v - -nv q- --NHLD - ¢")'(\I N
mIUzm(D1nv~».n p r o v mEG>-3(8°(7U)0)\D0\nr~m nv - - n Q
v r~"E°%8383"8"Est fqqwwf3 ; n. -my
»m8u><or~mmo-evo 0 0 0 0 Q 1 - .an o o o o ooc oo> - N N N N N N N N N
Euo<
ww w8¢DN@.. momgcamwow mo vE - n nD.DuLUCNQGWOQ co oo co oaaaammas(U- -v- -§mc'E|-
»c4:
8
\.| Jc >a>o>mc sm as m o w m o o o o o o o o o o o o- v- - - - v-v- v- - v - - - - N N N N N N N N N N N N23o.EoO _ .. v - v. - - -v- - - - - - -v- -v- - -v-v- -v -v- - - - -r-- -v-v- - - - - - -w - r v - -v v-w -v- -v-v -wmmmmwmmmmmmmmmmmmmmmmmmmmmmmmmmmmmmmmmmnmmmmmmmmmmmm
- - - - -N N N N Nm m m m mm M m M m
~v - r -v - - -mma>c>mo>c>o1c>u m m rvmm mn m mmm\L
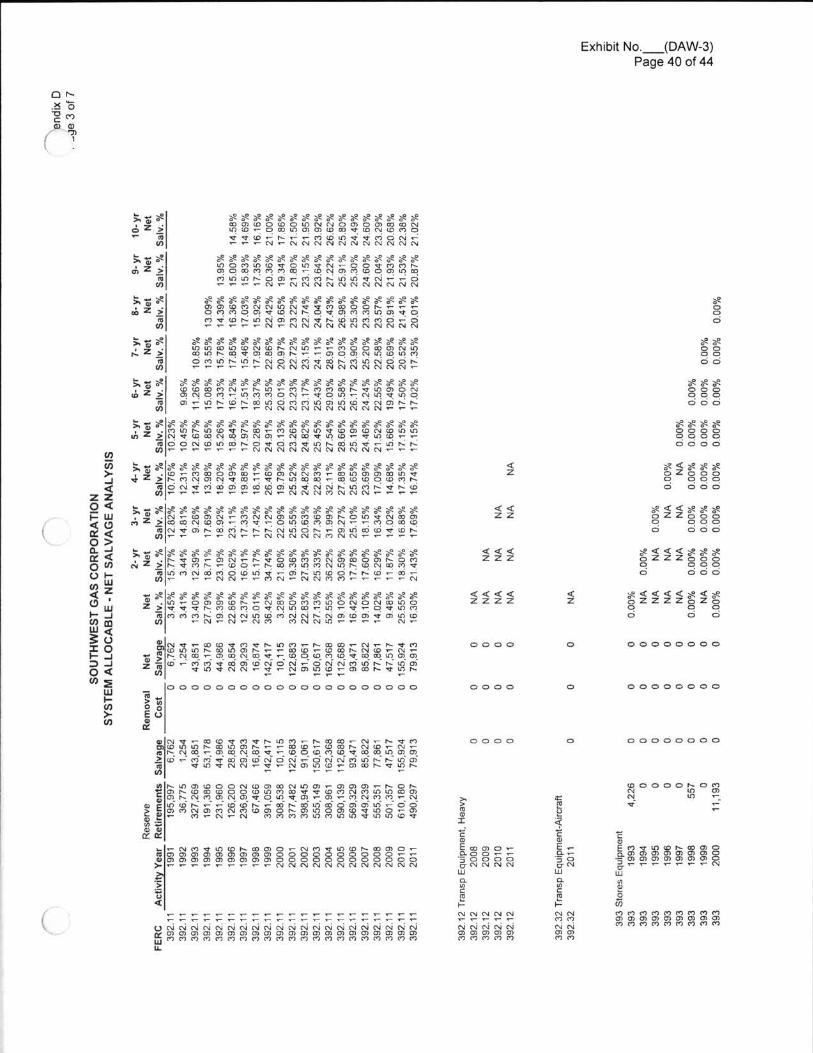
Exhibit No. (DAW-3)Page 40of44
Qr~4 8g mmm75( I
évud-Jr~<4.Jm¢o\néé¢*3dN41 $8E32a8$33$$$$33$$£$8mca<oo¢o8unnnoo>oo>mmnmen-ow cxcnacovcowmmo- v - - n - c v n n < \ l n n n n n n n
" r\mommmmm-<oc~4mm<.o8c>mmm\nu>r~oo\ me>r~\.r>u1vnv-v-o- w - - N - N N N N N N N N N N N
$ 8 3 9 8 3 9 a8 8 9 B 2 $ ' £ $ $ $ $ $ a3 $ ' $orzmomvwmnmv<nl~mo4o:mnvr~¢nmmmo-o
32oqc
»--m g o co ca m wo o uu l~ o o v m c o m l~ - - m o n=n<ov>¢'> l
W
8 8o fQQo f
rI mmwmmmmmvgmgggmgs sv
v - - 1 - -N M -N N N N N N N N N N N$8£8a9$£$£$89£89a383$8€$$v.r:unm\n<on<ol~nu>d d w 6 n d n d 4 6 n d w d d d- - r - v - - N N N N N N N N N N N F
g g g g g g g g g g g g g g g g g g g gvmnasoma > no m- mmmo w- vo mf nu> vmo =§ gagQ Qo o o
9 . 3 8é 2 8- as
m
$ 3 8mz_é
LumB 0>.°'>. g .on _>
83 5 81122
8$ 3 8z <o1o co :>n-r~m -r1r~<*>mmr~
N out-u»v~<or~ao\no¢vm\nmm<ovo4c>r~v~V) v w w w w w N N N N N N N N N p w w
§;£8$$8$$8$$$8$8£$$$$8$$ddn¢md déddéwRdwéémH8
$ 8 8 8c o c oQQQQo o o o
<z $<$a932Q z 8 o 0o ofo toono-r'>womao-coszmmmv-mmmmmmv¢̀idNémdc>cidwdméNc~ir<mmr<év4<6
< <z z B9 <<°a3 s2ozzg8oQ Q . Qo too
. z .c>u1 r\ \n¢o ; r~m- m¢o nlnv¢o o m¢o nlDu»mID >nvcomn 9GlO)'f\|®9\DW"?lD@v~v-V)"F"*** (VNC'|¢V(WCVCV(VNN F**
;~°&$;9$$$$3889$$$$$8$$$$$$8$éz i mmaawvco-vnmww-mwmowmq;-.---»-.-.-N-nnnmnnn--.--
°S.°'$8¢$$$8a'3$$$$a88$a2£$S2$$a2a3m N mwm omvmcom_ 6dv<mr6r<r4v<Nmdr<Jdl!id1.6¢<6l<www-
< < <z z z 9 < < < o o o8 z z z 3 3 3q Q q Qo o o o
r ~ v m - m w - r ~ v o n o m m n m m o o 1 v ~ o m8 s nm nm m o ¢ o \ nw - o >nuu¢ o o v \ v ~4 o - c o --
IIK
< < < <z z z z <z <<<< =<~e§ z z z z 3 z &Q q qo o o- N - N v- N m
Z -<D@Nv-¢'1NN8U1n >aomn¢no1v-mv- \nmmo>n--momzomm - v - n - - n n n n n m n n - - v - v
°§.6$83$$89$£$$898$$$a'3£$$'$a3$$4§2$r~vmr~-wo-r~uom\rlv>nmr~wnmc'>vv-*CNN--¢'7N-{NtVF7()-----CV
gS8€£S383$$>°$8$$8$$8a3a9$$$$Z§vvvr~muomovnmao-an-Qvovmm< ) N N ¢ n - - - -
\n-omm¢or~v-nmocfarfamnowomcuunom6ddHdNNW@dNn N¢@déd@@an n.-
o o o o o o o o QQ o Q oQSm
°n3~wm mv mmF~mmwnv~vmN® mr~m MN'-F®8'£D@N(YLDPNP>nnm mmnQ¢wQ QmQ mmwmm2-co-mr: aomcocvom-onnv>u>v~l~u>mN am nn-v-nc>m<n-c1mr~vlnr~vo - P -ro o o o o o o ooo o o oo o o o o o o o c o o o o o o o o o o o o
9(05<
23gmq ua0§&8:m8»-mm< 2
mP-.Jwm**J<ETl._I:_|o <<05LU|-w>(D
E3%E uw1
o o o o o Q o ooo o o o
dw-d<€65mc6ndc~i»Jd<~ic€¢*imv<r<mmn m w v m v > m m m m n w v mw lDNWlOO1r\ - -®lDv'(DQN(\|¢Dv-C\l -v ~~c o - o >no nc o v - c no w v w c o v w o o m m m
>v m v m m f - v - n m m < o -o1cor~v\nv~- r - - - -
UNTv(D
no o o o o r~ o mN m mN IN -q -v-mr~mmwoon¢oa>oonu>c>-camm-r~or~Em ssmwoowlnmoovvcnmmmmnnmmoqnmmqmm omvmqm mwqmwwE\DtDNv'"LD©B*Q WlDWOU1C5\D-O8oamnmmn¢n<oo:or~o>=r>ooasovu1o-2 - M F N F N mmmmnnmuwmvnnmwv
§mGOIGJzm ._8 sm m
m m m m m m m m m m t o o o Q D O * -o m m m m m m m m c a o o o o o o o o o o o o> w r w r v r w w w N N W W N N N W W N N N
c.84...cmE...Q.-o8nUJ
.Jca>E©®Cv-2 . 0 0 - -gooooucvmmmw5;=o<
...cc*>vu> l~ mogQ030)U38@8@8-moaoaazmmor3 - - . - - - v - - n
UJvsGJ..o.-mm m mmmmm m mo>a>ma>o>c>c1c>c>m m m m rxmm m m
é
(
amcm._|-NNm.m.NNmmmm
Qll)csI-N N N N N- - - - -N N N N NCO m a> m a>so F) g) ¢*> F)
- - - - - -v- - - - - -v- - w - 1 - 1 - F r - -- v r F - p ~ - - - - - v -v- ° - - -1-1-
Q N N N N N N N N N N N N N N N N N N N N Nx m m m m m m m w m m m m a a m m m m m m m mw m m m m m m m m m m m m m m n m m m m m mIL
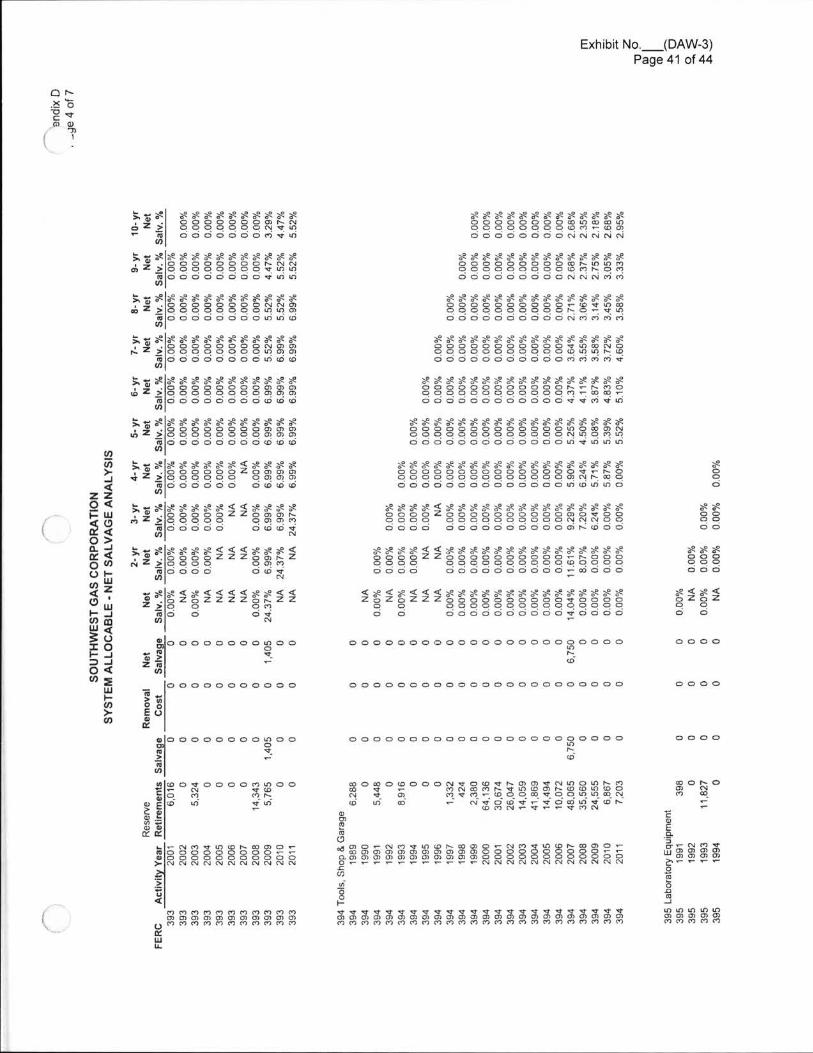
Exhibit No. (DAW-3)Page41 of44
QI \5 8E vm M
Ti
8888888888888oooooooooomeonomOCQQQQOOLDM-<DC7o o o o o o o o n n c~l n na2ssssxsx<<ooooooocm fv<2Q<=:QQQQ~.~z~Qo a o o ooom v un
$'$$£$£$£$$$32a889oooooooocmnunmnmQQQQQ°.Q9Q'Q"?'¥Q"!ooooooooomwwmm
b •>5>zo >F 9
(D
; 5 $ $ $ 8 $ $ $ $ £ $ $ £z .ocoooooo m w
m Z Q Q Q Q Q Q Q Q V W WwruoooooooovmnnI§§$#§ §§ §§§Q v -8QQQ3Q33QQ'w8vw!oooooooooommmmcm~l
g g ggae g ggggg ge g g g go o o o o o o o o o o vmmwo9°.99QQQQQQQ'Q"?'Q''9o o o o o o o o o oomoamm v
§ 3 $ £ $ $ £ £ $ $ 8 $ $ $$2$333383333$3$¢QQQQggQln@@S $$89££a3a3S£$$£m .o o o o o oo o m m mr~zzQQQQQQQQ~Q°z°wwcvoooooooosnaozor
$$8$$$8$$$$8$8$£$OQODCOOODOOCNwNFQOQQQOOOCOOOOO¢11"@@1oooooooooooovvmvnn
;.°"$$a3$a8a3$a9£888é' .o o o o o o o om m mQ 3 QQQQQQQQ°€°Z°!wm o o o o o o o cwmw
§ 3 $ £ $ $ 8 $ $ $ $ $ $ $ub2 ioooooooomcam
$$$$£$$$$$8$8$£$$$o o8o o Doooo oQo\n o w m nQQ .Q9QQQQQQQQ°!"?Q""!"!ooooocooooooomvuzsnmno o o o o o oommm
3ddddddddc6<o\d
>- 8oqo$$$8€$.$'a38$$$$$8a9$'$£82DQOGCOOOOC888809"NOqqoqqqoqqo . . . NNMOoooooooooooooommmmo
§;$89$$38$$<$$$a2Q08000Z057U>U7QZ>OO to o hmmmwww3 d d d d d 6(D$8o fQQa cdddddddodddrécddd
32£83$§$8$$32888$8$'$$a8$oooo oooooo o o o oa o v o oQqqq OOOOOC8QOONNNQGoooo
;§$£$8$§§§8$§§$ 2 s 8 8 8 8 ¢ 8 3 m middddd 6644w N
s 39 so o oQ Q Qo o Q
$8e$£<<8e$£$8e3e$8e£$$8$$$8o o o z Zo o o c o o o o o o - s o o o.sqqoooo QQQQQQQQQQIQQQQQO O OOOOOQCO F QO C O.-
B ¢ g g° °<<< °gle<> a~ a~*3>333¢2229@RzQ °? m.o <o vN& Z 2 Q Q Q QN o o o o
V)
|8 < 8 <Q Z 8 ZoQ Q
<~2< 9(<<\\\\\\3g\3g\~£3g\\~2zaz8zzzaaaaeaoaQa3QaaaQ Q o o o o oooooo ooooo o ddddddd6dd6dddd-
°°<°<<<<°°<<3 ' ' 8 z ' 3 z z z z 3 § z zZZQ Q q sno o avan N
Q(D_|<
23gmgoof&éU)8882.
LU»-.IW mW E3 0 O o o oOOOOOQOOOOOOOOOOOOSOOOO
Vuw¢9 QQQQQQQQ8QQ
-88Zneno o o oo o o o o o o o o o o o o o o c o o o o o o o
cm
IOl-.J:_1o<W :LUI->(D
Q o c o o o o o o o ocu> mo oE oll1
o o o oQQQQQQQQQQQQQQQQQQSQQQQ'Ew
u aoooooooog oo-EvZm10
\1
03m O r~ oau Nm QetID -_
g co o v o o o o m sn o oc - N vu:0 0 "ZNa m-
3°"°@°°°x§88:~883n88888N 8, 1- mveov mogomvocmunmw45 url Cd vonov vommvwnF N w m m f v w - v m w
la>E<5ET8 3are:
».-n<>vm8r~comov-NOGOOO OOO**o o oo o o o o o o o o>NNNNNNNNNNN
88
.-cwED.3, N m vm ca m ea mU) m U) ma- - ' -o..Eo.Qiv_Ju
<LD in ID LD IDm or m Q; cam m (") m c">
a>u:s8 mo nmvmn r~ mo nm us |~mo>o-"@@§8@88§8§88§88§8§88858norm mo- - - - .-.- - v .-»-v-nnnnnnnnnnnn.cU)8|-
as mmwmwmm mmmmmmmmmmmmmmmmmmvmmmmmmmmmmmramm m m ra m mm mm m mm m m oa m m ar m m as mo m m m m mn m mm m m
MmU.
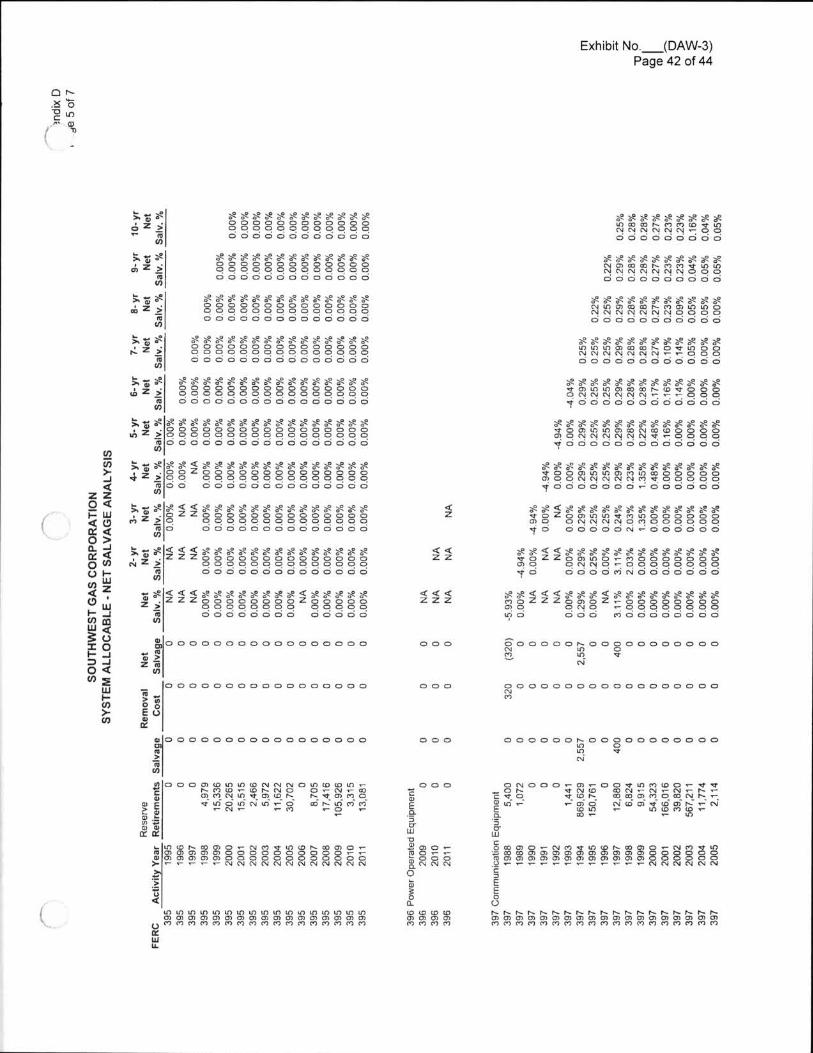
Exmbnno. <DAWQPage42 of44
Qr~4 -g o
quo< 9,
l
888888888888ooooooooooooQQQQQQQQQQQQoooooooooooo8838888339832uvmmnmmcovmnc~4nn¢\4n-ooo o oo ooo oo
'lg;$ansF E
m
$.38é2 g
8 8 8 8 8 8 8 8 8 8 8 8 80 8 8 9 9 0 0 0 0 0 0 0 0Q . . Q Q Q Q Q Q Q Q Q Qo o o o o o o o o o o oo
8888888888GIUUQQNKWFBWUDUD~.~.~.<~4~~.~QQQo o o o o o o o o ocuU)
II
§§§§§a9$8£a2$a2$$of OOOOOOQQQQQ=aQ3QQQQQQoooooooooooooog g g 8 e $ g $ g $ 8 8n m os m m n m cm m mn g<~4°4~.~.°4~.<\!QQQ .o o o o o o o o o o o
8584625
Ew$£8'8a3£8$89a889$$8$o o ooo o o ooo o o g g oQ q q q q q q q q q q q . . Qo o o o o o o o o o o o o o o
£ $ $ $ $ $ $ $ £ 8 $ $\D\D\DG7®W DQlOO8~.~<~4~.~<~4~.--Q0o o o o o o o o o o o o
3.38rL2>
EIDIa8$£33£$££$$$$ ' $$32$DQ OQ C O QCO O O O8 O QQQ Q Q Q Q Q Q Q Q Q Q Q .QQQo o o o o o o ooo o oo ooo
8 8 8 8 8 8 8 8 8 8 8 8 88 o > u n \ n c > w m r ~ ¢ o v o o oC \ 4 n g n g n . n n - - - Q Q QY O Q O C D O D O O O O Q
$.584625
'5w
§§§§§§§§§§**§qqqc~4qn.ogn.q~388qY O OQ O OQOODQQ D O
$ 3 $ $ $ $ 8 8 $ 8 8 8 $ 8 $ $ $ $ $ $z . o o o o o o o o o o o o o o o o gID Z Q 9 9 Q Q Q Q Q Q Q Q Q Q 9 Q 9 .8 O O C O O Q D O O O O O O O O O Q
§§§§§§§§§§§§q o o oo ooo o o o o o o
;¥*§§§§§**§§§§§* *§§4 2 f Q Q Q Q 8 8 Q Q Q Q Q 8 8 8 Q Q8 0 0 o o o o o o o o o o o o c o
I1
<z $33<a233$$8$338932£83883vozoc unumvmunooooog°?9 Q'*! '*.N.'*!Q"!QQQQ9 .YQ o o o o o m v- oooo o o;;$ §;§§§§§§§§§§s. t o o6 2 2 8 Q Q Q Q Q Q Q Q 9 Q 8 Q Q Q
8 0 o o o o o o o o o o o o o o<< (z z ...........33o o o o m m ooo o o o o
$£<<££Z3$$$388a9$'$a2$8DZZ00)lDO-6000998.°. DNNQFDOOOCqo;;s§§§sssssssxxsssss. t o o o o o o o o o o o&22 SQQQ8QQQQQQQQQ,g o o o o o o oooo o o o oI
< < <z z zI gaeéééggaséggaeaeaaggagn o o oQQ 339 398883388100 t o o mo o o o oo oo
3$<<<£$£$3e$$$<$8e8e$$z ZZZ88DOOOOOZOOOOO_> . .QQQQQq QQQQQ8 o o o o ooo o oocoo
o o o S o o o o o o o g o o o o o o o oN If)m m vN
°ooooooooococooooo3>z
n3<0
o Q o o w o o o o o o o o o o o o o o o o om
o o o o o o o o o o o o o c o o ovo§-
°oE u
Qm>.J<
z zQ <I- w8 LDo g4 .In¢ <Q vou »-m 38.
LLI1- .Jw mW <
ETI - . I: . Jo <W :LU| -w>w UM
o o oID vN
u o o c o o o o o o o o o o o o o on2ivin
(D mso -zas ._ll) ea
3 oooo»¢o\n\nconnnomco<om.-c r~mu> -¢ol\no D - n -Qo °l "Z °{ 'Q*¢ Z 'Q'E t>~x°z='a°mE vlnouvmunu-o mnmmman f N - pM -O -g v-o fM I
o f o.-ca>E.9:DUJ3 8 o -S o E 3gm N No
w
»mw~mmownm8m©~mmowea m m m m o o o o o o OO>-- . - - . - -NNNNNNNNNNNN
1:=u<
.3oD.
o r v o o o - m - o Q v » n m ¢ o o - v v_or~ vwco Q r - n - N w - n f<=<cQ *'1°Q'i 99°Z"ZQ9°{'E'1810- v-UIQ n¢nm wml~-n8 1- ©¢*)(Dv°Q - MnDULuCooomo-n<*>3=n<or~ooa>o-nmvmra:mmmwmm maamoaoaggggoo8mmmmmmmmmmmm o fr - v - - - - - - - - v - ( N ( 4 ( \ I N¢Y ( \ lc3EEoO
N N N N N N N Nmmmmmmmmmoamoamowmcammmmmmmmmmmmmmmmmmmmmmw o LE (Dor an o> o>m m m mK unmunnnmnmnmmmnnmmmnmmmmwmmmmmozmmmmmmmcdmmummmmmmmmmmmmmmmmm
asIUIL
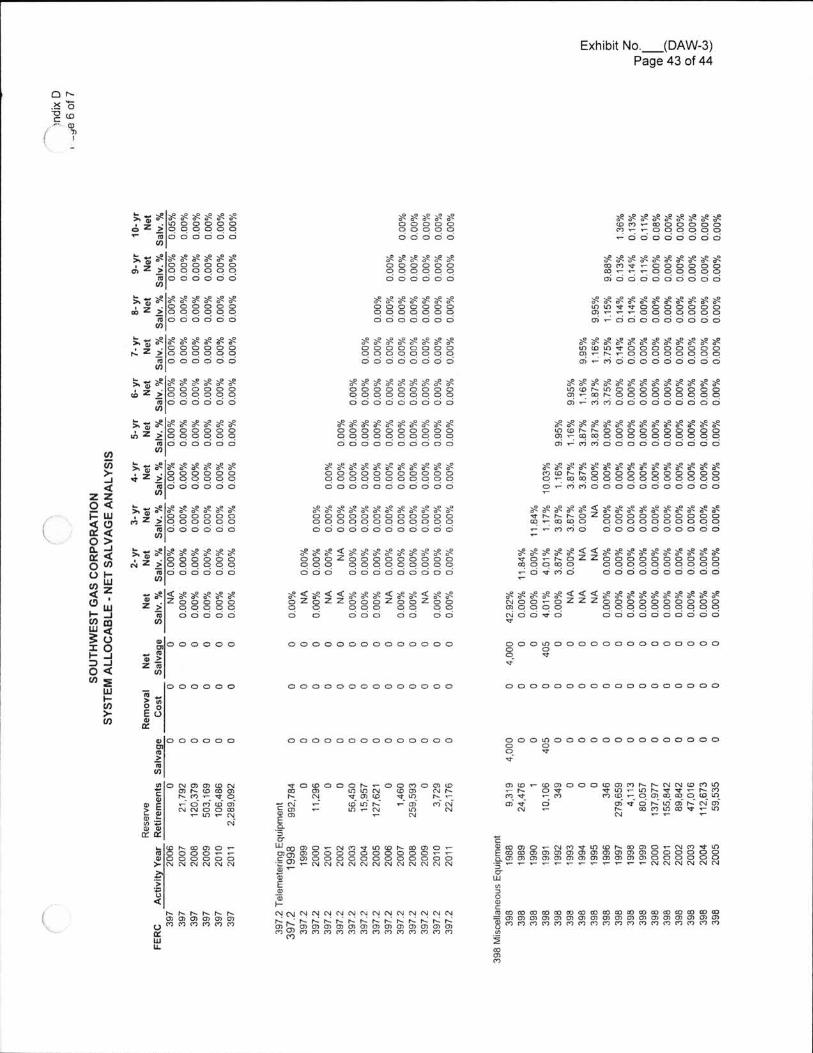
Exhibit no._<DAw-3)Page 43of44
I
0588 co" m
7)s
l\l
;.;8888888é2$oo8888v -
$8888oooooQQQQQooooo
888488888982<0¢~>-m8ooooFJFFO o q q o-o o o ooo o o
ID oTo d 6 d d d dm
$388888o o o o o oQQQQQQo o o o o o
8 8 8 8 8 8 8 8 8 8mca v - o o o o o g9 * " * 9 Q ° Q ° .moo ooooooo
988888888o o o o o om 2ZQQQQQQ8 o o c o o or8 8 8 8 8 8 83338388o c o o o o o
8 8 8 8 8 8 8 8 8 8 8s n m v v c o o o o o oq ) . . - Q Q Q Q Q Q Qo r - o o o o o o o o o
9.5$$3333£$$. o o o o o cQ Z > O O O O O Owruoooooc
Q o o o o o83883888889o o o oooo oQ q q q q q q qo o o ooo oo
8 8 8 8 8 8 8 8 8 3 2 8 8U p * N v - O O O O Qm - m o o o o o o o o o
3 3 8 8 8 8 8 8 8# 2 E Q Q Q Q Q Qwm o o o o o ol
889832832888o o o o o o o o oQQQQQQQQQo o o o o o o o o
8 8 8 8 8 8 8 8 8 8 8 8 8Lm<or~\noooooooooan-m o o o o o o o o oo r - m m o o o o o o o o a
3 3 8 8 8 8 8 8 8z . 8 o o o o oso _> .QQQQQ
m o o o c o ocm
$ $ 8 £ $ $ $ $ £ $OOO 8808OOQQ Q Q . .Q .QQQo o o o o o o o o o
gggz ggggse ggae ggg»nLol~r~ooooooo8oo°?*9°Q9QQ°QQQ .QQm - w m o o o o o o o o o o
a g s s s s x s sz . o o o o o oSn _>qqQqQQ8 0 0 0 0 0 0l
8888988839888o o o o o o o o o o oq q q q q q q q q q qo o o o o o o o o o o
$££$$8$$£$$$$$8rgwgggggggggggggdéédddddddddddd; ; $ s s s s s $
z o o o o o o9 Z Q Q Q Q Q Q
8 o o o o o o
a889a23933<$$$a8$$$$$$v i ~ r ~ r ~ o z o o o o o o o o o o4-oum.o Q o q o o o o o o o" M O o o o o o o o o o o
s s s s s s s s s s s so o o o o o o o o o o gq q q q q q q q q q q .o o o o o oo oooooi
§ " £ ¥ 8 $ $ 8 $-é' . o o o o o on Z Q Q Q Q Q Q8 0 9 0 0 0 0
II
n z8 $ £ < 8 $ $ 8 $ 8 £ $ $o o o z o o o o o o o o oQ q q QQQQQQQQQt o o o o o o o o o c o
$ $ 8 $ $ § § 8 $ $ $ $ $ $ $ $ $¢o- r ~o o o o o o o9 9 9 9 9 Q 8383QQQQQ- o n o o o o o o o o o o ov-
§ ; 8 8 $ 8 $ 8 8. o o o o o o_>QQQqqQ8 9 0 0 0 0 0I
4 8333883333d o o o o o o o o o
;, 8 < 82 BE $ 8 32z o o o o oQ q Q Q qo o o o o
°<<<< 2=< ° < ez z z 2 2
Q Q Qqq q s Q QQ o t o o o f o f
B3$a88989§§§$88$a2$$$882m o o - ocaoaoo'_}16¢e6Nw
o o o o o o o o o o o o o o o o o g o o o o o o o o o o o o o ooQ v<1
g o o o o o onSo
z f uV)o o o o o o o o o o o o o o o o o oo o c c o c o o o o c o o o
Qm>.I<
z z9 <I-1.L1g o
AgQ .Jm <
82<08
.LU
v - _ IW mW <
ETt - . ID . . Jo <W s
LU»-m>cm
o o o o o oE> 83 oooM
o o o o o o o c o o o o o o o o o o o o o o o g o o o o o o o o o o o o o ooQ vv
oN2Lum
l
w COv LDP c> d-~--
-v~6 4N
N Nr~ -m NN
~a°z<QSIRw
rmvo l~\.r>mv~no1r~ wmsnoovv-u>N - - F
_qonmo>¢nnc @l̀ @mg§v Qw Q,-Q(q©@nwoow- 0FNNwez
c m~.nor~coa>o-W O O Q O w pv o o o o o o> N N N N N N
-CWoo mo n m mncowooow n m v u ng m m m m m m m m m m m m o o o o o o
Um
Evu<
v o ¢ o o o o r ~ - o o m o c > u >of m m mRx- ngm nmE t N
Q:c\ U m m o f m m v m g n m c a o fc a g g m o o o o o o C 0 6 - *c m o a o o o o o o o o o o c o. 5 _ _ - ¢ W N N N N N N N N N N O 4.-mEwm»-n w w w w w w w w w w w w w wN N N N N Nm m m m mmmmm mmmmmmg m va m m m mmmm mmmm
r~ r~ r~ l~ r~ l~U) m om m m mu m m m m ¢'l go
mLUu.
m3oancrvmwmmnowaooamcommoocommmao=cnc>aamcno1mmoammmmmo>mo>a>g m m m m e o m r a v v m m n m m m m m n mm2m
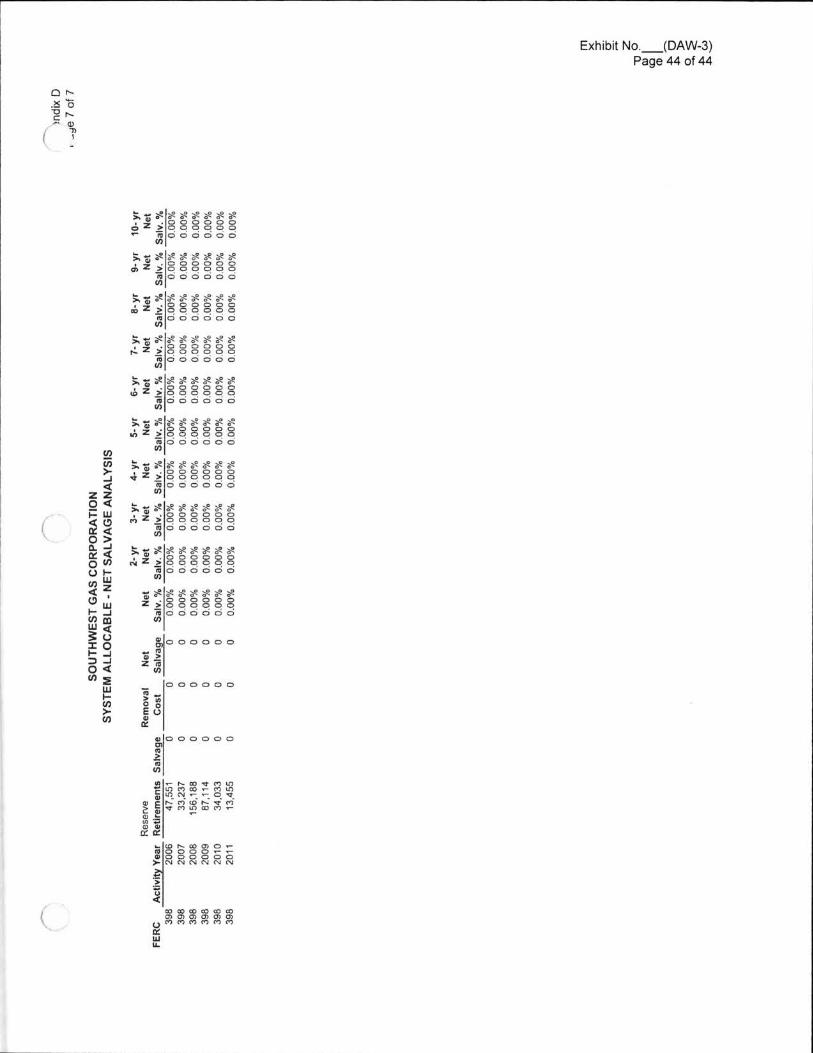
l
I
Exhibit no._(oAw-slPage 44of44
Qv~5 6DC»m
T)( \
;»go$gggg8 . of C 008
o _>q q q QQ .- 80 o o tooI§"$$$$$$8
3 .oooooom ZQQQQQQmm o ooo o oI
$ s s s $ s. t o o
é z z 3 3 8 Q Q Q8 0 9 0 0 9 0
; ; a s s $ s s $, ; z 33333888 o o o o o oI'Sq3¥932323239$$Z . o o o o o ow _>QQQQqQwmoococo
§;$$$$$$$42i388333
wm o o o o o o
II
;;ssss ss' z D00800v Z Q Q Q . Q Qmoooooo
Qw>-.I<
e nI,:,z; ; s $ s s s s x. o o o o o o
Z Q Q Q Q Q Q8000000(; ; s s s x x s s
Z . o o o o o oN ZQQQQQQ8900000
8 8 8 8 8 8 8O t o o
2z Q QQQ8800060
Iro o o o o o
23gmk w
0§82
w8,_w e8 2
UJ9-.JW mW <Eb'l - . ID Jo <W Ewv-cm>m
E o o o o o o
3 'gg oK
vN32
z so0)
an O o o o o oorm_>mm8 - mvmun=88"'8"o ..*" vm r~c> num€§v¢>8a><"'-1-
8 5myurn:
» .¢o r~w c>o -m o o o o v - ~a a o o o o o o> nc ~z nnnc \ l
Ea<
m w m of m moz m m m m o>o n m cm m m et:ml.uLL

Exhibit No. (DAW-4)Page 1 of 1
Southwest Gas CorporationSystem Allocable Plant
Comparison of Existing and Proposed Depreciation Rates
Exhibit No. DAW4
Proposed RatesExisting Rates
AnnualAmount
AnnualAmount
Gas Plant at11/30/2015
AccountNumber % %
LineNo.
Net Change ofDepreciation
ExpenseDescription
ss
1
ill
2.30% $6.67%
20.00%10.37%8.18%4.00%667%6.67%5.00%5.66%6.67%
1666%667%
390.10391.0039110392.11392. 12392.21393.00394.00395.00396.00397.00397.20398.00
2.79% S6.67%
20.00%10.00%10.00%4.00%6.67%6.67%5.00%6.67%6.67%
16.66%6.67%
680203563252
3364762377479
0328854
2.3764165145772
666445213
37376725
5927326
12345678g
10
11121314
825115563252
3364762364010
0328854
2.37641 65145772
784445213
37376725
6058887
295740258444555
168238083640102
08221361
3561562445691543411760
66748592.241
115030376118519
Depreciable PlantGeneral Plant
Structures a. Improvements OwnedOffice Furniture & EquipmentComputer EquipmentTransportation Equipment LightTransportation Equipment . HeavyTransportation Equipment Aircraft
Stores EquipmentTools Shop & Garage EquipmentLaboratory EquipmentPower Operated EquipmentCommunication Equipment
Telemetry EquipmentMiscellaneous Equipment
Total General Plant
(144912)0o
1346900000
(118)000
(131561)
$s 5927326s 5058.88715 76118.519 (131561)Total Depreciable Plant
NonDepreciable PlantIntangible Plant
301.00303.00
161718
61816194847174194908990
OrganizationMiscellaneous Intangible
Total Intangible Plant
389.0039020
421670643562088572914
General PlantLanda Land RightsStructures& Improvements Leased
Total General Plant
192021
22 203481 904Total NonDepreciable Plant
s 279600423Total Gas Plant in Service23
lII.
IiII
EXHIBIT no. A-10
DIRECTTESTIMONY- RANDI L. CUNNINGHAM
1 941 TTT
III
II
EXHIBIT
II

:
IN THE MATTER OF
SOUTHWEST GAS CORPORATION
DOCKET no. G-01551A-16-0107
PREPARED DIRECT TESTIMONY
OF
RANDI L. CUNNINGHAM
ON BEHALF OF
SOUTHWEST GAS CORPORATION
MAY 2, 2016
iI
Table of ContentsPrepared Direct Testimony
of
RANDI L. CUNNINGHAM
Paqe No.Description
1
2
4
7
8
10
15
ll. OVERVIEW OF CURRENT
III MAJOR COMPONENTS COMPRISING THE DEFICIENCY......................................
IV. OVERVIEW OF NATURAL GAS OPERATIONS
v. JURISDICTIONAL COST RESPONSIBILITY AND ALLOCATIONS
vi. RATE
VII OPERATING EXPENSES
IiI
I
I
II
I
Appendix A - Summary of Qualifications of Randi L. Cunningham

1 Southwest Gas CorporationDocket No. G-01551A-16-0107
2
BEFORE THE ARIZONA CORPORATION COMMISSION3I.I
4
in
Prepared Direct Testimonyof
RANDI L. CUNNINGHAM5
I. INTRODUCTIONIi|I 6
17 Q.
18 A. My business address is 5241 Spring
i
I9
Please state your name and business address.
My name is Randi L. Cunningham.
Mountain Road, Las Vegas, NV 89150.
210 Q.iI
211 A.
1 2
By whom and in what capacity are you employed?
I am employed by Southwest Gas Corporation (Southwest Gas or the Company)
in the Regulation department. My title is Regulatory Professional.
313 Q. Please summarize your educational background and relevant business
14 experience.
315 A.
16
417 Q.
My educational background and relevant business experience are summarized
in Appendix A to this testimony.
Have you previously testified before any regulatory commission?
418 A. Yes. I have previously testified before the Arizona Corporation Commission
19
20
521 Q.
22 A. 5
23
24
25
(Commission), the Public Utilities Commission of Nevada (PUCN), and the
California Public Utilities Commission (CPUC).
What is the purpose of your prepared direct testimony in this proceeding?
I provide a broad overview of the test year results and the major components
that comprise the Company's deficiency. I describe Southwest Gas' operations
and cost allocation methods. I also sponsor the development of the Company's
revenue requirement, the financial statements and statistical schedules in
-1-

1 Schedule E, from Schedule E-1 to E-6 and E-8 and E-9, and the projections and
2 forecasts in Schedule F.
63 Q.
64 A.
5
6
Please summarize your prepared direct testimony.
My prepared direct testimony consists of the following key issues:
• An overview of the current proceeding, including test year results, the
revenue deficiency as shown on Schedule A-1, and the fair value rate of
7
8
9
return (FVROR) requested by the Company.
The major components comprising the deficiency in this application, and
some of the efforts the Company has undertaken to minimize the rate
increase.10
•11
12
•13
14
An overview of Southwest Gas' natural gas utility operations, including a
description of the Company's state and federal ratemaking jurisdictions.
The methodologies employed by Southwest Gas for cost responsibility and
allocations (excluding the Company's class cost of service study) contained
in Schedule C-1 .15
•16
17
The computation of the Company's rate base, as presented in Schedule B,
and the rate making adjustments to determine the appropriate level of cost of
service.18
•19
20
21
22
Southwest Gas' adjusted test year income statements included in Schedule
C-1 with the exception of Sheet 2, and the majority of Company's pro forma
adjustments included in Schedule C-2.
The computation of the gross revenue conversion factor and state andII!I
federal income tax rates as shown on Schedule C-3.23
24 ll. OVERVIEW OF CURRENT PROCEEDING
725 Q. What is the test year in this general rate case (GRC) application?
-2-
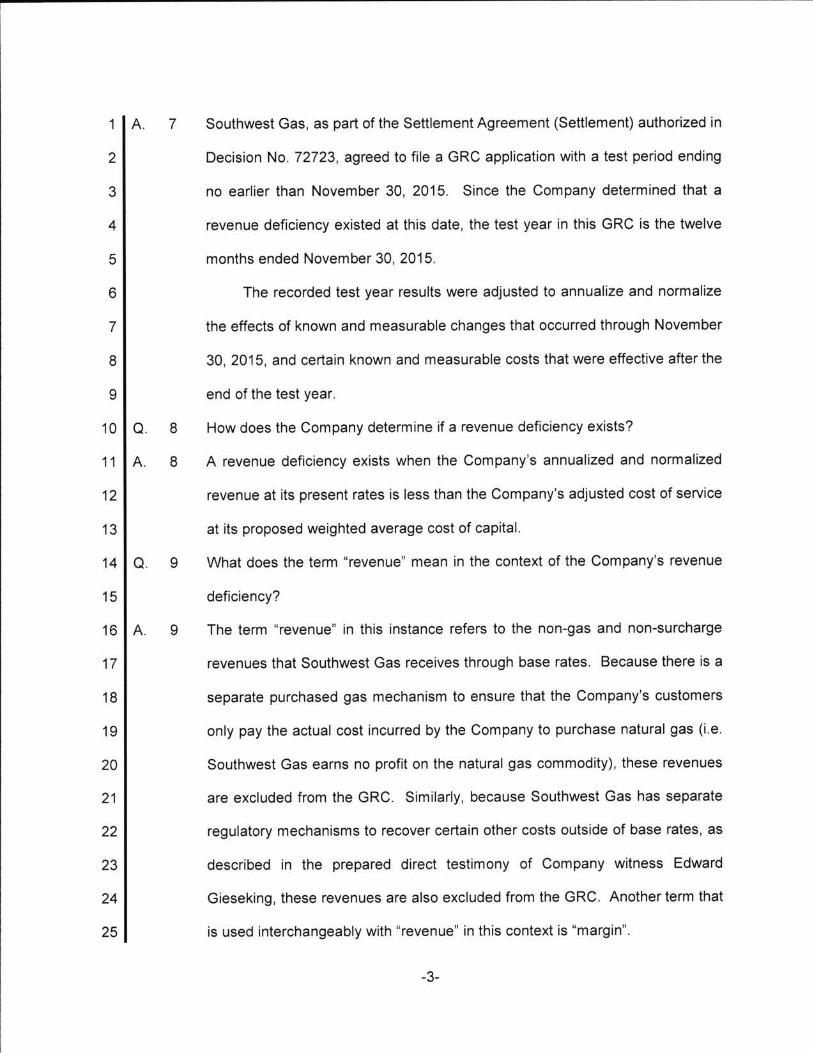
I l
i
71 A. Southwest Gas, as part of the Settlement Agreement (Settlement) authorized in
2
3
4
Decision No. 72723, agreed to file a GRC application with a test period ending
no earlier than November 30, 2015. Since the Company determined that a
revenue deficiency existed at this date, the test year in this GRC is the twelve
5 months ended November 30, 2015.
6
7
8
The recorded test year results were adjusted to annualize and normalize
the effects of known and measurable changes that occurred through November
30, 2015, and certain known and measurable costs that were effective after the
9
lll
lll
810 Q.
811 A.
12
11111
1
1111
13
end of the test year.
How does the Company determine if a revenue deficiency exists?
A revenue deficiency exists when the Company's annualized and normalized
revenue at its present rates is less than the Company's adjusted cost of service
at its proposed weighted average cost of capital.
What does the term "revenue"914 Q. mean in the context of the Company's revenue
15 deficiency?
916 A. The term "revenue" in this instance refers to the non-gas and non-surcharge
17 revenues that Southwest Gas receives through base rates. Because there is a
18
19
20
21
separate purchased gas mechanism to ensure that the Company's customers
only pay the actual cost incurred by the Company to purchase natural gas (i.e.
Southwest Gas earns no profit on the natural gas commodity), these revenues
are excluded from the GRC. Similarly, because Southwest Gas has separate
22
23
24
25
regulatory mechanisms to recover certain other costs outside of base rates, as
described in the prepared direct testimony of Company witness Edward
Gieseking, these revenues are also excluded from the GRC. Another term that
is used interchangeably with "revenue" in this context is "margin".
-3-

101 Q.
2
What is the Company's revenue deficiency in its Arizona operations, and how
was it determined?
3 A. 10
4
5
6
7
8
The Company's revenue deficiency is $31.9 million. Schedule A-1, Sheet 2,
Column (e) shows that margin needs to be adjusted upward to approximately
$481 .7 million at present rates, this yields a rate of return (ROR) of 6.68 percent
on rate base of $1,336,049,260. This equates to a FVROR of 6.01 percent on
fair value rate base (FVRB) of $1,812,414,666. Accordingly, to produce a 6.01
percent FVROR, a revenue increase of approximately $31 .9 million is required.
III. MAJOR COMPONENTS COMPRISING THE DEFICIENCYg
1110 Q.
11 A. 11
12
What are the major causes of the Company's revenue deficiency?
The Company has identified several major upward and downward changes to
the cost of service since the last GRC, which was filed with a June 30, 2010 test
13
14
1llil
15
16
17
18
year. The net impact of these changes contribute to the $31 .9 million deficiency.
Authorized revenues need to be updated to reflect the overall changes in the
level of operating expenses currently experienced by the Company, and to
reflect the significant amount of capital investments that have been made in the
natural gas distribution system since its last rate case that are not presently
included in rates. Each of these items and its cost of service impact are as
follows:19
20
21
1) Increased capital investment and related depreciation expense:
approximately $52.6 million,
22 2) Increased administrative and general expenses: approximately $16.7I
:|
23 million,I.l
24
25
3) increased property tax expense: approximately $14 million,
4) Increased distribution expenses: approximately $10.9 million,
-4-

1 5) Reduction in depreciation rates per the filed depreciation study:
2
3
approximately $41 .7 million;
6) Reduction in debt cost: approximately $20.3 million, and
4
125 Q.
7) Decreased customer accounts expenses: approximately $5.6 million.
What is the Company's proposed annual percentage increase over revenue at
6 present rates?
127 A
8
9
The proposed annual percentage increase is 4.25 percent, which is calculated
by dividing the $31.9 million proposed rate increase over revenue at present
rates of approximately $751.1 million. This is a modest increase of less than
10 one percent per year on average since rates were last established using a cost
This demonstrates the11 of service from almost five and a half years ago.
12
1313 Q.
Company's efforts in efficiently managing operations and containing costs.
Please describe some of the cost saving efforts the Company has engaged in
14
1315 A
16
17
18
since its last general rate case.
My testimony highlights five major cost reduction initiatives which resulted in
significant cost savings since the last GRC. These cost savings have positively
contributed to minimizing the deficiency in this case and will be passed through
to customers when rates from this proceeding become effective:
19
20
21
22
23
24
1) Paperless billing: the Company pursued increased customer enrollment in
paperless billing. For each bill not mailed, the Company saves approximately
$.43 cents due to avoided postage, printing, handling, and receiving costs.
Between 2012 and the end of the test year, Southwest Gas avoided mailing
17989,267 additional bills due to higher customer enrollment in paperless
Total savings from 2o12 through the end of the testbilling companywide.
25
-5-

I
K
1 year was approximately $7.7 million companywide, of which $4.3 million is
allocated to Arizona.2
3 2) CheckFree: Southwest Gas renegotiated its contract with its on-line
4
5
6
processing agent, CheckFree to lower its cost per bill for bill presentment.
The cost was lowered by one cent per bill. Southwest Gas realizes a savings
from not mailing bills to customers who use CheckFree. The difference
7
8
g
10
11
12
13
14
15
16
between the current postage rate and the CheckFree bill presentment
charge is 24 cents per bill. The total savings related to CheckFree from 2012
through the end of the test year was approximately $2.0 million
companywide, of which $1.1 million is allocated to Arizona.
3) Interest Savings: Southwest Gas took advantage of historically low interest
rates and improved credit ratings resulting from the Company's decoupled
rate structure* to refinance a portion of its long term debt. The cost of long
term debt authorized in the Company's last GRC was 8.34%, and the
Company is requesting a cost of long term debt of 5.21% in this proceeding.
As described above, the savings to Arizona customers will be over $20
17
18
19
20
21
22
million per year.
4) Disconnect for Non-Pay (DNP) Initiative: Southwest Gas began using
contractors to field DNP work orders so Company employees could focus on
more complicated work order types. Using a contractor results in an
approximate $23.42 per hour savings. The Company uses 16 full-time
contractors in Arizona, resulting in an annual savings of approximately $0.8
23 million per year.
24
25 1 Prepared direct testimony of Company witness Theodore K. Wood.
-6-
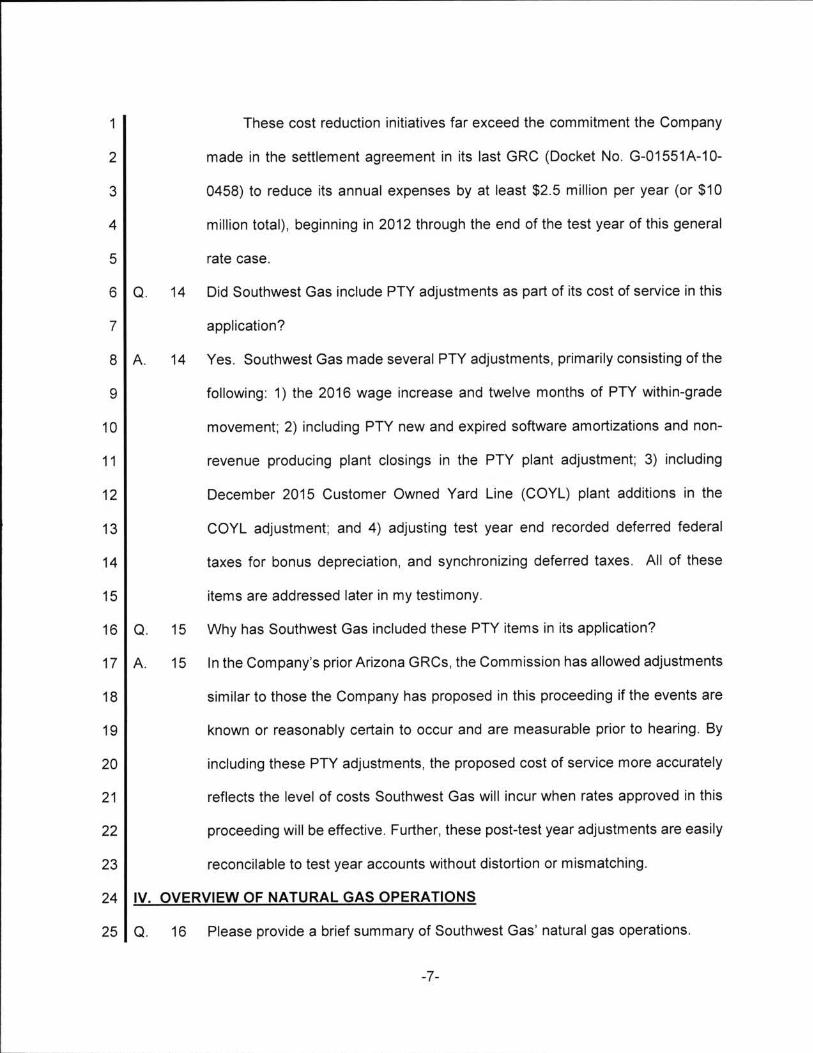
1
2
3
4
These cost reduction initiatives far exceed the commitment the Company
made in the settlement agreement in its last GRC (Docket No. G-01551A-10-
0458) to reduce its annual expenses by at least $2.5 million per year (or $10
million total), beginning in 2012 through the end of the test year of this general
rate case.5
146 o . Did Southwest Gas include PTY adjustments as part of its cost of service in this
7
148 A.
g
10
11
12
application?
Yes. Southwest Gas made several PTY adjustments, primarily consisting of the
following: 1) the 2016 wage increase and twelve months of PTY within-grade
movement, 2) including PTY new and expired software amortizations and non-
revenue producing plant closings in the PTY plant adjustment, 3) including
December 2015 Customer Owned Yard Line (COYL) plant additions in the
13 COYL adjustment, and 4) adjusting test year end recorded deferred federal
14
15
1516 Q.
17 A. 15
18
19
20
1
21
22
1111
11123
taxes for bonus depreciation, and synchronizing deferred taxes. All of these
items are addressed later in my testimony.
Why has Southwest Gas included these PTY items in its application?
In the Company's prior Arizona GRCs, the Commission has allowed adjustments
similar to those the Company has proposed in this proceeding if the events are
known or reasonably certain to occur and are measurable prior to hearing. By
including these PTY adjustments, the proposed cost of service more accurately
reflects the level of costs Southwest Gas will incur when rates approved in this
proceeding will be effective. Further, these post-test year adjustments are easily
reconcilable to test year accounts without distortion or mismatching.
iv. OVERVIEW OF NATURAL GAS OPERATIONS24
1625 Q. Please provide a brief summary of Southwest Gas' natural gas operations.
-7-

i
91 A. 16
2
3
Southwest Gas is primarily a natural gas local distribution company, providing
service to over 1.9 million customers in three states. At the end of the test year,
Southwest Gas served over 1.0 million customers in Arizona, comprising
4
5
6
approximately 53.4 percent of its total customer base.
Southwest Gas' operations are divided geographically into five operating
divisions: Central Arizona, Southern Arizona, Southern California, Northern
7
8
g
10
Nevada, and Southern Nevada. Each division operates independently of the
others and may include portions of multiple rate making jurisdictions. All divisions
are supported by staff located at the Company's corporate headquarters in Las
Vegas, Nevada.
11
12
13
14
At the state level, Southwest Gas' retail gas utility operations currently
consist of six rate jurisdictions: Arizona, subject to the regulation of the
Commission, Southern Nevada and Northern Nevada, subject to regulation by
the PUCN, and Southern California, Northern California, and South Lake Tahoe,
15
16
17
California, subject to regulation by the CPUC. Southwest Gas' remaining two
rate jurisdictions, Paiute Pipeline Company (Paiute) and Southwest Gas
Transmission Company (SGTC), are both regulated by the Federal Energy
18 Regulatory Commission (FERC).
JURISDICTIONAL COST RESPONSIBILITY AND ALLOCATIONS19 v.
1720 Q. how costs associated with Southwest Gas' natural gasl
l21
Briefly describe
operations are treated in this application.Iii
1722 A.
23
24
25
Both operating and capital costs are incurred at the Arizona division level and at
the corporate level. Costs incurred at the division level are charged directly to
the rate jurisdiction incurring them. Costs at the corporate level may be charged
to one or more rate jurisdictions if the cost/activity was incurred on its behalf (i.e.,
_8-
1
2
3
4
185 Q.
186 A.
7
8
199 Q.
1910 A.
11
"corporate direct" costs). In instances where corporate costs are beneficial to all
of the Company's rate jurisdictions, or where the ef fort of tracking the
jurisdictional allocation of the costs is not practical, such costs are allocated to
all rate jurisdictions (i.e. "common" or "system allocable" costs).
What are system allocable costs?
System allocable costs consist primarily of corporate administrative and general
(A&G) expenses, the costs associated with intangible plant (mainly software)
and general plant used to support the corporate administrative staff.
How does the Company allocate system allocable costs to Paiute and SGTC?
System allocable A&G expenses (except Account 924, Property Insurance) are
first allocated to Paiute and SGTC using the Modified Massachusetts Formula l
l
l12
l13 i
14
15
l1
l
l\Wl
16
17
(MMF), a FERC-authorized methodology that is calculated on Schedule C-1,
Sheet 18. Property insurance is allocated using an insurable property factor
(WP Schedule C-2, Adjustment No. 11, Sheets 3-4). Paiute is also charged a
rental fee for its use of system allocable intangible and general plant.
System allocable costs that are allocated and charged to Paiute are
transferred to and recorded on Paiute's books monthly, and to SGTC's books
18 annually. Consequently, system allocable A&G expenses shown on Southwest
Gas' books are net of the allocations to Paiute and SGTC.19
20
21
22
23
For this rate application, the MMF, the insurable property factor, and the
Paiute rental charge were recalculated using end of test year data The resulting
pro forma adjustment is presented in Adjustment No. 11, which is discussed in
further detail later in my testimony.
2024 Q.
25
After system allocable costs are allocated to Paiute and SGTC, how are the
remaining costs allocated to Southwest Gas' retail rate jurisdictions?
_g-
l
ll

201 A.
2
3
Property insurance costs are allocated to each retail rate jurisdiction using the
same insurable property factor discussed previously, and the remaining system
allocable costs are allocated using the 4-Factor Allocation Methodology (4-
4
215 Q.
216 A.
7
8
9
10
11
Factor) described below.
Please describe the 4-Factor methodology.
The 4-Factor is based on the average of four equally-weighted components: (al
direct operating expense, (b) average gross plant; (c) direct operating labor, and
(d) average number of customers. The 4-Factor has been used for ratemaking
purposes by Southwest Gas since the 1950S, and has been accepted and
approved by each of the Company's state regulatory commissions. Schedule
C-1, Sheet 17 provides the development of the 4-Factor allocation percentages
12 for the test year.
VI. RATE BASE13
2214 Q. What is the fair value and original cost rate base that Southwest Gas requests
15 in its application?
2216 A.
17
18
Southwest Gas proposes and supports a FVRB of $1,812,414,666. The FVRB
was determined by giving equal weight (50/50) to the adjusted original cost rate
base of $1 ,336,049,260 and the reconstruction cost new rate base of
19 $2,288,780,073.
20
21
22
23
Schedule B-1 is a high-level summary of the various
components that comprise rate base. Rate base is presented on this schedule
at original cost, reconstruction cost new, and at fair value. All rate base
measurements were performed at November 30, 2015, or for the thirteen months
ended November 30, 2015. Details of the various rate base components can be
24
2325 Q.
found in Schedules B-2 through B-6.
Please describe and explain Southwest Gas' Schedules B-3 and B-4.
-10_
l
231 A. Schedule B-3 is a summary of the reconstruction cost new study. The schedule
2 contains both the direct and system allocable plant assigned to Arizona. The
The detail3 reconstruction cost new data is utilized to develop the FVRB.
4
5
6
supporting Schedule B-3 is contained in Schedule B-4 which contains the
Handy-Whitman indices that were used to trend original cost plant and deferred
taxes to obtain the reconstruction cost new data, and the reconstruction cost
7
248 Q.
9
2410 A.
11
12
13
14
2515 Q.
new data by vintage year, by FERC account.
Please describe and explain the other rate base items contained in Southwest
Gas' Schedule B-5 and B-6 that do not use the end of test year balance.
Schedules B-5 and B-6 contain four items that employ the 13-month average
balance method for inclusion in rate base: 1) materials and supplies, 2)
prepayments, 3) customer deposits, and 4) customer advances for construction.
The use of the 13-month average balance as the method of calculation has been
accepted by the Commission in the Company's past several rate cases.
Please describe and explain the items contained in Schedule B-5 and B-6 that
16
2517 A.
do not employ the 13-month average balance method.
The cash working capital allowance and the accumulated balance of deferred
18 income taxes do not use the 13-month average balance method of calculation.
19
20
21
22
23
The cash working capital allowance was determined through a
comprehensive lead/lag study. The Company used the number of lead/lag study
days derived from the lead/lag study days performed in its last GRC and applied
this information to adjusted test year amounts in this GRC. Deferred taxes are
based on the recorded balance at the end of the test year, and adjusted as
24 explained further below.
25
_11-
261 Q. Is the Company proposing any adjustments to the recorded rate base amounts
at November 2015?2
263 A.
4
Yes. The Company is proposing three adjustments to recorded rate base
amounts: 1) PTY Plant, 2) COYL, and 3) Deferred Tax Adjustments.
5 Adjustment No. 18 - PTY Plant
276 Q. Please describe and explain Adjustment No. 18 - PTY plant.
277 A.
8
9
10
The PTY Plant adjustment serves two purposes. The first is to include the non-
revenue producing plant projects included in Construction Work in Progress
(CWIP) at the end of the test year that were serving customers at the end of the
test year or shortly thereafter, and that will be serving customers during the rate
11 Non-revenue producing plant represents plant that waseffective period.
12
13
14
15
16
17
18
19
20
21III
22
23
24
25
constructed to improve service or enhance reliability and safety for existing
customers. The Company will not realize any incremental operating revenues
from the construction and addition of this plant at the time it is placed into service.
Examples of PTY plant included in this adjustment are replacement pipe,
franchise-related replacements, pressure reinforcements, measuring and
regulating station equipment, and general plant.
Although the work orders for this PTY plant included in this adjustment
were still in CWIP at the end of the test year, primarily due to delays in entering
the required information into the Company's computer systems, the adjustment
is appropriate because the corresponding plant projects were in fact in service
at the end of the test year or shortly thereafter. The Company's customers at
the end of the test year are the primary benef ic iaries of these capital
expenditures, and will be during the rate effective period. Consequently, the
inclusion of PTY plant in rate base more accurately matches the Company's
42-
1 investment needed to serve the customers in its system at the end of the test
2 year.
3
4
5
6
7
1
8
9
10
11
12
13
14
15
16
17
18
19
20
21
Second, system allocable miscellaneous intangible plant was adjusted in
the PTY Plant adjustment. Most of the items in system allocable miscellaneous
intangible plant (Account 101) are software projects with three to five-year
amortization periods. These amortization periods are roughly equivalent to the
Company's Arizona rate case cycle. Absent an adjustment, customers may end
up double-paying for certain projects through rates, while never paying for other
projects. To mitigate this potential outcome, the Company proposes an
adjustment to remove all projects with an amortization period expiring August
31, 2016 or earlier from rate base, and to add estimated amounts for projects to
be closed to plant prior to August 31, 2016 to rate base. This is a conservative
adjustment because many small software projects spend a relatively short time
in construction work in progress before being transferred to plant. Consequently,
between the date this rate case was prepared and August 2016, more projects
may close to plant than are indicated by the estimated balances included in the
Company's application. Indeed, this adjustment strikes a fair balance between
project amortizations that will expire shortly after the end of the test year, and
projects commencing amortization and serving customers approximately one
year prior to rates from this proceeding going into effect. Further, the Company's
estimated amounts can be verified by intervening parties prior to the hearing in
22
2823 o.
24 A. 28
this proceeding.
What is the total impact of the PTY Plant adjustment on rate base?
This adjustment increases rate base by $39,417,890
25
-13-
1 Adjustment No. 19 - COYL
292 Q.
293 A.
4
Please describe and explain Adjustment No. 19 - COYL.
An adjustment was made to include the December 2015 COYL Program capital
expenditures in this application, and to normalize COYL leak survey O&M costs
5
306 Q.
7
A. 308
based on a 3-year average.
Why does the Company propose a post-test year adjustment to include
December 2015 COYL Program capital expenditures?
In its last rate case, Southwest Gas was authorized to implement a COYL Cost
9
10
11
12
13
14
15
16
17
18
19
3120 Q.
21
3122 A.
3223 Q.
3224 A.
25
Recovery Mechanism (CCRM) in order to recover the revenue requirement on
the COYL program between rate cases. The reporting requirement on the COYL
program, and the resulting revenue requirement calculation, is based on
calendar year capital expenditures as COYLs are replaced with Company-
owned facilities. Absent this adjustment, only the capital expenditures from
inception of the COYL program through the end of the test year (November
2015) will be included in base rates after rates from this proceeding are effective.
In order to keep all COYL-related investments synchronized, and to avoid the
administrative inefficiency of tracking one month of COYL additions, it is
appropriate to include this last month of capital additions in base rates in this
proceeding.
What is the total impact of the COYL adjustment to include December 2015
COYL program capital expenditures on rate base?
This adjustment increases rate base by $653,859.
How were COYL leak survey O8tM costs normalized?
The test year COYL leak survey O8=M recorded amount of $485,546 was
compared to the three year average amount recorded from December 2012 to
-14-

1
2
November 2015, which was $3,889,703 divided by 3, or $1,296,568 per year.
The difference is $811,024, which is the amount by which this adjustment
3
334 Q.
335 A
6
7
8
increases expenses.
Why was the COYL leak survey recorded amount so low during the test year?
In order to ensure that all known COYL accounts had a leak survey conducted
by the Company within a three year period, the leak survey work was front
loaded during the first two years. As such, the test year does not represent the
annual level of COYL leak survey expenditures expected to occur during the rate
9 effective period, and an adjustment is necessary.
10 Adjustment No. 20 - Deferred Tax Adjustments
3411 Q.
3412 All
13
Please describe and explain Adjustment No. 20 - Deferred Taxes Adjustments.
There are four adjustments to recorded test year deferred tax balances, as
summarized on WP B-6. The first adjustment was made to tie deferred taxes to
14
15
16
l
l
4
l
1ll
lll
17
3518 Q.
3519 A.
recorded plant at the end of the test year. The second adjustment was made to
reflect the retroactive enactment of bonus depreciation for 2015 capital additions
included in rate base. The third and fourth adjustments are to calculate the
deferred taxes on the PTY- and COYL-related plant additions.
What is the total impact of the Deferred Taxes adjustment on rate base?
This adjustment decreases rate base by $38,781 ,654.
VII. OPERATING EXPENSES20
9
3621 Q.
3622 A.
Please describe and explain Southwest Gas' Schedule C-1 .
Schedule C-1 begins with the Company's adjusted income statement on Sheet
23
24
1, and the subsequent sheets summarize recorded and adjusted operations and
maintenance (O8tM) expenses, administrative and general (A8¢G) expenses,
25 depreciation and amortization expenses, other taxes, and income taxes.
-15-
1
2
373 Q.
Schedule C-1 is rounded out by the calculations supporting the 4-Factor and
MMF allocations, which are described in greater detail above.
Please describe and explain Southwest Gas' Schedule C-2.
4 A. 37
5
6
387 Q.
8 A. 38
Schedule C-2 provides a summary, by function, of all of the pro forma
adjustments proposed in this proceeding. The remaining C-2 schedules provide
support for each pro forma adjustment.
Please describe and explain Southwest Gas' Schedule C-3.
Schedule C-3 shows the calculation of the gross revenue conversion factor, and
9 the income tax rates used in this proceeding.
10 Adjustment No. 3 - Labor and Labor Loading Annualization
3911 Q. Labor and Labor LoadingPlease describe and explain Adjustment No. 3
12 Annualization.
3913 A.
14
15
Adjustment No. 3 annualized the labor and related labor loadings of Arizona and
Corporate employees employed by the Company at the end of the test period -
November 30, 2015. This adjustment increases operating expenses by
16 $2,860,666
17
18
19
20
21
22
23
24
25
The labor and labor loading annualization adjustment includes three
components. First, a salary annualization is made for all Arizona and corporate
employees with salaries in effect at the end of the last pay period beginning prior
to June 30, 2015. Second, labor loadings are annualized at the end of the test
year and those costs are applied to the employees on Southwest Gas' payroll at
the end of the test year. Finally, the labor adjustment reflects an estimated 2.75
percent general wage increase to be effective in June 2016, along with additional
wage increases as a result of within-grade movement during the twelve months
subsequent to the end of the test year (i.e., through November 2016).
-16-
401 Q.
2
Why is it appropriate to adjust labor expense for the 2016 general wage increase
and within-grade movement?
403 A.
4
5
6
7
8
9l
10
Under current Commission guidelines for processing major rate applications, it
is not expected that the hearing in this proceeding will be conducted before
December 2016. Historically, the Company has granted general wage increases
effective each June, after being approved by the Company's Board of Directors
in May. Therefore, the 2016 general wage increase and post-test year within-
grade wage increases will be known and measurable prior to the hearing in this
proceeding. As such, Staff and other interveners will have an opportunity to
verify and quantify the 2016 general wage increase and PTY within grade
movement.11
4112 Q.
4113 A.l
1 4
Does this PTY adjustment adhere to the matching principle?
Yes. This adjustment only applies to employees on the Company's payroll at
November 30, 2015, the end of the test year. It does not apply to any employeesl
15 llll
l16
l
17l
18 I
1W19
20 l
1
21
221
23
4224 Q.
hired after November 30, 2015 to meet customer growth, changes to work
requirements, etc. Therefore, the number of employees at the end of the test
year is synchronized with test year customers that those employees serve.
Indeed, this adjustment preserves the matching principle by ensuring rates
approved in this proceeding better reflect the costs that will be incurred by the
Company during the period rates will be effective. This adjustment simply
recognizes that by the time rates become effective, test year customers will be
served by test year employees who, on average, will be paid more than the
wages that were in effect at the end of the test year.
Have previous Commission rulings in the Company's rate applications ll
25 addressed this adjustment?l
-17-

421 A. Yes. The Commission has consistently approved Southwest Gas' post-test year
2 In Decision No. 70665, the Commission concluded that
l l should be allowed because it3
wage increases.
Southwest Gas' post-test year wage increase
4
5
6
7
438 Q.
43g A
10
11
12
13
14
15
is a known and measurable expense that is being incurred by the Company on
a going-forward basis. Because the post-test year wage increase has been
applied only to employees who were employed during the test year, there is no
resulting mismatch of revenue and expenses."
Please describe the labor loading process.
Pensions, benefits and payroll taxes are accumulated at the corporate level.
These costs are then distributed among the various rate jurisdictions through a
labor loading process. The labor loading rate is adjusted at the beginning of
each year, based on budgeted pensions, benefits, paid time off, payroll taxes,
and expected employee levels. The labor loading process applies the labor
loading rate to each labor dollar, assigning an appropriate amount of pensions,
benefits, paid time off, and payroll taxes to each account to which labor has been
16 charged.
4417 Q How were labor loadings for Arizona and corporate employees annualized in this
18
4419 A.
20
21
22
23
24
proceeding?
For benefits with premiums or regular monthly payments, the amount recorded
in November 2015 was multiplied by twelve months to more accurately reflect
current expenses. Southwest Gas used the most recent actuarial amounts,
which are also used by the Company to accrue related expenses for 2016, as
the basis for annualizing pension, PBOP, and SERP costs. Consistent with prior
Commission decisions, the Company removed certain items recorded in the
Miscellaneous Benefits subaccount from the cost of service, such as costs25
-18-
1
2
3
4
5
6
related to service awards, retirement gifts and parties, and employee
recognition. Also, adjustments were made to remove out of period charges from
the test year, and to bring in test year charges recorded out of period. In addition,
payroll taxes, 401 k match, and indirect time were adjusted for the impact of
annualizing payroll and overtime. For the remaining costs in Account 926,
recorded test year costs were used as the basis for the annualization. These
7 adjustments are consistent with prior Commission decisions.
8 There were two methods used to allocate labor loading costs to Arizona.
9 First, the total cost of pensions, PBOP, SERP, executive deferred compensation,
10
11
12 l
i
13iil
14i
1 5
16
4517 Q.
and employee investment plan (401 k) was allocated based on each rate
jurisdiction's labor cost as a percentage of total Company labor. Second, for the
remaining benefits, a cost per employee was calculated based on the adjusted
costs divided by the total number of Company employees at the end of the test
year. The cost per employee was multiplied by the number of Arizona
jurisdictional employees at the end of the test year to determine the amount
allocated to Arizona for rate making purposes.
Once the annualized labor and labor loadings were calculated, how was the
18
4519 A.
20
21
22
23
24
25
adjustment determined?
The annualized labor and labor loadings were assigned to each account based
on the historical test year relationships For example, during the test year,
approximately 73 percent of Arizona direct labor and loadings were charged to
operations and maintenance (O&M) accounts. Therefore, 73 percent of the
annualized Arizona direct labor and loadings were assigned to O8tM accounts.
The difference between the annualized labor and loadings assigned to the O&M
accounts and the recorded labor and loadings is the adjustment for that account.
-1g-
1
2
3
4
5
Since 73 percent of the annualized Arizona direct labor and loadings were
assigned to O&M, the remaining 27 percent were assigned to capital and
deferred accounts, and do not impact the revenue requirement requested in this
application. A similar assignment was performed for corporate staff annualized
labor and loadings to determine the adjustment required.
6 Adjustment No. 4 - Call Center and Customer Support Allocation and Annualization
467 Q. Please explain Adjustment No. 4 - Call Center and Customer Support Allocation
and Annualization.8
46g A.
10
11
12
13
14
15
There are two parts to this adjustment. The first part of this adjustment allocates
the proper percentage of this function to Arizona customers. The second part of
this adjustment annualized the call center function to reflect a full year of contract
employees at the end of the test year, to synchronize with the number of
Company call center employees at the end of the test year. This adjustment
preserves the matching principle by ensuring rates approved in this proceeding
better reflect the costs that will be incurred by the Company during the period
rates will be effective.16 This adjustment increases operating expenses by
17 $2,180,175
4718 Q.
4719 A.
There are also20
21
22
23
24
25
Please describe the Company's call center and customer support function.
There are presently three customer assistance call centers in Southwest Gas'
service territory: Phoenix, Tucson, and Las Vegas, Nevada.
remote agents that are staffed by contract employees. Customers call a toll-free
telephone number, and the call is routed to the next available agent, no matter
where that agent is located. The agents are trained to respond to customer
inquiries regardless of where the customer is located. There are also Company
employees who provide back office customer support primarily in Victorville,
-20-
1 California and Carson City, Nevada. All call centers and both customer support
2
483 Q.
4 A. 48
5
6
7
locations handle customer inquiries and reporting for the entire Company.
Why is an adjustment necessary to properly allocate these costs to Arizona?
Call center and customer support function costs are aggregated on Southwest
Gas' books by operating division for cost management purposes. However,
since Southwest Gas is requesting recovery for Arizona jurisdiction-related costs
in this proceeding, an adjustment is necessary. These costs are therefore
8
g
10
aggregated on a total company basis, and then reallocated to Arizona based on
number of customers, which is the Factor IV component of the 4-Factor
discussed earlier in my testimony, and is calculated on Schedule C-1, Sheet 17,
11 Line 8. The adjustment reflects the difference between the amount recorded on
Southwest Gas' books and the reallocated amount.12
13 Adjustment No. 5 - Cost of Service Analysis
14 49Q.
15 A. 49
16
17
18
191
120 11
1
21
Please explain Adjustment No. 5 - Cost of Service Analysis.
Southwest Gas conducted an analysis of its operating expenses to: 1) determine
if there were costs recorded during the test year for which Southwest Gas is not
requesting recovery in this proceeding, 2) adjust recorded expenses so a full
year's worth of expense is reflected- no more and no less, 3) annualize items
with significant cost changes, and 4) determine whether the test year contains
material, non-recurring costs. Adjustment No. 5 reflects the results of this
analysis. The amounts removed from and added to the cost of service are
22
23
24
summarized by account in Schedule C-2, Adjustment No. 5 and the supporting
work papers categorize all transactions by the type of cost. This adjustment
reduces operating expenses by $429,388.
25
-21-
1 Adjustment No.6 - Employee Vehicle Compensation
502 Q.
503 A.
4
5
6
Please explain Adjustment No. 6 - Employee Vehicle Compensation.
Adjustment No. 6 removes from test year expenses the cost of Company
vehicles related to personal use by employees. This adjustment is consistent
with those approved in Southwest Gas' last several rate cases. This adjustment
reduces operating expenses by $62,108.
7 AdjustmentNo. 7 - Uncollectible Expense Annualization
518 Q.
519 A.
Please explain Adjustment No. 7 - Uncollectible Expense Annualization.
Adjustment No. 7 annualized the recorded amounts in Account 904,
10 Uncollectible Expenses, to reflect the test year net closing bill write-offs as a
11 The write-off percent applied to presentpercentage of gross revenues.
12 revenues determines the annualized amount, which is then compared to the
13 recorded uncollectible expense to determine the adjustment amount. This
14 adjustment is consistent with those approved in Southwest Gas' last several rate
15 cases. This adjustment increases operating expenses by $582,100.
16 Adjustment No. 8 - Leak Survey and Repair
5217 Q.
5218 A.
19
20
5321 Q.
22
5323 A.
24
25
Please explain Adjustment No. 8 - Leak Survey and Repair.
Adjustment No. 8, Leak Survey and Repair, reduces test year accelerated leak
survey and leak repair expense related to Aldyl HD pipe consistent with prior
Commission decisions. This adjustment reduces operating expenses by $33.
Why is the amount of this adjustment so small as compared to the Company's
prior rate case?
All known Aldyl A pipe has already been replaced in southern Arizona. With the
exception of some short segments totaling approximately 1000 feet, the
replacement of all known Aldyl HD pipe was complete in southern Arizona by
_22-
1 the end of 2012. As such, test year expenses related to leak survey and leak
2 repair on these pipe types in southern Arizona were minimal.
3 Adjustment No. 9 - Injuries and Damages
544 Q.
545 A.
6
557 Q.
8
559 A.
10
11
12
13
Please explain Adjustment No. 9 - Injuries and Damages.
Adjustment No. 9 adjusts the recorded self-insured accruals charged to Account
925 during the test year to a normalized level.
What was the Company's level of self-insurance for general liability claims at the
end of the test year?
The Company is self-insured for up to $1 million of claims expense for each
occurrence (per occurrence component). To the extent that a specific claim
exceeds $1 million, the Company is self-insured for the excess over $1 million
up to an aggregate (aggregate component) of $4 million. Once the $4 million
aggregate is reached, any amount paid above the $4 million is the responsibility
of the insurance carrier.14
15
16
17
18
19
20
21
22
23
24
The $4 million aggregate can be the result of layouts from more than one
incident that may occur in more than one rate jurisdiction. Given the potential
multi-jurisdictional nature of amounts recorded beyond the $1 million per
occurrence component and up to the $4 million aggregate, the Company treats
the aggregate component as a system allocable expense. The $4 million
aggregate results in a lower insurance premium expense than if the Company
maintained a lower aggregate component, or had no aggregate component.
Accordingly, any amounts recorded under the aggregate component of injuries
and damages expense should be treated similarly as the insurance premium
expense and be treated as a system allocable expense.
25
_23-

1
2
3
4
The up to $1 million per occurrence component has no annual limit as to
the number of claims, is claim specific, and does not include costs emanating
from more than one rate jurisdiction. Indeed, the per occurrence component of
injuries and damages expense should be treated as a direct jurisdictional
5
566 Q.ll7 A. 56
8
expense.
Please explain the accounting for the self-insured portion of liability claims.
When an incident is identified that may require payment, the Company accrues
the estimated payment as a self-insured retention expense. The entry is a debit
9 to Account 925, Injuries and Damages, and a credit to Account 228.2,
10
11
Accumulated Provision for Injuries and Damages. Once the outcome of the
claim becomes final, any costs paid are charged against the accrual in Account
12 228.2. If the amounts paid are different than the amount accrued, then the net
difference is removed from Account 228.2 and charged back against Account13
925.14
5715 Q.
16
Given the method used to account for the self-insured portion of liability claims,
does the test year expense reflect on-going operations?
5717 A. No. It is not unusual to have fluctuations in the net charges to Account 925 from
18 period-to-period because of the nature of the method used to account for this
19
20
21
22
process, and the fact that large claims that reach the $4 million aggregate do not
occur every year. This can result in Account 925 having an expense level during
any given recorded period not being representative of on-going operations. For
this reason, it is appropriate to normalize this cost based on claims experience
23
5824 Q.
over the last ten years.
Please explain the normalized adjustment to self-insured expense.
25
-24-
581 A.
l2l
3 l
1l
4
5
6
7
The Company uses a ten-year average of self-insured amounts to normalize this
expense for rate making purposes. Schedule C-2, Adjustment No. 9, shows that
the ten-year average of Arizona direct claims is $626,035 compared to the test
year amount of $106,354, requiring a $519,680 adjustment. The ten-year
average system allocable expense is $950885 compared to the test year
amount of $622,500, requiring a $328,385 adjustment. After allocating a portion
of this expense to Paiute, the Arizona portion of this adjustment is an increase
8 of $176,517. The total impact of this adjustment on Arizona's operating
g expenses is $696,197.
10 Adjustment No. 10 - AGA Dues
5911 Q.
12 A. 59
13
Please explain Adjustment No. 10 - AGA Dues.
Adjustment No. 10 removes $13,516 from operating expenses, which is the
portion of the Company's dues to the American Gas Association (AGA) identified
14 as lobbying in nature.
15 Adjustment No. 11 - Paiute Pipeline/SGTC Allocation Annualization
Paiute Pipeline/SGTC Allocation6016 o. Please explain Adjustment No. 11
17 Annualization, which you previously referred to in your response to Question
No. 10.18
6019 A.
20!
l
Adjustment No. 11 annualized the system allocable A&G amounts allocated to
Paiute through the MMF allocation methodology, the insurable property factor,
and the rent revenue that Southwest Gas receives from Paiute for the test year21
22 ended November 30, 2015. The supporting workpapers to Adjustment No. 11
show the detailed calculations needed to derive the Paiute rent expense and23
24 insurable property factor at November 30, 2015. This adjustment is consistent
25
-25-
1 with the methodology approved by the Commission in the Company's last
several rate cases.2
The annualized MMF allocation factors are also used in the pro forma3
4
5
6
adjustments that impact system allocable A8<G costs, in order to allocate a
portion of the adjustment to Paiute and SGTC before calculating the portion that
is allocated to Arizona. This adjustment reduces operating expenses by $90,012.
7 Adjustment No. 12 - Rate Case Expense
618 Q.
619 A.
10
11
12
13
14
Please explain Adjustment No. 12 - Rate Case Expense.
The Company estimated the incremental costs that would be incurred to prepare
and process this general rate case, including printing, postage, court reporting,
noticing, publication, travel, and outside consultants. The total incremental costs
are divided by four, which is roughly equal to the number of years in one rate
case cycle, to calculate an annual amortization to Account 928. The adjustment,
which increases operating expenses by $35,112, is the difference between this
new amortization amount and the amount of rate case expense amortized on15
16 the Company's books during the test year.
17 Adjustment No. 13 - Depreciation and Amortization Expense Annualization
6218 o.
1
Please explain Adjustment No. 13 - Depreciation and Amortization Expense
Annualization.19ll
6220 Al
2 1
Adjustment No. 13 annualized depreciation and amortization expense based on
adjusted plant in service at November 30, 2015, using currently approvedi
22 This adjustment increases operating expenses by li
23
depreciation rates.
$8,195,254. iiii
6324 Q.
25
Please explain why an adjustment is necessary to annualize depreciation and
amortization expense for the test year. ill
-26_ll
l
l
lJ

i
i
1 A. 63 This adjustment is necessary to synchronize the depreciation and amortization
2 expense with the plant in service at the end of the test year, as adjusted. Like
3 many utilities, Southwest Gas employs a depreciation convention based on the
4 Southwest Gas beginsmonth the plant is actually placed into service.
5
6
7
8
91
10
depreciation on plant the month subsequent to the month it is first placed in
service, and in turn, takes a full month's depreciation in the month it is removed
or retired from service. As a result, plant that is placed in service or retired after
the beginning of the test year has a partial year's depreciation expense recorded
on the books of the Company. To allow Southwest Gas the opportunity to
recover its reasonable and necessary operating expenses and to avoid charging
or retired from service, depreciation andcustomers for assets removed11
li
il1iE1
12
13 li
1 4
amortization must be annualized based on end of test year plant balances, as
adjusted. This adjustment accomplishes those objectives, and is consistent with
the methodology approved by the Commission in the Company's previous rate
cases.15
16 Adjustment No. 14 - Depreciation and Amortization Expense at New Rates
6417 Q. Please explain Adjustment No. 14 - Depreciation and Amortization Expense at
New Rates.18
6419 A.
iA20
21
\ll2 2
23
The Settlement Agreement from the Company's last GRC required Southwest
Gas to file a comprehensive depreciation study in this proceeding.
depreciation study for Arizona plant was prepared for this GRC, and a System
Allocable plant depreciation study was prepared for and approved in the
Company's last Nevada general rate case. Both of these studies were prepared ll
l
24
25
and sponsored by Company witness Dane Watson. The use of the most recently
approved System Allocable depreciation study filed in Nevada for updating the
-27_
iili
i
i
i
l
i
1
2
3
4
related depreciation rates is consistent with the Company's previous Arizona
rate cases. This adjustment calculates the difference in depreciation expense
due solely to the change in depreciation rates proposed by the Company. This
adjustment decreases operating expenses by $41 ,806,078.
5 Adjustment No. 15 - Property Tax Annualization
656 o.
657 A.
8
g
10
11
12
13
14
15
16
Please explain Adjustment No. 15 - Property Tax Annualization.
Adjustment No. 15 annualized property taxes on the Company's adjusted
investment in plant and materials as of the end of the test year. For Arizona
properties, the Company determines an estimated full cash value by using
adjusted net plant in service at November 30, 2015, adding materials and
supplies, and subtracting transportation equipment and land rights. The
estimated full cash value is then multiplied by the assessment ratio of 18 percent
to determine the assessed value. The assessed value is then multiplied by the
composite property tax rate of 14.11 percent, which is then reduced by
capitalized property taxes to determine the annualized property tax expense.
This adjustment increases operating expenses by $7,337,348.
17 Adjustment No. 16 - Interest on Customer Deposits
6618 Q.
6619 A.
20
Please explain Adjustment No. 16 - Interest on Customer Deposits.
Adjustment No. 16 synchronizes interest expense on customer deposits with the
amount of customer deposits used as a rate base reduction. The customer
21
22
deposit balance used as a rate base reduction is multiplied by the customer
deposit rate of six percent to determine the adjusted interest on customer deposit
23 The difference between the adjusted amount and thebalance expense.
24 Consistent with prior Commissionrecorded amount is the adjustment.
25
-28_
1 decisions, interest expense is treated as an above-the-line expense. This
2 adjustment increases operating expenses by $35,049.
3 Adjustment No. 17 - Surcharge Adjustment
674 Q.
675 A.
6
7
8
Please explain Adjustment No. 17 - Surcharge Adjustment.
Adjustment No. 17 removes expenses from base rates that are recovered
through various surcharges, including the Gas Research Fund (GRF) surcharge,
the Demand Side Management Program surcharge, and the Transmission
Integrity Management Program surcharge. This adjustment reduces operating
In addition, the Company proposes to increase9 expenses by $8,015,970
10
11
6812 Q.
6813 A.
14
15
16
17
18
funding for natural gas research to $820,000 per year, and to include this amount
in base rates instead of a surcharge.
Why does Southwest Gas propose to increase funding for natural gas research?
The level of annual funding for natural gas research is $688,712, which was
authorized by the Commission in the Company's 2004 GRC (Decision No.
68487) and has remained at the same level for the last decade. When the GRF
surcharge was initially approved by the Commission, it was recognized that there
is a need for, and a gap in, industry-wide funding. The GRF filled some of that
gap. The need for natural gas research funding still exists, and inflation has
eroded the contribution that authorized GRF dollars are making to fund these19
20
6921 Q.
22
worthwhile projects.
What level does Southwest Gas propose to increase its annual funding to be
recovered through the GRF surcharge, and what is this increase based on?
6923 A.
24
Southwest Gas proposes to increase the annual amount from $688,712 to
$820,000. This increase keeps the GRF cost per customer at approximately the
25
-29_

1 same level as it was in the 2004 GRC when the GRF was initially approved by
the Commission.2
703 Q. Does Southwest Gas propose any changes to Finding of Fact No. 37 in Decision
4 No. 68487 that..."Southwest Gas should have the flexibility, subject to Staff
i t
5
706 A.
7
8
719 Q.
10
11
12
7113 A.
14
15
16
oversight, to select appropriate entities for use of the research funds.
No. Southwest Gas will continue to file an annual plan that provides a list and
description of the research programs to be funded by the Company through the
GRF, in order to allow Staff to maintain its oversight over this program.
The Settlement Agreement from the Company's last GRC required Southwest
Gas to include the progress and money spent on early vintage plastic pipe
(EVPP) replacement. What is the progress and money spent on EVPP since the
Company's last GRC?
EVPP consists primarily of polyvinyl chloride (plc) pipe, Aldyl A polyethylene
pipe, and Aldyl HD polyethylene pipe. Since the last GRC, Southwest Gas has
replaced approximately 408,000 feet of PVC pipe, 700,000 feet ofAldyl HD pipe,
and 2.2 million feet of Aldyl A pipe in Arizona. The cost to replace this pipe was
17
7218 Q.
approximately $169 million.
Does this conclude your prepared direct testimony?
Yes .7219 A.
20 il
21
22
23
24
25
-30-
Appendix APage 1 of 2
SUMMARY OF QUALIFICATIONSRANDI L. CUNNINGHAM
I am a Certif ied
I graduated from the University of Washington in Seattle, Washington with a Bachelor
of Arts in Business Administration, Accounting. My areas of concentration were accounting
and finance. I graduated from the University of Nevada, Las Vegas with a Masters in
Business Administration (MBA), with Beta Gamma Sigma honors.
Management Accountant (CMA) and a member of the Institute of Management Accountants.
One year before completing my bachelor's degree, I accepted employment at
Washington Mutual Savings Bank in Seattle, Washington as an Asset/Liability Management
intern. Upon graduation in 1993, I accepted a full-time position as a Financial Analyst Trainee
in the Financial Forecasting Department. In 1994, I was promoted to Financial Analyst I. My
responsibilities included assisting in the budget and forecasting process and various financial
analyses.
In February 1995, l accepted a position as a Budget Analyst in the Budget and
Forecasting Department at PriMerit Bank in Las Vegas, Nevada, which was a subsidiary of
Southwest Gas at the time. In April 1996, l transferred to Southwest Gas as a Corporate
Accountant I in the Accounting Control Department. in January 1998, I was promoted to
Analyst l/Accounting. In February 1998, I transferred to the Revenue Requirements
department as an Analyst. In January 2001 I was promoted to Specialist, in July 2003 I was
promoted to Senior Specialist, in May 2007 I was promoted to Supervisor, and in April 2009
I was promoted to Manager. Subsequent to a reorganization in October 2014, I have worked
in the Regulation department in my present position.
I have attended numerous training and technical conferences related to utility
ratemaking regulatory, and accounting issues.

Appendix APage 2 of 2
I taught the Cost of Service Problem for "The Basics" conference presented by the
Center for Public Utilities at New Mexico State University and the National Association of
Regulatory Utility Commissioners from 2003 to 2014.
l
ll
iI

EXHIBIT no. A-11
DIRECT TESTIMONY-THEODORE K. WOODl
1l\
Il
I
Ili
8 EXHIBIT
i!E5
e
1
IN THE MATTER OF
SOUTHWEST GAS CORPORATION
DOCKET no. G-01551A-16-0107
PREPARED DIRECT TESTIMONY
OF
THEODORE K. WOOD
ON BEHALF OF
SOUTHWEST GAS CORPORATION
MAY 2, 2016
Table of Contentsof
Prepared Direct Testimonyof
THEODORE K. WOOD
Description Paqe No.
I.
II.
ill.
SOUTHWEST GAS' FAIR VALUE RATE OF RETURN .. 3
SOUTHWEST GAS' FINANCIAL PROFILE 5
A.
B. Energy Efficiency Enabling Provision 9
C Change in Depreciation Rates................. 10
D Gas Infrastructure Modernization (GIM) Program 12
E. Capital Attraction .............
RECOMMENDED CAPITAL STRUCTURE 19
EMBEDDED COST OF LONG TERM 20
FAIR VALUE RATE OF RETURN FOR INCREMENTAL INVESTMENTS 23
iv.
v.
vi .
Appendix A .- Summary of Qualifications of Theodore K. WoodI
II
Exhibit No.__(TKW-1)
Exhibit NO._(TKW-2)
Exhibit No.__(TKW-3)

1 Southwest Gas CorporationDocket No. G-01551A-16-0107
2
BEFORE THE ARIZONA CORPORATION COMMISSION3
4 Prepared Direct Testimonyof
THEODORE K.WOOD5
I. INTRODUCTION6
17 o .
18 A.
9
210 Q.
211 A.
Please state your name and business address.
My name is Theodore K. Wood. My business address is 5241 Spring Mountain
Road, Las Vegas, Nevada 89150.
By whom and in what capacity are you employed?
I am employed by Southwest Gas Corporation (Southwest Gas or the Company)
12 My title is Assistant Treasurer 8.in the Financial Services department.
Director/Financial Services.13
314 Q. Please summarize your educational background and relevant business
15
316 A.
17
418 Q.
experience.
My educational background and relevant business experience are summarized
in Appendix A to this testimony.
Have you previously testified before any regulatory commission?
419 A Yes. I have previously testified before the Arizona Corporation Commission
20
21
22
523 Q.
524 A.
25
(ACC or Commission), the Public Utilities Commission of Nevada (PUCN), and
the California Public Utilities Commission (CPUC). I have also provided written
testimony to the Federal Energy Regulatory Commission (FERC).
What is the purpose of your prepared direct testimony in this proceeding?
I sponsor the Company's overall requested rate of return. Specifically, my direct
testimony details the requested capital structure and the embedded cost of long-
-1-
1
2
3I
I
I
4
5
6
67 Q.
68 A.
9
term debt used for determining the appropriate cost of capital for the Company's
Arizona rate jurisdiction. In addition, I discuss the importance of the Company's
overall rate of return on the Company's bond ratings and financial profile. I also
discuss the appropriate fair value rate of return (FVROR) methodology for
rate making and to how that methodology should be applied in conjunction with
the Company's proposed Gas Infrastructure Modernization (GIM) mechanism.
Please summarize your prepared direct testimony.
My prepared direct testimony consists of the following key topics:
• The development of a FVROR necessary for the Company to earn a fair
10
•11
return on its Arizona properties,
A review of the Company's financial profile, addressing the Company's
12 credit ratings and their importance in accessing the capital markets. In
13
14
15
16
17
18
doing so, l comment on the actual credit rating impacts from decoupling
and the potential impacts from the change in depreciation rates and the
Company's proposed GIM mechanism. I also comment on the need for
Southwest Gas to offer a competitive rate of return to continue to attract
capital and discuss why Southwest Gas' requested overall FVROR is
necessary to support and sustain the Company's financial profile and credit
19
•20I.21
22
23
ratings,
The Company's requested capital structure for ratemaking, which is
composed of 51.69 percent common equity and 48.31 percent long-term
debt. The requested capital structure is the Company's actual capital
structure for the test period ended November 30, 2015;
24
25
-2-
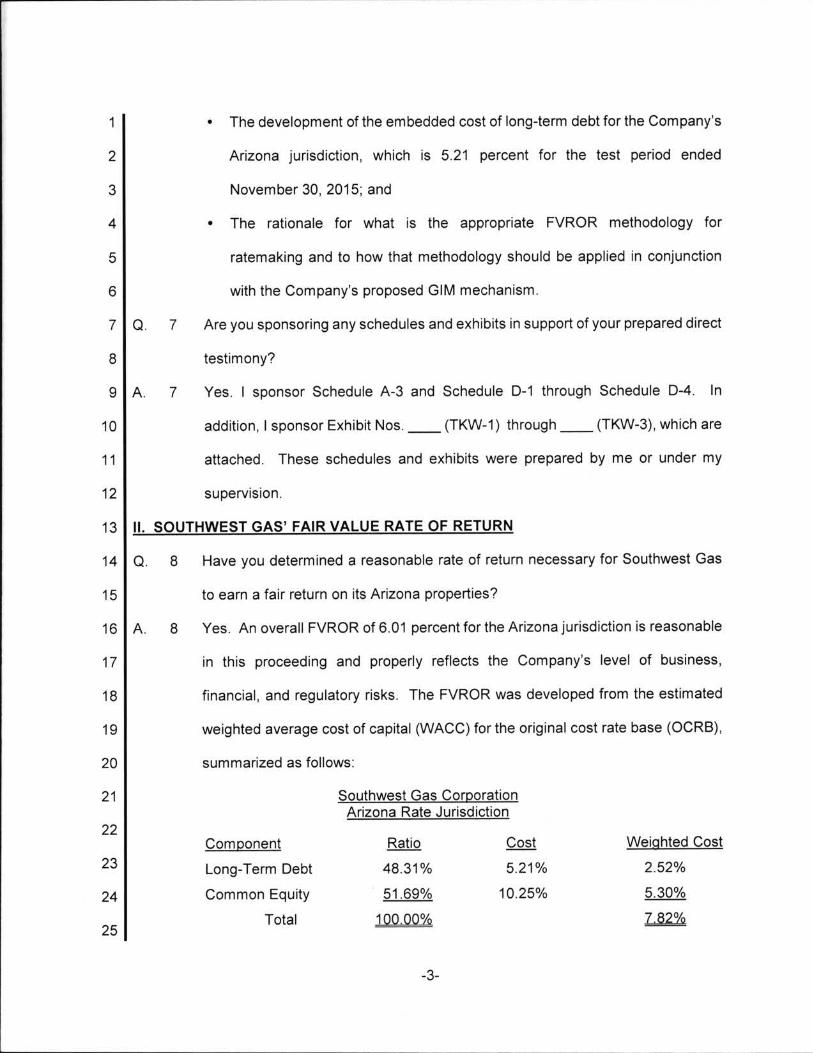
»1
2
3
The development of the embedded cost of long-term debt for the Company's
Arizona jurisdiction, which is 5.21 percent for the test period ended
November 30, 2015, and
4
5
6
The rationale for what is the appropriate FVROR methodology for
rate making and to how that methodology should be applied in conjunction
with the Company's proposed GIM mechanism.
77 o.
8
Are you sponsoring any schedules and exhibits in support of your prepared direct
testimony?
79 A. Yes. I sponsor Schedule A-3 and Schedule D-1 through Schedule D-4. In
10 (TKW-3), which are(TKW-1) throughaddition, l sponsor Exhibit Nos.
11 attached. These schedules and exhibits were prepared by me or under my
12 supervision.
II. SOUTHWEST GAS' FAIR VALUE RATE OF RETURN13
814 o . Have you determined a reasonable rate of return necessary for Southwest Gas
15 to earn a fair return on its Arizona properties?
816 A. Yes. An overall FVROR of 6.01 percent for the Arizona jurisdiction is reasonable
17
18
19
in this proceeding and properly reflects the Company's level of business,
financial, and regulatory risks. The FVROR was developed from the estimated
weighted average cost of capital (WACC) for the original cost rate base (OCRB),
summarized as follows:20
21 Southwest Gas CorporationArizona Rate Jurisdiction
l
i
i
9
22
23
l
l
l
l
Co s t
5.21%
10.25%24
Component
Long-Term Debt
Common Equity
Total
Weighted Cost
2.52%
5.30%
1.82%
Ratio
48.31%
51 .69%
1Q0QQf4Q25
-3-
\\\\

1
2
3
4 Q. 9
The resulting FVROR to be applied to the fair value rate base is 6.01 percent
(the prepared direct testimony of Company witness Robert Hevert details the
methodology used to derive the FVROR)
Why is the proposed rate of return appropriate and necessary for Southwest
Gas?5
6 A. 9
7
8
g
This rate of return is necessary to maintain the Company's financial integrity, to
allow the Company to attract new capital and to permit the Company's equity
holders the opportunity to earn a fair and reasonable rate of return (RoR).
Moreover, this rate of return meets the standard of reasonableness
10 established by the United States Supreme Court in Bluefield Water Works 8i
11 Improvement Co. v. Public Service Commission of West Virqinia, 262 U.S. 679
12 (1923)(Bluefield)1
13
14
15
The return should be reasonably sufficient to assure confidencein the financial soundness of the utility, and should be adequate,under efficient and economical management, to maintain andsupport its credit and enable it to raise the money necessary forthe proper discharge of its public duties.
16
17 This rate of return also satisfies the comparability standard set by the
Court in Federal Power Commission v. Hope Natural Gas Company, 320 U.S.18
591 (1944)(Hope):19
20
21
... the return to the equity owner should be commensurate withreturns on investments in other enterprises having correspondingrisks.
22
23 An explanation regarding the practical application of these two court
rulings to a diversified utility such as Southwest Gas is appropriate.24
ii
l
25i
-4-
l
1 The Company has, since the late 1950s, filed rate cases as a "diversified"
2 utility. The multi-jurisdictional rate case fi l ings are based on the fact that
3 Southwest Gas, as a natural gas utility, serves three states with several different
4 rate making jurisdictions. The Company requests only gas distribution utility
5 required rates of return in all filings within each jurisdiction. The capital costs
6 requested in this filing are utility-only costs. Southwest Gas' practices assure
7 that the costs of utility operations attributable to each of its jurisdictions are
8 properly insulated from the impact of any non-utility activities.
g In summary, Southwest Gas' requested rate of return in this proceeding
10 is fair to both customers and shareholders and properly reflects the risks and
11 returns appropriate for its gas distribution properties.
Ill. SOUTHWEST GAS' FINANCIAL PROFILE12
13 A. Credit Ratings
14 Q. 10
1015 A.
What is a credit rating?
A c red i t ra t ing re f lec ts an independent ra t ing agency 's op in ion o f the
16
17
creditworthiness of a particular company, security, or obligation. Credit ratings
play an important role in capital markets by providing an effective and objective
18 tool for market participants to evaluate and assess credit risk. In a report on the
19 role and function of credit rat ing agencies, the Securi t ies and Exchange
20 Commission (SEC) concluded:
21
22
23
The importance of credit ratings to investors and other marketparticipants had increased significantly, impacting an issuer'saccess to and cos t o f cap i ta l , the s t ruc tu re o f f i nanc ia ltransactions, and the ability of fiduciaries and others to makeparticular investments.l
24
251 SEC "Report on the Role and Function of Credit Rating Agencies in the Operation of the SecuritiesMarkets," January 24 2003.
-5-
1
2
3
4
5
As a result, the Company's credit ratings are a key factor in determining the
required yield on the Company's debt securities and bank facilities, and the
amount and terms of available unsecured trade credit. Credit rating agencies
use both quantitative and qualitative information in the process of developing a
credit rating.
6 Q. 11 How important is the regulatory environment in the determination of a credit
7 rating for a public utility?
8 A. 11 For a public utility, credit rating agencies regard regulation as a significant factor
g in determining financial performance, as regulation defines the environment in
10 which the utility operates. The importance of regulation on the credit rating for a
11 utility is reflected in the following statement from Standard & Poor's (S8tP):
12
13
14
Based on Standard & Poor's Ratings Services' experience inrating U.S. investor-owned uti li ties, we believe that thefundamental regulatory environment can be one of the mostimportant factors we analyze when assigning utility creditratings?
15 Similarly, Moody's Investors Service (Moody's) states:
16
l17
For a regulated utility, the predictability and supportive ness of theregulatory f ramework in which it operates is a key creditconsideration and the one that differentiates the industry frommost other corporate sectors.3
18
19 Q. 12
20 A. 12
21
What are the Company's current long-term unsecured debt credit ratings?
Currently, Southwest Gas' long-term unsecured debt credit ratings are "A" from
Fitch, Inc. (Fitch), "AS" from Moody's, and "BBB+" from S8tP.
22
23
24
25
2 Standard 8t Poors RatingsDirect Credit FAQ. Standard & Poor"s Assessments Of Regulatory ClimatesFor U.S Investor-Owned Utilities November 25, 2008 p. 2.3 Moodys Investors Service Moody's Rating Methodology, Regulated Electric and Gas Utilities, August2009 p. 6.
-6-
1 Q. 13 What is the Company's current credit rating outlook?
2 A. 13
1 3
Credit rating agencies also provide a credit ratings outlook, which is an
assessment of the direction of the credit rating over the intermediate to longer
4 term. The current credit rating outlooks for Southwest Gas provided by each
5
6
7 Q. 14
of the three rating agencies are "stable." The latest available credit agency
reports are included in Exhibit No._(TKW-1).
Have there been any changes in Southwest Gas' credit ratings since the
8
g A. 14
10
Company's last Arizona general rate case?
Yes. The table below displays the Company's unsecured credit ratings at June
30, 2010 (the test period for the Company's last general rate case) compared
11
12
13
14
June 30, 2010
BBB
Baa2
BBB
Current
BBB+
AS
A
Rating Agency
S&P
Moody's
Fitch
to the current ratings.
Last Change
October 2014
January 2014
May 2013
15
16
17
18
Since the last general rate case, the Company's credit ratings and
financial profile have improved. The improved financial profile reflects the
combined outcome from the significant common stock issuances over the last
19
20
21
22
decades and improved operating results. Given the improved credit ratings and
the low interest rate environment, the Company has been able to significantly
reduce the embedded cost of debt, going from the authorized 8.34 percent in
the Company's last general rate case to a now-requested 5.21 percent cost of
debt.23
24
ll25
4 Over the period December 31 2005 to December 31 2015, the Company has issued 8049,284shares of common stock, which is approximately 17 percent of the shares outstanding.
-7-
151 Q Has the Company taken any action to maintain its strong investment grade credit
2
15
rating?
Yes. Southwest Gas filed a Notice of Intent in Docket No. G-01551A-15-0_513 A
4
5
6
7
8
9
10
11
12
requesting authority to implement a Plan of reorganization (plan) that will result
in a holding company structure. A holding company structure will further the
separation between the Company's utility operations and its construction
services affiliates. The proposed holding company structure will also work to
reduce financial and legal risk to the utility, and offers greater flexibility in
financing by allowing both the utility and the holding company to individually
access capital markets. A key benefit is that it will enable the utility business of
Southwest Gas to obtain separate credit ratings apart from the new consolidated
entity, which should help insulate the utility from the impacts of a larger
construction services business. In addition, the proposed holding company13
14
15
1616 Q
17
1618 A
19 This commitment by
20
21
structure will provide optionality in managing the construction services segment
percentage of the consolidated entity.
What other steps has the Company taken to maintain its strong investment grade
credit ratings?
Southwest Gas is committed to maintaining an appropriate capital structure to
support its strong investment grade credit ratings.
Southwest Gas has been demonstrated by its willingness to continue to issue
new equity to finance its investment in utility plant and maintain its capital
22 structure with the establishment of a $100 million Equity Shelf Programs During
23
24
25
5 In March 2015, the Company filed with the SEC a shelf registration statement which includes aprospectus detailing the Companys plans to sell up to $100 million of the Companys common stock overa period of time. In March 2015, the Company entered into a Sales Agency Agreement with BNY MellonCapital Markets LLC relating to this issuance and sale of shares of the Company's common stock ("Equity
-8-

i
1 2015, the Company issued 645,225 shares of common stock under this program,
li2 raising net proceeds of $35.2 million.
3 B. Energy Efficiency Enabling Provision
4 o. 17
5
Is the Company requesting the continuation of the decoupled rate design which
is contained in the previously approved Energy Efficiency Enabling Provision
6
7 A. 17
8
9 Q. 18
(EEP)'?
Yes. The prepared direct testimony of Company witness Edward Gieseking
details the rationale for the Company's proposed continuation of the EEP.
Has the Company's decoupled rate design been a positive credit rating factor?
10 A. 18 Yes. The decoupled rate design has been a positive contributing factor in
11
12
13
14
15
16
17
Southwest Gas' ability to improve its credit ratings in two ways: (1) improved
credit metrics due to less volatile cash flows and revenues; and (2) as a sign of
increased regulatory support by the ACC. In its last general rate case,
Southwest Gas stated that one of the key benefits of the Company's EEP would
be to its credit ratings, as the EEP would be viewed by rating agencies as being
credit supportive and, over time, would help to strengthen Southwest Gas'
financial metrics leading to improved ratings.*3 With the approval of decoupling,
18 in conjunction with improved operating results and an improved capitalil!
19
20
21
structure - stemming from the significant common stock issuances over the last
decade while maintaining a conservative dividend policy, improved credit
ratings have been realized. The improved credit ratings have contributed to a
22
23
24
25
shelf Program"). Sales of the shares will continue to be made at market prices prevailing at the time ofsale. Net proceeds from the sale of shares of common stock under the Equity Shelf Program will be usedfor general corporate purposes, including the acquisition of property for the construction, completion,extension or improvement of pipeline systems and facilities located in and around the communitiesSouthwest Gas serves.s Prepared direct testimony of Theodore K. Wood, Docket No. G-01551A-10-0458, p.7-9.
-g-

1
2
3
4
significant reduction in the embedded cost of debt since the Company's last
general rate case. The approval of a decoupled rate design has been cited by
the rating agencies as a contributing positive factor in the upgrades. For
example, Fitch, in its press release for the Company's upgrade to BBB+ from
5 BBB (June 2, 201 1), stated:
6ll
7l
8
... a push toward more decoupled rate structures within SWX'soperating jurisdictions has helped to lower some of the revenuevolatility associated with the effects of weather and conservation.Fitch generally views the implementation of rate mechanismssuch as decoupling that reduce cash flow volatility favorably;7
g
10
In addition, with the upgrade by Moody's to Baal from Baa2 (March 15, 2012),
Moody's stated, "...the implementation of gas de-coupling [is] supportive to
11 S&P directly pointed out the improvedSouthwest's credit quality".8
12 regulatory environment in Arizona for Southwest Gas due to the approval of
13 decoupling, stating:
14
15I
In our opinion, regulation in Arizona (historically considered oneo f the less credit-supportive jurisdictions) has improvedsubstantially because the ACC approved a decoupled ratedesign in Southwest Gas's latest rate case.9
16
17 C. Change in Depreciation Rates
18 o . 19
19
Is the Company proposing a change in the book depreciation rates for its
Arizona jurisdiction?
20 A. 19 Yes. As part of the settlement agreement approved by the Commission in the
21 Company agreed to f i le aCompany's last general rate case,1° the
22
23
24
25
7 Fitch Ratings FitchRatings Upgrades Southwest Gas Corp. to B8B+; Outlook Stable, June 2 2011 ,p.1 ..8 Moodys Investors Service, Rating Action: Moody's Upgrades Southwest Gas Corp to Baal fromBaa2,. Outlook Stable, March 15, 2012, p.19 Standard & Poor's RatingsDirect, Summary: Southwest Gas Corp., March 20, 2013 p. 4.10 Decision No. 72723.
-10-
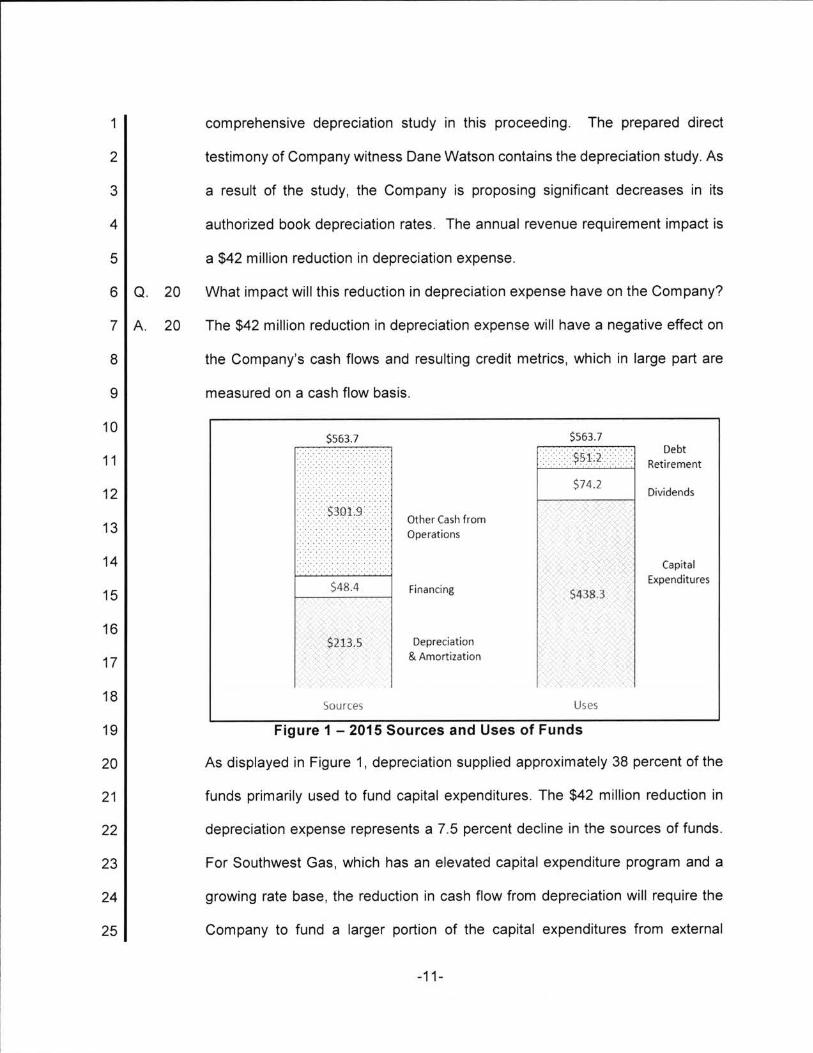
1 The prepared directcomprehensive depreciation study in this proceeding.
2 testimony of Company witness Dane Watson contains the depreciation study. As
3 a result of the study, the Company is proposing significant decreases in its
4 authorized book depreciation rates. The annual revenue requirement impact is
5 a $42 million reduction in depreciation expense.
206 Q. What impact will this reduction in depreciation expense have on the Company?
20A.7 The $42 million reduction in depreciation expense will have a negative effect on
8 the Company's cash flows and resulting credit metrics, which in large part are
measured on a cash flow basis.g
10
11$563.7
:3$S1£2- DebtRetirement
$74.2Dividends12
$563.7
f.$3m9".<13
Other Cash fromOperations
14 CapitalExpenditures
$48.4 Financing $438.315
16$213.5 Depreciation
& Amortization i1 7
l
18l lQ 5Bout L95
19 Figure 1 - 2015 Sources and Uses of Funds
20 As displayed in Figure 1, depreciation supplied approximately 38 percent of the
21 funds primarily used to fund capital expenditures. The $42 million reduction in
22 depreciation expense represents a 7.5 percent decline in the sources of funds.
23 For Southwest Gas, which has an elevated capital expenditure program and a
24 growing rate base, the reduction in cash flow from depreciation will require the
25 Company to fund a larger portion of the capital expenditures from external
-11_

1
2
sources, both debt and equity. At the same time, the cash flow based credit
metrics of the Company will be negatively impacted due to the reduction in cash
3 flows, which in turn could increase the cost of borrowing on a going forward
4 basis. The negative impact to the credit ratings from the lower depreciation rates
5
6
can possibly be mitigated by the Commission's approval of the Company's
proposed GIM mechanism.
D. Gas Infrastructure Modernization Mechanism7
8 Q. 21
9 A. 21
10
11
Please briefly describe the Company's proposed GIM mechanism.
Southwest Gas is proposing a GIM mechanism with respect to its investment
in certain non-revenue-producing gas infrastructure, non-revenue-producing
pipeline replacement programs, and the funding of unfunded government
The GIM would inc lude the12 mandates between general rate cases.
13
14
15 il
16
17 Q. 22
Company's currently-approved Customer-Owned Yard Line (COYL) Program.
The specif ic details of the Company's proposed GIM mechanism are
described in the prepared direct testimony of Company witnesses Edward
Gieseking and Kevin M. Lang.
How will the Company's proposed GIM help sustain the Company's financial
18
19 A. 22
20
21
22
profile?
The proposed GIM would improve Southwest Gas' ability to recover costs
associated with its non-revenue-producing infrastructure investments on a
more timely basis, which over time would help maintain Southwest Gas'
financial metrics, including its ability to earn its authorized ROR, and increase
23
24
25
the likelihood for Southwest Gas to improve its credit ratings. From a capital
attraction standpoint, the GIM would make Southwest Gas more comparable
to other natural gas utilities with similar mechanisms, or other mechanisms
-12-
1
2
3
that allow for timely recovery of infrastructure replacement costs. As reported
by Company witness Robert Hevert, all six of the proxy group companies used
to estimate the cost of common equity in this proceeding have infrastructure
4 recovery mechanisms."
5 Q. 23
6
7 A. 23
8
9
Would approval of the proposed GlM be recognized as a positive factor for
the Company's credit rating?
Yes. Rating agencies would view Commission approval of the GIM as a
positive regulatory support factor. As discussed below, this positive reaction
from the credit rating agencies was recognized following the Commission's
10
11
approval of the Company's COYL program. As the Company continues to
make significant investments in non-revenue producing infrastructure, it will
12
13
14
15
16
continue to experience increased expenses (capital costs, depreciation, and
property taxes), with the revenue increases associated with these capital
expenditures not being experienced until the Company's next general rate
case. From a credit ratings standpoint, this will cause key financial metrics,
such as funds from operations (FFO) to debt and FFO interest coverage, to
17 decline between general rate cases.
18 Specifically, rating agencies recognize the benefit from such
19 mechanisms, with S8¢P stating:
20
21
22
23
A utility's credit quality during construction projects will dependon credit-supportive regulation. We believe supportive andtimely cost recovery that helps avoid large rate increases willbecome more critical to utilities' ability to maintain cash flow,earnings power, and ultimately, credit quality. Cost recoveryoptions generally include base-rate increases when projects
24
25 11 Prepared Direct Testimony of Company Witness Robert Hevert, p.49.
-13-

1 are complete, along with rate surcharges and riders duringconstruction.'2
2
3 Similarly, Moody's states:
4
5
An increasing array of accelerated cost recovery mechanismsin various state jurisdictions is helping to support the creditqualities of gas utilities.'3
6 In addition, Moody's has specifically cited the approval of such infrastructure
7 recovery mechanisms for Southwest Gas as reflecting constructive regulatory
8 treatment and being credit positive, stating:
g
10
11
12
13
14
15
16
17
In recent years, there have been meaningful improvements inthe regulatory frameworks under which Southwest Gasoperates. For example, infrastructure tracker mechanismswere approved in Arizona and Nevada. In Arizona and morerecently in California, Southwest Gas was granted a Customer-Owned Yard line program (COYL), and an InfrastructureReliability and Replacement Adjustment Mechanism (IRRAM)for timely cost recovery of qualifying non-revenue producingcapital expenditures associated with the enhancement andreplacement of gas infrastructure. A gas infrastructurerecovery (GIR) mechanism has been implemented in Nevadawith the 2014 GIR advance application authorizing $14.4million of replacement work for 2015. Also, all threejurisdictions implemented decoupling mechanisms albeit theactual mechanism varies state by state. Constructiveregulatory framework developments and signs of an improvingregulatory environment are credit positive.1"
18 Q. 24 l
19
l
l
i
l
20 A. 24
21
Please summarize the importance of the potential credit rating impacts
resulting from this proceeding to Southwest Gas.
The importance to the Company's credit rating is due to the capital-intensive
nature of the natural gas distribution business. Southwest Gas needs to make
22
23
24
25
12 Standard & Poor's Ratings Direct U.S. Utilities' Capital Spending Is Rising And Cost Recovery IsVital May 14, 2012.13 Moody's Investors Service, Special Comment Pipeline Safety Costs Rising As Alterative RafeDesigns Sought, April 25, 2012, p. 1.14 Moody's Investors Service Credit Opinion: Southwest Gas Corporation, March 24, 2015, p.2
-14-
l

1
2
3
4
5
continuing and substantial investments to provide reliable and safe service to
customers. On a total company basis, Southwest Gas anticipates capital
expenditures over the next three-year period ending December 31, 2018, to
be in the range of $1.4 billion to $1.6 billion. Accordingly, Southwest Gas
needs to have continuing access to capital and credit capacity at reasonable
6 costs. This is especially relevant given that the Company is proposing to
7 decrease its book depreciation rates, which will lower its current depreciation
8
g
10
11
12
13
14
15
expense, and therefore, its cash flows by approximately $42 million a year.'5
While the change in depreciation expense will be seen as a negative credit
rating factor, Commission approval of the proposed GlM would be seen as
positive credit rating factor, as it would reduce regulatory lag and somewhat
mitigate the depreciation effect. Approval of the GIM mechanism, combined
with the continuation of the Company's decoupled rate design and approval
of the Company's requested FVROR will provide the Company the opportunity
to sustain its credit ratings, which benefits both its customers and its investors.
16 E. Capital Attraction
17 o . 25
18
19
20 A. 25
Given the Company's operating environment, what are the key factors that will
enable the Company to continue to attract the capital necessary to meet its
ongoing capital requirements?
Generally, investors will choose between alternative investments based on the
risk and reward characteristics of the available investment opportunities.21
22
23
Consequently, the Company must compete with other utilities and alternative
investment opportunities in fully competitive global capital markets to attract
24
25 15 See the Prepared Direct Testimony of Company witness Dane Watson.
-15-

1 equity capital. For Southwest Gas to successfully attract equity capital, it must
2 demonstrate an ability to achieve a competitive return on that equity capital. The
3
4
5
6
7 Q. 26
8
9 A. 26
10
11
12
13
14
15
prepared direct testimony of Company witness Robert B. Hevert discusses the
development of a fair and reasonable cost of common equity of 10.25 percent,
considering the Company's specific risk factors and costs of common equity for
proxy groups of "similar" natural gas utilities.
What are the historic and projected earned returns on book common equity for
the proxy group companies used to estimate the cost of common equity?
Investors commonly use historic and projected earned returns on book value
equity as an important financial metric when evaluating alternative investments.
Exhibit No._(TKW-2) provides the average and median historical returns for the
time period 2011-2015, and the projected returns for the periods 2016, 2017, and
2019-2021 for each proxy group member firm.'6 The analysis of the proxy
groups of natural gas distribution companies can be summarized as follows:
Proxv Group of Six LDCs
16 Historical ROE2011-2015 Projected ROE2016 2017 2019-21
17
10.50%10.37%Average ROE18
11.00%9.84%Median ROE19
20
21
22
This comparable earnings analysis demonstrates that the Company's requested
10.25 percent ROE is both conservative and reasonable relative to the proxy
group.'7
23
24
25
is Information was derived from the Value Line Investment Survey, March 4, 2016. The proxy group ofsix natural gas distribution companies was developed and used by Company witness Robert Hevert.17 Prepared direct testimony of Company witness Robert B. Hevert.
46_1i
I|
iliil
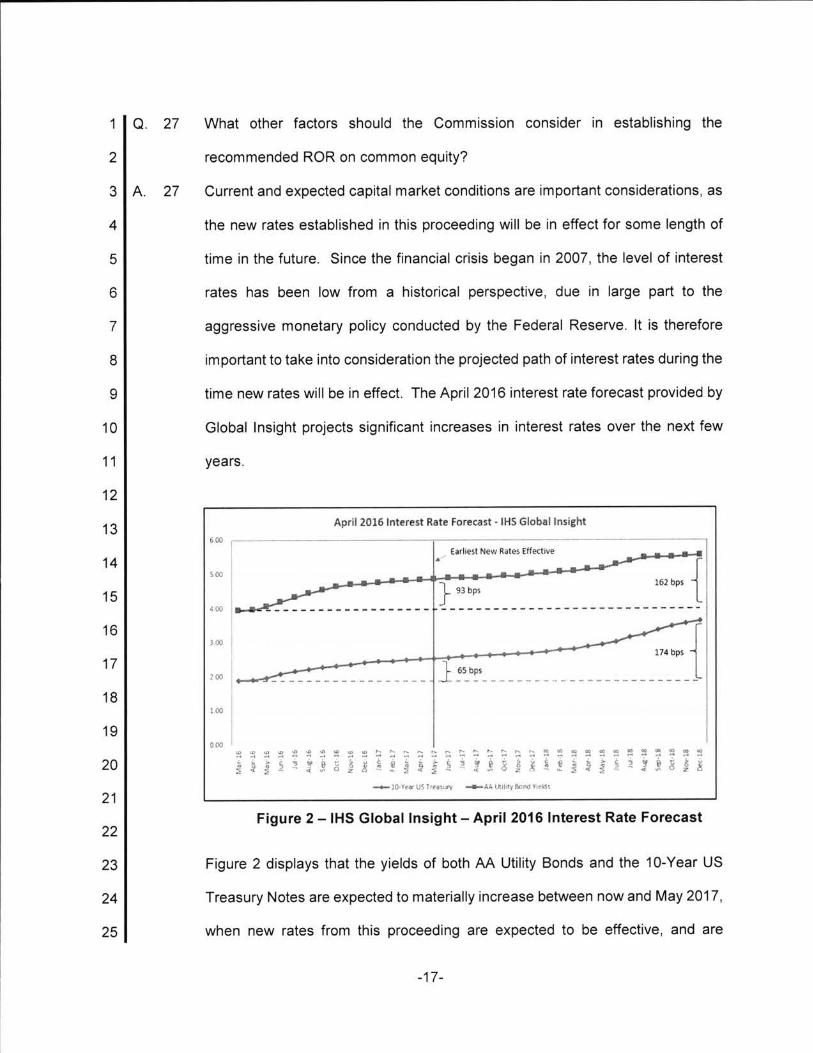
271 Q. What other factors should the Commission consider in establishing the
2 recommended ROR on common equity?
273 A. Current and expected capital market conditions are important considerations, as
4 the new rates established in this proceeding will be in effect for some length of
5 time in the future. Since the financial crisis began in 2007, the level of interest
6 rates has been low from a historical perspective, due in large part to the
7 aggressive monetary policy conducted by the Federal Reserve. It is therefore
8 important to take into consideration the projected path of interest rates during the
9 time new rates will be in effect. The April 2016 interest rate forecast provided by
10 Global Insight projects significant increases in interest rates over the next few
11 years.
12
April 2016 Interest RateForecast . ITS Global Insight13
600
1
1i1
Earliest New Rates EffectiveA14
1 W162 bps
8Il
93 bps15
4 00
16$00
174 bps
117
i
) 65 bps.v 00
18 l
9
100
19l
IrI
!
II
l
IJ n o
l~
é 820ro .._. .42 :
" S " 2 § Z " D 2 Z 2 " 2 2 2 8 2 2 " 3 an.; . .. " ; " s". .335§§§!£8§8§£3§§§~328:3
0 o o w us so u w o- s s vi -4 - r- >33£§23£8§
.p-0-l0Yea x i ' Tr: -Q-.A U1l.vyB¢tn1l Yu .1
21
Figure 2 - ITS Global Insight - April 2016 Interest Rate Forecast22
23 Figure 2 displays that the yields of both AA Utility Bonds and the 10-year US
24 Treasury Notes are expected to materially increase between now and May 2017,
25 when new rates from this proceeding are expected to be effective, and are
-17-I
II

1
2
projected to continue to increase significantly thereafter. Given that current
interest rates are still low from a historical perspective and are forecasted to
3
4
increase signif icantly over the next few years, the Commission should
incorporate this information in selecting an ROE to ensure it remains reasonable
5 on average in the near-term, when new rates from this proceeding will be in
effect.6
How does the overall FVROR balance the interests of both customers and7 o . 28
8
9 A. 28
10
11
12
13
investors of the Company?
The Company's financial health is, over time, important in determining the rates
it must charge its customers. The Company's credit ratings are significantly
influenced by its financial strength. The Company's cost of debt is in large part
determined by the Company's credit ratings. All other things being equal, with
higher credit ratings, the Company's cost of capital and the rates it charges its
customers would be lower.14
15 It is also important that investors be given the opportunity to earn an ROR
commensurate with the level of risk associated with their investment. Investor16l
17
18
19
20
21
22
23
24
confidence in Southwest Gas is important for both its existing shareholders and
for the Company's future ability to issue additional common equity. If the overall
allowed ROR is set below the Company's actual cost of capital, the Company
may be unable to attract sufficient financing at reasonable rates to continue to
fund required capital expenditures and maintain its quality of customer service.
The Company's requested overall FVROR will help sustain the Company's
improved financial condition and support continued improvement. In the long-
run, this will benefit both the Company's customers and investors.
25
IE _18-
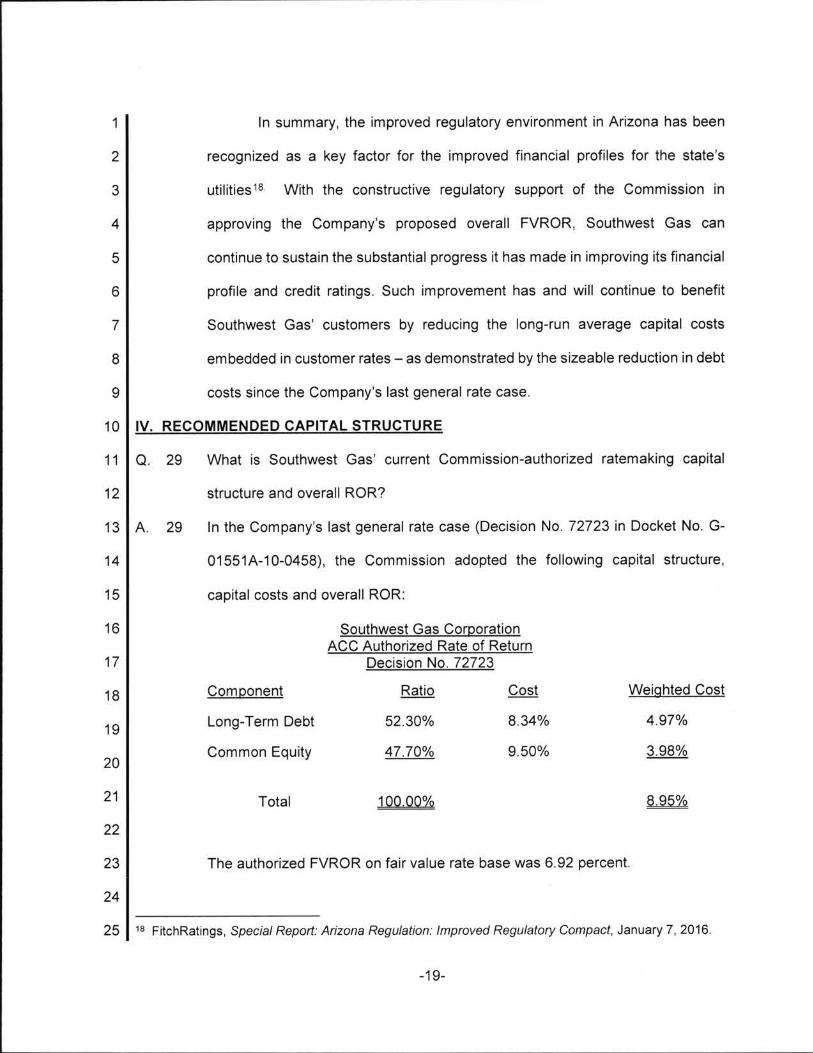
1
2
3
4
5
In summary, the improved regulatory environment in Arizona has been
recognized as a key factor for the improved financial profiles for the state's
utilities*° With the constructive regulatory support of the Commission in
approving the Company's proposed overall FVROR, Southwest Gas can
continue to sustain the substantial progress it has made in improving its financial
6
7
8
profile and credit ratings. Such improvement has and will continue to benefit
Southwest Gas' customers by reducing the long-run average capital costs
embedded in customer rates - as demonstrated by the sizeable reduction in debt
9 costs since the Company's last general rate case.
IV. RECOMMENDED CAPITAL STRUCTURE10
11 Q. 29 What is Southwest Gas' current Commission-authorized ratemaking capital
structure and overall ROR?12
13 A. 29
14
15
In the Company's last general rate case (Decision No. 72723 in Docket No. G-
01551A-10-0458), the Commission adopted the following capital structure,
capital costs and overall ROR:
16
17
Southwest Gas CorporationACC Authorized Rate of Return
Decision No. 72723
18
19
Weiqhted Cost
4.97%
3.98%
Cost
8.34%
9.50%
Ratio
52.30%
47.70%
Component
Long-Term Debt
Common Equity20
21 Total o1.0Q.QQ%
22
23 The authorized FVROR on fair value rate base was 6.92 percent.
24
25 18 Fitch Ratings Special Report: Arizona Regulation: Improved Regulatory Compact,January 7, 2016.
-19-

1 Q. 30
2
3 A. 30
4
5
6
7
What is the Company's recommended capital structure for rate making purposes
in this proceeding?
The Company requests a capital structure at the end of the test period,
November 30, 2015, composed of 51.69 percent common equity and 48.31
percent long-term debt. This capital structure is consistent with the utility only
portion of the Company's proposed reorganized holding company structure that
the Company expects to be in place when new rates go into effect from this
8 proceeding.
g v. EMBEDDED COST OF LONG-TERM DEBT
10 Q. 31
11
12 A. 31
13
14
15
16
Have you determined the test period embedded cost rate for long-term debt
capital?
Yes. Southwest Gas' cost rate for long-term debt is 5.21 percent for the test
period ended November 30, 2015. This rate is summarized on line 1, column
(c), of Schedule D-1, Sheet 1 of 2. Schedule D-2, Sheets 1 through 4, contains
the development of the long-term debt cost rate. The cost of debt is comprised
of the cost of fixed-rate debentures and notes, fixed-rate medium-term notes,
17 and a variable-rate term facility.
18 Q. 32
19 A. 32
20
21
22
Please describe the development of the cost rates of the debentures and notes.
The Company had three outstanding debenture and note issues, totaling $825
million of gross principal, at the end of the test year. The debentures and notes
had a weighted average cost of 5.66 percent, as shown on line 6, column (e), of
Schedule D-2, Sheet 2 of 4.
Please describe the cost rate of the medium-term notes.23 Q. 33
24 A. 33 The Company established a $150 million medium-term note program in
November 1997. The name is somewhat of a misnomer as medium-term notes25ll
-20- l
l

i
il
l
i
1 can be issued with maturities ranging from nine months to 30 years. Theii
2
3
4
5
6 Q. 34
Company issued its entire medium-term note program and had four outstanding
medium-term note issues totaling $82.5 million of gross principal at
November 30, 2015. The medium-term notes had a weighted average cost of
7.75 percent, as shown on line 11, column (e), of Schedule D-2, Sheet 2 of 4.
How are the effective cost rates of debentures, notes, and medium-term notes
7 calculated?
8 A. 34 The effective cost rates of debentures, notes, and medium-term notes are
g calculated through the use of the yield-to-maturity (YTM) or effective interest rate
10 method .
II 11 Q. 35
12 A. 35I
:I 13
14
15
Please describe and discuss the cost of unamortized loss on reacquired debt.
In March 2010, the Company redeemed at par $100 million in Trust Originated
Preferred Securities (TOPrS), which had an effective cost of 8.20 percent. The
redemption expenses and the remaining unamortized balance are being
amortized on a straight-line basis to the original maturity date of the called
16
17
18
Subordinate Debentures, September 2043.
The effective cost for the unamortized loss on reacquired debt is
calculated by dividing the annual amortization, $171,862 by the remaining
19 recorded amount, $(4,783,486) as shown on line 12, column (f) and column (d),
20 of Schedule D-2, Sheet 2 of 4.
21 Q. 36 Please describe and discuss the development of the cost rate for the variable-
22
23 A. 36
24
25
rate term facility debt.
The Company has a five-year $300 million revolving credit facility, which was
originated in May 2012 and was recently extended to expire in March 2021. In
addition, the Company has a $50 million uncommitted F-2 commercial paper
-21-
1
2
3
4
program, supported by the revolving credit facility. The Company continues to
view $150 million of the facility as a permanent intermediate-term component of
its debt portfolio. Accordingly, the Company has classified it as long-term debt.
Southwest Gas continues to use the remaining $150 million of the facility to fund
5
6
7
8
g
recurring seasonal working capital needs.
At the end of the test period, the Company had $100 million outstanding
in LIBOR loans and $50 million outstanding as commercial paper. The all-in
effective rate of the long-term debt portion of the facility at the end of the test
period was 1.10 percent as shown on line 1, column (e), of Schedule D-2, Sheet
3 of 4. The all-in rate effective rate includes the interest on the loans/commercial10
11
12
paper, an annual fee, and unused commitment fees for amounts outstanding as
commercial paper and amortization of debt expenses incurred to establish the
13
14 Q. 37
15
16 A. 37
17
18
19
20
21
22
23
24
i
1i
25
term facility.
Why are the Industrial Development Revenue Bonds (IDRBs) excluded in
calculating the cost of long-term debt?
Southwest Gas issued lDRBs in two of its rate jurisdictions - Clark County,
Nevada and Big Bear, California. The IDRB issues outstanding at the end of the
test period are as follows: (1) the Clark County, Nevada lDRBs (2003 Series A,
2005 Series A, 2006 Series A, 2008 Series A and 2009 Series A) for the
Company's Southern Nevada rate jurisdiction; and (2) the City of Big Bear,
California lDRBs (1993 Series A) for its Southern California rate jurisdiction. As
reflected in the IDRB indentures and financing agreements, the proceeds from
the issuance of this type of debt are restricted to funding qualified construction
expenditures for additions and improvements in the specific distribution systems
to which the lDRBs relate In addition, there are strict Internal Revenue Service
_22_
I
I
1
2
3
(IRS) rules which mandate that the benefits of the tax-exempt, lower cost IDRBs
must accrue to customers in the specific jurisdiction to which the lDRBs apply.
Deviation from the requirements of this IRS ruling could result in the loss of the
4
5
6 o . 38
IDRB tax-exempt status which would, in turn, cause the Company to refinance
its debt at a much higher cost.
How have this and other regulatory commissions treated the cost of Southwest
7
8 A. 38
9
10
11
12
Gas' IDRBs in past regulatory proceedings?
Southwest Gas has historically excluded the IDRBs from the cost of debt
calculation in all regulatory jurisdictions, except for the specific jurisdictions
(Southern Nevada for Clark County lDRBs and Southern California for City of
Big Bear IDRBs), to which the relevant IDRBs apply This Commission, the
PUCN, the CPUC, and the FERC have accepted this treatment for IDRBs in past
13 regulatory proceedings.
14 vi. FAIR VALUE RATE OF RETURN (FVROR) FOR INCREMENTAL INVESTMENTS
15 Q. 39
16 A. 39
17
18
19
20
21
22
what is the purpose of this section of your testimony?
In this section of my testimony, I present the rationale for the appropriate FVROR
to be applied in conjunction with an infrastructure recovery mechanism such as
the Company's proposed GIM mechanism.'9 In doing so, I start with a review of
the calculation of the fair value rate base (FVRB), then examine two alternative
Commission-accepted FVROR methodologies by using some simple examples
to demonstrate which methodology is more appropriate. I then explain why an
incremental FVROR should be computed in conjunction with the GIM
23 mechanism requested by the Company.
24
25 19 Prepared direct testimony of Company witness Edward Gieseking, p.5-10.
-23_
1 Q. 40
2 A. 40
Please explain the concept of FVRB, as used for ratemaking purposes.
Article XV, section 14 of the Arizona Constitution provides that "the Corporation
3
4
Commission shall, to aid it in the proper discharge of its duties, ascertain the fair
value of the property within the State of every public service corporation doing
ll5 business therein This requires a fair value determination of a utility's rate
6 base. The term FVRB for ratemaking purposes is defined as being somewhere
7
8
9
between the original OCRB and the reproduction cost new depreciated (RCND)
rate base.20 In Arizona, the standard convention for computing the FVRB has
been based on a simple 50/50 weighted average of the OCRB and RCND ratellibase.10
11 o. 41
4112 A.
13
14
Please explain how the RCND rate base is computed.
This RCND rate base is computed by using the Handy-Whitman utility
construction indices to trend original cost utility plant and certain other rate base
items to obtain the current reproduction cost new, by vintage year of construction.
15
16
17
The Handy-Whitman indices are well recognized and commonly used by utility
regulatory bodies to trend earlier valuations and original cost records to estimate
reproduction cost at prices prevailing at a certain date.
18 Q. 42I
: 19
20 A. 42
21
22
23
Based on the methodology used to compute the FVRB, what is a key property
concerning the relationship between the OCRB and the FVRB?
A key property is that the difference between the OCRB and FVRB is a function
of the average age of the utility plant where, holding all else constant, a utility
with a greater average utility plant age will result in a greater difference between
the OCRB and FVRB and therefore a larger ratio of FVRB to OCRB
24See, Charles F. Phillips, Jr. The Regulation of Public Utilities - Theory and Practice358 (public Utilities20
25 Reports, Inc. 2d ed. 1988, Chapter 8 for the historical evolution of the fair value rate base concept.
-24-

1
2
3
4
5
(FVRB/OCRB). At the time of any new investment in utility plant, the OCRB for
that plant will be equivalent to the RCND rate base for that plant and therefore,
by definition, will also be equal to the FVRB for that plant. As the age of the utility
plant increases, so does the difference between the OCRB and the FVRB due
to a greater level of inflation embedded in the calculation of the FVRB.
6 Q. 43
7 A. 43
8
9
10
11
12
Please give a simple example to demonstrate this mathematical relationship.
For example, assume a utility only has one asset that had an initial cost of
$1,000. In addition, assume the annual inflation rate embedded in the Handy-
Whitman index for computing the RCND rate base new through time is 3 percent,
and the annual book and tax depreciation rate is 5 percent (no deferred taxes).
The following table displays the OCRB, the RCND rate base, and the FVRB over
the first three years of the rate base.
13Year 3Year 2Year 1Yearo
14
s 1000.015
s 1,000.0
(150.0)
850.0
s 1,000.0
(100.0)
900.0
s 1,000.0
(50.0)
950.0 sSs
Gross PlantAccumulated DepreciationNet Plant s 1,000.0
16
s 850.0s 900.0s 950.0OCRB s 1,000.017
1.091.061.031.0018 HandyWhitman Index
s 928.819 s 954.8s 978.5RCND rate base s 1,000.0
20 s 889.4s 927.4s 964.3s 1,000.0FVRB[1]
21 1.051.031.021.00FVRB/OCRB
22[1] FVRB 2 0.5 X OCRB + 0.5 X RCND rate base
Table 1. Example of the OCRB and FVRB through time23
24 As can be seen from this table, as the utility plant ages, the difference between
the OCRB and the FVRB increases.25
-25-

1 Q. 44 Please explain the FVROR used in conjunction with the FVRB for ratemaking
2
3 A. 44
4
l5l
ll
purposes.
In conjunction with the FVRB, a FVROR must be developed to compute the
revenue requirement to recover a utility's fair value capital costs. The starting
point to develop the FVROR is a utility's WACC for the OCRB. The Commission,
in Decision No. 70441, concluded that the WACC was related to the OCRB and6
7
8
g
10
11
12
13
14
15
16
17I.
I
I
18
that an adjustment to the WACC was appropriate in determining a rate of return
on the FVRB. In previous rate proceedings, the Commission has accepted two
primary methods to adjust the WACC to compute the FVROR, which were initially
proposed in the remand proceeding for Chaparral City Water Company in Docket
No. W-02113A-04-0616. The f irst method, which was proposed by the
Residential Utility Consumer Office (RUCO), is to start with the utility's WACC
and adjust by the expected rate of inflation. A variation of this approach, which
the Commission approved in Decision No. 70441, is to adjust only the equity rate
of return component of the WACC by the expected rate of inflation. Henceforth,
this method will be referred to as the RUCO method. The second method, which
was proposed by the ACC Staff (Staff), is to begin with the WACC and if the cost
attributed to the FVRB increment is above the OCRB, that cost should be no
19
20
21
larger than the real risk-free rate of return, which had been adjusted for inflation.
Henceforth, this method will be referred to as the Staff method. With the Staff
method, the range of return for the fair value increment ranged from zero up to
Both the RUCO and Staff methods werethe real risk-free rate of return.22
23
24
developed to adjust for inflation in the FVROR so as not to double count inflation
in the ratemaking process since the FVRB includes an inflation factor.
25
_26-
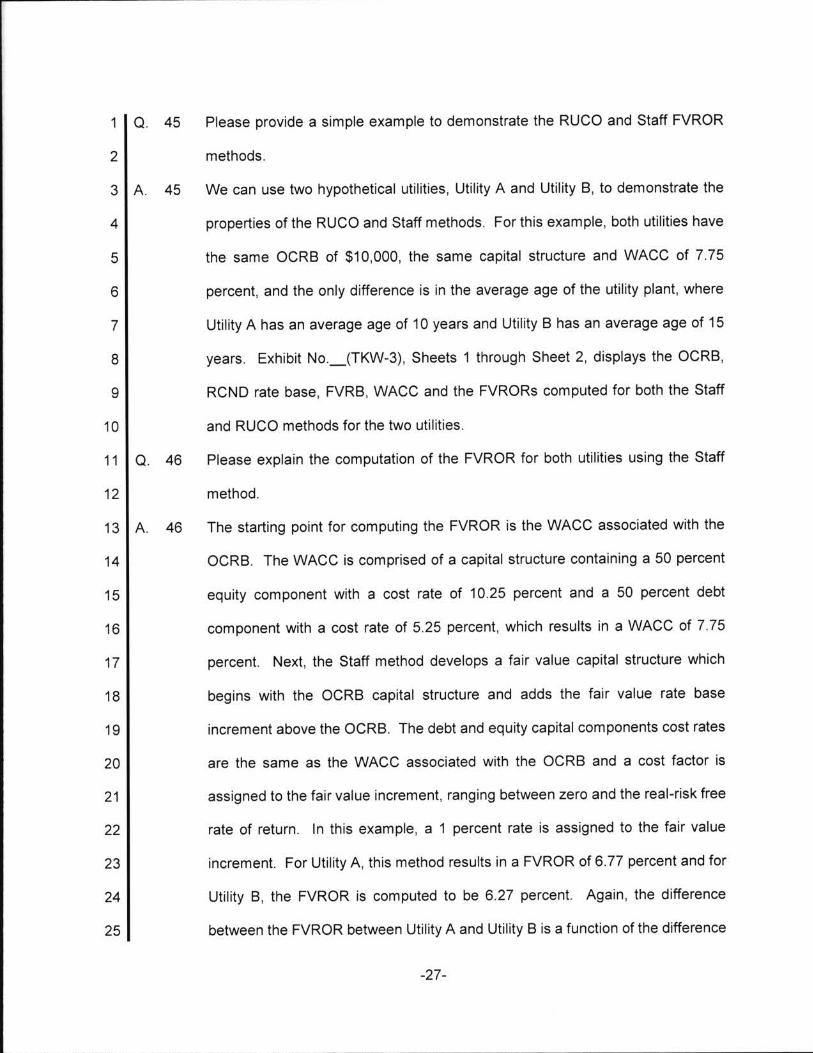
1 Q. 45 Please provide a simple example to demonstrate the RUCO and Staff FVROR
methods.2
3 A. 45
4
5
6
7
8
9
We can use two hypothetical utilities, Utility A and Utility B, to demonstrate the
properties of the RUCO and Staff methods. For this example, both utilities have
the same OCRB of $10,000, the same capital structure and WACC of 7.75
percent, and the only difference is in the average age of the utility plant, where
Utility A has an average age of 10 years and Utility B has an average age of 15
years. Exhibit No._(TKW-3), Sheets 1 through Sheet 2, displays the OCRB,
RCND rate base, FVRB, WACC and the FVRORs computed for both the Staff
and RUCO methods for the two utilities.10
11 Q. 46 Please explain the computation of the FVROR for both utilities using the Staff
method.12
13 A. 46
14
15
16
The starting point for computing the FVROR is the WACC associated with the
OCRB. The WACC is comprised of a capital structure containing a 50 percent
equity component with a cost rate of 10.25 percent and a 50 percent debt
component with a cost rate of 5.25 percent, which results in a WACC of 7.75
17
18
19
percent. Next, the Staff method develops a fair value capital structure which
begins with the OCRB capital structure and adds the fair value rate base
increment above the OCRB. The debt and equity capital components cost rates
are the same as the WACC associated with the OCRB and a cost factor is20
21
22
23
24
25
assigned to the fair value increment, ranging between zero and the real-risk free
rate of return. In this example, a 1 percent rate is assigned to the fair value
increment. For Utility A, this method results in a FVROR of 6.77 percent and for
Utility B, the FVROR is computed to be 6.27 percent. Again, the difference
between the FVROR between Utility A and Utility B is a function of the difference
_27-

1
2
3
4
5
6
7
in the age of the utility plant and the resulting difference between the FVRB and
the OCRB. Utility A has a FVRB of $11,700 with a fair value increment above
the OCRB of $1,700 while Utility B has an FVRB of $12,800 with a fair value
increment of $2,800. The computation of the FVROR for both utilities highlights
a key property of the Staff method in which, holding all else constant, the FVROR
computation for a higher (lower) FVRB results in a lower (higher) FVROR as
displayed below.
8
g
10 <
>
Utility B
$10,000
$12.800
6.27%11
Utilitv A
$10,000
$11 ,700
6.77%
OCRB
FVRB
FVROR
12 Q. 47 Please explain the computation of the FVROR for both utilities using the RUCO
method.13
14 A. 47
15
16
17
18
19
20
21
22
23
Again the starting point is the WACC of 7.75 percent. With the RUCO method,
the cost of equity is reduced by an inflation factor. For this example, an inflation
factor of 2 percent is used and reduces the common equity cost rate from 10.25
percent to 8.25 percent. Using the same capital structure used to compute the
WACC and the new cost of equity results in a FVROR of 6.75 percent for both
Utility A and Utility B. The computation of the FVROR for both utilities highlights
a key property of the RUCO method, which is holding all else constant, the
FVROR is not a function of the age of the utility plant and therefore the degree
of inflation embedded in the FVRB, and results in the same FVROR for both
higher and lower FVRB as displayed below.
24
25
-28-
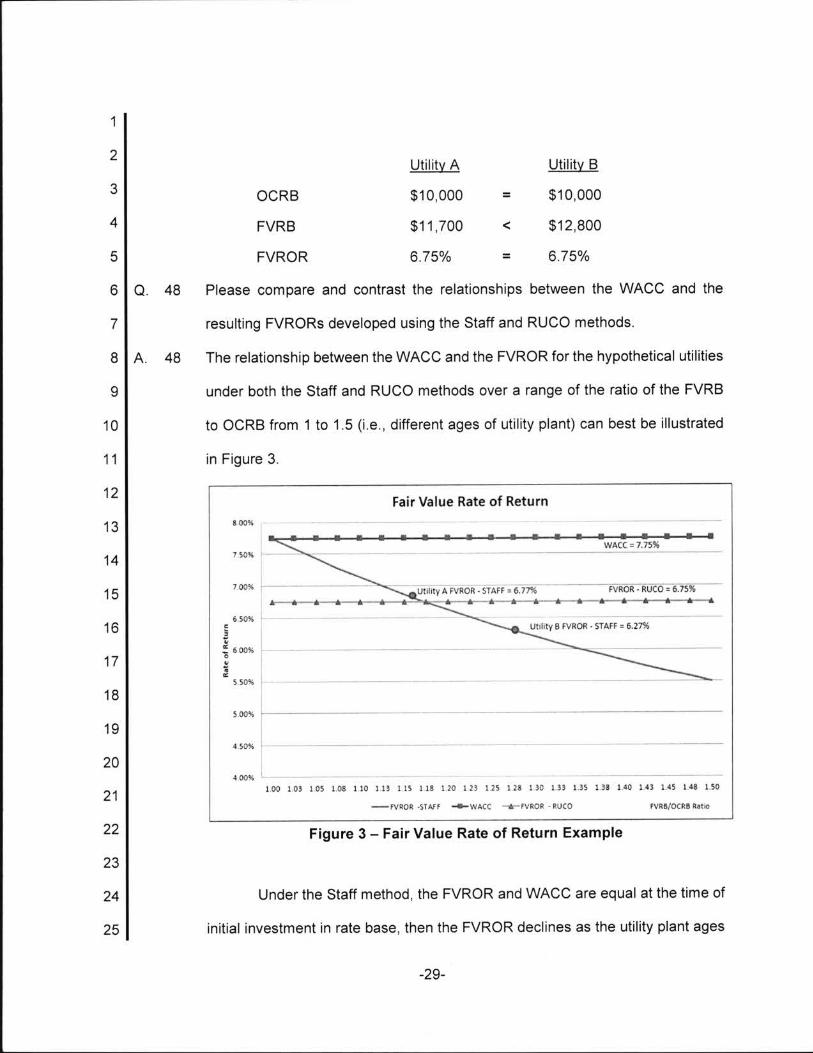
1
2Utilitv BUtility A
3 OCRB $10,000$10,000
4 <FVRB $12,800$11,700
6.75%5 6.75%FVROR
486 Q. Please compare and contrast the relationships between the WACC and the
7 resulting FVRORs developed using the Staff and RUCO methods.
8 48A. The relationship between the WACC and the FVROR for the hypothetical utilities
9 under both the Staff and RUCO methods over a range of the ratio of the FVRB
10 to OCRB from 1 to 1.5 (i.e., different ages of utility plant) can best be illustrated
11 in Figure 3.
12Fair Value Rate of Return
800%13wAce : 7.75%
750%14
70096 FVROR . RUCO : 6.75%* * * * * *
T x m fg A ;v; i ¢ j j ; ;§ AF ¢ : 6 .7 7 % ""15 I - - I * l I i * *A--ar-A *
Utnlity8 FVROR . STAFF: 6.27%16».
17
6 50%c8g_ 6 go*ovi¢
5.509618
5.0096 _
194 50%
20
21
4 00961.00 103 105 1.08 1 10 113 1.15 118 120 1 23 1.25 128 1 30 1.33 1.35 1 38 140 1.43 u s u h 1.50
WROTE STAFF -0-wAcc 1- rvnon . RUCO FVR8/OCRB Ramo
22 Figure 3 - Fair Value Rate of Return Example
23
Under the Staff method, the FVROR and WACC are equal at the time of24
initial investment in rate base, then the FVROR declines as the utility plant ages25
-2g-

II|
and the FVRB increases over the OCRB. The RUCO method results in a1
2
3
4
5
6
7
8
9
constant FVROR because there is no adjustment for the age of the rate base
and the amount of inflation in the FVRB. The resulting revenue requirements
(computed by multiplying the pretax rates of return 2' by the rate base) under the
different methodologies help illustrate the end result of the competing
methodologies. Figure 4 displays the OCRB and FVRB for the example utilities
over the same range of the ratios of FVRB to OCRB used in Figure 3. Figure 5
displays the revenue requirement for an OCRB of $10,000 over the same range
of ratios of FVRB to OCRB using the FVRORs displayed in Figure 3.
10
11Fair Value Rate Base - OCRB = $10,000
12
13
14
15Ara_v.1
16
17
, fv I 4I r4 5 45 1 5I I II II I I4 1 5I I |I I II I |I II II I
III4IIIIIII4I
iIE
I II If If l4 II II r4 II II II I4 IA I4. I4. II II II II II II I
5 5I II
IIIrfII9v
IIIIIIIIIIIIIIIIIIIIAI4II!afIIIII4IIII5.I
444f4;II5I
9fI44rIrII4fIIIII4IIIIIIrI4I4IIrI5I18
r
59I5 I
I If If II 41 II II II II rI 4I I
r 4rI I4 5I I
I5r
r 45 rI lI II II Ir I4 II II If II If II I I5 9 II I I
r I9 5 II I II I II I II I II f II 4 'I I 'I I II I II I 5I I If I ;f * I5 5 II I5 I II I 4I I II I ,4 I4 I II I ,II I I5 9 II I I
9 45 IIIIIIIIIIIIIIfIIIg 44 Il l l l l l l l H I I l l l I I
143118 1/0 123 125 x 28 130 13= 135 18 40 x:s 148 150
s 1s.oo0
514008
$12000
s1oooc
ssnoo
56000
$4800
51000
5.100 103 :cs 108 no 113 11;
FVR8/OCRB Ratio19 mans IOCRB
20Figure 4 - OCRB and FVRB Example
21
22
23
24
I
I
iV
II
E25
21 A gross-up factor of 1.6579 was used for the example to compute the pre-tax rates of return used tocompute the revenue requirements.
-30-
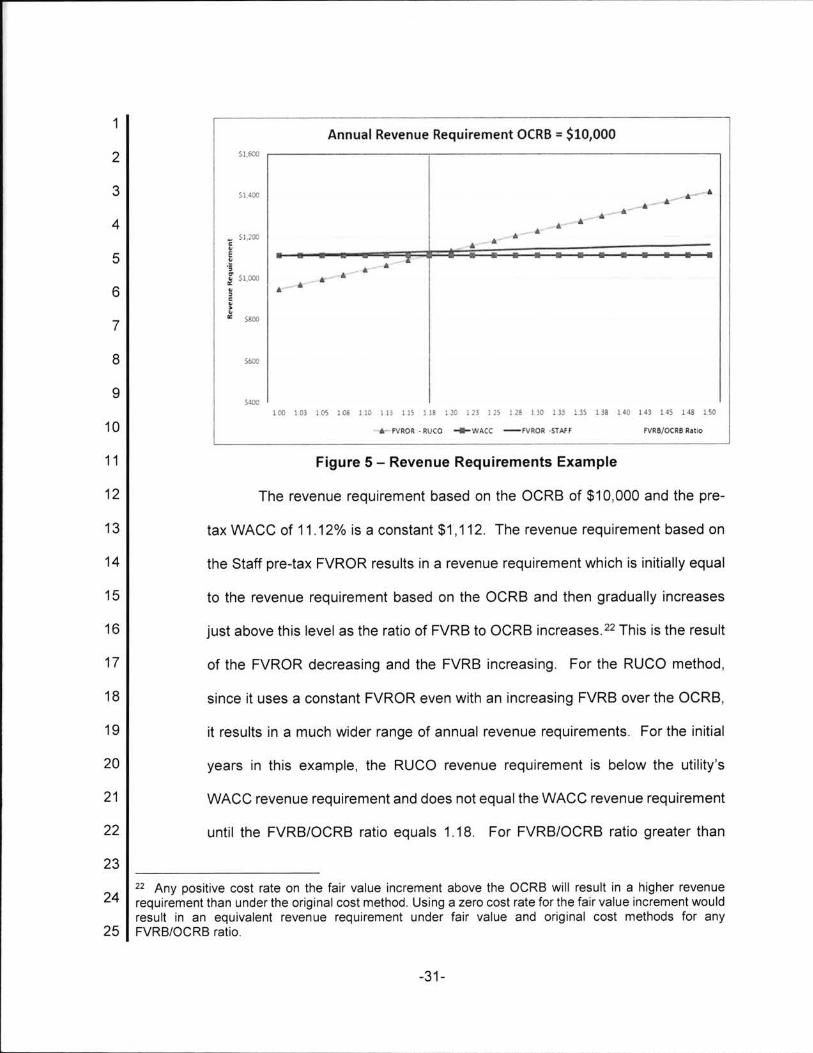
1Annual Revenue Requirement OCRB = $10,000
exsoo2
3 51400 A8,.AAA A
A4 1_., A$1.200 A
A A
5$1000
A A4 A
AA6
E
3uéu::g9°' sso0
7
S6008
9
10
S400100 1.03 IOS 101 110 113 115 118 x 2o 12s 125 x 2a no 133 L 35 138 140 143 145 148 150
WROTE . RUCO °l'WACC -WROTE STAfF FVRB/OCRB Rlho. .
11 Figure 5 - Revenue Requirements Example
12 The revenue requirement based on the OCRB of $10,000 and the pre-
13 tax WACC of 11.12% is a constant $1 ,112. The revenue requirement based on
14 the Staff pre-tax FVROR results in a revenue requirement which is initially equal
15 to the revenue requirement based on the OCRB and then gradually increases
16 just above this level as the ratio of FVRB to OCRB increases.22 This is the result
17 of the FVROR decreasing and the FVRB increasing. For the RUCO method,
18 since it uses a constant FVROR even with an increasing FVRB over the OCRB,
19 it results in a much wider range of annual revenue requirements. For the initial
20 years in this example, the RUCO revenue requirement is below the utility's
21 WACC revenue requirement and does not equal the WACC revenue requirement
22 until the FVRB/OCRB ratio equals 1.18. For FVRB/OCRB ratio greater than
23
24
25
22 Any positive cost rate on the fair value increment above the OCRB will result in a higher revenuerequirement than under the original cost method. Using a zero cost rate for the fair value increment wouldresult in an equivalent revenue requirement under fair value and original cost methods for anyFVRB/OCRB ratio.
-31-

1 1.18, it begins to exceed the WACC and at higher ratios it begins to significantly
exceed the WACC.2
3 Q. 49 Which of these two methods does Southwest Gas recommend for computing
4 FVROR?
5 A. 49
6
7
8
9
10
11
12
13
14
As a result of the properties of the two methods, the Company recommends that
the Staff method be adopted for computing the FVROR. The Staff method has
the following properties as illustrated in the examples that support its use:
(1) The adjustment to the WACC to compute the FVROR under the Staff
method takes into account that the degree of inflation embedded in the FVRB is
a function of the age of the utility plant, where the FVROR declines as both the
average age of the utility plant and the resulting FVRB increases, and
(2) The Staff method always results in a FVROR that provides a utility
the opportunity to recover its cost of capital, and is therefore consistent with the
Hope and Bluefield standards of a fair return.
15
16
17
18
19
20
21 Q. 50
22
23
24
In contrast, while the RUCO method makes an adjustment to the WACC
for inflation, it does so arbitrarily by not taking into account the age of the utility
plant, which is a key determinant of the difference between the OCRB and FVRB.
As a result, the RUCO method results in a disparate treatment between utilities
that have differences in the age of the utility plant and, as demonstrated, could
result in a revenue requirement below a utility's actual cost of capital.
For an infrastructure recovery mechanism such as the Company's proposed GIM
mechanism, would it be appropriate to use the FVROR authorized in the
Company's last general rate case to compute the incremental cost of capital
revenue requirement for such a mechanism?
25
-32_

1 A. 50
2
3
4
5
6
7
8
No. As explained and demonstrated previously, the FVROR authorized in a
general rate case proceeding is a function of the average age for all rate base
items, and therefore it would not be appropriate to apply an average authorized
FVROR to new incremental investments that are not of the same average age
(i.e., the FVRB/OCRB ratio is not equivalent for the average and the incremental
rate base). Doing so would not allow a utility to recover its cost of capital on the
incremental rate base investments. The appropriate FVROR for incremental rate
base investments would be computed using the same methodology in the
g
10 Q. 51
11
12
general rate case, but based only on the incremental rate base.
Can you demonstrate why it is not appropriate to use the FVROR authorized in
the Company's last general rate case to compute the incremental cost of capital
revenue requirement for the GIM mechanism?
13 A. 51 Yes. Using the previous example with Utilities A and B, assume that both utilities
14
15
have an infrastructure recovery mechanism and one year after their last general
rate case each utility has an incremental OCRB of $1,000 under such a
16
17
18
19
mechanism. For this example, the first step is to compute the incremental FVRB
by using the simple average of the incremental OCRB and incremental RCND
rate base, which results in an incremental FVRB of $1,015. Applying the
authorized pre-tax FVROR to the incremental FVRB for both Utilities A and B,
20 the annual revenue requirements would be as follows:
21Pre-tax FVRORFVRB
229.75%
Utility
A
Revenue Requirement
$99$101523
9.05%B $92$1,01524
25
-33-

1 First, it is nonsensical that two utilities that have the same capital structure
2 and WACC would have dif ferent revenue requirements for an identical
3
4
5
6
7 Q. 52
8
9
10 A. 52
11
12
13
14
15
16
incremental investment in FVRB. Second, this revenue requirement would not
recover the capital costs for the incremental investment in FVRB. The capital
costs can be computed using the pre-tax WACC of 11.12 percent for the
incremental of OCRB of $1 ,000, which would result in capital cost of $111 .
Can you demonstrate why the appropriate FVROR for incremental rate base
investments would be computed using the same methodology in the general rate
case, but based only on the incremental rate base.
Yes. The incremental FVROR is computed by first developing a fair value capital
structure which begins with the authorized OCRB capital structure percentages
(50 percent equity and 50 percent debt) to compute the incremental fair value
capital component amounts and adds the incremental fair value rate base
increment above the incremental OCRB. The debt (5.25 percent) and equity
(10.25 percent) capital components cost rates are the same as the authorized
WACC associated with the authorized OCRB and the previously authorized 1
17 The resultingpercent cost factor is assigned to the fair value increment.
18
19
20
incremental FVROR applicable to the incremental FVRB is 7.65 percent. Using
the incremental pre-tax FVROR results in an incremental revenue requirement
of $111 .5 for both Utility A and Utility B.
21
Pre-tax FVRORFVRB22
10.98%
Revenue Requirement
$111 .5
Utility
A23
10.98%B $111.5
$1,015
$1,01524
25
-34-

The use of the incremental FVROR now results in identical revenue1
2
3
4
5
6
7
8
requirements for identical incremental investment in FVRB for utilities that have
the same WACC. Moreover, the revenue requirement will allow both utilities to
recover the incremental capital costs. In addition, Exhibit No.__(TKW-3),
Sheet 3 and Sheet 4, demonstrates that the incremental revenue requirement
using the incremental FVROR plus the authorized revenue requirement from the
last general rate case will result in an equivalent revenue requirement as if the
incremental investment in the FVRB was originally included at the time of the
g calculation of the FVROR in the last general case.
5310 Q. Please summarize the Company's recommendation on the FVROR for
incremental investments.11
5312 A. First, Southwest Gas recommends utilizing the Staff method, as it
13
14
15
16
17
18
19
20
21 Q. 54
proportionately adjusts for the amount of inflation embedded in the FVRB and
always results in a FVROR that provides an opportunity for it's the recovery of
capital costs. Second, an incremental FVROR needs to be computed for use
with infrastructure recovery mechanisms such as the proposed GIM in order to
provide an opportunity to recover capital costs for the incremental rate base
investments performed under such a mechanism. In addition, the resulting
revenue requirement for the infrastructure recovery mechanism is consistent
and equivalent with that of the general rate case process.
Does this conclude your prepared direct testimony?
Yes .22 A. 54
23
24
25
-35-

Appendix APage 1 of 2
SUMMARY OF QUALIFICATIONSTHEODORE K. WOOD
I graduated from the University of Nevada, Reno (UNR) in 1985 with a Bachelor of
Science degree with a major in agricultural economics. In 1989, I earned a Master of Science
degree from UNR in agricultural economics with a minor in finance. I have attained the
professional designations of Chartered Financial Analyst (cA), Certified Rate of Return
Analyst (CRRA), Certified Management Accountant (CMA), Certif ied in Financial
Management (coM), and Certified Treasury Professional (CTP). I am a member of the
Institute of Management Accountants, the CFA Institute, Association for Financial
Professionals, Financial Management Association, and the Society of Regulatory and UtilityI
II
Financial Analysts.
From 1985 to 1988, I was employed as a research associate in the Department of
Agricultural Economics at UNR in Reno, Nevada. My primary role was to assist with ongoing
research projects in the Department including secondary data collection, statistical analysis,
FORTRAN programming, and the development of microcomputer spreadsheets for farm
management decision analysis.
In 1989, I was employed by First Interstate Bank of Nevada in Reno, Nevada, as a
financial analyst in the Finance Department. My duties entailed maintenance of the general
ledger system, creation of monthly management and financial reports, and special projects.
From 1990 to 1992, Iwis employed as a planning analyst with Valley Bank of Nevada,
in Las Vegas, Nevada, in the Planning Department. My primary responsibilities included
preparation of the annual budget, quarterly budget variance analysis, supporting the
Asset/Liability Committee of the bank, and other financial analyses.
From 1992 to 1994, I was employed by PriMerit Bank, FSB, then a wholly-owned
subsidiary of Southwest Gas, as a Senior Financial Analyst in the Budget and Forecasting

Appendix APage 2 of 2
Department. My primary responsibilities included creation and maintenance of a
microcomputer-based budgeting system, preparation of the annual budget, monthly budget
variance analysis, product profitability analysis, and other special projects.
In 1994, I accepted a Senior Financial Analyst position in the Treasury Services
Department of Southwest Gas. I was promoted to Supervisor of the Treasury Services
Department in May 1997, to Manager in June 2000, to Senior Manager in May 2005 and
Assistant Treasurer & Director/Financial Services in December 2009. My responsibilities
include directing the Company's treasury and corporate planning functions and assisting with
certain investor relations activities, which includes meeting with institutional equity and fixedl
ilil
lIn addition, my responsibilities includeincome analysts, as well as rating agencies. i
representing the Company in various regulatory proceedings in its ratemaking jurisdictions
concerning regulatory finance issues.
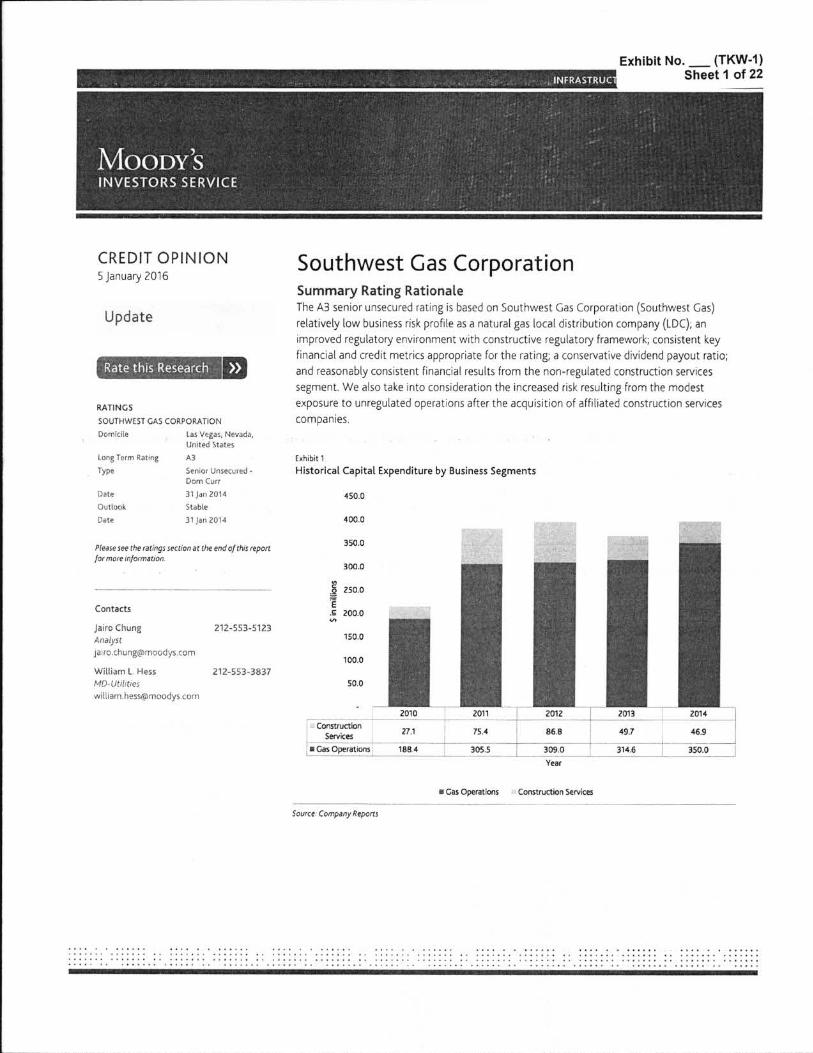
Exhibit No..-- (TKW-1 )I Sheet 1 of 22
MooDy'sINVESTORS SERVICE
CREDIT OPINION Southwest Gas Corporation5 January 2016
Update
Rate this Research >>
Summary Rating RationaleThe AS senior unsecured rating is based on Southwest Gas Corporation (Southwest Gas)relatively low business risk profile as a natural gas local distribution company (LDC); animproved regulatory environment with constructive regulatory framework; consistent keyfinancial and credit metrics appropriate for the rating a conservative dividend payout ratio;and reasonably consistent financial results from the nonregulated construction servicessegment. We also take into consideration the increased risk resulting from the modestexposure to unregulated operations after the acquisition of affiliated construction servicesComD8r1i€s.
Long Term Rating
TypeEx h ib i t 1
His toric al Capi t al Ex pendi t ure by Bus ines s Segments
450.0
400.0
Date
Outlook
Date
RATINGS
SOUTHWEST GAS CORPORATION
Domicile Las Vegas NevadaUnited States
AS
Senior UnsecuredDom Curr
31 jar 2014
Stable
31 jar Z014
350.0Please see the ratings sectionat the Endo/ this report/ormore in/orma I/on
300.0
250.0
Contacts 200.0
8E.Siv
2125535123150.0
Cairo Chung
Analyst
212553383750.0
William L. Hess
MDUtilf t ies
[email protected] I I I2010
21.1
1884 2013
49.7
314.6
2014
46.9
350.0
;
iL -
1
ConstructionServkes
I Gas Operations
2012
86.8
509.0
Year
Construction Servicesl cos Operations
Sou/ce Company Reports
. . . . . . . . . . . . . . . . . . . . . . . . . . . . . . . . . . . . . . . . . . . . . . . . . . . . . . . . . . . . . . . . . . . .
. . . . . . . . . . . . . . . . . . . . . . . . . . . . . . . . . . . . . . . . . . . . . . . . . . . . . . . . . . . . . . . . . . . . . . . . . . . . . . . . . . . . . . . . . . . . . . . . . . . . . . . . . .

Exhibit No. (TKW-1iSheet 2 of 22INFRASTRUCTMOODYS INVESTORS SERVICE
Credit Strengths
» LDC operations with a low business risk profile
» Constructive rate case outcomes and credit supportive regulatory developments
» Stable credit metrics supported by transparent cash flows
Credit Challenges
» Exposure to higher risk non-utility operations through Centuri Construction Group
>> increased foreign currency risk
Rating OutlookThe stable outlook is based on Southwest Gas low risk operations improved regulatory environments, the approval of recovery
mechanisms that decrease regulatory lag and our expectation that the company will manage its unregulated construction operations
without any credit pressure on its regulated utility. The outlook also assumes that the companys financial profile will not change
materially.
Factors that Could Lead to an Upgrade
» Further strengthening in its financial profile
» Improved credit metrics including cash flow from operations preworking capital (CFO pre-WC) to debt above 25% on a sustained
basis
» Significant improvement in regulatory environments
Factors that Could Lead to a Downgrade
» A sustained deterioration in Southwest Gas overall credit profile
»
»
A sustained deterioration in credit metrics including CFO preWC to debt below the high teens
Significant expansion of its construction business or other strategic activities that result in higher financial and business risks
Key Indicators
Southwest GasCo rner1U31R013
7.3x28.9%25.5%45.4%
12/31/20115.8x
25.4%22.5%48.1%
9/30/201s(L)6.2x
22.6%191%47.3%
12/31/20126.5x
25.7%22.7%48.0%
12/31/20146.9x
23.3%20.2%49.1%
CFOpreWC+ Interest / InterestCFO prewC I DebtCFO preWC - Dividends / DebtDebt I Capitalization
Source: MoodysFlnanclalMetric "[1] All ratios are based on Adjusted financial data and Incorporate Moodys Global Standard Adjustments lot NonFlnanclal Corporations.
Source Moody:FinancialMetrics
This publication does not announce a credit rating action. For any credit ratings referenced in this publication please see the ratngs tab on the ssuer/en»ry page onwvvw.moodys com lot the most updated credit rating action information and rating history.
2 SouthwestGasCorporation.S January 2016

Exhibit No. __ (TKW-1 )Sheet 3 of 22MOODYS INVESTORS SERVICE INFRASTRUCT
Detai led Rating Considerations- LDC operations with a low business risk profile
i|||i
ii
With LDC operations making up the majority of its business. Southwest Gas is generally viewed as having a low business risk profile.
At September 30. 2015 the LDC operations contributed approximately 86.5% of the companys $130.9 million net income and 63%
of its $2.3 billion revenue. The customer base for the LDC operations is over 99% residential and small commercial. which provides
a stable and consistent foundation for its operations. In 2015, its customer growth was approximately 1.4% and we expect a similar
growth rate in the next 1218 months in Southwest Cas LDC territory.
Southwest Gas is expected to invest approximately s1.3 billion between 2015 and 2017 on its natural gas operations segment. The
company has stated it plans to incur S445 million of the $1.3 billion in calendar year 2015. Southwest plans to accelerate projects that
improve system flexibility and reliability, including replacement of early vintage plastic and steel pipe. Approximately 40% of the 2015
budgeted capital expenditure will be invested on enhancement and replacement of gas infrastructure followed by 31% invested on
growth 14% on general plant, 10% on other projects and 5% on replacements under regulatory trackers We expect Southwest Gaswill use a combination of internally generated cash flows and debt and equity proceeds to fund its capital expenditure program.
- Constructive rate case outcomes and credit supportive regulatory developments
In recent years, there have been meaningful improvements in the regulatory frameworks under which Southwest Cas operates.
For example. infrastructure tracker mechanisms were approved in Arizona and Nevada. In Arizona and more recently in California
Southwest Cas was granted a Customer-Owned Yard line program (COYL) and an infrastructure Reliability and Replacement
Adjustment Mechanism (IRRAM) for timely cost recovery of capital expenditures associated with the enhancement and replacement of
gas infrastructure. In May 2015, the ACC issued a decision approving the COYL surcharge application, effective in June 2015.III!I
Southwest made a filing in May 2014. referred to as a Gas Infrastructure Replacement (GIR) Advance Application identifying early
vintage plastic pipe (EVPP) and vintage steel pipe (VSP) projects for replacement beginning in January 2015. In October 2014 the
Public Utilities Commission of Nevada (puck) approved EVPP replacement expenditures of $14.4 million for 2015.
l!I|i
In June 2015, Southwest filed a second GIR Advance Application with the PUCN proposing $43.5 million of additional accelerated pipe
replacement for 2016. Once completed, the annualized revenue requirement is estimated at $4.6 million. In October 2015 the PUCN
approved the GIR Advance Application granting Southwest the authority to replace the $43.5 million of infrastructure under the GIR
mechanism for 2016. In October 2015 management filed a rate application to reset the GIR surcharge to reflect annualized revenues
of $4.5 million The rate filing was based upon projects placed in service by August 2015 with rates anticipated to be made effective in
january 2016II
II Also, all three of the companys jurisdictions implemented decoupling mechanisms albeit the actual mechanism varies state by state.
Constructive regulatory developments and signs of an improving regulatory environment are credit positive.
The next LDC general rate case will be in 2016 when Southwest Cas files in Arizona. Based on the current rate case moratorium in the
state, Southwest Gas could file with the earliest test year ending November 30, 2015. If filed in the second quarter of 2016, the newrates could become effective in May 2017.
In January 2014, Southwest filed an application with the Arizona Corporation Commission (ACC) seeking preapproval to constructoperate and maintain a 233000 dekatherm LNG facility in southern Arizona and to recover the actual costs including the
establishment of a regulatory asset. This facility is intended to enhance service reliability and flexibility in natural gas deliveries in the
southern Arizona area by providing a local storage option, operated by Southwest and connected directly to its distribution system. The
Company purchased the site for the facility in October 2015 and is preparing the construction requirements bid package for potential
contractors. The contract to construct the facility is currently expected to be in place near the end of the first quarter of 2016 and
construction is expected to take approximately two to three years to complete. The Company anticipates including a proposal lot the
rate making treatment of facility costs as part of its next Arizona rate case filing
3 S January 2016 Southwest Gas Corporation:
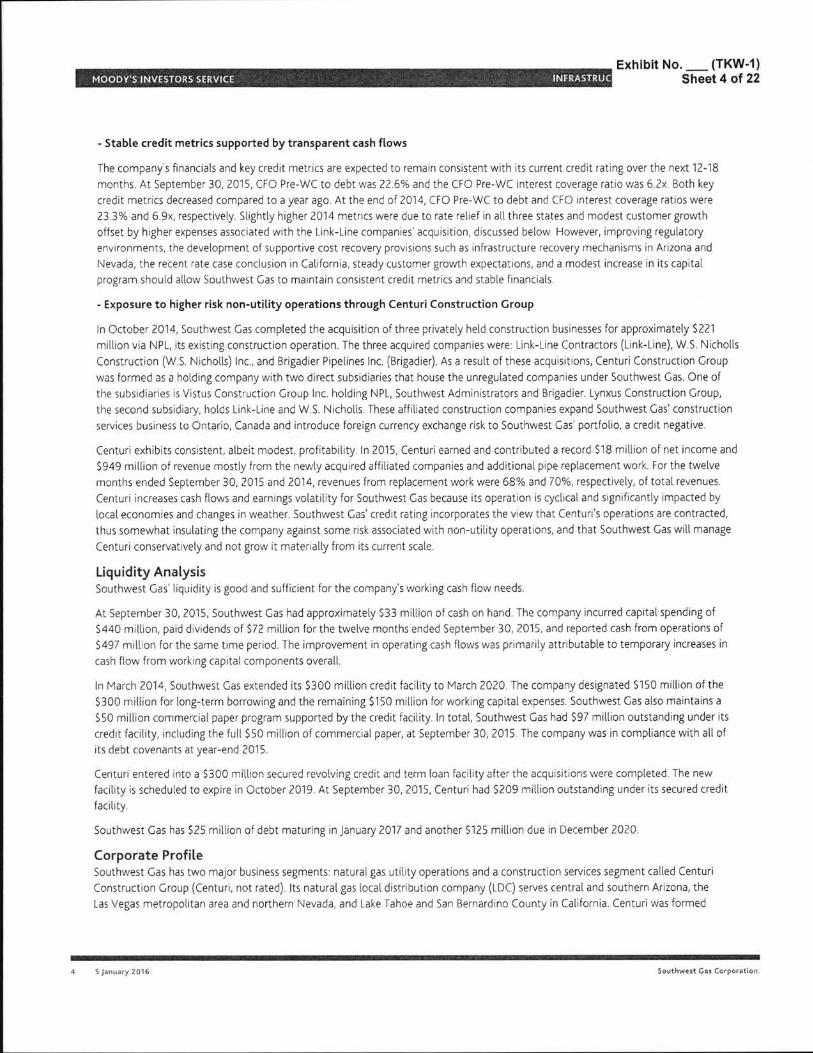
INFRASTRUCMOODYS INVESTORS SERVICE
Exhibit No. (TKW-1)Sheet 4 of 22
- Stable credit metrics supported by transparent cash f lows
The companys financials and key credit metrics are expected to remain consistent with its current credit rating over the next 12-18
months. At September 30 2015 CFO PrewC to debt was 22.6% and the CFO PrewC interest coverage ratio was 6.2x. Both key
credit metrics decreased compared to a year ago. At the end of 2014 CFO PreWC to debt and CFO interest coverage ratios were
23.3% and 6.9x respectively. Slightly higher 2014 metrics were due to rate relief in all three states and modest customer growth
offset by higher expenses associated with the Link-Line companies acquisition discussed below. However improving regulatoryenvironments the development of supportive cost recovery provisions such as infrastructure recovery mechanisms in Arizona and
Nevada, the recent rate case conclusion in California steady customer growth expectations, and a modest increase in its capitalprogram should allow Southwest Gas to maintain consistent credit metrics and stable financials.
- Exposure to higher risk non-utility operations through Century Construction Group
In October 2014 Southwest Gas completed the acquisition of three privately held construction businesses for approximately $221
million via NPL its existing construction operation. The three acquired companies were: Link-Line Contractors (Link-Line) W.S. Nicholls
Construction (W.S. Nicholls) Inc., and Brigadier Pipelines Inc. (Brigadier). As a result of these acquisitions. Centuri Construction Group
was formed as a holding company with two direct subsidiaries that house the unregulated companies under Southwest Cas. One ofthe subsidiaries is Vistus Construction Group Inc. holding NPL, Southwest Administrators and Brigadier. Lynxus Construction Group,
the second subsidiary. holds Link-Line and W.S. Nicholls. These affiliated construction companies expand Southwest Gas construction
services business to Ontario, Canada and introduce foreign currency exchange risk to Southwest Gas portfolio, a credit negative.
Centuri exhibits consistent, albeit modest profitability. In 2015 Centuri earned and contributed a record S18 million of net income and
S949 million of revenue mostly from the newly acquired affiliated companies and additional pipe replacement work For the twelve
months ended September 30, 2015 and 2014, revenues from replacement work were 68% and 70%, respectively of total revenues.
Century increases cash flows and earnings volatility for Southwest Caz because its operation is cyclical and significantly impacted by
local economies and changes in weather. Southwest Gas' credit rating incorporates the view that Centuris operations are contracted
thus somewhat insulating the company against some risk associated with nonutility operations, and that Southwest Gas will manage
Centuri conservatively and not grow it materially from its current scale.
Liquidity AnalysisSouthwest Gas liquidity is good and sufficient for the companys working cash flow needs.
At September 30, 2015 Southwest Gas had approximately $33 million of cash on hand. The company incurred capital spending of
$440 million, paid dividends of S72 million for the twelve months ended September 30, 2015 and reported cash from operations of
$497 million for the same time period. The improvement in operating cash flows was primarily attributable to temporary increases in
cash flow from working capital components overall.
In March 2014, Southwest Gas extended its $300 million credit facility to March 2020. The company designated S150 million of the
$300 million for longterm borrowing and the remaining $150 million for working capital expenses. Southwest Gas also maintains a
$50 million commercial paper program supported by the credit facility In total, Southwest Gas had S97 million outstanding under its
credit facility including the full $50 million of commercial paper at September 30, 2015 The company was in compliance with all of
its debt covenants at year-end 2015.
Centuri entered into a S300 million secured revolving credit and term loan facility after the acquisitions were completed. The new
facility is scheduled to expire in October 2019. At September 30, 2015 Centuri had $209 million outstanding under its secured credit
facility.
Southwest Cas has $25 million of debt maturing in January 2017 and another S125 million due in December 2020.
Corporate ProfileSouthwest Gas has two major business segments: natural gas utility operations and a construction services segment called CenturiConstruction Group (Centuri not rated). Its natural gas local distribution company (LDC) serves central and southern Arizona, the
Las Vegas metropolitan area and northern Nevada, and Lake Tahoe and San Bernardino County in California. Centuri was formed
4 Southwest Gas CorpcrNion:*Z January 7016
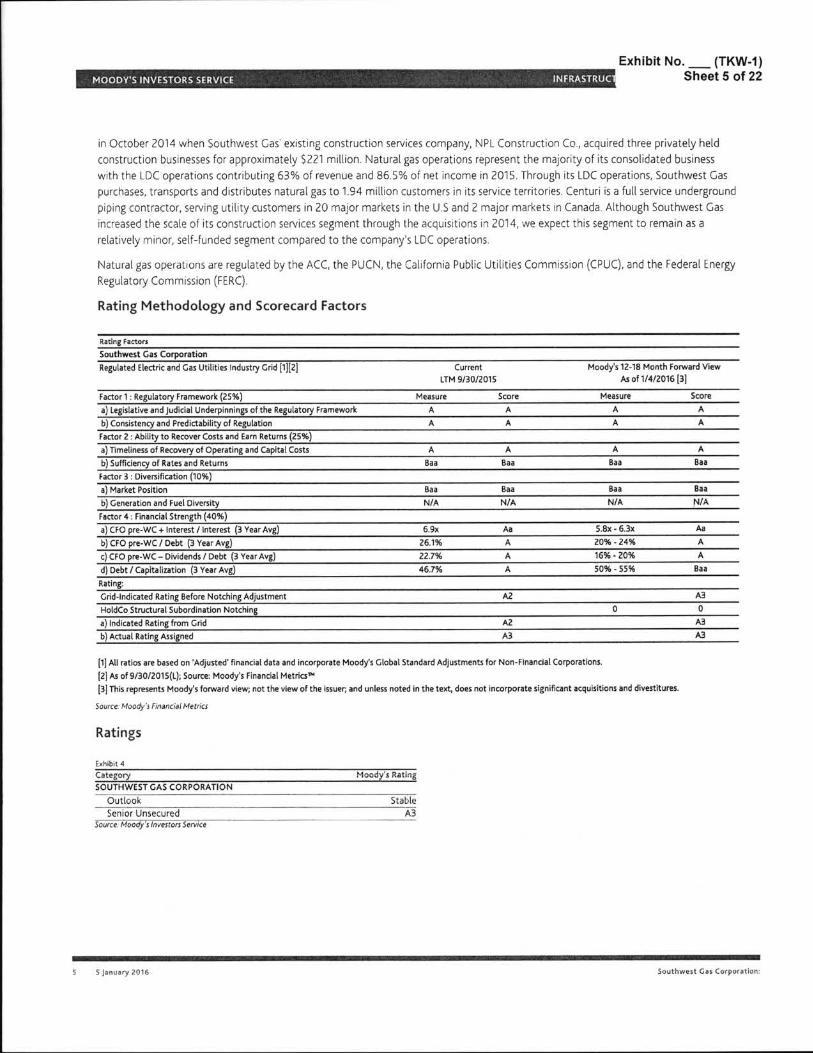
Exhibit No. (TKW-1 )Sheet 5 of 22INFRASTRUCMOODYS INVESTORS SERVICE
in October 2014 when Southwest Gas existing construction services company NPL Construction Co. acquired three privately held
construction businesses for approximately S221 million. Natural gas operations represent the majority of its consolidated business
with the LDC operations contributing 63% of revenue and 86.5% of net income in 2015. Through its LDC operations, Southwest Gas
purchases, transports and distributes natural gas to 1.94 million customers in its service territories. Centuri is a full service underground
piping contractor serving utility customers in 20 major markets in the U.S and 2 major markets in Canada. Although Southwest Gas
increased the scale of its construction services segment through the acquisitions in 2014, we expect this segment to remain as a
relatively minor self-funded segment compared to the company's LDC operations.
Natural gas operations are regulated by the Acc, the PUCN the California Public Utilities Commission (CPUC) and the Federal Energy
Regulatory Commission (FERC).
Ra t i n g Me t h o d o l o g y and Scorecard Factors
Rating Factors
Southwe s t Ga s C o rpo ra tio n
Regulated Electric and Gas Utilities Industry Grid [1][2] Moodys 12.18 Month Fo rwa rd View
AS of t/4/2016 [3]
Sco re
A
A
Measure
A
A
Current
LTM 9/30/2015
Measure Sco re
A A
A A
A
Baa
A
Baa
A
Baa
A
Baa
Baa
N/ A
Baa
N/ A
BaaN/A
Baa
N/ A
As
A
A
Baa
5.8x . 6.3x
20% . 24%
16% . 20%
50% . 55%
As
A
A
A
6.9x
26.1%
22.7%
46.7%
A2
0
AS
0
AS
AS
A2
AS
Factor 1 : Regulatory Framework (25%)
a) Legislative and judicia l Underpinnings of the Regulatory Framework
b) Consistency and Predictability of Regulation
Factor 2 : Ability to Recover Costs and Earn Returns (25%)
a) Timeliness of Recovery of Operating and Capital Costs
b) Sufficiency of Rates and Returns
Factor 3 : Diversification (10%)
a) Market Position
b) Generation and Fuel Diversity
Factor 4 : Financia l Strength (40%)
a) CFO prewC + Interest / Interest (3 Year Avg)
b) CFO preWC / Debt (3 Year Avg)
c) CFO preWC - Dividends / Debt (3 Year Avg)
d) Debt / Capita lization (3 Year Avg)
Rating:
GridIndica ted Rating Be fore Notching Adjustment
Ho ldCo Structura l Subord ina tion Notching
a) Indicated Rating from Grid
b) Actual Rating Assigned
not the view of the Issuer and unless noted in the text does not incorporate significant acquisitions and divestitures.
[1] All ratios are based on Adjusted financial data and Incorporate Moodys Globa l Standard Adjustments for NonFinancia l Corporations.
[2] As of 9/30/2015(L); Source: Moodys Financia l Metrics"'
[3] This represents Moodys forward New
Source:Moodys Financia lMetrics
Ratings
Mo o d ys R a tin g
Sta b le
A S
Exhibit! 4
C a te go ry
SO U T H W EST GAS C O R P O R AT I O N
O u t l o o k
Se n io r U n s e cu re d
Source. Moody :Investors Service
S Southwest Gas Corporation5 January ?()16
INFRASTRUCT
Exhibit No. (TKW-1 ISheet 6 of 22MOODYS INVESTORS SERVICE
© 2016 Moodys Corporation Moodys Investors Service Inc.. Moodys Analytics Inc. and/or their licensors and affiliates (collectively MOOOYS). All rights reserved
CREDIT RATINGS ISSUED BY MOODYS INVESTORS SERVICE ac AND ITS RATINGS ArrluAr£s (reIs) ARE MOODYS CURRENT OPINIONS OF THE RELATIVE FUTURE CREDIT
RISK OF ENTITIES CREDIT COMMITMENTS OR DEBT OR DEBTlIKE SECURITIES AND CREDIT RATINGS AND RESEARCH PUBLICATIONS PUBLISHED BY MOODYS (MooDvs
PUBLICATIONS) MAY INCLUDE mooovs CURRENT OPINIONS OF THE RELATIVE FUTURE CREDIT RISK OF ENTITIES CREDIT COMMITMFNTS OR DEBT OR DEBTLIKE
SECURITIES. MOODYS DEFINES CREDIT RISK AS THE RISK THAT AN ENTITY MAY NOT MEET ITS CONTRACTUAl. FINANCIAL OBI IGATIONS AS THEY COME DUE AND ANY
ESTIMATED FINANCIAL LOSS IN THE EVENT OF DEFAULT. CREDIT RATINGS DO NOT ADDRESS ANY OTHER RISK INCLUDING BUT NOT LIMITED TO LIQUIDITY RISK MARKET
VALUE RISK. OR PRICE VOLATILITY. CREDIT RATINGS AND MOODYS OPINIONS INCLUDED IN MOODVS PUBLICATIONS ARE NOT STATEMENTS OF CURRENT OR HISTORICAL
FACT MOODYS PUBLICATIONS MAY ALSO INCLUDE QUANIIIATIVE MODELBASED ESTIMATES OF CREDIT RISK AND RELATED OPINIONS OR COMMENTARY PUBLISHED
BY MOODYS ANALYTICS INC. CREDIT RATINGS AND mooovs PUBLICATIONS DO NOT CONSTITUTE OR PROVIDE INVESTMENT OR FINANCIAL ADVICE. AND CREDIT
RATINGS AND MOODYS PUBLICATIONS ARE NOT AND DO NOT PROVIDE RECOMMENDATIONS TO PURCHASE SELL. OR HOLD PARTICULAR SECURITIES. NEITHER CREDIT
RATINGS NOR MOODYS PUBLICATIONS COMMENT ON THE SUITABILITY OF AN INVESTMENT FOR ANY PARTICULAR INVESTOR MOODYS ISSUES ITS CREDIT RATINGS
AND PUBLISHES MOODYS PUBLICATIONS WITH THE EXPECTATION AND UNDERSTANDING THAT EACH INVESTOR WILL WITH DUE CARE MAKE ITS OWN STUDY AND
EVALUATION OF EACH SECURITY THAT IS UNDER CONSIDERATION FOR PURCHASE HOLDING OR SALE
MOODYS CREDIT RATINGS AND MOODYS PUBLICATIONS ARE NOT INTENDED FOR USE BY RETAIL INVESTORS AND IT WOULD BE RECKLESS AND INAPPROPRIATE FOR
RETAIL INVESTORS TO USF MOODYS CREDIT RATINGS OR MOODYS PUBLICATIONS WHEN MAKING AN INVESTMENT DECISIon. IF IN DOUBT YOU SHOULD CONTACT
YOUR FINANCIAL OR OTHER PROFESSIONAL ADVISER. ALL INFORMATION CONTAINED HEREIN IS PROTECTED BY LAW INCLUDING BUT NOT LIMITED TO. COPYRIGHT LAW.
AND NONE OF SucH INFORMATION MAY BE COPIED OR OTHERWISE REPRODUCED. REPACKACED FURTHER TRANSMITTED TRANSFERRED DISSEMINATED REDISTRIBUTED
OR RESOLD. OR STORED FOR SUBSEQUENT USE FOR ANY SUCH PURPOSE IN WHOLE OR IN PART IN ANY FORM OR MANNER OR BV ANY MEANS WHATSOEVER BY ANY
PERSON WITHOUT MOODYS PRIOR WRITTEN CONSENT.
All information contained herein is obtained by MOODYS from sources believed by it to be accurate and reliable Because of the possibility of human or mechanical error as wellas other factors however all information contained herein is provided As IS without warranty of any kind. MOODY5 adopts all necessary measures so that the information ituses in assigning a credit rating is of sufficient quality and Iron sources MOODYS considers to be reliable including when appropriate. independent thirdparty sources. HoweverMOODYS is not an auditor and cannot in every instance independently verify or validate information received in the rating process or in preparing the Moodys Publications
To the extent permitted by law MOODVS and its directors officers employees agents representatives licensors and suppliers disclaim liability to any person or entity for anyindirect special consequential or incidental losses or damages whatsoever arising Iron Or in connection with the information contained herein or the use of or inability to use anysuch information even if MOODYS or any of its directors officers. employees agents representatives. licensors or suppliers is advised in advance of the possibility or such losses ordamages including but not limited to: (a) any loss of present or prospective profits or (b) any loss or damage arising where the relevant financial instrument is not the subject of aparticular credit rating assigned by MOODYS.
To the extent permitted by law MOODYS and its directors officers employees. agents representatives licensors and suppliers disclaim liability for any direct or compensatorylosses or damages caused to any person or entity including but not limited to by any negligence (but excluding fraud willful misconduct or any other type al liability that for theavoidance of doubt by law cannot be excluded) on the part of or any contingency within or beyond the control of MOODVS or any al its directors officers employees. agentsrepresentatives licensors or suppliers arising from or in connection with the information contained herein or the use of or inability ro use any such Information
no WARRANTY EXPRESS OR IMPLIED AS TO THE ACCURACY rim£unEss COMPLETENESS. MERCHANTABILHY OR FITNESS FOR ANV PARTICULAR PURPOSE OF ANY such l
RATING OR OTHER OPINION OR INFORMATION IS GIVEN OR MADE BV MOODYS in ANV FORM OR MANNtrt WHATSOf.VER
Moodys Investors Service Inc a whollyowned credit rating agency subsidiary of Moodys Corporation (MCO) hereby discloses that most issuers of debt securities (includingcorporate and municipal bonds debentures notes and commercial paper) and preferred stock rated by Moodys Investors Service Inc. have prior to assignment of any ratingagreed ro pay to Moodys Investors Service. Inc. for appraisal and rating services rendered by it fees ranging from $1500 to approximately $2500000. MCO and mis also maintainpolicies and procedures to address the independence of MISs ratings and rating processes. information regarding certain affiliations that may exist between directors of MCO andrated entities and between entities who hold ratings from MIS and have also publicly reported to the SEC an ownership interest in MCO of more than 5%. is posted annually atwwwmoodys.com under the heading Investor Relations - Corporate Governance - Director and Shareholder Affiliation Policy.
Additional terms for Australia only: Any publication into Australia of this document is pursuant to the Australian Financial Services License of MOODYS affiliate Moodys InvestorsService Pty Limited ABN 61 003 399 6S7AFSL 336969 and/or Moodys Analytics Australia pty Ltd ABN 94 105136972 AFSL 383569 (as applicable). This document is intendedto be provided only to wholesale clients within the meaning of section 7616 of the Corporations Act 2001. By continuing to access this document from within Australla yourepresent to MOODYS that you are or are accessing the document as a representative al a wholesale client and that neither you nor the entity you represent will directly orindirectly disseminate this document or its contents to retail clients within the meaning of section 761G al the Corporations Act 2001. MOODYS credit rating is an opinion asto the creditworthiness of a debt obligation al the issuer not on the equity securities of the issuer or any form of security that is available to retail investors ii would be recklessand inappropriate for retail investors to use MOODYS credit ratings or publications when making an investment decision If in doubt you should contact your financial or otherprofessional adviser.
Additional terms for Japan only: Moodys Japan K K (M)KK) is a whollyowned credit rating agency subsidiary of Moodys Group Japan G.K which is whollyowned by MoodysOverseas Holdings ire. a whollyowned subsidiary of MCO. Moodys SF Japan x K (MSF)) as a whollyowned credit rating agency subsidiary of MJKK MSF] is not a NationallyRecognized Statistical Rating Organization (NRSRO). Therefore credit ratings assigned by MSF] are NonNRSRO Credit Ratings. NonNRSRO Credit Ratings are assigned by anentity that is not a NRSRO and consequently the rated obligation will not qualify for certain types of treatment under U.S. laws. MJKK and f*1sFj are credit rating agencies registeredwith the Japan Financial Services Agency and their registration numbers are FSA Commissioner (Ratings) no. 2 and 3 respectively
M)KI( or MSF] (as applicable) hereby disclose that most issuers of debt securities (including corporate and municipal bonds. debentures. notes and commercial paper) and preferredstock rated by MJKK or MSF) (as applicable) have. prior to assignment of any rating agreed to pay to M)KK or MSF] (as applicable) for appraisal and rating services rendered by it feesranging from JPY200000 to approximately )PY350.000.000.
MjKK and MSF) also maintain policies and procedures to address )japanese regulatory requirements.
REPORT NUMBER 1012446
MooDy'sINVESTORS SERVICE
i Southwest Gas Corporation:S January 2016

Exhibit No. (TKW-1 )Sheet 7 of 22
M STANDARD8.POOR'SRATINGS SERVICES2MuGRAW HILL FINANCIAL
®RatingsDirect
Summary:
Southwest Gas Corp.Primary Credit Analyst:
Obama Ugboaja New York 2124387406 [email protected]
Secondary Contact:Gabe Grosberg New York (1) 212-438-6043; [email protected]
Table Of Contents
Rationale
Outlook
Standard & Poor's Base-Case Scenario
Business Risk
Financial Risk
Liquidity
Other Credit Considerations
Ratings Score Snapshot
Issue Rating
Related Criteria And Research
FEBRUARY 16, 2016 1WWW.STANDARDANDPOORS.COM/RATlNGSDlRECTTHIS WAS PREPARED zxcl.uswzi.y POR USER in xzrmv.NOT PER REDISTRIBUTION UNLESS OTHERWISE PERMITTED.
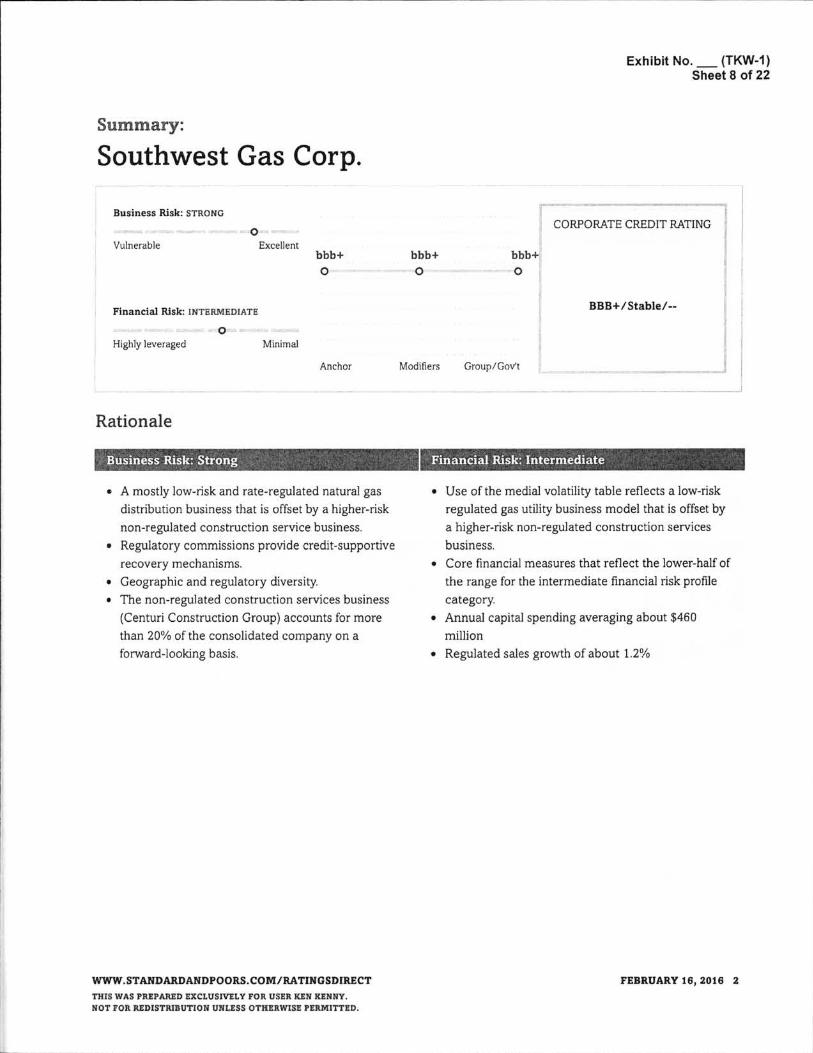
ExhibitNo. _ (TKW-1)Sheet 8 of 22
Summary:
Southwest Gas Corp.
Business Risk: STRONGCORPORATE CREDIT RATING
oExcellentVulnerable
bblo
b b l
o
b b l
o ll
l
BBB+/stable/-- lFinancial Risk: INTERMEDIATE
oMinimalHighly leveraged
ModifiersAnchor Group/Govt
Rationale
Financial Risk: IntermediateBusiness Risk: Strong
•G
•
•
•
Use of the media] volatility table reflects a lowrisk
regulated gas utility business model that is offset by
a higher-risk non-regulated construction services
business.
Core financial measures that reflect the lower-half of
the range for the intermediate financial risk profile
category.
Annual capital spending averaging about $460
million
Regulated sales growth of about 1.2%
A mostly low-risk and rate-regulated natural gas
distribution business that is offset by a higher-risk
non-regulated construction service business.
Regulatory commissions provide creditsupportive
recovery mechanisms.
Geographic and regulatory diversity.
The non-regulated construction services business
(Centuri Construction Group) accounts for more
than 20% of the consolidated company on a
forward-looking basis.
lII
FEBRUARY 16, 2016 2WWW.STANDARDANDPOORS.COM/RATINGSDIRECT
THISWAS PREPARED EXCLUSWELY FORUSER KEN KENNY.NOT FOR REDISTRIBUTION UNLESSOTHERWISE PERMITTED.

Exhibit No. (TKW-1)Sheet 9 of 22
Summary: Southwest Gas Corp.
Outlook: Stable
The stable outlook on Southwest Gas Corp. reflects our expectations that its construction services business will
reflect about 20% of the consolidated company and that the companys financial measures will consistently reflect
the lower-half of the range for the "intermediate" financial risk profile category.
Downside scenario
We could lower the rating if the business risk profile further weakens either because of a less-than-effective
management of regulatory risk or due to a disproportional growth of the construction business so that it represents
more than 30% of the consolidated company. We could also lower the rating if financial measures weaken to below
the higher-end of the significant financial risk profile, reflecting funds from operations (FFO) to debt that is
consistently lower than 21%.
li1l\
Upside scenario
Although less likely we could raise the rating if Southwest Gas permanently reduces the size of its higher~risk
construction services business to below 20% of the consolidated company or if the company's financial measures
improve toward the higherend of the intermediate financial risk profile category reflecting FFO to debt that
consistently exceeds 32%.
Standard 8: Poor's Base-Case Scenario
Assumptions Key Metrics
20 I6E25-273.03.32226
2015E25273.0-3.32226
2014A24.93.318.6
FFo/debt (%)Debt/EBITDA (X)OfF/debt (%)
A--Actual. EEstimate. OCF--Operating cash f low.•
Regulated utility sales growth of about 1.2%.Continued use of the infrastructure riders.Nonregulated business that does not exceed 25% of
the company's consolidated net income.Annual capital spending averaging about $460million.Annual dividends averaging about $80 millionRefinancing of upcoming debt maturities.
Business Risk: Strong
.II
Southwest Gas' strong business risk profile reflects its mostly low-risk rate-regulated gas utility business that is offset
by its higherrisk construction services business. We view the regulated business as having geographic and regulatory
diversity serving about 1.9 million customers in Arizona Nevada and California. In addition, we view the company's
management of regulatory risk as average compared with peers. This reflects the company's ability to generally earn
close to its authorized return on equity partially by using credit-supportive mechanisms that include purchased gas,
FEBRUARY 16, 2016 3.srAnnAnnAivnpoons.coivunArmGsr>m£crTHISWASPREPARED EXCLUSWELYFORUSER Tzu xznuv.NOT FORREDISTRIBUTIONUNLESS OTHERWISEPERMITTED.

Exhibit No. (TKW1)Sheet 10 of Hz
Summary.uvnunvcot vie uucp.
infrastructure replacement riders customer-owned yard line and decoupling.
l
Century Construction mainly does pipe-replacement work for other regulated utilities and operates under multiyear
contracts. As such the potential for margin erosion that could result from higher-than-expected costs or reduced utility
capital budgets offsets our overall view of a strong competitive position that stems primarily from the regulated gas
utilities business. On a forwardlooldng basis, we view the higherrisk non-regulated construction services business as
representing more than 20% of the consolidated company.
Financial Risk: Intermediate
We assess Southwest Gas' intermediate financial risk profile using our medial volatility table, reflecting the company's
lower-risk regulated gas business that is offset by higher-risk Centuri Construction.
Our assessment reflects our expectation that the companys financial measures will reflect the lower-half of the range
of the intermediate financial riskprofile category. Under our base case scenario that reflects annualcapital spending
that averages about $460 million dividend payments averaging about $80 million regulated sales growth of about
l.2% and the continued use of existing regulatory mechanisms we expect FFO to debt of about 26%.
Our choice of the 'bbl' anchor given two potential outcomes (a-' or 'bbl') reflects the company's higher-risk
construction business which weakens the companys business risk profile toward the lower-half of the strong business
risk profile category.
lLiquidity: Adequate
Southwest Gas has adequate liquidity in our view, and could more than cover its needs for the next 12 months even if
EBITDA declines by 10%. We expect the company's consolidated liquidity sources over the next 12 months will
exceed its uses by more than 1. lx. Under our stress scenario we do not expect Southwest Gas to seek access to the
capital markets during that period to meet liquidity needs. The adequate assessment also reflects the companys
generally prudent risk management. sound relationships with banks and a generally satisfactory standing in the credit
markets.
Principal Liquidity UsesPrincipal Liquidity Sources
FFO of about $480 million.Available credit facility of about $340 million.Available cash of about $40 million.
Capital spending of about $460 million.Debt maturities of about $70 million.Dividend payments of about $80 million.
Other Credit Considerations
All modifiers are neutral and dont affect the standalone credit profile.
FEBRUARY 18, 2016 4WWW.STANDARDANDPOORS.COM/RATINGSDIRECT
THISWAS PREPAREDzxcl.usxvzx.vFOR USERgnuKENNY.HOTPOR REDISTRIBUTIONum.zss OTHERWISEPERMITTED.
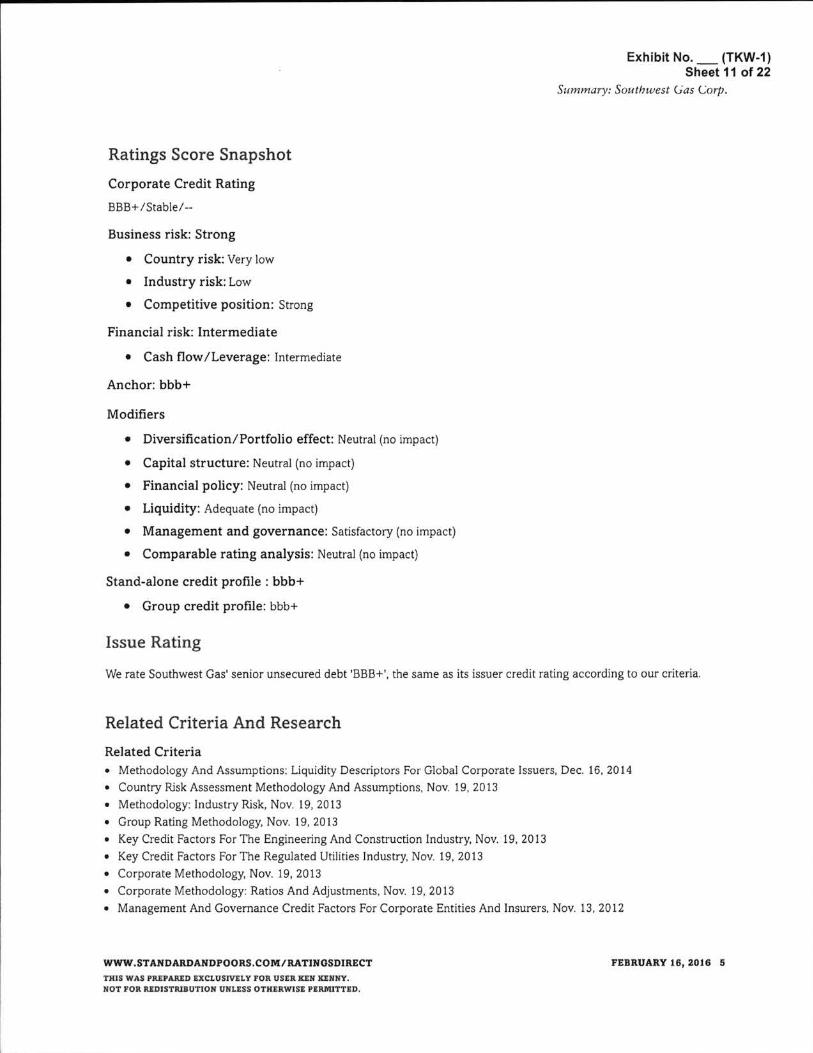
Exhibit No. _.___ (TKW-1 )Sheet 11 of 22
Summary: Southwest Gas Corp.
Ratings Score Snapshot
Corporate Credit Rating
BBB+/Stable/--
•
l
i
•
I
Business risk: Strong
Country risk: Very low
Industry risk: Low
Competitive position: Strong
Financial risk: Intermediate
Cash flow/Leverage: Intermediate
Anchor: bbl
Modifiers
Diversification/Portfolio effect: Neutral (no impact)
Capital structure: Neutral (no impact)
Financia l policy : Neut ra l (no im pact )
Liquidit y : Adequate (no im pact )
Management and governance: Satisfactory (no impact)
Comparable rating analysis: Neutral (no impact)
Stand-alone credit profile : b b l
• Group credit profile: bbl
Issue Rating
We rate Southwest Gas' senior unsecured debt 'BBB+' the same as its issuer credit rating according to our criteria.
Related Criteria And Research
•
•
1
•
•
•
I
•
•
R e la t e d C r i t e r iaM ethodology And Assum ptions: Liquidity Descriptors For Global Corporate Issuers Dec. 16 2014Country Risk Assessm ent M ethodology And Assum ptions Nov. 19 2013M ethodology: Industry Risk Nov. 19, 2013Group Rat ing M ethodology Nov . 19 2013Key Credit Factors For The Engineering And Construct ion Industry Nov. 19 2013Key Credit Factors For The Regulated Utilit ies Industry Nov. 19, 2013Corporate M ethodology, Nov. 19. 2013Corporate M ethodology : Rat ios And Adjustm ents Nov. 19 2013M anagem ent And Governance Credit Factors For Corporate Entit ies And Insurers. Nov. 13 2012
FEBRUARY16, 2016 5WWW.STANDARDANDPOORS.COM/RATINOSDIRECT
THIS wAs PREPARED SXCLUSWELY POR USER zn KENNY.NOT FOR REDISTRIBUTION UNLESS OTHERWISE PERMITTED.
l
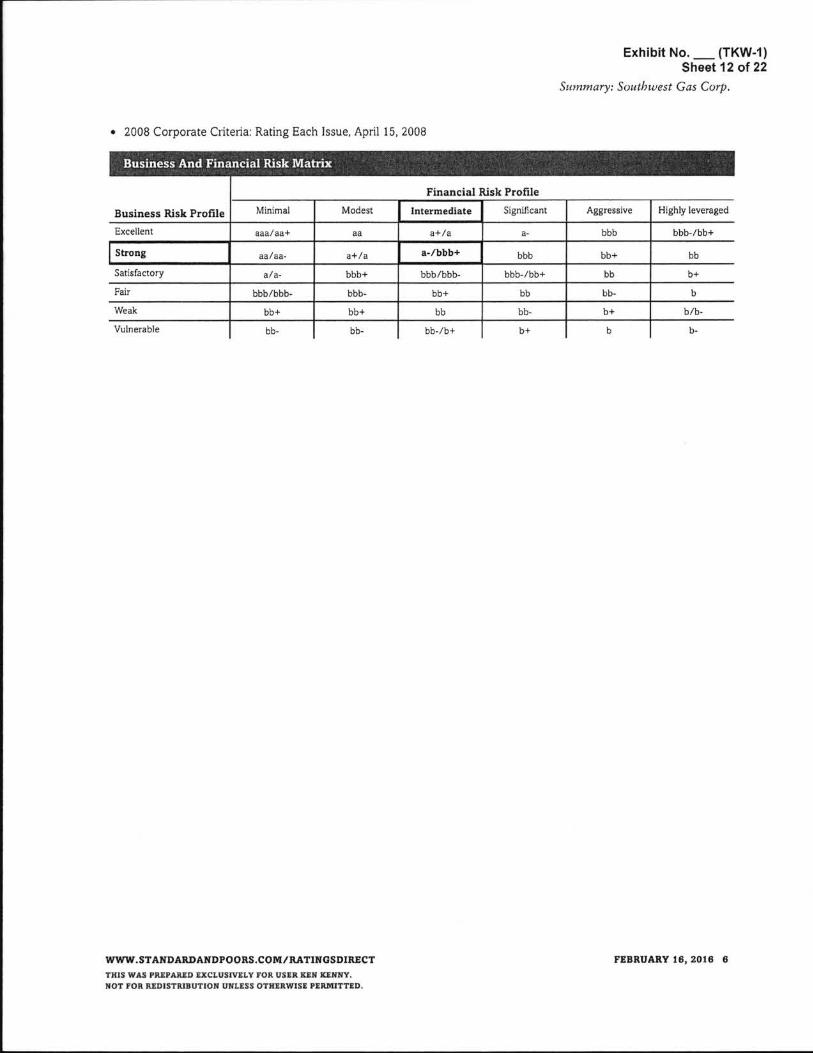
Exhibit No. _ (TKW-1 )Sheet 12 of 22
Summary: Southwest Gas Corp.
• 2008 Corporate Criteria: Rating Each Issue April 15 2008
Business And Financial Risk Matrix
Aggressive
bea+/a
bb l bob/bb+
Financial Risk Profile
Intermediate Significant
a+/a
a/bbb+
bbb/bbb
bb+i s
Business Risk Profile
Excellent
St rong
Satisfactory
Fair
Weak
Vulnerable
Highly leveraged
bob/bb+
bb
b+
b
b/b
b
b+
b
b e
bb b+
Minimal
ala/aa+
ea/aa
a/a
bbb/bbb
b e
bb bb/b+
FEBRUARY 16, 2016 eW W W . S T A NDA RDA NDP OORS . COM / RA T INGS DIRECT
THIS wAs PREPARED EXCLUSWELY FOR USER KEN KENNY.NOT FOR REDISTRIBUTION UNLESS OTHERWISE PERMITTED.

Exhibit No. (TKW-1ISheet 13 of 22
I
Published by Standard 8 Po0rs Financial Services LLC (S &Pl Executive and Editorial offices 55 Water Street New York NY 10041. Subscriber services: (1)2124387280.
Copyright ©2016 by Standard & Poors Financial Services LLC. All fights reserved.No content (including ratings. creditrelated analyses and data model software Or other application or output therefrom( or any part thereof (Content) may be modified.
reverse engineered reproduced or distributed in any form by any means or stored in a database or retrieval system without the prior written permission of Standard & Poors
Financial Services LLC or its affiliates (collectively S8rP) The Content shall not be used for any unlawful or unauthorized purposes. S8rP and any thirdpany providers. as well
as their directors officers shareholders. employees or agents (collectively S8rP Partiesl do mol guarantee the accuracy completeness timeliness or availability ef the
Content. S&P Parties are not responsible for any errors or omissions (negligent or otherwise). regardless al the cause for the results obtained from the use of the Content or
lot the security or maintenance al any data input by the user. The C 0ment is provided on an as rs basis S&P PARTIES DISCLAIM ANY AND ALL EXPRESS OR IMPLIED
WARRANTIES INCLUDING. BUT NOT LIMITED TD ANY WARRANTIES 0F MERCHANTABILITY OR FITNESS FOR A PARTICULAR PURPOSE OR USE. FREEDOM FROM BUGS.
SOFTWARE ERRORS OR DEFECTS. THAT THE CONTENTS FUNCTIDNING WILL BE UNINTERRUPTED. OR THAT THE CONTENT WILL OPERATE WITH ANY SOFTWARE ORHARDWARE CONFlGUFlATlON In no event shall S8rP Parties be liable to any party (or any direct indirect incidental exemplary compensatory punitive special or
consequential damages. costs. expenses legal fees or losses (including without limitation lost income or lost profits and 0pponunity costs or losses caused by negligence)
in connection with any use of the Content even if advised of tle possibility of such damages.
I
Creditrelated and other analyses. including ratings. and statements in the Content are statements 01 opinion as of the date they are expressed and not statements of fact.
S&Ps opinions. analyses and rating acknowledgment decisions (described below) are not recommendations to purchase hold or sell any securities Or ro make any
investment decisions and do not address the suitability al any security S&P assumes no obligation to update the Content following publication tn any form or formal. The
Content should not be relied on and is mol a substitute for the skill judgment and experience al the user its management employees advisors and/or clients when making
investment and other business decisions. S&P does not act as a fiduciary 0r an investment advisor except where registered as such. While S&P has obtained information from
sources it believes to be reliable S&P does not perform an audit and undertakes no duty of due diligence or independent verification of any information it receives.<br>.To the
extent that regulatory authorities allow a rating agency to acknowledge in one jurisdiction a rating issued rn another jurisdiction for certain regulatory purposes S&P reserves
the right to assign withdraw or suspend such acknowledgement at any time and in its sole discretion. S&P Parties disclaim any duly whatsoever arising out of the
assignment. withdrawal or suspension at an acknowledgment as well as any liability for any damage alleged to have been suffered on account thereof.
l
i
l
l
S&° keeps certain activities of 115 business units separate from each other rn order to preserve the independence and objectivity of their respective activities. As a resultcertain business units of S&P may have information that is not available to Other S&P business units. S&P has established policies and procedures to maintain theconfidentiality of certain nonpublic information received in connection with each analytical process.S8ip may receive compensation for its ratings and certain analyses
normally from issuers or underwriters of securities or from obligors. S&P reserves the right to disseminate its opinions and analyses. S&ps public ratings and analyses are
made available on its Web sites www.standardandp00rs.c0mlfree of charge). and www.ratingsdirect.com and www.globalcreditportal.c0m{subscription) and may be
distributed through other means including via S&P publications and thirdparty redistributers. Additional information about out ratings fees is available at
www standardandpoors.com/usratingsfees
S&ps Global Credit Portal uses cookies for remembering IDs. S&P uses billing and contact data collected from subscribers for billing and order fulfillment purposes andoccasionally to iniurm subscribers about products or services from S&P its affiliates. and reputable third parties that may be of interest to them. We also track web usage for
purposes 01 customizing the user experience and f0 r product development and/0r enhancement purposes All information entered 0n this Website is stored in a secure
database in the U.S. and access is limited to authorized persons ll you would prefer not to have your information shared as outlined in this notice. or if you wish to review
your information for accuracy or for more information on our privacy practices please call us at ll) 2124387280 or write to us at: privacy@standardandpoorscom For more
information about The McGrawHill Companies Customer Privacy Policy please visit www.mcgrawhill.c0m/privacyhtml.
Any Passwords/user IDs issued by S&P to users are single userdedicated and may ONLY be used by the individual to whom they have been assigned No sharing of
passwords/user IDs and no simultaneous access via the same password/user ID is permitted To reprint translate or use the data or information other than as provided
herein contact Client Services 55 Water Street New York NY 10041; fl)2124387280 or by emall to: research_request@ standardandpoors.c0m.
To reprint translate or quote S&Ps publications contact Client Services 55 Water Street New York NY 10041 (11212.438.7280 or by email toresearch_request @ standardandpoors.co m.
FEBRUARY 16, 2018 7WWW.STANDARDANDPOORS.COM/RATINGSDIRBCT
THIS WAS PREPARED zxcLusnel.v FOR USER Tzu KENNY.nor FOR REDISTRIBUTION UNLESS OTHERWISE PERMIITTED.

..; ..'x \ ?95
4. '\.
* goExhibit No. (TKW-1 )Sheet 14 of 22
.
.: t .ni us
. . r.* i f
-4Fitch Ratings " .§;1.>i
z9..\HL.4 l§
1 . .. M !< 1
. ..T§.241.
Utilities, Power & Gas I U.S.A.
Southwest Gas Corporation
Full Rating Report
Key Rating DriversA-
F2A
A
FT
Ratings
LongTerm IDS
ShortTerm IDS
Senior Unsecured
Industrial DevelopmentRevenue BondsCommercial Paper l
ll
Constructive Rate Design: The ratings of Southwest Gas Corporation (Southwest Gas)
benefit from a relatively constructive regulatory environment that has improved over recent
years. Southwest Gas' natural gas distribution business has revenue decoupling and
purchased gas adjustment mechanisms (PGAs) throughout its service territory. These
constructive rate mechanisms increase the stability and predictability of earnings and cash
flows and provide for more timely recovery of costs.
Stable
IDS - Issuer Default Rating.
Rating Outlook
LongTerm IDS Modest Regulatory Diversification: Southwest Gas natural gas distribution business has a
modest level of regulatory diversification which helps limit exposure to any one jurisdiction. In
2015 Arizona and Nevada accounted for 55% and 34% respectively of the utilitys operating
income while California accounted for 11%.2014
2122542
5471.6043.179
3461es9s1sa
156.9
Strong Financial Metrics: The constructive regulatory environment has enabled Southwest
Gas Financial metrics to remain strong. Excluding the beneficial impact of bonus depreciation
Fitch Ratings had forecasted FFO fixedcharge coverage to average 6.1x-6.4x FFO adjustedleverage 3.3x-3.5x and adjusted debt/EBITDAR 2.9x-3.0x through 2017 continuing to provide
headroom at the existing ratings. FFO metrics should be slightly stronger than originally
forecasted in 2015 due to the extension of bonus depreciation.
6.8
3.2
180.7
5.9
3.0
2.8 3.1
Financial Summary
Southwest Gas Corporation
(S Mil.) 2015
Adjusted Revenue 2464Operating EBITDAR 563Cash Flow fromOPSFBUOHSTotal Adjusted DebtTotal CapitalizationCaped/Depreciation (%)FFO Fixedcharge Coverage (x)FFOAdjustedLeverage (X)Total AdjustedDebVEBITDAR (x)
Moderate Risk in Construction Services Business: The positive credit attributes associated
with Southwest Gas solid financial profile are slightly diminished by the greater business risks
at the companys unregulated construction services subsidiary Century Construction Group Inc.
(Centuri). Centuri contributed slightly less than 20% of consolidated EBITDA in 2015 and Fitch
expects Centuris EBITDA contribution to remain around that level going forward.
Related Research
Southwest Gas Corporation -Ratings Navigator (September 2015)
Fitch Affirms Southwest Gas Corp. atA-. Outlook Stable (July 2015).I
|
Elevated Capex Program: Southwest Gas is undergoing a period of increased apex
primarily focused on safety and reliability. Fitch expects Southwest Gas natural gas distribution
business to spend a total of $1.4 billion-$1.6 billion over 2016-2018 with the annual amountgradually increasing each year. Concerns regarding the relatively large cape program are
mitigated by the utilitys various infrastructure replacement cost-recovery mechanisms. Capex
at Century is selffunded.
Rating Sensitivities
Positive Rating Actlon: A ratings upgrade is unlikely at this time but could result fromexpectations for FFO adjusted leverage to be less than 3.25x and adjusted debt/EBITDAR to
remain less than 3.0x on a sustained basis along with further improvement in the regulatory
environment that results in reduced regulatory lag.
AnalystsKevin L Beicke CFA+1 212 9080G 18kevinbeid<e@litchmingseoin
Philip w. Smyth CFA+1 212 9080531PNiPSf"W'@5\*"W'95°°'"
Negative Rating Action: A negative rating action could result from a significant deterioration
of the regulatory environment in Arizona or Nevada or a material expansion of Centuris
business activities that reduces the natural gas distribution segments share of consolidatedEBlTDA to 75%. A negative rating action could also result from expectations for FFO adjusted
leverage to be greater than 4.0x and adjusted debt/EBITDAR to be greater than 3.75x on a
sustained basis.
www.fitchratings.com April 8 2016

Exhibit No. _ (TKW-1)Sheet 15 of 22Fitch Ratings
. :Lffi .
Financial Overview
Liquidity and Debt Structure
Liquidity is adequate supported by sufficient availability under Southwest Gas $300 million
five-year revolving credit facility maturing March 25 2021. Southwest Gas also has an
uncommitted $50 million commercial paper (CP) program that is backstopped by the revolving
credit facility As of Dec. 31 2015, $50 million of CP had been issued and $118 million ofborrowings outstanding leaving $132 million of availability.
Southwest Gas keeps sufficient cash on hand to fund its daily business needs and had
$36 million of unrestricted cash and cash equivalents as of Dec. 31, 2015.
l
Upcoming debt maturities are manageable with $25 million of unsecured 7.59% medium-term
notes maturing in January 2017 and $125 million of unsecured 4.45% debentures maturing in
December 2020.
Centuri is selffunding and maintains access to liquidity through its $300 million secured
revolving credit facility which expires in October 2019. As of Dec. 31 2015 Centuri had
$77.4 million of availability under the facility. Centuri assets securing the facility as of
Dec. 31, 2015 totaled $437 million.
Total Debt and LeverageDebt Maturities and LiquidityTotal Adjusted Debt (LHS)
-Debt/EBITDAR (RHS) (x)4.0
3.0
2.0
1.0
0.0
Is Mn )2000
1.500
1000
500
0
1942
15142
1.35336
132 201520142011 2012 2013
Source: Company data Fitch.
($ Mil. As of Dec. 31 2015)2016201720182019ThereafterCash and Cash EquivalentsUndrawn Committed Facilities
Source; Company data. Fitch
Cash Flow AnalysisIi
Re l a te d Cr i te r i a
Recovery Ratings and Notching Criteriafor Utilities (March 2016)
Corporate Rating Methodology -Including ShopTerm Ratings andParent and Subsidiary Linkage(August 2015)
Parent and Subsidiary Rating Linkage(August 2015)
Rat ing U.S Ut i l i t ies . Power and GasCompanies (Sector Credit Factors)(March 2014)
I
Southwest Gas cape program is focused on projects to enhance safety and maintain the
reliability of the natural gas utility local distribution company (LDC) system with replacement ofaging pipe an important component. Southwest Gas plans to spend $1.4 billion-$1.6 billion in
total over 2016-2018 and Fitch expects the annual amount to increase each year over that
period as growth continues to drive investment. Construction apex is expected to continue to
be self-funded.
In light of the large apex program. Southwest Gas is likely to remain modestly FCF negativefunding the vast majority of cape internally. Fitch expects external funding requirements to be
financed via a balanced mix of debt and equity to maintain the current capital structure.
2Southwest Gas CorporationApril 8. 2016

Exhibit No. (TKW-1)Sheet 16 of 22
!itch RatingsF 4.
.42. . .u..MA .
CFO and Cash Use
:CFO 1 DividendsI Caped(S Mil)600
. l500
400
300
200
100
02013 2014 20152011 2012
Source: Company data Fitch.
Peer and Sector Analysis
Peer Group Peer Group AnalysisWCountry
(S Mil.)As ofIDSOuliookU.S.
Southwest GasCorporation
12/31/15A-
Rating OutlookStable
Ammos EnergyCorporation
12/31/15A_
Rating OutlookStable
SouViernCalifornia Gas Co.
12/31/15A
Rating OutlookStable
AGLResources Inc.
12/31/15BBB+
Rating WatchPositive
U.S.
IssuerASouther California Gas Co U.S.A-Ammos Energy Corporationas8+AGL Resources. Inc
historyIssuer Rating H 5815.713.9524.74.0569.173.5
258.79.0
8.215.212.4825.83.8811.938.7
293.313.3
6.306.583.6528.68.5051.367.4
361 .sas
7.416.952.853293 0453.277.5
1 a0.78.7
2.46416 155922.7(15)
160436
452(488)
3.789(23.4)
91824.2
(290)3.474
79842
(1006)
3941(26.8)120130.5
924898
19999
(1027)
3.489(9.5)
1.06930.6
(523)2152
58573
(1352)
Outlook/Watc hStableStableStableStableStableStablePosiliweStablePositiveStableStableStableStableStableStableStableStable
Fundamental Ratlos (x)Operating EBITDARI(Gross Interest Expense + Rents)FFO FixedCharge CoverageTotal Adjusted Debt/Operating EBITDARFFO/Total Adjusted Debt (%)FFOAdjusted LeverageCommon Dividend Payout (%)Internal Cash/Capex (%)Caped/Depreciation (%)Recur on Equity (%)
Flnanclal InformationRevenueRevenue Growth (°/>)EBITDAOperating EBITDA Margin (%)FCFTotal Adjusted Debt with Equity CreditCash and Cash EquivalentsFunds Flow from OperationsCapex
IDS - Issuer Default Rating.Source: Company data. Fitch.
LT IDSDate (FC)Sept. 30 2015 A-July 31 2015 A-Oct. 1. 2014 A-July 11 2014 A-April 7 2014 A-May 28 2013 A-May 30 2012 Baa+June 2. 2011 s a oJune 1 2010 BBBApril 29 2009 BBBFeb. 1 2008 BBBJan 17 2007 BBBDec. s 2005 BBBAug. 16 2005 BBBApril 28 2004 888April 2 2002 BBBJuly 25. 1996 BBBSept 14 1995 BBB-NOV. 30 1993 BB* -Sept 14 1990 BBB- -May 1 1977 eeB+ . -
LT IDS - LongTerm Issuer DefaultRating FC - Foreign currency.Source: Fitch.
3Southwest Gas CorporationApril 8. 2016
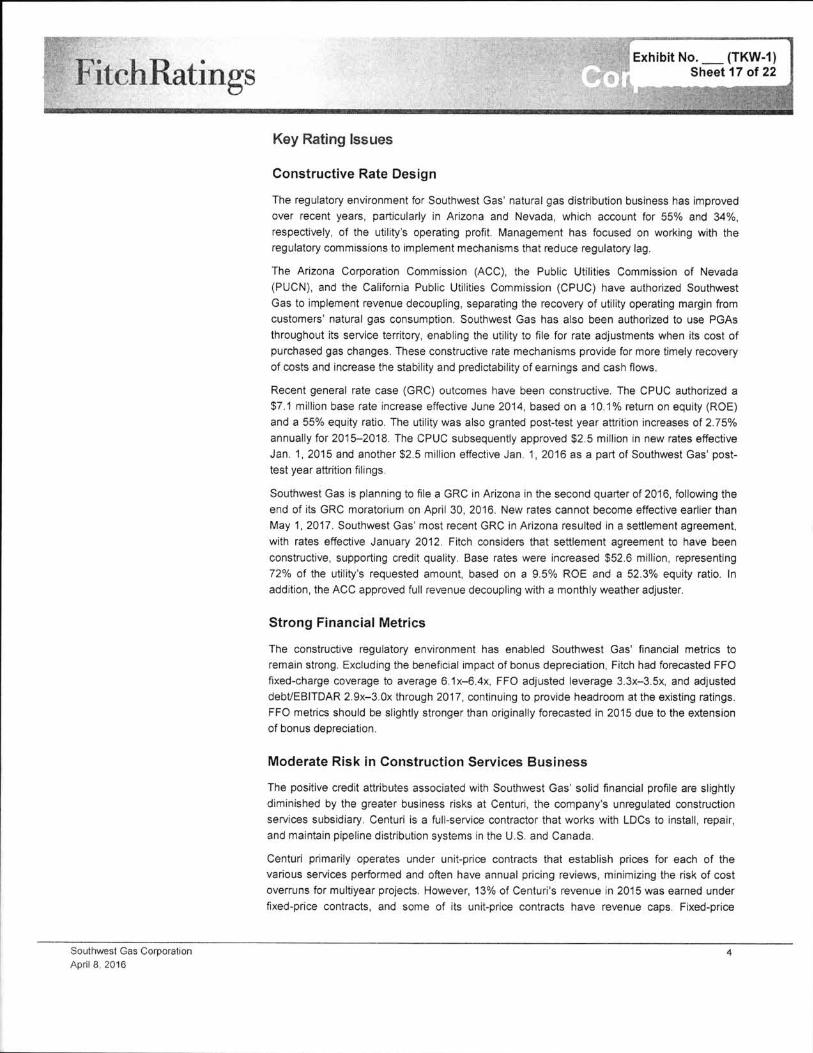
Exhibit No. (TKW-1)Sheet 17 of 22
21A . ,
:J. . a 41 . l .. . . 4
¢ = s ~x. » ,,
itch RatingsFKey Rating Issues
Constructive Rate Design
The regulatory environment for Southwest Gas natural gas distribution business has improved
over recent years particular ly in Arizona and Nevada which account for 55% and 34%
respectively. of the utilitys operating profit. Management has focused on working with the
regulatory commissions to implement mechanisms that reduce regulatory lag.
The Arizona Corporation Commission (ACC) the Public Uti li ties Commission of Nevada
(PUCN) and the California public Utilities Commission (CPUC) have authorized Southwest
Gas to implement revenue decoupling separating the recovery of utility operating margin from
customers natural gas consumption. Southwest Gas has also been authorized to use PGAs
throughout its service territory enabling the utility to file for rate adjustments when its cost of
purchased gas changes. These constructive rate mechanisms provide for more timely recovery
of costs and increase the stability and predictability of earnings and cash flows.
Recent general rate case (GRC) outcomes have been constructive. The CPUC authorized a
$7.1 million base rate increase effective June 2014 based on a 10.1% return on equity (ROE)
and a 55% equity ratio. The utility was also granted posttest year attrition increases of 2.75%
annually for 2015-2018. The CPUC subsequently approved $2.5 million in new rates effective
Jan. 1 2015 and another $2.5 million effective Jan. 1 2016 as a part of Southwest Gas' post-
test year attrition filings.
li
Southwest Gas is planning to tile a GRC in Arizona in the second quarter of 2016 following the
end of its GRC moratorium on April 30 2016. New rates cannot become effective earlier than
May 1, 2017. Southwest Gas most recent GRC in Arizona resulted in a settlement agreement
with rates effective January 2012. Fitch considers that settlement agreement to have been
constructive supporting credit quality. Base rates were increased $52.6 million representing
72% of the utilitys requested amount based on a 9.5% ROE and a 52.3% equity ratio. In
addition the ACC approved full revenue decoupling with a monthly weather adjuster.
Strong Financial Metrics
The constructive regulatory environment has enabled Southwest Gas' f inancial metrics to
remain strong. Excluding the beneficial impact of bonus depreciation Fitch had forecasted FFO
fixed-charge coverage to average 6.1x-6.4x FFO adjusted leverage 3.3x-3.5x and adjusted
debt/EBITDAR 2.9x-3.0x through 2017 continuing to provide headroom at the existing ratings.
FFO metrics should be slightly stronger than originally forecasted in 2015 due to the extension
of bonus depreciation.
Moderate Risk in Construction Services Business
The positive credit attributes associated with Southwest Gas solid financial profile are slightly
diminished by the greater business risks at Centuri, the companys unregulated constructionservices subsidiary. Centuri is a fullservice contractor that works with LDCs to install repair
and maintain pipeline distribution systems in the U.S. and Canada.
Centuri primarily operates under unitprice contracts that establish prices for each of thevarious services performed and often have annual pricing reviews minimizing the risk of cost
overruns for multiyear projects. However 13% of Centuris revenue in 2015 was earned under
fixedprice contracts and some of its unit~price contracts have revenue caps. Fixedprice
4Southwest Gas CorporationApril 8 2016
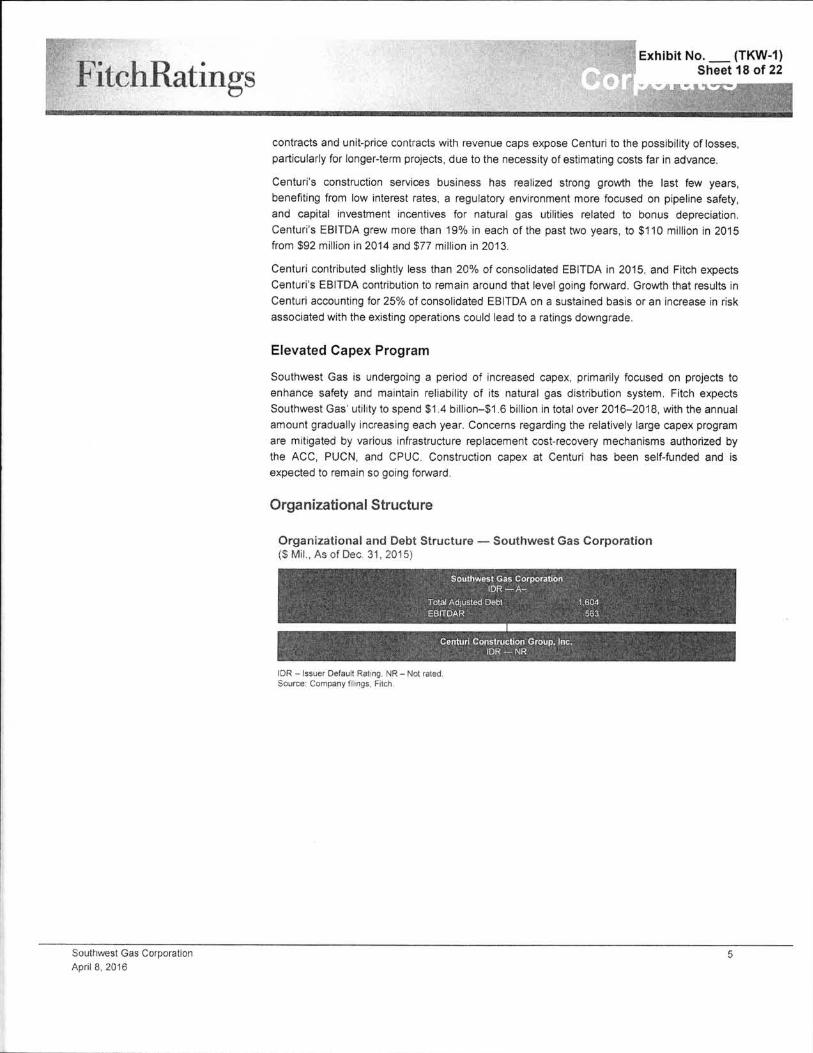
Tl
. .: . Exhibit No. (TKW-1)
Sheet 18 of 22.§.
oFitch Ratings . f"?v4' »
W F !
contracts and unitprice contracts with revenue caps expose Centuri to the possibility of losses
particularly for longer-term projects due to the necessity of estimating costs far in advance.
Centur is construction services business has realized strong growth the last few yearsbenefiting from low interest rates a regulatory environment more focused on pipeline safety
and capital investment incentives for natural gas uti li ties related to bonus depreciation.
Centuris EBITDA grew more than 19% in each of the past two years to $110 million in 2015
from $92 million in 2014 and $77 million in 2013.
Centuri contributed slightly less than 20% of consolidated EBITDA in 2015 and Fitch expects
Centuris EBITDA contribution to remain around that level going forward. Growth that results in
Centuri accounting for 25% of consolidated EBITDA on a sustained basis or an increase in risk
associated with the existing operations could lead to a ratings downgrade.
Elevated Capex Program
Southwest Gas is undergoing a period of increased cape primarily focused on projects to
enhance safety and maintain reliability of its natural gas distribution system. Fitch expects
Southwest Gas utility to spend $1 .4 billion-$1 .6 billion in total over 2016-2018 with the annual
amount gradually increasing each year. Concerns regarding the relatively large caped program
are mitigated by various infrastructure replacement costrecovery mechanisms authorized by
the Acc PUCN and CPUC. Construc tion cape at Centuri has been self~funded and is
expected to remain so going forward.
Organizational Structure
i
Organizational and Debt Structure - Southwest Gas Corporation(S Mil. As of D80 31 2015)
Southwest Gas CorporationIDS - A-
3ii
1.604563
Total Adjusted DebtEBITDAR
Centuri Construction Group. Inc.IDS .... NR
IDS - Issuer Default Rating. NR - Nd ratedSource: Company filings Fitch
;
5Southwest Gas Corporation
April 8 2016
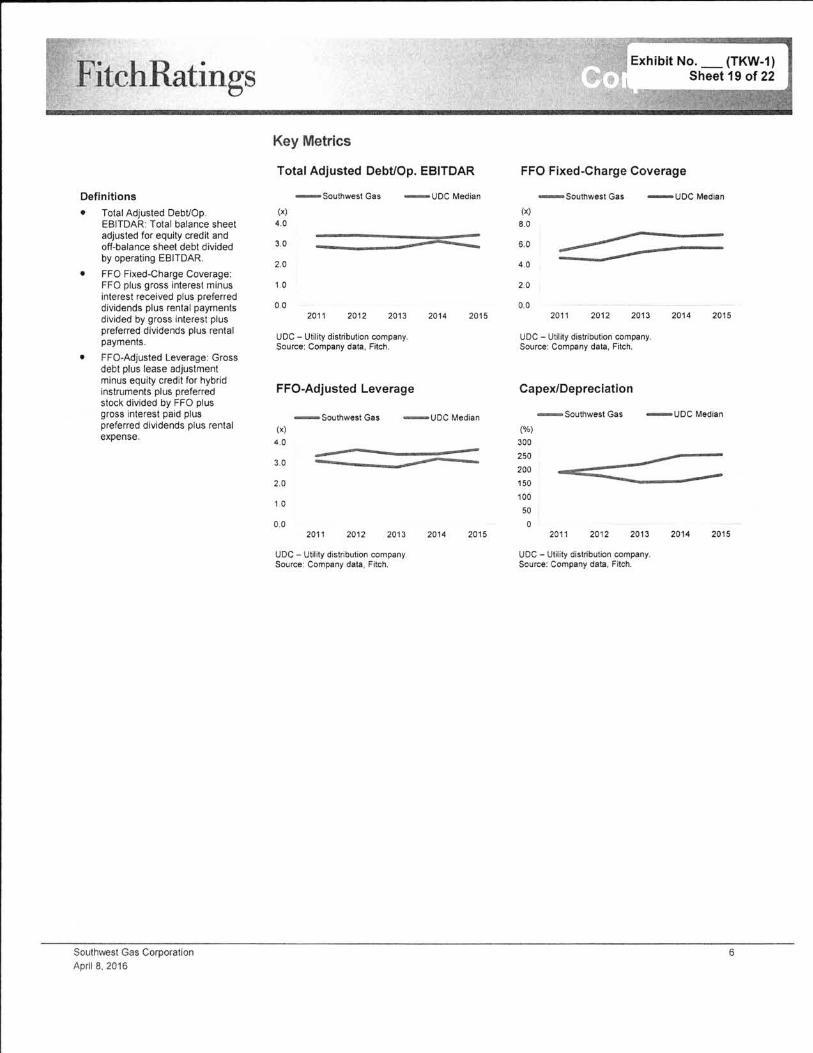
Exhibit No. (TKW-1 )Sheet 19 of 22itch Ratings
.v
LeFKey Metrics
FFO Fixed-Charge CoverageTotal Adjusted Debt/Op. EBITDAR
-_ Southwest Gas - UDC Median -UDC MedianDefinitions• (x)
4.0
3.0
2.0
1 0
0 o
--Sourrlwest Gas(X)8.0
6.0
40
2.0
0.02011 201520142013201220152011 2012 2013 2014
UDC- Utility distribution company.Source: Company data.Fitch.
UDC- Utility distribution company.Source: Company data Fitch.
CapexlDepreclationFFO-Adjusted Leverage
- U D C Median- Southwest Gas --UDC Median Southwest Gas
(%)
Total Adjusted Debt/Op.EBITDAR: Total balance sheetadjusted for equity credit andoffbalance sheet debt dividedby operating EBITDAR.
FFO FixedCharge Coverage:FFO plus gross interest minusinterest received plus preferreddividends plus rental paymentsdivided by gross interest pluspreferred dividends plus rentalpayments.
FFOAdjusted Leverage: Grossdebt plus lease adjustmentminus equity credit for hybridinstruments plus preferredstock divided by FFO plusgross interest paid pluspreferred dividends plus rentalexpense.
(x)4.0 300
250200150100500
3.0
20
1 o
0.02014 20152011 2012 2013201420132011 2012 2015
UDC -Utilitydistribution company.Source: Company data Fitch.
UDC - Utility distribution companySource Company dataFitch.
5Southwest Gas CorporationApril 8. 2016
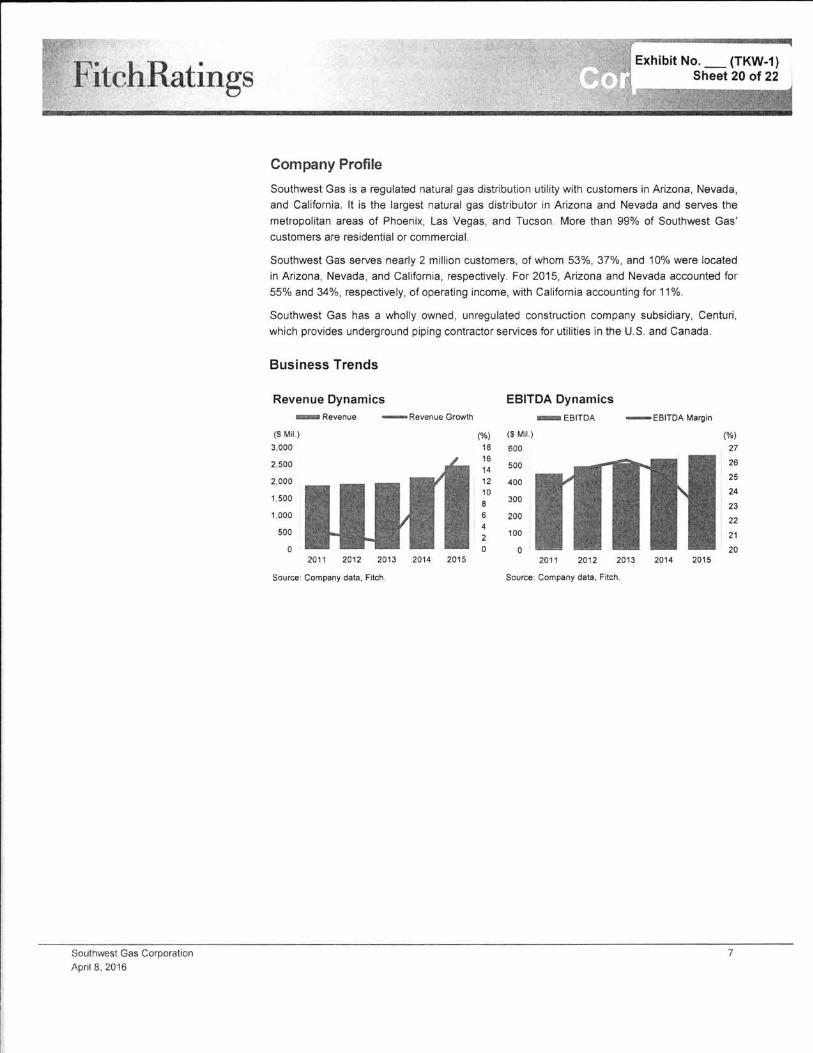
4
gr; Exhibit No. (TKW-1)Sheet 20 of 22
. ; 4. . w
i.f1u%. of; 4§
: Ke ..
4.95itch Ratings
.~ 2QFCompany Profile
Southwest Gas is a regulated natural gas distribution utility with customers in Arizona Nevadaand California. It is the largest natural gas distributor in Arizona and Nevada and serves the
metropolitan areas of Phoenix Las Vegas and Tucson More than 99% of Southwest Gas
customers are residential or commercial.
Southwest Gas serves nearly 2 million customers of whom 53% 37% and 10% were located
in Arizona Nevada and California respectively. For 2015 Arizona and Nevada accounted for55% and 34% respectively of operating income with California accounting for 11%.
Southwest Gas has a wholly owned unregulated construction company subsidiary Centuri
which provides underground piping contractor services for utilities in the U.S. and Canada.
Business Trends
EBITDA DynamicsRevenue DynamicsRevenue --Revenue Growth - EBITDA EBlTDA Margin
(499
,
.85: w
Le
. 7;....
3:4E IIIII
(%)181614121086420
(S Mil.)
3000
2500
2000
1.500
1.000
500
0
(°/°)27
26
25
24
23
22
21
20
(S Mil.)
600
500
400
300
200
100
020152014 20152011 2012 2013 2014
Source: Company data. Fitch.
2011 2012 2013
Source: Company data Fitch.
11
111
7Southwest Gas Corporation
April a. 2016
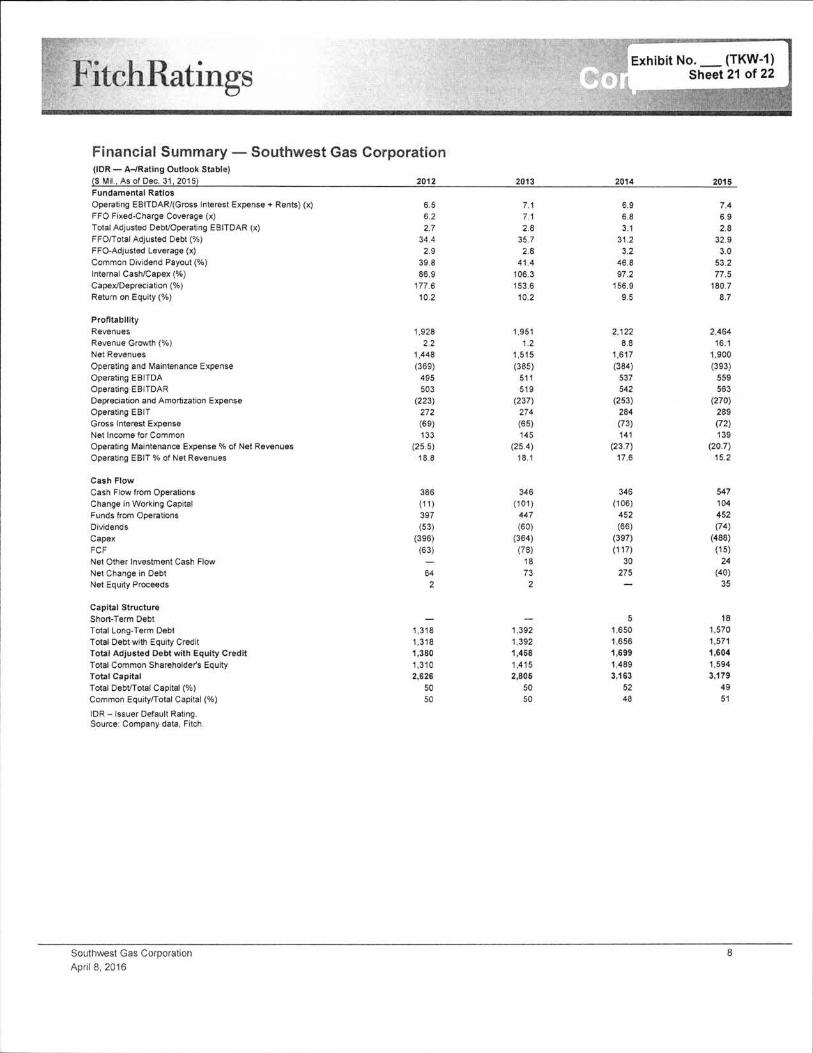
*' Exhibit No.._ (TKW-1 )Sheet 21 of 22
9.Fitch Ratings ",..; .
.. . .
. . . .; : . / . J
.t°..
4 .;12 yFm !# l:...i
uh.
~Financial Summary - Southwest Gas Corporation
2012 20142013 2015
7.46.92.8
32.93.0
53.277.5
18078.7
6.56.227
34.42.9
39.886.9
171.610.2
7.171
2835.72.8
41.4106.3153.6
10.2
6.96.83.1
31.23.2
46.897.2
156.99.5
(IDS ._ A-/Ratlng Outlook Stable)(S MiI As of Dec. 31. 2015)Fundamental RatlosOperating EBITDAR/(Gross Interest Expense Rents) (x)
FFO FixedCharge Coverage (x)Total Adjusted Debt/Operating EBITDAR (x)FFO/Total Adjusted Debt (%)
FFOAdjusted Leverage (x)Common Dividend Payout (%)Internal CashlCapex (%)Cape Depreciat ion (%)Return on Equity (%)
l
l
21228.8
1.617(384)
537542
(253)284
(73)141
(23.7)17.6
246416.1
1900(393)
559563
(270)289
(72)139
(20.7)15.2
19511 2
1515(385)
511519
(237)274
(85)145
(25.4)18.1
19282 2
1.448
(369)495503
(223)272
(69)133
(25.5)18.8
Profitabil ityRevenuesRevenue Growth (%)Net Revenues
Operating and Maintenance ExpenseOperating EBITDAOperating EBITDARDepreciation and Amortization ExpenseOperating EBITGross Interest ExpenseNet Income for CommonOperating Maintenance Expense % of Net RevenuesOperating EBIT % of net Revenues
386
(1 1)397
(53)(396)(63)
l
346(101)
447
(60)(364)
(78)l a73
345(106)
452
(66)(397)(117)
30275
547104452
(74)(488)
(15)24
(40)352
642
Cash FlowCash Flow from OperationsChange in Working CapitalFunds from OperationsDividendsCapex
FCFNet Other Investment Cash FlowNet Change in Debtnet Equity Proceeds
51.650
1.6561.6991.4893.163
5248
18157015711.60415943.179
4951
1.392139214s s14152a0s
5050
13181318138013102626
5050
Capital Structure
ShortTerm DebtTotal LongTerm DebtTotal Debt with Equity CreditTotal Adjusted Debt with Equity CreditTotal Common $hareholders EquityTotal CapitalTotal Debt/Total Capital (%)Common Equity/Total Capital (%)
IDS - Issuer Default Rating.Source: Company data Fitch
8Southwest Gas CorporationApr il 8 2016

Exhibit No. (TKW-1 ISheet 22 of 22itch Ratings
4F 44 ". 3 .
The ratings above were solicited by. or on behalf of the issuer, and therefore Fitch has been
compensated for the provision of the ratings.
ALL FITCH CREDIT RATINGS ARE SUBJECT TO CERTAIN LIMITATIONS AND DISCLAIMERS PLEASE READTHESE LIMITATIONS AND DISCLAIMERS BY FOLLOWING THIS LINK;H SJ/FITCHRATINGS.COWUNDERSTANDINGCREDITRATINGS. IN ADDITION RATING DEFINITIONS ANDTHE TERMS OF USE OF SUCH RATINGS ARE AVAILABLE ON THE AGENCYS PUBLIC WEB SITEAT .FlrcHmTlnGs.com. PUBLISHED RATINGS. CRITERIA AND METHODOLOGIES ARE AVAIIABLEFROM THIS SITE AT ALL TIMES. FITCHS CODE OF CONDUCT. CONFIDENTIALITY CONFLICTS OF INTEREST.AFFILIATE FIREWAI.L. COMPLIANCE. AND OTHER RELEVANT POLICIES AND PROCEDURES ARE ALSOAVAILABLE FROM THE CODE OF CONDUCT SECTIOn OF THIS SITE. FITCH MAY HAVE PROVIDED ANOTHERPERMISSIBLE SERVICE TO THE RATED ENTITY OR ITS RELATED THIRD PARTIES. DETAILS OF THIS SERVICEFOR RATINGS FOR WHICH THE LEAD ANALYST IS BASED IN AN EUREGISTERED ENTITY CAN BE FOUND ONTHE ENTITY SUMMARY PAGE FOR THIS ISSUER ON THE FITCH WEBSITE.
Copyright © 2016 by Fitdl Ratings. ire Foch Ratings Lid. and its subsidiaries 33 Whitehall Stied. NY NY 10004.Telephone: 18007534824 (212) 9080500. Fax: (212)4804435. Reproduction or retransmission in whole or in part isprohibited except by permission. All rights reserved. In issuing and maintaining its ratings and in making other reports(iWWi forecast information) Foch relies on factual information it receives from issuers and underwriters and from othersources itdibelievesto be credible Fitch conducts a reasonable investigation of the factual information relied Lion by itin awordarroe with its ratings methodology and obtains reasonable verification at that information from independentswrces. to the extent such sources are available for a givenseairiya in a given jurisdiction. The matter of Fitchs factualinvestigation and the scope of the thindJparty verification it obtains will vary depending on the nature al the rated seaxityand its issuer the requirements and practices in the jurisdiction in which the rated searrity is offered and sold and/or theissuer is located. the availability and nature or relevant public information access to the managematt d the issuer and itsadvisers the availability of preexisting thirdpaty verifications such as audit reports agreedupon procedures entersappraisals actuarial reports. engineering reports. legal opinions and other reports provided by tIird pardei the availabilityof independent and competerl thirdparty veriicadon swroes with respect to the partiarlar searrity or in the pardwlarjurisdiction M the issuer and a variety of otter factors. Users of Fitchs ratings and reports should underhand that neitheran enhanced factual investigation nor any thirdparty verification can ensure that al of tie information Fitch ides on inconnection with a rating a a report will be accurate and compete. Ultimately the issue and its advisers are responsive forthe acairacy of the information they provide to Fitdi and to the market in otteririg documents and other reports. In issuingits ratings aid its reports. Fitch must rely on the work of experts lnduding independent auditors with raped to randalstatanerlts and attorneys with reaped to legal and tax matters. Further ratings and faecasts of financial aid otherinformation are inherently forbadlooking and embody assumptions and predictions about flexure events that by ttdrnature cannot be verified as fads. As a result despite any verification of aineit tacts ratings aid forecasts can be affectedby future events or conditions mat were not anticipated at the time a rating M forecast was issued or affirmed.The information in this report is provided as is without any representation or warranty of any kind aid Fem does notrepresent or warrant that the report or any of its contents will meet any of the requiranents of a recipient of the report AFitch rating ts an opinion 8 to the cledilworttiness of a security. Ttys opinion and reports made by Frtch are based onestabtehed criteria and methodologies that Fitch is continuously evaluating and updating. Therefore. ratings and reportsare the oolledive work product of non and no individual or group or individuals. is solely responsible for a rating or areport. The mom does not address me risk of loss due to risks otter than crept rb unless such risk is spedicaltymentioned. Fitch is nd engaged in the Etta or sale of Ag; security. All Fitdi reports have shared authorship. individualsidentified in a Fitch report were involved th but are not s Dy responsible for the opinions stated therein. The individualsare named for contact purposes only. A report providing a Fitch rating is neither a prospectus nor a substitute for theinformation assembled varied aid presented to investors by the issuer and Ng agents in connection with the sale of thesecurities. Ratings maybedragged or withdrawn at any time fa any reason in tie Ade discretion of Fitch. Fitch does notprovide investment advice of any sort Ratings are not a recommendation to buy sell or hole any seairity. Ratings do notcomment on the adequacy of market price the suitability of any security fa a particular investor or the laxexenpt natureor taxability of payments made in respect to any security. Fitdi receives tees from issuers. insures. uararrtors. otherobligors. and underwriters for ratkig searrities. Sudl fees generally vary from US$1000 to US$750.000 in the applicablecurrency equivalent) per issue. In certain cases. Fitch will rate all or a number of issues issued by a paniarlar issuer orinsured or guaranteed by a particular issuer or guarantor. for a single annual fee. Such fees are expected to vary fromUSS10.000 to US$1500.000 (or the applicable currency equivalent). The assignment publication or dissemination d arating by Fitch shall not constitute a consent by Fitch to use its name as an expert in connection with any registrationstatement filed under the United States searnties laws. the Financial Services and Markets Ad d 2000 d tie UnitedKingdom. U the searrities laws or any particular jurisdiction. Due to the relative efltdaicy of electronic publishing anddistribution. Fitch research may be available to electronic subscribersupto three days earlier than to print subscribers.For Australia. New Zealand. Taiwan and South Korea OHM Fitdt Australia Pty Ud holds an Australian financial deviceslicense (AFS license no. 337123) which arlhorizes it ro provide credit ratings to wholesale rents only Credit ratingsinformation published by Fitch is not intended to be used by perscrrs who are retail clients within the meaning of theCorporations Ad 2001 .
gSouthwest Gas CorporationApril 8 2016
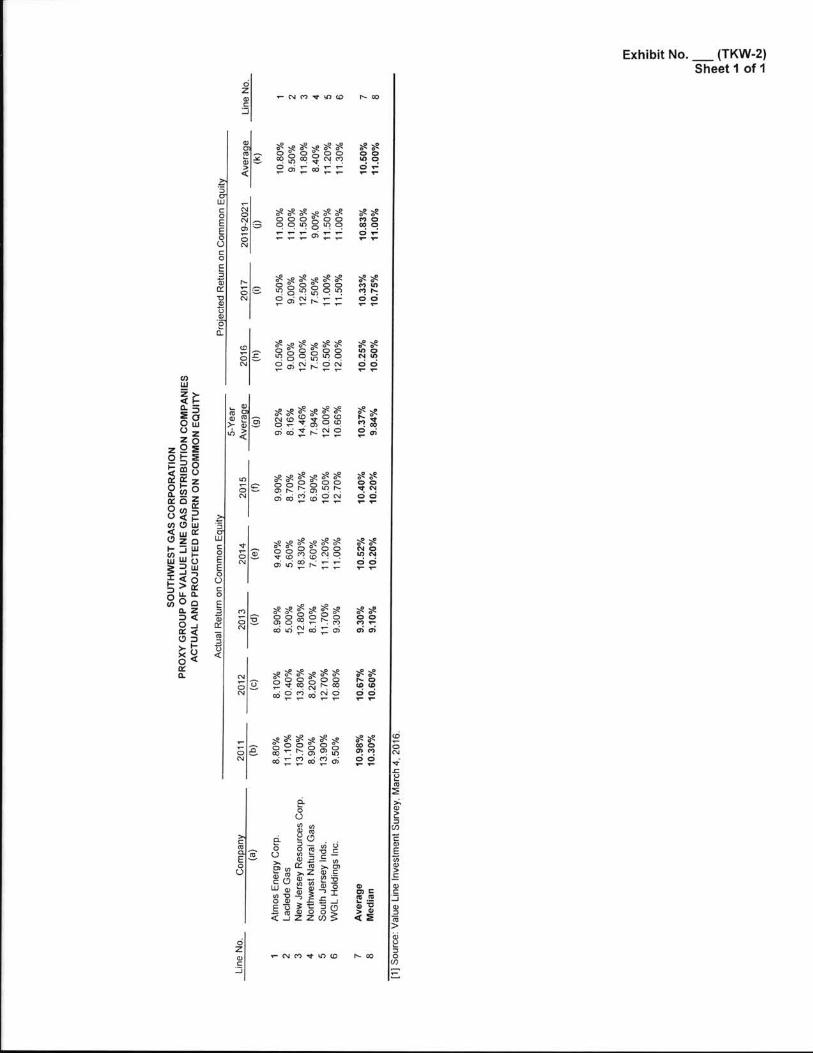
ExNbHno. (TKW-2)Sheet 1 of 1
- N <> v IO (D r~oo
6za»c_I
2 ;m yO FP '
w $88888 go8°8°88 8 8. m . v . .
3 °¢$W§Cr :3
s ETRa oet qQ v'- -
89328948282o o o g o oQ Q ~ f2 ° * Q Qp - v - v -w - p M v F
1 -No'Yr-mevoN
r\- AQ 4 :N
828828932m 88888
$89nmw eo fQ- F
UJcoEEoO:o:.2mmU8u.cae
a.
Wo rN
$8Ono~.~feo fF F
\° ~e ~e ~2ala$a§" ? o ° . 9 1 ' ° .O N O N
' M '
o e a£§8$8$o F Y 8 9 96 , 8 9 4 , _ n o
\° o& >43°¢
o(Bq) N99
" <
ESN
SOo f*t~.o f1 - -
m $s§$§§OONOIDN6 W6&mo o . . . <o v _-
o 8N
82328484848 o0 0 0 0 0 0v © " w n Qc>8n°°/~§,'I
Q sN O"f~.o fv v
U) o8 \.¢ggo fQ"Imm
css§§g§8 8 3 9_e o 1 n _ m _ o >
gLUcoEEoOcoE3G)or33u<
U)EzbE28gm
28e g go388z280s==§093288LUUzi#Yum | -
o8 2ago848¢ n 0 O888 . 1
s>o§mo.
MQ BN
o#8888°vo o °v~o oFddnndW w - 1 - v " -
s sv~oQ Qo f1 - 1 -
<6-o(\|v
P $88888fs °°8- "m,1,_oo,_c>
£8iv;o f1"!- .c8RuE
9oO
88.. o . .
- u> o§SvscNE Too S
oz3v>...cG)E. .8>
w.E_I2-
Q Uas
d»8 U D C> - g,§ £ >Z M 8 .9: 0 8 3 § EU J v 5 ¥ . . 1 £8 8 " > C S . :59*3sw< 4 2 Z W 3
4:Ag:m>< 5
w::cl>
8r~uo- N M v UP (D
3o(D
6zwc_J -
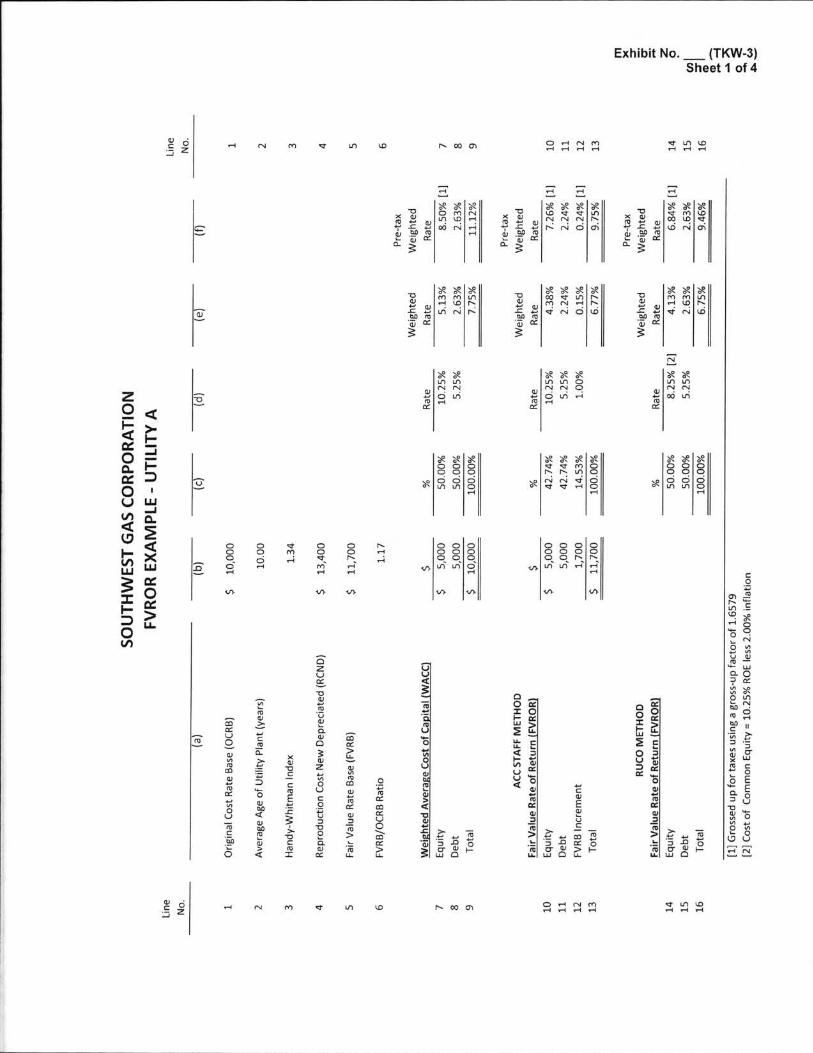
Exhibit No. (TKW3)Sheet 1 of 4
H N m A o f asW m m F l N m1 H -1
o-1
v m w-1 - l 4
ea 6c5 Z
--1FL F (
82928ad
:._x 33 xo m Nm w -1
N ppF l
, `
ah ah X BQno q v mN N NN N o as
or
m q; ." W'64 ¢Q.
xto'TG)._4
oz 2 as* .C 4£, no ml. .5 o r'* 3
o>< GJ
4. c
ca .99
g
D
2 UC 4.29 fu
s
>2m so*Q qN m
83 32 39m m mH m r\in N X 33 32 Xof v m r\m N -1 N
Q N o s oOJ»``¢
v
m
x
ovu.cofG)3
D8 GJ. c ube fuan 1
o xxxm u m8.,,~~Q'w
. c www. 9 "w e :
N. .
z
X BE ahLm Lm o~. ~. Qo Lm HF(3
>2 BQ
Mn 4NQ . .o f m
Ram
KJivo r
so ah8 8
8 9 i i1
3983328
32
82 Be xo o oQ Q QQ Q Om m o
- 1
38 X 83 ahv v fn okw 'w "T Q
89 N N v oQ ¢ -1 883838F
qopp
w
l.u
o
FmH
- 13
o o o oo O o oQ Q fu 'xm mvs "" 3
m vs
o o Nm o 4-1 q` FT
m- 1
W w
Q o <oqo- 1
an
o o oo o aQ Q qi n LD oV* H
vs vs
>lil
g << i°= :o »=SO 38 ;m EI<
83 xLIJ n;:so1- as3 LLi n
uU<3 D»m̀B
mw>
9m
3zum~.»UGJHcuuq)._QUo
"~u
cyu4-oToou
3ozu9.mmcum
8 5IE EEouDz
mz
U w-oE
3a¢
E."~.
8m
E
Hc2D.483 c*oww<
Tou wor -
w
uEm m8 ¢ 6
| -
co16m -
v~28. -.a s"'c
* QQ .N
`5 v* 01o Wcv'-
* Lu<10D o$39Q mM n
~8Qu38 8,<uJf u;" o" EQ° o8 u8%
H
Q BUE E
cL
:uwXowmzw3N _.> u iv.* : g uN ou. up Q
To>L.Nu.
5Nor
uO\m4>L L
LuE:.c3>ccmI
°a=Is - a" ">E u.
* c'35'-'.1u< 3 *E
1;= §8 ;
m>8f.* :4 : 8 8 a
>* u3 .Q oo an »-Lu O
;<, 3zv.8 °° oc 3Q no m'G Q ac8 3oB
QG)M
UaDm.
QJ>
<
a:44ma:mouTyc.20._o
Um\.m><UUu. c
m wH N m v of m v m n o-1 -4 FT
o - 4 N m-1 -1 Fl v-
an .c oJ Z '
i
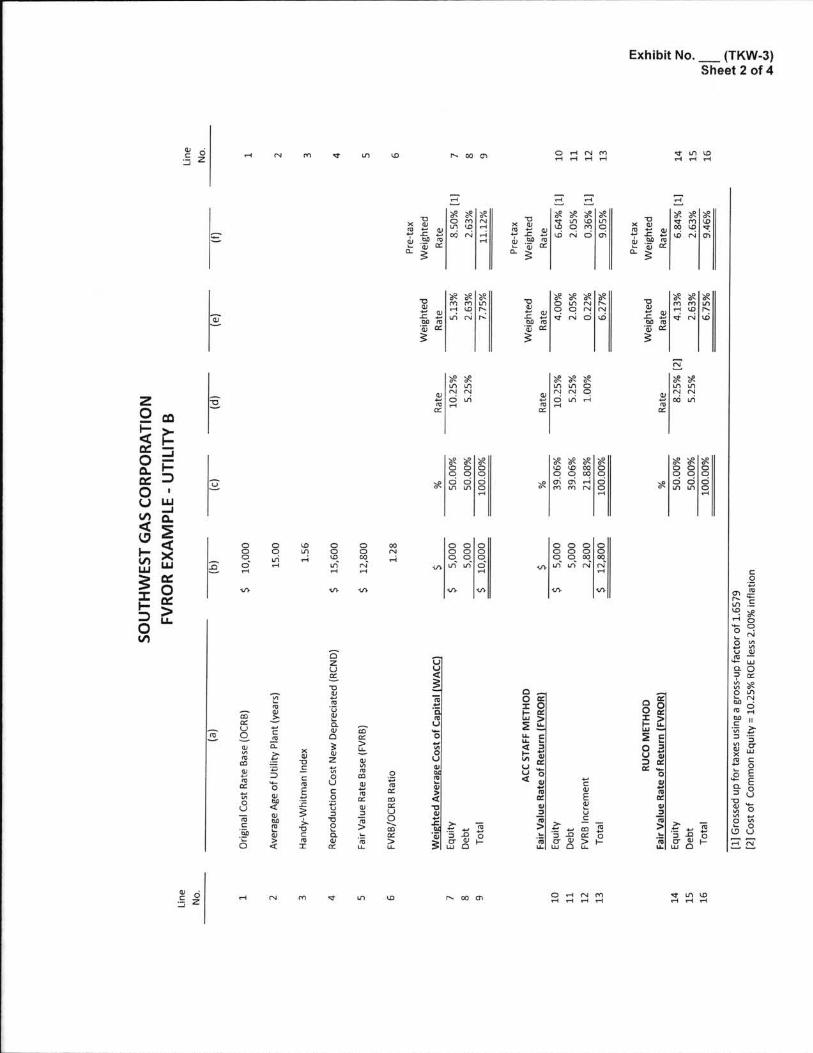
Exhibit No. (TKW-3)Sheet 2 of 4
-4 N m Le KDv N of m o Fl N m-1 -4 F( F( Q m wpp F( -1z
Gd5
--4
\
mw
:GJu
._ -.; -I
BE ah 33 338 nm w m
o Eva om N o m
8bi 32 89as m LD
w vw N m»`4-
cx D mto m LD -4
.cof fu
8' 1
4)uivas8
QS381;\ . § ¢
" s
c3; 8T 89 a
3
>2 .°o No f N HH
ET
U
83m m|\N wm
39 89 ah BEo m NQ Q ~. n.
13 v N o nom
c et ah ahGJ m o n he
as - a s o. c L m N2° paa: a¢
oUu.cIaw3
323 m2 8 3 `°I a Eus m
-N_g Xm Rhn. ~.of m
32 hi xm m 8N No IN 1-4-1
BE a hm Len . ~ .o mFL9, .
G)wfuor
U4mx
Uuivm
xo
u ah >2
ah ah aho oQ Qo om o-1
X BE 32 aho no o f oQ Q e t Q
F T8 2 N §Ag 89 as
Q QQ Q QQ Q Qm m Q
-1
QQm
l¢
of~.Fl
LDmF l
oQnmp(
§
LL._I4
E<xLU §
o o o oo o o oQ Q of et./s Lm m N g
vs w
Fl
V>
o oo o'Q ofm N"l -4
w w
o o oo o oQ Q qvs m m 3
vs (0
z
Q m| -
< E:J
g *5Oum<LE| -m
u.l a¢88| -D Eom
uu<
o VSoL»m̀;
m4)>~¢TO~..
8orL.)Q,
>u..
u. E< 3
f-ma:>LL
ivOF
mu0-ouvouU
Eu;34-
o8cox
ggLE3
G)
cu.w>
<
> To4o|-
o| -
aU
w z17ouc.94u8
> ou
fu 8I m
c.9*aQ ¢m . :
w ahH o- - oQ .8 f v
a mg t '
* u.»Q OD m" X
mN"cs
W -4&°ll; 83 8
6838:" oQ E* E4 0U p
915m
Se» oLD U.- ._»- i n....._.
¢Q oo asgoE EQ :u 33 orM Q-
o2masv3m _> 9 4 19.* = 88 S o
monLJomz>u .
3zU5 .oGJnouU6.
8 w2
an n. x 3go >mQJmzuvsoUEcQDl . .
o
GJVImmGJmacw
2m>»mu .
o zI ol- oru.:
Eu .
U, uor8 *< o u
2 8N3 3J bTo z E>\. 3 8 3cu u w >4 up Q u.
o
32°wup D8 c><
uw.E . .._ " 8 8as : oU ea |-3 up a
H N inm A co cmwv o H N mFL 'l F( F l Q Le wH 4 F(
w .c o3 Z

Exhibit No. __ (TKw-s)Sheet3 of4
4 n m 4 vi \D r~ m Q U \ a N- - 1 -1oo~ .. 3 ...
n of m o c N mI N N N Nea .c oD Z\
V? ~. ~.V s o* -4-4
vs "1 "P8 i N4 44 .
etHal~.
8
c c of Nu U>eo;z 3o
m N v
E m s 2 9:U v 3 N 4> .:
mo UZ U> ¢H.
o Q °=z ~z sq: n 8 W -C c 3 ~ x xw o mbEo r 8a s 5o¢ 5> a :u. w vs vs vs I
UJ
U 8¢ .:
w VSv\
v Q "2 " ! V?J u m Q o F T-1-4
uz
8z> zu.v s w
V*
-4"§Q .-4 4
1§°4 .4
m m e- 4
Q q q4 4 1
q vFT 8 Flv~ r~ r~N N N
H
3E mG z= >o .<
888r \ r n
8¢92:8 ¢-.53<
8C m
Et8 4
Ean*n
Sx a hi v N'T "1¢ \ 4
x888 :
E* at BR3 ; ¢ 9 5 m N o f
r - o m m Q a yl a m o n N o o: E "
x 8 8 B (m o H mz Q nm Q 'Qo m N o r ~8
V I
7,7. . _#xxxg r so v v vu0 w " w ¥a:r~~oo»" >..
5 4
afxaf faovmMMNHAg v f wo m>u.
8 Ex xaueae¢V\hnm» - o " ! ~ . ~ ° = !é ¢ h n o u »- >° u .
xaeauemr~m8X Q NHOénaowda
VSHr t
. .aNP
b e * §m mN No m w e4
ou
an as §m VN No m ¢FL
uou
of we §m mN Nd v i . 1-c
VoU
h
§ 8 v we4Q v~
o 8 . J 4• R u 4 -9 w m- J 8
o I v< ¢w
M
q
xoz>u.xMrea-4
ToucUEo.uE><
* weso \o asN i v Qn m m 8o Q Q 1
:uz
8 Ar x8 8 9 §
298~§3X
x A r * §Q v mN N eN N Qo Q Q F T 8; H
m¢ mac>u.
o m§ ma . Q Q" 85 Lu
T : E mv U o5 EE ¢
us vs
z &
9 E»-<8888:<8°>msU i 9
aE D
' 9=8' J O " IL U
3I| -3om
3 ' J Ja c E3 o r
oor>u .
E
§4
F T
4
-1
§§o m
_ £ 4 C
36"
G Q Q: § § H 4u r~ l ~4 8 m n m - I p H£81%a . m
§ § § §an ....3 m m :
3mno
E5 8J u< a¢
Sn v»
m m§ § 1 su .3 1
mgLu¢
vs 4/1v>vsvsvs
3ucUE0.u
E4¢oz>U.*Lu-rIa4
:8DTsucvE2uE
mac>u.
ccuas :u
9.\
5zO
3.5g5E5
Uv.... :o. c
S<xm¢>4
uUN
xo
sE3
-oL54
_Qvs-Evea
¢ E
cB:ueazsovufuz §
_ a l£ 8
8m¢uo
_ oa
E
U3cu>.mu .
.- .m¢>'inv8U.5¢ 68
a._ u-8G82wc
Q.N
znN.. we
§8
m'9-ooEvs
eIa89oz'5N
8 2u .z n om Eo :4 nuQm 5u8 .o> < -m 468l l 3m V. . m owas_ no
2 E E
mz>u .
'~-cl l
5 ,:=Eggo-¢ co588, z ,§$2828"488E<8at;SObamu
. c c . .5 5 °e a . "448< < u
0
82
as éeaea a
: E U no ,g 5 ulaws: g o8 2 u. |.
m¢>LLT .u
38uE
ll| -zw
zupE3o
U¢I a
3zw>wz2'| -o\ -
3..s cE t ! !g m !0 4 2 85 0 8a T ».125o E> t ' . ° 'u . u
§ §- o xi » ° ~&83u < yu Reu X Zo _= $ ~g o :< 8 8eau au: : . ._ > . $ °8451o<24
no
§o
§4885doe"
w.E u. m
89U2*»-
u34>.mu.
52mz§mma
av¢mo04 4Nzas3iv>L.Nu.UwN
coc. -9<
um3u. .9.
3zuE.u2Iv
m2 t o
8 8ea .3 a t 'fu u> 'go
u . . . u; Q :o. . . _9 gs.l U :
* ' m2 Etg . P u
04 5 ¢
m
ggD4,--gaS_
o o E ' °w E U8834Q mso 8 ' § » 8u _ u .
E32
us o no- ¢ ~ m vso as o -1 N M4 N N N NV m 0 l~4 4 F(fnF
o -m - 4 - 1 5an .o8 zI
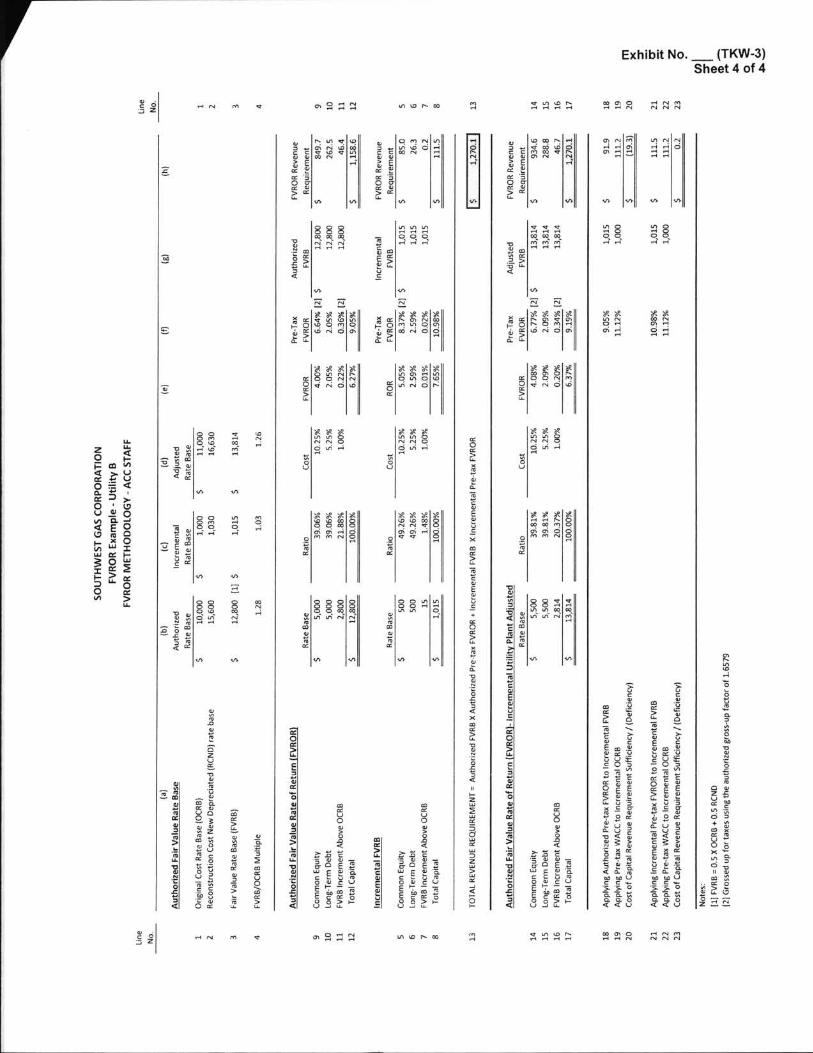
Exhibit No. (TKW-3)Sheet 4 of 4
D o no1 n m v of m o N m-1 N N N Nv m LD |\4 r t
m-4
4e a 8 2
u .c on Z'
m ~ . ~ .4 s o
A°? ~. m.4 4 om H. , .
- |
ov~
~.F T. :
E>v11 :O oO
vs
U sq Q If 4: a v 8 \D oc c M 1 |\u u a N "E 40;
Z> ¢u. vs w V? vs ,V
u 999 v °"! " ! " !Ju¢NQ8 : . .v1oo-4¢;8\Pq :cw~o n N F w e> € > E" Ia ° vz . ¢ .1 : a c :Q c O uE u E ua X E K
vs m n
4
vs
4vi §Q .FT 4
_vo §Q .Fl -o
m h mn n 4Q Q Qrt F L F l
Q v QFL Fl qIo et Qm M MH 4 4883
m8 m3 m.5 >o u.4
m°§S u.:<
Eau 3§,>_ u.u
EV)VIV\
c.
so aho f Nm -1o -
1 ¢
8 Xm NQ Io.; .4
F
9 9_ -x ah bf§ ¢ h v m1- Q |\ m
é z c N o m. >4 u.lu
8x388888
la as m N o 8
F 3_ _ah 99 x atgo ¢ 3 n m in
»- O . Q m Qw z o N o 6»>4 4.
8
ah as 59 :Qm m q mq V ? q q
3 m N ono
_egg26466Il1§§§r8 . Q ~. ~.1 v N o \o>u.
eN
Q-Qn-z
o §
:Q at §m mN N .o n c-4
nou
x Ar §m mN NO M 1c
Vou
* x §m mN No m-
v~oU
o8o 8 -F 6v As
: 2o< 8:
vsm
nomFTQ .5
§
88.z.r
zog>u.xmru-Q.To..cuEv.uEx
of Arr FL ?Eof on mm m o 8o m m N I
8N¢
x ah ahw o mN N Vas as Ho Q Q §
:mn:
x x ah8858.9 4pag
8.~.;3
8 :z
vs
N o
3I5 - 8
u.'a
im< ua: > `O z (4 "1 3 >o oU 2 9
a280U
IZ I
1 5>
o zSn >u.
m¢>u.3..cvE2uE
vs
78
co~.vs3
uIa: Q Q5 § § -4 0. of m38WW&6
8c an5 -" 8
u 88u 3 o mN u -._ - ma o_..: •uJ m< zQ Avsm
Ia m§ § " a2 4m2N¢
V S
aw@&&omu-Nx
Rhvsvs
IiC
0
Ozo¢>u.xfu¢0.4
:EDT,u
gG)»uE
4 -l l
e\
5eE
0Vn.auaea x
oz>u .
zom>4
3:o.cu:<xwa>u .
o4:NLo
. c..:<II7; 19- m
3x>
E:uvz
uo0su¢U3
m>
:.:
uUz*oea..4 9¢w3N>.
2n.L?
m¢>u.
>~=c u
.qu .
uC x xo nu _L ' :
cU
.eao.
s 8 Ia5 DupOUEP-
Es aE 'T
.zQcv'é u3no Q
c z Ec > |-
i n
Q4-
o
88a?ao:.5vnB53
o u3 sm nomed S* Vumz gUrox 24%Q uII xm V
852* u. O3:8
cum . _
g . £
Euca 5839: t; p a. n . . .: E rO f "z E E>&8=2°738.. " Ua u ,23c >o 3 0
8 2
he ucg*. s 3 °e a .
4 8< < u
Qzuov
3..'78 Eaa-
ggW e
: E -8 8&~:»~»sc ooQ B
a-zLUEwEDcIaKw:>zw>wz.1<>-o\-
5ga2 asa u
3.C
v :E t !a'°=888:
- _ V u
3 2 5m g885icy453. o z95°4 9 3u < os o
n838NM M U. c . c»5 5 °e a *o< < u
cuucNEw.u:
m
gw
3ZN E8 o ea -N8 ° 58 E -EP-E8 . u.
oq)n.
o. :u:<
52m
Q\mz>u.
QocuoU>
8BEE.504/3o9 EIa 2u
E U¢ r a
§?§Sv-U 34
4
54)mmv2m>.iv\L
3zuE.oU.-
x FU- 2
a2 5 8N oz 9 .3w3 §3
m y2 8m
u . " S
8 Ag. u: i v .g o2 ~o
3 l ° vG I< e x
E:o. :u:<
m so F ofH N m Q Q m \D r~v1 4 -4 1
of m o H N mc -4 N N N Nm\m 8 N.4
Ia¢ O
J Z ,
Related Documents