2020, Volume 1, Number 1 2020, Volume 1, Number 1 2021, Volume 4, Issue 2 165 Original Article: Soil weed seedbank response to tillage types and crop residue mulches in different cropping patterns Mobarak Hossain a, *, Mahfuza Begum b , Abul Hashem c , Moshiur Rahman b , Richard Bell d a Rice Breeding Platform, International Rice Research Institute, Manilla-1301, Philippines. b Department of Agronomy, Bangladesh Agricultural University, Mymensingh 2202, Bangladesh. c Department of Agriculture and Food, 75 York Road, Northam 6401, Australia. d Agricultural Sciences, Murdoch University, South St, WA 6150, Australia. Use yor device to scan and read the article online Citation Mobarak Hossaina, Mahfuza Begum, Abul Hashem, Moshiur Rahman, Richard Bell. 2021. Soil weed seedbank response to tillage types and crop residue mulches in different cropping patterns. Journal of Research in Weed Science, 4(2), 165-176. http://dx.doi.org/10.26655/JRWEEDSCI.2021.2.3 Article info Received: 18 December 2020 Accepted: 18 January 2021 Available Online: 20 January 2021 Checked for Plagiarism: Yes Peer reviewers approved by: Dr. Mohammad Mehdizadeh Editor who approved publication: Dr. Amin Baghizadeh *Corresponding Author: Mobarak Hossain ([email protected]) Keywords: Bed planting Conservation Agriculture, Crop mulches, Strip tillage, Weed seedbank. A B S T R A C T The composition of weed species and the distribution of weed seeds in the soil profile vary significantly and closely correlated to the previous cropping system. Information on the effect of tillage types, crop residue mulching and crop rotation on the soil weed seedbank is a useful tool for sustainable weed management in conservation agriculture (CA). With the view to studying the trend of weed seedbank in CA, a net-house experiment was conducted at the Department of Agronomy, Bangladesh Agricultural University during January - December, 2016. Soil samplings were done at 0 - 15 cm depth from four different sites after the end of CA trials at Mymensingh and Baliaknadi during 2012 - 2015 and Durgapur and Godagari in 2010-2015, in Bangladesh. At Mymensingh, conventional tillage (CT) and strip tillage (ST), while at Durgapur and Godagari, additional bed planting (BP) were practiced. On the other hand, at Baliakandi additional Zero tillage (ZT) was included. At all sites 20% and 40 - 50% of standing mulches of previous crops were applied. A total of 290 samples replicated four times were placed in individual trays following a completely randomized design. The year- round headcount of emerged weed revealed that the smallest size of weed seedbank in terms of weed species composition and weed density was found in ST followed by CT, BP, and ZT with 40 - 50% crop mulch than 20% mulch. The ST, BP, and ZT produced a higher number of perennials weeds than annual weeds, but opposite in CT. Based on the results, it could be concluded that the continuous practice of ST with 40 - 50% residue mulch declined the size of weed seedbank with the proliferation of perennial weeds. Weed seedbank size in ST is even smaller than BP and ZT. Introduction onservation agriculture (CA) is the practice of any tillage sequence that minimizes soil disturbances with at least 30% soil cover by crop residue mulches utilizing the intensive crop rotation involving at least three different crops as defined by the United Nations’ Food and Agriculture Organization (Kassam et al. 2019). CA is being promoted globally for improving soil health; sustainably increase the overall economic productivity of mechanized agriculture (Sanyal et al. 2008). In addition to agronomic benefits, CA also has a major influence on the relative abundance of weed species (Fonteyne et al. 2020), and weed control is perceived as one of the most challenging issues due to a reduction in tillage operations. The composition and dynamics of weeds in the soil weed seedbank under minimum tillage was found to be changed compared to conventional tillage (Pittelkow et al. 2015). Literatures reported that C

Welcome message from author
This document is posted to help you gain knowledge. Please leave a comment to let me know what you think about it! Share it to your friends and learn new things together.
Transcript

2020, Volume 1, Number 1 2020, Volume 1, Number 1 2021, Volume 4, Issue 2
165
Original Article: Soil weed seedbank response to tillage
types and crop residue mulches in different cropping
patterns
Mobarak Hossaina,
*, Mahfuza Begumb, Abul Hashem
c, Moshiur Rahman
b, Richard Bell
d
aRice Breeding Platform, International Rice Research Institute, Manilla-1301, Philippines.
bDepartment of Agronomy, Bangladesh Agricultural University, Mymensingh 2202, Bangladesh.
cDepartment of Agriculture and Food, 75 York Road, Northam 6401, Australia.
dAgricultural Sciences, Murdoch University, South St, WA 6150, Australia.
Use yor device to scan and read the article online
Citation Mobarak Hossaina, Mahfuza Begum, Abul Hashem, Moshiur Rahman, Richard Bell. 2021. Soil weed
seedbank response to tillage types and crop residue mulches in different cropping patterns. Journal of Research in
Weed Science, 4(2), 165-176.
http://dx.doi.org/10.26655/JRWEEDSCI.2021.2.3
Article info
Received: 18 December 2020 Accepted: 18 January 2021
Available Online: 20 January 2021
Checked for Plagiarism: Yes
Peer reviewers approved by:
Dr. Mohammad Mehdizadeh
Editor who approved publication:
Dr. Amin Baghizadeh
*Corresponding Author:
Mobarak Hossain ([email protected])
Keywords:
Bed planting Conservation Agriculture, Crop mulches, Strip
tillage, Weed seedbank.
A B S T R A C T The composition of weed species and the distribution of weed seeds in the soil profile
vary significantly and closely correlated to the previous cropping system. Information
on the effect of tillage types, crop residue mulching and crop rotation on the soil weed
seedbank is a useful tool for sustainable weed management in conservation agriculture
(CA). With the view to studying the trend of weed seedbank in CA, a net-house
experiment was conducted at the Department of Agronomy, Bangladesh Agricultural
University during January - December, 2016. Soil samplings were done at 0 - 15 cm
depth from four different sites after the end of CA trials at Mymensingh and Baliaknadi
during 2012 - 2015 and Durgapur and Godagari in 2010-2015, in Bangladesh. At
Mymensingh, conventional tillage (CT) and strip tillage (ST), while at Durgapur and
Godagari, additional bed planting (BP) were practiced. On the other hand, at Baliakandi
additional Zero tillage (ZT) was included. At all sites 20% and 40 - 50% of standing
mulches of previous crops were applied. A total of 290 samples replicated four times
were placed in individual trays following a completely randomized design. The year-
round headcount of emerged weed revealed that the smallest size of weed seedbank in
terms of weed species composition and weed density was found in ST followed by CT,
BP, and ZT with 40 - 50% crop mulch than 20% mulch. The ST, BP, and ZT produced a
higher number of perennials weeds than annual weeds, but opposite in CT. Based on the
results, it could be concluded that the continuous practice of ST with 40 - 50% residue
mulch declined the size of weed seedbank with the proliferation of perennial weeds.
Weed seedbank size in ST is even smaller than BP and ZT.
Introduction
onservation agriculture (CA) is the practice
of any tillage sequence that minimizes soil
disturbances with at least 30% soil cover
by crop residue mulches utilizing the
intensive crop rotation involving at least three
different crops as defined by the United Nations’
Food and Agriculture Organization (Kassam et al.
2019). CA is being promoted globally for
improving soil health; sustainably increase the
overall economic productivity of mechanized
agriculture (Sanyal et al. 2008). In addition to
agronomic benefits, CA also has a major influence
on the relative abundance of weed species
(Fonteyne et al. 2020), and weed control is
perceived as one of the most challenging issues
due to a reduction in tillage operations. The
composition and dynamics of weeds in the soil
weed seedbank under minimum tillage was found
to be changed compared to conventional tillage
(Pittelkow et al. 2015). Literatures reported that
C
2021, Volume 4, Issue 2
166 Mobarak Hossaina et al. J Res Weed Sci. 2021; 4(2): 165-176
minimum tillage favors the infestation of
perennial weeds like Cyperus rotundus L.,
Saccharum spontaneum L., Sorghum halepense L.
than annual weeds, which are generally
reproduced from tubers and rhizomes and have
not buried them or by failed to uproot and killed
them as by conventional tillage. According to
Woźniak (2018), populations of annual grass
increase in no-tillage systems concurrent with a
decrease in populations of dicotyledonous weeds.
Again, Fonteyne et al. (2020) observed annual and
perennial grasses, and perennial dicot species
would increase, and annual dicot species would
decrease in reduced tillage. Moreover, Moonen
and Barberi (2004) recorded fivefold higher
seedbank density in reduced tillage systems
compared to full tillage systems. Barberi and Lo
Cascio (2001) discovered Amaranthus spp.
seedling density was much higher in no-till
environments than tilled environments.
Despite the widespread promotion, in Bangladesh
the practice of CA began in 2005 (Hossain et al.
2015) to validate its’ principles for small farm
hold. But adequate information on weed species
composition in the soil seedbank under CA is not
available which is expected to be a problem after
several years. Reduced tillage practice with the
residue mulching of previous crops in different
cropping patterns changes weed seed density in
the soil by affecting the soil weed seedbank and
the efficacy of weed control practices. Such
knowledge on the soil weed seedbank might be a
useful tool for sustainable weed management in
CA. Hence, this study was undertaken to assess
the trend the soil weed seedbank in 3-5 years long
trials of CA in Bangladesh context. By necessity,
it was hoped that understanding gained about
weed seedbanks could be used to fill the gaps in
weed seedbank information and the best managing
of weeds to trigger the widespread adoption of
CA.
Materials and Methods
Experimental site
The net-house experiment was conducted at the
Department of Agronomy, Bangladesh
Agricultural University (BAU), located
geographically at 24.75° N and 90.50° E at an
average altitude of 18 m above the mean sea level.
Edaphic and climatic environments
The experiment field was located at a flood-free
medium-high land on the Old Brahmaputra
Floodplain of predominantly dark grey non-
calcareous alluvium soils under the Sonatala
series (Brammer, 1996). The pH of sandy clay
loam (50% sand, 23% silt, and 27% clay) soil was
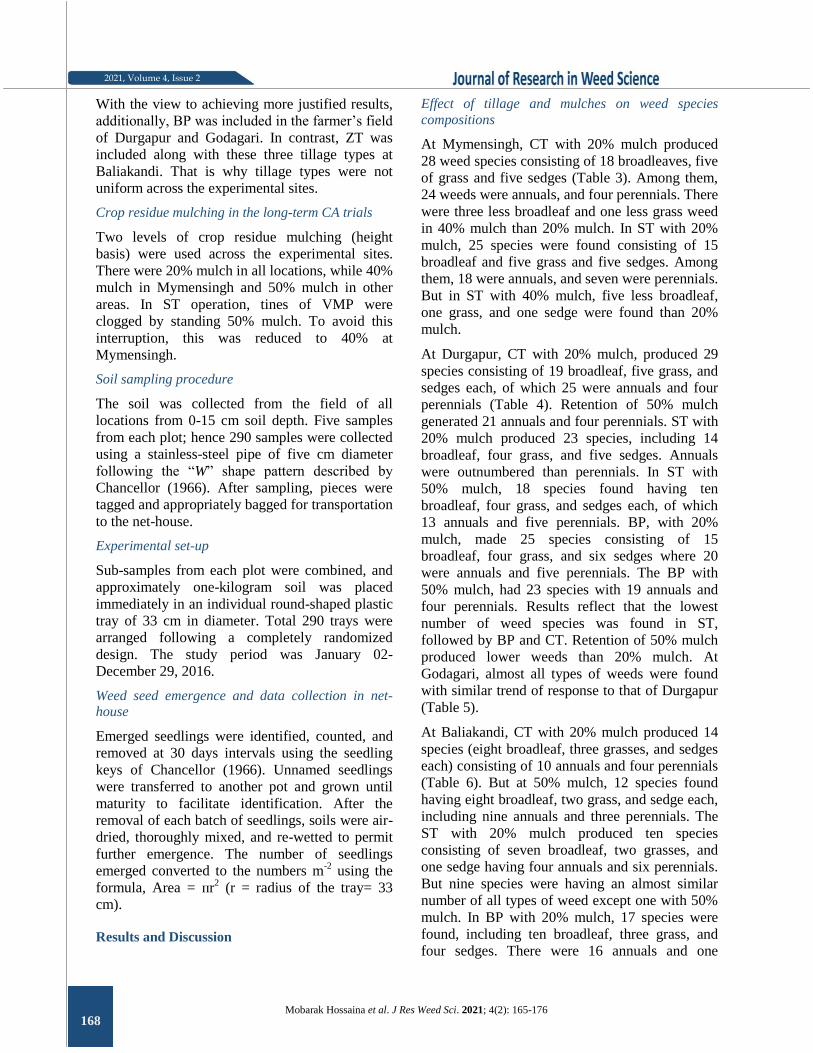
7.2. The research site was characterized by high
temperature, high humidity, and heavy monsoon
rainfall with occasional gusty wind during April-
September and low precipitation with moderately
low temperature during October - March (Figure
1). The maximum temperature varies from 32.3 -
33.5℃ during April - June while January was the
coldest month. About 95% rainfall and relative
humidity was received during April - September.
The rest of rainfall was very unevenly distributed
and mostly uncertain. Sunshine hours differed
much in during the months of rainfall due the
cloudy weather.
Figure 1. Monthly temperature and rainfall distribution pattern in 2016.

167
2021, Volume 4, Issue 2
Mobarak Hossaina et al. J Res Weed Sci. 2021; 4(2): 165-176
Sites of long-term CA trials
CA trials were conducted at four locations. At
Mymensingh, trials were conducted at the Soil
Science Field Laboratory of the BAU campus at
Sadar sub-district of Mymensingh district. In this
site, six experiments on CA trials under T. aman
rice-wheat-mungbean cropping pattern was
studied during 2012 - 2015. Durgapur and
Godagari sub-districts situated under the Rajshahi
district, geographically at 24°22′ N and 88°36′ E
in 2010 - 2015. There were, 12 trials following T.
aman rice-mustard-Boro rice, T. aman rice-
mungbean-lentil, and lentil-jute-T. aman rice
patterns at Durgapur while T. aman rice-wheat-
mungbean, T. aman rice-wheat-jute, and T. aman
rice-chickpea-jute cropping patterns. Baliakandi
(at 23°39'45" N and 89°29'39" E) sub-district was
located at the Rajbari district where, CA trials
conducted during 2012 - 2015. At this site, six
trials were performed under T. aman rice-wheat-
jute system. The treatments imposed in these four
locations have been presented in Table 1.
Table 1. Treatments details at four locations of long-term CA trial.
Locations Treatments No. of
replication Tillage types Residue mulching (%)
Mymensingh i. Conventional tillage (CT) i. 20
3 ii. Strip tillage (ST) ii. 40
Durgapur and
Godagari
i. CT i. 20
4 ii. ST ii. 50
iii. Bed planting (BP)
Baliakandi
i. CT i. 20
4 ii. ST ii. 50
iii. BP
iv. Zero tillage (ZT)
Weed control strategies of long-term CA trials
In CT, weeds were controlled by hand weeding in
all crops. In ST, BP, and ZT weeds were
controlled using different herbicides for different
crops, as stated in Table 2. Similar herbicides
were used at all locations.
Table 2. Weeding regimes of long-term CA trials at four locations.
Tillage types Weeding regimes in different crops*
CT
Three hand weeding (HW) at 25, 45 and 65 DAT/S in rice and wheat.
Two HW at 25 and 45 DAS in mustard, jute, mungbean, lentil, chickpea.
ST
BP
ZT
Glyphosate @ 3.7 L at 3 DBT for all crops.
Pendimethalin at @ 2.7 L 3 DAT/S in rice and wheat while at IAS in mustard, jute, lentil,
mungbean, and chickpea.
Isoproturon @ 2.5 L at 15 DAS in mustard.
Ethoxysulfuron-ethyl @ 100 g at 25 DAT in rice.
Carfentrazon-ethyl + isoproturon @ 1.25 kg at 25 DAS in wheat.
Fenoxaprop-p-ethyl @ 650 ml at 25 DAS in jute, mungbean, lentil, chickpea.
CT= Conventional tillage, ST= Strip tillage, BP= Bed planting, ZT= Zero tillage, DAT= Days after transplanting, DAS= Days after sowing, @= at the rate of, DBT= Days before tillage, IAS= Immediately after sowing, *Dose of product ha-1.
Tillage practices followed in long-term CA trials
The CT was done by a two-wheel tractor (2WT)
by four plowings and cross plowing followed by
sun-drying for two days (in non-rice crops),
finally by inundation and laddering (in rice). The
ST was done by a versatile multi-crop planter
(VMP) in a single pass operation. Strips were
prepared for four rows, each of six cm wide and
five cm deep made at a time. In BP, raised beds
(15 cm high and 90 cm wide with 60 cm tops and
30 cm furrows) were made with a bed planting
machine. In ZT, the land remained untilled.
Initially, at Mymensingh, the effect of ST was
tested at limited areas university field laboratory.
2021, Volume 4, Issue 2
168 Mobarak Hossaina et al. J Res Weed Sci. 2021; 4(2): 165-176
With the view to achieving more justified results,
additionally, BP was included in the farmer’s field
of Durgapur and Godagari. In contrast, ZT was
included along with these three tillage types at
Baliakandi. That is why tillage types were not
uniform across the experimental sites.
Crop residue mulching in the long-term CA trials
Two levels of crop residue mulching (height
basis) were used across the experimental sites.
There were 20% mulch in all locations, while 40%
mulch in Mymensingh and 50% mulch in other
areas. In ST operation, tines of VMP were
clogged by standing 50% mulch. To avoid this
interruption, this was reduced to 40% at
Mymensingh.
Soil sampling procedure
The soil was collected from the field of all
locations from 0-15 cm soil depth. Five samples
from each plot; hence 290 samples were collected
using a stainless-steel pipe of five cm diameter
following the “W” shape pattern described by
Chancellor (1966). After sampling, pieces were
tagged and appropriately bagged for transportation
to the net-house.
Experimental set-up
Sub-samples from each plot were combined, and
approximately one-kilogram soil was placed
immediately in an individual round-shaped plastic
tray of 33 cm in diameter. Total 290 trays were
arranged following a completely randomized
design. The study period was January 02-
December 29, 2016.
Weed seed emergence and data collection in net-house
Emerged seedlings were identified, counted, and
removed at 30 days intervals using the seedling
keys of Chancellor (1966). Unnamed seedlings
were transferred to another pot and grown until
maturity to facilitate identification. After the
removal of each batch of seedlings, soils were air-
dried, thoroughly mixed, and re-wetted to permit
further emergence. The number of seedlings
emerged converted to the numbers m-2
using the
formula, Area = ᴨr2 (r = radius of the tray= 33
cm).
Results and Discussion
Effect of tillage and mulches on weed species
compositions
At Mymensingh, CT with 20% mulch produced
28 weed species consisting of 18 broadleaves, five
of grass and five sedges (Table 3). Among them,
24 weeds were annuals, and four perennials. There
were three less broadleaf and one less grass weed
in 40% mulch than 20% mulch. In ST with 20%
mulch, 25 species were found consisting of 15
broadleaf and five grass and five sedges. Among
them, 18 were annuals, and seven were perennials.
But in ST with 40% mulch, five less broadleaf,
one grass, and one sedge were found than 20%
mulch.
At Durgapur, CT with 20% mulch, produced 29
species consisting of 19 broadleaf, five grass, and
sedges each, of which 25 were annuals and four
perennials (Table 4). Retention of 50% mulch
generated 21 annuals and four perennials. ST with
20% mulch produced 23 species, including 14
broadleaf, four grass, and five sedges. Annuals
were outnumbered than perennials. In ST with
50% mulch, 18 species found having ten
broadleaf, four grass, and sedges each, of which
13 annuals and five perennials. BP, with 20%
mulch, made 25 species consisting of 15
broadleaf, four grass, and six sedges where 20
were annuals and five perennials. The BP with
50% mulch, had 23 species with 19 annuals and
four perennials. Results reflect that the lowest
number of weed species was found in ST,
followed by BP and CT. Retention of 50% mulch
produced lower weeds than 20% mulch. At
Godagari, almost all types of weeds were found
with similar trend of response to that of Durgapur
(Table 5).
At Baliakandi, CT with 20% mulch produced 14
species (eight broadleaf, three grasses, and sedges
each) consisting of 10 annuals and four perennials
(Table 6). But at 50% mulch, 12 species found
having eight broadleaf, two grass, and sedge each,
including nine annuals and three perennials. The
ST with 20% mulch produced ten species
consisting of seven broadleaf, two grasses, and
one sedge having four annuals and six perennials.
But nine species were having an almost similar
number of all types of weed except one with 50%
mulch. In BP with 20% mulch, 17 species were
found, including ten broadleaf, three grass, and
four sedges. There were 16 annuals and one
2021, Volume 4, Issue 2
169
Mobarak Hossaina et al. J Res Weed Sci. 2021; 4(2): 165-176
perennial. In 50% mulch, 15 species were found
with a similar amount of grass and sedge and
fewer annual broadleaf. The ZT with 20% mulch
produced 19 weed species belonged to 11
broadleaf and four grass and four sedges, having
15 annuals and four perennials. But in ZT with
50% mulch, 16 species were found to have less
number broadleaf grass and sedges.
Table 3. Composition of weed species in different tillage types and residue mulches at Mymensingh.
Weed types and species
Conventional tillage Strip tillage
M20 M40 M20 M40
Broadleaf
Alternanthera sessilis L. Perennial P P P P
Amaranthus viridis L. Annual P P P P
A. spinosus L. Annual P P P P
Chenopodium album L. Annual P A P A
Commelina benghalensis L. Annual P P P A
Cyanotis axillaris Roem. Annual P P P P
Dentella repens L. Perennial P P P A
Eclipta alba L. Annual P P A P
Euphorbia parviflora L. Annual P P A P
E. hirta L. Annual P A P P
Hedyotis corymbosa Lamk. Annual P P P A
Jussia deccurence Walt. Perennial A A P P
Lindernia hyssopifolia L. Annual P P P A
L. antipoda Alston. Annual P P P A
Monochoria hastata L. Annual P P A A
Physalis minima L. Annual P P A A
Rotala ramosior (L.) Koehne. Annual P A P P
Solanum torvum Sw. Perennial A A P A
Sphenoclea zeylanica Gaertn. Annual P P P A
Spilanthes acmella Murr. Annual P P P P
Sub-total 18 15 15 10
Grass
Digitaria sanguinalis L. Annual P P P P
Echinochloa colonum L. Annual P P P P
E. crusgalli L. Annual P A P P
Eleusine indica L. Annual P P P P
Leersia hexandra L. Perennial P P P A
Sub-total 5 4 5 4
Sedges
Cyperus difformis L. Annual P P P A
C. iria L. Annual P P P A
C. rotundus L. Perennial A A P P
Eleocharisatro purpurea Retz. Annual P P P P
Fimbristylis miliacea L. Annual P P A P
Scripus supinus L. Perennial P P P P
Sub-total 5 5 5 4
Grand-Total 28 24 25 18
M20 = 20% mulch, M40 = 40% mulch, P = Present, A = Absent
Effect of tillage types and mulch levels on density
(plants m-2) of different weed types
Data presented in Table 7 reflect that at
Mymensingh, ST created 777 less number of
weeds than CT, and 40% mulch produced 288 less
number of weed m-2
than 20% mulch (Table 7).
Broadleaf weeds were most dominant over sedges
and grasses in CT but dominant over grasses and
sedges in ST. Annuals led over perennials in CT,
but perennials led over annuals in ST (Table 8).

2021, Volume 4, Issue 2
170 Mobarak Hossaina et al. J Res Weed Sci. 2021; 4(2): 165-176
Table 4. Composition of weed species in different tillage types and residue levels at Durgapur.
Weed types and species Lifecycle
Conventional
tillage Strip tillage Bed planting
M20 M50 M20 M50 M20 M50
Broad leaf
Alternanther asessilis L. Perennial P P P P P P
Amaranthus viridis L. Annual P P P P P P
A. spinosus L. Annual P P P P P P
Chenopodium album L. Annual P A P A P A
Commelina benghalensis L. Annual P P P A P A
Cyanotis axillaris Roem. Annual P P A P A P
Dentella repens L. Annual P P P A P P
Eclipta alba L. Annual P P A P A P
Euphorbia parviflora L. Annual P P A A A P
E. hirta L. Annual P A P P P P
Hedyotis corymbosa Lamk. Annual P P P A P P
Jussia deccurence Walt. Perennial P A P P P P
Lindernia hyssopifolia L. Annual P P P A P P
L. antipoda Alston. Annual P P P A P A
Monochoria hastata L. Annual A P P P P P
M. vaginalis Burm. Annual P P A A A P
Physalis minima L. Annual P P A A A A
Rotala ramosior (L.) Koehne. Annual P A P P P P
Solanum torvum Sw. Perennial A P P P A A
Sphenoclea zeylanica Gaertn. Annual P P A A P A
Spilanthes acmella Murr. Annual P P A A P P
Sub-Total 19 17 14 10 15 15
Grass
Digitaria sanguinalis L. Annual P P A P A P
Echinochloa colonum L. Annual P A P P P P
E. crusgalli L. Annual P A P P P P
Eleusine indica L. Annual P P P P P P
Leersia hexandra L. Perennial P P P A P A
Sub-Total 5 3 4 4 4 4
Sedges
Cyperus difformis L. Annual P P P A P A
C. iria L. Annual P P A A P A
C. rotundus L. Perennial A A P P P P
Eleocharisatro purpurea Re. Annual P P P P P P
Fimbristylis miliacea L. Annual P P P P P P
Scripus supinus L. Perennial P P P P P P
Sub-Total 5 5 5 4 6 4
Grand-Total 29 25 23 18 25 23
M20 = 20% mulch, M50 = 50% mulch, P = Present, A = Absent
At Durgapur and Godagari, BP generated the
highest weed density followed by CT and ST
(Table 7). Compared to CT (1738 at Durgapur and
2079 at Godagari), ST had 172 and 237 fewer
weeds, but BP had 717 and 776 more number of
weeds at two locations, respectively. Retention of
50% mulch produced 442 and 610 fewer numbers
of weeds than 20% mulch at two locations,
respectively. Broadleaf weeds were the most
dominant in all types of tillage at both locations,
while grasses dominated over sedges in ST at
Durgapur and BP at Godagari but opposite in BP
at Durgapur and ST at Godagari. Perennials led
over annuals both in ST and BP but reverse in CT
at both locations (Table 8).

171
Mobarak Hossaina et al. J Res Weed Sci. 2021; 4(2): 165-176
2021, Volume 4, Issue 2
Table 5. Composition of weed species in different tillage types and residue levels at Godagari.
Weed types and species Lifecycle Conventional tillage Strip tillage Bed planting
M20 M50 M20 M50 M20 M50
Broad leaf
Alternanther asessilis L. Perennial P P P P P A
Amaranthus viridis L. Annual P P P P P P
A. spinosus L. Annual P P P P P P
Chenopodium album L. Annual P A P A P A
Commelina benghalensis L. Annual P P A A P A
Cyanotis axillaris Roem. Annual P P A P A P
Dentella repens L. Annual P P A A P P
Eclipta alba L. Annual P P A P A P
Euphorbia parviflora L. Annual P P A P A P
E. hirta L. Annual P A P P P P
Hedyotis corymbosa Lamk. Annual P P A A P P
Jussia deccurence Walt. Perennial P P P P P P
Lindernia hyssopifolia L. Annual P P A A P P
L. antipoda Alston. Annual P P P A P A
Monochoria hastata L. Annual P P P A P P
M. vaginalis Burm. Annual P P A P A P
Physalis minima L. Annual P P A A A A
Rotala ramosior (L.) Koehne. Annual P P P P P P
Solanum torvum Sw. Perennial P P P A A A
Sphenoclea zeylanica Gaertn. Annual P P A A P A
Spilanthes acmella Murr. Annual P P A A P P
Sub-Total 21 19 10 10 15 14
Grass
Digitaria sanguinalis L. Annual P P A P A P
Echinochloa colonum L. Annual P A P P P P
E. crusgalli L. Annual P P P P P P
Eleusine indica L. Annual P P P P P P
Leersia hexandra L. Perennial P P P A P A
Sub-Total 5 4 4 4 4 4
Sedges
Cyperus difformis L. Annual P P P A P A
C. iria L. Annual P P P A P A
C. rotundus L. Perennial A A P P A P
Eleocharisatro purpurea Re. Annual P P P P P P
Fimbristylis miliacea L. Annual P P P P P P
Scripus supinus L. Perennial P P P A P P
Sub-Total 5 6 6 3 6 4
Grand-Total 31 29 20 17 25 22
M20 = 20% mulch, M50 = 50% mulch, P = Present, A = Absent
At Baliakandi, the trend of weed density m-2
was
ZT > BP > CT > ST. Compared to CT (1668), ST
has 560 fewer weeds, but 386 and 2639 more
weeds in BP and ZT, respectively. On the other
hand, 50% of mulch produced 608 fewer weeds
than 20% mulch (Table 7). In all types of tillage
and mulch levels, broadleaf led over sedges and
grasses. Annuals were dominant over perennials
in CT, but perennials led over annuals in ST, BP,
and ZT (Table 8).

2021, Volume 4, Issue 2
172 Mobarak Hossaina et al. J Res Weed Sci. 2021; 4(2): 165-176
In this study, the higher number of weeds
composting broadleaf, grass, and sedge types was
found in CT than ST. This phenomenon might be
attributed to the emergence of more weed species
in CT over ST. Mohler (2001) quoted dormant
seeds in CT become viable to germinate by
scarification, ambient CO2 concentrations, and
higher nitrate concentrations, which may lead to
producing higher weed emergence of new weed
species in CT.
Table 6. Composition of weed species in different tillage types and residue mulches at Baliakandi.
CT= Conventional tillage, ST= Strip tillage, BP= Bed planting, ZT= Zero tillage, M20 = 20% mulch, M50 =50% mulch, P= Present, A= Absent.
Table 7. Effect of tillage types and mulch levels on the density (plants m-2
) of different weed types at different
locations.
Locations Tillage
Mulch
Broadleaf Grass Sedges
M20 M40/50 X̄ M20 M40/50 X̄ M20 M40/50 X̄
Mymensingh
CT 2616 2402 2509 643 764 703 765 838 801
ST 2249 1775 2012 703 601 652 562 583 572
X̄ 2433 2089 - 673 682 - 663 710 -
Durgapur
CT 1900 1575 1738 760 630 695 506 422 464
ST 1805 1421 1613 779 456 617 528 459 493
BP 2243 2359 2301 615 426 520 760 823 791
X̄ 1983 1785 - 718 504 - 598 568 -
Godagari
CT 2261 1897 2079 895 542 718 613 556 584
ST 2067 1704 1885 617 561 589 943 398 670
BP 2635 2714 2674 897 864 880 672 535 603
X̄ 2321 2105 - 803 656 - 743 496 -
Baliakandi
CT 2019 1317 1668 650 497 573 446 671 558
ST 1405 1272 1339 619 417 518 468 298 383
BP 1989 1613 1801 768 720 744 733 547 640
ZT 2891 2854 2873 1908 1376 1642 983 866 924
X̄ 2076 1764 - 986 752 - 657 595 -
CT = Conventional tillage, ST = Strip tillage, BP = Bed planting, ZT = Zero tillage, M20 = 20% mulch, M40 = 40% mulch, M50 = 50% mulch, X̄ =
Mean.
Weed types and species Lifecycle CT ST BP ZT
M20 M50 M20 M50 M20 M50 M20 M50
Broad leaf
Alternanthera sessilis L. Perennial A A P P A A P P Amaranthus viridis L. Annual P P A A P A P A Commelina benghalensis L. Annual A P A A P P A A Cyanotis axillaris Roem. Annual A A A A P P P A Dentella repens L. Perennial P P P P A A P P Eclipta alba L. Annual P P A A P P P P Euphorbia parviflora L. Annual A A A A P P A P Hedyotis corymbosa (L.) Lamk. Annual A A P P P P P P Jussia deccurence Walt. Perennial P P P P A A P P Lindernia hyssopifolia L. Annual P P P P P P P P Lindenia antipoda Alston. Annual P P P P P P P P Monochoria hastata L. Annual P P A A P P A A Rotala ramosior (L.) Koehne. Annual A A A A A A P P Solanum torvum Sw. Perennial P A P P A A A A Spilanthes acmella Murr. Annual A A A A P A P A
Sub-total 8 8 7 7 10 8 11 9
Grass
Digitaria sanguinalis L. Annual P P A A P P P P Echinochloa colonum L. Annual P P P P P P P P Echinochloa crusgalli L. Annual A A A A A A P A Eleusine indica L. Annual A A A A P P P P Leersia hexandra L. Perennial P A P A A A A A
Sub-total 3 2 2 1 3 3 4 3
Sedges
Cyperus difformis L. Annual P A A A P P P P C. iria L. Annual P A A A P P P P C. rotundus L. Perennial A A P P P P P P Fimbristylis miliacea L. Annual P P A A P P P P
Sub-total 3 1 1 1 4 4 4 4 Grand-total 14 11 10 9 17 15 19 16

173
Mobarak Hossaina et al. J Res Weed Sci. 2021; 4(2): 165-176
2021, Volume 4, Issue 2
Table 8. Effect of tillage types and mulch levels on the density (plants m-2
) of annual and perennial weeds at
different locations.
Locations Tillage
Mulch
Annual weeds Perennial weeds
M20 M40/50 X̄ M20 M40/50 X̄
Mymensingh
CT 2683 2397 2540 1341 1607 1474
ST 1663 1281 1472 1851 1678 1765
X̄ 2173 1839 - 1596 1643 -
Durgapur
CT 1631 1429 1530 1535 1198 1366
ST 1462 864 1163 1650 1472 1561
BP 1681 1739 1710 1937 1869 1903
X̄ 1592 1344 - 1707 1513 -
Godagari
CT 1926 1689 1807 1843 1306 1575
ST 1674 1077 1375 1953 1586 1770
BP 1811 1954 1882 2393 2159 2276
X̄ 1803 1573 - 2063 1683 -
Baliakandi
CT 2407 1863 2135 708 621 664
ST 1112 833 972 1380 1154 1267
BP 1651 1307 1479 1839 1573 1706
ZT 2378 1889 2134 3403 3207 3305
X̄ 1887 1473 - 1832 1638 -
CT = Conventional tillage, ST = Strip tillage, BP = Bed planting, ZT = Zero tillage, M20 = 20% mulch, M40 = 40% mulch, M50 =
50% mulch, X̄ = Mean.
The research finding of Cardina et al. (2002)
also revealed the increase of weed species
composition in CT offered from the higher rate
of seed viability occurred from weed seed burial
in the soil profile. Such a higher rate of weed
seed survivability might lead to an increase in
weed composition in CT. Gallandt et al. (2004)
found germination stimulus is generally higher
near the soil surface and decreases with depth. In
the reduced tillage system of ST, seedbanks are
concentrated in the top layer of the soil; thus, a
higher proportion of reduced tilled seedbanks
will germinate compared with CT, which led to
reduce seedbank size in ST than CT. The
reduction of weed species in ST might also be
due to minimizing the weed seedbank status in
the soil by increasing non-viable or dormant
weed seeds in the seedbank. Due to minimal soil
disturbance (only 20%) at the upper soil layer in
ST, most of the weed seeds remain on the soil
surface. They can lose viability due to
desiccation and adverse climate, as reported by
Nichols et al. (2015). Losing of seed viability in
ST may also be attributed to increased seed
dormancy at an undisturbed deeper soil layer.
Seeds remain dormant at a deeper layer suffer
from suffocation for less oxygen pressure and
darkness for feeble light, as weed seeds required
oxygen and light for maximum germination
(Oziegbe et al. 2010).
Surface accumulation of weed seeds in ST
would increase predator like ants, insects,
rodents, and birds (Blubaugh and Kaplan, 2015)
access to weed seeds and could increase their
removal rates. For example, common ground
beetles or crickets can reduce weed seed
emergence by 5 to 15% (White et al. 2007).
Overall, the adoption of ST may encourage seed
losses via predation by increasing the
availability of seeds to predators, and by
minimizing mortality and forced relocation of
predators, therefore, represent a potentially
valuable tool for reducing weed seedbank size in
ST. Higher dispersal of weed seeds may also
lead to an increase in the seedbank in CT over
ST. Barroso et al. (2006) found the weed seeds
traveled 2–3 m in the direction of full tillage,
while in reduced tillage soils, the distance is
negligible. Reducing tillage in ST, therefore,
reduced the spread of weed seed both within and
across fields and reduced seedbank size in this
study. The reduced weed seedbank in ST may
also have occurred from more lavish weed seed
burial as strips were made in the same location
over the years because the field layout and all
the treatments were the same in the field study.

2021, Volume 4, Issue 2
176 Mobarak Hossaina et al. J Res Weed Sci. 2021; 4(2): 165-176
Furthermore, the application of different
herbicides might lead to having less amount of
weed in ST, BP, and ZT. We used glyphosate
and pendimethalin herbicide in all crops.
Besides, we used ethoxysulfuron-ethyl in rice;
oxadiazon in mustard; Carfentrazon-ethyl +
isoproturon in wheat while fenoxaprop-p-ethyl
in jute, lentil, mungbean, and chickpea. These
herbicides are previously reported to reduce seed
viability or induced seed dormancy in weed,
which might have led to reducing weed pressure
in ST than CT. It was reported that a range of
herbicides could reduce seed production and
germination by several folds depending on the
biotypes. Glyphosate is registered to affected
pollen and seed production almost 100% in
Ambrosia artemisiifolia L. (Gauvrit and
Chauvel, 2010) and Bromus japonicus Thunb.
(Rinella et al., 2010) while and 69.8% in Conyza
bonariensis L. (Wu et al. 2007). Findings of
previous studies reported that herbicides could
reduce the germination of weeds seeds. Tanveer
et al. (2009) found pendimethalin herbicide
exerted only 30.57% seed germination of
Chenopodium album L., while ethoxysulfuron-
ethyl killed 98-100% seeds of Echinochloa
glabrescens L. (Opeña et al. 2014). Moreover,
oxadiazon waived 85.81% seeds of Fimbristylis
cymosa R.Br. Furthermore, carfentrazon-ethyl +
isoproturon damaged 100% seeds of Emex
spinosa L. (Javaid et al. 2012) and fenoxaprop-
p-ethyl wrecked 96.78% seeds of Phalaris minor
L. (Singh et al. 2017).
The results of these studies agree the findings of
the present study demonstrated that herbicides
could potentially reduce seed production and
viability of weeds, thereby reducing seedbank
size in ST than CT, followed by BP and ZT. On
the other hand, herbicide induced seed dormancy
could contribute to the altered seed dormancy
found in Hordeum murinum L., Bromus
diandrus Roth., and Lolium rigidum Gaud., in
intensive cropping systems that relied heavily on
herbicidal weed control reported by Kleemann
and Gurjeet (2013) and Owen et al. (2015). The
above-discussed reasons might lead to a decline
in the size of the weed seedbank in ST in a trend
of weed species composition following ST < CT
at Mymensingh, ST < CT < BP at Durgapur and
Godagari, and ST < CT < BP < ZT at
Baliakandi. Bàrberi and Cascio (2001) agree
with the findings of the present study as stated
the higher weed density at ZT, followed by
reduced tillage because of taller weeds seedlings
recruitment from the topsoil in ZT. In the
present study, annual weeds led over perennials
in CT, but perennial weeds led over annuals in
ST, BP, and ZT. Boscutti et al. (2015) agree this
finding in support with Erenstein and Laxmi
(2008) concluded that altering the tillage
regimes changes the disturbance frequency of
the field, which results in shifts in weed
vegetation of that field. Many studies support
our survey with the reports; CT systems favor
annuals, while reduced tillage systems favor
perennial weeds (Tuesca et al. 2001). Ecological
succession theory (Aweto, 2013) also agrees
with our research finding suggesting the
dominancy of perennials weeds in less disturbed
systems. Because CT kills most of the
underground vegetative reproduction structures
(rhizomes, tubers, bulbs, runner, and stolons) of
perennials weeds, hence, reserves only annuals
weeds which reproduce mostly by seeds
(matured ovules). On the other hand, the vice-
versa phenomenon generally occurs in tillage
was minimized in ST and BP while absent in
ZT, which favored perennial weeds here in the
soil weed seedbank. In this study, retention of 40
or 50% crop mulch had fewer above ground
weed taxa than 20% mulch. This phenomenon
might be due to the drastic effect of suppressing
weed seed germination caused by a physical
barrier, lowering soil temperatures and
allelochemicals released from decaying plant
tissues, as suggested by Curran (2016).
Moreover, reduced light penetration stating
cooler average soil temperatures could reduce
weed seed germination or causing delay
germination, damage of weed seeds upon
predation and decomposition by macro and
microbial populations (Conklin et al., 2002) and
massive moisture conservation (Manici et al.
2004); delay the emergence of etiolated plants
producing lower seeds as stated earlier (Begum
et al. 2006) might have reduced weed seedbank
size in 40/50% mulch over 20% mulch.
Conclusion
Based on the study, it might be concluded that
long-term strip tillage of 3-5 years with 40-50%
crop mulch under conservation agriculture
practice reduced weed seedbanks in terms of

175
Mobarak Hossaina et al. J Res Weed Sci. 2021; 4(2): 165-176
2021, Volume 4, Issue 2
weed species composition and density, and this
reduction is much higher than bed planting and
zero tillage. Strip tillage, bed planting and zero
tillage also increased perennial weeds in the
weed seedbank while conventional tillage
increased annual weeds.
Acknowledgements
This study was a part of Ph.D. research, which
was funded by the Australian Centre for
International Agricultural Research (ACIAR)
and of Murdoch University, Australia.
Conflicts of Interest
The authors have declared no conflicts of
interest.
References
Aweto A.O. 2013. Ecological succession theory
and models. in: Aweto A.O. (Ed), Shifting
Cultivation and Secondary Succession in the
Tropics. CABI Publications, Oxfordshire, UK.
pp. 116-130. [Crossref], [Google scholar],
[Publisher] Barberi P, Lo Cascio B. 2001. Long-term tillage
and crop rotation effects on weed seedbank size
and composition. Weed Res. 41: 325–340. [Crossref], [Google scholar], [Publisher]
Barroso J, Navarrete L, Sánchez del Arco M,
Fernandez-Qunitanilla C, Lutman P, Perry N,
Hull R. 2006. Dispersal of Avena fatua and A.
sterilis patches by natural dissemination, soil
tillage and combine harvesters. Weed Res. 46:
118-128. [Crossref], [Google scholar],
[Publisher] Begum M, Juraimi A.S, Rastan S.O.B.S, Rajan A,
Man A.B. 2006. Seedbank and seedling
emergence characteristics of weeds in rice field
soils of the muda granary area in north-west
peninsular Malaysia. Biotrop. 13(1): 11-21. [Google scholar], [Publisher]
Bell R, Haque M, Jahiruddin M, Rahman M,
Begum M, Miah M, Islam M, Hossen M,
Salahin N, Zahan T, Hossain M, Alam M,
Mahmud M. 2018. Conservation agriculture for
rice-based intensive cropping by smallholders in
the Eastern Gangetic Plain. Agric. 9(1): 5-22. [Crossref], [Google scholar], [Publisher]
Blubaugh C.K, Kaplan I. 2015. Tillage
compromises weed seed predator activity across
developmental stages. Biol Control. 81: 76-82. [Crossref], [Google scholar], [Publisher]
Boscutti F, Sigura M, Gambon N, Lagazio C,
Krüsi B.O, Bonfanti P. 2015. Conservation
tillage affects species composition but not
species diversity. J Environ Manage. 55: 443-
452. [Crossref], [Google scholar], [Publisher]
Brammer H. 1996. The Geography of the Soils of
Bangladesh, First ed. Dhaka, Bangladesh. [Publisher]
Cardina J, Herms C.P, Doohan D.J. 2002. Crop
rotation and tillage systems effects on weed
seedbank. Weed Sci. 50: 448-460. [Crossref],
[Google scholar], [Publisher]
Chancellor R.J. 1966. The Identification of weed
seedlings of farm and garden, first ed. Oxford,
England. [Crossref], [Google scholar],
[Publisher] Conklin A.E, Erich M.S, Liebman M, Lambert D,
Gallandt E.R, Halteman W.A. 2002. Effects of
red clover green manure and compost soil
amendments on wild mustard growth and
incidence of disease. Plant Soil. 238: 245-256. [Crossref], [Google scholar], [Publisher]
Curran W.S. 2016. Persistence of herbicides in
soil. Crops Soils. 49(5): 16–21. [Crossref],
[Google scholar], [Publisher]
Erenstein O, Laxmi V. 2008. Zero tillage impacts
in India’s rice-wheat systems: a review. Soil
Tillage Res. 100: 1-14. [Crossref], [Google
scholar], [Publisher]
Fonteyne S, Singh R.G, Govaerts B, Verhulst N.
2020. Rotation, mulch and zero tillage reduce
weeds in a long-term conservation agriculture
trial. Agron. 10(7): 962-978. [Crossref], [Google
scholar], [Publisher] Gallandt E.R, Fuerst E.P, Kennedy A.C. 2004.
Effect of tillage, fungicide seed treatment and
soil fumigation on seedbank dynamics of wild
oat (Avena fatua). Weed Sci. 52: 597-604. [Crossref], [Google scholar], [Publisher]
Gauvrit C, Chauvel B. 2010. Sensitivity of
Ambrosia artemisiifolia to glufosinate and
glyphosate at various development stages. Weed
Res. 50: 503-510. [Crossref], [Google scholar],
[Publisher] Hossain M.I, Sarker M.J.U, Haque M.A. 2015.
Status of conservation agriculture-based tillage
technology for crop production in Bangladesh.
Bangladesh J Agric Res. 40(2): 235-248. [Crossref], [Google scholar], [Publisher]
Javaid M.M, Tanveer A, Ahmad R, Yaseen M,
Khaliq A. 2012. Optimizing activity of
herbicides at reduced rate on Emex spinosa with adjuvants. Planta Daninha. 30(2): 425-435. [Crossref], [Google scholar], [Publisher]

2021, Volume 4, Issue 2
176 Mobarak Hossaina et al. J Res Weed Sci. 2021; 4(2): 165-176
Kassam A, Friedrich T, Derpsch R. 2019. Global
spread of conservation agriculture. Int J Environ Stud. 76(1): 29–51. [Crossref], [Google scholar],
[Publisher] Kleemann S.G, Gurjeet G. 2013. Seed dormancy
and seedling emergence in ripgut brome
(Bromus diandrus) populations in Southern
Australia. Weed Sci. 61: 22-29. [Crossref],
[Google scholar], [Publisher]
Manici L.M, Caputo F, Babini V. 2004. Effect of
green manure on Pythium spp. population and
microbial communities in intensive cropping
systems. Plant Soil. 263: 133-142. [Crossref],
[Google scholar], [Publisher]
Mohler C.L. 2001. Ecological Management of
Agricultural Weeds. Cambridge, UK. [Google
scholar], [Publisher]
Moonen A.C, Barberi P. 2004. Size and
composition of the weed seedbank after 7 years
of different cover crops-maize management
systems. Weed Res. 44: 163–177. [Crossref],
[Google scholar], [Publisher]
Nichols V, Verhulst N, Cox R, Govaerts B. 2015.
Weed dynamics and conservation agriculture
principles: A review. Field Crops Res. 183: 56-
68. [Crossref], [Google scholar], [Publisher]
Opeña J.L, Chauhan B.S, Baltazar A.M. 2014.
Seed germination ecology of Echinochloa glabrescens and its implication for management
in rice (Oryza sativa L.). PLoS One. 9(3): 1-13. [Crossref], [Google scholar], [Publisher]
Owen M.J, Goggin D.E, Powles S.B. 2015.
Intensive cropping systems select for greater
seed dormancy and increased herbicide
resistance levels in Lolium rigidum. Pest Manag
Sci. 71: 966-971. [Crossref], [Google scholar],
[Publisher] Oziegbe M, Faluyi J.O, Oluwaranti A. 2010. Effect
of seed age and soil texture on the germination
of some Ludwigia species (Onagraceae) in
Nigeria. J Univ Zagreb. 69(2): 249-257. [Google
scholar], [Publisher]
Pittelkow C.M, Liang X, Linquist B.A, Van
Groenigen K.J, Lee J, Lundy M.E, van Gestel
N, Six J, Venterea R.T, van Kessel C. 2015.
Productivity limits and potentials of the
principles of conservation agriculture. Nature.
517: 365-368. [Crossref], [Google scholar],
[Publisher]
Rinella M.J, Hagerkamp M.R, Masters R.A,
Muscha J.M, Bellows S.E, Vermeire L.T. 2010.
Growth regulator herbicides prevent invasive
annual grass seed production. Invasive Plant Sci Manag. 3: 12-16. [Crossref], [Google scholar],
[Publisher] Sanyal D, Bhowmik P.C, Anderson R.L, Shrestha
A. 2008. Revisiting the perspective and progress
of integrated weed management. Weed Sci. 56:
161-167. [Crossref], [Google scholar],
[Publisher] Singh R, Pramanick B, Singh A.P, Neelam, Kumar
S, Kumar A, Singh G. 2017. Bio-efficacy of
fenoxaprop-p-ethyl for grassy weed control in
onion and its residual effect on succeeding
maize crop. India J Weed Sci. 49(1): 63-66. [Crossref], [Google scholar], [Publisher]
Taa A, Tanner D, Bennie A.T. 2004. Effects of
stubble management, tillage and cropping
sequence on wheat production in the south-
eastern highlands of Ethiopia. Soil Tillage Res.
76: 69-82. [Crossref], [Google scholar],
[Publisher] Tanveer A, Nadeem M.A, Ali A, Tahir M, Zamir
M.S.I. 2009. Germination behavior of seeds
from herbicide treated plants of Chenopodium
album L. Ann Brazilian Aca Sci. 81(4): 873-879. [Crossref], [Google scholar], [Publisher]
Tuesca D, Puricelli E, Papa J. 2001. A long-term
study of weed flora shifts in different tillage
systems. Weed Res. 41: 369-382. [Crossref],
[Google scholar], [Publisher]
White S.S, Renner K.A, Menalled F.D, Landis
D.A. 2007. Feeding preferences of weed seed
predators and effect on weed emergence. Weed
Sci. 55: 606-612. [Crossref], [Google scholar],
[Publisher] Woźniak A. 2018. Effect of tillage system on the
structure of weed infestation of winter wheat.
Span J Agric Res. 16(4): 1-7. [Crossref],
[Google scholar], [Publisher]
Wu H, Walker S, Rollin M.J, Tan D.K.Y,
Robinson G, Werth J. 2007. Germination,
persistence, and emergence of flaxleaf fleabane
(Conyza bonariensis (L.) Cronquist). Weed Biol
Manag. 7: 192-199. [Crossref], [Google
scholar], [Publisher]
Copyright © 2021 by SPC (Sami Publishing Company) + is an open access article distributed under the
Creative Commons Attribution License(CC BY) license (https://creativecommons.org/licenses/by/4.0/),
which permits unrestricted use, distribution, and reproduction in any medium, provided the original work
is properly cited.
Related Documents