disease involves many factors, including risk factors, symp- toms, and examinations. e inspections carried out result in many clinical data attributes. To translate attribute clinical data into information, it is necessary to interpret the clinical data. Interpretation systems for the diagnosis of coronary heart disease are being developed. e development of infor- mation technology has moved the interpretation of clinical data to computer-based systems. An interpretation system of clinical data can serveas a decision support for clinicians in making diagnoses. e use of decision support systems has been shown to improve physician services, from both the doctor and patient perspectives [1]. Systems for the interpretation of clinical data for the diag- nosis of coronary heart disease have been developed by uti- lizing data mining algorithms. e use of data mining algo- Interpretation of Clinical Data Based on C4.5 Algorithm for the Diagnosis of Coronary Heart Disease Wiharto Wiharto, MCom 1,2 , Hari Kusnanto, DrPH 2,3 , Herianto Herianto, DrEng 2,4 1 Department of Informatic, Sebelas Maret University, Surakarta, Indonesia; Departments of 2 Biomedical Engineering, 3 Medicine, and 4 Mechanical & Industrial Engineering, Gadjah Mada University, Yogyakarta, Indonesia Objectives: e interpretation of clinical data for the diagnosis of coronary heart disease can be done using algorithms in data mining. Most clinical data interpretation systems for diagnosis developed using data mining algorithms with a black- box approach cannot recognize examination attribute relationships with the incidence of coronary heart disease. Methods: is study proposes a system to interpretation clinical examination results for the diagnosis of coronary heart disease based the decision tree algorithm. is system comprises several stages. First, oversampling is carried out by a combination of the synthetic minority oversampling technique (SMOTE), feature selection, and the C4.5 classification algorithm. System testing is done using k-fold cross-validation. e performance parameters are sensitivity, specificity, positive prediction value (PPV), negative prediction value (NPV) and the area under the curve (AUC). Results: e results showed that the performance of the system has a sensitivity of 74.7%, a specificity of 93.7%, a PPV of 74.2%, an NPV of 93.7%, and an AUC of 84.2%. Conclusions: is study demonstrated that, by using C4.5 algorithms, data can be interpreted in the form of a decision tree, to aid the un- derstanding of the clinician. In addition, the proposed system can provide better performance by category. Keywords: Heart Diseases, Algorithms, Diagnosis, Data Mining, Decision Tree Healthc Inform Res. 2016 July;22(3):186-195. http://dx.doi.org/10.4258/hir.2016.22.3.186 pISSN 2093-3681 • eISSN 2093-369X Original Article Submitted: March 24, 2016 Revised: June 20, 2016 Accepted: July 13, 2016 Corresponding Author Wiharto Wiharto, MCom Jl. Ir. Sutami No. 36A, Kentingan, Surakarta, Central of Java 57126, Indonesia. Tel: +628121520050, E-mail: [email protected] This is an Open Access article distributed under the terms of the Creative Com- mons Attribution Non-Commercial License (http://creativecommons.org/licenses/by- nc/4.0/) which permits unrestricted non-commercial use, distribution, and reproduc- tion in any medium, provided the original work is properly cited. ⓒ 2016 The Korean Society of Medical Informatics I. Introduction Medical examinations for the diagnosis of coronary heart

Welcome message from author
This document is posted to help you gain knowledge. Please leave a comment to let me know what you think about it! Share it to your friends and learn new things together.
Transcript

disease involves many factors, including risk factors, symp-toms, and examinations. The inspections carried out result in many clinical data attributes. To translate attribute clinical data into information, it is necessary to interpret the clinical data. Interpretation systems for the diagnosis of coronary heart disease are being developed. The development of infor-mation technology has moved the interpretation of clinical data to computer-based systems. An interpretation system of clinical data can serveas a decision support for clinicians in making diagnoses. The use of decision support systems has been shown to improve physician services, from both the doctor and patient perspectives [1]. Systems for the interpretation of clinical data for the diag-nosis of coronary heart disease have been developed by uti-lizing data mining algorithms. The use of data mining algo-
Interpretation of Clinical Data Based on C4.5 Algorithm for the Diagnosis of Coronary Heart DiseaseWiharto Wiharto, MCom1,2, Hari Kusnanto, DrPH2,3, Herianto Herianto, DrEng2,4
1Department of Informatic, Sebelas Maret University, Surakarta, Indonesia; Departments of 2Biomedical Engineering, 3Medicine, and 4Mechanical & Industrial Engineering, Gadjah Mada University, Yogyakarta, Indonesia
Objectives: The interpretation of clinical data for the diagnosis of coronary heart disease can be done using algorithms in data mining. Most clinical data interpretation systems for diagnosis developed using data mining algorithms with a black-box approach cannot recognize examination attribute relationships with the incidence of coronary heart disease. Methods: This study proposes a system to interpretation clinical examination results for the diagnosis of coronary heart disease based the decision tree algorithm. This system comprises several stages. First, oversampling is carried out by a combination of the synthetic minority oversampling technique (SMOTE), feature selection, and the C4.5 classification algorithm. System testing is done using k-fold cross-validation. The performance parameters are sensitivity, specificity, positive prediction value (PPV), negative prediction value (NPV) and the area under the curve (AUC). Results: The results showed that the performance of the system has a sensitivity of 74.7%, a specificity of 93.7%, a PPV of 74.2%, an NPV of 93.7%, and an AUC of 84.2%. Conclusions: This study demonstrated that, by using C4.5 algorithms, data can be interpreted in the form of a decision tree, to aid the un-derstanding of the clinician. In addition, the proposed system can provide better performance by category.
Keywords: Heart Diseases, Algorithms, Diagnosis, Data Mining, Decision Tree
Healthc Inform Res. 2016 July;22(3):186-195. http://dx.doi.org/10.4258/hir.2016.22.3.186pISSN 2093-3681 • eISSN 2093-369X
Original Article
Submitted: March 24, 2016Revised: June 20, 2016Accepted: July 13, 2016
Corresponding Author Wiharto Wiharto, MComJl. Ir. Sutami No. 36A, Kentingan, Surakarta, Central of Java 57126, Indonesia. Tel: +628121520050, E-mail: [email protected]
This is an Open Access article distributed under the terms of the Creative Com-mons Attribution Non-Commercial License (http://creativecommons.org/licenses/by-nc/4.0/) which permits unrestricted non-commercial use, distribution, and reproduc-tion in any medium, provided the original work is properly cited.
ⓒ 2016 The Korean Society of Medical Informatics
I. Introduction
Medical examinations for the diagnosis of coronary heart

187Vol. 22 • No. 3 • July 2016 www.e-hir.org
C4.5 Algorithm for Coronary Heart Disease
rithms in such systems can be grouped into two approaches, namely, non-black-box and black-box. In the black-box approach the system cannot explain the relationship between the input and output attribute, which can be understood by clinicians. Research interpretation systems for diagnosis using the black-box approach include those using neural networks [2], support vector machine (SVM) [3], K-star [4] and naive Bayesian [3]. The non-black-box approaches in clue those us-ing C4.5 algorithms and fuzzy inference systems [5-7]. There have been few attempts to develop a system to diag-nose the type/level of coronary heart disease, including that by Nahar et al. [8]. Their study assessed the performance of several data mining algorithms for the diagnosis of coro-nary heart disease. The algorithms included black-box and non-black-box approaches. The non-black-box algorithms considered were J48 (C4.5) and PART. The study converted multiclass classifications to binary classifications. Similar to the research by Nahar et al. [8], Prabowo et al. [9] proposed a system of diagnosis of coronary heart disease that adds randomization before the classification process. The algo-rithm was tested together with those considered by Nahar et al. [8]. In addition to these studies, Dominic et al. [10] also proposed a system for the diagnosis of coronary heart disease using black-boxand non-black-box data mining al-gorithms. The non-black-box algorithm used was a decision tree. Subsequent research was conducted by Setiawan et al. [11]. This study compared several methods of feature selec-tion and data mining algorithms with a black-box approach naive Bayesian and non-black-box J48. In the studies that have been done with non-black-box approaches to implement conversion into binary and mul-ticlass, the average yield performance is still relatively low, especially for the true positive rate (TPR) [8-10] and F-measure. Low TPR and F-measure values indicate that the system has a poor ability to interpret the data. This data should be interpreted as indicating one of the four types/levels of coronary heart disease, but instead, it is interpreted as indicting that the patient is healthy. The results of research conducted by Wiharto et al. [3], which tested several types of multiclass SVM algorithms and used the UCI dataset reposi-tory [12], showed good performance for the type/level with a large amount of training data. The problem of data imbalance can be addressed by several approaches. Ramyachitra and Manikandan [13] combined several methods to overcome the problem of data imbal-ance. These methods included data-based approaches and feature selection. Data-based approaches include those using oversampling, undersampling, and hybrid [14]. One method
of oversampling is the synthetic minority oversampling tech-nique (SMOTE), developed by Chawla et al. [14]. A study conducted by Wiharto et al. [4] applied the oversampling method to restore the balance of data in a system to diagnose coronary heart disease. The oversampling method uses a combination of resampling, SMOTE, deletion of data beyond the limit of its attributes, and the removal of duplicated data. Unfortunately, as [4] showed, the process cannot be inter-preted by the clinician. The approach of feature selection has also been widely used to address data imbalanced in relation to the diagnosis of coronary heart disease, as was done in the studies by Nahar et al. [8] and Prabowo et al. [9]. Referring to previous studies, this paper proposes a system for clinical data interpretation for type/level diaagnosis of coronary heart disease. The system uses a non-black-box classification algorithm, C4.5. Classification implementation taking a multiclass approach is adopted, and the imbalance of data is also considered. To address the imbalance of data two methods are employed: oversampling SMOTE and the feature selection method of information gain.
II. Methods
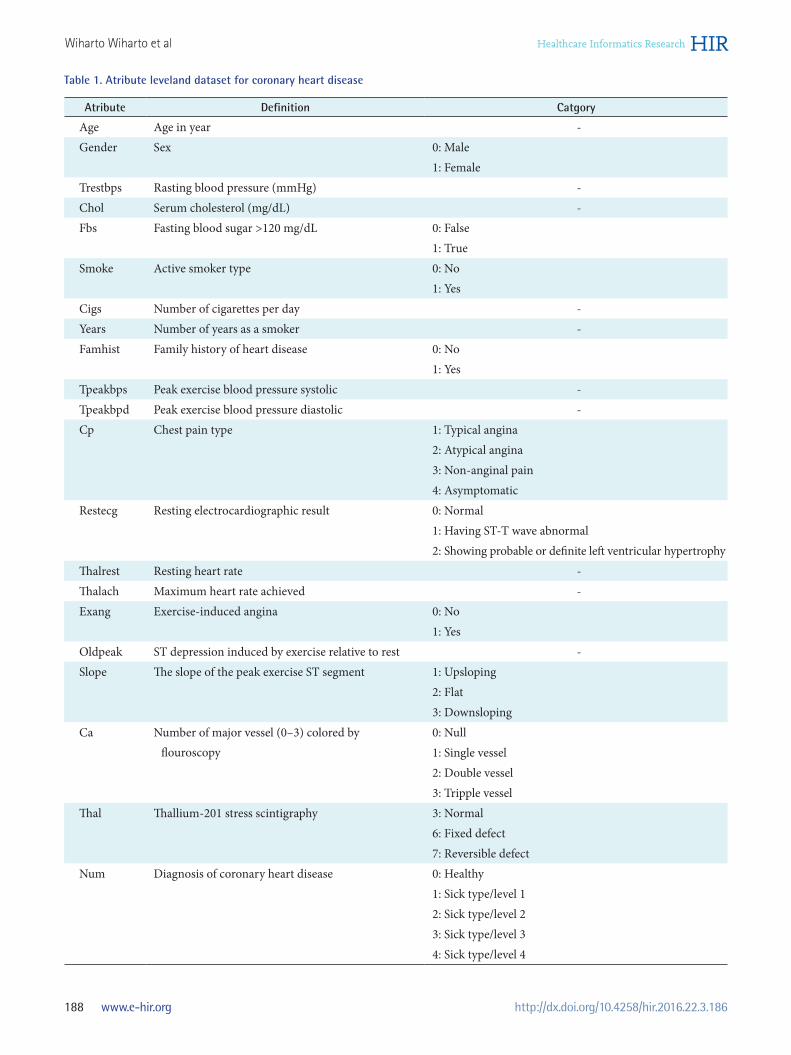
1. Data This study used the coronary heart disease dataset provided by the University of California Irvine (UCI) repository, which can be accessed online [12]. The dataset has 75 at-tributes; not all of these are used in the interpretation of clinical data systems for diagnosis. Referring to research conducted Marateb and Goudarzi [15], this study used 20 at-tributes, as shown in Table 1. The output diagnoses are given as healthy, sick-type/level 1, sick-type/level 2, sick-type/level 3, and sick-type/level 4 [2,8].
2. Synthetic Minority Over-sampling TechniqueSMOTE is an oversampling method that is used to address the problem of data imbalance. SMOTE creates an instance of a class of synthetic minority that operates in the feature space of the data space. By duplicating the minority class examples, SMOTE generates a new synthetic sample by ex-trapolating from the existing minority sample with a random sample obtained from the value of k nearest neighbors. With the synthetic results on an increased minority sample, the area of decision of the minority class is widened [14]. In this study, the SMOTE process is preceded by resam-pling with the aim to assess the accuracy of statistical sam-ples by providing a snapshot or by randomly replacing data from a subset of the available data. The resampling process
188 www.e-hir.org
Wiharto Wiharto et al
http://dx.doi.org/10.4258/hir.2016.22.3.186
Table 1. Atribute leveland dataset for coronary heart disease
Atribute Definition Catgory
Age Age in year -Gender Sex 0: Male
1: FemaleTrestbps Rasting blood pressure (mmHg) -Chol Serum cholesterol (mg/dL) -Fbs Fasting blood sugar >120 mg/dL 0: False
1: TrueSmoke Active smoker type 0: No
1: YesCigs Number of cigarettes per day -Years Number of years as a smoker -Famhist Family history of heart disease 0: No
1: YesTpeakbps Peak exercise blood pressure systolic -Tpeakbpd Peak exercise blood pressure diastolic -Cp Chest pain type 1: Typical angina
2: Atypical angina 3: Non-anginal pain4: Asymptomatic
Restecg Resting electrocardiographic result 0: Normal1: Having ST-T wave abnormal2: Showing probable or definite left ventricular hypertrophy
Thalrest Resting heart rate -Thalach Maximum heart rate achieved -Exang Exercise-induced angina 0: No
1: YesOldpeak ST depression induced by exercise relative to rest -Slope The slope of the peak exercise ST segment 1: Upsloping
2: Flat3: Downsloping
Ca Number of major vessel (0–3) colored by flouroscopy
0: Null1: Single vessel2: Double vessel3: Tripple vessel
Thal Thallium-201 stress scintigraphy 3: Normal 6: Fixed defect7: Reversible defect
Num Diagnosis of coronary heart disease 0: Healthy1: Sick type/level 12: Sick type/level 23: Sick type/level 34: Sick type/level 4

189Vol. 22 • No. 3 • July 2016 www.e-hir.org
C4.5 Algorithm for Coronary Heart Disease
results in data duplication. Meanwhile, SMOTE results in an attribute whose value is not within the range of attribute val-ues. To overcome this, resampling and SMOTE are carried out after the removal of duplicated data and deletion of data that exceeds the attribute-value limit.
3. Feature SelectionDimensionality reduction (DR) is the process of reducing the dimension of the data, with the possibility of a slight re-duction in information. DR comprises two steps, selection (feature selection) and transformation (feature extraction) [16]. In this study, DR is used for feature selection with the method of information gain (IG). The process of feature selection with IG is done by reference to the IG, which is a measure of the effectiveness of an attribute in classifying the data. The IG value is obtained by the following calculations (1)–(2) [17]:
Entropy(S) = ∑ c – pilog2(pi),i (1)
Gain(S,A) = Entropy(S) – ∑v∈Values(A)|Sv| Entropy(Sv),|S| (2)
where c : the number of grade classificationpi : the number of samples in class iA : attributeV : a possible value for attribute AValues(A) : the set of possible values for attribute A|Sv| : the number of samples for the value v|S| : the total number of data samplesEntropy(Sv) : entropy for samples that have value v
Attribute selection is carried out using the following proce-dure: Step-0 : IG is calculated for all attributes, based on Equa-tion (2) Step-1 : All features are sorted by IG in order from the highest IG value to the lowest Step-2 : All IGsare summed for N attributes of the training data
TotalGain = ∑ N Gain(S,Ai)i=1 (3)
Step-3 : The weights are calculated for each attribute Ai, where i = 1,2, ..., N
W(Ai) = Gain(S,Ai)TotalGain (4)
Step-4 : Repetitions are performed to add attribute weights,
Wn = 0.0; FOR i = 1 to N Wn = Wn + W(Ai) IF Wn ≥ Threshold THEN go to Step-5 ENDIF i = i + 1 ENDFOR
Step-5 : Attribute number i is selected, which attribute to 1, 2 .... i.
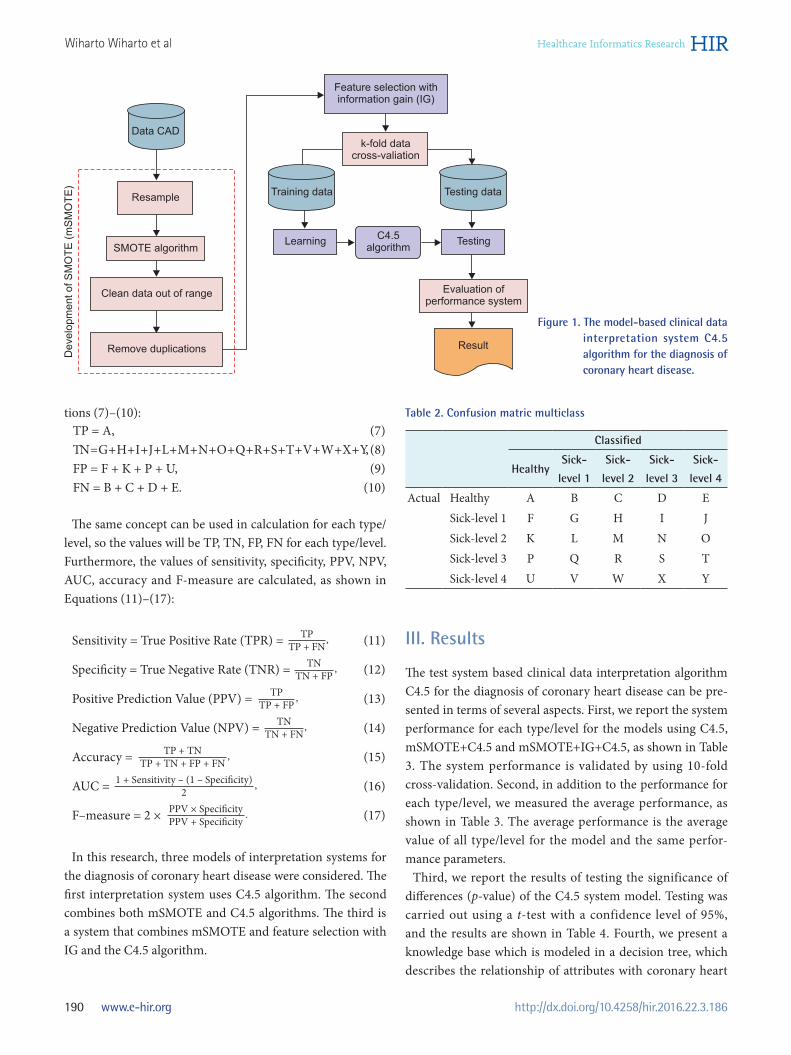
4. Method Proposed The model-based clinical data interpretation system C4.5 algorithm for the diagnosis of coronary heart disease is shown in Figure 1. The system consists of oversampling us-ing SMOTE development (mSMOTE), a feature selection al-gorithm using IG, multiclass classification, and performance evaluation. The multiclass classification algorithm used is C4.5 which is a development of the decision tree algorithm ID3 [18]. The algorithm has the same working principle, but the calculation of information gain is differently. In ID3, the learning process is done with reference to the calculation of the gain. The calculation of the gain in ID3 is same as the calculation of the gain in the feature selection process with the IG as shown in Equations (1)–(2). In the C4.5 algorithm, the learning process uses the ID3 normalized gain, as writ-ten in Equations (5)–(6):
GainRation(S,A) = Gain(S,A) ,SplitInfo(S,A) (5)
SplitInfo(S,A) = ∑ c Sv log2(Sv ).i=1 S S (6)
5. Performace Evaluation of the Proposed SystemThe method used to assess or validate the accuracy of the model of the proposed system is k-fold cross valida-tion. The method simply divides the data into k subsets, with k = 2,3,4, ..., 10. Then, these k subsetsare divided into two, k – 1 subsets as training data, and a subset of data for testing.The performance of the system is assessed with reference to the confusion matrix table for multiclass, as shown in Table 2. Based on the table calculation system per-formance parameter value, the calculation is performed by counting TP, TN, FP, and FN results for each type/level. As an example we show the calculation of the values of TN, TP, FP, FN on healthy output, the calculation shown in Equa-
190 www.e-hir.org
Wiharto Wiharto et al
http://dx.doi.org/10.4258/hir.2016.22.3.186
tions (7)–(10):TP = A, (7)TN = G + H + I + J + L + M + N + O + Q + R + S + T + V + W + X + Y,(8)FP = F + K + P + U, (9)FN = B + C + D + E. (10)
The same concept can be used in calculation for each type/level, so the values will be TP, TN, FP, FN for each type/level. Furthermore, the values of sensitivity, specificity, PPV, NPV, AUC, accuracy and F-measure are calculated, as shown in Equations (11)–(17):
Sensitivity = True Positive Rate (TPR) = TP , (11)TP + FN
Specificity = True Negative Rate (TNR) = TN , (12)TN + FP
Positive Prediction Value (PPV) = TP , (13)TP + FP
Negative Prediction Value (NPV) = TN , (14)TN + FN
Accuracy = TP + TN , (15)TP + TN + FP + FN
AUC = 1 + Sensitivity – (1 – Specificity) , (16)2
F–measure = 2 × PPV × Specificity . (17)PPV + Specificity
In this research, three models of interpretation systems for the diagnosis of coronary heart disease were considered. The first interpretation system uses C4.5 algorithm. The second combines both mSMOTE and C4.5 algorithms. The third is a system that combines mSMOTE and feature selection with IG and the C4.5 algorithm.
III. Results
The test system based clinical data interpretation algorithm C4.5 for the diagnosis of coronary heart disease can be pre-sented in terms of several aspects. First, we report the system performance for each type/level for the models using C4.5, mSMOTE+C4.5 and mSMOTE+IG+C4.5, as shown in Table 3. The system performance is validated by using 10-fold cross-validation. Second, in addition to the performance for each type/level, we measured the average performance, as shown in Table 3. The average performance is the average value of all type/level for the model and the same perfor-mance parameters. Third, we report the results of testing the significance of diff erences (p-value) of the C4.5 system model. Testing was carried out using a t-test with a confidence level of 95%, and the results are shown in Table 4. Fourth, we present a knowledge base which is modeled in a decision tree, which describes the relationship of attributes with coronary heart
Figure 1. The model-based clinical data interpretation system C4.5 algorithm for the diagnosis of coronary heart disease.
Data CAD
Develo
pm
entofS
MO
TE
(mS
MO
TE
)
Resample
SMOTE algorithm
Clean data out of range
Remove duplications
Feature selection withinformation gain (IG)
k-fold datacross-valiation
Training data Testing data
LearningC4.5
algorithmTesting
Evaluation ofperformance system
Result
Table 2. Confusion matric multiclass
Classified
HealthySick-
level 1
Sick-
level 2
Sick-
level 3
Sick-
level 4
Actual Healthy A B C D ESick-level 1 F G H I JSick-level 2 K L M N OSick-level 3 P Q R S TSick-level 4 U V W X Y

191Vol. 22 • No. 3 • July 2016 www.e-hir.org
C4.5 Algorithm for Coronary Heart Disease
disease, as shown in Figure 2. The knowledge base shown in Figure 2 was obtained by a system with an mSMOTE com-bination model, with feature selection, IG and C4.5. The use of feature selection reduces the IG from 19 attributes to 16 attributes of coronary heart disease.
IV. Discussion
In this section we will discuss the results in terms of three considerations. First, we will discuss the effect of oversam-pling and the feature selection process on the performance of the C4.5 algorithm. Second, we will discuss the analysis of the resulting decision tree models. Finally, we will com-pare our method with some previous research that used data mining algorithms with a non-black-box approach. Oversampling with the mSMOTE method was used in a
Table 3. Comparison of the performance of the system
Model Sensitivity Specificity PPV NPV AUC Accuracy F-measure
Healthy C4.5 0.834 0.686 0.768 0.769 0.760 0.768 0.800mSMOTE+C4.5 0.704 0.900 0.711 0.896 0.802 0.849 0.708mSMOTE+IG+C4.5 0.786 0.914 0.762 0.924 0.850 0.881 0.774
Sick-level 1 C4.5 0.224 0.865 0.268 0.835 0.545 0.750 0.244mSMOTE+C4.5 0.476 0.901 0.492 0.896 0.689 0.830 0.484mSMOTE+IG+C4.5 0.540 0.930 0.607 0.910 0.735 0.865 0.571
Sick-level 2 C4.5 0.300 0.893 0.257 0.911 0.596 0.827 0.277mSMOTE+C4.5 0.694 0.914 0.702 0.911 0.804 0.865 0.698mSMOTE+IG+C4.5 0.765 0.928 0.756 0.931 0.846 0.891 0.760
Sick-level 3 C4.5 0.167 0.934 0.238 0.900 0.550 0.849 0.196mSMOTE+C4.5 0.759 0.950 0.800 0.937 0.855 0.910 0.779mSMOTE+IG+C4.5 0.797 0.963 0.851 0.947 0.880 0.928 0.824
Sick-level 4 C4.5 0.083 0.962 0.091 0.958 0.522 0.923 0.087mSMOTE+C4.5 0.885 0.957 0.767 0.981 0.921 0.947 0.821mSMOTE+IG+C4.5 0.846 0.951 0.733 0.975 0.898 0.936 0.786
Average C4.5 0.322 0.868 0.325 0.875 0.595 0.823 0.321mSMOTE+C4.5 0.704 0.924 0.694 0.924 0.814 0.880 0.698mSMOTE+IG+C4.5 0.747 0.937 0.742 0.937 0.842 0.900 0.743
PPV: positive prediction value, NPV: negative prediction value, AUC: the area under the curve.The bold numbers indicate the highest value of the three models (C4.5, mSMOTE+C4.5, mSMOTE+IG+C4.5).
Table 4. The results of t-test (p-value) of significance difference with C4.5 system
Method Sensitivity Specificity PPV NPV AUC Accuracy F-measure
C4.5+mSMOTE 0.037 0.115 0.023 0.043 0.012 0.004 0.029C4.5+mSMOTE+IG (proposed) 0.019 0.085 0.012 0.035 0.004 0.007 0.015
PPV: positive prediction value, NPV: negative prediction value, AUC: area under the curve.
Figure 2. Knowledge-based in decision tree C4.5+mSMOTE+IG.
192 www.e-hir.org
Wiharto Wiharto et al
http://dx.doi.org/10.4258/hir.2016.22.3.186
previous study, which combined it with a black-box clas-sification algorithm, namely K-star [4]. The results showed a significant improvement. The combination of classification algorithms with a non-black-box approach, namely, C4.5 with mSMOTE produced the results shown in Table 3. Based on the results of the significance test (p-value) with a 95% confidence level, as shown in Table 4, there was a significant difference among the model systems using mSMOTE+C4.5 compared with that using only C4.5. The results also show that the use mSMOTE provides significant improvement (p < 0.05). This was also proved by Choi [19]. Furthermore, in addition to using mSMOTE to address the problem of data imbalance, this study also reduced the dimension of feature selection data. The performance with the addition of feature selection was improved for almost every type/level except type/level 4. In type/level 4, there is no improvement for any of the performance parameters. This caused necessary variable amount in order to be able to distinguish the type/level 4 with each other, so that if re-duced will result in a drop in performance. Model systems with a combination of mSMOTE feature selection and C4.5 also able to provide significant improvements to the system model using the C4.5 algorithm, as shown in Table 4. As compared to the model using mSMOTE+C4.5, there was an improvement with low significance. This is seen clearly by considering the p-value in Table 4. The average per-formance of the system model with reference to the AUC value increased by 2.8%. It increased from 81.4% to 84.2% in comparison with the system that makes no use of feature selection, which 59.5% to 84.2% or 24.7% of the system models without mSMOTE. The AUC value was in the range of 80%–90% [20], which can be considered good. Interpretation of clinical data using a combination of mS-MOTE, feature selection, and C4.5, can be a valuable tool for clinicians. The C4.5 algorithm results in a decision tree
structure as shown in Figure 2. A decision tree also can be written in an IF-THEN format. Another example of the out-put type/level 3 is
IF thal > 3 and years ≤ 32.43 and ca ≤ 0 and tpeakbps ≤ 159.07 and restecg > 1 THEN num = 3.
Using the model, a clinician can perform an analysis of the decision tree generated and determine whether it is in accor-dance with the knowledge and experience of the clinician. With a decision tree, if there is no match, then we modify the resulting decision tree algorithm C4.5. Interpretation of these data enables the clinician to understand the workings of the system for the diagnosis coronary heart disease. Clini-cians can not only know the results, but can also intervene in the structure of the resulting decision tree. Next we compare the proposed system to some previous research, which used non-black-box data mining algorithms, namely J48 and 10-fold cross-validation. The first study was conducted by Nahar et al. [8], on the implementation of algorithms using the J48 binary classification approach. The resulting performance for the TPR and F-measure pa-rameters for type/level healthy was better than that of the proposed system, both with and without feature selection, as shown in Tables 5 and 6. This is due to the mSMOTE process, in the elimination of duplicated data in the sub-processes, which results in a decreased amount of data on the type/level of healthy compared to the amount of data on the type/level of healthy research Nahar et al. [8]. Decreasing the amount of data results in a lower TPR value, and a low TPR results in a low F-measure. Regarding the TPR and F-measure for the type/levels 1-4, the proposed system showed much better performance than the method of Nahar et al. [8].
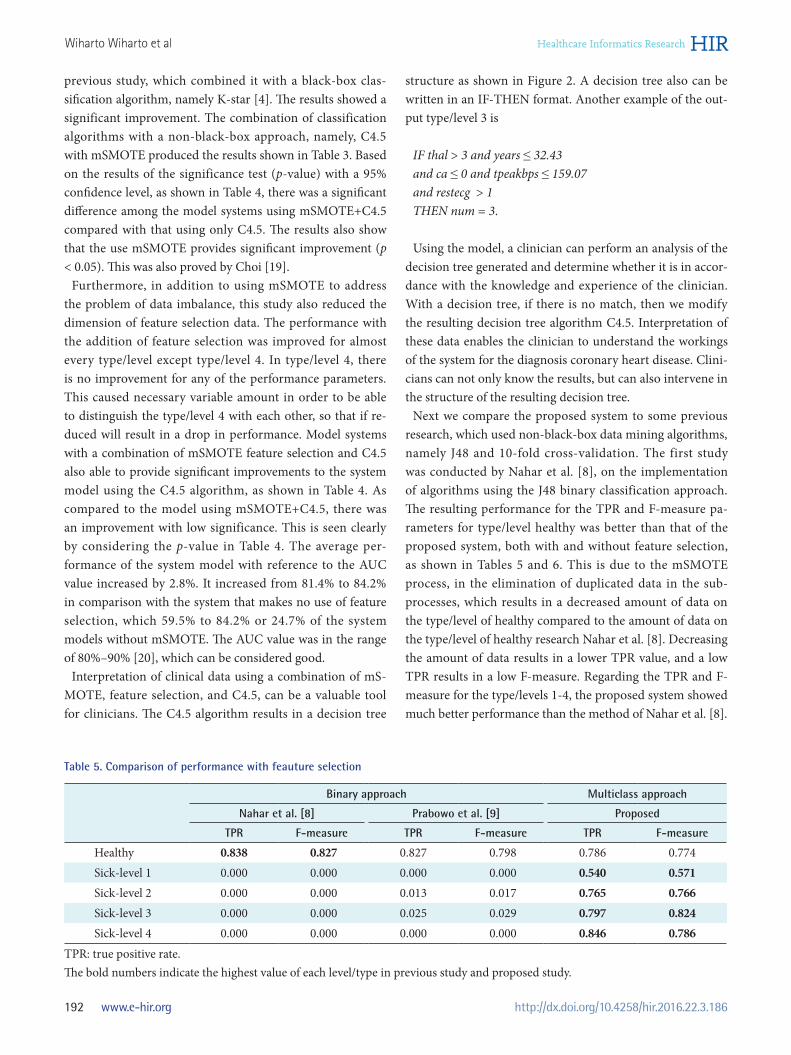
Table 5. Comparison of performance with feauture selection
Binary approach Multiclass approach
Nahar et al. [8] Prabowo et al. [9] Proposed
TPR F-measure TPR F-measure TPR F-measure
Healthy 0.838 0.827 0.827 0.798 0.786 0.774Sick-level 1 0.000 0.000 0.000 0.000 0.540 0.571Sick-level 2 0.000 0.000 0.013 0.017 0.765 0.766Sick-level 3 0.000 0.000 0.025 0.029 0.797 0.824Sick-level 4 0.000 0.000 0.000 0.000 0.846 0.786
TPR: true positive rate.The bold numbers indicate the highest value of each level/type in previous study and proposed study.
193Vol. 22 • No. 3 • July 2016 www.e-hir.org
C4.5 Algorithm for Coronary Heart Disease
Such improvement is due to additional amounts of data in the type/level 1–4 mSMOTE result. The overall significance test based on the results in Table 7 with a confidence level of 95% indicates that the proposed system achieves better per-formance than the previous method. Both with and without feature selection, it provides a significant performance im-provement (p < 0.05). The next comparison is with research conducted by Prabo-wo et al. [9] which was not much different from the research of Nahar et al. [8], as shown in Tables 5 and 6. The combina-tion of randomization and feature selection with computer feature selection (CFS) and the J48 algorithm did not pro-vide a significant improvement in the study, so the proposed system achieves better results, as shown in Table 5. This is evidenced by the significance test results shown in Table 7, where the p-value is <0.05. In the research of Prabowo et al. [9], in addition to using feature selection CFS, motivated feature selection (MFS) was also used. In comparison with the combination of randomization, MFS, and J48 feature selection, the TPR and F-measure performance for all type/levels of the proposed system is relatively lower. Unfortu-nately, the method proposed by Prabowo et al. [9] uses the conversion of multiclass classification to binary. In [9], the classification process is done for each type/level, so there are five models of the diagnosis system. Tables 5 and 6 show the
resulting system performance of all five models of diagnosis system. This is different from the multiclass approach. In this approach there is only one model of diagnosis system, with output there are 5 types/levels. In a binary classifica-tion approach, to obtain a single diagnosis system model with an output of five type/levels, The classifications must be compiled again into a single system. With a compiled system model, the performance may decline in comparison to that obtained using a model system for each diagnosis for each type/level.
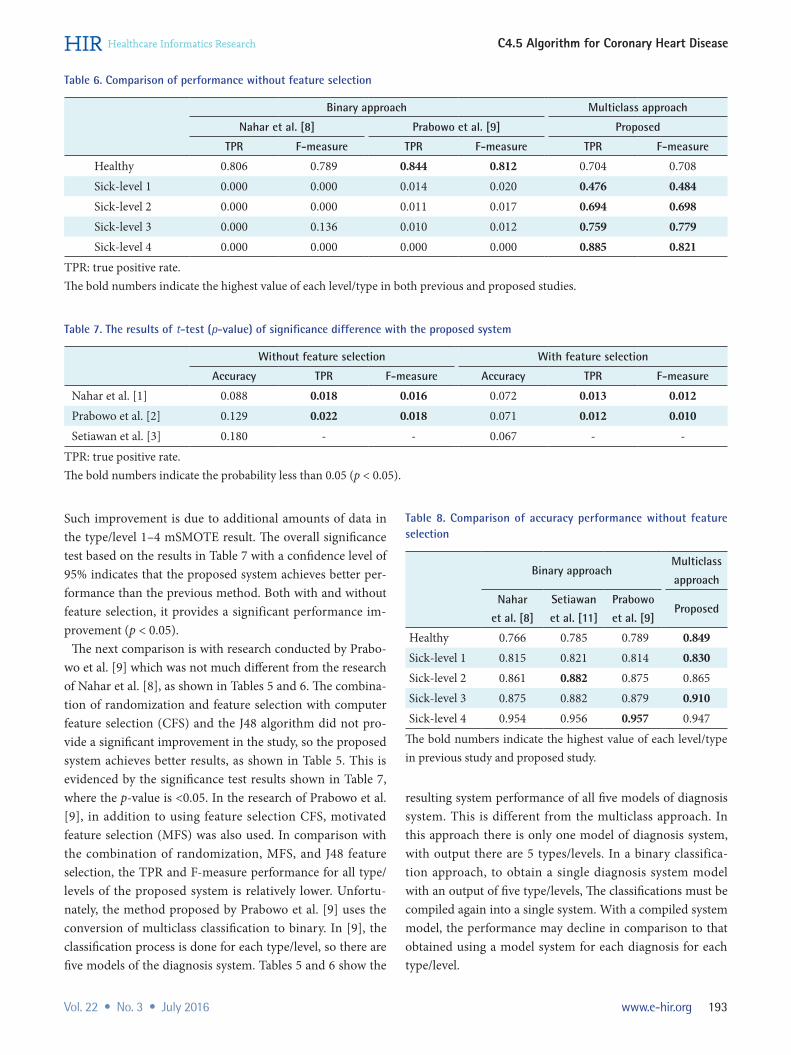
Table 6. Comparison of performance without feature selection
Binary approach Multiclass approach
Nahar et al. [8] Prabowo et al. [9] Proposed
TPR F-measure TPR F-measure TPR F-measure
Healthy 0.806 0.789 0.844 0.812 0.704 0.708Sick-level 1 0.000 0.000 0.014 0.020 0.476 0.484Sick-level 2 0.000 0.000 0.011 0.017 0.694 0.698Sick-level 3 0.000 0.136 0.010 0.012 0.759 0.779Sick-level 4 0.000 0.000 0.000 0.000 0.885 0.821
TPR: true positive rate.The bold numbers indicate the highest value of each level/type in both previous and proposed studies.
Table 7. The results of t-test (p-value) of significance difference with the proposed system
Without feature selection With feature selection
Accuracy TPR F-measure Accuracy TPR F-measure
Nahar et al. [1] 0.088 0.018 0.016 0.072 0.013 0.012Prabowo et al. [2] 0.129 0.022 0.018 0.071 0.012 0.010Setiawan et al. [3] 0.180 - - 0.067 - -
TPR: true positive rate.The bold numbers indicate the probability less than 0.05 (p < 0.05).
Table 8. Comparison of accuracy performance without feature selection
Binary approachMulticlass
approach
Nahar
et al. [8]
Setiawan
et al. [11]
Prabowo
et al. [9]Proposed
Healthy 0.766 0.785 0.789 0.849Sick-level 1 0.815 0.821 0.814 0.830Sick-level 2 0.861 0.882 0.875 0.865Sick-level 3 0.875 0.882 0.879 0.910Sick-level 4 0.954 0.956 0.957 0.947
The bold numbers indicate the highest value of each level/type in previous study and proposed study.

194 www.e-hir.org
Wiharto Wiharto et al
http://dx.doi.org/10.4258/hir.2016.22.3.186
Finally, the accuracy performance of our system is com-pared with the performance of systems proposed in previous studies. The accuracy performance of our diagnosis system is compared with diagnosis systems without feature selec-tion. The proposed diagnosis system shows better perfor-mance with low significance (p > 0.05) in comparison to the systems developed by Nahar et al. [8], Prabowo et al. [9], and Setiawan et al. [11], as shown in Tables 7 and 8. Using feature selection, the performance of the proposed system is better, with low significance (p > 0.05) in comparison with previously proposed systems, as shown in Tables 7 and 9. The accuracy performance is very similar, but previous studies showed low TPR values and high TNR values. In contrast, the proposed system has an accuracy that is very similar, but the TPR value is much better, and the TNR is also good. The proposed system achieves good performance in interpreting patient data to produce high rates of true positive and true negative results.
Conflict of Interest
No potential conflict of interest relevant to this article was reported.
Acknowledgments
This research was supported by scholarships from the gen-eral directorate of higher education of the Indonesian gov-ernment (BPDN).
References
1. Garg AX, Adhikari NK, McDonald H, Rosas-Arellano
MP, Devereaux PJ, Beyene J, et al. Effects of computer-ized clinical decision support systems on practitioner performance and patient outcomes: a systematic review. JAMA 2005;293(10):1223-38.
2. Salari N, Shohaimi S, Najafi F, Nallappan M, Karish-narajah I. A novel hybrid classification model of genetic algorithms, modified k-Nearest Neighbor and developed backpropagation neural network. PLoS One 2014;9(11): e112987.
3. Wiharto W, Kusnanto H, Herianto H. Performance analysis of multiclass support vector machine classifica-tion for diagnosis of coronary heart diseases. Int J Com-put Sci Appl 2015;5(5):27-37.
4. Wiharto W, Kusnanto H, Herianto H. Intelligence sys-tem for diagnosis level of coronary heart disease with K-star algorithm. Healthc Inform Res 2016;22(1):30-8.
5. Santhanam T, Ephzibah EP. Heart disease prediction using hybrid genetic fuzzy model. Indian J Sci Technol 2015;8(9):797-803.
6. Kim J, Lee J, Lee Y. Data-mining-based coronary heart disease risk prediction model using fuzzy logic and de-cision tree. Healthc Inform Res 2015;21(3):167-74.
7. Kim JK, Lee JS, Park DK, Lim YS, Lee YH, Jung EY. Adaptive mining prediction model for content recom-mendation to coronary heart disease patients. Cluster Comput 2014;17(3):881-91.
8. Nahar J, Imam T, Tickle KS, Chen YP. Computational intelligence for heart disease diagnosis: a medical knowl-edge driven approach. Expert Syst Appl 2013;40(1):96-104.
9. Prabowo DW, Setiawan NA, Nugroho HA. A study of data randomization on a computer based feature selec-tion for diagnosing coronary artery disease. Adv Intell Syst 2014;53:237-48.
10. Dominic V, Gupta D, Khare S. An effective performance analysis of machine learning techniques for cardiovas-cular disease. Appl Med Inform 2015;36(1):23-32.
11. Setiawan NA, Prabowo DW, Nugroho HA. Benchmark-ing of feature selection techniques for coronary artery disease diagnosis. Proceedings of 2014 6th International Conference on Information Technology and Electrical Engineering (ICITEE); 2014 Oct 7-8; Yogyakarta, Indo-nesia. p. 1-5.
12. Detrano R. Heart disease data set: Cleveland [Internet]. Irvine (CA): UCI Machine Learning Repository; 1988 [cited at 2016 Jun 30]. Available from: https://archive.ics.uci.edu/ml/datasets/Heart+Disease.
13. Ramyachitra D, Manikandan P. Imbalanced dataset clas-
Table 9. Comparison of accuracy performance with feature selec-tion
Binary approachMulticlass
approach
Nahar
et al. [1]
Setiawan
et al. [11]
Prabowo
et al. [2]Proposed
Healthy 0.809 0.809 0.773 0.881Sick-level 1 0.823 0.821 0.822 0.865Sick-level 2 0.853 0.882 0.876 0.891Sick-level 3 0.882 0.882 0.878 0.928Sick-level 4 0.971 0.956 0.957 0.936
The bold numbers indicate the highest value of each level/type in previous study and proposed study.

195Vol. 22 • No. 3 • July 2016 www.e-hir.org
C4.5 Algorithm for Coronary Heart Disease
sification and solutions: a review. Int J Comput Bus Res 2014;5(4):1-29.
14. Chawla NV, Bowyer KW, Hall LO, Kegelmeyer WP. SMOTE: synthetic minority over-sampling technique. J Artif Intell Res 2002;16:321-57.
15. Marateb HR, Goudarzi S. A noninvasive method for coronary artery diseases diagnosis using a clinically-interpretable fuzzy rule-based system. J Res Med Sci 2015;20(3):214-23.
16. Jensen R. Combining rough and fuzzy sets for feature selection [dissertation]. Edinburgh: University of Edin-burgh; 2005.
17. Jain M, Richariya V. An improved techniques based on naive Bayesian for attack detection. Int J Emerg Technol Adv Eng 2012;2(1):324-31.
18. Hssina B, Merbouha A, Ezzikouri H, Erritali M. A com-parative study of decision tree ID3 and C4.5. Int J Adv Comput Sci Appl 2014;4(2):13-9.
19. Choi JM. A selective sampling method for imbalanced data learning on support vector machines [dissertation]. Ames (IA): Iowa State University; 2010.
20. Gorunescu F. Data mining: concepts, models and tech-niques. Heidelberg: Springer; 2011.
Related Documents