Origin of Bistability in the lac Operon M. Santilla ´ n,* y M. C. Mackey, yz and E. S. Zeron § *Unidad Monterrey, Centro de Investigacio ´n y Estudios Avanzados del Instituto Polite ´ cnico Nacional, Monterrey, Me ´ xico; Escuela Superior de Fı ´sica y Matema ´ ticas, Instituto Polite ´ cnico Nacional, Me ´xico DF, Me ´ xico; y Centre for Nonlinear Dynamics in Physiology and Medicine, z Departments of Physiology, Physics, and Mathematics, McGill University, Montreal, Canada; and § Departamento de Matema ´ ticas, Centro de Investigacio ´n y Estudios Avanzados del Instituto Polite ´ cnico Nacional, Me ´xico DF, Me ´ xico ABSTRACT Multistability is an emergent dynamic property that has been invoked to explain multiple coexisting biological states. In this work, we investigate the origin of bistability in the lac operon. To do this, we develop a mathematical model for the regulatory pathway in this system and compare the model predictions with other experimental results in which a nonmetabolizable inducer was employed. We investigate the effect of lactose metabolism using this model, and show that it greatly modifies the bistable region in the external lactose (Le) versus external glucose (Ge) parameter space. The model also predicts that lactose metabolism can cause bistability to disappear for very low Ge. We have also carried out stochastic numerical simulations of the model for several values of Ge and Le. Our results indicate that bistability can help guarantee that Escherichia coli consumes glucose and lactose in the most efficient possible way. Namely, the lac operon is induced only when there is almost no glucose in the growing medium, but if Le is high, the operon induction level increases abruptly when the levels of glucose in the environment decrease to very low values. We demonstrate that this behavior could not be obtained without bistability if the stability of the induced and uninduced states is to be preserved. Finally, we point out that the present methods and results may be useful to study the emergence of multistability in biological systems other than the lac operon. INTRODUCTION At the molecular level, biological systems function using two types of information: genes, which encode the molecular machines that execute the functions of life, and networks of regulatory interactions, specifying how genes are expressed. Substantial progress over the past few decades in biochem- istry, molecular biology, and cell physiology has ushered in a new era of regulatory interaction research. Recent analysis has revealed that cell signals do not necessarily propagate linearly. Instead, cellular signaling networks can be used to regulate multiple functions in a context-dependent fashion. Because of the magnitude and complexity of the interactions in the cell, it is often not possible to understand intuitively the systems behavior of these networks. Rather, it has become necessary to develop mathematical models and analyze the behavior of these models, both to develop a systems-level understanding and to obtain experimentally testable predic- tions. This, together with the fact that DNA micro-arrays, sequencers, and other technologies have begun to generate vast amounts of quantitative biological data, has accelerated the shift away from a purely descriptive biology and toward a predictive one. Recent computer simulations of partial or whole genetic networks have demonstrated collective behaviors (commonly called systems, or emergent, properties) that were not apparent from examination of only a few isolated interactions alone. Among the various patterns of complex behavior associated with nonlinear kinetics, multistability is noteworthy. Multi- stability corresponds to a true switch between alternate and coexisting steady states, and so allows a graded signal to be turned into a discontinuous evolution of the system along several different possible pathways. Multistability has cer- tain unique properties not shared by other mechanisms of integrative control. These properties may play an essential role in the dynamics of living cells and organisms. More- over, multistability has been invoked to explain catastrophic events in ecology (1), mitogen-activated protein kinase cas- cades in animal cells (2–4), cell cycle regulatory circuits in Xenopus and Saccharomyces cerevisiae (5,6), the generation of switchlike biochemical responses (2,3,7), and the estab- lishment of cell cycle oscillations and mutually exclusive cell cycle phases (6,8), among other biological phenomena. On the other hand, there are also serious doubts that multistability is the dynamic origin of some biological switches (9). Never- theless, it is generally accepted that two paradigmatic gene- regulatory networks in bacteria, the phage l switch and the lac operon (at least when induced by nonmetabolizable inducers), do show bistability (10–12). In the former, bistability arises through a mutually inhibitory double-negative-feedback loop, while in the latter, a positive-feedback loop is responsible for the bistability. The lac operon, the phage-l switch, and the trp operon, are three of the best known and most widely studied systems in molecular biology. The inducible lac operon in E. coli is the classic example of bistability. It was first noted by Monod and co-workers more than 50 years ago, although it was not fully recognized at the time. The bistable behavior of the lac operon has been the subject of a number of studies. It was first examined in detail by Novick and Weiner (13) and Cohn and Horibata (14). Later experimental studies include those Submitted November 27, 2006, and accepted for publication February 5, 2007. Address reprint requests to M. Santilla ´n, E-mail: [email protected]. Ó 2007 by the Biophysical Society 0006-3495/07/06/3830/13 $2.00 doi: 10.1529/biophysj.106.101717 3830 Biophysical Journal Volume 92 June 2007 3830–3842

Welcome message from author
This document is posted to help you gain knowledge. Please leave a comment to let me know what you think about it! Share it to your friends and learn new things together.
Transcript

Origin of Bistability in the lac Operon
M. Santillan,*y M. C. Mackey,yz and E. S. Zeron§
*Unidad Monterrey, Centro de Investigacion y Estudios Avanzados del Instituto Politecnico Nacional, Monterrey, Mexico; EscuelaSuperior de Fısica y Matematicas, Instituto Politecnico Nacional, Mexico DF, Mexico; yCentre for Nonlinear Dynamics in Physiologyand Medicine, zDepartments of Physiology, Physics, and Mathematics, McGill University, Montreal, Canada; and §Departamento deMatematicas, Centro de Investigacion y Estudios Avanzados del Instituto Politecnico Nacional, Mexico DF, Mexico
ABSTRACT Multistability is an emergent dynamic property that has been invoked to explain multiple coexisting biologicalstates. In this work, we investigate the origin of bistability in the lac operon. To do this, we develop a mathematical model for theregulatory pathway in this system and compare the model predictions with other experimental results in which a nonmetabolizableinducer was employed. We investigate the effect of lactose metabolism using this model, and show that it greatly modifies thebistable region in the external lactose (Le) versus external glucose (Ge) parameter space. The model also predicts that lactosemetabolism can cause bistability to disappear for very low Ge. We have also carried out stochastic numerical simulations of themodel for several values of Ge and Le. Our results indicate that bistability can help guarantee that Escherichia coli consumesglucose and lactose in the most efficient possible way. Namely, the lac operon is induced only when there is almost no glucosein the growing medium, but if Le is high, the operon induction level increases abruptly when the levels of glucose in theenvironment decrease to very low values. We demonstrate that this behavior could not be obtained without bistability if thestability of the induced and uninduced states is to be preserved. Finally, we point out that the present methods and results maybe useful to study the emergence of multistability in biological systems other than the lac operon.
INTRODUCTION
At the molecular level, biological systems function using twotypes of information: genes, which encode the molecularmachines that execute the functions of life, and networks ofregulatory interactions, specifying how genes are expressed.Substantial progress over the past few decades in biochem-istry, molecular biology, and cell physiology has ushered in anew era of regulatory interaction research. Recent analysishas revealed that cell signals do not necessarily propagatelinearly. Instead, cellular signaling networks can be used toregulate multiple functions in a context-dependent fashion.Because of the magnitude and complexity of the interactionsin the cell, it is often not possible to understand intuitivelythe systems behavior of these networks. Rather, it hasbecome necessary to developmathematical models and analyzethe behavior of these models, both to develop a systems-levelunderstanding and to obtain experimentally testable predic-tions. This, together with the fact that DNA micro-arrays,sequencers, and other technologies have begun to generatevast amounts of quantitative biological data, has acceleratedthe shift away from a purely descriptive biology and toward apredictive one.Recent computer simulations of partial or whole genetic
networks have demonstrated collective behaviors (commonlycalled systems, or emergent, properties) that were not apparentfrom examination of only a few isolated interactions alone.Among the various patterns of complex behavior associatedwith nonlinear kinetics, multistability is noteworthy. Multi-
stability corresponds to a true switch between alternate andcoexisting steady states, and so allows a graded signal to beturned into a discontinuous evolution of the system alongseveral different possible pathways. Multistability has cer-tain unique properties not shared by other mechanisms ofintegrative control. These properties may play an essentialrole in the dynamics of living cells and organisms. More-over, multistability has been invoked to explain catastrophicevents in ecology (1), mitogen-activated protein kinase cas-cades in animal cells (2–4), cell cycle regulatory circuits inXenopus and Saccharomyces cerevisiae (5,6), the generationof switchlike biochemical responses (2,3,7), and the estab-lishment of cell cycle oscillations and mutually exclusive cellcycle phases (6,8), among other biological phenomena. Onthe other hand, there are also serious doubts that multistabilityis the dynamic origin of some biological switches (9). Never-theless, it is generally accepted that two paradigmatic gene-regulatory networks in bacteria, the phage l switch and the lacoperon (at least when induced by nonmetabolizable inducers),do show bistability (10–12). In the former, bistability arisesthrough a mutually inhibitory double-negative-feedback loop,while in the latter, a positive-feedback loop is responsible forthe bistability.The lac operon, the phage-l switch, and the trp operon,
are three of the best known and most widely studied systemsin molecular biology. The inducible lac operon in E. coli is theclassic example of bistability. It was first noted by Monod andco-workers more than 50 years ago, although it was not fullyrecognized at the time. The bistable behavior of the lacoperon has been the subject of a number of studies. It wasfirst examined in detail by Novick andWeiner (13) and Cohnand Horibata (14). Later experimental studies include those
Submitted November 27, 2006, and accepted for publication February 5,2007.
Address reprint requests toM. Santillan, E-mail: [email protected].
! 2007 by the Biophysical Society
0006-3495/07/06/3830/13 $2.00 doi: 10.1529/biophysj.106.101717
3830 Biophysical Journal Volume 92 June 2007 3830–3842

of Maloney and Rotman (15) and Chung and Stephanopou-los (10). Over the last few years, the lac operon dynamicshave been analyzed mathematically by Wong et al. (16),Vilar et al. (17), Yildirim and Mackey (18), Santillan andMackey (19), Yildirim et al. (20), Tian and Burrage (21), andHoek and Hogeweg (22). This was possible because thissystem has been experimentally studied for nearly 50 yearsand there is a wealth of biochemical and molecular infor-mation and data on which to draw. Recently, Ozbudak et al.(23) performed a set of ingenious experiments that not onlyconfirm bistability in the lac operon when induced with thenonmetabolizable inducer thiomethylgalactoside (TMG), butalso provide new and novel quantitative data that raise ques-tions that may be answered via a modeling approach.Previous studies have analyzed bistability and its dynamic
properties as a systems phenomenon. However, to our knowl-edge, none of them have dealt with questions like: ‘‘How didmultistability arise within the context of gene regulatorynetworks?’’ or ‘‘What evolutionary advantages do bistableregulatory networks have when compared with monostableones?’’ In this article, we address these issues from a mathe-matical modeling approach, basing our examination on thedynamics of the lac operon.
THEORY
Model development
A mathematical model for the lac operon is developed inAppendices A–C. All of the model equations are tabulated inTable 1 and they are briefly explained below. The reader mayfind it useful to refer to Fig. 1, where the lac operon regu-latory pathway is schematically represented.The model consists of three differential equations (Eqs.
1–3), that respectively account for the temporal evolutionof mRNA (M), lacZ polypeptide (E), and internal lactose (L)concentrations.Messenger RNA (mRNA) is produced via transcription of
the lac operon genes, and its concentration decreases becauseof active degradation and dilution due to cell growth. Thevalue gM represents the degradation plus dilution rate, kM isthe maximum transcription rate per promoter, and D is theaverage number of promoter copies per bacterium. The func-tion PR!A" (defined in Eq. 9) accounts for regulation oftranscription initiation by active repressors. The fraction ofactive repressors is proportional to r(A) (compare Eq. 10);since repressors are inactivated by allolactose (A), r is a de-creasing function of A. Furthermore, the rate of transcriptioninitiation decreases as the concentration of active repressorsincreases. Concomitantly, PR is a decreasing function of r,and thus it is an increasing function of A. The functionPD!Ge" (Eq. 9) denotes the modulation of transcription ini-tiation by external glucose, i.e., through catabolite repression.Production of cyclic AMP (cAMP) is inhibited by extracel-lular glucose. cAMP further binds the so-called cAMP re-
ceptor protein (CRP) to form the CAP complex. Finally,CAP binds a specific site near the lac promoter and enhancestranscription initiation. The probability of finding a CAPmole-cule bound to its corresponding site is given by pc (Eq. 8) andis a decreasing function of Ge. Moreover, PD is an increas-ing function pc and, therefore, a decreasing function of Ge.The translation initiation rate of lacZ transcripts is kE,
while gE is the dilution and degradation rate of lacZ poly-peptides. Let B andQ, respectively, denote the b-galactosidaseand permease concentrations. Given that the correspondingparameters for lacY transcripts and polypeptides attain sim-ilar values, that b-galactosidase is a homo-tetramer made upof four identical lacZ polypeptides, and that permease isa lacY monomer, it follows that Q # E and B # E/4 (Eqs. 5and 6).Lactose is transported into the bacterium by a catalytic
process in which permease protein plays a central role. Thus,the lactose influx rate is assumed to be kLbL(Le)Q, with thefunction bL(Le) given by Eq. 11. Extracellular glucose
TABLE 1 Full set of equations for the model of lactose operonregulatory pathway depicted in Fig. 1
Eq. No.
_M # DkMPD!Ge"PR!A" $ gMM (1)
_E # kEM $ gEE (2)
_L # kLbL!Le"bG!Ge"Q$ 2fMM!L"B$ gLL (3)
A # L (4)
Q # E (5)
B # E=4 (6)
PD!Ge" #pp 11 pc!Ge" kpc $ 1
! "! "
11 pppc!Ge" kpc $ 1! " (7)
pc!Ge" #Knh
G
KnhG 1Genh
(8)
PR!A" #1
11 r!A"1 j123 r!A"11 j2r!A"! " 11 j3r!A"! "
(9)
r!A" # rmax
KA
KA 1A
# $4(10)
bL!Le" #Le
kL 1Le(11)
bG!Ge" # 1$ fG
Ge
kG 1Ge(12)
M!L" # L
kM 1L(13)
Differential Eqs. 1–3 govern the time evolution of the intracellularconcentration of mRNA (M), polypeptide (E), and lactose (L) molecules.
Ge and Le, respectively, stand for the extracellular glucose and lactose
concentrations. A, Q, and B represent the intracellular allolactose, permease,and b-galactosidase molecule concentrations. The functions PD, PR, bL,
and bG, respectively, account for the negative effect of external glucose on
the initiation rate of transcription (via catabolite repression), the probability
that the lactose promoter is not repressed, the positive effect of external lac-tose on its uptake rate, and the negative effect of external glucose on lactose
uptake (inducer exclusion). The expression 2fMM is the rate of lactose me-
tabolism per b-galactosidase. Finally, pc and r represent internal auxiliary
variables.
Origin of Bistability in the Lac Operon 3831
Biophysical Journal 92(11) 3830–3842

negatively affects lactose uptake (so-called inducer exclu-sion), and this is accounted for by bG(Ge) (Eq. 12), which isa decreasing function of Ge. Once inside the cell, lactose ismetabolized by b-galactosidase. Approximately half of thelactose molecules are transformed into allolactose, while therest enter the catalytic pathway that produces galactose. Inour model, fMM!L", with M defined in Eq. 13, denotes thelactose-to-allolactose metabolism rate, which equals thelactose-to-galactose metabolism rate. Allolactose is furthermetabolized into galactose by b-galactosidase. From theassumptions that the corresponding metabolism parametersare similar to those of lactose, and that the allolactose pro-
duction rate is much higher than its degradation plus dilutionrate, it follows that A % L (Eq. 4).
Parameter estimation
All of the parameters in the model are estimated in AppendixD. Their values are tabulated in Table 2.
METHODS
Numerical experiments and analytical studies
We carried out stochastic simulations with the above-described model. This
was done by means of Gillespie’s Tau-Leap algorithm (24,25), which we
implemented in Python (http://www.python.org/download/).All of the analytical results we used to study the model dynamic behavior
are explained in detail in the Appendices.
RESULTS
Amathematical model for the lac operon regulatory pathwaywas developed as explained in Theory, above. The modelequations are tabulated in Table 1. These equations deter-mine the time evolution of variables M, E, and L, whichrespectively stand for mRNA, lacZ polypeptide, and internallactose concentrations. Special attention was paid to theestimation of the model parameters from reported experi-mental data. The model parameters are tabulated in Table 2.Below we describe the results obtained from this model.The model steady states and their stability are analyzed in
Appendix E. As seen there, depending on the values of Leand Ge, there can be up to three steady states. For very lowLe values, there is a single stable steady state correspondingto the uninduced state. As Le increases, two more steadystates appear via a saddle-node bifurcation. One of these newfixed points is stable, corresponding to the induced state,while the other is a saddle node. With further increases in Lethe saddle node and the original stable steady-state approachuntil they eventually collide and are annihilated via anothersaddle-node bifurcation. Afterwards, only the induced stablesteady state survives.
FIGURE 1 (A) Schematic representation of the lac operon regulatory
mechanisms. This operon comprises genes lacZ, lacY, and lacA. ProteinLacZ is a permease that transports external lactose into the cell. Protein LacY
polymerases into a homo-tetramer named b-galactosidase. This enzymetransforms internal lactose (Lac) into allolactose (Allo) and galactose (Gal),
and further transforms allolactose into galactose. Allolactose can bind to the
repressor (R) inhibiting it. When not bound by allolactose, R can bind to aspecific site upstream of the operon structural genes and thus avoid
transcription initiation. External glucose inhibits production of cAMP
which, when bound to protein CRP to form complex CAP, acts as an
activator of the lac operon. External glucose also inhibits lactose uptake bypermease proteins. (B) Graphical representation of the interactions
accounted for by the lac operon mathematical model. The meaning of the
variables appearing in this figure is as follows. Ge and Le stand for external
glucose and lactose concentrations; M, Q, and B denote mRNA, permease,and b-galactosidase, molecule concentrations, respectively; and L, A, and Gcorrespond to the intracellular lactose, allolactose, and galactose molecule
concentrations. All of the processes underlying the lac operon regulatorypathway are represented by rectangles. Inputs (outputs) are denoted with
empty arrowheads (circles). Finally, plus and minus signs stand for the effect
each input variable has on every output variable.
TABLE 2 Value of all of the parameters in the equations ofTable 1, as estimated in Appendix D
m % 0.02 min$1 KG % 2.6 mMD % 2 mpb nh % 1.3kM % 0.18 min$1 j2 % 0.05
kE % 18.8 min$1 j3 % 0.01
kL % 6.0 3 104 min$1 j123 % 163
gM % 0.48 min$1 rmax % 1.3gE % 0.03 min$1 KA % 2.92 3 106 mpb
gL % 0.02 min$1 kL % 680 mMkpc % 30 fG % 0.35
pp % 0.127 kG % 1.0 mMfM % 2 [0, 4.0 3 104] min$1 kM % 7.0 3 105 mpb
The term mpb indicates molecules per average bacterium.
3832 Santillan et al.
Biophysical Journal 92(11) 3830–3842
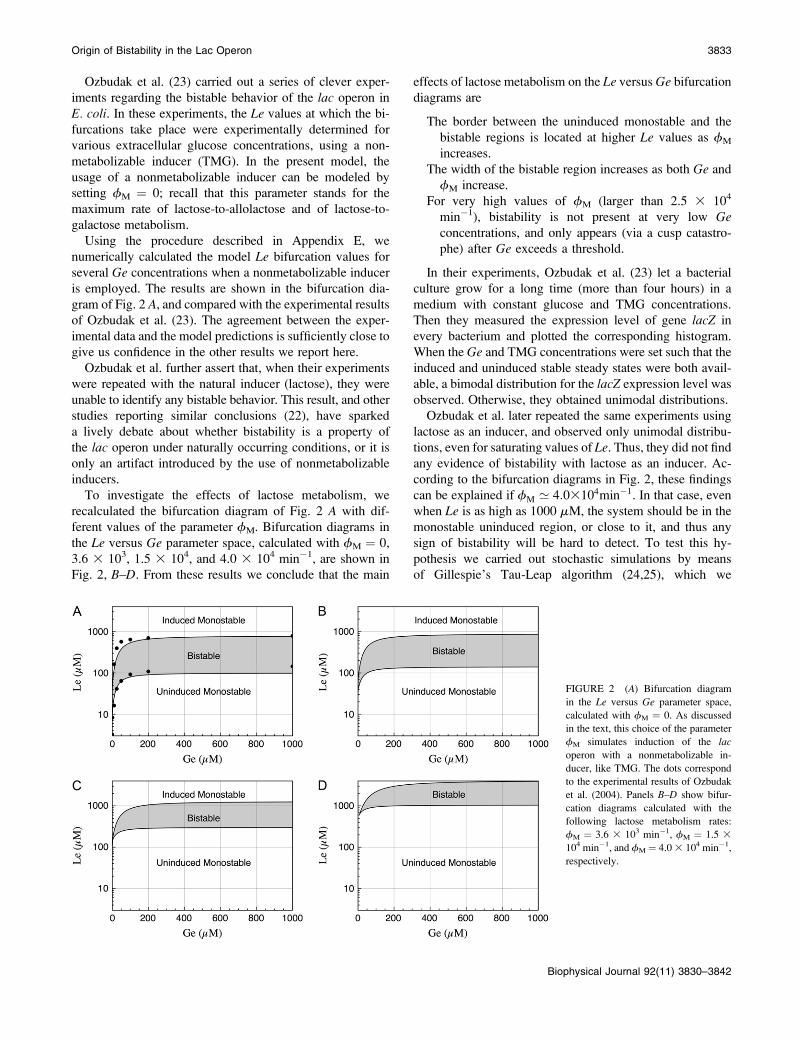
Ozbudak et al. (23) carried out a series of clever exper-iments regarding the bistable behavior of the lac operon inE. coli. In these experiments, the Le values at which the bi-furcations take place were experimentally determined forvarious extracellular glucose concentrations, using a non-metabolizable inducer (TMG). In the present model, theusage of a nonmetabolizable inducer can be modeled bysetting fM # 0; recall that this parameter stands for themaximum rate of lactose-to-allolactose and of lactose-to-galactose metabolism.Using the procedure described in Appendix E, we
numerically calculated the model Le bifurcation values forseveral Ge concentrations when a nonmetabolizable induceris employed. The results are shown in the bifurcation dia-gram of Fig. 2 A, and compared with the experimental resultsof Ozbudak et al. (23). The agreement between the exper-imental data and the model predictions is sufficiently close togive us confidence in the other results we report here.Ozbudak et al. further assert that, when their experiments
were repeated with the natural inducer (lactose), they wereunable to identify any bistable behavior. This result, and otherstudies reporting similar conclusions (22), have sparkeda lively debate about whether bistability is a property ofthe lac operon under naturally occurring conditions, or it isonly an artifact introduced by the use of nonmetabolizableinducers.To investigate the effects of lactose metabolism, we
recalculated the bifurcation diagram of Fig. 2 A with dif-ferent values of the parameter fM. Bifurcation diagrams inthe Le versus Ge parameter space, calculated with fM # 0,3.6 3 103, 1.5 3 104, and 4.0 3 104 min$1, are shown inFig. 2, B–D. From these results we conclude that the main
effects of lactose metabolism on the Le versus Ge bifurcationdiagrams are
The border between the uninduced monostable and thebistable regions is located at higher Le values as fM
increases.The width of the bistable region increases as both Ge andfM increase.
For very high values of fM (larger than 2.5 3 104
min$1), bistability is not present at very low Geconcentrations, and only appears (via a cusp catastro-phe) after Ge exceeds a threshold.
In their experiments, Ozbudak et al. (23) let a bacterialculture grow for a long time (more than four hours) in amedium with constant glucose and TMG concentrations.Then they measured the expression level of gene lacZ inevery bacterium and plotted the corresponding histogram.When the Ge and TMG concentrations were set such that theinduced and uninduced stable steady states were both avail-able, a bimodal distribution for the lacZ expression level wasobserved. Otherwise, they obtained unimodal distributions.Ozbudak et al. later repeated the same experiments using
lactose as an inducer, and observed only unimodal distribu-tions, even for saturating values of Le. Thus, they did not findany evidence of bistability with lactose as an inducer. Ac-cording to the bifurcation diagrams in Fig. 2, these findingscan be explained if fM ’ 4:03104min$1. In that case, evenwhen Le is as high as 1000 mM, the system should be in themonostable uninduced region, or close to it, and thus anysign of bistability will be hard to detect. To test this hy-pothesis we carried out stochastic simulations by meansof Gillespie’s Tau-Leap algorithm (24,25), which we
FIGURE 2 (A) Bifurcation diagram
in the Le versus Ge parameter space,
calculated with fM # 0. As discussedin the text, this choice of the parameter
fM simulates induction of the lacoperon with a nonmetabolizable in-
ducer, like TMG. The dots correspondto the experimental results of Ozbudak
et al. (2004). Panels B–D show bifur-
cation diagrams calculated with thefollowing lactose metabolism rates:
fM # 3.6 3 103 min$1, fM # 1.5 3104 min$1, and fM # 4.03 104 min$1,
respectively.
Origin of Bistability in the Lac Operon 3833
Biophysical Journal 92(11) 3830–3842

implemented in Python. In these simulations we set the val-ues of Ge and Le, and let the system evolve for 20,000 min,recording the value of all variables every minute. We per-formed these numerical experiments with Le # 1000 mM,and Ge # 4, 10, 20, 40, 100, 200, 400, and 1000 mM.In Fig. 3 we show the histograms of the internal lactose
molecule count calculated from these numerical experi-ments. Notice that:
Unimodal distributions, corresponding to the uninducedsteady state, were obtained for Ge # 100, 200, 400,1000 mM. In all these cases, the number of lactosemolecules per average bacterium is small—as com-pared with the corresponding numbers in the inducedstate—most of the times, and the frequency of highermolecule counts rapidly decays.
We obtained unimodal distributions as well for Ge # 4,10, 20 mM. These distributions correspond to the in-
duced steady state, and the number of lactose mole-cules per average bacterium fluctuates around valueslarger than 2 3 107 mpb.
Of all the calculated distributions, only that for Ge # 40mM vaguely resembles a bimodal distribution.
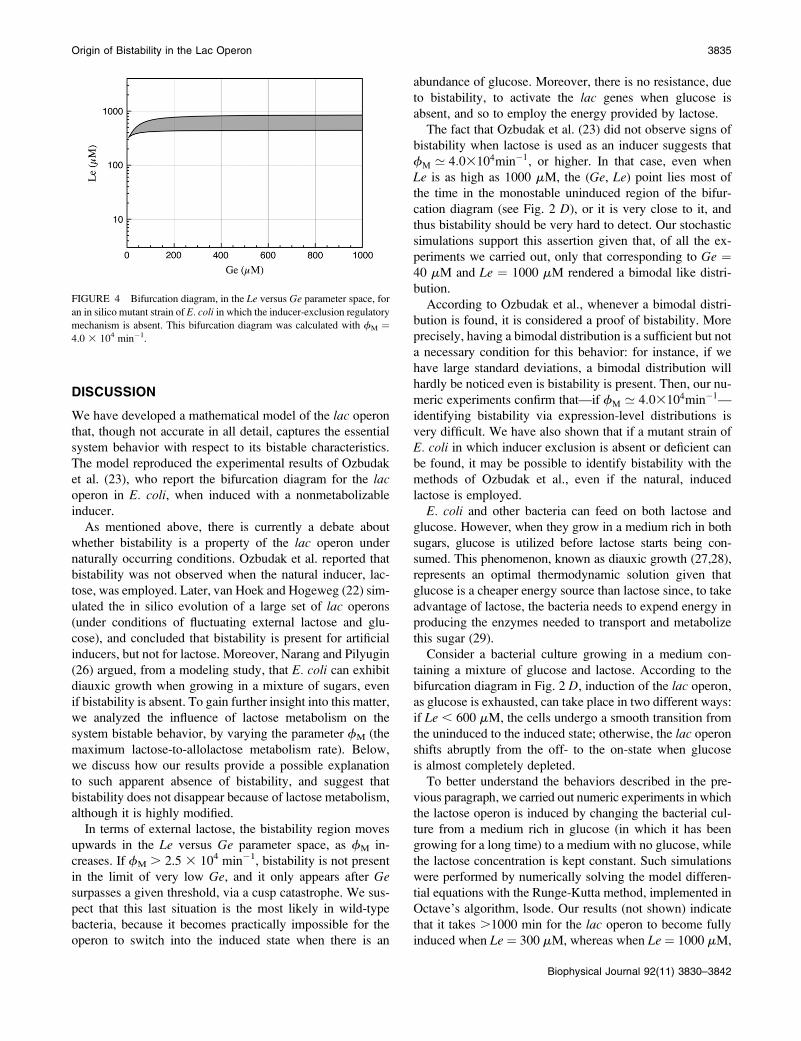
Following Santillan and Mackey (19), we analyze theeffect of inducer exclusion on the bistable behavior of the lacoperon. For this, we construct—by setting bG(Ge) # 1 inEq. 3—an in silico mutant strain of E. coli in which this regu-latory mechanism is absent, and recalculate the bifurcationdiagram in the Le versus Ge parameter space. The result isshown in Fig. 4. As seen there, the absence of this mechanismmoves the bifurcation region downwards, so the monostableinduced region starts at Le values similar to those obtainedwhen TMG is used as inducer (Fig. 2 A). If this mutant straincan be engineered, it may be possible to identify bistabilitywith experiments like those of Ozbudak et al. (23).
FIGURE 3 Normalized histograms
for the number of lactose molecules
per average-size bacterium. This histo-grams were calculated from the results
of stochastic simulations in which we
let the system evolve, for 10,000 min,with Le # 1000 mM and Ge # 1000,
400, 200, 100, 40, 20, 10, and 4 mM;
see the main text for details. Notice that
the lac operon remains in the uninducedstate for Ge $ 100 mM, and then it
jumps to the induced state when Ge #20 mM. Of all the histograms, only that
corresponding to Ge # 40 mM shows avaguely bimodal distribution character-
istic of bistability. These results are in
complete accord with the bifurcation
diagrams presented in Fig. 2.
3834 Santillan et al.
Biophysical Journal 92(11) 3830–3842
DISCUSSION
We have developed a mathematical model of the lac operonthat, though not accurate in all detail, captures the essentialsystem behavior with respect to its bistable characteristics.The model reproduced the experimental results of Ozbudaket al. (23), who report the bifurcation diagram for the lacoperon in E. coli, when induced with a nonmetabolizableinducer.As mentioned above, there is currently a debate about
whether bistability is a property of the lac operon undernaturally occurring conditions. Ozbudak et al. reported thatbistability was not observed when the natural inducer, lac-tose, was employed. Later, van Hoek and Hogeweg (22) sim-ulated the in silico evolution of a large set of lac operons(under conditions of fluctuating external lactose and glu-cose), and concluded that bistability is present for artificialinducers, but not for lactose. Moreover, Narang and Pilyugin(26) argued, from a modeling study, that E. coli can exhibitdiauxic growth when growing in a mixture of sugars, evenif bistability is absent. To gain further insight into this matter,we analyzed the influence of lactose metabolism on thesystem bistable behavior, by varying the parameter fM (themaximum lactose-to-allolactose metabolism rate). Below,we discuss how our results provide a possible explanationto such apparent absence of bistability, and suggest thatbistability does not disappear because of lactose metabolism,although it is highly modified.In terms of external lactose, the bistability region moves
upwards in the Le versus Ge parameter space, as fM in-creases. If fM . 2.5 3 104 min$1, bistability is not presentin the limit of very low Ge, and it only appears after Gesurpasses a given threshold, via a cusp catastrophe. We sus-pect that this last situation is the most likely in wild-typebacteria, because it becomes practically impossible for theoperon to switch into the induced state when there is an
abundance of glucose. Moreover, there is no resistance, dueto bistability, to activate the lac genes when glucose isabsent, and so to employ the energy provided by lactose.The fact that Ozbudak et al. (23) did not observe signs of
bistability when lactose is used as an inducer suggests thatfM ’ 4:03104min$1, or higher. In that case, even whenLe is as high as 1000 mM, the (Ge, Le) point lies most ofthe time in the monostable uninduced region of the bifur-cation diagram (see Fig. 2 D), or it is very close to it, andthus bistability should be very hard to detect. Our stochasticsimulations support this assertion given that, of all the ex-periments we carried out, only that corresponding to Ge #40 mM and Le # 1000 mM rendered a bimodal like distri-bution.According to Ozbudak et al., whenever a bimodal distri-
bution is found, it is considered a proof of bistability. Moreprecisely, having a bimodal distribution is a sufficient but nota necessary condition for this behavior: for instance, if wehave large standard deviations, a bimodal distribution willhardly be noticed even is bistability is present. Then, our nu-meric experiments confirm that—if fM ’ 4:03104min$1—identifying bistability via expression-level distributions isvery difficult. We have also shown that if a mutant strain ofE. coli in which inducer exclusion is absent or deficient canbe found, it may be possible to identify bistability with themethods of Ozbudak et al., even if the natural, inducedlactose is employed.E. coli and other bacteria can feed on both lactose and
glucose. However, when they grow in a medium rich in bothsugars, glucose is utilized before lactose starts being con-sumed. This phenomenon, known as diauxic growth (27,28),represents an optimal thermodynamic solution given thatglucose is a cheaper energy source than lactose since, to takeadvantage of lactose, the bacteria needs to expend energy inproducing the enzymes needed to transport and metabolizethis sugar (29).Consider a bacterial culture growing in a medium con-
taining a mixture of glucose and lactose. According to thebifurcation diagram in Fig. 2 D, induction of the lac operon,as glucose is exhausted, can take place in two different ways:if Le , 600 mM, the cells undergo a smooth transition fromthe uninduced to the induced state; otherwise, the lac operonshifts abruptly from the off- to the on-state when glucoseis almost completely depleted.To better understand the behaviors described in the pre-
vious paragraph, we carried out numeric experiments in whichthe lactose operon is induced by changing the bacterial cul-ture from a medium rich in glucose (in which it has beengrowing for a long time) to a medium with no glucose, whilethe lactose concentration is kept constant. Such simulationswere performed by numerically solving the model differen-tial equations with the Runge-Kutta method, implemented inOctave’s algorithm, lsode. Our results (not shown) indicatethat it takes .1000 min for the lac operon to become fullyinduced when Le # 300 mM, whereas when Le # 1000 mM,
FIGURE 4 Bifurcation diagram, in the Le versus Ge parameter space, for
an in silico mutant strain of E. coli in which the inducer-exclusion regulatorymechanism is absent. This bifurcation diagram was calculated with fM #4.0 3 104 min$1.
Origin of Bistability in the Lac Operon 3835
Biophysical Journal 92(11) 3830–3842

the operon achieves a 97% induction level 300 min after themedium shift.From these results we conclude that, with a very high
external lactose concentration, the lac operon can remainfully uninduced until glucose utilization is almost completelygiven up, because the response time is short in these con-ditions. That is, the most efficient performance consists of anabrupt change from the off- to the on-state, driven by a smallvariation on the external glucose concentration, if Le is veryhigh. An analysis of Fig. 2 D reveals that, if Le # 1000 mM,the system goes from the uninduced to the induced monostableregions when Ge decreases from 210 to 25 mM.We have argued that bistability helps to guarantee an
efficient performance of the lac operon in E. coli, whenfeeding on glucose, lactose, or both sugars. Could a regu-latory pathway involving only monostability be equally ef-ficient? The lac operon in E. coli is an inducible operon. Thismeans that it is subject to positive feedback regulationthrough lactose (allolactose). In our model, this is accountedfor by the fact that PR in Eq. 1 is an increasing function ofA. Therefore, the higher the intracellular level of lactose,the higher the transcription initiation rate of the lactoseoperon genes. Depending on the functional form of PR, wecan have either bistability for some parameter values, or aunique single stable steady state for all the parameters.In general, PR needs to be highly sigmoidal to have bi-stability.Expression of the lac operon is modulated by external
glucose through the function PD. On the other hand, byanalyzing the model steady state we can see that as Gedecreases from 210 to 25 mM, the system jumps from theuninduced to the induced states, and the L* steady-statevalue increases by a factor of 56. Substituting all thesevalues into Eqs. 7 and 8, we conclude that an incrementalincrease of PD from 0.14 to 0.26 drives the 56-fold increaseof L*. That is, the following amplification relation is ob-served:
PD!Ge # 25mM"PD!Ge # 210mM"
# $6:5
’ L&!Ge # 25mM"L&!Ge # 210mM"
’ 56:
It is well known, since the invention of the regenerativecircuit in the early decades of the 20th Century, that verylarge amplifications can destabilize a monostable systemsubject to positive feedback (30–32), and that the only wayto get large amplifications is to approach as much as possibleto the stability limit. In Appendix F we analyze the pos-sibility of having large amplifications, with monostable regu-lation, in the present model of the lac operon. There we showthat the stability of the steady state is highly compromisedwhenever the amplification exponent is.4. Since we predictan amplification exponent of 6.5, larger than four, the sta-bility of our system would be at risk if it were controlled by amonostable pathway. In Appendix F we also demonstrate
that bistability (multistability) allows both large amplifica-tion and strongly stable steady states. Hence, since a largeamplification of the lac operon expression level (driven by asmall change in PD) is advantageous for E. coli (when Le isvery high), we conclude that bistability ensures an efficientconsumption of lactose and glucose without jeopardizing thesystem stability.
APPENDIX A: MODEL DEVELOPMENT
In this section, a mathematical model of the lac operon in E. coli is
developed. The reader may find it convenient to refer to Fig. 1 of the main
text, where the lac operon regulatory mechanisms are schematically rep-resented. The model presented here accounts for the time evolution of
the following variables: intracellular mRNA (M), lacZ polypeptide (E),and intracellular lactose (L) concentrations. The dynamics of these variablesare modeled by the (balance) differential equations:
_M # DkMPD!Ge"PR!A" $ gMM; (14)
_E # kEM$ gEE; (15)
_L # kLbL!Le"bG!Ge"Q$ 2fMM!L"B$ gLL: (16)
The meaning of the functions and parameters in these equations is asfollows:
A is the intracellular allolactose concentration.
D is the concentration of lac promoter within the bacterium.
Q and B are the permease and b-galactosidase concentrations, respec-
tively.kM, kE, and kL are, respectively, the lac promoter transcription initiation
rate, the lacZ mRNA translation initiation rate, and the maximum
lactose uptake rate per permease.
gM, gE, and gL, respectively, stand for the dilution plus degradation ratesof M, E, and L.
Ge and Le denote the external glucose and lactose concentrations.
PR!A" is the probability that promoter P1 is not repressed, whilePD!Ge" takes into account the effect of external glucose on the
probability of having an mRNA polymerase bound to this promoter
(catabolite repression).
bL(Le) and bG(Ge) are functions that account for the modulation oflactose uptake as functions of the external lactose and glucose
(inducer exclusion) concentrations, respectively.
2fMM!L" represents the rate of lactose metabolization per b-galacto-sidase molecule.
Probability of having a polymerase bound to thelac promoter, including catabolite repression
Let P and C, respectively, denote the mRNA polymerase and CAPconcentrations. A polymerase can bind by itself to the lac promoter, P1.
However, the affinity of this reaction is increased when a CAP molecule is
bound to its corresponding binding site in the DNA chain. By taking this
cooperative behavior into account, as well as the results in Appendices B andC, the probability PD can be calculated as
PD!Ge" #PKP
11 kpc CKC
% &
11P
KP
1C
KC
1 kpcP
KP
C
KC
; (17)
3836 Santillan et al.
Biophysical Journal 92(11) 3830–3842
whereKP and KC are the respective dissociation constants of the polymerase-
promoter and CAP-DNA complexes, and kpc . 1 is a constant that accounts
for the cooperative interaction between the promoter and the CAP binding
site. Equation 17 can be rewritten as
PD!Ge" #pp!11 pc!Ge"!kpc $ 1""11 pppc!Ge"!kpc $ 1"
: (18)
In this equation, pp and pc(Ge), respectively, denote the probabilities that
a polymerase is bound to the promoter in the absence of CAP, and that aCAP molecule is bound to its binding site in the absence of mRNA poly-
merase. The probability pp is constant and given by
pp #PKP
11 PKP
:
However,
pc!Ge" #CKC
11 CKC
is a function of the external glucose concentration. Experimentally pc(Ge)
must be a decreasing function of Ge since external glucose inhibits the syn-thesis of cAMP, which in turns implies a decrease in C and thus in pc(Ge).
Here we assume that the functional form for pc(Ge) is given by
pc!Ge" #Knh
G
KnhG 1Gnh
e
: (19)
Probability that the promoter P1 is not repressed
The lac operon has three different operator regions denoted by O1, O2, andO3 all of which can bind active repressor and are involved in transcriptional
regulation. A repressor bound to O1 avoids transcription initiation. Con-
versely, a repressor bound to either O2 or O3 does not seem to affecttranscription. Nevertheless, DNA can fold in such a way that a single
repressor simultaneously binds two operators in all possible combinations.
These complexes are more stable than that of a repressor bound to a single
operator, and all of them inhibit transcription initiation (33). From the resultsin Appendix B, the probability that the lac operon promoter is not repressed
can then be calculated as
PR!A" #11 R
K2
% &11 R
K3
% &
11 RK1
% &11 R
K2
% &11 R
K3
% &1R 1
K121 1
K131 1
K23
% &;
(20)
where R is the concentration of active repressors, Ki (i # 1, 2, 3) is
the dissociation constant of the R-Oi complex, and Kij (i, j # 1, 2, 3, i, j) isthe dissociation constant of the Oi-R-Oj complex.
Define r(A) # R/K1, ji # K1/Ki (i # 2, 3), and j123 # K1=K121K1=K131K1=K23. With these definitions, Eq. 20 can be rewritten as
PR!A" #1
11 r!A"1 j123r!A"!11 j2r!A""!11 j3r!A""
: (21)
Repressor molecules are tetramers and each of their subunits can be boundby an allolactose molecule, inactivating the repressor. The concentration of
active repressors as a function of the allolactose concentration is given by Eq. 19,
R # RT
KA
KA 1A
# $4
;
where RT is the total repressor concentration, andKA is the allolactose-repressor
subunit complex dissociation rate. Since r(A) # R/K1, it follows that
r!A" # rmax
KA
KA 1A
# $4
; (22)
where rmax # RT/K1.
Inducer uptake rate
From the results of Ozbudak et al. (23), in the absence of external glucose
the dependence of the normalized inducer uptake rate, per b-permease
molecule, on the external inducer concentration is given by
bL!Le" #Le
kL 1 Le
: (23)
The results of Ozbudak et al. (23) also allow us to model the decrease in theinducer uptake rate caused by external glucose by
bG!Ge" # 1$ fG
Ge
kG 1Ge
: (24)
Lactose metabolism
After being transported into the bacterium, lactose is metabolized by
b-galactosidase. Approximately half of the lactose molecules are trans-
formed into allolactose, while the rest are directly used to produce galactose.
The lactose-to-allolactose metabolism rate, which as explained above equalsthe lactose-to-galactose metabolism rate, can be modeled as a Michaelis-
Menten function, typical of catalytic reactions
fM
L
kM 1 LB:
Therefore, the total rate of lactose metabolized per single b-galactosidase is
2fMM!L"; with M!L" # L
kM 1 L: (25)
Allolactose metabolism
Allolactose and lactose are both metabolized into galactose by the same
enzyme b-galactosidase. Under the assumption that the allolactose produc-
tion and metabolism rates are much faster than the cell growth rate, we mayassume that these two metabolic processes balance each other almost
instantaneously so
fM
L
kM 1 LB % fA
A
kA 1AB:
On the other hand, allolactose is an isomer of lactose, and therefore we can
expect that the parameters related to the metabolism kinetics of both sugarsattain similar values: fM % fA and kM % kA. Then
A % L: (26)
Permease and b-galactosidase concentrations
The translation initiation and degradation rates of lacZ and lacY are slightly
different. Here, we assume they are the same for the sake of simplicity. From
this and the fact that b-galactosidase is a homotetramer, made up of four
lacZ polypeptides, while permease consists of a single lacY polypeptide,it follows that
Origin of Bistability in the Lac Operon 3837
Biophysical Journal 92(11) 3830–3842

B # E=4; and Q # E: (27)
APPENDIX B: BINDING-STATE PROBABILITYDISTRIBUTION FOR A MOLECULE WITHMULTIPLE, INDEPENDENT, BINDING SITES
Consider a molecule D with specific, independent, binding sites for N dif-ferent molecules Bi, i # 1. . . N. Denote the binding state of molecule D by
(n1, n2, . . . nN) # (fnig), where ni # 1 if a molecule Bi its bound to its
corresponding site in molecule D, and ni # 0 otherwise. In what follows, we
demonstrate by induction that the probability of any given binding state is
PN!ni" #
QN
i#1'Bi (Ki
% &ni
+nn1 ... nnN#0;1
QN
j#1
'Bj (Kj
% &nj ;
where [Bi] is the concentration of chemical species Bi, and Ki is the
dissociation constant of the D:Bi complex.
Case N # 1
The reaction leading to the formation of complex D:B1 is
B1 1D !K1D :B1:
At equilibrium, the concentrations of the chemical species involved in this
reaction satisfy the relation
'B1('D( # K1'D :B1(: (28)
Assume a constant total concentration for species D, i.e.,
'D(1 'D :B1( # 'Dtot(: (29)
Then, from Eqs. 28 and 29, the fractions of free and bound B1 sites are
respectively given by
'D('Dtot(
# 1
11 'B1 (K1
and'D :B1('Dtot(
#'B1(K1
11 'B1 (K1
:
From these results, the binding-state probability distribution for the current
system can be written as
P1!n1" #'B1(K1
% &n1
11 'B1 (K1
; (30)
where n1 # 0 if the B1 binding site is empty, and n1 # 1 otherwise.
Case N # 2
From theN# 1 case, the probability distribution for the B1 binding site in the
absence of species B2 is
P1!n1" #'B1(K1
% &n1
11 'B1 (K1
:
Also, the probability distribution for the B2 binding site in the absence ofspecies B1 is
P1!n2" #'B2(K2
% &n2
11 'B2 (K2
:
If both sites are independent, their joint binding-state probability distribution is
P2!n1; n2" # P1!n1"P2!n2" #'B1 (K1
% &n1 'B2 (K2
% &n2
11 'B1 (K1
1 'B2 (K2
1 'B1(K1
'B2 (K2
: (31)
General case
Take a D molecule with N independent binding sites and assume that the
binding-state probability distribution for the first N–1 sites is given, in the
absence of species BN, by
PN!n1; . . . nN$1" #
QN$1
i#1'Bi(Ki
% &ni
+nn1 ... nnN$1
#0;1
QN$1
j#1
'Bj (Kj
% &nj :
In the absence of species B1, . . . BN–1, the probability of the BN binding site
is
P1!nN" #'BN (KN
% &nN
11 'BN (KN
:
Since all sites are independent from each other, the binding-state probability
distribution can be calculated as
PN!n1; . . . nN" # PN!n1; . . . nN$1"P1!nN"
#
QN
i#1'Bi(Ki
% &ni
+nn1 ... nnN#0;1
QN
j#1
'Bj(Kj
% &nj ;(32)
which proves our original assertion.
APPENDIX C: COOPERATIVITY BETWEENBINDING SITES
We can see from Eq. 32 that the probability of finding ni # 0, 1 molecules Bi
bound to its corresponding binding site is proportional to !'Bi(=K1"ni . Thedenominator in the fraction of Eq. 32 plays the role of a normalizing con-stant.
Assume that two given sites, say l and m, have a cooperative interactionin the sense that the probability of finding the two of them bound by theirrespective molecules is larger than the product of the individual probabil-
ities. From this and the considerations of Appendix B, the binding-state
probability distribution accounting for cooperativity between sites l and m is
PN!n1; . . . nN" #knlnmc
QN
i#1'Bi(Ki
% &ni
+nn1 ... nnN#0;1
knnl nnmc
QN
j#1
'Bj(Kj
% &nj ; (33)
where kc . 1 measures the strength of the cooperativity.
APPENDIX D: PARAMETER ESTIMATION
Growth rate, m
The growth rate of a bacterial culture depends strongly on the growth
medium. Typically, the mass doubling time varies from 20 to more than
40 min (34). For the purpose of this study, we take a doubling time of30 min, which corresponds to the growth rate m % 0.02 min$1.
3838 Santillan et al.
Biophysical Journal 92(11) 3830–3842

Lac promoter concentration
According to Bremmer and Dennis (34), there are;2.5 genome equivalents
per average E. coli cell at the growth rate determined by m. For the purposeof this work, we take D ’ 2.
Production rates
Malan et al. (35) measured the transcription initiation rate at the lac promoter
and report kM % 0.18 min$1.From Kennell and Riezman (36), translation of the lacZ mRNA starts
every 3.2 s. According to Beckwith (37), the production rate of lac permease
is smaller than that of b-galactosidase monomers even though, as Kennelland Riezman (36) report, there are similar levels of both mRNA species.
This suggests that lacY mRNA values are translated at a lower rate than is
lacZ mRNA. Nevertheless, to our knowledge, there are no reported
measurements of the lacY mRNA translation initiation rate. Thus, weassume it is equal to that of lacZ: kE ’ 18:8min$1.
According to Chung and Stephanopoulos (10), the inducer uptake rate
per lac permease is kL ’ 6:03104 min$1.
Degradation rates
Kennell and Riezman (36) measured a lacZmRNA half-life of 1.5 min. Thatis, its degradation rate is 0.46 min$1, and the corresponding dilution plus
degradation rate is gM ’ 0:48min$1.
According toKennell andRiezman (36), the lac permease degradation rate
is 0.01 min$1. Thus, its degradation plus dilution rate is gE ’ 0:03min$1.Here we assume that the lactose degradation rate is negligible and so its
degradation plus dilution rate is simply gL ’ 0:02min$1.
Catabolite repression parameters
Malan et al. (35) measured the polymerase-lac promoter affinity in the
presence and absence of cAMP. From their data, we estimate kpc ’ 30.The parameters pp, KG, and nh were estimated by fitting Eq. 5 of the main
text (with pc as given by Eq. 6) to the experimental data reported in Ozbudak
et al. (23). See Fig. 5. The values we obtained are pp ’ 0:127;KG ’ 2:6mM; and nh ’ 1:3.
Repression parameters
Oehler et al. (33) studied how the three operators in the lac operon cooperatein repression. According to their results, when only O1 and either O2 and O3
are present, the repression level is reduced to 53.85% and 33.85% that of the
wild-type operon, respectively. Moreover, when O2 and O3 are destroyed,repression is reduced to 1.38% that of the wild-type operon. This allowed us
to estimate the parameters j2, j3, and j123 as j2 ’ 0:05, j3 ’ 0:01, andj123 ’ 163.
For this, we took into consideration that eliminating O2 (O3) is equivalentto making 1/K2 # 1/K12 # 1/K23 # 0 (1/K2 # K13 # 1/K23 # 0) in Eq. 7
of the main text. Parameters j2, j3, and j123 are modified accordingly in
Eq. 8 of the main text.
The parameters r max and KA were estimated by fitting the curves in themodel bifurcation diagram to the experimental results of Ozbudak et al. (23)
(see Fig. 2 A of the main text) obtaining the values rmax ’ 1:3 andKA ’ 2:923 106.
Inducer uptake parameters
From the experimental data of Ozbudak et al. (23), the inducer uptake rate
per active permease, as a function of external inducer concentration, can befitted by a Michaelis-Menten function with a half-saturation concentration of
680 mM. That is, kL ’ 680mM.
Ozbudak et al. (23) measured the inducer-uptake-rate decrease per active
permease as a function of external glucose concentration. We found (plot notshown) that these data are well fit by Eq. 11 of the main text with
fG ’ 0:35 andkG ’ 1mM.
Lactose metabolism parameters
Lactose metabolism rate and saturation constant, fM and kM. We estimate
these parameters from the data reported in Martınew-Bilbao et al. (38) as
fM % 3.60 3 103 min$1, and kM % 7.0 3 105 mpb, where mpb stands
for molecules per average bacterium.
APPENDIX E: STEADY-STATE STABILITY ANDBIFURCATION DIAGRAMS
Stability analysis
The model equations (Eqs. 1–3) in the main text can be rewritten as
_M # DkMPD'PR!L" $ PR!L&"( $ gM'M $M&(; (34)
_E # kE'M $M&( $ gE'E$ E&(; (35)
_L # kLbLbG'E$E&( $fM
2'M!L"E$M!L&"E&( $ gL'L$ L&(:
(36)
The steady-state values M*, E*, and L* are, respectively, given by
M& # DkMgM
PDPR!L&"; (37)
E& # DkMkEgMgE
PDPR!L&"; (38)
L& # DkMkEkLgMgEgL
bLbG $ fM
2kLM!L&"
' (PDPR!L&": (39)
It is easy to show numerically that given the parameter values tabulated in
Table 2 andGe. 0, Eq. 39 may have up to three roots, and therefore that themodel has up to three steady states.
FIGURE 5 Effect of external glucose, due to catabolite repression, on
the activity of the lac promoter. The dots stand for the experimental dataof Ozbudak et al. (23), while the solid line was drawn from Eq. 5, with pcas given by Eq. 6, with the estimated parameter values.
Origin of Bistability in the Lac Operon 3839
Biophysical Journal 92(11) 3830–3842

Notice that, except for PR!T" $ PR!T&" and M!L" $M!L&", all terms in
the right-hand side of Eqs. 34–36 are linear with respect toM$M*, E$E*,and L$L*. Since we are only interested in analyzing the system dynamic
behavior in a small neighborhood around the steady states, the followinglinear approximation is employed:
PR!L" $ PR!L&" ’ 'L$ L&(P9R!L&";M!L"E$M!L&"E& ’M!L&"'E$E&(1 'L$ L&(M9!L&"E&:
With this approximation, the full model can be reduced (around the steady
state) to the following system of linear differential equations,
v # Av; (40)
where
v #M $M&
E$ E&
L$ L&
2
4
3
5;
and
A :#$gM 0 DkMPDP9R!L&"kE $gE 00 kLbLbG $ fMM!L&"=2 $gL $ fMM9!L&"E&=2
2
4
3
5:
The general solution of the linear system (Eq. 40) is v # +3k#1 Ckuk
exp!akt", where Ck are undetermined constants, while ak and uk are the
respective eigenvalues and eigenvectors of matrix A. Therefore, if all eigen-values ak have negative real parts, the corresponding steady state is stable.
Conversely, the steady state is unstable if at least one eigenvalue has a positive
real part.
The eigenvalues of A are the roots of its characteristic polynomial,det(sI – A). It follows after some algebra that det(sI – A) # P(s) – Q3, with
P!s" : # !s1 gM"!s1 gE"!s1 g3";g3 : # gL 1fMM9!L&"E&=2;
Q3 : # DkMkEkL bLbE $fM
2kLM!L&"
' (PDP9R!L&":
Notice that g3 . 0 because gL . 0 and M is an increasing function;
moreover gM . gE . 0. Hence, the polynomial P(s) is positive and strictly
increasing for every real s$ 0. Assume now that Q3 . P(0), then, P(s) – Q3
has one positive real root since P(0) – Q3 , 0 and P(s) is strictly increasingfor s . 0.
On the other hand, we assert that all roots of P(s) – Q3 have negative real
part whenever Q3 , P(0). It follows from the work of Strelitz (39) that allroots have negative real part if and only if the following pair of inequalities
hold simultaneously:
0, gMgEg3 $ Q3 , !gM 1 gE 1 g3"!gMgE 1 gMg3 1 gEg3";
and we obviously have that
P!0" # gMgEg3 and
gMgEg3 , !gM 1 gE 1 g3"!gMgE 1 gMg3 1 gEg3":
Therefore, the linear system _v # Av is stable (unstable) wheneverQ3, P(0)(Q3. P(0)). Furthermore, since the steady-state values of L* are the roots ofthe equation S!L&" # 0, with
S!L&" :# DkMkEkLgMgEgL
bLbG $ fM
2kLM!L&"
' (PDPR!L&" $ L&;
(41)
we can easily calculate that a given steady state is locally stable (unstable)
whenever the derivative
dS!L&"dL& # Q3
gMgEgL
$ fMM!L&"E&
2gL
$ 1
# Q3 $ P!0"gMgEgL
(42)
is strictly negative (positive).
Calculation of the bifurcation points and thebifurcation diagram
Given Ge, the values of L* and Le at which a saddle node bifurcation oc-curs can be calculated by simultaneously solving S!L&" # 0 and
dS!L&"=dL& # 0, with S!L&" as defined in Eq. 41. The bifurcation diagram
in the Le versus Ge parameter space can be calculated by repeating theabove procedure for several values of Ge.
APPENDIX F: POSITIVE FEEDBACK, STABILITYAND HYSTERESIS
Consider the following simplified model of a biological switch with
nonlinear feedback,
_x # bP!x" $ gx; (43)
where g . 0 is a degradation parameter, b . 0 is an external controlparameter, and the smooth function P!x". 0 is nonlinear with respect to x.The steady states x* of Eq. 43 are the solutions to
b
g3 P!x&" # x&: (44)
It is easy to prove that the dynamic system given by Eq. 43 is locally stable
at x* if and only if
b
g3
dP!x"dx
))))x#x&
, 1: (45)
We choose system Eq. 43 because its dynamic behavior is representative of
(and similar to) the behavior of higher dimensional systems. For example,
consider the following two-dimensional system, with positive parametersbk . 0 and gk . 0:
_x # b1P!y" $ g1x;
_y # b2x $ g2y:
The steady states x* and y* are the solutions of
b1b2
g1g2
3 P!y&" # y& and b2x& # g2y
&:
These equations are equivalent to Eq. 44 with b # b1b2 and g # g1g2.Furthermore, the two dimensional system is locally stable at x* and y* if andonly if both eigenvalues of the matrix
A2 # $g1 b1dP!y"dy
jy#y&
b2 $g2
' (
have strictly negative real parts. Simple algebraic calculations allows us to
prove that both eigenvalues of A2 have strictly negative real part if and only if
b1b2
g1g2
3dP!y"dy
))))y#y&
, 1:
3840 Santillan et al.
Biophysical Journal 92(11) 3830–3842

Notice that this last result is equivalent to Eq. 45, after setting the
degradation parameter g # g1g2 and the external control parameter b #b1b2. Similar results holds for higher dimensions.
Consider the model equations (Eqs. 1–3) with the external glucose Gevalues in the interval [25, 210] mM, the external lactose Le # 103 mM and
fM # 43 104 min$1. It is easy to show, under the previous conditions, that
the steady state L* achieves the minimum and maximum values of 4.53 105
and 2.53 3 107 molecules per average bacterium, respectively. Therefore,
bL!103mM"bG!25mM"$bL!10
3mM"bG!210mM"%7310$3;
fM
2kLM!2:533107
mpb"$fM
2klM!4:53105
mpb"%1:94310$1:
The above results indicate that the term bL(Le)bG(Ge) inside the square
brackets of Eq. 41 is approximately constant and equal to 0.39. From this,
and taking into consideration that the steady states L* are given by the rootsS!L&" # 0, with S defined in Eq. 41, it follows that
b
g3 0:39$ fM
2kLM!L&"
' (PR!L&" # L&
(46)
with the control and degradation parameters defined as
b :# PD!Ge"; and g :# gMgEgL
DkMkEkL: (47)
On the other hand, we have from Eq. 42 that the steady-state L* is locally
stable if and only if
b
g3
d
dL0:39$ fM
2kLM!L"
' (PR!L"jL#L& , 1: (48)
To finish, notice that Eqs. 46–48 are completely equivalent to Eqs. 44 and
45.
Why hysteresis?
In this section we argue that hysteresis (multistability) is the only dynamic
behavior compatible with positive feedback, robust stability, and high
amplification factors.Positive feedback is obtained by demanding that P!x". 0 is strictly in-
creasing with respect to x, and robust stability is introduced through a new
safety parameter 0 , p , 1 in Eq. 45,
b
g3
dP!x"dx
jx#x&#p, 1: (49)
The parameters in Eq. 43 vary largely due to changes in the experimentalvariables like temperature, pH, salinity, etc. Hence, robust stability is
obtained by setting the safety bound 0 , p , 1 in Eq. 49; a simple
estimation yields p # 3/4. If the derivative dP!x"=dxjx#x& is very close to
g/b, any fluctuation could make dP!x"=dxjx#x&.g=b, and Eq. 43 willbecome unstable.
Assume that Eq. 43 is monostable, and thus that Eq. 44 has one single
solution (steady state) x*(b) for every external control b . 0. Assume alsothat this steady state is locally stable and satisfies the robust stability
inequality (Eq. 49). Finally, suppose that the external control variable b. 0
lies in the closed interval a# b# b. Notice that x*(b). x*(a), sinceP!x" isstrictly increasing with respect to x. We shall investigate now what therelation between b/a and x*(b)/x*(a) is.Rewrite Eq. 44 under the assumption that the steady-state x*(b) is a functionb . 0
b
g3 P!x&!b"" # x&!b":
Differentiate this equation with respect to b to give
P!x&!b""g
1b
g3
dP!x"dx
jx#x&!b" 3
dx&!b"db
# dx&!b"db
:
Rearranging terms and using the bound in Eq. 49 yields
x&!b"b
# P!x&!b""g
$ !1$ p"dx&!b"db
;
then
dx&!b"x&!b"
#1
1$ p3
db
b:
Finally, integrating in the interval a # b # b, yields
1#x&!b"x&!a"
#b
a
# $ 11$p
: (50)
It follows from the previous results that the hypotheses of monostability,positive feedback, and robust stability, with a safety parameter of p # 3/4,
yield an amplification exponent in Eq. 50 of at most 1/(1 – p) # 4. This
amplification exponent is quite small if we expect large amplification, so we
have to make sacrifices. Presumably, robust stability is not a condition to besacrificed.
A solution for obtaining large amplification exponents in Eq. 50 is to
have a sigmoid function P!x". This allows the derivative dP!x"=dxjx#x& to
be almost zero for two steady states, x*, located outside some interval [x1,x2], with x2 . x1 . 0. Conversely dP!x"=dxjx#x& can be )1 for a third
steady state x* 2 [x1, x2]. The large value of the derivative inside the interval[x1, x2] permits very large amplification exponents. On the other hand, evenwhen the steady state x* 2 [x1, x2] is unstable, the system is still stable
because the large steady state, x* . x2, and the small one, x* , x1, are bothstable.
In conclusion, only if the function P!x" is sigmoid, and the systemequation (Eq. 43) shows bistability, can we simultaneously have very large
amplifications and robust stability.
We thank P. Swain for invaluable comments and suggestions.
This research was supported by the Natural Sciences and EngineeringResearch Council (grant No. OGP-0036920, Canada), Mathematics of
Information Technology and Complex Systems (Canada), Consejo Nacional
de Ciencia y Tecnologıa (CONACyT, Mexico), Comision de Operacion yFomento de Actividades Academicas del Instituto Politecnico Nacional
(COFAA-IPN, Mexico), and Estımulo al Desempeno de la Investigacion del
Instituto Politecnico Nacional (EDI-IPN, Mexico), and partially carried out
while M.S. was visiting McGill University in 2005.
REFERENCES
1. Rietkerk, M., S. F. Dekker, P. C. de Ruiter, and J. van de Koppel.2004. Self-organized patchiness and catastrophic shifts in ecosystems.Science. 305:1926–1929.
2. Ferrell, J. E., Jr., and E.M.Machleder. 1998. The biochemical basis of anall-or-none cell fate switch in Xenopus oocytes. Science. 280:895–898.
3. Bagowski, C. P., and J. E. Ferrell. 2001. Bistability in the JNK cascade.Curr. Biol. 11:1176–1182.
4. Bhalla, U. S., P. T. Ram, and R. Iyengar. 2002. MAP kinasephosphatase as a locus of flexibility in a mitogen-activated proteinkinase signaling network. Science. 297:1018–1023.
5. Cross, F. R., V. Archambault, M. Miller, and M. Klovstad. 2002.Testing a mathematical model of the yeast cell cycle. Mol. Biol. Cell.13:52–70.
Origin of Bistability in the Lac Operon 3841
Biophysical Journal 92(11) 3830–3842

6. Pomerening, J. R., E. D. Sontag, and J. E. Ferrell, Jr. 2003. Buildinga cell cycle oscillator: hysteresis and bistability in the activation ofCdc2. Nat. Cell Biol. 5:346–351.
7. Bagowski, C., J. Besser, C. R. Frey, and J. E. J. J. Ferrell, Jr. 2003. TheJNK cascade as a biochemical switch in mammalian cells: ultrasen-sitive and all-or-none responses. Curr. Biol. 13:315–320.
8. Sha, W., J. Moore, K. Chen, A. D. Lassaletta, C. S. Yi, J. J. Tyson, andJ. C. Sible. 2003. Hysteresis drives cell-cycle transitions in Xenopuslaevis egg extracts. Proc. Natl. Acad. Sci. USA. 100:975–980.
9. Slepchenko, B. M., and M. Terasaki. 2004. Bio-switches: what makesthem robust? Curr. Opin. Genet. Dev. 14:428–434.
10. Chung, J. D., and G. Stephanopoulos. 1996. On physiological mul-tiplicity and population heterogeneity of biological systems. Chem.Eng. Sci. 51:1509–1521.
11. Ferrell, J. E. 2002. Self-perpetuating states in signal transduction:positive feedback, double-negative feedback, and bistability. Curr.Opin. Chem. Biol. 6:140–148.
12. Angeli, D., J. E. Ferrell, Jr., and E. D. Sontag. 2004. Detection ofmultistability, bifurcations, and hysteresis in a large class of biologicalpositive-feedback systems. Proc. Natl. Acad. Sci. USA. 101:1822–1827.
13. Novick, A., and M. Weiner. 1957. Enzyme induction as an all-or-nonephenomenon. Proc. Natl. Acad. Sci. USA. 43:553–566.
14. Cohn, M., and K. Horibata. 1959. Analysis of the differentiation and ofthe heterogeneity within a population of Escherichia coli undergoinginduced beta-galactosidase synthesis. J. Bacteriol. 78:613–623.
15. Maloney, L., and B. Rotman. 1973. Distribution of suboptimallyinduces $D-galactosidase in Escherichia coli. The enzyme content ofindividual cells. J. Mol. Biol. 73:77–91.
16. Wong, P., S. Gladney, and J. D. Keasling. 1997. Mathematical modelof the lac operon: inducer exclusion, catabolite repression, and diauxicgrowth on glucose and lactose. Biotechnol. Prog. 13:132–143.
17. Vilar, J. M., C. C. Guet, and S. Leibler. 2003. Modeling networkdynamics: the lac operon, a case study. J. Cell Biol. 161:471–476.
18. Yildirim, N., and M. C. Mackey. 2003. Feedback regulation in thelactose operon: a mathematical modeling study and comparison withexperimental data. Biophys. J. 84:2841–2851.
19. Santillan, M., and M. C. Mackey. 2004. Influence of cataboliterepression and inducer exclusion on the bistable behavior of the lacoperon. Biophys. J. 86:1282–1292.
20. Yildirim, N., M. Santillan, D. Horike, and M. C. Mackey. 2004.Dynamics and bistability in a reduced model of the lac operon. Chaos.14:279–292.
21. Tian, T., and K. Burrage. 2005. A mathematical model for geneticregulation of the lactose operon. In Lecture Notes in ComputerScience, Vol. 3841. O. Gervasi, M. L. Gavrilova, V. Kumar, A.Lagana, H. P. Lee, Y. Mun, D. Taniar, and C. J. K. Tan, editors.Springer-Verlag, Berlin, Heidelberg.
22. van Hoek, M. J., and P. Hogeweg. 2006. In silico evolved lac operonsexhibit bistability for artificial inducers, but not for lactose. Biophys. J.91:2833–2843.
23. Ozbudak, E. M., M. Thattai, H. N. Lim, B. I. Shraiman, and A. vanOudenaarden. 2004. Multistability in the lactose utilization network ofEscherichia coli. Nature. 427:737–740.
24. Gillespie, D. T. 2001. Approximate accelerated stochastic simulation ofchemically reacting systems. J. Chem. Phys. 115:1716–1733.
25. Gillespie, D. T., and L. R. Petzold. 2003. Improved leap-size selec-tion for accelerated stochastic simulation. J. Chem. Phys. 119:8229–8234.
26. Narang, A., and S. S. Pilyugin. 2007. Bacterial gene regulation indiauxic and non-diauxic growth. J. Theor. Biol. 244:326–348.
27. Roseman, S., and N. D. Meadow. 1990. Signal transduction by thebacterial phosphotransferase system. J. Biol. Chem. 265:2993–2996.
28. Narang, A. 1998. The dynamical analogy between microbial growth onmixtures of substrates and population growth of competing species.Biotechnol. Bioeng. 59:116–121.
29. Dekel, E., and U. Alon. 2005. Optimality and evolutionary tuningof the expression level of a protein. Nature. 436:588–592.
30. Armstrong, E. H. 1922. Some recent developments of regenerativecircuits. Proc. Inst. Radio Eng. 10:244–260.
31. Britain, J. E. 2004. Electrical Engineering Hall of Fame—Edwin H.Armstrong. Proc. IEEE. 92:575–578.
32. Garnsback, H. 1924. The crystodyne principle. Radio News. 431:294–295.
33. Oehler, S., E. R. Eismann, H. Kramer, and B. Muller-Hill. 1990. Thethree operators of lac operon cooperate in repression. EMBO J. 9:973–979.
34. Bremmer, H., and P. P. Dennis. 1996. Modulation of chemicalcomposition and other parameters of the cell by growth rate. InEscherichia coli and Salmonella typhimurium: Cellular and MolecularBiology, Vol. 2. F. C. Neidhart, R. Curtis, J. L. Ingraham, E. C. C. Lin,K. B. Low, B. Magasanik, W. S. Reznikoff, M. Riley, M. Schaechter,and H. E. Umbarger, editors. American Society of Microbiologists,Washington, DC.
35. Malan, T. P., A. Kolb, H. Buc, and W. R. McClure. 1984. Mechanismof CRP-cAMP activation of lac operon transcription initiation activa-tion of the P1 promoter. J. Mol. Biol. 180:881–909.
36. Kennell, D., and H. Riezman. 1977. Transcription and translationinitiation frequencies of the Escherichia coli lac operon. J. Mol. Biol.114:1–21.
37. Beckwith, J. 1987. The lactose operon. In Escherichia coli andSalmonella typhimurium: Cellular and Molecular Biology, Vol. 2.F. C. Neidhart, J. L. Ingraham, K. B. Low, B. Magasanik, and H. E.Umbarger, editors. American Society of Microbiologists, Washington,DC.
38. Martınez-Bilbao, M., R. E. Holdsworth, R. A. Edwards, and R. E.Huber. 1991. A highly reactive b-galactosidase (Escherichia coli)resulting from a substitution of an aspartic acid for Gly-794. J. Biol.Chem. 266:4979–4986.
39. Strelitz, S. 1977. On the Routh-Hurwitz problem. Am. Math. Mon.84:542–544.
3842 Santillan et al.
Biophysical Journal 92(11) 3830–3842
Related Documents