DATA REPORT ORGANOCHLORINE AND METAL CONTAMINANT LEVELS IN HUDSON RIVER AQUATIC INSECTS HUDSON RIVER NATURAL RESOURCE DAMAGE ASSESSMENT HUDSON R IVER NATURAL R ESOURCE TRUSTEES STATE OF NEW YORK U.S. DEPARTMENT OF COMMERCE U.S. DEPARTMENT OF THE INTERIOR SEPTEMBER 2009 Available from: U.S. Department of Commerce National Oceanic and Atmospheric Administration Hudson River NRDA, Lead Administrative Trustee Damage Assessment Center, N/ORR31 1305 East-West Highway, Rm. 10219 Silver Spring, MD 20910-3281

Welcome message from author
This document is posted to help you gain knowledge. Please leave a comment to let me know what you think about it! Share it to your friends and learn new things together.
Transcript

DATA REPORTORGANOCHLORINE AND METAL CONTAMINANT
LEVELS IN HUDSON RIVER AQUATIC INSECTS
HUDSON RIVER NATURAL RESOURCEDAMAGE ASSESSMENT
HUDSON RIVER NATURAL RESOURCE TRUSTEES
STATE OF NEW YORK
U.S. DEPARTMENT OF COMMERCE
U.S. DEPARTMENT OF THE INTERIOR
SEPTEMBER 2009
Available from:U.S. Department of CommerceNational Oceanic and Atmospheric AdministrationHudson River NRDA, Lead Administrative TrusteeDamage Assessment Center, N/ORR311305 East-West Highway, Rm. 10219Silver Spring, MD 20910-3281

HUDS
ON R
IVER
HU
DSO
N R
IVE
R D
AT
A R
EP
OR
T: O
RG
AN
OC
HL
OR
INE
AN
D M
ET
AL
CO
NT
AM
INA
NT
LE
VE
LS
IN H
UD
SON
RIV
ER
AQ
UA
TIC
IN
SEC
TS EXECUTIVE SUMMARYEXECUTIVE SUMMARYEXECUTIVE SUMMARYEXECUTIVE SUMMARYEXECUTIVE SUMMARY
Natural resources of the Hudson River have been contaminated through past and ongoing discharges of polychlorinated biphenyls (PCBs). The Hudson River Natural Resource Trustees - New York State, the U.S. Department of Commerce, and the U.S. Department of the Interior - are conducting a natural resource damage assessment (NRDA) to assess and restore those natural resources injured by PCBs. Previous studies have documented elevated PCB levels in sediment and tree swallows (Tachycineta bicolor) adults, eggs, and nestlings from the Upper Hudson River. Since tree swallows prey on emerging aquatic insects, the Trustees collected emerging adult aquatic insects at four sites along the Hudson River to determine PCB contamination levels in aquatic insects to complete the contaminant pathway from sediment to tree swallows. In addition, the Trustees measured concentrations of other organochlorine compounds and metals in adult aquatic insects.
In May through June 1998, emerging adult aquatic insects were collected from Remnant Area 4, Special Area 13, Saratoga National Historic Park, and the Village of Chelsea using black-light funnel traps. Samples were sorted to exclude insects without aquatic larval stages or that were not prey items of tree swallows. Once sorted, samples were homogenized, divided into five sub-samples, and analyzed for PCBs, select metals, and select organochlorine pesticides. Metals were detected in most samples but do not exhibit spatial patterns related to proximity to the two General Electric (GE) plant sites at Hudson Falls and Ft. Edward where PCBs were released to the river. Many of the organochlorine pesticides that were tested for were not detected in the aquatic insect samples. With the exception of hexachlorobenzene and beta-HCH, most detectable organochlorine pesticides were higher in samples from the Hudson River Estuary (Chelsea) than from the Upper Hudson River (Remnant Area 4, Special Area 13, and Saratoga National Historic Park). Total PCB concentrations in adult aquatic insects were related to sample site and proximity to the GE plant sites, and exhibited similar spatial patterns to those previously observed in Hudson River fish. PCB homologue distributions were similar for the three Upper Hudson River sites and distinctively different for the site in the Hudson River Estuary. These patterns are also similar to what has been observed in Hudson River fish. PCB concentrations in adult aquatic insects demonstrate a pathway from PCBs in the sediment up the food web to insects and into tree swallows, which rely on emerging insects from the river as a primary food source.
This study shows a contaminant pathway of PCBs from contaminated Hudson River sediments to adult aquatic insects to tree swallows. A similar pathway would exist for other insectivorous invertebrates and vertebrates, both aquatic and terrestrial, exposed to PCBs through their diet of insects.
HUDSON RIVER DATA REPORT: ORGANOCHLORINE AND METAL CONTAMINANT LEVELS IN
HUDSON RIVER AQUATIC INSECTS

HUDSON RIVERH
UD
SON
RIV
ER D
AT
A RE
PO
RT: O
RG
AN
OC
HL
OR
INE
AN
D M
ET
AL
CO
NT
AM
INA
NT L
EV
EL
S IN H
UD
SON
RIV
ER A
QU
AT
IC INSE
CT
S
TABLE OF CONTENTS
1.0 Introduction .................................................................................................................................................... 1
2.0 Scope of Work .............................................................................................................................................. 2
2.1 COLLECTION OF SPECIMENS ........................................................................................... 2
2.1.1 SAMPLING SITES ............................................................................................................ 2
2.1.2 SAMPLE COLLECTION ................................................................................................ 2
2.2 SAMPLE PREPARATION ......................................................................................................... 3
2.3 CHEMICAL ANALYSIS ............................................................................................................. 4
2.4 QUALITY ASSURANCE/QUALITY CONTROL .............................................................. 7
3.0 Results ............................................................................................................................................................. 8
3.1 DATA SHEETS ............................................................................................................................ 8
3.2 METAL CONCENTRATIONS................................................................................................ 9
3.3 ORGANOCHLORINE PESTICIDES .................................................................................. 10
3.4 PCBS .............................................................................................................................................. 12
3.4.1 TOTAL PCBS ................................................................................................................... 12
3.4.2 PCB AROCLORS ............................................................................................................. 12
3.4.3 PCB HOMOLOGUES AND CONGENERS .......................................................... 12
4.0 Discussion ................................................................................................................................................... 13
4.1 METALS ........................................................................................................................................ 13
4.2 ORGANOCHLORINE PESTICIDES ................................................................................... 13
4.3 PCBS .............................................................................................................................................. 14
5.0 Summary and Conclusion .................................................................................................................... 14
6.0 References .................................................................................................................................................. 16
Figures ................................................................................................................................................................ 19
APPENDIX A: 1998 ADULT AQUATIC INSECT FIELD COLLECTION RECORD
APPENDIX B: 1998 ADULT AQUATIC INSECT SAMPLE PREPARATION RECORD
APPENDIX C: 1998 ADULT AQUATIC INSECT CHAIN OF CUSTODY RECORD
APPENDIX D: 1998 ADULT AQUATIC INSECT HISTORICAL DATA REVIEW
APPENDIX E: 1998 ADULT AQUATIC INSECT DATA SHEETS
HUDSON RIVER DATA REPORT: ORGANOCHLORINE AND METAL CONTAMINANT LEVELS IN
HUDSON RIVER AQUATIC INSECTS

HUDS
ON R
IVER
HU
DSO
N R
IVE
R D
AT
A R
EP
OR
T: O
RG
AN
OC
HL
OR
INE
AN
D M
ET
AL
CO
NT
AM
INA
NT
LE
VE
LS
IN H
UD
SON
RIV
ER
AQ
UA
TIC
IN
SEC
TS
HUDSON RIVER DATA REPORT: ORGANOCHLORINE AND METAL CONTAMINANT LEVELS IN
HUDSON RIVER AQUATIC INSECTS

1.0 INTRODUCTION1.0 INTRODUCTION1.01.01.0 INTRODUCTIONINTRODUCTIONINTRODUCTION
Past and continuing discharges of polychlorinated biphenyls (PCBs) have contaminated the natural resources of the Hudson River. The Hudson River Natural Resource Trustees (Trustees) - New York State, the U.S. Department of Commerce, and the U.S. Department of the Interior - are conducting a natural resource damage assessment (NRDA) to assess and restore those natural resources injured by PCBs (Hudson River Natural Resource Trustees 2002a). This Data Report provides the results a preliminary investigation of organochlorine and metals contamination in adult aquatic insects emerging from the Hudson River.
The nymphs and larvae of many flying insects, including mayflies, caddisflies, and midges, are aquatic during these life stages. Eventually, an aquatic larval insect will pupate and emerge into a winged adult form or a nymph will molt into a winged adult (or sub-adult) form and then leave the water. For this report, an "adult emerging aquatic insect" refers to an insect with an aquatic life stage that has emerged from the Hudson River into its adult flying life stage. Often these adult emerging aquatic insects spend the majority of their life cycles in the aquatic life stages. While in the water, these insects are living on or in the sediment, placing them in direct contact with any sediment associated contamination. Therefore, emerging aquatic insects can be an important pathway for moving contaminants from aquatic to terrestrial systems (Fairchild et al. 1992).
PCB contamination in the sediment of the Upper Hudson River is well documented, but other organochlorine compounds and metals in the Hudson River system also have the potential to bioaccumulate in the aquatic food web and have been less studied. In contaminant studies, tree swallows (Tachycineta bicolor) are commonly used as indicators of local sediment contamination because they forage near their nest sites and feed primarily on emerging insects that have aquatic life stages (Blancher and McNichol 1991, Quinney and Ankney 1985, St. Louis et al. 1990). Several studies have investigated the bioaccumulation of PCBs in tissues of tree swallows and PCB effects on tree swallow breeding biology from PCB (Custer et al. 1998, Custer et al. 2003, Froese et al. 1998, Maul at al. 2006, Papp et al. 2005). On the Hudson River, levels of PCBs in tree swallow eggs, tissues of newborn chicks, and in growing nestlings indicated that contaminants are passed to them directly from their parents and through the foods that they are fed (Echols et al. 2004, McCarty and Secord 1999, and Secord et al. 1999). Since tree swallows feed on emerging insects, knowing PCB concentrations in emerging insects is an important step in connecting the pathway from contaminants in Hudson River sediments to contaminants observed in tree swallow adults, eggs, and nestlings. A few studies have examined PCB concentrations in aquatic insect larvae from the Hudson River (Bush et al. 1985, Novak et al. 1988, Novak et al. 1990), but few data are available on PCBs, organochlorine pesticides, or metal concentrations in the adult life stages. Like aquatic insect larvae, adult aquatic insects have been shown to be reliable indicators of sediment contamination (Ciborowski and Corkum 1988, Kovats and Ciborowski 1989, Kovats and Ciborowski 1993, Mauck and Olson 1977). This preliminary investigation was designed to help document the contaminant pathway from sediment to tree swallows by sampling adult aquatic insects from the Hudson River in areas adjacent to previously studied tree swallow colonies.
In May through July 1998, the Trustees collected emerging adult aquatic insects at four sites along the Hudson River between Hudson Falls, NY and Chelsea, NY. This work was undertaken by the Trustees to identify contaminants, including PCBs, in aquatic insects of the Hudson River and to document the pathway of contaminants, particularly PCBs, from the sediments to biological resources, such as tree swallows. This work may potentially be used to design future studies to further assess pathways from aquatic to terrestrial ecosystems.
HUDSON RIVERH
UD
SON
RIV
ER D
AT
A RE
PP
RT: O
RG
AN
OC
HL
OR
INE
AN
D M
ET
AL
CO
NT
AM
INA
NT L
EV
EL
S IN H
UD
SON
RIV
ER A
QU
AT
IC INSE
CT
S
HUDSON RIVER DATA REPORT: ORGANOCHLORINE AND METAL CONTAMINANT LEVELS IN
HUDSON RIVER AQUATIC INSECTS
1

HUDS
ON R
IVER
HU
DSO
N R
IVE
R D
AT
A R
EP
OR
T: O
RG
AN
OC
HL
OR
INE
AN
D M
ET
AL
CO
NT
AM
INA
NT
LE
VE
LS
IN H
UD
SON
RIV
ER
AQ
UA
TIC
IN
SEC
TS
2.0 SCOPE OF WORK2.0 SCOPE OF WORK2.02.02.0 SCOPE OF WORKSCOPE OF WORKSCOPE OF WORK
2.1 C2.1 C2.1 C2.1 C2.1 COLLECTIONOLLECTIONOLLECTIONOLLECTIONOLLECTION OFOFOFOFOF SSSSSPECIMENSPECIMENSPECIMENSPECIMENSPECIMENS
2.1.1 SAMPLING SITES
Four sampling locations along the Hudson River were selected for adult aquatic insect collections between Hudson Falls, NY and Chelsea, NY (Figure 1). The sampling sites used in this investigation are as follows:
Site Name Location 1 HRI-98-1 Remnant 4 2 HRI-98-2 Special Area 13 3 HRI-98-3 Saratoga National Historic Park 4 HRI-98-4 Chelsea
The Upper Hudson River sites (Sites 1-3) were selected to correspond with previously established tree swallow colonies. Site 4 was selected to assess how organochlorine and metal concentrations in adult aquatic insects differ between the upper Hudson River above the Federal Dam at Troy and the Hudson River Estuary.
Remnant 4 (Site 1) is located in the Town of Moreau, Saratoga County, approximately 1.5 mile downstream of the former GE Hudson Falls plant and near the former outfall of the GE Ft. Edward plant (Figure 2a). Special Area 13 (Site 2) is located in the Town of Moreau, Saratoga County, approximately 3 miles downstream of the Hudson Falls plant (Figure 2b). Saratoga National Historic Park (Saratoga NHP, Site 3) is located in the Town of Stillwater, Saratoga County approximately 23 miles downstream of the Hudson Falls plant (Figure 2c). Chelsea (Site 4) is located in the Village of Chelsea, Duchess County, approximately 130 miles downstream of the Hudson Falls plant (Figure 2d).
2.1.2 SAMPLE COLLECTION
Adult aquatic insects were collected using BioQuip® terrestrial black light traps powered by 12-volt DC current and designed to capture nocturnal flying insects. At each sampling location, two traps were deployed as close to the surface of the river as possible in order to collect recently emerged insects. The two samplers were placed approximately 40 feet apart. Collections began at dusk and ran until 1.5 hours after dark.
The traps consisted of a five gallon plastic bucket with an aluminum funnel fitted directly into the bucket with the small end of the funnel near the bottom of the bucket. The bucket was lined with aluminum foil to prevent contamination from substances adhered to the plastic bucket. A light source (12-volt fluorescent black light) was supported by a plexiglass tripod vane structure above the funnel. An aluminum lid was placed over the light assembly and held in place with bungee cords. Insects attracted to the light were subsequently trapped in the bucket below.
Prior to each sampling effort, the plexiglass vanes, funnel, and aluminum foil components of the sampling devices were rinsed with hexane to minimize contamination of the samples to be collected. Field personnel wore latex gloves at all times while handling, deploying and retrieving the sampling equipment. If gloved hands came in contact with river water, riverbank soils or other sources of contamination, the contaminated gloves were immediately discarded and replaced with clean gloves prior to handling the sampling equipment. Following the collection period the light and vanes were removed from the light trap and the aluminum lid securely fastened to the top of the bucket, with the funnel left in place.
HUDSON RIVER DATA REPORT: ORGANOCHLORINE AND METAL CONTAMINANT LEVELS IN
HUDSON RIVER AQUATIC INSECTS
2

The following data was recorded on a Field Collection Record (Appendix A) for each sample collected:
a. Sample number
b. Date and time period of collection
c. Study site name
d. Method of collection
e. Study site location (distance from river bank and distance and direction from nearest prominent and identifiable landmark)
f. Habitat description (vegetative community type, dominant vegetation, river conditions)
g. Environmental conditions (air temperature, wind, cloud cover, moon phase, etc.)
h. Comments
i. Name of collector(s).
The sample was tagged, dated, and assigned an identification number corresponding to the study location as soon as it was collected. Samples were frozen as soon as practicable and kept frozen until being processed at NYSDEC Hale Creek Field Station.
2.2 S2.2 S2.2 S2.2 S2.2 SAMPLEAMPLEAMPLEAMPLEAMPLE PPPPPREPREPREPREPREPARAARAARAARAARATIONTIONTIONTIONTION
All samples were frozen as soon as practicable after collection and kept frozen in a locked freezer until processing at NYSDEC Hale Creek Field Station. The field samples were thawed and a small sub-sample of adults from each taxonomic group was preserved in alcohol for potential later identification to lowest possible taxonomic level. The field samples were examined and sorted to exclude all insects of terrestrial origin and adult insects of aquatic origin that are not prey items of tree swallows (e.g., whirligig beetles, backswimmers, etc.). Once sorted, samples were weighed to the nearest 0.1 gram and the total wet-weight of the sorted sample was recorded.
Five sub-samples of approximately equal weight were made from the sorted sample from each of the sample locations. Prior to sub-sampling, sorted samples were homogenized using a blender. When sub-sampling was not possible immediately following sorting, the sample was re-frozen until sub-sampling was practicable (period not to exceed two months). Previously frozen samples were thawed and re-hydrated (as necessary) to original wet weight using deionized water before homogenizing. Each sample was composed of approximately 5-10 grams (minimum of 4 grams) of adult aquatic insects weighed to the nearest 0.01 gram. Each sub-sample was placed in a separate hexane-rinsed glass jar and immediately re-frozen. Sub-samples were identified using the sample location number followed by sequential upper-case letters (e.g., HRI-98-1A, HRI-98-1B, etc.). Samples were stored in a locked freezer except for when samples were being prepared or being transported to the designated laboratory.
The following data were recorded on a Sample Preparation Record (Appendix B) for each sub-sample prepared for shipment to the analytical laboratory:
a. Sample number
b. Study site name
c. Total wet weight of sorted sample (measured to nearest 0.1 gram)
d. Comments
e. Date sample is sorted
HUDSON RIVERH
UD
SON
RIV
ER D
AT
A RE
PP
RT: O
RG
AN
OC
HL
OR
INE
AN
D M
ET
AL
CO
NT
AM
INA
NT L
EV
EL
S IN H
UD
SON
RIV
ER A
QU
AT
IC INSE
CT
S
HUDSON RIVER DATA REPORT: ORGANOCHLORINE AND METAL CONTAMINANT LEVELS IN
HUDSON RIVER AQUATIC INSECTS
3

HUDS
ON R
IVER
HU
DSO
N R
IVE
R D
AT
A R
EP
OR
T: O
RG
AN
OC
HL
OR
INE
AN
D M
ET
AL
CO
NT
AM
INA
NT
LE
VE
LS
IN H
UD
SON
RIV
ER
AQ
UA
TIC
IN
SEC
TS f. Name of sample sorter(s)
g. Date sample was homogenized/sub-sampled
h. Name of sub-sample preparer(s)
i. Sub-sample number
j. Wet-weight of sub-samples (measured to nearest 0.01 gram)
During transport, the samples were kept frozen in a secured ice chest or shipping container. The completed form entitled Chain of Custody Record (Appendix C) accompanied all processed sub-samples. Samples were stored in a locked freezer except when samples were being prepared or being transported to the designated laboratory.
2.3 C2.3 C2.3 C2.3 C2.3 CHEMICALHEMICALHEMICALHEMICALHEMICAL AAAAANALNALNALNALNALYSISYSISYSISYSISYSIS
A total of 20 sub-samples (5 sub-samples from each of the 4 sample sites) were submitted for analysis. Adult aquatic insect samples were analyzed for percent lipids, 124 PCB congeners (some of which are coeluters for a total of 100 congener peaks; Table 1), PCB Aroclors, organochlorine pesticides, and select metals. The samples were analyzed by Axys Analytical Services, Ltd., Sidney, British Columbia, Canada for PCBs, organochlorine pesticides, and percent lipids and by Frontier Geosciences, Seattle, Washington, for metals and percent moisture.
The analytical methods used are those listed below.
Parameter Analytical Method Reference
Lipids Axys Analytical Services, Ltd. SOP PCB congeners Axys Analytical Services, Ltd. SOP (124 congeners as provided in Table 1) PCB (by Aroclor) Aldrin BHC isomers (4) Chlordane compounds (4) DDT and metabolites Dieldrin EPA 8080 Endrin Heptachlor Heptachlor epoxide Mirex Photomirex Hexachlorobenzene Mercury EPA 7470 Lead EPA 7421 Cadmium EPA 7131 Chromium EPA 7191 Moisture Frontier Geosciences, SOP
HUDSON RIVER DATA REPORT: ORGANOCHLORINE AND METAL CONTAMINANT LEVELS IN
HUDSON RIVER AQUATIC INSECTS
4

Table 1. Polychlorinated biphenyl (PCB) congeners analyzed in adult aquatic insects along the
Hudson River, NY.
Ballschmiter and Zell (1994) and IUPAC Number Congener Type
PCB-6 di
PCB-4/10 di
PCB-7/9 di
PCB-8/5 di
PCB-15 di
PCB-19 tri
PCB-18 tri
PCB-17 tri
PCB-24/27 tri
PCB-16/32 tri
PCB-26 tri
PCB-25 tri
PCB-31/28 tri
PCB-33 /20 tri
PCB-22 tri
PCB-37 tri
PCB-53 tetra
PCB-45 tetra
PCB-46 tetra
PCB-52 tetra
PCB-49 tetra
PCB-47/48 tetra
PCB-44 tetra
PCB-42 tetra
PCB-41/71/64 tetra
PCB-40 tetra
PCB-74 /61 tetra
PCB-70/76 tetra
PCB-66 /80 tetra
PCB-81 tetra
PCB-56/60 tetra
PCB-77 tetra
PCB-95 penta
PCB-119 penta
HUDSON RIVERH
UD
SON
RIV
ER D
AT
A RE
PP
RT: O
RG
AN
OC
HL
OR
INE
AN
D M
ET
AL
CO
NT
AM
INA
NT L
EV
EL
S IN H
UD
SON
RIV
ER A
QU
AT
IC INSE
CT
S
HUDSON RIVER DATA REPORT: ORGANOCHLORINE AND METAL CONTAMINANT LEVELS IN
HUDSON RIVER AQUATIC INSECTS
5

HUDS
ON R
IVER
HU
DSO
N R
IVE
R D
AT
A R
EP
OR
T: O
RG
AN
OC
HL
OR
INE
AN
D M
ET
AL
CO
NT
AM
INA
NT
LE
VE
LS
IN H
UD
SON
RIV
ER
AQ
UA
TIC
IN
SEC
TS PCB-91 penta
PCB-84 penta
PCB-90/101/89 penta
PCB-99 penta
PCB-83 penta
PCB-97 /86 penta
PCB-87 penta
PCB-85 penta
PCB-110 penta
PCB-82 penta
PCB-107 penta
PCB-114 penta
PCB-126 penta
PCB-136 hexa
PCB-151 hexa
PCB-144/135 hexa
PCB-149 hexa
PCB-134 /143 hexa
PCB-131 hexa
PCB-146 hexa
PCB-118 hexa
PCB-123 hexa
PCB-105 hexa
PCB-153 hexa
PCB-132/168 hexa
PCB-141 hexa
PCB-130 hexa
PCB-137 hexa
PCB-138 hexa
PCB-158 hexa
PCB-129 hexa
PCB-128 hexa
PCB-167 hexa
PCB-156 hexa
PCB-157 hexa
PCB-169 hexa
PCB-184 hepta
PCB-179 hepta
PCB-176 hepta
PCB-178 hepta
PCB-175 hepta
PCB-187/182 hepta
HUDSON RIVER DATA REPORT: ORGANOCHLORINE AND METAL CONTAMINANT LEVELS IN
HUDSON RIVER AQUATIC INSECTS
6

PCB-183 hepta
PCB-185 hepta
PCB-174 /181 hepta
PCB-177 hepta
PCB-171 hepta
PCB-172 hepta
PCB-180 hepta
PCB-193 hepta
PCB-191 hepta
PCB-170 /190 hepta
PCB-189 hepta
PCB-201 (BZ#200) octa
PCB-197 octa
PCB-200 (BZ#199) octa
PCB-198 octa
PCB-199 (BZ#201) octa
PCB-196/203 octa
PCB-195 octa
PCB-194 octa
PCB-205 octa
PCB-208 nona
PCB-207 nona
PCB-206 nona
PCB-209 deca
HUDSON RIVERH
UD
SON
RIV
ER D
AT
A RE
PP
RT: O
RG
AN
OC
HL
OR
INE
AN
D M
ET
AL
CO
NT
AM
INA
NT L
EV
EL
S IN H
UD
SON
RIV
ER A
QU
AT
IC INSE
CT
S
2 . 42 . 42 . 42 . 42 . 4 QQQQQUALITYUALITYUALITYUALITYUALITY AAAAASSURANCESSURANCESSURANCESSURANCESSURANCE / Q/ Q/ Q/ Q/ QUALITYUALITYUALITYUALITYUALITY CCCCCONTROLONTROLONTROLONTROLONTROL
Data validation was based on method performance criteria and quality control (QC) criteria documented in the Trustee's Analytical Quality Assurance Plan (QAP; Hudson River Natural Resource Damage Trustees 2002b), U.S. Environmental Protection Agency (USEPA) National Functional Guidelines for Organic Data Review (USEPA 1999), and the laboratory standard operating procedures (SOPs) when available.
The following QC elements were reviewed for all data packages: • Chain of custody and sample handling• Laboratory deliverables and documentation practices• Initial and continuing calibration (from summary forms and raw data)• Laboratory preparation blank contamination (from summary forms)• Analytical accuracy (as appropriate to method): surrogate recovery, laboratory control
samples (LCS), ongoing precision and recovery (OPC) samples, matrix spike (MS) samples, certified reference material (CRM) results (from summary forms and raw data)
HUDSON RIVER DATA REPORT: ORGANOCHLORINE AND METAL CONTAMINANT LEVELS IN
HUDSON RIVER AQUATIC INSECTS
7

HUDS
ON R
IVER
HU
DSO
N R
IVE
R D
AT
A R
EP
OR
T: O
RG
AN
OC
HL
OR
INE
AN
D M
ET
AL
CO
NT
AM
INA
NT
LE
VE
LS
IN H
UD
SON
RIV
ER
AQ
UA
TIC
IN
SEC
TS
3.0 RESUL3.0 RESUL3.0 RESUL3.03.0 RESULRESULTSTSTSTSTS
3.13.13.13.13.1 DDDDDAAAAATTTTTAAAAA SSSSSHEEHEEHEEHEEHEETSTSTSTSTS
The Adult Aquatic Insect Data Sheets (Appendix E) provide the complete results of the analyses. The data sheets contain the following fields:
Sampling Date - mm/dd/yy
Field ID - Field IDs were created using the format HRI -98-01A, where "HRI" refers to Hudson River insects, "98" refers to the year the sample was collected (1998), "01" refers to the sample site number, and "A" refers to the sub-sample.
Laboratory ID - "Laboratory ID" refers to the ID assigned by Axys Analytical to samples analyzed for PCBs and organochlorine pesticides.
Analyte - The PCB Aroclor, PCB congener, organochlorine pesticide, or metal analyzed.
Value - Analytical result.
Interpretative Qualifier - This field contains qualifiers applied, where necessary, to each data point by the laboratory and after the data validation process. The qualifiers are defined as follows:
HUDSON RIVER DATA REPORT: ORGANOCHLORINE AND METAL CONTAMINANT LEVELS IN
• Analytical precision: laboratory replicate analyses (from summary forms and raw data)• Analyte identifications and quantitations (from summary forms and raw data)
Analyses from this investigation predate the QAP. As a result, some information was not available and the following QAP criteria could not be evaluated:
PCB/organochlorine pesticide • No GC/MS performance checks (“tunes”) were submitted • No initial calibration (ICAL) data were submitted• No MS samples were analyzed• No reference materials (RM) were analyzed• No breakdown checks for 4,4’-DDT or endrin were performed • Internal standard for the electron capture detector (ECD) could not be evaluated
Metals analysis
• The inductively coupled plasma - mass spectrometer (ICP-MS) tune data were not submitted
Appendix D contains the report of the historical data review and validation. Of the 2,600 data points submitted by Axys Analytical, two results were not reported and 19 results were rejected (R), leaving 2,579 usable results, for a completeness of 99%. Of these usable results, 98 results were estimated (J), 162 results were qualified as not detected (U), and 80 results were qualified as tentatively identified and estimated (NJ). Some results were both estimated (J) and qualified as not detected (U), so the total number of qualified results is less than the sum of these three. Out of 2,579 usable results reported by Axys, a total of 331 (12.9%) data points were qualified. Of the 80 data points submitted by Frontier Geosciences, 36 (45%) data points were estimated (J). None were rejected. Overall, of the 2,680 data points submitted, 21 were rejected (R), leaving 2,659 usable data points. Of these, 367 (13.8%) were qualified. The overall quality of this data is acceptable and these results, as qualified, are considered usable.
HUDSON RIVER AQUATIC INSECTS
8

U Not detected: Analyte was not detected. The associated value represents the detection limit.
J Estimated: The associated numerical value is an estimated quantity. The analyte was detected, but the reported value may not be accurate or precise. The "J" qualification indicates the data fell outside the QC limits, but the exceedance was not sufficient to cause rejection of the data.
UJ Estimated/Not detected: An analysis was performed for the compound or analyte, but it was not detected and the sample quantitation or detection limit may be inaccurate or imprecise. The associated numerical result is the detection limit.
NJ Tentatively Identified/Estimated: The analyte was tentatively identified and the associated numerical value is an estimated quantity.
Reasons for qualification are explained further in the Data Quality Assessment Report (Appendix D).
Qualifier Reason Code - Codes explaining data flagged during data validation. The reason codes are defined as follows:
3 Compound confirmation not performed
5A Initial Calibration not performed
7 Blank Contamination
9 Laboratory Duplicate Precision (RPD > 30%)
10 LCS (percent recovery outside MQO )
13 Surrogate (percent recovery outside MQO)
14 Other (see data validation report)
21 Potential False Positive
Detection Limit - The analytical limit below which an analyte cannot be detected.
Units - The unit of measurement of the analytical result (e.g., ng/g).
For the purpose of reporting PCB, organochlorine pesticide, and metal results in the text, tables, and figures included in this report, all values flagged with either a U or UJ qualifier (that is, not detected; see Appendix E) were considered to be zero. Using zero, rather than the value reported by the laboratory for the analyte, which represents the detection limit for the analysis, potentially underreports the true value, but avoids over-reporting the true value. This is thus a conservative result; the actual concentrations could be higher.
3.2 M3.2 M3.2 M3.2 M3.2 MEEEEETTTTTALALALALAL CCCCCONCENTRAONCENTRAONCENTRAONCENTRAONCENTRATIONSTIONSTIONSTIONSTIONS
Cadmium concentrations in adult aquatic insects from the three sites in the Upper Hudson River (Sites 1-3) ranged from 0.041-0.088 mg/kg (wet weight). Cadmium concentrations at Site 4 located in the tidal portion of the Hudson River were higher than those in the Upper Hudson River and ranged from 0.177-0.200 mg/kg (wet weight). Chromium concentration in adult aquatic insects from Sites 1-3 ranged from 0.027-0.317 mg/kg (wet weight). Chromium concentration at Site 4 ranged from 0.040-0.088 mg/kg (wet weight). Lead concentration at Sites 1-3 ranged from 0.088-0.376 mg/ kg (wet weight). Lead concentrations at Site 4 ranged from 0.144-1.061 mg/kg (wet weight). Mercury concentrations at Sites 1-3 ranged from 0.028-0.050 mg/kg (wet weight). Mercury concentrations at Site 4 ranged from 0.027-0.033 mg/kg (wet weight) (Table 2).
HUDSON RIVERH
UD
SON
RIV
ER D
AT
A RE
PP
RT: O
RG
AN
OC
HL
OR
INE
AN
D M
ET
AL
CO
NT
AM
INA
NT L
EV
EL
S IN H
UD
SON
RIV
ER A
QU
AT
IC INSE
CT
S
HUDSON RIVER DATA REPORT: ORGANOCHLORINE AND METAL CONTAMINANT LEVELS IN
HUDSON RIVER AQUATIC INSECTS
9

HUDS
ON R
IVER
HU
DSO
N R
IVE
R D
AT
A R
EP
OR
T: O
RG
AN
OC
HL
OR
INE
AN
D M
ET
AL
CO
NT
AM
INA
NT
LE
VE
LS
IN H
UD
SON
RIV
ER
AQ
UA
TIC
IN
SEC
TS
3.3 O3.3 O3.3 O3.3 O3.3 ORGANOCHLORINERGANOCHLORINERGANOCHLORINERGANOCHLORINERGANOCHLORINE PPPPPESTICIDESESTICIDESESTICIDESESTICIDESESTICIDES
Many of the selected organochlorine pesticides were not detected in the adult aquatic insect samples (Table 3). Hexachlorobenzene was highest at Sites 1 and 2 and not detected in Site 4 (Figure 5a). Site 2 had the only detectable levels of BHC isomers (alpha and beta; Figure 5b). Oxychlordane was detected at Sites 13, but not at Site 4, while alpha-Chlordane (cis-) displayed an increasing trend with distance away from the PCB source at Hudson Falls and Ft. Edward (Figure 5c). Dieldrin concentrations were noticeably higher
HUDSON RIVER DATA REPORT: ORGANOCHLORINE AND METAL CONTAMINANT LEVELS IN
HUDSON RIVER AQUATIC INSECTS
Metal concentrations in adult aquatic insects exhibited some noticeable variation with regards to sample location. Cadmium concentrations were higher at Site 4 than at Sites 1-3 (Figure 3a). Chromium concentrations tended to increase slightly at Site 2 and Site 3 (Figure 3b). Lead concentrations appeared to be higher at Site 4 than at the Upper Hudson River sites (Figure 3c). Mercury concentrations were higher at Sites 1 and 3 than at Sites 2 and 4, but the differences, amounted to only 0.01 mg/kg (Figure 3d). Cadmium concentrations in the insect samples increased with distance downriver (Figure 4a). Chromium and lead concentrations were poorly correlated with sample site with no clear concentration gradient (Figures 4b and 4c). Mercury concentrations in the insect samples appeared to decrease with distance downriver, but the relationship was not significant (Figure 4d).
Table 2. Summary of metal concentrations (mg/kg wet weight) in adult aquatic insect samples from
four sample sites along the Hudson River. Site 1 is Remnant Area 4, Site 2 is Special Area 13, Site 3 is
Saratoga NHP, and Site 4 is Chelsea Marina.
Metal Concentration Conc. Average ±1 Site Metal n Range (mg/kg) Std. Dev. (mg/kg)
1 Cd 5 0.041-0.048 0.044±0.003
Cr 4 0.08-0.095 0.088±0.007
Pb 5 0.096-0.142 0.108±0.019
Hg 5 0.037-0.041 0.039±0.002
2 Cd 5 0.062-0.082 0.075±0.009
Cr 5 0.027-0.317 0.137±0.118
Pb 5 0.216-0.376 0.259±0.068
Hg 5 0.028-0.031 0.030±0.001
3 Cd 5 0.065-0.088 0.078±0.012
Cr 5 0.081-0.288 0.151±0.082
Pb 5 0.088-0.145 0.120±0.023
Hg 5 0.034-0.050 0.040±0.006
4 Cd 5 0.177-0.200 0.188±0.010
Cr 2 0.04-0.088 0.064±0.034
Pb 5 0.144-1.061 0.345±0.040
Hg 5 0.027-0.033 0.030±0.002
10

at Site 4 than at the three Upper Hudson River sites (Figure 5d). The most prominent DDT metabolite was p,p'-DDE (Figure 6a), which also displayed an increasing trend with distance away from the PCB source at Hudson Falls and Ft. Edward (Figure 7). The other DDT metabolites displayed a similar trend although at noticeably lower concentrations (Figure 6b).
Table 3. Organochlorine pesticides analyzed in adult aquatic insect samples taken from four sites
along the Hudson River. Site 1=Remnant Area 4, Site 2=Special Area 13, Site 3=Saratoga National
Historic Park, Site 4=Chelsea Marina. ND=non-detect and n=number of detects out of 5 sub-samples.
Organochlorine concentrations are expressed as ng/g wet weight
Sample Site Analyte 1 2 3 4
range n range n range n range n Aldrin ND 0 ND 0 ND 0 ND 0 BHC isomers
alpha HCH 0.35 1 0.35 1 ND 0 ND 0 beta HCH ND 0 ND 0 ND 0 ND 0 delta HCH ND 0 ND 0 ND 0 ND 0 gamma HCH ND 0 3.1 1 ND 0 ND 0
Chlordane compounds Oxychlordane ND 0 ND 0 ND 0 ND 0 alpha-Chlordane (cis-) 0.20-0.21 2 0.23-0.38 5 0.22-0.28 3 ND 0 gamma-Chlordane (trans-) ND 0 ND 0 ND 0 ND 0 trans-Nonachlor 0.34-0.47 5 0.46-0.56 5 0.39-0.62 5 0.54-0.95 5
DDT and metabolites o,p'-DDD 0.10-0.14 3 0.09-0.11 3 0.16-0.24 2 0.20-0.83 4 p,p'-DDD 0.48-0.71 5 0.29-0.33 4 0.27-0.30 3 0.78-1.3 5 o,p'-DDE 0.13 1 0.10-0.16 5 0.13-0.16 4 0.36-0.75 3 p,p'-DDE 6.2-6.9 5 5.5-5.9 5 6.1-7.4 5 27-150 5 o,p'-DDT 0.21-0.26 5 0.17-0.21 5 0.16-0.54 5 0.29-1.8 5 p,p'-DDT 0.42-0.53 5 0.43-0.55 5 0.42-0.68 4 0.68-1.1 5
Dieldrin 0.24-0.34 5 0.40-0.57 5 0.39-0.48 5 0.66-4.9 5 Endrin ND 0 ND 0 ND 0 ND 0 Heptachlor ND 0 ND 0 ND 0 ND 0 Heptachlor Epoxide ND 0 ND 0 ND 0 ND 0 Hexachlorobenzene 0.53-0.59 5 0.57-0.70 4 0.43 1 ND 0 Mirex ND 0 ND 0 ND 0 ND 0
HUDSON RIVERH
UD
SON
RIV
ER D
AT
A RE
PP
RT: O
RG
AN
OC
HL
OR
INE
AN
D M
ET
AL
CO
NT
AM
INA
NT L
EV
EL
S IN H
UD
SON
RIV
ER A
QU
AT
IC INSE
CT
S
HUDSON RIVER DATA REPORT: ORGANOCHLORINE AND METAL CONTAMINANT LEVELS IN
HUDSON RIVER AQUATIC INSECTS
11

HUDS
ON R
IVER
HU
DSO
N R
IVE
R D
AT
A R
EP
OR
T: O
RG
AN
OC
HL
OR
INE
AN
D M
ET
AL
CO
NT
AM
INA
NT
LE
VE
LS
IN H
UD
SON
RIV
ER
AQ
UA
TIC
IN
SEC
TS
and Site 2 and decreasing slightly between Site 2 and Site 3. Aroclor 1260 also displayed a similar trend, but concentrations were approximately one-tenth those of Aroclors 1242 and 1254. Site 4 displayed the lowest Aroclor concentrations of the four sample sites (Figure 11).
Measurements of Aroclors may not accurately reflect the hazards posed to organisms from exposure to PCBs, and congener specific analysis is widely recognized to be a more accurate measurement of total PCBs and exposure risk (Valoppi et al. 2000). However, Aroclor analysis and total PCBs based on Aroclor were widely used in contaminants monitoring for decades, and is included in this data report for its value in comparison to historical data sets.
3.4.3 PCB HOMOLOGUES AND CONGENERS
The complete list of concentrations for the 124 PCB congeners that were analyzed in this investigation are located in the data sheets in Table 1. The PCB congeners were grouped into homologue groups based on chemical structure related to the number of chlorine atoms (1-10) attached to the biphenyl core. The distribution of homologues expressed as a fraction of Total PCBs was similar for Sites 1, 2, and 3. The homologue distribution for Site 4 was distinctly different when compared to the three Upper Hudson River sites (Figure 12). Site 4 had a greater proportion of higher chlorinated PCBs than Sites 1, 2, or 3.
HUDSON RIVER DATA REPORT: ORGANOCHLORINE AND METAL CONTAMINANT LEVELS IN
3.4 PCB3.4 PCB3.4 PCB3.43.4 PCBPCBSSSSS
3.4.1 TOTAL PCBS
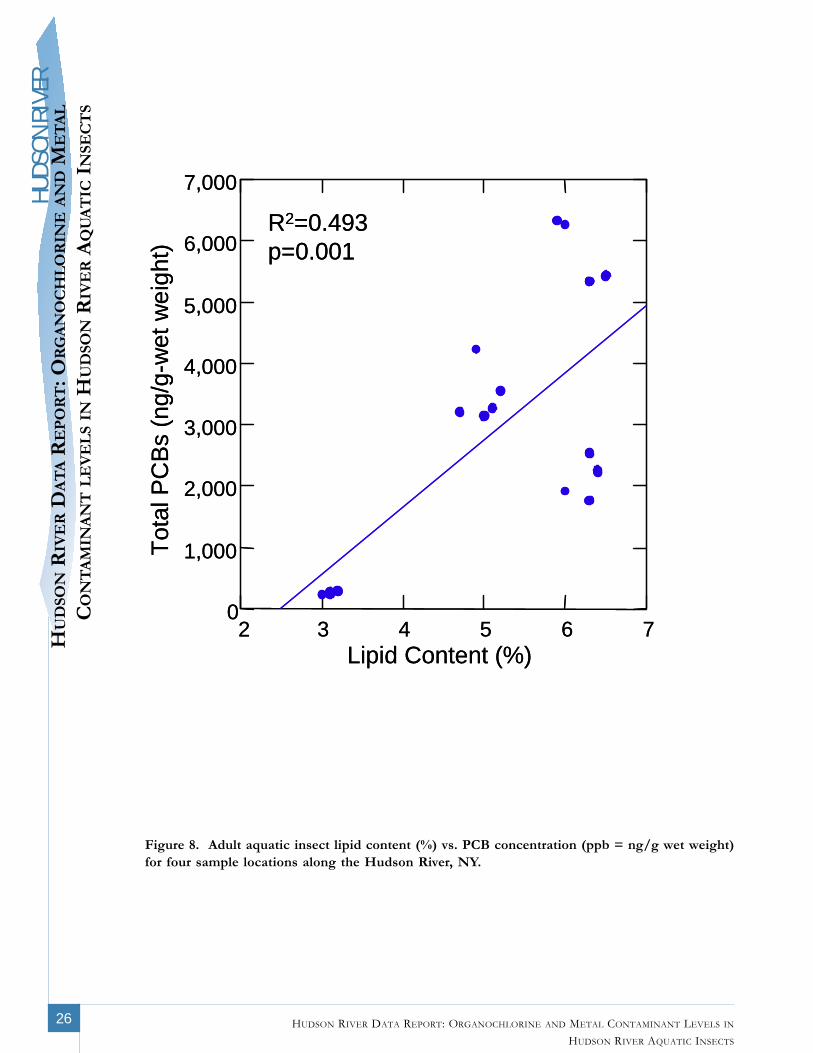
Total PCBs were calculated as the sum of the PCB homologues. Total PCBs in adult aquatic insect samples ranged from 238.3 ng/g to 6326 ng/g (wet weight basis, Table 4). Adult aquatic insect PCB concentrations were well correlated with lipid content (Figure 8). Total PCB concentration showed clear spatial trends. PCB concentrations increased between Site 1 and Site 2 and decreased slightly between Site 2 and Site 3. Site 4 displayed the lowest PCB concentrations of the four sample sites (Figure 9). Although Site 1, which is closest to the two GE plant sites, had lower total PCB concentrations than Sites 2 and 3, PCB concentrations still showed a significantly decreasing downstream concentration gradient from the plant sites to the Hudson River Estuary using linear regression analysis (Figure 10).
Table 4. Total PCBs concentrations (ng/g wet weight) from adult aquatic insect samples
from four sites along the Hudson River. Site 1=Remnant Area 4, Site 2=Special Area 13, Site
3=Saratoga National Historic Park, Site 4=Chelsea Marina.
Site Ave±SD Range n
1 2143±302.8 1769-2537 5
2 5739±509.8 5330-6326 5
3 3481±446.9 3141-4229 5
4 264.8±21.66 238.3-295.3 5
3.4.2 PCB AROCLORS
Aroclor 1248 was not detected in any of the insect samples at any of the sample sites. Aroclors 1242 and 1254 concentrations displayed a similar trend to total PCBs with concentrations increasing between Site 1
HUDSON RIVER AQUATIC INSECTS
12

4.0 DISCUSSION4.0 DISCUSSION4.04.04.0 DISCUSSIONDISCUSSIONDISCUSSION
4.1 M4.1 M4.1 M4.1 M4.1 MEEEEETTTTTALALALALALSSSSS
All adult aquatic insect samples analyzed had detectable levels of cadmium, chromium, mercury, and lead, except for one sample from Site 1 where chromium was not detected and three samples from Site 4 where chromium was not detected. Even though metals were detectable in most samples, the concentrations were well below levels of concern developed for macroinvertebrates in NY state waters (Table 5, Bode et al. 2002). Mercury appeared to have a decreasing concentration gradient with distance downstream from the GE plant sites, but the differences between sites were small (0.01 ppm) and may represent variations related to site-specific mercury cycling (Evers et al. 2007). Cadmium displayed a concentration gradient increasing with distance away from the GE plants. Elevated cadmium concentrations in sediment and invertebrates (e.g., blue claw crabs) are well documented in the Hudson River Estuary and may be the lingering effect of cadmium contamination related to the remediation of the former Marathon Battery site in Foundry Cove, Putnam County, NY (Kneip and Hazen 1979, Levinton et al. 2006, Sloan and Karcher 1984, USEPA 1986, 1988, 1989.
Table 5. Metal concentrations (mg/kg wet weight) for four sample sites along the
Hudson River, NY. Site 1=Remnant Area 4, Site 2=Special Area 13, Site 3=Saratoga
National Historic Park, Site 4=Chelsea Marina.
Cd Cr Pb Hg
Site ave±sd (mg/kg) ave±sd (mg/kg) ave±sd (mg/kg) ave±sd (mg/kg)
1 0.044±0.003 0.088±0.007 0.108±0.019 0.039±0.002
2 0.075±0.009 0.137±0.118 0.259±0.068 0.030±0.001
3 0.078±0.012 0.151±0.082 0.120±0.023 0.040±0.006
4 0.188±0.010 0.064±0.034 0.345±0.040 0.030±0.002
4.2 O4.2 O4.2 O4.2 O4.2 ORGANOCHLORINERGANOCHLORINERGANOCHLORINERGANOCHLORINERGANOCHLORINE PPPPPESTICIDESESTICIDESESTICIDESESTICIDESESTICIDES
Other than hexachlorobenzene and alpha- and beta-HCH, detectable organochlorine pesticides exhibited higher concentrations in the Hudson River Estuary (Site 4), than at the three Upper Hudson River sites. DDT, DDD, DDE, and dieldrin displayed increasing concentration gradients with distance away from the GE plant sites. The increased organochlorine pesticide concentrations at Site 4 in the Hudson River Estuary may be a result of that sample site receiving inputs from a much larger drainage area than Sites 1-3.
Table 6. DDT, DDD, and DDE concentrations (ng/g wet weight) from four sites along
the Hudson River. Site 1=Remnant Area 4, Site 2=Special Area 13, Site 3=Saratoga
National Historic Park, Site 4=Chelsea Marina.
DDT DDD DDE
Site ave+sd (ng/g) ave+sd (ng/g) ave+sd (ng/g)
1 0.696±0.063 0.664±0.092 6.534±0.311
2 0.690±0.051 0.390±0.048 5.884±0.183
3 0.688±0.330 0.417±0.131 6.774±0.488
4 1.670±0.743 1.286±0.482 65.516±50.601
HUDSON RIVERH
UD
SON
RIV
ER D
AT
A RE
PP
RT: O
RG
AN
OC
HL
OR
INE
AN
D M
ET
AL
CO
NT
AM
INA
NT L
EV
EL
S IN H
UD
SON
RIV
ER A
QU
AT
IC INSE
CT
S
HUDSON RIVER DATA REPORT: ORGANOCHLORINE AND METAL CONTAMINANT LEVELS IN
HUDSON RIVER AQUATIC INSECTS
13

HUDS
ON R
IVER
HU
DSO
N R
IVE
R D
AT
A R
EP
OR
T: O
RG
AN
OC
HL
OR
INE
AN
D M
ET
AL
CO
NT
AM
INA
NT
LE
VE
LS
IN H
UD
SON
RIV
ER
AQ
UA
TIC
IN
SEC
TS
HUDSON RIVER DATA REPORT: ORGANOCHLORINE AND METAL CONTAMINANT LEVELS IN
HUDSON RIVER AQUATIC INSECTS
14
4.3 PCB4.3 PCB4.3 PCB4.3 PCB4.3 PCBSSSSS
Total PCB concentration at a given sample site was related to distance from the GE plant sites. Adultaquatic insects sampled at Site 1, which is downstream of the Hudson Falls plant site and the formeroutfall for the Ft. Edward plant, showed relatively high PCB levels. PCB concentrations increased andreached the highest levels at Site 2. PCB concentrations at Site 3, which is approximately 23 milesdownstream from the plant sites, show a decrease from Site 2, but are still relatively elevated. This patternis similar to PCB concentrations in fish collected over the same stretch of river in 1999 (Sloan et al. 2002).Several factors may help explain why concentrations at Site 1, which is the closest site to the plant sites, arelower than concentrations at Sites 2 and 3, including source control and remediation of PCBs at the plantsites, differences in substrate between the three locations, and the hydraulics of the river at Site 1. Forexample, PCB concentrations in fish were higher at Remnant 3 than directly across the river at Remnant 4(Site 1) suggesting that physical characteristics, such as flow, erosion, and deposition, play an important rolein PCB concentrations in biota even over a relatively small spatial scale (Sloan et al. 2002). Site 4, located130 miles downstream of the Hudson Falls plant and in the tidal Hudson River Estuary, had the lowestPCB concentrations in adult aquatic insects out of the four sample sites.
The distribution of PCB homologues can be a useful tool in interpreting whether PCBs detected atdifferent sample sites are from the same source. PCB homologue distributions were all similar at the UpperHudson River sites, suggesting a common source, presumably the GE plants at Hudson Falls and Ft.Edward. Site 4 exhibited a slightly different homologue distribution, potentially representing somecontribution of PCB sources in addition to those from the GE plants and/or weathering of PCBs fromthe GE plants. The pattern of samples having greater proportions of higher chlorinated PCBs in theHudson River Estuary versus the Upper Hudson River has also been observed in fish (Sloan et al. 2005).
Table 7. Total PCB concentrations (ng/g wet weight) from four sites along the Hudson River.
Site 1=Remnant Area 4, Site 2=Special Area 13, Site 3=Saratoga National Historic Park, Site
4=Chelsea Marina.
Total PCBs
Site ave±sd (ng/g)
1 2143±302.8
2 5739±509.8
3 3481±446.9
4 264.8±21.66
5.0 SUMMARY AND CONCLUSION5.0 SUMMARY AND CONCLUSION5.0 SUMMARY AND CONCLUSION5.0 SUMMARY AND CONCLUSION5.0 SUMMARY AND CONCLUSION
This study collected and analyzed adult emergent aquatic insects composited in five sub-samples at each offour locations along the Hudson River, including three sites in the Upper Hudson River expected to beheavily influenced by PCB contamination from the GE plants at Hudson Falls and Ft. Edward and one sitein the Hudson River Estuary at Chelsea, NY. Samples were analyzed for selected metals, organochlorinepesticides, and PCBs. The primary objective of this investigation was to collect data to help connect thecontaminant pathway from sediments through insects emerging from the river into tree swallows andpotentially other wildlife. The findings of this investigation are as follows:
• Selected metals (cadmium, chromium, mercury, lead) were detected in most samples, and withthe exception of cadmium, which was highest in the estuary, concentrations of metals do notappear to be site dependent.
• Some of the selected organochlorine pesticides were detectable in some samples.Hexachlorobenzene and alpha- and beta-HCH were higher at the Upper Hudson River sitesthan in the Hudson River Estuary. Concentrations of other detectable organochlorines, most

notably dieldrin and DDT metabolites, were higher in the Hudson River Estuary than in the Upper Hudson River.
• Total PCB concentrations were related to sample site and proximity to the GE plant sites. PCB homologue distributions were similar for the three Upper Hudson sites and distinctively different for the site in the Hudson River Estuary. PCB concentrations in emergent adult aquatic insects demonstrate a pathway of PCBs from the sediment up into the food web to insects and into tree swallows, which rely on emerging insects from the Hudson River as a primary food source.
HUDSON RIVERH
UD
SON
RIV
ER D
AT
A RE
PP
RT: O
RG
AN
OC
HL
OR
INE
AN
D M
ET
AL
CO
NT
AM
INA
NT L
EV
EL
S IN H
UD
SON
RIV
ER A
QU
AT
IC INSE
CT
S
HUDSON RIVER DATA REPORT: ORGANOCHLORINE AND METAL CONTAMINANT LEVELS IN
HUDSON RIVER AQUATIC INSECTS
15

HUDS
ON R
IVER
HU
DSO
N R
IVE
R D
AT
A R
EP
OR
T: O
RG
AN
OC
HL
OR
INE
AN
D M
ET
AL
CO
NT
AM
INA
NT
LE
VE
LS
IN H
UD
SON
RIV
ER
AQ
UA
TIC
IN
SEC
TS
States and southeastern Canada. Bioscience 57:29-43.
Fairchild, W.L., D.C.G. Muir, R.S. Currie, and Y.L. Yarechewski. 1992. Emerging insects as a biotic pathway for movement of 2,3,7,8-tetrachlorodibenzofuran from lake sediments. Environmental Toxicology and Chemistry 11:867-872.
Froese, L.K., D.A. Verbrugge, G.T. Ankley, G.J. Niemi, C.P. Larsen, and J.P. Giesy. 1998. Bioaccumulation of polychlorinated biphenyls from sediments to aquatic insects and tree swallow eggs and nestlings in Saginaw Bay, Michigan, USA. Environmental Toxicology and Chemistry 17:484-492.
Hudson River Natural Resource Trustees. 2002a. Hudson River Natural Resource Damage Assessment Plan. September 2002. U.S. Department of Commerce, Silver Spring, MD.
Hudson River Natural Resource Trustees. 2002b. Analytical Quality Assurance Plan for the Hudson River Natural Resource Damage Assessment. Public Release Version. July 9, 2002, Version 1.0. U.S. Department of Commerce, Silver Spring, MD.
Kneip, T.J. and R.E. Hazen. 1979. Deposit and mobility of cadmium in a marsh-cove ecosystem and the relation to cadmium concentration in biota. Environmental Health Perspectives 28:67-73.
Kovats, Z.E. and J.J.H. Ciborowski. 1989. Aquatic insect adults as indicators of organochlorine contamination. Journal of Great Lakes Research 15:623-634.
HUDSON RIVER DATA REPORT: ORGANOCHLORINE AND METAL CONTAMINANT LEVELS IN
6.0 REFERENCES6.0 REFERENCES6.06.06.0 REFERENCESREFERENCESREFERENCES
Ballschmiter, K. and M. Zell. 1994. Analysis of polychlorinated biphenyls (PCBs) by glass capillary gas chromatography. Fresenius' Journal of Analytical Chemistry 302:20-31.
Blancher, P.J. and D.K. McNichol. 1991. Tree swallow diet in relation to wetland acidity. Canadian Journal of Zoology 69:2629-2637.
Bode, R.W., M.A. Novak, L.E. Abele, D.L. Heitzman, and A.J. Smith. 2002. Quality Assurance Work Plan for Biological Stream Monitoring in New York State. New York State Department of Environmental Conservation, Albany, NY.
Bush, B., K.W. Simpson, L. Shane, and R.R. Koblintz. 1985. PCB congener analysis of water and caddisfly larvae (Insecta:Trichoptera) in the Upper Hudson River by glass capillary chromatography. Bulletin of Environmental Contamination and Toxicology 34:96-105.
Ciborowski, J.J.H. and L.D. Corkum. 1988. Organic contaminants in adult aquatic insects of the St. Clair and Detroit Rivers, Ontariom Canada. Journal of Great Lakes Research 14:148-156.
Custer, C.M., T.W. Custer, P.D. Allen, K.L. Stromborg, and M.J. Melancon. 1998. Reproduction and environmental contamination in tree swallows nesting in the Fox River drainage and Green Bay, Wisconsin, USA. Environmental Toxicology and Chemistry 17:1786-1798.
Custer, C.M., T.W. Custer, P.M. Dummer, and K.L. Munney. 2003. Exposure and effect of chemical contaminants on tree swallows nesting along the Housatonic River, Berkshire County, Massachusetts, USA, 1998-2000. Environmental Toxicology and Chemistry 22:1605-1621.
Echols, K.R., D.E. Tillitt, J.W. Nichols, A.L. Secord, and J.P. McCarty. 2004. Accumulation of PCB congeners in nestling tree swallows (Tachycineta bicolor). Environmental Science and Technology 38:6240-6246.
Evers, D.C., Y.J. Han, C.T. Driscoll, N.C. Kamman, M.W. Goodale, K.F. Lambert, T.M. Holsen, C.Y. Chen, T.A. Clair, and T. Butler. 2007. Biological mercury hotspots in the northeastern United
HUDSON RIVER AQUATIC INSECTS
16

Kovats, Z.E. and J.J.H. Ciborowski. 1993. Organochlorine contaminant concentrations in caddisfly adults (Trichoptera) collected from the Great Lakes connecting channels. Environmental Monitoring and Assessment 27:135-158.
Levinton, J.S., S.T. Pochran, and M.W. Kane. 2006. Superfund dredging restoration results in widespread regional reduction in cadmium in blue crabs. Environmental Science and Technology 40:7597-7601.
Mauck, W.L. and L.E. Olson. 1977. Polychlorinated biphenyls in adult mayflies (Hexagenia bilineata) from the upper Mississippi River. Bulletin of Environmental Contamination and Toxicology 17: 387-390.
Maul, J.D., J.B. Belden, B.A. Schwab, M.R. Whiles, B. Spears, J.L. Farris, and M.J. Lydy. 2006. Bioaccumulation and trophic transfer of polychlorinated biphenyls by aquatic and terrestrial insects to tree swallows (Tachycineta bicolor). Environmental Toxicology and Chemistry 25:1017-1025.
McCarty, J.P. and A.L. Secord. 1999. Reproductive ecology of tree swallows (Tachycineta bicolor) with high levels of polychlorinated biphenyl contamination. Environmental Toxicology and Chemistry 18:1433-1439.
Novak, M.A., A.A. Reily, and S.J. Jackling. 1988. Long-term monitoring of polychlorinated biphenyls in the Hudson River (New York) using caddisfly larvae and other macroinvertebrates. Archives of Environmental Contamination and Toxicology 17:699710.
Novak, M.A., A.A. Reily, B. Bush, and L. Shane. 1990. In situ determination of PCB congener-specific first order absorption/desorption rate constants using Chironomus tentans larvae (Insecta: Diptera: Chironomidae). Water Resources 24:321-327.
Quinney, T.E. and C.D. Ankney. 1985. Prey size selection by tree swallows. Auk 102:245-250.
Papp, Z., G.R. Bortolotti, and J.E.G. Smits, 2005. Organochlorine contamination and physiological responses in nestling tree swallows in Point Pelee National Park, Canada. Archives of Environmental Contamination Toxicology 49:563-568.
Secord, A.L., J.P. McCarty, K.R. Echols, J.C. Meadows, R.W. Gale, and D.E. Tillitt. 1999. Polychlorinated biphenyls and 2,3,7,8-tetra-chlorodibenzo-p-dioxin equivalents in tree swallows from the upper Hudson River, New York State, USA. Environmental Toxicology and Chemistry 18:2519-2525.
Sloan, R, and R. Karcher. 1984. On the origins of high cadmium concentrations in Hudson River blue crab (Callinectes sapidus Rathbun). Northeastern Environmental Science 3:222232.
Sloan, R.J., M.W. Kane, and L.C. Skinner. 2002. 1999 as a Special Spatial Year for PCBs in Hudson River Fish. Bureau of Habitat, Division of Fish, Wildlife, and Marine Resources, New York State Department of Environmental Conservation, Albany, NY. 34 pp.
Sloan, R.J., M.W. Kane, and L.C. Skinner. 2005. Of Time, PCBs, and the Fish of the Hudson River. Bureau of Habitat, Division of Fish, Wildlife, and Marine Resources, New York State Department of Environmental Conservation, Albany, NY. 287 pp.
St. Louis, V.L., L. Breebaart, and J.C. Barlow. 1990. Foraging behaviour of tree swallows over acidified and nonacidic lakes. Canadian Journal of Zoology 68:2385-2392.
USEPA. 1986. Record of Decision on Marathon Battery Company Site Area I. Region 2, United States Environmental Protection Agency, New York, NY.
HUDSON RIVERH
UD
SON
RIV
ER D
AT
A RE
PP
RT: O
RG
AN
OC
HL
OR
INE
AN
D M
ET
AL
CO
NT
AM
INA
NT L
EV
EL
S IN H
UD
SON
RIV
ER A
QU
AT
IC INSE
CT
S
HUDSON RIVER DATA REPORT: ORGANOCHLORINE AND METAL CONTAMINANT LEVELS IN
HUDSON RIVER AQUATIC INSECTS
17

HUDS
ON R
IVER
HU
DSO
N R
IVE
R D
AT
A R
EP
OR
T: O
RG
AN
OC
HL
OR
INE
AN
D M
ET
AL
CO
NT
AM
INA
NT
LE
VE
LS
IN H
UD
SON
RIV
ER
AQ
UA
TIC
IN
SEC
TS USEPA. 1988. Record of Decision on Marathon Battery Company Site Area II. Region 2, United
States Environmental Protection Agency, New York, NY.
USEPA. 1989. Record of Decision on Marathon Battery Company Site Area III. Region 2, United States Environmental Protection Agency, New York, NY.
USEPA. 1999. USEPA Contract Laboratory Program National Functional Guidelines for Organic Data Review. Office of Emergency and Remedial Response, United States Environmental Protection Agency, Washington, DC.
Valoppi, L., M. Petreas, R.M. Donohoe, L. Sullivan, and C.A. Callahan. 2000. Use of PCB congener and homologue analysis in ecological risk assessment, in Environmental Toxicology and Risk Assessment: Recent Achievements in Environmental Fate and Transport: Ninth Volume. ASTMSTP 1381. F.T. Price, K.V. Brix, and N.K. Lane, Eds. American Society for Testing and Materials, West Conshohocken, PA.
HUDSON RIVER DATA REPORT: ORGANOCHLORINE AND METAL CONTAMINANT LEVELS IN
HUDSON RIVER AQUATIC INSECTS
18

HUDSON RIVERH
UD
SON
RIV
ER D
AT
A RE
PP
RT: O
RG
AN
OC
HL
OR
INE A
ND
ME
TA
L
CO
NT
AM
INA
NT L
EV
EL
S IN H
UD
SON
RIV
ER A
QU
AT
IC INSE
CT
S
HUDSON RIVER DATA REPORT: ORGANOCHLORINE AND METAL CONTAMINANT LEVELS IN
HUDSON RIVER AQUATIC INSECTS
19
FIGURESFIGURESFIGURESFIGURESFIGURES
Figure 1. 1998 adult aquatic insect samples analyzed for metals, organochlorine pesticides,and PCBs along the Hudson River, NY. Green dots represent insect sampling locations.
^̂
0 25 50 miles
¹
GE Hudson Falls Plant
GE Ft. Edward Plant
Mohawk River
Rondout Creek
Stillwater
Troy
Albany
Kingston
Hudson
Beacon
^̂̂̂
0 25 50 miles
¹
GE Hudson Falls Plant
GE Ft. Edward Plant
Mohawk River
Rondout Creek
Stillwater
Troy
Albany
Kingston
Hudson
Beacon

HUDS
ON R
IVER
CO
NT
AM
INA
NT
LE
VE
LS
IN H
UD
SON
RIV
ER
AQ
UA
TIC
IN
SEC
TS
HU
DSO
N R
IVE
R D
AT
A R
EP
OR
T: O
RG
AN
OC
HL
OR
INE
AN
D M
ET
AL
HUDSON RIVER DATA REPORT: ORGANOCHLORINE AND METAL CONTAMINANT LEVELS IN 20
Figure 2. Adult aquatic insect sampling locations for samples a) HRI-98-1; Remnant Area 4, b) HRI-98-2; Special Area 13, c) HRI-98-3; Saratoga National Historic Park, and d) HRI-98-4; Village of Chelsea.
HUDSON RIVER AQUATIC INSECTS

HUDSON RIVERH
UD
SON
RIV
ER D
AT
A RE
PP
RT: O
RG
AN
OC
HL
OR
INE A
ND
ME
TA
L
CO
NT
AM
INA
NT L
EV
EL
S IN H
UD
SON
RIV
ER A
QU
AT
IC INSE
CT
S
HUDSON RIVER DATA REPORT: ORGANOCHLORINE AND METAL CONTAMINANT LEVELS IN
HUDSON RIVER AQUATIC INSECTS
21
Figure 3. Concentration (ppm; mg/kg wet weight) of metals in adult aquatic insects fromfour sampling locations along the Hudson River, NY. Error bars represent standard error.Differing letters over the bars represent significant differences (p<0.01, ANOVA andBonferoni pairwise analysis). Site 1 is Remnant Area 4, Site 2 is Special Area 13, Site 3 isSaratoga NHP, and Site 4 is Chelsea Marina.
d) Hg
1 2 3 4Sample Site
0.02
0.03
0.04
0.05
Met
al C
once
ntra
tion
(mg/
kg w
et w
eigh
t)
c) Pb
1 2 3 4Sample Site
0.0
0.2
0.4
0.6
0.8
1.0
1.2
Met
al C
once
ntra
tion
(mg/
kg w
et w
eigh
t)
Sample Site
a) Cd
1 2 3 40.00
0.05
0.10
0.15
0.20
Met
al C
once
ntra
tion
(mg/
kg w
et w
eigh
t) b) Cr
1 2 3 4Sample Site
0.0
0.1
0.2
0.3
0.4
Met
al C
once
ntra
tion
(mg/
kg w
et w
eigh
t)
d) Hg
1 2 3 4Sample Site
0.02
0.03
0.04
0.05
Met
al C
once
ntra
tion
(mg/
kg w
et w
eigh
t)
d) Hg
1 2 3 4Sample Site
0.02
0.03
0.04
0.05
Met
al C
once
ntra
tion
(mg/
kg w
et w
eigh
t)
c) Pb
1 2 3 4Sample Site
0.0
0.2
0.4
0.6
0.8
1.0
1.2
Met
al C
once
ntra
tion
(mg/
kg w
et w
eigh
t)
c) Pb
1 2 3 4Sample Site
0.0
0.2
0.4
0.6
0.8
1.0
1.2
Met
al C
once
ntra
tion
(mg/
kg w
et w
eigh
t)
Sample Site
a) Cd
1 2 3 40.00
0.05
0.10
0.15
0.20
Met
al C
once
ntra
tion
(mg/
kg w
et w
eigh
t) a) Cd
1 2 3 40.00
0.05
0.10
0.15
0.20
Met
al C
once
ntra
tion
(mg/
kg w
et w
eigh
t) b) Cr
1 2 3 4Sample Site
0.0
0.1
0.2
0.3
0.4
Met
al C
once
ntra
tion
(mg/
kg w
et w
eigh
t) b) Cr
1 2 3 4Sample Site
0.0
0.1
0.2
0.3
0.4
Met
al C
once
ntra
tion
(mg/
kg w
et w
eigh
t)

HUDS
ON R
IVER
HU
DSO
N R
IVE
R D
AT
A R
EP
OR
T: O
RG
AN
OC
HL
OR
INE
AN
D M
ET
AL
CO
NT
AM
INA
NT
LE
VE
LS
IN H
UD
SON
RIV
ER
AQ
UA
TIC
IN
SEC
TS
HUDSON RIVER DATA REPORT: ORGANOCHLORINE AND METAL CONTAMINANT LEVELS IN
HUDSON RIVER AQUATIC INSECTS
22
Figure 4. Distance downstream (miles) vs. metal concentrations (ppm = mg/kg wet weight) foradult aquatic insects along the Hudson River, NY.
a) Cd
0 50 100 150Distance Downstream (miles)
0.00
0.05
0.10
0.15
0.20
0.25M
etal
Con
cent
ratio
n (m
g/kg
wet
wei
ght)
R2=0.972P<0.001
2
b) Cr
0 50 100 150Distance Downstream (miles)
0.0
0.1
0.2
0.4
Met
al C
once
ntra
tion
(mg/
kg w
et w
eigh
t)
R2=0.048p=0.4122
c) Pb
0 50 100 150Distance Downstream (miles)
0.0
0.2
0.4
0.6
0.8
1.0
1.2
Met
al C
once
ntra
tion
(mg/
kg w
et w
eigh
t)
R2=0.132p=0.115
2
d) Hg
0 50 100 150Distance Downstream (miles)
0.02
0.03
0.04
0.05M
etal
Con
cent
ratio
n (m
g/kg
wet
wei
ght)
R2=0.173p=0.0682
a) Cd
0 50 100 150Distance Downstream (miles)
0.00
0.05
0.10
0.15
0.20
0.25M
etal
Con
cent
ratio
n (m
g/kg
wet
wei
ght)
R2=0.972P<0.001
2
a) Cd
0 50 100 150Distance Downstream (miles)
0.00
0.05
0.10
0.15
0.20
0.25M
etal
Con
cent
ratio
n (m
g/kg
wet
wei
ght)
R2=0.972P<0.001
2
b) Cr
0 50 100 150Distance Downstream (miles)
0.0
0.1
0.2
0.4
Met
al C
once
ntra
tion
(mg/
kg w
et w
eigh
t)
R2=0.048p=0.4122
b) Cr
0 50 100 150Distance Downstream (miles)
0.0
0.1
0.2
0.4
Met
al C
once
ntra
tion
(mg/
kg w
et w
eigh
t)
R2=0.048p=0.4122
c) Pb
0 50 100 150Distance Downstream (miles)
0.0
0.2
0.4
0.6
0.8
1.0
1.2
Met
al C
once
ntra
tion
(mg/
kg w
et w
eigh
t)
R2=0.132p=0.115
2
c) Pb
0 50 100 150Distance Downstream (miles)
0.0
0.2
0.4
0.6
0.8
1.0
1.2
Met
al C
once
ntra
tion
(mg/
kg w
et w
eigh
t)
R2=0.132p=0.115
2
d) Hg
0 50 100 150Distance Downstream (miles)
0.02
0.03
0.04
0.05M
etal
Con
cent
ratio
n (m
g/kg
wet
wei
ght)
R2=0.173p=0.0682
d) Hg
0 50 100 150Distance Downstream (miles)
0.02
0.03
0.04
0.05M
etal
Con
cent
ratio
n (m
g/kg
wet
wei
ght)
R2=0.173p=0.0682

HUDSON RIVERH
UD
SON
RIV
ER D
AT
A RE
PP
RT: O
RG
AN
OC
HL
OR
INE
AN
D M
ET
AL
CO
NT
AM
INA
NT L
EV
EL
S IN H
UD
SON
RIV
ER A
QU
AT
IC INSE
CT
S
HUDSON RIVER DATA REPORT: ORGANOCHLORINE AND METAL CONTAMINANT LEVELS IN
HUDSON RIVER AQUATIC INSECTS
23
Figure 5. Concentration (ng/g wet weight) of organochlorine pesticides in adult aquatic insects from four sampling locations along the Hudson River, NY. Error bars represent standard error. Site 1 is Remnant Area 4, Site 2 is Special Area 13, Site 3 is Saratoga NHP, and Site 4 is Chelsea Marina.
deltagamma betaalpha
1 2 3 4 Sample Site
0
1
2
3
4
ng/g
-wet
wei
ght
deltagammabetaalpha
1 2 3 4Sample Site
0
1
2
3
4
ng/g
-wet
wei
ght
trans-Nonachlogamma-Chlordane (trans-)alpha-Chlordane (cis-)Oxychlordane
1 2 3 4 Sample Site
0.1
0.2
0.3
0.4
0.5
0.6
0.7
0.8
0.9
1.0
ng/g
-wet
wei
ght
trans-Nonachlorgamma-Chlordane (trans-)alpha-Chlordane (cis-)Oxychlordane
1 2 3 4Sample Site
0.1
0.2
0.3
0.4
0.5
0.6
0.7
0.8
0.9
1.0
ng/g
-wet
wei
ght
1 2 3 4 Sample Site
10.4
0.5
0.6
0.7
ng/g
-wet
wei
ght
0.2 3 4
Sample Site4
0.5
0.6
0.7
ng/g
-wet
wei
ght
1 2 3 4 Sample Site
10
1
2
3
4
5
ng/g
-wet
wei
ght
02 3 4
Sample Site
1
2
3
4
5
ng/g
-wet
wei
ght
a) BHC Isomers c) Hexachlorobenzene
b) Chlordane d) Dieldrin
BHC IsomerBHC Isomer
Chlordane compoundChlordane compound

HUDS
ON R
IVER
HU
DSO
N R
IVE
R D
AT
A R
EP
OR
T: O
RG
AN
OC
HL
OR
INE
AN
D M
ET
AL
CO
NT
AM
INA
NT
LE
VE
LS
IN H
UD
SON
RIV
ER
AQ
UA
TIC
IN
SEC
TS
HUDSON RIVER DATA REPORT: ORGANOCHLORINE AND METAL CONTAMINANT LEVELS IN24
Figure 6. DDT and DDT metabolite concentrations (ng/g wet weight) in adult aquatic insects from four sampling locations along the Hudson River, NY. Error bars represent standard error. Site 1 is Remnant Area 4, Site 2 is Special Area 13, Site 3 is Saratoga NHP, and Site 4 is Chelsea Marina.
p,p'-DDTo,p'-DDT p,p'-DDDo,p'-DDDp,p'-DDEo,p'-DDE
DDT metabolites
1 2 3 4 Sample Site
0
40
80
120
160
ng/g
-wet
wei
ght
p,p'-DDTo,p'-DDTp,p'-DDDo,p'-DDDp,p'-DDEo,p'-DDE
DDT metabolites
1 2 3 4Sample Site
0
40
80
120
160
ng/g
-wet
wei
ght
p,p'-DDTp,po,p'-DDTo,pp,p'-DDDp,po,p'-DDDo,po,p'-DDEo,p
DDT and MetabolitesDDT
1 2 3 4 Sample Site
10.0
0.5
1.0
1.5
2.0
ng/g
-wet
wei
ght
0.0'-DDT'-DDT'-DDD'-DDD'-DDE and Metabolites
2 3 4Sample Site
0.5
1.0
1.5
2.0
ng/g
-wet
wei
ght
a) DDT and metabolites
b) DDT and metabolites without p,p’ DDE
HUDSON RIVER AQUATIC INSECTS

HUDSON RIVERH
UD
SON
RIV
ER D
AT
A RE
PP
RT: O
RG
AN
OC
HL
OR
INE
AN
D M
ET
AL
CO
NT
AM
INA
NT L
EV
EL
S IN H
UD
SON
RIV
ER A
QU
AT
IC INSE
CT
S
HUDSON RIVER DATA REPORT: ORGANOCHLORINE AND METAL CONTAMINANT LEVELS IN 25
Figure 7. Distance downstream (miles) vs. DDT concentration (ppb = ng/g wet weight) for adult aquatic insects along the Hudson River, NY.
DDT and Metabolites
0 50 100 150 Distance Downstream (miles)
0.0
0.5
1.0
1.5
2.0
Con
cent
ratio
n (n
g/g
wet
wei
ght)
R2=0.385 p=0.000
DDT and Metabolites
0 50 100 150Distance Downstream (miles)
0.0
0.5
1.0
1.5
2.0
Con
cent
ratio
n (n
g/g
wet
wei
ght)
DDT and Metabolites
0 50 100 150Distance Downstream (miles)
0.0
0.5
1.0
1.5
2.0
Con
cent
ratio
n (n
g/g
wet
wei
ght)
R2=0.385p=0.000
HUDSON RIVER AQUATIC INSECTS
HUDS
ON R
IVER
HU
DSO
N R
IVE
R D
AT
A R
EP
OR
T: O
RG
AN
OC
HL
OR
INE
AN
D M
ET
AL
CO
NT
AM
INA
NT
LE
VE
LS
IN H
UD
SON
RIV
ER
AQ
UA
TIC
IN
SEC
TS
HUDSON RIVER DATA REPORT: ORGANOCHLORINE AND METAL CONTAMINANT LEVELS IN26
Figure 8. Adult aquatic insect lipid content (%) vs. PCB concentration (ppb = ng/g wet weight) for four sample locations along the Hudson River, NY.
R2=0.493 p=0.001
2 3 4 5 6 7 Lipid Content (%)
0
1,000
2,000
3,000
4,000
5,000
6,000
7,000 To
tal P
CB
s (n
g/g-
wet
wei
ght)
R2=0.493p=0.001
2 3 4 5 6 7Lipid Content (%)
0
1,000
2,000
3,000
4,000
5,000
6,000
7,000To
tal P
CB
s (n
g/g-
wet
wei
ght)
HUDSON RIVER AQUATIC INSECTS

Tota
l PC
Bs
(ng/
g-w
et w
eigh
t)
Tota
l PC
Bs
(ng/
g-w
et w
eigh
t)
7,0007,000
6,0006,000
5,0005,000
4,0004,000
3,0003,000
2,0002,000
1,0001,000
001 2 3 41 2 3 4
Sample SiteSample Site
Figure 9. Total PCB concentrations (ng/g wet weight) in adult aquatic insects from four sampling locations along the Hudson River, NY. Error bars represent standard error. Site 1 is Remnant Area 4, Site 2 is Special Area 13, Site 3 is Saratoga NHP, and Site 4 is Chelsea Marina.
HUDSON RIVERH
UD
SON
RIV
ER D
AT
A RE
PP
RT: O
RG
AN
OC
HL
OR
INE
AN
D M
ET
AL
CO
NT
AM
INA
NT L
EV
EL
S IN H
UD
SON
RIV
ER A
QU
AT
IC INSE
CT
S
HUDSON RIVER DATA REPORT: ORGANOCHLORINE AND METAL CONTAMINANT LEVELS IN
HUDSON RIVER AQUATIC INSECTS
27

HUDS
ON R
IVER
HU
DSO
N R
IVE
R D
AT
A R
EP
OR
T: O
RG
AN
OC
HL
OR
INE
AN
D M
ET
AL
CO
NT
AM
INA
NT
LE
VE
LS
IN H
UD
SON
RIV
ER
AQ
UA
TIC
IN
SEC
TS
HUDSON RIVER DATA REPORT: ORGANOCHLORINE AND METAL CONTAMINANT LEVELS IN
HUDSON RIVER AQUATIC INSECTS
28
Figure 10. Distance downstream (miles) vs. Total PCB concentration (ng/g wet weight) foradult aquatic insects along the Hudson River, NY.
0
1,000
2,000
3,000
4,000
5,000
6,000
7,000To
tal PCB
s (ng/g‐wet weight)
0 50 100 150Distance Downstream (miles)
R2 = 0.566p = 0.000
0
1,000
2,000
3,000
4,000
5,000
6,000
7,000To
tal PCB
s (ng/g‐wet weight)
0 50 100 150Distance Downstream (miles)
0 50 100 150Distance Downstream (miles)
R2 = 0.566p = 0.000

HUDSON RIVERH
UD
SON
RIV
ER D
AT
A RE
PP
RT: O
RG
AN
OC
HL
OR
INE
AN
D M
ET
AL
CO
NT
AM
INA
NT L
EV
EL
S IN H
UD
SON
RIV
ER A
QU
AT
IC INSE
CT
S
HUDSON RIVER DATA REPORT: ORGANOCHLORINE AND METAL CONTAMINANT LEVELS IN 29
Figure 11. PCB Aroclor concentrations (ng/g wet weight) in adult aquatic insects from four sampling locations along the Hudson River, NY. Error bars represent standard error. Site 1 is Remnant Area 4, Site 2 is Special Area 13, Site 3 is Saratoga NHP, and Site 4 is Chelsea Marina.
1260 1254 1242
Aroclor
1 2 3 4 Site
0
1,000
2,000
3,000
4,000
PCB
(ng/
g w
et w
eigh
t)
126012541242
Aroclor
1 2 3 4Site
0
1,000
2,000
3,000
4,000
PCB
(ng/
g w
et w
eigh
t)
HUDSON RIVER AQUATIC INSECTS

HUDS
ON R
IVER
HU
DSO
N R
IVE
R D
AT
A R
EP
OR
T: O
RG
AN
OC
HL
OR
INE
AN
D M
ET
AL
CO
NT
AM
INA
NT
LE
VE
LS
IN H
UD
SON
RIV
ER
AQ
UA
TIC
IN
SEC
TS
HUDSON RIVER DATA REPORT: ORGANOCHLORINE AND METAL CONTAMINANT LEVELS IN30
Figure 12. PCB homologue distribution in adult aquatic insects from four sampling locations along the Hudson River, NY. Error bars represent standard error. Site 1 is Remnant Area 4, Site 2 is Special Area 13, Site 3 is Saratoga NHP, and Site 4 is Chelsea Marina.
4 3 2 1
Sample Site
2 4 6 8 10 PCB Homologue
0.0
0.1
0.2
0.3
0.4
0.5
0.6
PC
B C
once
ntra
tion
(ng/
g-w
et w
eigh
t)
1 3 5 7 9 4321
Sample Site
2 4 6 8 10PCB Homologue
0.0
0.1
0.2
0.3
0.4
0.5
0.6
PC
B C
once
ntra
tion
(ng/
g-w
et w
eigh
t)
1 3 5 7 9
HUDSON RIVER AQUATIC INSECTS

APPENDIX A
1998 ADULT AQUATIC INSECT
FIELD COLLECTION RECORD

NEW YORK STATE DEPARTMENT OF ENVIRONMENTAL CONSERVATION
Organochlorine and Metal Contaminant Levels in Hudson River Aquatic Insects
FIELD COLLECTION RECORD
Sample Number: HRI-98- Date: / /
98
Time:
Study Site Name: Collection Method:
Study Site Location: (also see attached topographic map)
Habitat Description:
Environmental Conditions: (air temperature, wind speed, cloud cover, phase of moon, etc.)
Comments:
Collector(s) name (please print): Signature:

APPENDIX B
1998 ADULT AQUATIC INSECT
SAMPLE PREPARATION RECORD

NEW YORK STATE DEPARTMENT OF ENVIRONMENTAL CONSERVATION
Organochlorine and Metal Contaminant Levels in Hudson River Aquatic Insects
SAMPLE PREPARATION RECORD
Sample Number:
HRI-98-Study Site Name:
Total Wet Weight of Sorted Sample: (to nearest 0.1 gram)
Date sample was sorted: / /1998
Sorted by(print name): Signature:
Comments: (sample composition by taxa, approximate number of each taxa, relative contribution of each taxa by weight, etc.)
Date Homogenized/Sub-sampled: / /1998
Prepared by (print name): Signature:
Prepared by (print name): Signature:
Wet-weight of Sub-samples (to nearest 0.01g)
HRI- 98 - - A HRI- 98 - - B HRI-98 - -
C
HRI- 98 - - D HRI- 98 - - E

APPENDIX C
1998 ADULT AQUATIC INSECT
CHAIN OF CUSTODY RECORD

NEW YORK STATE DEPARTMENT OF ENVIRONMENTAL CONSERVATION
Organochlorine and Metal Contaminant Levels in Hudson River Aquatic Insects
CHAIN OF CUSTODY RECORD
The items identified below were collected by from the Hudson River.
Sample Number/ Location Name
Town/ County
Collection Date(s)
Wet-weight of Sub-samples (to nearest 0.01 gram) Sample
preparer(s)A B C D E
HRI-98-1 Remnant #4
Moreau/ Saratoga
HRI-98-2 Special Area 13
Moreau/ Saratoga
HRI-98-3 Saratoga Battlefield
Stillwater/ Saratoga
HRI-98-4 Chelsea
Wappinger/ Dutchess
Said items were in the custody of the persons listed below at all times until transferred by and hand delivered by those persons at times, dates and for purposes noted:
PRINCIPAL COLLECTOR (print name) DATE & TIME PURPOSE OF TRANSFER
SIGNATURE UNIT
FIRST RECIPIENT (print name) DATE & TIME PURPOSE OF TRANSFER
SIGNATURE UNIT
RECEIVED IN LABORATORY BY (print name) DATE & TIME
SIGNATURE UNIT
LOGGED IN BY (print name) DATE & TIME ACCESSION NUMBERS:
SIGNATURE UNIT

APPENDIX D
1998 ADULT AQUATIC INSECT HISTORICAL DATA REVIEW
September 21, 2007

I. INTRODUCTION
This report documents the results of a quality assurance review of data from 20 aquatic insect samples collected in 1998 by the New York State Department of Environmental Conservation (NYSDEC) and analyzed in 1999. The aquatic insect samples were analyzed for metals, polychlorinated biphenyls (PCBs), organochlorine pesticide compounds, and percent lipids. The purpose of this review is to determine the comparability of the data quality of these samples to that of data generated under the current Analytical Quality Assurance Plan (QAP) for the Hudson River Natural Resource Damage Assessment (NRDA).
II. BASIS FOR THE DATA REVIEW
Review of the laboratory data packages, was based on method performance criteria and quality control (QC) criteria documented in the Analytical Quality Assurance Plan (QAP) for the Hudson River Natural Resource Damage Assessment, Version 2.0, September 1, 2005, USEPA National Functional Guidelines for Organic Data Review (2/99), and the laboratory standard operating procedures (SOPs) when available.
The samples were analyzed by Axys Analytical Services, Ltd., Sidney, British Columbia, Canada for PCBs, organochlorine pesticides, and percent lipids and by Frontier Geosciences, Seattle, Washington, for metals and percent moisture. The analytical results were submitted by the laboratory as hardcopy data packages. The following steps were taken to validate a package:
Sample results and related QC data were received as hardcopy data packages. All data received a full validation, where possible, with re-calculation of 10% of the sample results from the raw data.
The following QC elements were reviewed for all data packages:
• Chain of custody and sample handling
• Laboratory deliverables and documentation practices
• Initial and continuing calibration (from summary forms and raw data)
• Laboratory preparation blank contamination (from summary forms)
• Analytical accuracy (as appropriate to method): surrogate recovery, laboratory control samples (LCS), ongoing precision and recovery (OPR) samples, matrix spike (MS) samples, certified reference material (CRM) results (from summary forms and raw data)
• Analytical precision: laboratory replicate analyses (from summary forms and raw data).
• Analyte identifications and quantitations (from summary forms and raw data).
Laboratory QC samples were used to assess the effectiveness of homogenization procedures and to evaluate laboratory-derived contamination, instrument performance, and sample matrix effects. For the PCB/organochlorine pesticide analyses QC samples included: method blanks, OPR samples, and
1

laboratory duplicate samples. For the metal analyses QC samples included: method blanks, MS, laboratory duplicates, and CRMs.
Data were qualified when associated QC sample results were outside the QC limits. The following definitions provide brief explanations of the qualifiers assigned to results in the data validation process:
U Not Detected: Analysis was performed for the analyte, but it was not detected above the reported sample detection limit.
J Estimated: The associated numerical value is an estimated quantity. The analyte was positively identified, but the reported value may not be accurate or precise. This qualification indicates that data fell outside the QC limits, but the exceedance was not sufficient to cause rejection of the data.
NJ Estimated/Not confirmed: The analyte was tentatively identified (by electron-capture detection using a single column), but not confirmed by a second column or analysis. The identification and the reported value may not be accurate or precise.
UJ Estimated/Not detected: Analysis was performed for the analyte, but it was not detected and the reported sample detection limit may be inaccurate or imprecise.
R Rejected: The associated sample result was rejected due to serious deficiencies in the analysis of the sample or a major QC outlier. The presence or absence of the rejected analyte cannot be verified.
In addition to data qualifiers, reason codes were assigned to each qualifier to assist in data interpretation, as follows:
3 Compound identification not confirmed
5A Initial Calibration
7 Laboratory Blank Contamination
9 Replicate Precision
10 Laboratory Control Sample Recoveries
13 Surrogate Spike Recoveries
14 Data validators professional judgment, an explanation will be included in the validation report
21 Potential False Positive
III. GENERAL COMMENTS
The data reviewed were from 1999, and thus the analysis predates the QAP for the Hudson River NRDA. The criteria specified in the QAP were used to evaluate the data when the necessary information was available. However, as is many times the case with historical data review, not all
2

information was available. The following QAP criteria for the PCB/organochlorine pesticide analysis could not be evaluated:
• No GC/MS performance checks (“tunes”) were submitted
• No initial calibration (ICAL) data were submitted
• No MS samples were analyzed
• No reference materials (RM) were analyzed
• No breakdown checks for 4,4'-DDT or endrin were performed
• Internal standard for the electron capture detector (ECD) could not be evaluated
For the metals analysis the following QAP criteria could not be evaluated:
• The inductively coupled plasma – mass spectrometer (ICP-MS) tune data were not submitted
These missing items are minor findings, and in general the overall quality of the data can be considered acceptable for use. Data validation reports are provided for each analyte group reviewed in Section V of this report. These validation reports provide details regarding the items reviewed and reasons for any data qualification.
Results of the aquatic insect analysis were submitted in spreadsheet form by NYSDEC. One hundred percent (100%) of the data in the spreadsheet was compared to the raw data, and any errors or omissions were corrected. A spreadsheet containing the corrected and qualified data is submitted with this report.
The following changes were made to the spreadsheet:
• Units were added to all values, and adjusted to be consistent with the specifications for units in the Hudson Analytical QAP. Specifically, organics were reported as ng/g in wet weight; metals were reported as mg/kg in wet weight. (Note that the original spreadsheet had the metals reported in dry weight.)
• Significant figures were changed to match the hardcopy report.
• Dates sampled were added from the chains of custody (COC). When more than one date sampled was listed the earliest date was used.
• Laboratory IDs were added to the PCB/Pesticide samples.
• The PCB congeners were renamed to PCB-## from ##. For example, PCB6 was originally reported a “6” and this was changed to PCB-6.
• Non-detect (ND) results for endosulfan I, endosulfan II, endosulfan sulfate, endrin aldhehyde, endrin ketone, and methoxychlor were deleted from Samples HRI-98-01A, HRI-98-01B, HRI-98-01C, HRI-98-01D, HRI-98-01E, HRI-98-02A, HRI-98-02B, HRI-98-02C, HRI-98-02D,
3

and HRI-98-03A as these compounds were not reported for these samples in the hardcopy report from the laboratory.
• Standard procedure for handling blank results (per USEPA Functional Guidelines) is to establish an “action level” of 5 times the blank concentration, and any results less than the action level is qualified as “non-detected” at the reported concentration. Thus no organic results were “blank corrected”. The results in the validated spreadsheet reflect the qualification of any values less than the “action level” as non-detected at the reported concentration.
IV. COMPLETENESS AND USABILITY
Of the 2,600 data points submitted by Axys Analytical, two results were not reported and 19 results were rejected (R), leaving 2,579 usable results, for a completeness of 99%. Of these usable results, 98 results were estimated (J), 162 results were qualified as not detected (U), and 80 results were qualified as tentatively identified and estimated (NJ). Some results were both estimated (J) and qualified as not detected (U), so the total number of qualified results is less than the sum of these three. Out of 2,579 usable results reported by Axys, a total of 331 (12.9%) data points were qualified.
Of the 80 data points submitted by Frontier Geosciences, 36 (45%) data points were estimated (J). None were rejected.
Overall, of the 2,680 data points submitted, 21 were rejected (R), leaving 2,659 usable data points. Of these, 367 (13.8%) were qualified. The overall quality of this data is acceptable and these results, as qualified, are considered usable.
V. DATA VALIDATION SUMMARIES
A. ORGANOCHLORINE PESTICIDES AND PCB CONGENERS
Samples were analyzed by Axys Analytical Services, Ltd. Sidney, British Columbia, Canada. Sample extracts were split into two aliquots for analysis. The low to moderately polar pesticides and the PCB congeners were analyzed by low resolution mass spectrometer (LRMS). The more polar pesticides were analyzed by electron-capture detector (ECD). Both fractions are discussed below.
1. Data Package Completeness
The laboratory submitted all required deliverables, with the exceptions noted in Section 2 below. The laboratory followed adequate corrective action processes and all anomalies were discussed in the case narrative.
4

___________________________________________________________
2. Technical Data Validation
The quality control (QC) requirements that were reviewed are listed below.
Sample Receipt 2 Ongoing Precision and Recovery (OPR) 1 GC/MS & GC/ECD Instrument Performance Checks 1 Reference Material (RM) 2 Initial Calibration (ICAL) 2 Laboratory Duplicate 1 Continuing Calibration (CCAL) 1 Internal Standards 2 Laboratory Blanks 2 Compound Identification 2 Surrogates/Labeled Compounds 1 Reporting Limits (MDL and MRL) 1 Matrix Spike (MS) 1 Calculation Verification
1 Quality control results are discussed below, but no data were qualified. 2 Quality control outliers that impact the reported data were noted. Data qualifiers were issued as discussed below.
GC/MS & GC/ECD Instrument Performance Checks The laboratory did not analyze breakdown checks for p,p'-DDT or endrin. In addition, no GC/MS instrument performance checks (“tunes”) were submitted. As all continuing calibration standards met the laboratory acceptance limits no qualifiers were assigned on this basis.
Initial Calibration (ICAL) No initial calibrations (ICALs) were submitted. All samples were bracketed by continuing calibration (CCAL) standards and quantitation performed using the average relative response factor (RRF) of the opening and closing CCAL. Additionally, the standards used for the CCAL contained known concentrations of Aroclors 1242, 1254, and 1260, but the individual PCB congeners and their concentrations were not provided. Furthermore, examination of the raw data indicates that not all PCB congeners reported are present in the CCAL standards and the relative response factor (RRF) for select PCB congeners are used to establish the RRF for others. For example, it appears that PCB6 is not present in the CCAL but is reported as a target analyte, and it appears that PCB8/5 is used to establish the RRF for PCB4/10, PCB6, and PCB7/9. In 1999, when these samples were analyzed, this method for the quantitation of PCB congeners was not uncommon, thus no action was taken on this basis.
Photomirex was reported as not-detected in all samples. However, this compound is not present in the calibration standards or the ongoing precision and recovery (OPR) sample. As no information on the response of this compound was submitted all reporting limits were rejected (R-5A).
Continuing Calibration (CCAL) The CCAL could not be evaluated by the criteria specified in the quality assurance plan (QAP) as no ICAL were submitted. In addition, in several cases the interval between CCAL analyses was greater than the QAP specified interval of 12 hours. All CCAL met the laboratory acceptance criteria , thus no data were qualified .
5
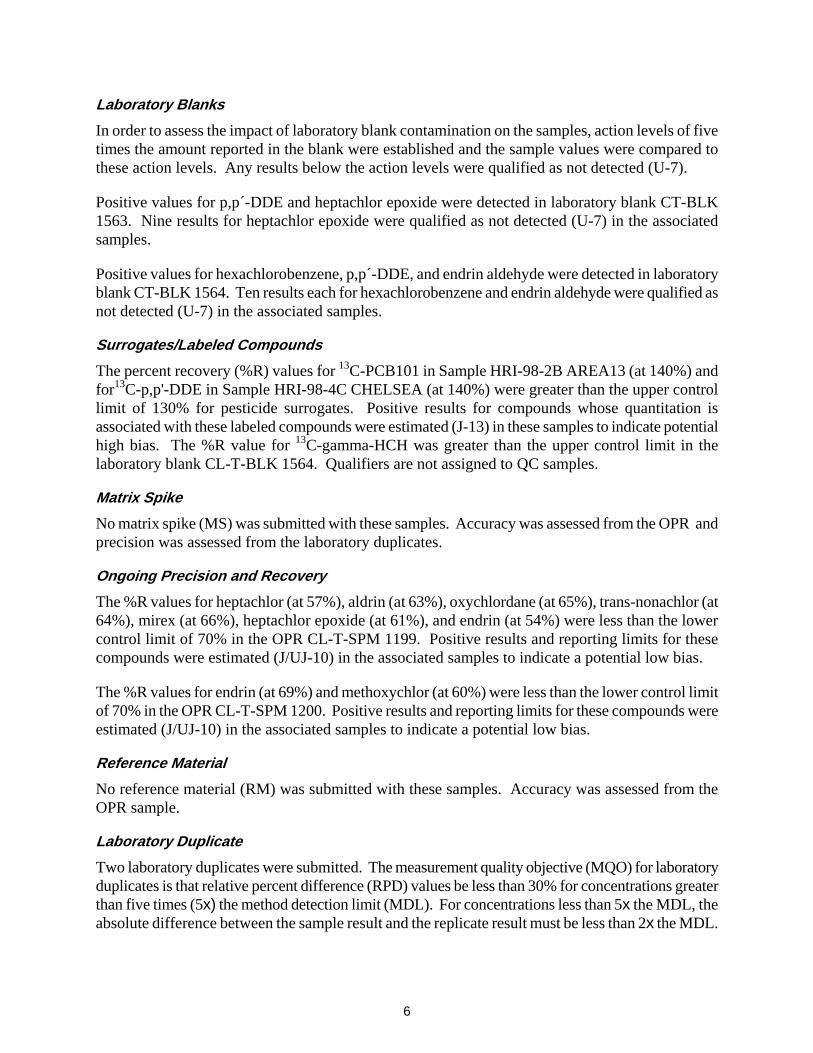
Laboratory Blanks In order to assess the impact of laboratory blank contamination on the samples, action levels of five times the amount reported in the blank were established and the sample values were compared to these action levels. Any results below the action levels were qualified as not detected (U-7).
Positive values for p,p´-DDE and heptachlor epoxide were detected in laboratory blank CT-BLK 1563. Nine results for heptachlor epoxide were qualified as not detected (U-7) in the associated samples.
Positive values for hexachlorobenzene, p,p´-DDE, and endrin aldehyde were detected in laboratory blank CT-BLK 1564. Ten results each for hexachlorobenzene and endrin aldehyde were qualified as not detected (U-7) in the associated samples.
Surrogates/Labeled Compounds The percent recovery (%R) values for 13C-PCB101 in Sample HRI-98-2B AREA13 (at 140%) and for13C-p,p'-DDE in Sample HRI-98-4C CHELSEA (at 140%) were greater than the upper control limit of 130% for pesticide surrogates. Positive results for compounds whose quantitation is associated with these labeled compounds were estimated (J-13) in these samples to indicate potential high bias. The %R value for 13C-gamma-HCH was greater than the upper control limit in the laboratory blank CL-T-BLK 1564. Qualifiers are not assigned to QC samples.
Matrix Spike No matrix spike (MS) was submitted with these samples. Accuracy was assessed from the OPR and precision was assessed from the laboratory duplicates.
Ongoing Precision and Recovery The %R values for heptachlor (at 57%), aldrin (at 63%), oxychlordane (at 65%), trans-nonachlor (at 64%), mirex (at 66%), heptachlor epoxide (at 61%), and endrin (at 54%) were less than the lower control limit of 70% in the OPR CL-T-SPM 1199. Positive results and reporting limits for these compounds were estimated (J/UJ-10) in the associated samples to indicate a potential low bias.
The %R values for endrin (at 69%) and methoxychlor (at 60%) were less than the lower control limit of 70% in the OPR CL-T-SPM 1200. Positive results and reporting limits for these compounds were estimated (J/UJ-10) in the associated samples to indicate a potential low bias.
Reference Material No reference material (RM) was submitted with these samples. Accuracy was assessed from the OPR sample.
Laboratory Duplicate Two laboratory duplicates were submitted. The measurement quality objective (MQO) for laboratory duplicates is that relative percent difference (RPD) values be less than 30% for concentrations greater than five times (5x) the method detection limit (MDL). For concentrations less than 5x the MDL, the absolute difference between the sample result and the replicate result must be less than 2x the MDL.
6

All RPD values and absolute differences were acceptable for Sample HRI-98-1E (Remnant #4) and its duplicate.
The RPD values for PCB7/9 (at 38%), PCB8/5 (at 35%), and PCB18 (at 38%) were greater than the MQO for Sample HRI-98-2E AREA 13 and its duplicate. The results for these compounds were estimated (J-9) in the parent sample.
Internal Standards The laboratory did not submit summaries of the internal standard areas. When possible the internal standard areas were evaluated from the raw data. The internal standard areas for several LRMS dilution analyses could not be evaluated as the raw data for the associated CCAL were not submitted. As the internal standard areas for all undiluted analyses were acceptable no action was taken on this basis.
The internal standard areas for the ECD analyses could not be evaluated as the internal standard concentration in the CCAL was obviously different from that of the samples. The concentrations were not labeled so no accurate comparison could be made. The sample internal standard areas for all ECD analyses were consistent with one another, thus no action was taken on this basis.
Compound Identification The results for all pesticides analyzed by ECD were reported from one column only, no confirmation was performed. Positive results from the ECD were qualified as tentatively identified and estimated (NJ-3).
The laboratory assigned a NDR flag to some LRMS results to indicate the ion abundance ratio criteria were not met. These results were qualified as not detected (U-21).
The laboratory did not provide any information to confirm the Aroclor identifications. Furthermore, the case narrative states that when no Aroclor patterns are identified the laboratory reports values for Aroclors 1242, 1254, and 1260 as a default. All samples are reported with results for Aroclors 1242, 1254, and 1260 and there is no indication that these Aroclors were identified. All positive Aroclor results were qualified as estimated and tentatively identified (NJ-14).
Reporting Limits (Method Detection Limit and Method Reporting Limit) Most results were reported to two significant figures, while some results less than one were reported to one significant figure. The QAP specifies that all results be reported to three significant figures. No action was taken on this basis.
All PCB congeners listed in the QAP were reported. However, results for the PCB homologue groups were not reported. Cis-nonachlor, chlordane, and toxaphene were not reported for any sample. Endosulphan I, endosulphan II, endosulphan sulfate, endrin aldehyde, endrin ketone, and methoxychlor were not reported for ten of the samples. Results for mirex, photomirex, delta-BHC, and Aroclors 1242, 1248, 1254, and 1260, which are not on the analyte list in the QAP, were reported for all samples.
7

The result for PCB 24/27 in Sample HRI-98-3B SARATOGA was greater than the linear range of the instrument in the initial analysis. The laboratory flagged the data OLR to indicate that the result for PCB24/27 would be reported from a dilution analysis. The dilution analysis was performed; however no result for PCB24/27 was reported. The result for photomirex in this same sample was flagged NQ, “not quantifiable”, in the initial analysis. Photomirex was not reported from the dilution analysis. Thus, there are no reported results for photomirex nor for PCB24/27 for Sample HRI-98-3B SARATOGA. These compounds were rejected (R-14) in this sample to indicate that the data are not usable.
Calculation Verification Several transcription errors were noted during this review on the CCAL summary forms. Where applicable, results for the compounds with transcription errors were recalculated in samples associated with the CCALs to ensure that the results were unaffected.
Insufficient information to re-calculate the CCALs was provided; standard concentrations were not labeled and the raw data for four of the eight LRMS CCALs were not provided. The laboratory was contacted and the standard concentrations were provided. However, for one of the four LRMS CCALs with raw data present, the calculations could not be duplicated because the recalculated relative response factors did not match. As the differences in relative response differences were minor and the calculations for the other three CCALs were duplicated, no action was taken on this basis.
The calculations for all eight ECD CCALs could not be duplicated. However, in all cases the differences between the reported and calculated results were consistent (calculated results were 1.1 times greater than reported). This discrepancy was possibly due to a non-documented factor. These data points were already qualified for other reasons, so no further qualification was required.
3. Overall Assessment
As was determined by this evaluation, accuracy was acceptable, as demonstrated by the surrogate or labeled compound and OPR %R, with the exceptions noted above. Precision was acceptable as demonstrated by the RPD values for the laboratory duplicates, with the exceptions noted above.
Data were estimated (J) due to laboratory duplicate precision outliers, and due to labeled compound and OPR recovery outliers. Data were qualified as tentatively identified and estimated (NJ) due to the lack of confirmation analysis. Data were qualified as not detected (U) due to ion ratio criteria outliers and contamination from the associated laboratory blanks.
Data were rejected due to lack of calibration standards and missing results for dilution analysis. Rejected data should not be used for any purpose. All other data, as qualified, are acceptable for use.
8

___________________________________________________________
B. METALS
This report documents the review of analytical data from the analysis of aquatic invertebrate tissue samples and the associated laboratory quality control (QC) samples. The samples were analyzed by Frontier Geosciences Inc., Seattle, Washington, using inductively coupled plasma mass spectrometry (ICP-MS) for chromium, cadmium, and lead determinations, and cold vapor atomic fluorescence spectrometry (CVAFS) for mercury determinations.
1. Data Package Completeness
The laboratory submitted all required deliverables, with the exception noted in Section 2 below. The laboratory followed adequate corrective action processes and all anomalies were discussed in the case narrative.
2. Technical Data Validation
The QC requirements that were reviewed are listed below.
1 Sample Receipt Matrix Spikes/Matrix Spike Duplicates (MS/MSD) Initial Calibration (ICAL) Laboratory Duplicates Continuing Calibration Verification (CCV) Internal Standards
1 Blanks (Instrument and Method) 2 Compound Quantitation and Reporting Limits 1 Certified Reference Materials (CRM) 1 Calculation Verification
Blank Spikes
1 Quality control results are discussed below, but no data were qualified. 2 Quality control outliers that impact the reported data were noted. Data qualifiers were issued as discussed below.
Sample Receipt No chains of custody (COC) were included in the data package. No action was taken on this basis.
Blanks (Instrument and Method) The mean blank concentrations were all less than the estimated method detection limit (EMDL), with the exception of lead. All sample lead results were greater than the action level of five times the mean blank concentration and no qualifiers were required.
Certified Reference Materials National Research Council of Canada (NRCC) certified reference material (CRM) DOLT-2 (dogfish liver) was analyzed with these samples. All recovery values were within the acceptance limits with the exception of chromium (63.4% recovery). The chromium value for this CRM is not certified and is for informational purposes only; therefore, no data was qualified on this basis.
9

Compound Quantitation and Reporting Limits The laboratory blank-corrected all analytical results. The instrument concentration was corrected for the average of four instrument blanks analyzed prior to the samples. The final sample concentration was then corrected for the average of four preparation blanks. This was deemed acceptable.
A stainless steel blender was used to homogenize the samples. For this reason positive results for chromium were estimated (J-14).
Calculation Verification All sample results were recalculated from the raw data. The calculated mercury values did not match the reported values. In all cases the reported value was lower than the reported value and the differences between the two values were less than 10%. Data were qualified and estimated (J-14) on this basis, as the data user should be aware of the potential for a low bias in the mercury results.
3. Overall Assessment
As determined by this evaluation, the laboratory followed the specified methods. Laboratory accuracy was acceptable as demonstrated by the matrix spike/matrix spike duplicate (MS/MSD) and CRM recovery results. Laboratory precision was also acceptable as demonstrated by the laboratory duplicate and MS/MSD relative percent difference values.
Data were estimated due to the use of a stainless steel blender and the inability to recalculate mercury results.
All data, as qualified, are acceptable for use.
�
10

APPENDIX E
1998 ADULT AQUATIC INSECT DATA SHEETS

Aquatic Insects Pesticide and PCB Data
SAMPLING DATE FIELD ID LABORATORY ID ANALYTE VALUE INTERPRETIVE
QUALIFIER*
QUALIFIER REASON CODE*
DETECTION LIMIT
UNITS
6/10/98 HRI-98-01A (Remnant #4) L3172-1 % Lipids 6.0 Percent 6/10/98 HRI-98-01A (Remnant #4) L3172-1 Hexachlorobenzene 0.58 0.12 ng/g-wet weight 6/10/98 HRI-98-01A (Remnant #4) L3172-1 alpha HCH ND U 0.61 ng/g-wet weight 6/10/98 HRI-98-01A (Remnant #4) L3172-1 beta HCH ND U 0.81 ng/g-wet weight 6/10/98 HRI-98-01A (Remnant #4) L3172-1 gamma HCH 3.1 U 21 0.61 ng/g-wet weight 6/10/98 HRI-98-01A (Remnant #4) L3172-1 delta HCH ND U 0.61 ng/g-wet weight 6/10/98 HRI-98-01A (Remnant #4) L3172-1 Heptachlor ND UJ 10 1.2 ng/g-wet weight 6/10/98 HRI-98-01A (Remnant #4) L3172-1 Aldrin ND UJ 10 0.31 ng/g-wet weight 6/10/98 HRI-98-01A (Remnant #4) L3172-1 Oxychlordane ND UJ 10 1.6 ng/g-wet weight 6/10/98 HRI-98-01A (Remnant #4) L3172-1 gamma-Chlordane (trans-) ND U 0.22 ng/g-wet weight 6/10/98 HRI-98-01A (Remnant #4) L3172-1 alpha-Chlordane (cis-) 0.21 0.2 ng/g-wet weight 6/10/98 HRI-98-01A (Remnant #4) L3172-1 o,p'-DDE 0.13 0.05 ng/g-wet weight 6/10/98 HRI-98-01A (Remnant #4) L3172-1 p,p'-DDE 6.7 0.07 ng/g-wet weight 6/10/98 HRI-98-01A (Remnant #4) L3172-1 trans-Nonachlor 0.40 J 10 0.10 ng/g-wet weight 6/10/98 HRI-98-01A (Remnant #4) L3172-1 o,p'-DDD 0.14 0.08 ng/g-wet weight 6/10/98 HRI-98-01A (Remnant #4) L3172-1 p,p'-DDD 0.61 0.09 ng/g-wet weight 6/10/98 HRI-98-01A (Remnant #4) L3172-1 o,p'-DDT 0.26 0.11 ng/g-wet weight 6/10/98 HRI-98-01A (Remnant #4) L3172-1 p,p'-DDT 0.53 0.13 ng/g-wet weight 6/10/98 HRI-98-01A (Remnant #4) L3172-1 Mirex ND UJ 10 0.12 ng/g-wet weight 6/10/98 HRI-98-01A (Remnant #4) L3172-1 Photomirex R 5A 6/10/98 HRI-98-01A (Remnant #4) L3172-1 Heptachlor Epoxide 0.15 UJ 7,10 0.12 ng/g-wet weight 6/10/98 HRI-98-01A (Remnant #4) L3172-1 Dieldrin 0.3 NJ 3 0.11 ng/g-wet weight 6/10/98 HRI-98-01A (Remnant #4) L3172-1 Endrin ND UJ 10 0.2 ng/g-wet weight 6/10/98 HRI-98-01A (Remnant #4) L3172-1 Aroclor 1242 780 NJ 14 1.3 ng/g-wet weight 6/10/98 HRI-98-01A (Remnant #4) L3172-1 Aroclor 1248 ND U 1.3 ng/g-wet weight 6/10/98 HRI-98-01A (Remnant #4) L3172-1 Aroclor 1254 830 NJ 14 1.5 ng/g-wet weight 6/10/98 HRI-98-01A (Remnant #4) L3172-1 Aroclor 1260 94 NJ 14 2.3 ng/g-wet weight 6/10/98 HRI-98-01A (Remnant #4) L3172-1 PCB-6 0.24 0.04 ng/g-wet weight 6/10/98 HRI-98-01A (Remnant #4) L3172-1 PCB-4/10 1.0 0.06 ng/g-wet weight 6/10/98 HRI-98-01A (Remnant #4) L3172-1 PCB-7/9 0.28 0.06 ng/g-wet weight 6/10/98 HRI-98-01A (Remnant #4) L3172-1 PCB-8/5 1.4 0.06 ng/g-wet weight 6/10/98 HRI-98-01A (Remnant #4) L3172-1 PCB-15 6.6 0.09 ng/g-wet weight 6/10/98 HRI-98-01A (Remnant #4) L3172-1 PCB-19 2.4 0.09 ng/g-wet weight 6/10/98 HRI-98-01A (Remnant #4) L3172-1 PCB-18 15 0.09 ng/g-wet weight 6/10/98 HRI-98-01A (Remnant #4) L3172-1 PCB-17 8.8 0.09 ng/g-wet weight
*See Qualifier Codes table at end. Page 1 of 75

Aquatic Insects Pesticide and PCB Data
SAMPLING DATE FIELD ID LABORATORY ID ANALYTE VALUE INTERPRETIVE
QUALIFIER*
QUALIFIER REASON CODE*
DETECTION LIMIT
UNITS
6/10/98 HRI-98-01A (Remnant #4) L3172-1 PCB-24/27 2.3 0.09 ng/g-wet weight 6/10/98 HRI-98-01A (Remnant #4) L3172-1 PCB-16/32 11 0.09 ng/g-wet weight 6/10/98 HRI-98-01A (Remnant #4) L3172-1 PCB-26 9.8 0.08 ng/g-wet weight 6/10/98 HRI-98-01A (Remnant #4) L3172-1 PCB-25 3.4 0.08 ng/g-wet weight 6/10/98 HRI-98-01A (Remnant #4) L3172-1 PCB-31/28 190 0.08 ng/g-wet weight 6/10/98 HRI-98-01A (Remnant #4) L3172-1 PCB-33 /20 15 0.08 ng/g-wet weight 6/10/98 HRI-98-01A (Remnant #4) L3172-1 PCB-22 7.7 0.08 ng/g-wet weight 6/10/98 HRI-98-01A (Remnant #4) L3172-1 PCB-37 31 0.08 ng/g-wet weight 6/10/98 HRI-98-01A (Remnant #4) L3172-1 PCB-53 8.3 0.1 ng/g-wet weight 6/10/98 HRI-98-01A (Remnant #4) L3172-1 PCB-45 3.3 0.1 ng/g-wet weight 6/10/98 HRI-98-01A (Remnant #4) L3172-1 PCB-46 1.5 0.1 ng/g-wet weight 6/10/98 HRI-98-01A (Remnant #4) L3172-1 PCB-52 82 0.1 ng/g-wet weight 6/10/98 HRI-98-01A (Remnant #4) L3172-1 PCB-49 96 0.13 ng/g-wet weight 6/10/98 HRI-98-01A (Remnant #4) L3172-1 PCB-47/48 86 0.13 ng/g-wet weight 6/10/98 HRI-98-01A (Remnant #4) L3172-1 PCB-44 56 0.12 ng/g-wet weight 6/10/98 HRI-98-01A (Remnant #4) L3172-1 PCB-42 34 0.12 ng/g-wet weight 6/10/98 HRI-98-01A (Remnant #4) L3172-1 PCB-41/71/64 77 0.12 ng/g-wet weight 6/10/98 HRI-98-01A (Remnant #4) L3172-1 PCB-40 2.3 0.14 ng/g-wet weight 6/10/98 HRI-98-01A (Remnant #4) L3172-1 PCB-74 /61 140 0.14 ng/g-wet weight 6/10/98 HRI-98-01A (Remnant #4) L3172-1 PCB-70/76 210 0.14 ng/g-wet weight 6/10/98 HRI-98-01A (Remnant #4) L3172-1 PCB-66 /80 160 0.08 ng/g-wet weight 6/10/98 HRI-98-01A (Remnant #4) L3172-1 PCB-81 3.1 0.08 ng/g-wet weight 6/10/98 HRI-98-01A (Remnant #4) L3172-1 PCB-56/60 69 0.08 ng/g-wet weight 6/10/98 HRI-98-01A (Remnant #4) L3172-1 PCB-77 13 U 21 0.08 ng/g-wet weight 6/10/98 HRI-98-01A (Remnant #4) L3172-1 PCB-95 19 0.04 ng/g-wet weight 6/10/98 HRI-98-01A (Remnant #4) L3172-1 PCB-119 1.3 0.04 ng/g-wet weight 6/10/98 HRI-98-01A (Remnant #4) L3172-1 PCB-91 5.9 0.04 ng/g-wet weight 6/10/98 HRI-98-01A (Remnant #4) L3172-1 PCB-84 4.3 0.04 ng/g-wet weight 6/10/98 HRI-98-01A (Remnant #4) L3172-1 PCB-90/101/89 47 0.04 ng/g-wet weight 6/10/98 HRI-98-01A (Remnant #4) L3172-1 PCB-99 31 0.04 ng/g-wet weight 6/10/98 HRI-98-01A (Remnant #4) L3172-1 PCB-83 2.4 0.06 ng/g-wet weight 6/10/98 HRI-98-01A (Remnant #4) L3172-1 PCB-97 /86 20 0.06 ng/g-wet weight 6/10/98 HRI-98-01A (Remnant #4) L3172-1 PCB-87 31 0.06 ng/g-wet weight 6/10/98 HRI-98-01A (Remnant #4) L3172-1 PCB-85 24 0.06 ng/g-wet weight 6/10/98 HRI-98-01A (Remnant #4) L3172-1 PCB-110 71 0.06 ng/g-wet weight
*See Qualifier Codes table at end. Page 2 of 75

Aquatic Insects Pesticide and PCB Data
SAMPLING DATE FIELD ID LABORATORY ID ANALYTE VALUE INTERPRETIVE
QUALIFIER*
QUALIFIER REASON CODE*
DETECTION LIMIT
UNITS
6/10/98 HRI-98-01A (Remnant #4) L3172-1 PCB-82 4.6 0.04 ng/g-wet weight 6/10/98 HRI-98-01A (Remnant #4) L3172-1 PCB-107 4.2 0.04 ng/g-wet weight 6/10/98 HRI-98-01A (Remnant #4) L3172-1 PCB-114 2.1 0.04 ng/g-wet weight 6/10/98 HRI-98-01A (Remnant #4) L3172-1 PCB-126 2.7 0.04 ng/g-wet weight 6/10/98 HRI-98-01A (Remnant #4) L3172-1 PCB-136 2.2 0.09 ng/g-wet weight 6/10/98 HRI-98-01A (Remnant #4) L3172-1 PCB-151 3.1 0.09 ng/g-wet weight 6/10/98 HRI-98-01A (Remnant #4) L3172-1 PCB-144/135 3.3 0.09 ng/g-wet weight 6/10/98 HRI-98-01A (Remnant #4) L3172-1 PCB-149 20 0.09 ng/g-wet weight 6/10/98 HRI-98-01A (Remnant #4) L3172-1 PCB-134 /143 0.95 0.09 ng/g-wet weight 6/10/98 HRI-98-01A (Remnant #4) L3172-1 PCB-131 0.31 0.09 ng/g-wet weight 6/10/98 HRI-98-01A (Remnant #4) L3172-1 PCB-146 3.5 0.06 ng/g-wet weight 6/10/98 HRI-98-01A (Remnant #4) L3172-1 PCB-118 72 0.04 ng/g-wet weight 6/10/98 HRI-98-01A (Remnant #4) L3172-1 PCB-123 2.3 0.04 ng/g-wet weight 6/10/98 HRI-98-01A (Remnant #4) L3172-1 PCB-105 36 0.04 ng/g-wet weight 6/10/98 HRI-98-01A (Remnant #4) L3172-1 PCB-153 37 0.08 ng/g-wet weight 6/10/98 HRI-98-01A (Remnant #4) L3172-1 PCB-132/168 9.7 0.13 ng/g-wet weight 6/10/98 HRI-98-01A (Remnant #4) L3172-1 PCB-141 5.7 0.13 ng/g-wet weight 6/10/98 HRI-98-01A (Remnant #4) L3172-1 PCB-130 2.2 0.10 ng/g-wet weight 6/10/98 HRI-98-01A (Remnant #4) L3172-1 PCB-137 2.3 0.10 ng/g-wet weight 6/10/98 HRI-98-01A (Remnant #4) L3172-1 PCB-138 47 0.10 ng/g-wet weight 6/10/98 HRI-98-01A (Remnant #4) L3172-1 PCB-158 5.3 0.10 ng/g-wet weight 6/10/98 HRI-98-01A (Remnant #4) L3172-1 PCB-129 1.4 0.10 ng/g-wet weight 6/10/98 HRI-98-01A (Remnant #4) L3172-1 PCB-128 8.5 0.13 ng/g-wet weight 6/10/98 HRI-98-01A (Remnant #4) L3172-1 PCB-167 1.7 0.10 ng/g-wet weight 6/10/98 HRI-98-01A (Remnant #4) L3172-1 PCB-156 6.6 0.15 ng/g-wet weight 6/10/98 HRI-98-01A (Remnant #4) L3172-1 PCB-157 1.6 0.15 ng/g-wet weight 6/10/98 HRI-98-01A (Remnant #4) L3172-1 PCB-169 ND U 0.10 ng/g-wet weight 6/10/98 HRI-98-01A (Remnant #4) L3172-1 PCB-184 0.74 U 21 0.12 ng/g-wet weight 6/10/98 HRI-98-01A (Remnant #4) L3172-1 PCB-179 1.0 0.12 ng/g-wet weight 6/10/98 HRI-98-01A (Remnant #4) L3172-1 PCB-176 0.37 0.12 ng/g-wet weight 6/10/98 HRI-98-01A (Remnant #4) L3172-1 PCB-178 1.1 0.12 ng/g-wet weight 6/10/98 HRI-98-01A (Remnant #4) L3172-1 PCB-175 0.23 0.12 ng/g-wet weight 6/10/98 HRI-98-01A (Remnant #4) L3172-1 PCB-187/182 5.5 0.12 ng/g-wet weight 6/10/98 HRI-98-01A (Remnant #4) L3172-1 PCB-183 2.7 0.15 ng/g-wet weight 6/10/98 HRI-98-01A (Remnant #4) L3172-1 PCB-185 0.36 0.15 ng/g-wet weight
*See Qualifier Codes table at end. Page 3 of 75

Aquatic Insects Pesticide and PCB Data
SAMPLING DATE FIELD ID LABORATORY ID ANALYTE VALUE INTERPRETIVE
QUALIFIER*
QUALIFIER REASON CODE*
DETECTION LIMIT
UNITS
6/10/98 HRI-98-01A (Remnant #4) L3172-1 PCB-174 /181 3.0 0.15 ng/g-wet weight 6/10/98 HRI-98-01A (Remnant #4) L3172-1 PCB-177 2.2 0.15 ng/g-wet weight 6/10/98 HRI-98-01A (Remnant #4) L3172-1 PCB-171 1.1 0.16 ng/g-wet weight 6/10/98 HRI-98-01A (Remnant #4) L3172-1 PCB-172 0.69 0.14 ng/g-wet weight 6/10/98 HRI-98-01A (Remnant #4) L3172-1 PCB-180 11 0.14 ng/g-wet weight 6/10/98 HRI-98-01A (Remnant #4) L3172-1 PCB-193 0.58 0.14 ng/g-wet weight 6/10/98 HRI-98-01A (Remnant #4) L3172-1 PCB-191 0.25 0.14 ng/g-wet weight 6/10/98 HRI-98-01A (Remnant #4) L3172-1 PCB-170 /190 5.6 0.2 ng/g-wet weight 6/10/98 HRI-98-01A (Remnant #4) L3172-1 PCB-189 0.29 0.2 ng/g-wet weight 6/10/98 HRI-98-01A (Remnant #4) L3172-1 PCB-201 (BZ#200) 0.26 0.23 ng/g-wet weight 6/10/98 HRI-98-01A (Remnant #4) L3172-1 PCB-197 ND U 0.41 ng/g-wet weight 6/10/98 HRI-98-01A (Remnant #4) L3172-1 PCB-200 (BZ#199) ND U 0.41 ng/g-wet weight 6/10/98 HRI-98-01A (Remnant #4) L3172-1 PCB-198 ND U 0.41 ng/g-wet weight 6/10/98 HRI-98-01A (Remnant #4) L3172-1 PCB-199 (BZ#201) 2.0 0.41 ng/g-wet weight 6/10/98 HRI-98-01A (Remnant #4) L3172-1 PCB-196/203 1.9 0.38 ng/g-wet weight 6/10/98 HRI-98-01A (Remnant #4) L3172-1 PCB-195 0.5 0.38 ng/g-wet weight 6/10/98 HRI-98-01A (Remnant #4) L3172-1 PCB-194 1.9 0.51 ng/g-wet weight 6/10/98 HRI-98-01A (Remnant #4) L3172-1 PCB-205 ND U 0.51 ng/g-wet weight 6/10/98 HRI-98-01A (Remnant #4) L3172-1 PCB-208 ND U 0.31 ng/g-wet weight 6/10/98 HRI-98-01A (Remnant #4) L3172-1 PCB-207 ND U 0.31 ng/g-wet weight 6/10/98 HRI-98-01A (Remnant #4) L3172-1 PCB-206 0.39 0.31 ng/g-wet weight 6/10/98 HRI-98-01A (Remnant #4) L3172-1 PCB-209 ND U 0.19 ng/g-wet weight 6/10/98 HRI-98-01B (Remnant #4) L3172-2 % Lipids 6.3 Percent 6/10/98 HRI-98-01B (Remnant #4) L3172-2 Hexachlorobenzene 0.53 0.09 ng/g-wet weight 6/10/98 HRI-98-01B (Remnant #4) L3172-2 alpha HCH ND U 0.73 ng/g-wet weight 6/10/98 HRI-98-01B (Remnant #4) L3172-2 beta HCH ND U 0.97 ng/g-wet weight 6/10/98 HRI-98-01B (Remnant #4) L3172-2 gamma HCH 3.4 U 21 0.73 ng/g-wet weight 6/10/98 HRI-98-01B (Remnant #4) L3172-2 delta HCH ND U 0.73 ng/g-wet weight 6/10/98 HRI-98-01B (Remnant #4) L3172-2 Heptachlor ND UJ 10 1.8 ng/g-wet weight 6/10/98 HRI-98-01B (Remnant #4) L3172-2 Aldrin ND UJ 10 0.36 ng/g-wet weight 6/10/98 HRI-98-01B (Remnant #4) L3172-2 Oxychlordane ND UJ 10 2.3 ng/g-wet weight 6/10/98 HRI-98-01B (Remnant #4) L3172-2 gamma-Chlordane (trans-) ND U 0.26 ng/g-wet weight 6/10/98 HRI-98-01B (Remnant #4) L3172-2 alpha-Chlordane (cis-) ND U 0.23 ng/g-wet weight 6/10/98 HRI-98-01B (Remnant #4) L3172-2 o,p'-DDE 0.19 U 21 0.17 ng/g-wet weight 6/10/98 HRI-98-01B (Remnant #4) L3172-2 p,p'-DDE 6.37 0.22 ng/g-wet weight
*See Qualifier Codes table at end. Page 4 of 75

Aquatic Insects Pesticide and PCB Data
SAMPLING DATE FIELD ID LABORATORY ID ANALYTE VALUE INTERPRETIVE
QUALIFIER*
QUALIFIER REASON CODE*
DETECTION LIMIT
UNITS
6/10/98 HRI-98-01B (Remnant #4) L3172-2 trans-Nonachlor 0.47 J 10 0.10 ng/g-wet weight 6/10/98 HRI-98-01B (Remnant #4) L3172-2 o,p'-DDD 0.13 0.08 ng/g-wet weight 6/10/98 HRI-98-01B (Remnant #4) L3172-2 p,p'-DDD 0.60 0.09 ng/g-wet weight 6/10/98 HRI-98-01B (Remnant #4) L3172-2 o,p'-DDT 0.21 0.16 ng/g-wet weight 6/10/98 HRI-98-01B (Remnant #4) L3172-2 p,p'-DDT 0.52 0.19 ng/g-wet weight 6/10/98 HRI-98-01B (Remnant #4) L3172-2 Mirex ND UJ 10 0.19 ng/g-wet weight 6/10/98 HRI-98-01B (Remnant #4) L3172-2 Photomirex R 5A 6/10/98 HRI-98-01B (Remnant #4) L3172-2 Heptachlor Epoxide 0.34 UJ 7,10 0.08 ng/g-wet weight 6/10/98 HRI-98-01B (Remnant #4) L3172-2 Dieldrin 0.34 NJ 3 0.07 ng/g-wet weight 6/10/98 HRI-98-01B (Remnant #4) L3172-2 Endrin ND UJ 10 0.13 ng/g-wet weight 6/10/98 HRI-98-01B (Remnant #4) L3172-2 Aroclor 1242 1400 NJ 14 2.6 ng/g-wet weight 6/10/98 HRI-98-01B (Remnant #4) L3172-2 Aroclor 1248 ND U 2.6 ng/g-wet weight 6/10/98 HRI-98-01B (Remnant #4) L3172-2 Aroclor 1254 970 NJ 14 4.0 ng/g-wet weight 6/10/98 HRI-98-01B (Remnant #4) L3172-2 Aroclor 1260 97 NJ 14 2.1 ng/g-wet weight 6/10/98 HRI-98-01B (Remnant #4) L3172-2 PCB-6 0.17 0.04 ng/g-wet weight 6/10/98 HRI-98-01B (Remnant #4) L3172-2 PCB-4/10 0.93 0.04 ng/g-wet weight 6/10/98 HRI-98-01B (Remnant #4) L3172-2 PCB-7/9 0.31 0.04 ng/g-wet weight 6/10/98 HRI-98-01B (Remnant #4) L3172-2 PCB-8/5 0.79 0.04 ng/g-wet weight 6/10/98 HRI-98-01B (Remnant #4) L3172-2 PCB-15 10 0.06 ng/g-wet weight 6/10/98 HRI-98-01B (Remnant #4) L3172-2 PCB-19 3.4 0.17 ng/g-wet weight 6/10/98 HRI-98-01B (Remnant #4) L3172-2 PCB-18 36 0.17 ng/g-wet weight 6/10/98 HRI-98-01B (Remnant #4) L3172-2 PCB-17 18 0.17 ng/g-wet weight 6/10/98 HRI-98-01B (Remnant #4) L3172-2 PCB-24/27 3.8 0.17 ng/g-wet weight 6/10/98 HRI-98-01B (Remnant #4) L3172-2 PCB-16/32 20 0.17 ng/g-wet weight 6/10/98 HRI-98-01B (Remnant #4) L3172-2 PCB-26 18 0.15 ng/g-wet weight 6/10/98 HRI-98-01B (Remnant #4) L3172-2 PCB-25 5.8 0.15 ng/g-wet weight 6/10/98 HRI-98-01B (Remnant #4) L3172-2 PCB-31/28 320 0.15 ng/g-wet weight 6/10/98 HRI-98-01B (Remnant #4) L3172-2 PCB-33 /20 30 0.15 ng/g-wet weight 6/10/98 HRI-98-01B (Remnant #4) L3172-2 PCB-22 11 0.15 ng/g-wet weight 6/10/98 HRI-98-01B (Remnant #4) L3172-2 PCB-37 50 0.15 ng/g-wet weight 6/10/98 HRI-98-01B (Remnant #4) L3172-2 PCB-53 15 0.22 ng/g-wet weight 6/10/98 HRI-98-01B (Remnant #4) L3172-2 PCB-45 6.2 0.22 ng/g-wet weight 6/10/98 HRI-98-01B (Remnant #4) L3172-2 PCB-46 3.1 0.22 ng/g-wet weight 6/10/98 HRI-98-01B (Remnant #4) L3172-2 PCB-52 120 0.22 ng/g-wet weight 6/10/98 HRI-98-01B (Remnant #4) L3172-2 PCB-49 140 0.28 ng/g-wet weight
*See Qualifier Codes table at end. Page 5 of 75

Aquatic Insects Pesticide and PCB Data
SAMPLING DATE FIELD ID LABORATORY ID ANALYTE VALUE INTERPRETIVE
QUALIFIER*
QUALIFIER REASON CODE*
DETECTION LIMIT
UNITS
6/10/98 HRI-98-01B (Remnant #4) L3172-2 PCB-47/48 110 0.28 ng/g-wet weight 6/10/98 HRI-98-01B (Remnant #4) L3172-2 PCB-44 89 0.26 ng/g-wet weight 6/10/98 HRI-98-01B (Remnant #4) L3172-2 PCB-42 51 0.26 ng/g-wet weight 6/10/98 HRI-98-01B (Remnant #4) L3172-2 PCB-41/71/64 120 0.26 ng/g-wet weight 6/10/98 HRI-98-01B (Remnant #4) L3172-2 PCB-40 2.7 0.3 ng/g-wet weight 6/10/98 HRI-98-01B (Remnant #4) L3172-2 PCB-74 /61 170 0.3 ng/g-wet weight 6/10/98 HRI-98-01B (Remnant #4) L3172-2 PCB-70/76 270 0.3 ng/g-wet weight 6/10/98 HRI-98-01B (Remnant #4) L3172-2 PCB-66 /80 180 0.18 ng/g-wet weight 6/10/98 HRI-98-01B (Remnant #4) L3172-2 PCB-81 4.0 0.18 ng/g-wet weight 6/10/98 HRI-98-01B (Remnant #4) L3172-2 PCB-56/60 82 0.18 ng/g-wet weight 6/10/98 HRI-98-01B (Remnant #4) L3172-2 PCB-77 17 U 21 0.18 ng/g-wet weight 6/10/98 HRI-98-01B (Remnant #4) L3172-2 PCB-95 24 0.1 ng/g-wet weight 6/10/98 HRI-98-01B (Remnant #4) L3172-2 PCB-119 1.5 0.1 ng/g-wet weight 6/10/98 HRI-98-01B (Remnant #4) L3172-2 PCB-91 7.2 0.1 ng/g-wet weight 6/10/98 HRI-98-01B (Remnant #4) L3172-2 PCB-84 5.9 0.1 ng/g-wet weight 6/10/98 HRI-98-01B (Remnant #4) L3172-2 PCB-90/101/89 52 0.1 ng/g-wet weight 6/10/98 HRI-98-01B (Remnant #4) L3172-2 PCB-99 34 0.1 ng/g-wet weight 6/10/98 HRI-98-01B (Remnant #4) L3172-2 PCB-83 3.1 0.16 ng/g-wet weight 6/10/98 HRI-98-01B (Remnant #4) L3172-2 PCB-97 /86 24 0.16 ng/g-wet weight 6/10/98 HRI-98-01B (Remnant #4) L3172-2 PCB-87 38 0.16 ng/g-wet weight 6/10/98 HRI-98-01B (Remnant #4) L3172-2 PCB-85 27 0.16 ng/g-wet weight 6/10/98 HRI-98-01B (Remnant #4) L3172-2 PCB-110 82 0.16 ng/g-wet weight 6/10/98 HRI-98-01B (Remnant #4) L3172-2 PCB-82 5.2 0.1 ng/g-wet weight 6/10/98 HRI-98-01B (Remnant #4) L3172-2 PCB-107 4.4 0.1 ng/g-wet weight 6/10/98 HRI-98-01B (Remnant #4) L3172-2 PCB-114 2.3 0.1 ng/g-wet weight 6/10/98 HRI-98-01B (Remnant #4) L3172-2 PCB-126 3.0 0.09 ng/g-wet weight 6/10/98 HRI-98-01B (Remnant #4) L3172-2 PCB-136 2.6 0.19 ng/g-wet weight 6/10/98 HRI-98-01B (Remnant #4) L3172-2 PCB-151 3.6 0.19 ng/g-wet weight 6/10/98 HRI-98-01B (Remnant #4) L3172-2 PCB-144/135 3.7 0.19 ng/g-wet weight 6/10/98 HRI-98-01B (Remnant #4) L3172-2 PCB-149 22 0.19 ng/g-wet weight 6/10/98 HRI-98-01B (Remnant #4) L3172-2 PCB-134 /143 1.1 0.19 ng/g-wet weight 6/10/98 HRI-98-01B (Remnant #4) L3172-2 PCB-131 0.44 0.19 ng/g-wet weight 6/10/98 HRI-98-01B (Remnant #4) L3172-2 PCB-146 3.5 0.12 ng/g-wet weight 6/10/98 HRI-98-01B (Remnant #4) L3172-2 PCB-118 76 0.10 ng/g-wet weight 6/10/98 HRI-98-01B (Remnant #4) L3172-2 PCB-123 2.7 0.10 ng/g-wet weight
*See Qualifier Codes table at end. Page 6 of 75

Aquatic Insects Pesticide and PCB Data
SAMPLING DATE FIELD ID LABORATORY ID ANALYTE VALUE INTERPRETIVE
QUALIFIER*
QUALIFIER REASON CODE*
DETECTION LIMIT
UNITS
6/10/98 HRI-98-01B (Remnant #4) L3172-2 PCB-105 38 0.1 ng/g-wet weight 6/10/98 HRI-98-01B (Remnant #4) L3172-2 PCB-153 38 0.14 ng/g-wet weight 6/10/98 HRI-98-01B (Remnant #4) L3172-2 PCB-132/168 11 0.22 ng/g-wet weight 6/10/98 HRI-98-01B (Remnant #4) L3172-2 PCB-141 5.9 0.22 ng/g-wet weight 6/10/98 HRI-98-01B (Remnant #4) L3172-2 PCB-130 2.4 0.17 ng/g-wet weight 6/10/98 HRI-98-01B (Remnant #4) L3172-2 PCB-137 2.3 0.17 ng/g-wet weight 6/10/98 HRI-98-01B (Remnant #4) L3172-2 PCB-138 49 0.17 ng/g-wet weight 6/10/98 HRI-98-01B (Remnant #4) L3172-2 PCB-158 5.6 0.17 ng/g-wet weight 6/10/98 HRI-98-01B (Remnant #4) L3172-2 PCB-129 1.5 0.17 ng/g-wet weight 6/10/98 HRI-98-01B (Remnant #4) L3172-2 PCB-128 9.0 0.24 ng/g-wet weight 6/10/98 HRI-98-01B (Remnant #4) L3172-2 PCB-167 1.7 0.17 ng/g-wet weight 6/10/98 HRI-98-01B (Remnant #4) L3172-2 PCB-156 6.7 0.26 ng/g-wet weight 6/10/98 HRI-98-01B (Remnant #4) L3172-2 PCB-157 1.6 0.26 ng/g-wet weight 6/10/98 HRI-98-01B (Remnant #4) L3172-2 PCB-169 ND U 0.17 ng/g-wet weight 6/10/98 HRI-98-01B (Remnant #4) L3172-2 PCB-184 0.78 U 21 0.12 ng/g-wet weight 6/10/98 HRI-98-01B (Remnant #4) L3172-2 PCB-179 1.1 0.12 ng/g-wet weight 6/10/98 HRI-98-01B (Remnant #4) L3172-2 PCB-176 0.43 0.12 ng/g-wet weight 6/10/98 HRI-98-01B (Remnant #4) L3172-2 PCB-178 1.1 0.12 ng/g-wet weight 6/10/98 HRI-98-01B (Remnant #4) L3172-2 PCB-175 0.26 0.12 ng/g-wet weight 6/10/98 HRI-98-01B (Remnant #4) L3172-2 PCB-187/182 5.5 0.12 ng/g-wet weight 6/10/98 HRI-98-01B (Remnant #4) L3172-2 PCB-183 2.8 0.14 ng/g-wet weight 6/10/98 HRI-98-01B (Remnant #4) L3172-2 PCB-185 0.41 0.14 ng/g-wet weight 6/10/98 HRI-98-01B (Remnant #4) L3172-2 PCB-174 /181 3.0 0.14 ng/g-wet weight 6/10/98 HRI-98-01B (Remnant #4) L3172-2 PCB-177 2.3 0.14 ng/g-wet weight 6/10/98 HRI-98-01B (Remnant #4) L3172-2 PCB-171 1.2 0.15 ng/g-wet weight 6/10/98 HRI-98-01B (Remnant #4) L3172-2 PCB-172 0.72 0.13 ng/g-wet weight 6/10/98 HRI-98-01B (Remnant #4) L3172-2 PCB-180 11 0.13 ng/g-wet weight 6/10/98 HRI-98-01B (Remnant #4) L3172-2 PCB-193 0.58 0.13 ng/g-wet weight 6/10/98 HRI-98-01B (Remnant #4) L3172-2 PCB-191 0.21 0.13 ng/g-wet weight 6/10/98 HRI-98-01B (Remnant #4) L3172-2 PCB-170 /190 5.9 0.18 ng/g-wet weight 6/10/98 HRI-98-01B (Remnant #4) L3172-2 PCB-189 0.33 0.18 ng/g-wet weight 6/10/98 HRI-98-01B (Remnant #4) L3172-2 PCB-201 (BZ#200) 0.24 0.15 ng/g-wet weight 6/10/98 HRI-98-01B (Remnant #4) L3172-2 PCB-197 ND U 0.26 ng/g-wet weight 6/10/98 HRI-98-01B (Remnant #4) L3172-2 PCB-200 (BZ#199) ND U 0.26 ng/g-wet weight 6/10/98 HRI-98-01B (Remnant #4) L3172-2 PCB-198 ND U 0.26 ng/g-wet weight
*See Qualifier Codes table at end. Page 7 of 75

Aquatic Insects Pesticide and PCB Data
SAMPLING DATE FIELD ID LABORATORY ID ANALYTE VALUE INTERPRETIVE
QUALIFIER*
QUALIFIER REASON CODE*
DETECTION LIMIT
UNITS
6/10/98 HRI-98-01B (Remnant #4) L3172-2 PCB-199 (BZ#201) 2.2 0.26 ng/g-wet weight 6/10/98 HRI-98-01B (Remnant #4) L3172-2 PCB-196/203 2.1 0.24 ng/g-wet weight 6/10/98 HRI-98-01B (Remnant #4) L3172-2 PCB-195 0.45 0.24 ng/g-wet weight 6/10/98 HRI-98-01B (Remnant #4) L3172-2 PCB-194 2.0 0.32 ng/g-wet weight 6/10/98 HRI-98-01B (Remnant #4) L3172-2 PCB-205 ND U 0.32 ng/g-wet weight 6/10/98 HRI-98-01B (Remnant #4) L3172-2 PCB-208 ND U 0.25 ng/g-wet weight 6/10/98 HRI-98-01B (Remnant #4) L3172-2 PCB-207 ND U 0.25 ng/g-wet weight 6/10/98 HRI-98-01B (Remnant #4) L3172-2 PCB-206 0.4 0.25 ng/g-wet weight 6/10/98 HRI-98-01B (Remnant #4) L3172-2 PCB-209 ND U 0.14 ng/g-wet weight 6/10/98 HRI-98-01C (Remnant #4) L3172-3 % Lipids 6.4 Percent 6/10/98 HRI-98-01C (Remnant #4) L3172-3 Hexachlorobenzene 0.59 0.14 ng/g-wet weight 6/10/98 HRI-98-01C (Remnant #4) L3172-3 alpha HCH ND U 0.72 ng/g-wet weight 6/10/98 HRI-98-01C (Remnant #4) L3172-3 beta HCH ND U 0.96 ng/g-wet weight 6/10/98 HRI-98-01C (Remnant #4) L3172-3 gamma HCH 3.8 U 21 0.72 ng/g-wet weight 6/10/98 HRI-98-01C (Remnant #4) L3172-3 delta HCH ND U 0.72 ng/g-wet weight 6/10/98 HRI-98-01C (Remnant #4) L3172-3 Heptachlor ND UJ 10 1.8 ng/g-wet weight 6/10/98 HRI-98-01C (Remnant #4) L3172-3 Aldrin ND UJ 10 0.26 ng/g-wet weight 6/10/98 HRI-98-01C (Remnant #4) L3172-3 Oxychlordane ND UJ 10 2.1 ng/g-wet weight 6/10/98 HRI-98-01C (Remnant #4) L3172-3 gamma-Chlordane (trans-) ND U 0.25 ng/g-wet weight 6/10/98 HRI-98-01C (Remnant #4) L3172-3 alpha-Chlordane (cis-) ND U 0.22 ng/g-wet weight 6/10/98 HRI-98-01C (Remnant #4) L3172-3 o,p'-DDE ND U 0.24 ng/g-wet weight 6/10/98 HRI-98-01C (Remnant #4) L3172-3 p,p'-DDE 6.2 0.31 ng/g-wet weight 6/10/98 HRI-98-01C (Remnant #4) L3172-3 trans-Nonachlor 0.34 J 10 0.14 ng/g-wet weight 6/10/98 HRI-98-01C (Remnant #4) L3172-3 o,p'-DDD ND U 0.14 ng/g-wet weight 6/10/98 HRI-98-01C (Remnant #4) L3172-3 p,p'-DDD 0.71 0.15 ng/g-wet weight 6/10/98 HRI-98-01C (Remnant #4) L3172-3 o,p'-DDT 0.21 0.21 ng/g-wet weight 6/10/98 HRI-98-01C (Remnant #4) L3172-3 p,p'-DDT 0.44 0.25 ng/g-wet weight 6/10/98 HRI-98-01C (Remnant #4) L3172-3 Mirex ND UJ 10 0.23 ng/g-wet weight 6/10/98 HRI-98-01C (Remnant #4) L3172-3 Photomirex R 5A 6/10/98 HRI-98-01C (Remnant #4) L3172-3 Heptachlor Epoxide ND UJ 10 0.17 ng/g-wet weight 6/10/98 HRI-98-01C (Remnant #4) L3172-3 Dieldrin 0.32 NJ 3 0.15 ng/g-wet weight 6/10/98 HRI-98-01C (Remnant #4) L3172-3 Endrin ND UJ 10 0.36 ng/g-wet weight 6/10/98 HRI-98-01C (Remnant #4) L3172-3 Aroclor 1242 1200 NJ 14 3.1 ng/g-wet weight 6/10/98 HRI-98-01C (Remnant #4) L3172-3 Aroclor 1248 ND U 3.1 ng/g-wet weight 6/10/98 HRI-98-01C (Remnant #4) L3172-3 Aroclor 1254 820 NJ 14 13 ng/g-wet weight
*See Qualifier Codes table at end. Page 8 of 75

Aquatic Insects Pesticide and PCB Data
SAMPLING DATE FIELD ID LABORATORY ID ANALYTE VALUE INTERPRETIVE
QUALIFIER*
QUALIFIER REASON CODE*
DETECTION LIMIT
UNITS
6/10/98 HRI-98-01C (Remnant #4) L3172-3 Aroclor 1260 85 NJ 14 5.8 ng/g-wet weight 6/10/98 HRI-98-01C (Remnant #4) L3172-3 PCB-6 0.28 0.07 ng/g-wet weight 6/10/98 HRI-98-01C (Remnant #4) L3172-3 PCB-4/10 2.1 0.07 ng/g-wet weight 6/10/98 HRI-98-01C (Remnant #4) L3172-3 PCB-7/9 0.8 0.07 ng/g-wet weight 6/10/98 HRI-98-01C (Remnant #4) L3172-3 PCB-8/5 3.3 0.07 ng/g-wet weight 6/10/98 HRI-98-01C (Remnant #4) L3172-3 PCB-15 13 0.12 ng/g-wet weight 6/10/98 HRI-98-01C (Remnant #4) L3172-3 PCB-19 4.8 0.21 ng/g-wet weight 6/10/98 HRI-98-01C (Remnant #4) L3172-3 PCB-18 37 0.21 ng/g-wet weight 6/10/98 HRI-98-01C (Remnant #4) L3172-3 PCB-17 17 0.21 ng/g-wet weight 6/10/98 HRI-98-01C (Remnant #4) L3172-3 PCB-24/27 4.2 0.21 ng/g-wet weight 6/10/98 HRI-98-01C (Remnant #4) L3172-3 PCB-16/32 19 0.21 ng/g-wet weight 6/10/98 HRI-98-01C (Remnant #4) L3172-3 PCB-26 17 0.18 ng/g-wet weight 6/10/98 HRI-98-01C (Remnant #4) L3172-3 PCB-25 5.2 0.18 ng/g-wet weight 6/10/98 HRI-98-01C (Remnant #4) L3172-3 PCB-31/28 260 0.18 ng/g-wet weight 6/10/98 HRI-98-01C (Remnant #4) L3172-3 PCB-33 /20 30 0.18 ng/g-wet weight 6/10/98 HRI-98-01C (Remnant #4) L3172-3 PCB-22 10 0.18 ng/g-wet weight 6/10/98 HRI-98-01C (Remnant #4) L3172-3 PCB-37 49 0.18 ng/g-wet weight 6/10/98 HRI-98-01C (Remnant #4) L3172-3 PCB-53 13 0.25 ng/g-wet weight 6/10/98 HRI-98-01C (Remnant #4) L3172-3 PCB-45 5.3 0.25 ng/g-wet weight 6/10/98 HRI-98-01C (Remnant #4) L3172-3 PCB-46 2.6 0.25 ng/g-wet weight 6/10/98 HRI-98-01C (Remnant #4) L3172-3 PCB-52 100 0.25 ng/g-wet weight 6/10/98 HRI-98-01C (Remnant #4) L3172-3 PCB-49 100 0.31 ng/g-wet weight 6/10/98 HRI-98-01C (Remnant #4) L3172-3 PCB-47/48 81 0.31 ng/g-wet weight 6/10/98 HRI-98-01C (Remnant #4) L3172-3 PCB-44 71 0.29 ng/g-wet weight 6/10/98 HRI-98-01C (Remnant #4) L3172-3 PCB-42 40 0.29 ng/g-wet weight 6/10/98 HRI-98-01C (Remnant #4) L3172-3 PCB-41/71/64 92 0.29 ng/g-wet weight 6/10/98 HRI-98-01C (Remnant #4) L3172-3 PCB-40 2.8 0.34 ng/g-wet weight 6/10/98 HRI-98-01C (Remnant #4) L3172-3 PCB-74 /61 150 0.34 ng/g-wet weight 6/10/98 HRI-98-01C (Remnant #4) L3172-3 PCB-70/76 260 0.34 ng/g-wet weight 6/10/98 HRI-98-01C (Remnant #4) L3172-3 PCB-66 /80 170 0.2 ng/g-wet weight 6/10/98 HRI-98-01C (Remnant #4) L3172-3 PCB-81 4.1 0.2 ng/g-wet weight 6/10/98 HRI-98-01C (Remnant #4) L3172-3 PCB-56/60 84 0.2 ng/g-wet weight 6/10/98 HRI-98-01C (Remnant #4) L3172-3 PCB-77 19 U 21 0.2 ng/g-wet weight 6/10/98 HRI-98-01C (Remnant #4) L3172-3 PCB-95 22 0.33 ng/g-wet weight 6/10/98 HRI-98-01C (Remnant #4) L3172-3 PCB-119 1.3 0.33 ng/g-wet weight
*See Qualifier Codes table at end. Page 9 of 75

Aquatic Insects Pesticide and PCB Data
SAMPLING DATE FIELD ID LABORATORY ID ANALYTE VALUE INTERPRETIVE
QUALIFIER*
QUALIFIER REASON CODE*
DETECTION LIMIT
UNITS
6/10/98 HRI-98-01C (Remnant #4) L3172-3 PCB-91 6.9 0.33 ng/g-wet weight 6/10/98 HRI-98-01C (Remnant #4) L3172-3 PCB-84 5.7 0.33 ng/g-wet weight 6/10/98 HRI-98-01C (Remnant #4) L3172-3 PCB-90/101/89 46 0.33 ng/g-wet weight 6/10/98 HRI-98-01C (Remnant #4) L3172-3 PCB-99 26 0.33 ng/g-wet weight 6/10/98 HRI-98-01C (Remnant #4) L3172-3 PCB-83 2.8 0.53 ng/g-wet weight 6/10/98 HRI-98-01C (Remnant #4) L3172-3 PCB-97 /86 21 0.53 ng/g-wet weight 6/10/98 HRI-98-01C (Remnant #4) L3172-3 PCB-87 36 0.53 ng/g-wet weight 6/10/98 HRI-98-01C (Remnant #4) L3172-3 PCB-85 23 0.53 ng/g-wet weight 6/10/98 HRI-98-01C (Remnant #4) L3172-3 PCB-110 76 0.53 ng/g-wet weight 6/10/98 HRI-98-01C (Remnant #4) L3172-3 PCB-82 5.5 0.33 ng/g-wet weight 6/10/98 HRI-98-01C (Remnant #4) L3172-3 PCB-107 4.9 0.33 ng/g-wet weight 6/10/98 HRI-98-01C (Remnant #4) L3172-3 PCB-114 2.5 0.33 ng/g-wet weight 6/10/98 HRI-98-01C (Remnant #4) L3172-3 PCB-126 2.9 0.3 ng/g-wet weight 6/10/98 HRI-98-01C (Remnant #4) L3172-3 PCB-136 2.9 0.25 ng/g-wet weight 6/10/98 HRI-98-01C (Remnant #4) L3172-3 PCB-151 3.1 0.25 ng/g-wet weight 6/10/98 HRI-98-01C (Remnant #4) L3172-3 PCB-144/135 3.5 0.25 ng/g-wet weight 6/10/98 HRI-98-01C (Remnant #4) L3172-3 PCB-149 19 0.25 ng/g-wet weight 6/10/98 HRI-98-01C (Remnant #4) L3172-3 PCB-134 /143 1.0 0.25 ng/g-wet weight 6/10/98 HRI-98-01C (Remnant #4) L3172-3 PCB-131 0.48 0.25 ng/g-wet weight 6/10/98 HRI-98-01C (Remnant #4) L3172-3 PCB-146 3.7 0.16 ng/g-wet weight 6/10/98 HRI-98-01C (Remnant #4) L3172-3 PCB-118 69 0.31 ng/g-wet weight 6/10/98 HRI-98-01C (Remnant #4) L3172-3 PCB-123 2.5 0.31 ng/g-wet weight 6/10/98 HRI-98-01C (Remnant #4) L3172-3 PCB-105 34 0.26 ng/g-wet weight 6/10/98 HRI-98-01C (Remnant #4) L3172-3 PCB-153 30 0.17 ng/g-wet weight 6/10/98 HRI-98-01C (Remnant #4) L3172-3 PCB-132/168 8.7 0.27 ng/g-wet weight 6/10/98 HRI-98-01C (Remnant #4) L3172-3 PCB-141 5.4 0.27 ng/g-wet weight 6/10/98 HRI-98-01C (Remnant #4) L3172-3 PCB-130 2.0 0.21 ng/g-wet weight 6/10/98 HRI-98-01C (Remnant #4) L3172-3 PCB-137 1.9 0.21 ng/g-wet weight 6/10/98 HRI-98-01C (Remnant #4) L3172-3 PCB-138 39 0.21 ng/g-wet weight 6/10/98 HRI-98-01C (Remnant #4) L3172-3 PCB-158 4.2 0.21 ng/g-wet weight 6/10/98 HRI-98-01C (Remnant #4) L3172-3 PCB-129 1.5 0.21 ng/g-wet weight 6/10/98 HRI-98-01C (Remnant #4) L3172-3 PCB-128 8.3 0.29 ng/g-wet weight 6/10/98 HRI-98-01C (Remnant #4) L3172-3 PCB-167 1.8 0.21 ng/g-wet weight 6/10/98 HRI-98-01C (Remnant #4) L3172-3 PCB-156 7.1 0.31 ng/g-wet weight 6/10/98 HRI-98-01C (Remnant #4) L3172-3 PCB-157 1.7 0.31 ng/g-wet weight
*See Qualifier Codes table at end. Page 10 of 75

Aquatic Insects Pesticide and PCB Data
SAMPLING DATE FIELD ID LABORATORY ID ANALYTE VALUE INTERPRETIVE
QUALIFIER*
QUALIFIER REASON CODE*
DETECTION LIMIT
UNITS
6/10/98 HRI-98-01C (Remnant #4) L3172-3 PCB-169 ND U 0.21 ng/g-wet weight 6/10/98 HRI-98-01C (Remnant #4) L3172-3 PCB-184 0.47 U 21 0.31 ng/g-wet weight 6/10/98 HRI-98-01C (Remnant #4) L3172-3 PCB-179 0.93 0.31 ng/g-wet weight 6/10/98 HRI-98-01C (Remnant #4) L3172-3 PCB-176 0.32 0.31 ng/g-wet weight 6/10/98 HRI-98-01C (Remnant #4) L3172-3 PCB-178 0.76 0.31 ng/g-wet weight 6/10/98 HRI-98-01C (Remnant #4) L3172-3 PCB-175 ND U 0.31 ng/g-wet weight 6/10/98 HRI-98-01C (Remnant #4) L3172-3 PCB-187/182 3.9 0.31 ng/g-wet weight 6/10/98 HRI-98-01C (Remnant #4) L3172-3 PCB-183 2.0 0.36 ng/g-wet weight 6/10/98 HRI-98-01C (Remnant #4) L3172-3 PCB-185 0.44 0.36 ng/g-wet weight 6/10/98 HRI-98-01C (Remnant #4) L3172-3 PCB-174 /181 2.6 0.36 ng/g-wet weight 6/10/98 HRI-98-01C (Remnant #4) L3172-3 PCB-177 2.2 0.36 ng/g-wet weight 6/10/98 HRI-98-01C (Remnant #4) L3172-3 PCB-171 1.3 0.4 ng/g-wet weight 6/10/98 HRI-98-01C (Remnant #4) L3172-3 PCB-172 0.91 0.35 ng/g-wet weight 6/10/98 HRI-98-01C (Remnant #4) L3172-3 PCB-180 9.5 0.35 ng/g-wet weight 6/10/98 HRI-98-01C (Remnant #4) L3172-3 PCB-193 0.58 0.35 ng/g-wet weight 6/10/98 HRI-98-01C (Remnant #4) L3172-3 PCB-191 ND U 0.35 ng/g-wet weight 6/10/98 HRI-98-01C (Remnant #4) L3172-3 PCB-170 /190 5.7 0.49 ng/g-wet weight 6/10/98 HRI-98-01C (Remnant #4) L3172-3 PCB-189 ND U 0.49 ng/g-wet weight 6/10/98 HRI-98-01C (Remnant #4) L3172-3 PCB-201 (BZ#200) ND U 0.4 ng/g-wet weight 6/10/98 HRI-98-01C (Remnant #4) L3172-3 PCB-197 ND U 0.72 ng/g-wet weight 6/10/98 HRI-98-01C (Remnant #4) L3172-3 PCB-200 (BZ#199) ND U 0.72 ng/g-wet weight 6/10/98 HRI-98-01C (Remnant #4) L3172-3 PCB-198 ND U 0.72 ng/g-wet weight 6/10/98 HRI-98-01C (Remnant #4) L3172-3 PCB-199 (BZ#201) 1.8 0.72 ng/g-wet weight 6/10/98 HRI-98-01C (Remnant #4) L3172-3 PCB-196/203 1.8 0.66 ng/g-wet weight 6/10/98 HRI-98-01C (Remnant #4) L3172-3 PCB-195 ND U 0.66 ng/g-wet weight 6/10/98 HRI-98-01C (Remnant #4) L3172-3 PCB-194 2.2 0.88 ng/g-wet weight 6/10/98 HRI-98-01C (Remnant #4) L3172-3 PCB-205 ND U 0.88 ng/g-wet weight 6/10/98 HRI-98-01C (Remnant #4) L3172-3 PCB-208 ND U 0.68 ng/g-wet weight 6/10/98 HRI-98-01C (Remnant #4) L3172-3 PCB-207 ND U 0.68 ng/g-wet weight 6/10/98 HRI-98-01C (Remnant #4) L3172-3 PCB-206 ND U 0.68 ng/g-wet weight 6/10/98 HRI-98-01C (Remnant #4) L3172-3 PCB-209 ND U 0.3 ng/g-wet weight 6/10/98 HRI-98-01D (Remnant #4) L3172-4 % Lipids 6.3 Percent 6/10/98 HRI-98-01D (Remnant #4) L3172-4 Hexachlorobenzene 0.55 0.17 ng/g-wet weight 6/10/98 HRI-98-01D (Remnant #4) L3172-4 alpha HCH ND U 0.25 ng/g-wet weight 6/10/98 HRI-98-01D (Remnant #4) L3172-4 beta HCH ND U 0.33 ng/g-wet weight
*See Qualifier Codes table at end. Page 11 of 75

Aquatic Insects Pesticide and PCB Data
SAMPLING DATE FIELD ID LABORATORY ID ANALYTE VALUE INTERPRETIVE
QUALIFIER*
QUALIFIER REASON CODE*
DETECTION LIMIT
UNITS
6/10/98 HRI-98-01D (Remnant #4) L3172-4 gamma HCH 3.1 U 21 0.24 ng/g-wet weight 6/10/98 HRI-98-01D (Remnant #4) L3172-4 delta HCH ND U 0.24 ng/g-wet weight 6/10/98 HRI-98-01D (Remnant #4) L3172-4 Heptachlor ND UJ 10 1.9 ng/g-wet weight 6/10/98 HRI-98-01D (Remnant #4) L3172-4 Aldrin ND UJ 10 0.21 ng/g-wet weight 6/10/98 HRI-98-01D (Remnant #4) L3172-4 Oxychlordane ND UJ 10 1.5 ng/g-wet weight 6/10/98 HRI-98-01D (Remnant #4) L3172-4 gamma-Chlordane (trans-) ND U 0.2 ng/g-wet weight 6/10/98 HRI-98-01D (Remnant #4) L3172-4 alpha-Chlordane (cis-) 0.20 0.18 ng/g-wet weight 6/10/98 HRI-98-01D (Remnant #4) L3172-4 o,p'-DDE 0.16 U 21 0.08 ng/g-wet weight 6/10/98 HRI-98-01D (Remnant #4) L3172-4 p,p'-DDE 6.37 0.1 ng/g-wet weight 6/10/98 HRI-98-01D (Remnant #4) L3172-4 trans-Nonachlor 0.41 J 10 0.12 ng/g-wet weight 6/10/98 HRI-98-01D (Remnant #4) L3172-4 o,p'-DDD 0.10 0.05 ng/g-wet weight 6/10/98 HRI-98-01D (Remnant #4) L3172-4 p,p'-DDD 0.48 0.05 ng/g-wet weight 6/10/98 HRI-98-01D (Remnant #4) L3172-4 o,p'-DDT 0.22 0.08 ng/g-wet weight 6/10/98 HRI-98-01D (Remnant #4) L3172-4 p,p'-DDT 0.42 0.10 ng/g-wet weight 6/10/98 HRI-98-01D (Remnant #4) L3172-4 Mirex ND UJ 10 0.22 ng/g-wet weight 6/10/98 HRI-98-01D (Remnant #4) L3172-4 Photomirex R 5A 6/10/98 HRI-98-01D (Remnant #4) L3172-4 Heptachlor Epoxide 0.15 UJ 7,10 0.07 ng/g-wet weight 6/10/98 HRI-98-01D (Remnant #4) L3172-4 Dieldrin 0.32 NJ 3 0.07 ng/g-wet weight 6/10/98 HRI-98-01D (Remnant #4) L3172-4 Endrin ND UJ 10 0.12 ng/g-wet weight 6/10/98 HRI-98-01D (Remnant #4) L3172-4 Aroclor 1242 750 NJ 14 1.5 ng/g-wet weight 6/10/98 HRI-98-01D (Remnant #4) L3172-4 Aroclor 1248 ND U 1.5 ng/g-wet weight 6/10/98 HRI-98-01D (Remnant #4) L3172-4 Aroclor 1254 800 NJ 14 2.0 ng/g-wet weight 6/10/98 HRI-98-01D (Remnant #4) L3172-4 Aroclor 1260 96 NJ 14 2.6 ng/g-wet weight 6/10/98 HRI-98-01D (Remnant #4) L3172-4 PCB-6 0.16 0.03 ng/g-wet weight 6/10/98 HRI-98-01D (Remnant #4) L3172-4 PCB-4/10 1.7 0.05 ng/g-wet weight 6/10/98 HRI-98-01D (Remnant #4) L3172-4 PCB-7/9 0.28 0.05 ng/g-wet weight 6/10/98 HRI-98-01D (Remnant #4) L3172-4 PCB-8/5 0.98 0.05 ng/g-wet weight 6/10/98 HRI-98-01D (Remnant #4) L3172-4 PCB-15 6.4 0.07 ng/g-wet weight 6/10/98 HRI-98-01D (Remnant #4) L3172-4 PCB-19 4.0 0.1 ng/g-wet weight 6/10/98 HRI-98-01D (Remnant #4) L3172-4 PCB-18 19 0.1 ng/g-wet weight 6/10/98 HRI-98-01D (Remnant #4) L3172-4 PCB-17 9.8 0.1 ng/g-wet weight 6/10/98 HRI-98-01D (Remnant #4) L3172-4 PCB-24/27 3.3 0.1 ng/g-wet weight 6/10/98 HRI-98-01D (Remnant #4) L3172-4 PCB-16/32 12 0.1 ng/g-wet weight 6/10/98 HRI-98-01D (Remnant #4) L3172-4 PCB-26 9.7 0.09 ng/g-wet weight 6/10/98 HRI-98-01D (Remnant #4) L3172-4 PCB-25 3.4 0.09 ng/g-wet weight
*See Qualifier Codes table at end. Page 12 of 75

Aquatic Insects Pesticide and PCB Data
SAMPLING DATE FIELD ID LABORATORY ID ANALYTE VALUE INTERPRETIVE
QUALIFIER*
QUALIFIER REASON CODE*
DETECTION LIMIT
UNITS
6/10/98 HRI-98-01D (Remnant #4) L3172-4 PCB-31/28 180 0.09 ng/g-wet weight 6/10/98 HRI-98-01D (Remnant #4) L3172-4 PCB-33 /20 13 0.09 ng/g-wet weight 6/10/98 HRI-98-01D (Remnant #4) L3172-4 PCB-22 6.3 0.09 ng/g-wet weight 6/10/98 HRI-98-01D (Remnant #4) L3172-4 PCB-37 27 0.09 ng/g-wet weight 6/10/98 HRI-98-01D (Remnant #4) L3172-4 PCB-53 9.8 0.10 ng/g-wet weight 6/10/98 HRI-98-01D (Remnant #4) L3172-4 PCB-45 3.7 0.10 ng/g-wet weight 6/10/98 HRI-98-01D (Remnant #4) L3172-4 PCB-46 1.9 0.10 ng/g-wet weight 6/10/98 HRI-98-01D (Remnant #4) L3172-4 PCB-52 84 0.10 ng/g-wet weight 6/10/98 HRI-98-01D (Remnant #4) L3172-4 PCB-49 93 0.12 ng/g-wet weight 6/10/98 HRI-98-01D (Remnant #4) L3172-4 PCB-47/48 82 0.12 ng/g-wet weight 6/10/98 HRI-98-01D (Remnant #4) L3172-4 PCB-44 54 0.11 ng/g-wet weight 6/10/98 HRI-98-01D (Remnant #4) L3172-4 PCB-42 33 0.11 ng/g-wet weight 6/10/98 HRI-98-01D (Remnant #4) L3172-4 PCB-41/71/64 70 0.11 ng/g-wet weight 6/10/98 HRI-98-01D (Remnant #4) L3172-4 PCB-40 2.0 0.13 ng/g-wet weight 6/10/98 HRI-98-01D (Remnant #4) L3172-4 PCB-74 /61 120 0.13 ng/g-wet weight 6/10/98 HRI-98-01D (Remnant #4) L3172-4 PCB-70/76 170 0.13 ng/g-wet weight 6/10/98 HRI-98-01D (Remnant #4) L3172-4 PCB-66 /80 140 0.08 ng/g-wet weight 6/10/98 HRI-98-01D (Remnant #4) L3172-4 PCB-81 3.0 0.08 ng/g-wet weight 6/10/98 HRI-98-01D (Remnant #4) L3172-4 PCB-56/60 57 0.08 ng/g-wet weight 6/10/98 HRI-98-01D (Remnant #4) L3172-4 PCB-77 12 U 21 0.08 ng/g-wet weight 6/10/98 HRI-98-01D (Remnant #4) L3172-4 PCB-95 20 0.05 ng/g-wet weight 6/10/98 HRI-98-01D (Remnant #4) L3172-4 PCB-119 1.2 0.05 ng/g-wet weight 6/10/98 HRI-98-01D (Remnant #4) L3172-4 PCB-91 5.8 0.05 ng/g-wet weight 6/10/98 HRI-98-01D (Remnant #4) L3172-4 PCB-84 4.1 0.05 ng/g-wet weight 6/10/98 HRI-98-01D (Remnant #4) L3172-4 PCB-90/101/89 46 0.05 ng/g-wet weight 6/10/98 HRI-98-01D (Remnant #4) L3172-4 PCB-99 31 0.05 ng/g-wet weight 6/10/98 HRI-98-01D (Remnant #4) L3172-4 PCB-83 2.2 0.08 ng/g-wet weight 6/10/98 HRI-98-01D (Remnant #4) L3172-4 PCB-97 /86 18 0.08 ng/g-wet weight 6/10/98 HRI-98-01D (Remnant #4) L3172-4 PCB-87 30 0.08 ng/g-wet weight 6/10/98 HRI-98-01D (Remnant #4) L3172-4 PCB-85 21 0.08 ng/g-wet weight 6/10/98 HRI-98-01D (Remnant #4) L3172-4 PCB-110 64 0.08 ng/g-wet weight 6/10/98 HRI-98-01D (Remnant #4) L3172-4 PCB-82 3.5 0.05 ng/g-wet weight 6/10/98 HRI-98-01D (Remnant #4) L3172-4 PCB-107 3.5 0.05 ng/g-wet weight 6/10/98 HRI-98-01D (Remnant #4) L3172-4 PCB-114 1.7 0.05 ng/g-wet weight 6/10/98 HRI-98-01D (Remnant #4) L3172-4 PCB-126 2.4 0.05 ng/g-wet weight
*See Qualifier Codes table at end. Page 13 of 75

Aquatic Insects Pesticide and PCB Data
SAMPLING DATE FIELD ID LABORATORY ID ANALYTE VALUE INTERPRETIVE
QUALIFIER*
QUALIFIER REASON CODE*
DETECTION LIMIT
UNITS
6/10/98 HRI-98-01D (Remnant #4) L3172-4 PCB-136 2.2 0.19 ng/g-wet weight 6/10/98 HRI-98-01D (Remnant #4) L3172-4 PCB-151 3.0 0.19 ng/g-wet weight 6/10/98 HRI-98-01D (Remnant #4) L3172-4 PCB-144/135 3.4 0.19 ng/g-wet weight 6/10/98 HRI-98-01D (Remnant #4) L3172-4 PCB-149 20 0.19 ng/g-wet weight 6/10/98 HRI-98-01D (Remnant #4) L3172-4 PCB-134 /143 0.84 0.19 ng/g-wet weight 6/10/98 HRI-98-01D (Remnant #4) L3172-4 PCB-131 0.39 0.19 ng/g-wet weight 6/10/98 HRI-98-01D (Remnant #4) L3172-4 PCB-146 3.3 0.12 ng/g-wet weight 6/10/98 HRI-98-01D (Remnant #4) L3172-4 PCB-118 70 0.06 ng/g-wet weight 6/10/98 HRI-98-01D (Remnant #4) L3172-4 PCB-123 2.5 0.06 ng/g-wet weight 6/10/98 HRI-98-01D (Remnant #4) L3172-4 PCB-105 33 0.05 ng/g-wet weight 6/10/98 HRI-98-01D (Remnant #4) L3172-4 PCB-153 35 0.15 ng/g-wet weight 6/10/98 HRI-98-01D (Remnant #4) L3172-4 PCB-132/168 8.6 0.24 ng/g-wet weight 6/10/98 HRI-98-01D (Remnant #4) L3172-4 PCB-141 5.1 0.24 ng/g-wet weight 6/10/98 HRI-98-01D (Remnant #4) L3172-4 PCB-130 1.9 0.19 ng/g-wet weight 6/10/98 HRI-98-01D (Remnant #4) L3172-4 PCB-137 2.1 0.19 ng/g-wet weight 6/10/98 HRI-98-01D (Remnant #4) L3172-4 PCB-138 41 0.19 ng/g-wet weight 6/10/98 HRI-98-01D (Remnant #4) L3172-4 PCB-158 4.7 0.19 ng/g-wet weight 6/10/98 HRI-98-01D (Remnant #4) L3172-4 PCB-129 1.2 0.19 ng/g-wet weight 6/10/98 HRI-98-01D (Remnant #4) L3172-4 PCB-128 7.6 0.27 ng/g-wet weight 6/10/98 HRI-98-01D (Remnant #4) L3172-4 PCB-167 1.5 U 21 0.19 ng/g-wet weight 6/10/98 HRI-98-01D (Remnant #4) L3172-4 PCB-156 6.0 0.29 ng/g-wet weight 6/10/98 HRI-98-01D (Remnant #4) L3172-4 PCB-157 1.5 0.29 ng/g-wet weight 6/10/98 HRI-98-01D (Remnant #4) L3172-4 PCB-169 ND U 0.19 ng/g-wet weight 6/10/98 HRI-98-01D (Remnant #4) L3172-4 PCB-184 0.61 U 21 0.14 ng/g-wet weight 6/10/98 HRI-98-01D (Remnant #4) L3172-4 PCB-179 0.77 0.14 ng/g-wet weight 6/10/98 HRI-98-01D (Remnant #4) L3172-4 PCB-176 0.38 0.14 ng/g-wet weight 6/10/98 HRI-98-01D (Remnant #4) L3172-4 PCB-178 0.91 0.14 ng/g-wet weight 6/10/98 HRI-98-01D (Remnant #4) L3172-4 PCB-175 0.15 0.14 ng/g-wet weight 6/10/98 HRI-98-01D (Remnant #4) L3172-4 PCB-187/182 4.8 0.14 ng/g-wet weight 6/10/98 HRI-98-01D (Remnant #4) L3172-4 PCB-183 2.3 0.16 ng/g-wet weight 6/10/98 HRI-98-01D (Remnant #4) L3172-4 PCB-185 0.37 0.16 ng/g-wet weight 6/10/98 HRI-98-01D (Remnant #4) L3172-4 PCB-174 /181 2.5 0.16 ng/g-wet weight 6/10/98 HRI-98-01D (Remnant #4) L3172-4 PCB-177 1.9 0.16 ng/g-wet weight 6/10/98 HRI-98-01D (Remnant #4) L3172-4 PCB-171 1.1 0.18 ng/g-wet weight 6/10/98 HRI-98-01D (Remnant #4) L3172-4 PCB-172 0.74 0.16 ng/g-wet weight
*See Qualifier Codes table at end. Page 14 of 75

Aquatic Insects Pesticide and PCB Data
SAMPLING DATE FIELD ID LABORATORY ID ANALYTE VALUE INTERPRETIVE
QUALIFIER*
QUALIFIER REASON CODE*
DETECTION LIMIT
UNITS
6/10/98 HRI-98-01D (Remnant #4) L3172-4 PCB-180 11 0.16 ng/g-wet weight 6/10/98 HRI-98-01D (Remnant #4) L3172-4 PCB-193 0.68 0.16 ng/g-wet weight 6/10/98 HRI-98-01D (Remnant #4) L3172-4 PCB-191 0.25 0.16 ng/g-wet weight 6/10/98 HRI-98-01D (Remnant #4) L3172-4 PCB-170 /190 6.3 0.22 ng/g-wet weight 6/10/98 HRI-98-01D (Remnant #4) L3172-4 PCB-189 0.3 0.22 ng/g-wet weight 6/10/98 HRI-98-01D (Remnant #4) L3172-4 PCB-201 (BZ#200) ND U 0.27 ng/g-wet weight 6/10/98 HRI-98-01D (Remnant #4) L3172-4 PCB-197 ND U 0.48 ng/g-wet weight 6/10/98 HRI-98-01D (Remnant #4) L3172-4 PCB-200 (BZ#199) ND U 0.48 ng/g-wet weight 6/10/98 HRI-98-01D (Remnant #4) L3172-4 PCB-198 ND U 0.48 ng/g-wet weight 6/10/98 HRI-98-01D (Remnant #4) L3172-4 PCB-199 (BZ#201) 1.9 0.48 ng/g-wet weight 6/10/98 HRI-98-01D (Remnant #4) L3172-4 PCB-196/203 1.9 0.44 ng/g-wet weight 6/10/98 HRI-98-01D (Remnant #4) L3172-4 PCB-195 0.49 0.44 ng/g-wet weight 6/10/98 HRI-98-01D (Remnant #4) L3172-4 PCB-194 1.7 0.58 ng/g-wet weight 6/10/98 HRI-98-01D (Remnant #4) L3172-4 PCB-205 ND U 0.58 ng/g-wet weight 6/10/98 HRI-98-01D (Remnant #4) L3172-4 PCB-208 0.21 0.14 ng/g-wet weight 6/10/98 HRI-98-01D (Remnant #4) L3172-4 PCB-207 ND U 0.14 ng/g-wet weight 6/10/98 HRI-98-01D (Remnant #4) L3172-4 PCB-206 0.33 0.14 ng/g-wet weight 6/10/98 HRI-98-01D (Remnant #4) L3172-4 PCB-209 ND U 0.22 ng/g-wet weight 6/10/98 HRI-98-01E (Remnant #4) L3172-5 % Lipids 6.4 Percent 6/10/98 HRI-98-01E (Remnant #4) L3172-5 Hexachlorobenzene 0.58 0.13 ng/g-wet weight 6/10/98 HRI-98-01E (Remnant #4) L3172-5 alpha HCH ND U 0.32 ng/g-wet weight 6/10/98 HRI-98-01E (Remnant #4) L3172-5 beta HCH ND U 0.43 ng/g-wet weight 6/10/98 HRI-98-01E (Remnant #4) L3172-5 gamma HCH 3.2 U 21 0.33 ng/g-wet weight 6/10/98 HRI-98-01E (Remnant #4) L3172-5 delta HCH ND U 0.33 ng/g-wet weight 6/10/98 HRI-98-01E (Remnant #4) L3172-5 Heptachlor ND UJ 10 1.8 ng/g-wet weight 6/10/98 HRI-98-01E (Remnant #4) L3172-5 Aldrin ND UJ 10 0.25 ng/g-wet weight 6/10/98 HRI-98-01E (Remnant #4) L3172-5 Oxychlordane ND UJ 10 1.5 ng/g-wet weight 6/10/98 HRI-98-01E (Remnant #4) L3172-5 gamma-Chlordane (trans-) ND U 0.20 ng/g-wet weight 6/10/98 HRI-98-01E (Remnant #4) L3172-5 alpha-Chlordane (cis-) ND U 0.17 ng/g-wet weight 6/10/98 HRI-98-01E (Remnant #4) L3172-5 o,p'-DDE 0.12 U 21 0.08 ng/g-wet weight 6/10/98 HRI-98-01E (Remnant #4) L3172-5 p,p'-DDE 6.9 0.11 ng/g-wet weight 6/10/98 HRI-98-01E (Remnant #4) L3172-5 trans-Nonachlor 0.43 J 10 0.16 ng/g-wet weight 6/10/98 HRI-98-01E (Remnant #4) L3172-5 o,p'-DDD ND U 0.05 ng/g-wet weight 6/10/98 HRI-98-01E (Remnant #4) L3172-5 p,p'-DDD 0.55 0.05 ng/g-wet weight 6/10/98 HRI-98-01E (Remnant #4) L3172-5 o,p'-DDT 0.23 0.14 ng/g-wet weight
*See Qualifier Codes table at end. Page 15 of 75

Aquatic Insects Pesticide and PCB Data
SAMPLING DATE FIELD ID LABORATORY ID ANALYTE VALUE INTERPRETIVE
QUALIFIER*
QUALIFIER REASON CODE*
DETECTION LIMIT
UNITS
6/10/98 HRI-98-01E (Remnant #4) L3172-5 p,p'-DDT 0.44 0.17 ng/g-wet weight 6/10/98 HRI-98-01E (Remnant #4) L3172-5 Mirex ND UJ 10 0.14 ng/g-wet weight 6/10/98 HRI-98-01E (Remnant #4) L3172-5 Photomirex R 5A 6/10/98 HRI-98-01E (Remnant #4) L3172-5 Heptachlor Epoxide 0.18 UJ 7,10 0.15 ng/g-wet weight 6/10/98 HRI-98-01E (Remnant #4) L3172-5 Dieldrin 0.24 NJ 3 0.12 ng/g-wet weight 6/10/98 HRI-98-01E (Remnant #4) L3172-5 Endrin ND UJ 10 0.25 ng/g-wet weight 6/10/98 HRI-98-01E (Remnant #4) L3172-5 Aroclor 1242 1100 NJ 14 2.0 ng/g-wet weight 6/10/98 HRI-98-01E (Remnant #4) L3172-5 Aroclor 1248 ND U 2.0 ng/g-wet weight 6/10/98 HRI-98-01E (Remnant #4) L3172-5 Aroclor 1254 900 NJ 14 3.1 ng/g-wet weight 6/10/98 HRI-98-01E (Remnant #4) L3172-5 Aroclor 1260 95 NJ 14 2.5 ng/g-wet weight 6/10/98 HRI-98-01E (Remnant #4) L3172-5 PCB-6 0.17 0.03 ng/g-wet weight 6/10/98 HRI-98-01E (Remnant #4) L3172-5 PCB-4/10 1.4 0.05 ng/g-wet weight 6/10/98 HRI-98-01E (Remnant #4) L3172-5 PCB-7/9 0.35 0.05 ng/g-wet weight 6/10/98 HRI-98-01E (Remnant #4) L3172-5 PCB-8/5 1.1 0.05 ng/g-wet weight 6/10/98 HRI-98-01E (Remnant #4) L3172-5 PCB-15 7.9 0.08 ng/g-wet weight 6/10/98 HRI-98-01E (Remnant #4) L3172-5 PCB-19 4.0 0.13 ng/g-wet weight 6/10/98 HRI-98-01E (Remnant #4) L3172-5 PCB-18 28 0.13 ng/g-wet weight 6/10/98 HRI-98-01E (Remnant #4) L3172-5 PCB-17 14 0.13 ng/g-wet weight 6/10/98 HRI-98-01E (Remnant #4) L3172-5 PCB-24/27 3.6 0.13 ng/g-wet weight 6/10/98 HRI-98-01E (Remnant #4) L3172-5 PCB-16/32 18 0.13 ng/g-wet weight 6/10/98 HRI-98-01E (Remnant #4) L3172-5 PCB-26 15 0.11 ng/g-wet weight 6/10/98 HRI-98-01E (Remnant #4) L3172-5 PCB-25 4.6 0.11 ng/g-wet weight 6/10/98 HRI-98-01E (Remnant #4) L3172-5 PCB-31/28 250 0.11 ng/g-wet weight 6/10/98 HRI-98-01E (Remnant #4) L3172-5 PCB-33 /20 18 0.11 ng/g-wet weight 6/10/98 HRI-98-01E (Remnant #4) L3172-5 PCB-22 8.2 0.11 ng/g-wet weight 6/10/98 HRI-98-01E (Remnant #4) L3172-5 PCB-37 37 0.11 ng/g-wet weight 6/10/98 HRI-98-01E (Remnant #4) L3172-5 PCB-53 14 0.13 ng/g-wet weight 6/10/98 HRI-98-01E (Remnant #4) L3172-5 PCB-45 5.6 0.13 ng/g-wet weight 6/10/98 HRI-98-01E (Remnant #4) L3172-5 PCB-46 2.7 0.13 ng/g-wet weight 6/10/98 HRI-98-01E (Remnant #4) L3172-5 PCB-52 120 0.13 ng/g-wet weight 6/10/98 HRI-98-01E (Remnant #4) L3172-5 PCB-49 130 0.16 ng/g-wet weight 6/10/98 HRI-98-01E (Remnant #4) L3172-5 PCB-47/48 110 0.16 ng/g-wet weight 6/10/98 HRI-98-01E (Remnant #4) L3172-5 PCB-44 87 0.15 ng/g-wet weight 6/10/98 HRI-98-01E (Remnant #4) L3172-5 PCB-42 45 0.15 ng/g-wet weight 6/10/98 HRI-98-01E (Remnant #4) L3172-5 PCB-41/71/64 110 0.15 ng/g-wet weight
*See Qualifier Codes table at end. Page 16 of 75

Aquatic Insects Pesticide and PCB Data
SAMPLING DATE FIELD ID LABORATORY ID ANALYTE VALUE INTERPRETIVE
QUALIFIER*
QUALIFIER REASON CODE*
DETECTION LIMIT
UNITS
6/10/98 HRI-98-01E (Remnant #4) L3172-5 PCB-40 2.3 0.18 ng/g-wet weight 6/10/98 HRI-98-01E (Remnant #4) L3172-5 PCB-74 /61 160 0.18 ng/g-wet weight 6/10/98 HRI-98-01E (Remnant #4) L3172-5 PCB-70/76 230 0.18 ng/g-wet weight 6/10/98 HRI-98-01E (Remnant #4) L3172-5 PCB-66 /80 160 0.11 ng/g-wet weight 6/10/98 HRI-98-01E (Remnant #4) L3172-5 PCB-81 3.5 0.11 ng/g-wet weight 6/10/98 HRI-98-01E (Remnant #4) L3172-5 PCB-56/60 69 0.11 ng/g-wet weight 6/10/98 HRI-98-01E (Remnant #4) L3172-5 PCB-77 15 U 21 0.11 ng/g-wet weight 6/10/98 HRI-98-01E (Remnant #4) L3172-5 PCB-95 24 0.08 ng/g-wet weight 6/10/98 HRI-98-01E (Remnant #4) L3172-5 PCB-119 1.4 0.08 ng/g-wet weight 6/10/98 HRI-98-01E (Remnant #4) L3172-5 PCB-91 7.0 0.08 ng/g-wet weight 6/10/98 HRI-98-01E (Remnant #4) L3172-5 PCB-84 5.3 0.08 ng/g-wet weight 6/10/98 HRI-98-01E (Remnant #4) L3172-5 PCB-90/101/89 49 0.08 ng/g-wet weight 6/10/98 HRI-98-01E (Remnant #4) L3172-5 PCB-99 32 0.08 ng/g-wet weight 6/10/98 HRI-98-01E (Remnant #4) L3172-5 PCB-83 2.9 0.12 ng/g-wet weight 6/10/98 HRI-98-01E (Remnant #4) L3172-5 PCB-97 /86 22 0.12 ng/g-wet weight 6/10/98 HRI-98-01E (Remnant #4) L3172-5 PCB-87 35 0.12 ng/g-wet weight 6/10/98 HRI-98-01E (Remnant #4) L3172-5 PCB-85 25 0.12 ng/g-wet weight 6/10/98 HRI-98-01E (Remnant #4) L3172-5 PCB-110 78 0.12 ng/g-wet weight 6/10/98 HRI-98-01E (Remnant #4) L3172-5 PCB-82 4.9 0.08 ng/g-wet weight 6/10/98 HRI-98-01E (Remnant #4) L3172-5 PCB-107 4.5 0.08 ng/g-wet weight 6/10/98 HRI-98-01E (Remnant #4) L3172-5 PCB-114 2.2 0.08 ng/g-wet weight 6/10/98 HRI-98-01E (Remnant #4) L3172-5 PCB-126 3.0 0.07 ng/g-wet weight 6/10/98 HRI-98-01E (Remnant #4) L3172-5 PCB-136 2.7 0.13 ng/g-wet weight 6/10/98 HRI-98-01E (Remnant #4) L3172-5 PCB-151 3.6 0.13 ng/g-wet weight 6/10/98 HRI-98-01E (Remnant #4) L3172-5 PCB-144/135 3.8 0.13 ng/g-wet weight 6/10/98 HRI-98-01E (Remnant #4) L3172-5 PCB-149 21 0.13 ng/g-wet weight 6/10/98 HRI-98-01E (Remnant #4) L3172-5 PCB-134 /143 1.0 0.13 ng/g-wet weight 6/10/98 HRI-98-01E (Remnant #4) L3172-5 PCB-131 0.43 0.13 ng/g-wet weight 6/10/98 HRI-98-01E (Remnant #4) L3172-5 PCB-146 3.8 0.08 ng/g-wet weight 6/10/98 HRI-98-01E (Remnant #4) L3172-5 PCB-118 74 0.08 ng/g-wet weight 6/10/98 HRI-98-01E (Remnant #4) L3172-5 PCB-123 2.8 0.08 ng/g-wet weight 6/10/98 HRI-98-01E (Remnant #4) L3172-5 PCB-105 36 0.07 ng/g-wet weight 6/10/98 HRI-98-01E (Remnant #4) L3172-5 PCB-153 36 0.08 ng/g-wet weight 6/10/98 HRI-98-01E (Remnant #4) L3172-5 PCB-132/168 8.9 0.12 ng/g-wet weight 6/10/98 HRI-98-01E (Remnant #4) L3172-5 PCB-141 5.3 0.12 ng/g-wet weight
*See Qualifier Codes table at end. Page 17 of 75

Aquatic Insects Pesticide and PCB Data
SAMPLING DATE FIELD ID LABORATORY ID ANALYTE VALUE INTERPRETIVE
QUALIFIER*
QUALIFIER REASON CODE*
DETECTION LIMIT
UNITS
6/10/98 HRI-98-01E (Remnant #4) L3172-5 PCB-130 2.1 0.09 ng/g-wet weight 6/10/98 HRI-98-01E (Remnant #4) L3172-5 PCB-137 2.3 0.09 ng/g-wet weight 6/10/98 HRI-98-01E (Remnant #4) L3172-5 PCB-138 44 0.09 ng/g-wet weight 6/10/98 HRI-98-01E (Remnant #4) L3172-5 PCB-158 5.2 0.09 ng/g-wet weight 6/10/98 HRI-98-01E (Remnant #4) L3172-5 PCB-129 1.4 0.09 ng/g-wet weight 6/10/98 HRI-98-01E (Remnant #4) L3172-5 PCB-128 7.9 0.13 ng/g-wet weight 6/10/98 HRI-98-01E (Remnant #4) L3172-5 PCB-167 1.6 0.09 ng/g-wet weight 6/10/98 HRI-98-01E (Remnant #4) L3172-5 PCB-156 7.2 0.14 ng/g-wet weight 6/10/98 HRI-98-01E (Remnant #4) L3172-5 PCB-157 1.5 0.14 ng/g-wet weight 6/10/98 HRI-98-01E (Remnant #4) L3172-5 PCB-169 ND U 0.09 ng/g-wet weight 6/10/98 HRI-98-01E (Remnant #4) L3172-5 PCB-184 0.62 U 21 0.14 ng/g-wet weight 6/10/98 HRI-98-01E (Remnant #4) L3172-5 PCB-179 1.0 0.14 ng/g-wet weight 6/10/98 HRI-98-01E (Remnant #4) L3172-5 PCB-176 0.42 0.14 ng/g-wet weight 6/10/98 HRI-98-01E (Remnant #4) L3172-5 PCB-178 0.99 0.14 ng/g-wet weight 6/10/98 HRI-98-01E (Remnant #4) L3172-5 PCB-175 0.18 0.14 ng/g-wet weight 6/10/98 HRI-98-01E (Remnant #4) L3172-5 PCB-187/182 4.9 0.14 ng/g-wet weight 6/10/98 HRI-98-01E (Remnant #4) L3172-5 PCB-183 2.6 0.16 ng/g-wet weight 6/10/98 HRI-98-01E (Remnant #4) L3172-5 PCB-185 0.39 0.16 ng/g-wet weight 6/10/98 HRI-98-01E (Remnant #4) L3172-5 PCB-174 /181 2.7 0.16 ng/g-wet weight 6/10/98 HRI-98-01E (Remnant #4) L3172-5 PCB-177 2.1 0.16 ng/g-wet weight 6/10/98 HRI-98-01E (Remnant #4) L3172-5 PCB-171 1.4 0.17 ng/g-wet weight 6/10/98 HRI-98-01E (Remnant #4) L3172-5 PCB-172 0.69 0.16 ng/g-wet weight 6/10/98 HRI-98-01E (Remnant #4) L3172-5 PCB-180 11 0.16 ng/g-wet weight 6/10/98 HRI-98-01E (Remnant #4) L3172-5 PCB-193 0.63 0.16 ng/g-wet weight 6/10/98 HRI-98-01E (Remnant #4) L3172-5 PCB-191 0.25 0.16 ng/g-wet weight 6/10/98 HRI-98-01E (Remnant #4) L3172-5 PCB-170 /190 5.6 0.21 ng/g-wet weight 6/10/98 HRI-98-01E (Remnant #4) L3172-5 PCB-189 0.29 0.21 ng/g-wet weight 6/10/98 HRI-98-01E (Remnant #4) L3172-5 PCB-201 (BZ#200) 0.24 0.18 ng/g-wet weight 6/10/98 HRI-98-01E (Remnant #4) L3172-5 PCB-197 ND U 0.32 ng/g-wet weight 6/10/98 HRI-98-01E (Remnant #4) L3172-5 PCB-200 (BZ#199) ND U 0.32 ng/g-wet weight 6/10/98 HRI-98-01E (Remnant #4) L3172-5 PCB-198 ND U 0.32 ng/g-wet weight 6/10/98 HRI-98-01E (Remnant #4) L3172-5 PCB-199 (BZ#201) 2.1 0.32 ng/g-wet weight 6/10/98 HRI-98-01E (Remnant #4) L3172-5 PCB-196/203 2.0 0.29 ng/g-wet weight 6/10/98 HRI-98-01E (Remnant #4) L3172-5 PCB-195 0.39 0.29 ng/g-wet weight 6/10/98 HRI-98-01E (Remnant #4) L3172-5 PCB-194 1.8 0.39 ng/g-wet weight
*See Qualifier Codes table at end. Page 18 of 75

Aquatic Insects Pesticide and PCB Data
SAMPLING DATE FIELD ID LABORATORY ID ANALYTE VALUE INTERPRETIVE
QUALIFIER*
QUALIFIER REASON CODE*
DETECTION LIMIT
UNITS
6/10/98 HRI-98-01E (Remnant #4) L3172-5 PCB-205 ND U 0.39 ng/g-wet weight 6/10/98 HRI-98-01E (Remnant #4) L3172-5 PCB-208 ND U 0.24 ng/g-wet weight 6/10/98 HRI-98-01E (Remnant #4) L3172-5 PCB-207 ND U 0.24 ng/g-wet weight 6/10/98 HRI-98-01E (Remnant #4) L3172-5 PCB-206 0.33 0.24 ng/g-wet weight 6/10/98 HRI-98-01E (Remnant #4) L3172-5 PCB-209 ND U 0.2 ng/g-wet weight 5/28/98 HRI-98-02A (Special Area 13) L3172-6 % Lipids 6.3 Percent 5/28/98 HRI-98-02A (Special Area 13) L3172-6 Hexachlorobenzene 0.62 0.12 ng/g-wet weight 5/28/98 HRI-98-02A (Special Area 13) L3172-6 alpha HCH ND U 0.41 ng/g-wet weight 5/28/98 HRI-98-02A (Special Area 13) L3172-6 beta HCH ND U 0.55 ng/g-wet weight 5/28/98 HRI-98-02A (Special Area 13) L3172-6 gamma HCH 3.2 U 21 0.41 ng/g-wet weight 5/28/98 HRI-98-02A (Special Area 13) L3172-6 delta HCH ND U 0.41 ng/g-wet weight 5/28/98 HRI-98-02A (Special Area 13) L3172-6 Heptachlor ND UJ 10 1.5 ng/g-wet weight 5/28/98 HRI-98-02A (Special Area 13) L3172-6 Aldrin ND UJ 10 0.24 ng/g-wet weight 5/28/98 HRI-98-02A (Special Area 13) L3172-6 Oxychlordane ND UJ 10 0.74 ng/g-wet weight 5/28/98 HRI-98-02A (Special Area 13) L3172-6 gamma-Chlordane (trans-) ND U 0.13 ng/g-wet weight 5/28/98 HRI-98-02A (Special Area 13) L3172-6 alpha-Chlordane (cis-) 0.27 0.12 ng/g-wet weight 5/28/98 HRI-98-02A (Special Area 13) L3172-6 o,p'-DDE 0.12 0.09 ng/g-wet weight 5/28/98 HRI-98-02A (Special Area 13) L3172-6 p,p'-DDE 5.9 0.11 ng/g-wet weight 5/28/98 HRI-98-02A (Special Area 13) L3172-6 trans-Nonachlor 0.56 J 10 0.06 ng/g-wet weight 5/28/98 HRI-98-02A (Special Area 13) L3172-6 o,p'-DDD 0.10 0.03 ng/g-wet weight 5/28/98 HRI-98-02A (Special Area 13) L3172-6 p,p'-DDD 0.32 0.04 ng/g-wet weight 5/28/98 HRI-98-02A (Special Area 13) L3172-6 o,p'-DDT 0.21 0.09 ng/g-wet weight 5/28/98 HRI-98-02A (Special Area 13) L3172-6 p,p'-DDT 0.53 0.11 ng/g-wet weight 5/28/98 HRI-98-02A (Special Area 13) L3172-6 Mirex ND UJ 10 0.15 ng/g-wet weight 5/28/98 HRI-98-02A (Special Area 13) L3172-6 Photomirex R 5A 5/28/98 HRI-98-02A (Special Area 13) L3172-6 Heptachlor Epoxide 0.71 UJ 7,10 0.06 ng/g-wet weight 5/28/98 HRI-98-02A (Special Area 13) L3172-6 Dieldrin 0.52 NJ 3 0.06 ng/g-wet weight 5/28/98 HRI-98-02A (Special Area 13) L3172-6 Endrin ND UJ 10 0.1 ng/g-wet weight 5/28/98 HRI-98-02A (Special Area 13) L3172-6 Aroclor 1242 2800 NJ 14 9.7 ng/g-wet weight 5/28/98 HRI-98-02A (Special Area 13) L3172-6 Aroclor 1248 ND U 1.5 ng/g-wet weight 5/28/98 HRI-98-02A (Special Area 13) L3172-6 Aroclor 1254 2200 NJ 14 3.2 ng/g-wet weight 5/28/98 HRI-98-02A (Special Area 13) L3172-6 Aroclor 1260 210 NJ 14 1.2 ng/g-wet weight 5/28/98 HRI-98-02A (Special Area 13) L3172-6 PCB-6 2.2 0.03 ng/g-wet weight 5/28/98 HRI-98-02A (Special Area 13) L3172-6 PCB-4/10 46 0.03 ng/g-wet weight 5/28/98 HRI-98-02A (Special Area 13) L3172-6 PCB-7/9 1.1 0.03 ng/g-wet weight
*See Qualifier Codes table at end. Page 19 of 75

Aquatic Insects Pesticide and PCB Data
SAMPLING DATE FIELD ID LABORATORY ID ANALYTE VALUE INTERPRETIVE
QUALIFIER*
QUALIFIER REASON CODE*
DETECTION LIMIT
UNITS
5/28/98 HRI-98-02A (Special Area 13) L3172-6 PCB-8/5 11 0.03 ng/g-wet weight 5/28/98 HRI-98-02A (Special Area 13) L3172-6 PCB-15 28 0.05 ng/g-wet weight 5/28/98 HRI-98-02A (Special Area 13) L3172-6 PCB-19 67 0.1 ng/g-wet weight 5/28/98 HRI-98-02A (Special Area 13) L3172-6 PCB-18 57 0.1 ng/g-wet weight 5/28/98 HRI-98-02A (Special Area 13) L3172-6 PCB-17 49 0.1 ng/g-wet weight 5/28/98 HRI-98-02A (Special Area 13) L3172-6 PCB-24/27 57 0.1 ng/g-wet weight 5/28/98 HRI-98-02A (Special Area 13) L3172-6 PCB-16/32 69 0.1 ng/g-wet weight 5/28/98 HRI-98-02A (Special Area 13) L3172-6 PCB-26 52 0.09 ng/g-wet weight 5/28/98 HRI-98-02A (Special Area 13) L3172-6 PCB-25 18 0.09 ng/g-wet weight 5/28/98 HRI-98-02A (Special Area 13) L3172-6 PCB-31/28 590 0.56 ng/g-wet weight 5/28/98 HRI-98-02A (Special Area 13) L3172-6 PCB-33 /20 32 0.09 ng/g-wet weight 5/28/98 HRI-98-02A (Special Area 13) L3172-6 PCB-22 24 0.09 ng/g-wet weight 5/28/98 HRI-98-02A (Special Area 13) L3172-6 PCB-37 78 0.09 ng/g-wet weight 5/28/98 HRI-98-02A (Special Area 13) L3172-6 PCB-53 47 0.12 ng/g-wet weight 5/28/98 HRI-98-02A (Special Area 13) L3172-6 PCB-45 12 0.12 ng/g-wet weight 5/28/98 HRI-98-02A (Special Area 13) L3172-6 PCB-46 4.2 0.12 ng/g-wet weight 5/28/98 HRI-98-02A (Special Area 13) L3172-6 PCB-52 300 0.86 ng/g-wet weight 5/28/98 HRI-98-02A (Special Area 13) L3172-6 PCB-49 330 1.1 ng/g-wet weight 5/28/98 HRI-98-02A (Special Area 13) L3172-6 PCB-47/48 300 1.1 ng/g-wet weight 5/28/98 HRI-98-02A (Special Area 13) L3172-6 PCB-44 120 0.14 ng/g-wet weight 5/28/98 HRI-98-02A (Special Area 13) L3172-6 PCB-42 100 0.14 ng/g-wet weight 5/28/98 HRI-98-02A (Special Area 13) L3172-6 PCB-41/71/64 240 1.0 ng/g-wet weight 5/28/98 HRI-98-02A (Special Area 13) L3172-6 PCB-40 8.4 0.16 ng/g-wet weight 5/28/98 HRI-98-02A (Special Area 13) L3172-6 PCB-74 /61 350 1.2 ng/g-wet weight 5/28/98 HRI-98-02A (Special Area 13) L3172-6 PCB-70/76 510 1.2 ng/g-wet weight 5/28/98 HRI-98-02A (Special Area 13) L3172-6 PCB-66 /80 300 0.74 ng/g-wet weight 5/28/98 HRI-98-02A (Special Area 13) L3172-6 PCB-81 7.2 0.10 ng/g-wet weight 5/28/98 HRI-98-02A (Special Area 13) L3172-6 PCB-56/60 160 0.74 ng/g-wet weight 5/28/98 HRI-98-02A (Special Area 13) L3172-6 PCB-77 33 U 21 0.10 ng/g-wet weight 5/28/98 HRI-98-02A (Special Area 13) L3172-6 PCB-95 55 0.08 ng/g-wet weight 5/28/98 HRI-98-02A (Special Area 13) L3172-6 PCB-119 4.0 0.08 ng/g-wet weight 5/28/98 HRI-98-02A (Special Area 13) L3172-6 PCB-91 20 0.08 ng/g-wet weight 5/28/98 HRI-98-02A (Special Area 13) L3172-6 PCB-84 12 0.08 ng/g-wet weight 5/28/98 HRI-98-02A (Special Area 13) L3172-6 PCB-90/101/89 110 0.27 ng/g-wet weight 5/28/98 HRI-98-02A (Special Area 13) L3172-6 PCB-99 77 0.08 ng/g-wet weight
*See Qualifier Codes table at end. Page 20 of 75

Aquatic Insects Pesticide and PCB Data
SAMPLING DATE FIELD ID LABORATORY ID ANALYTE VALUE INTERPRETIVE
QUALIFIER*
QUALIFIER REASON CODE*
DETECTION LIMIT
UNITS
5/28/98 HRI-98-02A (Special Area 13) L3172-6 PCB-83 6.3 0.13 ng/g-wet weight 5/28/98 HRI-98-02A (Special Area 13) L3172-6 PCB-97 /86 52 0.13 ng/g-wet weight 5/28/98 HRI-98-02A (Special Area 13) L3172-6 PCB-87 88 0.13 ng/g-wet weight 5/28/98 HRI-98-02A (Special Area 13) L3172-6 PCB-85 51 0.13 ng/g-wet weight 5/28/98 HRI-98-02A (Special Area 13) L3172-6 PCB-110 200 0.44 ng/g-wet weight 5/28/98 HRI-98-02A (Special Area 13) L3172-6 PCB-82 12 0.08 ng/g-wet weight 5/28/98 HRI-98-02A (Special Area 13) L3172-6 PCB-107 9.6 0.08 ng/g-wet weight 5/28/98 HRI-98-02A (Special Area 13) L3172-6 PCB-114 4.3 0.08 ng/g-wet weight 5/28/98 HRI-98-02A (Special Area 13) L3172-6 PCB-126 4.6 0.07 ng/g-wet weight 5/28/98 HRI-98-02A (Special Area 13) L3172-6 PCB-136 6.9 0.05 ng/g-wet weight 5/28/98 HRI-98-02A (Special Area 13) L3172-6 PCB-151 10 0.05 ng/g-wet weight 5/28/98 HRI-98-02A (Special Area 13) L3172-6 PCB-144/135 9.9 0.05 ng/g-wet weight 5/28/98 HRI-98-02A (Special Area 13) L3172-6 PCB-149 57 0.05 ng/g-wet weight 5/28/98 HRI-98-02A (Special Area 13) L3172-6 PCB-134 /143 2.6 0.05 ng/g-wet weight 5/28/98 HRI-98-02A (Special Area 13) L3172-6 PCB-131 0.68 0.05 ng/g-wet weight 5/28/98 HRI-98-02A (Special Area 13) L3172-6 PCB-146 9.0 0.03 ng/g-wet weight 5/28/98 HRI-98-02A (Special Area 13) L3172-6 PCB-118 130 0.32 ng/g-wet weight 5/28/98 HRI-98-02A (Special Area 13) L3172-6 PCB-123 5.0 0.08 ng/g-wet weight 5/28/98 HRI-98-02A (Special Area 13) L3172-6 PCB-105 70 0.08 ng/g-wet weight 5/28/98 HRI-98-02A (Special Area 13) L3172-6 PCB-153 70 0.04 ng/g-wet weight 5/28/98 HRI-98-02A (Special Area 13) L3172-6 PCB-132/168 21 0.05 ng/g-wet weight 5/28/98 HRI-98-02A (Special Area 13) L3172-6 PCB-141 9.8 0.05 ng/g-wet weight 5/28/98 HRI-98-02A (Special Area 13) L3172-6 PCB-130 4.1 0.04 ng/g-wet weight 5/28/98 HRI-98-02A (Special Area 13) L3172-6 PCB-137 3.7 0.04 ng/g-wet weight 5/28/98 HRI-98-02A (Special Area 13) L3172-6 PCB-138 100 0.04 ng/g-wet weight 5/28/98 HRI-98-02A (Special Area 13) L3172-6 PCB-158 9.2 0.04 ng/g-wet weight 5/28/98 HRI-98-02A (Special Area 13) L3172-6 PCB-129 2.6 0.04 ng/g-wet weight 5/28/98 HRI-98-02A (Special Area 13) L3172-6 PCB-128 15 0.06 ng/g-wet weight 5/28/98 HRI-98-02A (Special Area 13) L3172-6 PCB-167 2.7 U 21 0.04 ng/g-wet weight 5/28/98 HRI-98-02A (Special Area 13) L3172-6 PCB-156 12 0.07 ng/g-wet weight 5/28/98 HRI-98-02A (Special Area 13) L3172-6 PCB-157 2.8 0.07 ng/g-wet weight 5/28/98 HRI-98-02A (Special Area 13) L3172-6 PCB-169 0.04 0.04 ng/g-wet weight 5/28/98 HRI-98-02A (Special Area 13) L3172-6 PCB-184 0.93 U 21 0.06 ng/g-wet weight 5/28/98 HRI-98-02A (Special Area 13) L3172-6 PCB-179 3.1 0.06 ng/g-wet weight 5/28/98 HRI-98-02A (Special Area 13) L3172-6 PCB-176 1.1 0.06 ng/g-wet weight
*See Qualifier Codes table at end. Page 21 of 75

Aquatic Insects Pesticide and PCB Data
SAMPLING DATE FIELD ID LABORATORY ID ANALYTE VALUE INTERPRETIVE
QUALIFIER*
QUALIFIER REASON CODE*
DETECTION LIMIT
UNITS
5/28/98 HRI-98-02A (Special Area 13) L3172-6 PCB-178 4.2 0.06 ng/g-wet weight 5/28/98 HRI-98-02A (Special Area 13) L3172-6 PCB-175 0.4 0.06 ng/g-wet weight 5/28/98 HRI-98-02A (Special Area 13) L3172-6 PCB-187/182 16 0.06 ng/g-wet weight 5/28/98 HRI-98-02A (Special Area 13) L3172-6 PCB-183 5.6 0.07 ng/g-wet weight 5/28/98 HRI-98-02A (Special Area 13) L3172-6 PCB-185 0.6 0.07 ng/g-wet weight 5/28/98 HRI-98-02A (Special Area 13) L3172-6 PCB-174 /181 5.8 0.07 ng/g-wet weight 5/28/98 HRI-98-02A (Special Area 13) L3172-6 PCB-177 5.6 0.07 ng/g-wet weight 5/28/98 HRI-98-02A (Special Area 13) L3172-6 PCB-171 2.5 0.08 ng/g-wet weight 5/28/98 HRI-98-02A (Special Area 13) L3172-6 PCB-172 1.5 0.08 ng/g-wet weight 5/28/98 HRI-98-02A (Special Area 13) L3172-6 PCB-180 24 0.08 ng/g-wet weight 5/28/98 HRI-98-02A (Special Area 13) L3172-6 PCB-193 1.5 0.08 ng/g-wet weight 5/28/98 HRI-98-02A (Special Area 13) L3172-6 PCB-191 0.38 0.08 ng/g-wet weight 5/28/98 HRI-98-02A (Special Area 13) L3172-6 PCB-170 /190 12 0.1 ng/g-wet weight 5/28/98 HRI-98-02A (Special Area 13) L3172-6 PCB-189 0.5 0.1 ng/g-wet weight 5/28/98 HRI-98-02A (Special Area 13) L3172-6 PCB-201 (BZ#200) 0.72 0.06 ng/g-wet weight 5/28/98 HRI-98-02A (Special Area 13) L3172-6 PCB-197 0.4 0.1 ng/g-wet weight 5/28/98 HRI-98-02A (Special Area 13) L3172-6 PCB-200 (BZ#199) 0.61 0.1 ng/g-wet weight 5/28/98 HRI-98-02A (Special Area 13) L3172-6 PCB-198 0.38 0.1 ng/g-wet weight 5/28/98 HRI-98-02A (Special Area 13) L3172-6 PCB-199 (BZ#201) 6.7 0.1 ng/g-wet weight 5/28/98 HRI-98-02A (Special Area 13) L3172-6 PCB-196/203 6.3 0.1 ng/g-wet weight 5/28/98 HRI-98-02A (Special Area 13) L3172-6 PCB-195 1.4 0.1 ng/g-wet weight 5/28/98 HRI-98-02A (Special Area 13) L3172-6 PCB-194 5.2 0.13 ng/g-wet weight 5/28/98 HRI-98-02A (Special Area 13) L3172-6 PCB-205 0.38 0.13 ng/g-wet weight 5/28/98 HRI-98-02A (Special Area 13) L3172-6 PCB-208 0.67 0.16 ng/g-wet weight 5/28/98 HRI-98-02A (Special Area 13) L3172-6 PCB-207 0.25 0.16 ng/g-wet weight 5/28/98 HRI-98-02A (Special Area 13) L3172-6 PCB-206 1.5 0.16 ng/g-wet weight 5/28/98 HRI-98-02A (Special Area 13) L3172-6 PCB-209 0.31 0.21 ng/g-wet weight 5/28/98 HRI-98-02B (Special Area 13) L3172-7 % Lipids 6.5 Percent 5/28/98 HRI-98-02B (Special Area 13) L3172-7 Hexachlorobenzene 0.70 0.14 ng/g-wet weight 5/28/98 HRI-98-02B (Special Area 13) L3172-7 alpha HCH ND U 0.60 ng/g-wet weight 5/28/98 HRI-98-02B (Special Area 13) L3172-7 beta HCH ND U 0.81 ng/g-wet weight 5/28/98 HRI-98-02B (Special Area 13) L3172-7 gamma HCH 3.6 U 21 0.60 ng/g-wet weight 5/28/98 HRI-98-02B (Special Area 13) L3172-7 delta HCH ND U 0.60 ng/g-wet weight 5/28/98 HRI-98-02B (Special Area 13) L3172-7 Heptachlor ND UJ 10 1.2 ng/g-wet weight 5/28/98 HRI-98-02B (Special Area 13) L3172-7 Aldrin ND UJ 10 0.37 ng/g-wet weight
*See Qualifier Codes table at end. Page 22 of 75

Aquatic Insects Pesticide and PCB Data
SAMPLING DATE FIELD ID LABORATORY ID ANALYTE VALUE INTERPRETIVE
QUALIFIER*
QUALIFIER REASON CODE*
DETECTION LIMIT
UNITS
5/28/98 HRI-98-02B (Special Area 13) L3172-7 Oxychlordane ND UJ 10 1.5 ng/g-wet weight 5/28/98 HRI-98-02B (Special Area 13) L3172-7 gamma-Chlordane (trans-) ND U 0.22 ng/g-wet weight 5/28/98 HRI-98-02B (Special Area 13) L3172-7 alpha-Chlordane (cis-) 0.31 J 13 0.20 ng/g-wet weight 5/28/98 HRI-98-02B (Special Area 13) L3172-7 o,p'-DDE 0.16 0.08 ng/g-wet weight 5/28/98 HRI-98-02B (Special Area 13) L3172-7 p,p'-DDE 5.9 0.10 ng/g-wet weight 5/28/98 HRI-98-02B (Special Area 13) L3172-7 trans-Nonachlor 0.52 J 10,13 0.10 ng/g-wet weight 5/28/98 HRI-98-02B (Special Area 13) L3172-7 o,p'-DDD 0.11 J 13 0.07 ng/g-wet weight 5/28/98 HRI-98-02B (Special Area 13) L3172-7 p,p'-DDD 0.29 J 13 0.08 ng/g-wet weight 5/28/98 HRI-98-02B (Special Area 13) L3172-7 o,p'-DDT 0.20 0.17 ng/g-wet weight 5/28/98 HRI-98-02B (Special Area 13) L3172-7 p,p'-DDT 0.55 0.21 ng/g-wet weight 5/28/98 HRI-98-02B (Special Area 13) L3172-7 Mirex ND UJ 10 0.21 ng/g-wet weight 5/28/98 HRI-98-02B (Special Area 13) L3172-7 Photomirex R 5A 5/28/98 HRI-98-02B (Special Area 13) L3172-7 Heptachlor Epoxide 0.37 UJ 7,10 0.11 ng/g-wet weight 5/28/98 HRI-98-02B (Special Area 13) L3172-7 Dieldrin 0.45 NJ 3 0.09 ng/g-wet weight 5/28/98 HRI-98-02B (Special Area 13) L3172-7 Endrin ND UJ 10 0.18 ng/g-wet weight 5/28/98 HRI-98-02B (Special Area 13) L3172-7 Aroclor 1242 2800 NJ 14 18 ng/g-wet weight 5/28/98 HRI-98-02B (Special Area 13) L3172-7 Aroclor 1248 ND U 2.4 ng/g-wet weight 5/28/98 HRI-98-02B (Special Area 13) L3172-7 Aroclor 1254 2000 NJ 14 3.2 ng/g-wet weight 5/28/98 HRI-98-02B (Special Area 13) L3172-7 Aroclor 1260 200 NJ 14 4.3 ng/g-wet weight 5/28/98 HRI-98-02B (Special Area 13) L3172-7 PCB-6 3.8 0.06 ng/g-wet weight 5/28/98 HRI-98-02B (Special Area 13) L3172-7 PCB-4/10 94 0.06 ng/g-wet weight 5/28/98 HRI-98-02B (Special Area 13) L3172-7 PCB-7/9 2 0.06 ng/g-wet weight 5/28/98 HRI-98-02B (Special Area 13) L3172-7 PCB-8/5 17 0.06 ng/g-wet weight 5/28/98 HRI-98-02B (Special Area 13) L3172-7 PCB-15 37 0.09 ng/g-wet weight 5/28/98 HRI-98-02B (Special Area 13) L3172-7 PCB-19 130 0.16 ng/g-wet weight 5/28/98 HRI-98-02B (Special Area 13) L3172-7 PCB-18 64 0.16 ng/g-wet weight 5/28/98 HRI-98-02B (Special Area 13) L3172-7 PCB-17 55 0.16 ng/g-wet weight 5/28/98 HRI-98-02B (Special Area 13) L3172-7 PCB-24/27 100 0.16 ng/g-wet weight 5/28/98 HRI-98-02B (Special Area 13) L3172-7 PCB-16/32 74 0.16 ng/g-wet weight 5/28/98 HRI-98-02B (Special Area 13) L3172-7 PCB-26 65 0.14 ng/g-wet weight 5/28/98 HRI-98-02B (Special Area 13) L3172-7 PCB-25 21 0.14 ng/g-wet weight 5/28/98 HRI-98-02B (Special Area 13) L3172-7 PCB-31/28 590 1.1 ng/g-wet weight 5/28/98 HRI-98-02B (Special Area 13) L3172-7 PCB-33 /20 37 0.14 ng/g-wet weight 5/28/98 HRI-98-02B (Special Area 13) L3172-7 PCB-22 28 0.14 ng/g-wet weight 5/28/98 HRI-98-02B (Special Area 13) L3172-7 PCB-37 80 0.14 ng/g-wet weight
*See Qualifier Codes table at end. Page 23 of 75

Aquatic Insects Pesticide and PCB Data
SAMPLING DATE FIELD ID LABORATORY ID ANALYTE VALUE INTERPRETIVE
QUALIFIER*
QUALIFIER REASON CODE*
DETECTION LIMIT
UNITS
5/28/98 HRI-98-02B (Special Area 13) L3172-7 PCB-53 67 0.22 ng/g-wet weight 5/28/98 HRI-98-02B (Special Area 13) L3172-7 PCB-45 12 0.22 ng/g-wet weight 5/28/98 HRI-98-02B (Special Area 13) L3172-7 PCB-46 4.0 0.22 ng/g-wet weight 5/28/98 HRI-98-02B (Special Area 13) L3172-7 PCB-52 310 1.1 ng/g-wet weight 5/28/98 HRI-98-02B (Special Area 13) L3172-7 PCB-49 330 1.4 ng/g-wet weight 5/28/98 HRI-98-02B (Special Area 13) L3172-7 PCB-47/48 300 1.4 ng/g-wet weight 5/28/98 HRI-98-02B (Special Area 13) L3172-7 PCB-44 120 0.26 ng/g-wet weight 5/28/98 HRI-98-02B (Special Area 13) L3172-7 PCB-42 110 0.26 ng/g-wet weight 5/28/98 HRI-98-02B (Special Area 13) L3172-7 PCB-41/71/64 230 1.3 ng/g-wet weight 5/28/98 HRI-98-02B (Special Area 13) L3172-7 PCB-40 11 0.29 ng/g-wet weight 5/28/98 HRI-98-02B (Special Area 13) L3172-7 PCB-74 /61 340 1.6 ng/g-wet weight 5/28/98 HRI-98-02B (Special Area 13) L3172-7 PCB-70/76 480 1.6 ng/g-wet weight 5/28/98 HRI-98-02B (Special Area 13) L3172-7 PCB-66 /80 290 0.95 ng/g-wet weight 5/28/98 HRI-98-02B (Special Area 13) L3172-7 PCB-81 6.8 0.18 ng/g-wet weight 5/28/98 HRI-98-02B (Special Area 13) L3172-7 PCB-56/60 150 0.95 ng/g-wet weight 5/28/98 HRI-98-02B (Special Area 13) L3172-7 PCB-77 31 U 21 0.18 ng/g-wet weight 5/28/98 HRI-98-02B (Special Area 13) L3172-7 PCB-95 54 0.08 ng/g-wet weight 5/28/98 HRI-98-02B (Special Area 13) L3172-7 PCB-119 3.9 0.08 ng/g-wet weight 5/28/98 HRI-98-02B (Special Area 13) L3172-7 PCB-91 18 0.08 ng/g-wet weight 5/28/98 HRI-98-02B (Special Area 13) L3172-7 PCB-84 11 0.08 ng/g-wet weight 5/28/98 HRI-98-02B (Special Area 13) L3172-7 PCB-90/101/89 100 0.89 ng/g-wet weight 5/28/98 HRI-98-02B (Special Area 13) L3172-7 PCB-99 71 0.08 ng/g-wet weight 5/28/98 HRI-98-02B (Special Area 13) L3172-7 PCB-83 5.7 0.13 ng/g-wet weight 5/28/98 HRI-98-02B (Special Area 13) L3172-7 PCB-97 /86 48 0.13 ng/g-wet weight 5/28/98 HRI-98-02B (Special Area 13) L3172-7 PCB-87 77 0.13 ng/g-wet weight 5/28/98 HRI-98-02B (Special Area 13) L3172-7 PCB-85 45 0.13 ng/g-wet weight 5/28/98 HRI-98-02B (Special Area 13) L3172-7 PCB-110 190 1.5 ng/g-wet weight 5/28/98 HRI-98-02B (Special Area 13) L3172-7 PCB-82 10 0.08 ng/g-wet weight 5/28/98 HRI-98-02B (Special Area 13) L3172-7 PCB-107 8.1 0.08 ng/g-wet weight 5/28/98 HRI-98-02B (Special Area 13) L3172-7 PCB-114 3.8 0.08 ng/g-wet weight 5/28/98 HRI-98-02B (Special Area 13) L3172-7 PCB-126 4.2 0.07 ng/g-wet weight 5/28/98 HRI-98-02B (Special Area 13) L3172-7 PCB-136 6.2 0.11 ng/g-wet weight 5/28/98 HRI-98-02B (Special Area 13) L3172-7 PCB-151 9.3 0.11 ng/g-wet weight 5/28/98 HRI-98-02B (Special Area 13) L3172-7 PCB-144/135 8.4 0.11 ng/g-wet weight 5/28/98 HRI-98-02B (Special Area 13) L3172-7 PCB-149 48 0.11 ng/g-wet weight
*See Qualifier Codes table at end. Page 24 of 75

Aquatic Insects Pesticide and PCB Data
SAMPLING DATE FIELD ID LABORATORY ID ANALYTE VALUE INTERPRETIVE
QUALIFIER*
QUALIFIER REASON CODE*
DETECTION LIMIT
UNITS
5/28/98 HRI-98-02B (Special Area 13) L3172-7 PCB-134 /143 2.0 0.11 ng/g-wet weight 5/28/98 HRI-98-02B (Special Area 13) L3172-7 PCB-131 0.58 0.11 ng/g-wet weight 5/28/98 HRI-98-02B (Special Area 13) L3172-7 PCB-146 7.8 0.07 ng/g-wet weight 5/28/98 HRI-98-02B (Special Area 13) L3172-7 PCB-118 130 1.2 ng/g-wet weight 5/28/98 HRI-98-02B (Special Area 13) L3172-7 PCB-123 5.0 0.10 ng/g-wet weight 5/28/98 HRI-98-02B (Special Area 13) L3172-7 PCB-105 66 0.10 ng/g-wet weight 5/28/98 HRI-98-02B (Special Area 13) L3172-7 PCB-153 67 0.1 ng/g-wet weight 5/28/98 HRI-98-02B (Special Area 13) L3172-7 PCB-132/168 20 0.16 ng/g-wet weight 5/28/98 HRI-98-02B (Special Area 13) L3172-7 PCB-141 9.3 0.16 ng/g-wet weight 5/28/98 HRI-98-02B (Special Area 13) L3172-7 PCB-130 4.3 0.12 ng/g-wet weight 5/28/98 HRI-98-02B (Special Area 13) L3172-7 PCB-137 3.7 0.12 ng/g-wet weight 5/28/98 HRI-98-02B (Special Area 13) L3172-7 PCB-138 93 0.12 ng/g-wet weight 5/28/98 HRI-98-02B (Special Area 13) L3172-7 PCB-158 8.7 0.12 ng/g-wet weight 5/28/98 HRI-98-02B (Special Area 13) L3172-7 PCB-129 2.6 0.12 ng/g-wet weight 5/28/98 HRI-98-02B (Special Area 13) L3172-7 PCB-128 14 0.18 ng/g-wet weight 5/28/98 HRI-98-02B (Special Area 13) L3172-7 PCB-167 2.7 U 21 0.12 ng/g-wet weight 5/28/98 HRI-98-02B (Special Area 13) L3172-7 PCB-156 11 0.19 ng/g-wet weight 5/28/98 HRI-98-02B (Special Area 13) L3172-7 PCB-157 2.6 0.19 ng/g-wet weight 5/28/98 HRI-98-02B (Special Area 13) L3172-7 PCB-169 ND U 0.12 ng/g-wet weight 5/28/98 HRI-98-02B (Special Area 13) L3172-7 PCB-184 1.0 U 21 0.22 ng/g-wet weight 5/28/98 HRI-98-02B (Special Area 13) L3172-7 PCB-179 2.7 0.22 ng/g-wet weight 5/28/98 HRI-98-02B (Special Area 13) L3172-7 PCB-176 1.1 0.22 ng/g-wet weight 5/28/98 HRI-98-02B (Special Area 13) L3172-7 PCB-178 4.3 0.22 ng/g-wet weight 5/28/98 HRI-98-02B (Special Area 13) L3172-7 PCB-175 0.5 0.22 ng/g-wet weight 5/28/98 HRI-98-02B (Special Area 13) L3172-7 PCB-187/182 15 0.22 ng/g-wet weight 5/28/98 HRI-98-02B (Special Area 13) L3172-7 PCB-183 5.4 0.26 ng/g-wet weight 5/28/98 HRI-98-02B (Special Area 13) L3172-7 PCB-185 0.64 0.26 ng/g-wet weight 5/28/98 HRI-98-02B (Special Area 13) L3172-7 PCB-174 /181 5.1 0.26 ng/g-wet weight 5/28/98 HRI-98-02B (Special Area 13) L3172-7 PCB-177 5.5 0.26 ng/g-wet weight 5/28/98 HRI-98-02B (Special Area 13) L3172-7 PCB-171 2.5 0.29 ng/g-wet weight 5/28/98 HRI-98-02B (Special Area 13) L3172-7 PCB-172 1.6 0.27 ng/g-wet weight 5/28/98 HRI-98-02B (Special Area 13) L3172-7 PCB-180 23 0.27 ng/g-wet weight 5/28/98 HRI-98-02B (Special Area 13) L3172-7 PCB-193 1.5 0.27 ng/g-wet weight 5/28/98 HRI-98-02B (Special Area 13) L3172-7 PCB-191 0.54 0.27 ng/g-wet weight 5/28/98 HRI-98-02B (Special Area 13) L3172-7 PCB-170 /190 13 0.36 ng/g-wet weight
*See Qualifier Codes table at end. Page 25 of 75

Aquatic Insects Pesticide and PCB Data
SAMPLING DATE FIELD ID LABORATORY ID ANALYTE VALUE INTERPRETIVE
QUALIFIER*
QUALIFIER REASON CODE*
DETECTION LIMIT
UNITS
5/28/98 HRI-98-02B (Special Area 13) L3172-7 PCB-189 0.68 0.36 ng/g-wet weight 5/28/98 HRI-98-02B (Special Area 13) L3172-7 PCB-201 (BZ#200) 0.81 0.19 ng/g-wet weight 5/28/98 HRI-98-02B (Special Area 13) L3172-7 PCB-197 0.42 0.34 ng/g-wet weight 5/28/98 HRI-98-02B (Special Area 13) L3172-7 PCB-200 (BZ#199) 0.8 0.34 ng/g-wet weight 5/28/98 HRI-98-02B (Special Area 13) L3172-7 PCB-198 0.42 0.34 ng/g-wet weight 5/28/98 HRI-98-02B (Special Area 13) L3172-7 PCB-199 (BZ#201) 7.4 0.34 ng/g-wet weight 5/28/98 HRI-98-02B (Special Area 13) L3172-7 PCB-196/203 6.9 0.31 ng/g-wet weight 5/28/98 HRI-98-02B (Special Area 13) L3172-7 PCB-195 1.7 0.31 ng/g-wet weight 5/28/98 HRI-98-02B (Special Area 13) L3172-7 PCB-194 5.4 0.41 ng/g-wet weight 5/28/98 HRI-98-02B (Special Area 13) L3172-7 PCB-205 ND U 0.41 ng/g-wet weight 5/28/98 HRI-98-02B (Special Area 13) L3172-7 PCB-208 0.76 0.35 ng/g-wet weight 5/28/98 HRI-98-02B (Special Area 13) L3172-7 PCB-207 ND U 0.35 ng/g-wet weight 5/28/98 HRI-98-02B (Special Area 13) L3172-7 PCB-206 1.7 0.35 ng/g-wet weight 5/28/98 HRI-98-02B (Special Area 13) L3172-7 PCB-209 0.39 0.19 ng/g-wet weight 5/28/98 HRI-98-02C (Special Area 13) L3172-8 % Lipids 6.0 Percent 5/28/98 HRI-98-02C (Special Area 13) L3172-8 Hexachlorobenzene 0.61 0.11 ng/g-wet weight 5/28/98 HRI-98-02C (Special Area 13) L3172-8 alpha HCH ND U 0.64 ng/g-wet weight 5/28/98 HRI-98-02C (Special Area 13) L3172-8 beta HCH ND U 0.86 ng/g-wet weight 5/28/98 HRI-98-02C (Special Area 13) L3172-8 gamma HCH 3.3 U 21 0.64 ng/g-wet weight 5/28/98 HRI-98-02C (Special Area 13) L3172-8 delta HCH ND U 0.64 ng/g-wet weight 5/28/98 HRI-98-02C (Special Area 13) L3172-8 Heptachlor ND UJ 10 1.5 ng/g-wet weight 5/28/98 HRI-98-02C (Special Area 13) L3172-8 Aldrin ND UJ 10 0.32 ng/g-wet weight 5/28/98 HRI-98-02C (Special Area 13) L3172-8 Oxychlordane ND UJ 10 1.4 ng/g-wet weight 5/28/98 HRI-98-02C (Special Area 13) L3172-8 gamma-Chlordane (trans-) ND U 0.17 ng/g-wet weight 5/28/98 HRI-98-02C (Special Area 13) L3172-8 alpha-Chlordane (cis-) 0.24 0.15 ng/g-wet weight 5/28/98 HRI-98-02C (Special Area 13) L3172-8 o,p'-DDE 0.10 0.03 ng/g-wet weight 5/28/98 HRI-98-02C (Special Area 13) L3172-8 p,p'-DDE 5.5 0.04 ng/g-wet weight 5/28/98 HRI-98-02C (Special Area 13) L3172-8 trans-Nonachlor 0.46 J 10 0.07 ng/g-wet weight 5/28/98 HRI-98-02C (Special Area 13) L3172-8 o,p'-DDD 0.09 0.04 ng/g-wet weight 5/28/98 HRI-98-02C (Special Area 13) L3172-8 p,p'-DDD 0.33 0.04 ng/g-wet weight 5/28/98 HRI-98-02C (Special Area 13) L3172-8 o,p'-DDT 0.17 0.10 ng/g-wet weight 5/28/98 HRI-98-02C (Special Area 13) L3172-8 p,p'-DDT 0.49 0.12 ng/g-wet weight 5/28/98 HRI-98-02C (Special Area 13) L3172-8 Mirex ND UJ 10 0.13 ng/g-wet weight 5/28/98 HRI-98-02C (Special Area 13) L3172-8 Photomirex R 5A 5/28/98 HRI-98-02C (Special Area 13) L3172-8 Heptachlor Epoxide 0.42 UJ 7,10 0.20 ng/g-wet weight
*See Qualifier Codes table at end. Page 26 of 75

Aquatic Insects Pesticide and PCB Data
SAMPLING DATE FIELD ID LABORATORY ID ANALYTE VALUE INTERPRETIVE
QUALIFIER*
QUALIFIER REASON CODE*
DETECTION LIMIT
UNITS
5/28/98 HRI-98-02C (Special Area 13) L3172-8 Dieldrin 0.4 NJ 3 0.17 ng/g-wet weight 5/28/98 HRI-98-02C (Special Area 13) L3172-8 Endrin ND UJ 10 0.33 ng/g-wet weight 5/28/98 HRI-98-02C (Special Area 13) L3172-8 Aroclor 1242 3200 NJ 14 11 ng/g-wet weight 5/28/98 HRI-98-02C (Special Area 13) L3172-8 Aroclor 1248 ND U 1.0 ng/g-wet weight 5/28/98 HRI-98-02C (Special Area 13) L3172-8 Aroclor 1254 2400 NJ 14 4.8 ng/g-wet weight 5/28/98 HRI-98-02C (Special Area 13) L3172-8 Aroclor 1260 210 NJ 14 3.7 ng/g-wet weight 5/28/98 HRI-98-02C (Special Area 13) L3172-8 PCB-6 1.8 0.06 ng/g-wet weight 5/28/98 HRI-98-02C (Special Area 13) L3172-8 PCB-4/10 39 0.06 ng/g-wet weight 5/28/98 HRI-98-02C (Special Area 13) L3172-8 PCB-7/9 1.1 0.06 ng/g-wet weight 5/28/98 HRI-98-02C (Special Area 13) L3172-8 PCB-8/5 8.8 0.06 ng/g-wet weight 5/28/98 HRI-98-02C (Special Area 13) L3172-8 PCB-15 35 0.09 ng/g-wet weight 5/28/98 HRI-98-02C (Special Area 13) L3172-8 PCB-19 53 0.07 ng/g-wet weight 5/28/98 HRI-98-02C (Special Area 13) L3172-8 PCB-18 58 0.07 ng/g-wet weight 5/28/98 HRI-98-02C (Special Area 13) L3172-8 PCB-17 58 0.07 ng/g-wet weight 5/28/98 HRI-98-02C (Special Area 13) L3172-8 PCB-24/27 47 0.07 ng/g-wet weight 5/28/98 HRI-98-02C (Special Area 13) L3172-8 PCB-16/32 59 0.07 ng/g-wet weight 5/28/98 HRI-98-02C (Special Area 13) L3172-8 PCB-26 59 0.06 ng/g-wet weight 5/28/98 HRI-98-02C (Special Area 13) L3172-8 PCB-25 22 0.06 ng/g-wet weight 5/28/98 HRI-98-02C (Special Area 13) L3172-8 PCB-31/28 730 0.62 ng/g-wet weight 5/28/98 HRI-98-02C (Special Area 13) L3172-8 PCB-33 /20 49 0.06 ng/g-wet weight 5/28/98 HRI-98-02C (Special Area 13) L3172-8 PCB-22 34 0.06 ng/g-wet weight 5/28/98 HRI-98-02C (Special Area 13) L3172-8 PCB-37 120 0.06 ng/g-wet weight 5/28/98 HRI-98-02C (Special Area 13) L3172-8 PCB-53 47 0.2 ng/g-wet weight 5/28/98 HRI-98-02C (Special Area 13) L3172-8 PCB-45 10 0.2 ng/g-wet weight 5/28/98 HRI-98-02C (Special Area 13) L3172-8 PCB-46 4.6 0.2 ng/g-wet weight 5/28/98 HRI-98-02C (Special Area 13) L3172-8 PCB-52 340 1.1 ng/g-wet weight 5/28/98 HRI-98-02C (Special Area 13) L3172-8 PCB-49 370 1.4 ng/g-wet weight 5/28/98 HRI-98-02C (Special Area 13) L3172-8 PCB-47/48 350 1.4 ng/g-wet weight 5/28/98 HRI-98-02C (Special Area 13) L3172-8 PCB-44 150 0.24 ng/g-wet weight 5/28/98 HRI-98-02C (Special Area 13) L3172-8 PCB-42 120 0.24 ng/g-wet weight 5/28/98 HRI-98-02C (Special Area 13) L3172-8 PCB-41/71/64 270 1.3 ng/g-wet weight 5/28/98 HRI-98-02C (Special Area 13) L3172-8 PCB-40 10 0.27 ng/g-wet weight 5/28/98 HRI-98-02C (Special Area 13) L3172-8 PCB-74 /61 450 1.5 ng/g-wet weight 5/28/98 HRI-98-02C (Special Area 13) L3172-8 PCB-70/76 660 1.5 ng/g-wet weight 5/28/98 HRI-98-02C (Special Area 13) L3172-8 PCB-66 /80 410 0.91 ng/g-wet weight
*See Qualifier Codes table at end. Page 27 of 75

Aquatic Insects Pesticide and PCB Data
SAMPLING DATE FIELD ID LABORATORY ID ANALYTE VALUE INTERPRETIVE
QUALIFIER*
QUALIFIER REASON CODE*
DETECTION LIMIT
UNITS
5/28/98 HRI-98-02C (Special Area 13) L3172-8 PCB-81 8.3 0.16 ng/g-wet weight 5/28/98 HRI-98-02C (Special Area 13) L3172-8 PCB-56/60 210 0.91 ng/g-wet weight 5/28/98 HRI-98-02C (Special Area 13) L3172-8 PCB-77 40 U 21 0.16 ng/g-wet weight 5/28/98 HRI-98-02C (Special Area 13) L3172-8 PCB-95 56 0.12 ng/g-wet weight 5/28/98 HRI-98-02C (Special Area 13) L3172-8 PCB-119 4.1 0.12 ng/g-wet weight 5/28/98 HRI-98-02C (Special Area 13) L3172-8 PCB-91 20 0.12 ng/g-wet weight 5/28/98 HRI-98-02C (Special Area 13) L3172-8 PCB-84 13 0.12 ng/g-wet weight 5/28/98 HRI-98-02C (Special Area 13) L3172-8 PCB-90/101/89 120 0.49 ng/g-wet weight 5/28/98 HRI-98-02C (Special Area 13) L3172-8 PCB-99 82 0.12 ng/g-wet weight 5/28/98 HRI-98-02C (Special Area 13) L3172-8 PCB-83 6.7 0.19 ng/g-wet weight 5/28/98 HRI-98-02C (Special Area 13) L3172-8 PCB-97 /86 58 0.19 ng/g-wet weight 5/28/98 HRI-98-02C (Special Area 13) L3172-8 PCB-87 98 0.19 ng/g-wet weight 5/28/98 HRI-98-02C (Special Area 13) L3172-8 PCB-85 58 0.19 ng/g-wet weight 5/28/98 HRI-98-02C (Special Area 13) L3172-8 PCB-110 210 0.81 ng/g-wet weight 5/28/98 HRI-98-02C (Special Area 13) L3172-8 PCB-82 14 0.12 ng/g-wet weight 5/28/98 HRI-98-02C (Special Area 13) L3172-8 PCB-107 10 0.12 ng/g-wet weight 5/28/98 HRI-98-02C (Special Area 13) L3172-8 PCB-114 4.9 0.12 ng/g-wet weight 5/28/98 HRI-98-02C (Special Area 13) L3172-8 PCB-126 4.6 0.11 ng/g-wet weight 5/28/98 HRI-98-02C (Special Area 13) L3172-8 PCB-136 6.6 0.09 ng/g-wet weight 5/28/98 HRI-98-02C (Special Area 13) L3172-8 PCB-151 9.9 0.09 ng/g-wet weight 5/28/98 HRI-98-02C (Special Area 13) L3172-8 PCB-144/135 9.5 0.09 ng/g-wet weight 5/28/98 HRI-98-02C (Special Area 13) L3172-8 PCB-149 55 0.09 ng/g-wet weight 5/28/98 HRI-98-02C (Special Area 13) L3172-8 PCB-134 /143 2.6 0.09 ng/g-wet weight 5/28/98 HRI-98-02C (Special Area 13) L3172-8 PCB-131 0.72 0.09 ng/g-wet weight 5/28/98 HRI-98-02C (Special Area 13) L3172-8 PCB-146 8.8 0.06 ng/g-wet weight 5/28/98 HRI-98-02C (Special Area 13) L3172-8 PCB-118 160 0.62 ng/g-wet weight 5/28/98 HRI-98-02C (Special Area 13) L3172-8 PCB-123 5.0 0.12 ng/g-wet weight 5/28/98 HRI-98-02C (Special Area 13) L3172-8 PCB-105 85 0.13 ng/g-wet weight 5/28/98 HRI-98-02C (Special Area 13) L3172-8 PCB-153 72 0.07 ng/g-wet weight 5/28/98 HRI-98-02C (Special Area 13) L3172-8 PCB-132/168 23 0.11 ng/g-wet weight 5/28/98 HRI-98-02C (Special Area 13) L3172-8 PCB-141 11 0.11 ng/g-wet weight 5/28/98 HRI-98-02C (Special Area 13) L3172-8 PCB-130 4.7 0.09 ng/g-wet weight 5/28/98 HRI-98-02C (Special Area 13) L3172-8 PCB-137 4.1 0.09 ng/g-wet weight 5/28/98 HRI-98-02C (Special Area 13) L3172-8 PCB-138 110 0.09 ng/g-wet weight 5/28/98 HRI-98-02C (Special Area 13) L3172-8 PCB-158 9.9 0.09 ng/g-wet weight
*See Qualifier Codes table at end. Page 28 of 75

Aquatic Insects Pesticide and PCB Data
SAMPLING DATE FIELD ID LABORATORY ID ANALYTE VALUE INTERPRETIVE
QUALIFIER*
QUALIFIER REASON CODE*
DETECTION LIMIT
UNITS
5/28/98 HRI-98-02C (Special Area 13) L3172-8 PCB-129 2.9 0.09 ng/g-wet weight 5/28/98 HRI-98-02C (Special Area 13) L3172-8 PCB-128 16 0.13 ng/g-wet weight 5/28/98 HRI-98-02C (Special Area 13) L3172-8 PCB-167 2.9 U 21 0.09 ng/g-wet weight 5/28/98 HRI-98-02C (Special Area 13) L3172-8 PCB-156 12 0.14 ng/g-wet weight 5/28/98 HRI-98-02C (Special Area 13) L3172-8 PCB-157 2.9 0.14 ng/g-wet weight 5/28/98 HRI-98-02C (Special Area 13) L3172-8 PCB-169 ND U 0.09 ng/g-wet weight 5/28/98 HRI-98-02C (Special Area 13) L3172-8 PCB-184 0.88 U 21 0.19 ng/g-wet weight 5/28/98 HRI-98-02C (Special Area 13) L3172-8 PCB-179 3.0 0.19 ng/g-wet weight 5/28/98 HRI-98-02C (Special Area 13) L3172-8 PCB-176 1.1 0.19 ng/g-wet weight 5/28/98 HRI-98-02C (Special Area 13) L3172-8 PCB-178 4.1 0.19 ng/g-wet weight 5/28/98 HRI-98-02C (Special Area 13) L3172-8 PCB-175 0.39 0.19 ng/g-wet weight 5/28/98 HRI-98-02C (Special Area 13) L3172-8 PCB-187/182 16 0.19 ng/g-wet weight 5/28/98 HRI-98-02C (Special Area 13) L3172-8 PCB-183 5.5 0.22 ng/g-wet weight 5/28/98 HRI-98-02C (Special Area 13) L3172-8 PCB-185 0.61 0.22 ng/g-wet weight 5/28/98 HRI-98-02C (Special Area 13) L3172-8 PCB-174 /181 5.9 0.22 ng/g-wet weight 5/28/98 HRI-98-02C (Special Area 13) L3172-8 PCB-177 5.8 0.22 ng/g-wet weight 5/28/98 HRI-98-02C (Special Area 13) L3172-8 PCB-171 2.6 0.25 ng/g-wet weight 5/28/98 HRI-98-02C (Special Area 13) L3172-8 PCB-172 1.5 0.23 ng/g-wet weight 5/28/98 HRI-98-02C (Special Area 13) L3172-8 PCB-180 24 0.23 ng/g-wet weight 5/28/98 HRI-98-02C (Special Area 13) L3172-8 PCB-193 1.5 0.23 ng/g-wet weight 5/28/98 HRI-98-02C (Special Area 13) L3172-8 PCB-191 0.39 0.23 ng/g-wet weight 5/28/98 HRI-98-02C (Special Area 13) L3172-8 PCB-170 /190 12 0.31 ng/g-wet weight 5/28/98 HRI-98-02C (Special Area 13) L3172-8 PCB-189 0.5 0.31 ng/g-wet weight 5/28/98 HRI-98-02C (Special Area 13) L3172-8 PCB-201 (BZ#200) 0.74 0.17 ng/g-wet weight 5/28/98 HRI-98-02C (Special Area 13) L3172-8 PCB-197 0.37 0.3 ng/g-wet weight 5/28/98 HRI-98-02C (Special Area 13) L3172-8 PCB-200 (BZ#199) 0.53 0.3 ng/g-wet weight 5/28/98 HRI-98-02C (Special Area 13) L3172-8 PCB-198 0.36 0.3 ng/g-wet weight 5/28/98 HRI-98-02C (Special Area 13) L3172-8 PCB-199 (BZ#201) 6.6 0.3 ng/g-wet weight 5/28/98 HRI-98-02C (Special Area 13) L3172-8 PCB-196/203 6.1 0.28 ng/g-wet weight 5/28/98 HRI-98-02C (Special Area 13) L3172-8 PCB-195 1.4 0.28 ng/g-wet weight 5/28/98 HRI-98-02C (Special Area 13) L3172-8 PCB-194 5.3 0.37 ng/g-wet weight 5/28/98 HRI-98-02C (Special Area 13) L3172-8 PCB-205 ND U 0.37 ng/g-wet weight 5/28/98 HRI-98-02C (Special Area 13) L3172-8 PCB-208 0.63 0.31 ng/g-wet weight 5/28/98 HRI-98-02C (Special Area 13) L3172-8 PCB-207 ND U 0.31 ng/g-wet weight 5/28/98 HRI-98-02C (Special Area 13) L3172-8 PCB-206 1.5 0.31 ng/g-wet weight
*See Qualifier Codes table at end. Page 29 of 75

Aquatic Insects Pesticide and PCB Data
SAMPLING DATE FIELD ID LABORATORY ID ANALYTE VALUE INTERPRETIVE
QUALIFIER*
QUALIFIER REASON CODE*
DETECTION LIMIT
UNITS
5/28/98 HRI-98-02C (Special Area 13) L3172-8 PCB-209 0.22 0.19 ng/g-wet weight 5/28/98 HRI-98-02D (Special Area 13) L3172-9 % Lipids 6.3 Percent 5/28/98 HRI-98-02D (Special Area 13) L3172-9 Hexachlorobenzene 0.57 0.11 ng/g-wet weight 5/28/98 HRI-98-02D (Special Area 13) L3172-9 alpha HCH ND U 0.46 ng/g-wet weight 5/28/98 HRI-98-02D (Special Area 13) L3172-9 beta HCH ND U 0.62 ng/g-wet weight 5/28/98 HRI-98-02D (Special Area 13) L3172-9 gamma HCH 3.1 0.46 ng/g-wet weight 5/28/98 HRI-98-02D (Special Area 13) L3172-9 delta HCH ND U 0.46 ng/g-wet weight 5/28/98 HRI-98-02D (Special Area 13) L3172-9 Heptachlor ND UJ 10 0.99 ng/g-wet weight 5/28/98 HRI-98-02D (Special Area 13) L3172-9 Aldrin ND UJ 10 0.32 ng/g-wet weight 5/28/98 HRI-98-02D (Special Area 13) L3172-9 Oxychlordane ND UJ 10 1.8 ng/g-wet weight 5/28/98 HRI-98-02D (Special Area 13) L3172-9 gamma-Chlordane (trans-) ND U 0.13 ng/g-wet weight 5/28/98 HRI-98-02D (Special Area 13) L3172-9 alpha-Chlordane (cis-) 0.23 0.11 ng/g-wet weight 5/28/98 HRI-98-02D (Special Area 13) L3172-9 o,p'-DDE 0.13 0.05 ng/g-wet weight 5/28/98 HRI-98-02D (Special Area 13) L3172-9 p,p'-DDE 5.7 0.06 ng/g-wet weight 5/28/98 HRI-98-02D (Special Area 13) L3172-9 trans-Nonachlor 0.50 J 10 0.06 ng/g-wet weight 5/28/98 HRI-98-02D (Special Area 13) L3172-9 o,p'-DDD ND U 0.06 ng/g-wet weight 5/28/98 HRI-98-02D (Special Area 13) L3172-9 p,p'-DDD 0.32 0.07 ng/g-wet weight 5/28/98 HRI-98-02D (Special Area 13) L3172-9 o,p'-DDT 0.21 0.12 ng/g-wet weight 5/28/98 HRI-98-02D (Special Area 13) L3172-9 p,p'-DDT 0.43 0.15 ng/g-wet weight 5/28/98 HRI-98-02D (Special Area 13) L3172-9 Mirex ND UJ 10 0.14 ng/g-wet weight 5/28/98 HRI-98-02D (Special Area 13) L3172-9 Photomirex R 5A 5/28/98 HRI-98-02D (Special Area 13) L3172-9 Heptachlor Epoxide 1.0 UJ 7,10 0.09 ng/g-wet weight 5/28/98 HRI-98-02D (Special Area 13) L3172-9 Dieldrin 0.44 NJ 3 0.08 ng/g-wet weight 5/28/98 HRI-98-02D (Special Area 13) L3172-9 Endrin ND UJ 10 0.15 ng/g-wet weight 5/28/98 HRI-98-02D (Special Area 13) L3172-9 Aroclor 1242 2900 NJ 14 15 ng/g-wet weight 5/28/98 HRI-98-02D (Special Area 13) L3172-9 Aroclor 1248 ND U 1.5 ng/g-wet weight 5/28/98 HRI-98-02D (Special Area 13) L3172-9 Aroclor 1254 2100 NJ 14 4.2 ng/g-wet weight 5/28/98 HRI-98-02D (Special Area 13) L3172-9 Aroclor 1260 200 NJ 14 2.0 ng/g-wet weight 5/28/98 HRI-98-02D (Special Area 13) L3172-9 PCB-6 2.5 0.03 ng/g-wet weight 5/28/98 HRI-98-02D (Special Area 13) L3172-9 PCB-4/10 48 0.04 ng/g-wet weight 5/28/98 HRI-98-02D (Special Area 13) L3172-9 PCB-7/9 1.3 0.04 ng/g-wet weight 5/28/98 HRI-98-02D (Special Area 13) L3172-9 PCB-8/5 12 0.04 ng/g-wet weight 5/28/98 HRI-98-02D (Special Area 13) L3172-9 PCB-15 31 0.06 ng/g-wet weight 5/28/98 HRI-98-02D (Special Area 13) L3172-9 PCB-19 68 0.10 ng/g-wet weight 5/28/98 HRI-98-02D (Special Area 13) L3172-9 PCB-18 59 0.10 ng/g-wet weight
*See Qualifier Codes table at end. Page 30 of 75

Aquatic Insects Pesticide and PCB Data
SAMPLING DATE FIELD ID LABORATORY ID ANALYTE VALUE INTERPRETIVE
QUALIFIER*
QUALIFIER REASON CODE*
DETECTION LIMIT
UNITS
5/28/98 HRI-98-02D (Special Area 13) L3172-9 PCB-17 51 0.10 ng/g-wet weight 5/28/98 HRI-98-02D (Special Area 13) L3172-9 PCB-24/27 59 0.10 ng/g-wet weight 5/28/98 HRI-98-02D (Special Area 13) L3172-9 PCB-16/32 69 0.10 ng/g-wet weight 5/28/98 HRI-98-02D (Special Area 13) L3172-9 PCB-26 53 0.08 ng/g-wet weight 5/28/98 HRI-98-02D (Special Area 13) L3172-9 PCB-25 19 0.08 ng/g-wet weight 5/28/98 HRI-98-02D (Special Area 13) L3172-9 PCB-31/28 620 0.88 ng/g-wet weight 5/28/98 HRI-98-02D (Special Area 13) L3172-9 PCB-33 /20 41 0.08 ng/g-wet weight 5/28/98 HRI-98-02D (Special Area 13) L3172-9 PCB-22 31 0.08 ng/g-wet weight 5/28/98 HRI-98-02D (Special Area 13) L3172-9 PCB-37 81 0.08 ng/g-wet weight 5/28/98 HRI-98-02D (Special Area 13) L3172-9 PCB-53 48 0.18 ng/g-wet weight 5/28/98 HRI-98-02D (Special Area 13) L3172-9 PCB-45 12 0.18 ng/g-wet weight 5/28/98 HRI-98-02D (Special Area 13) L3172-9 PCB-46 4.4 0.18 ng/g-wet weight 5/28/98 HRI-98-02D (Special Area 13) L3172-9 PCB-52 290 0.71 ng/g-wet weight 5/28/98 HRI-98-02D (Special Area 13) L3172-9 PCB-49 320 0.92 ng/g-wet weight 5/28/98 HRI-98-02D (Special Area 13) L3172-9 PCB-47/48 290 0.92 ng/g-wet weight 5/28/98 HRI-98-02D (Special Area 13) L3172-9 PCB-44 130 0.21 ng/g-wet weight 5/28/98 HRI-98-02D (Special Area 13) L3172-9 PCB-42 100 0.21 ng/g-wet weight 5/28/98 HRI-98-02D (Special Area 13) L3172-9 PCB-41/71/64 230 0.86 ng/g-wet weight 5/28/98 HRI-98-02D (Special Area 13) L3172-9 PCB-40 11 0.23 ng/g-wet weight 5/28/98 HRI-98-02D (Special Area 13) L3172-9 PCB-74 /61 350 1.0 ng/g-wet weight 5/28/98 HRI-98-02D (Special Area 13) L3172-9 PCB-70/76 510 1.0 ng/g-wet weight 5/28/98 HRI-98-02D (Special Area 13) L3172-9 PCB-66 /80 300 0.61 ng/g-wet weight 5/28/98 HRI-98-02D (Special Area 13) L3172-9 PCB-81 7.1 0.14 ng/g-wet weight 5/28/98 HRI-98-02D (Special Area 13) L3172-9 PCB-56/60 160 0.61 ng/g-wet weight 5/28/98 HRI-98-02D (Special Area 13) L3172-9 PCB-77 34 U 21 0.14 ng/g-wet weight 5/28/98 HRI-98-02D (Special Area 13) L3172-9 PCB-95 51 0.11 ng/g-wet weight 5/28/98 HRI-98-02D (Special Area 13) L3172-9 PCB-119 3.9 0.11 ng/g-wet weight 5/28/98 HRI-98-02D (Special Area 13) L3172-9 PCB-91 19 0.11 ng/g-wet weight 5/28/98 HRI-98-02D (Special Area 13) L3172-9 PCB-84 12 0.11 ng/g-wet weight 5/28/98 HRI-98-02D (Special Area 13) L3172-9 PCB-90/101/89 110 0.7 ng/g-wet weight 5/28/98 HRI-98-02D (Special Area 13) L3172-9 PCB-99 75 0.11 ng/g-wet weight 5/28/98 HRI-98-02D (Special Area 13) L3172-9 PCB-83 6.2 0.17 ng/g-wet weight 5/28/98 HRI-98-02D (Special Area 13) L3172-9 PCB-97 /86 51 0.17 ng/g-wet weight 5/28/98 HRI-98-02D (Special Area 13) L3172-9 PCB-87 85 0.17 ng/g-wet weight 5/28/98 HRI-98-02D (Special Area 13) L3172-9 PCB-85 49 0.17 ng/g-wet weight
*See Qualifier Codes table at end. Page 31 of 75

Aquatic Insects Pesticide and PCB Data
SAMPLING DATE FIELD ID LABORATORY ID ANALYTE VALUE INTERPRETIVE
QUALIFIER*
QUALIFIER REASON CODE*
DETECTION LIMIT
UNITS
5/28/98 HRI-98-02D (Special Area 13) L3172-9 PCB-110 190 1.2 ng/g-wet weight 5/28/98 HRI-98-02D (Special Area 13) L3172-9 PCB-82 12 0.11 ng/g-wet weight 5/28/98 HRI-98-02D (Special Area 13) L3172-9 PCB-107 9.1 0.11 ng/g-wet weight 5/28/98 HRI-98-02D (Special Area 13) L3172-9 PCB-114 4.1 0.11 ng/g-wet weight 5/28/98 HRI-98-02D (Special Area 13) L3172-9 PCB-126 4 0.10 ng/g-wet weight 5/28/98 HRI-98-02D (Special Area 13) L3172-9 PCB-136 6.5 0.08 ng/g-wet weight 5/28/98 HRI-98-02D (Special Area 13) L3172-9 PCB-151 9.4 0.08 ng/g-wet weight 5/28/98 HRI-98-02D (Special Area 13) L3172-9 PCB-144/135 9.1 0.08 ng/g-wet weight 5/28/98 HRI-98-02D (Special Area 13) L3172-9 PCB-149 52 0.08 ng/g-wet weight 5/28/98 HRI-98-02D (Special Area 13) L3172-9 PCB-134 /143 2.5 0.08 ng/g-wet weight 5/28/98 HRI-98-02D (Special Area 13) L3172-9 PCB-131 0.63 0.08 ng/g-wet weight 5/28/98 HRI-98-02D (Special Area 13) L3172-9 PCB-146 8.4 0.05 ng/g-wet weight 5/28/98 HRI-98-02D (Special Area 13) L3172-9 PCB-118 140 0.84 ng/g-wet weight 5/28/98 HRI-98-02D (Special Area 13) L3172-9 PCB-123 4.8 0.11 ng/g-wet weight 5/28/98 HRI-98-02D (Special Area 13) L3172-9 PCB-105 70 0.12 ng/g-wet weight 5/28/98 HRI-98-02D (Special Area 13) L3172-9 PCB-153 67 0.06 ng/g-wet weight 5/28/98 HRI-98-02D (Special Area 13) L3172-9 PCB-132/168 20 0.10 ng/g-wet weight 5/28/98 HRI-98-02D (Special Area 13) L3172-9 PCB-141 9.9 0.1 ng/g-wet weight 5/28/98 HRI-98-02D (Special Area 13) L3172-9 PCB-130 4.0 0.08 ng/g-wet weight 5/28/98 HRI-98-02D (Special Area 13) L3172-9 PCB-137 3.8 0.08 ng/g-wet weight 5/28/98 HRI-98-02D (Special Area 13) L3172-9 PCB-138 91 0.08 ng/g-wet weight 5/28/98 HRI-98-02D (Special Area 13) L3172-9 PCB-158 8.6 0.08 ng/g-wet weight 5/28/98 HRI-98-02D (Special Area 13) L3172-9 PCB-129 2.5 0.08 ng/g-wet weight 5/28/98 HRI-98-02D (Special Area 13) L3172-9 PCB-128 13 0.11 ng/g-wet weight 5/28/98 HRI-98-02D (Special Area 13) L3172-9 PCB-167 2.5 U 21 0.08 ng/g-wet weight 5/28/98 HRI-98-02D (Special Area 13) L3172-9 PCB-156 11 0.12 ng/g-wet weight 5/28/98 HRI-98-02D (Special Area 13) L3172-9 PCB-157 2.5 0.12 ng/g-wet weight 5/28/98 HRI-98-02D (Special Area 13) L3172-9 PCB-169 ND U 0.08 ng/g-wet weight 5/28/98 HRI-98-02D (Special Area 13) L3172-9 PCB-184 0.86 U 21 0.1 ng/g-wet weight 5/28/98 HRI-98-02D (Special Area 13) L3172-9 PCB-179 2.9 0.1 ng/g-wet weight 5/28/98 HRI-98-02D (Special Area 13) L3172-9 PCB-176 0.97 0.1 ng/g-wet weight 5/28/98 HRI-98-02D (Special Area 13) L3172-9 PCB-178 3.7 0.1 ng/g-wet weight 5/28/98 HRI-98-02D (Special Area 13) L3172-9 PCB-175 0.31 0.1 ng/g-wet weight 5/28/98 HRI-98-02D (Special Area 13) L3172-9 PCB-187/182 14 0.1 ng/g-wet weight 5/28/98 HRI-98-02D (Special Area 13) L3172-9 PCB-183 4.9 0.12 ng/g-wet weight
*See Qualifier Codes table at end. Page 32 of 75
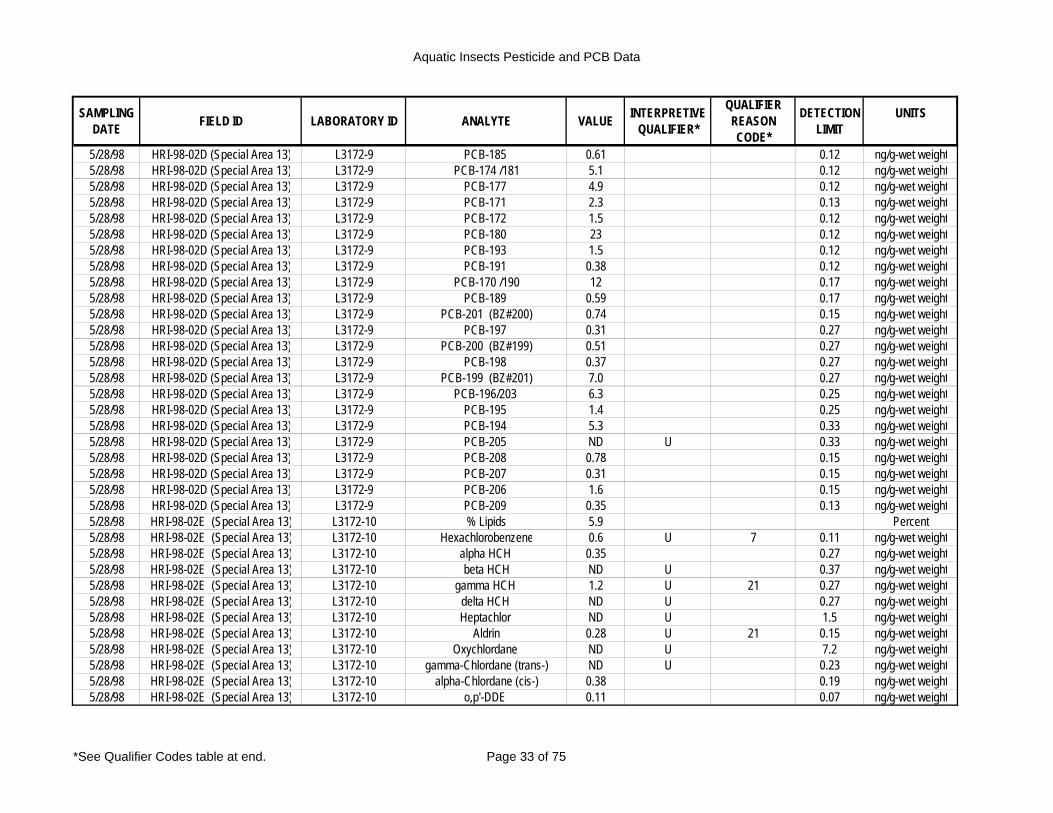
Aquatic Insects Pesticide and PCB Data
SAMPLING DATE FIELD ID LABORATORY ID ANALYTE VALUE INTERPRETIVE
QUALIFIER*
QUALIFIER REASON CODE*
DETECTION LIMIT
UNITS
5/28/98 HRI-98-02D (Special Area 13) L3172-9 PCB-185 0.61 0.12 ng/g-wet weight 5/28/98 HRI-98-02D (Special Area 13) L3172-9 PCB-174 /181 5.1 0.12 ng/g-wet weight 5/28/98 HRI-98-02D (Special Area 13) L3172-9 PCB-177 4.9 0.12 ng/g-wet weight 5/28/98 HRI-98-02D (Special Area 13) L3172-9 PCB-171 2.3 0.13 ng/g-wet weight 5/28/98 HRI-98-02D (Special Area 13) L3172-9 PCB-172 1.5 0.12 ng/g-wet weight 5/28/98 HRI-98-02D (Special Area 13) L3172-9 PCB-180 23 0.12 ng/g-wet weight 5/28/98 HRI-98-02D (Special Area 13) L3172-9 PCB-193 1.5 0.12 ng/g-wet weight 5/28/98 HRI-98-02D (Special Area 13) L3172-9 PCB-191 0.38 0.12 ng/g-wet weight 5/28/98 HRI-98-02D (Special Area 13) L3172-9 PCB-170 /190 12 0.17 ng/g-wet weight 5/28/98 HRI-98-02D (Special Area 13) L3172-9 PCB-189 0.59 0.17 ng/g-wet weight 5/28/98 HRI-98-02D (Special Area 13) L3172-9 PCB-201 (BZ#200) 0.74 0.15 ng/g-wet weight 5/28/98 HRI-98-02D (Special Area 13) L3172-9 PCB-197 0.31 0.27 ng/g-wet weight 5/28/98 HRI-98-02D (Special Area 13) L3172-9 PCB-200 (BZ#199) 0.51 0.27 ng/g-wet weight 5/28/98 HRI-98-02D (Special Area 13) L3172-9 PCB-198 0.37 0.27 ng/g-wet weight 5/28/98 HRI-98-02D (Special Area 13) L3172-9 PCB-199 (BZ#201) 7.0 0.27 ng/g-wet weight 5/28/98 HRI-98-02D (Special Area 13) L3172-9 PCB-196/203 6.3 0.25 ng/g-wet weight 5/28/98 HRI-98-02D (Special Area 13) L3172-9 PCB-195 1.4 0.25 ng/g-wet weight 5/28/98 HRI-98-02D (Special Area 13) L3172-9 PCB-194 5.3 0.33 ng/g-wet weight 5/28/98 HRI-98-02D (Special Area 13) L3172-9 PCB-205 ND U 0.33 ng/g-wet weight 5/28/98 HRI-98-02D (Special Area 13) L3172-9 PCB-208 0.78 0.15 ng/g-wet weight 5/28/98 HRI-98-02D (Special Area 13) L3172-9 PCB-207 0.31 0.15 ng/g-wet weight 5/28/98 HRI-98-02D (Special Area 13) L3172-9 PCB-206 1.6 0.15 ng/g-wet weight 5/28/98 HRI-98-02D (Special Area 13) L3172-9 PCB-209 0.35 0.13 ng/g-wet weight 5/28/98 HRI-98-02E (Special Area 13) L3172-10 % Lipids 5.9 Percent 5/28/98 HRI-98-02E (Special Area 13) L3172-10 Hexachlorobenzene 0.6 U 7 0.11 ng/g-wet weight 5/28/98 HRI-98-02E (Special Area 13) L3172-10 alpha HCH 0.35 0.27 ng/g-wet weight 5/28/98 HRI-98-02E (Special Area 13) L3172-10 beta HCH ND U 0.37 ng/g-wet weight 5/28/98 HRI-98-02E (Special Area 13) L3172-10 gamma HCH 1.2 U 21 0.27 ng/g-wet weight 5/28/98 HRI-98-02E (Special Area 13) L3172-10 delta HCH ND U 0.27 ng/g-wet weight 5/28/98 HRI-98-02E (Special Area 13) L3172-10 Heptachlor ND U 1.5 ng/g-wet weight 5/28/98 HRI-98-02E (Special Area 13) L3172-10 Aldrin 0.28 U 21 0.15 ng/g-wet weight 5/28/98 HRI-98-02E (Special Area 13) L3172-10 Oxychlordane ND U 7.2 ng/g-wet weight 5/28/98 HRI-98-02E (Special Area 13) L3172-10 gamma-Chlordane (trans-) ND U 0.23 ng/g-wet weight 5/28/98 HRI-98-02E (Special Area 13) L3172-10 alpha-Chlordane (cis-) 0.38 0.19 ng/g-wet weight 5/28/98 HRI-98-02E (Special Area 13) L3172-10 o,p'-DDE 0.11 0.07 ng/g-wet weight
*See Qualifier Codes table at end. Page 33 of 75

Aquatic Insects Pesticide and PCB Data
SAMPLING DATE FIELD ID LABORATORY ID ANALYTE VALUE INTERPRETIVE
QUALIFIER*
QUALIFIER REASON CODE*
DETECTION LIMIT
UNITS
5/28/98 HRI-98-02E (Special Area 13) L3172-10 p,p'-DDE 5.8 0.08 ng/g-wet weight 5/28/98 HRI-98-02E (Special Area 13) L3172-10 trans-Nonachlor 0.51 0.11 ng/g-wet weight 5/28/98 HRI-98-02E (Special Area 13) L3172-10 o,p'-DDD 0.16 U 21 0.05 ng/g-wet weight 5/28/98 HRI-98-02E (Special Area 13) L3172-10 p,p'-DDD 0.33 U 21 0.05 ng/g-wet weight 5/28/98 HRI-98-02E (Special Area 13) L3172-10 o,p'-DDT 0.18 0.1 ng/g-wet weight 5/28/98 HRI-98-02E (Special Area 13) L3172-10 p,p'-DDT 0.48 0.13 ng/g-wet weight 5/28/98 HRI-98-02E (Special Area 13) L3172-10 Mirex ND U 0.1 ng/g-wet weight 5/28/98 HRI-98-02E (Special Area 13) L3172-10 Photomirex R 5A 5/28/98 HRI-98-02E (Special Area 13) L3172-10 Heptachlor Epoxide ND U 0.4 ng/g-wet weight 5/28/98 HRI-98-02E (Special Area 13) L3172-10 alpha-Endosulphan (I) ND U 0.22 ng/g-wet weight 5/28/98 HRI-98-02E (Special Area 13) L3172-10 Dieldrin 0.57 NJ 3 0.13 ng/g-wet weight 5/28/98 HRI-98-02E (Special Area 13) L3172-10 Endrin ND UJ 10 0.33 ng/g-wet weight 5/28/98 HRI-98-02E (Special Area 13) L3172-10 beta-Endosulphan (II) ND U 0.25 ng/g-wet weight 5/28/98 HRI-98-02E (Special Area 13) L3172-10 Endrin Aldehyde 0.27 U 7 0.24 ng/g-wet weight 5/28/98 HRI-98-02E (Special Area 13) L3172-10 Endosulphan Sulphate ND U 0.29 ng/g-wet weight 5/28/98 HRI-98-02E (Special Area 13) L3172-10 Endrin Ketone ND U 0.14 ng/g-wet weight 5/28/98 HRI-98-02E (Special Area 13) L3172-10 Methoxychlor ND UJ 10 0.62 ng/g-wet weight 5/28/98 HRI-98-02E (Special Area 13) L3172-10 Aroclor 1242 3900 NJ 14 33 ng/g-wet weight 5/28/98 HRI-98-02E (Special Area 13) L3172-10 Aroclor 1248 ND U 1.5 ng/g-wet weight 5/28/98 HRI-98-02E (Special Area 13) L3172-10 Aroclor 1254 2400 NJ 14 4.1 ng/g-wet weight 5/28/98 HRI-98-02E (Special Area 13) L3172-10 Aroclor 1260 230 NJ 14 3.4 ng/g-wet weight 5/28/98 HRI-98-02E (Special Area 13) L3172-10 PCB-6 ND U 0.03 ng/g-wet weight 5/28/98 HRI-98-02E (Special Area 13) L3172-10 PCB-4/10 58 0.04 ng/g-wet weight 5/28/98 HRI-98-02E (Special Area 13) L3172-10 PCB-7/9 2.2 J 9 0.04 ng/g-wet weight 5/28/98 HRI-98-02E (Special Area 13) L3172-10 PCB-8/5 17 J 9 0.04 ng/g-wet weight 5/28/98 HRI-98-02E (Special Area 13) L3172-10 PCB-15 47 0.07 ng/g-wet weight 5/28/98 HRI-98-02E (Special Area 13) L3172-10 PCB-19 75 0.10 ng/g-wet weight 5/28/98 HRI-98-02E (Special Area 13) L3172-10 PCB-18 120 J 9 2.1 ng/g-wet weight 5/28/98 HRI-98-02E (Special Area 13) L3172-10 PCB-17 78 0.10 ng/g-wet weight 5/28/98 HRI-98-02E (Special Area 13) L3172-10 PCB-24/27 67 0.10 ng/g-wet weight 5/28/98 HRI-98-02E (Special Area 13) L3172-10 PCB-16/32 96 0.10 ng/g-wet weight 5/28/98 HRI-98-02E (Special Area 13) L3172-10 PCB-26 73 0.08 ng/g-wet weight 5/28/98 HRI-98-02E (Special Area 13) L3172-10 PCB-25 27 0.08 ng/g-wet weight 5/28/98 HRI-98-02E (Special Area 13) L3172-10 PCB-31/28 820 1.8 ng/g-wet weight 5/28/98 HRI-98-02E (Special Area 13) L3172-10 PCB-33 /20 70 0.08 ng/g-wet weight
*See Qualifier Codes table at end. Page 34 of 75

Aquatic Insects Pesticide and PCB Data
SAMPLING DATE FIELD ID LABORATORY ID ANALYTE VALUE INTERPRETIVE
QUALIFIER*
QUALIFIER REASON CODE*
DETECTION LIMIT
UNITS
5/28/98 HRI-98-02E (Special Area 13) L3172-10 PCB-22 36 0.08 ng/g-wet weight 5/28/98 HRI-98-02E (Special Area 13) L3172-10 PCB-37 16 0.08 ng/g-wet weight 5/28/98 HRI-98-02E (Special Area 13) L3172-10 PCB-53 62 0.12 ng/g-wet weight 5/28/98 HRI-98-02E (Special Area 13) L3172-10 PCB-45 16 0.12 ng/g-wet weight 5/28/98 HRI-98-02E (Special Area 13) L3172-10 PCB-46 5.8 0.12 ng/g-wet weight 5/28/98 HRI-98-02E (Special Area 13) L3172-10 PCB-52 340 2.9 ng/g-wet weight 5/28/98 HRI-98-02E (Special Area 13) L3172-10 PCB-49 380 3.8 ng/g-wet weight 5/28/98 HRI-98-02E (Special Area 13) L3172-10 PCB-47/48 350 3.8 ng/g-wet weight 5/28/98 HRI-98-02E (Special Area 13) L3172-10 PCB-44 170 3.6 ng/g-wet weight 5/28/98 HRI-98-02E (Special Area 13) L3172-10 PCB-42 140 0.15 ng/g-wet weight 5/28/98 HRI-98-02E (Special Area 13) L3172-10 PCB-41/71/64 280 4.1 ng/g-wet weight 5/28/98 HRI-98-02E (Special Area 13) L3172-10 PCB-40 13 0.17 ng/g-wet weight 5/28/98 HRI-98-02E (Special Area 13) L3172-10 PCB-74 /61 400 4.1 ng/g-wet weight 5/28/98 HRI-98-02E (Special Area 13) L3172-10 PCB-70/76 560 4.1 ng/g-wet weight 5/28/98 HRI-98-02E (Special Area 13) L3172-10 PCB-66 /80 330 2.5 ng/g-wet weight 5/28/98 HRI-98-02E (Special Area 13) L3172-10 PCB-81 7.8 U 21 0.1 ng/g-wet weight 5/28/98 HRI-98-02E (Special Area 13) L3172-10 PCB-56/60 170 2.5 ng/g-wet weight 5/28/98 HRI-98-02E (Special Area 13) L3172-10 PCB-77 38 U 21 0.1 ng/g-wet weight 5/28/98 HRI-98-02E (Special Area 13) L3172-10 PCB-95 64 0.1 ng/g-wet weight 5/28/98 HRI-98-02E (Special Area 13) L3172-10 PCB-119 4.0 0.1 ng/g-wet weight 5/28/98 HRI-98-02E (Special Area 13) L3172-10 PCB-91 22 0.1 ng/g-wet weight 5/28/98 HRI-98-02E (Special Area 13) L3172-10 PCB-84 13 0.1 ng/g-wet weight 5/28/98 HRI-98-02E (Special Area 13) L3172-10 PCB-90/101/89 120 1.8 ng/g-wet weight 5/28/98 HRI-98-02E (Special Area 13) L3172-10 PCB-99 81 0.1 ng/g-wet weight 5/28/98 HRI-98-02E (Special Area 13) L3172-10 PCB-83 7.1 0.17 ng/g-wet weight 5/28/98 HRI-98-02E (Special Area 13) L3172-10 PCB-97 /86 57 0.17 ng/g-wet weight 5/28/98 HRI-98-02E (Special Area 13) L3172-10 PCB-87 98 0.17 ng/g-wet weight 5/28/98 HRI-98-02E (Special Area 13) L3172-10 PCB-85 56 0.17 ng/g-wet weight 5/28/98 HRI-98-02E (Special Area 13) L3172-10 PCB-110 210 3.0 ng/g-wet weight 5/28/98 HRI-98-02E (Special Area 13) L3172-10 PCB-82 13 0.10 ng/g-wet weight 5/28/98 HRI-98-02E (Special Area 13) L3172-10 PCB-107 10 0.10 ng/g-wet weight 5/28/98 HRI-98-02E (Special Area 13) L3172-10 PCB-114 4.7 0.10 ng/g-wet weight 5/28/98 HRI-98-02E (Special Area 13) L3172-10 PCB-126 5.1 0.09 ng/g-wet weight 5/28/98 HRI-98-02E (Special Area 13) L3172-10 PCB-136 6.7 0.11 ng/g-wet weight 5/28/98 HRI-98-02E (Special Area 13) L3172-10 PCB-151 10 0.11 ng/g-wet weight
*See Qualifier Codes table at end. Page 35 of 75

Aquatic Insects Pesticide and PCB Data
SAMPLING DATE FIELD ID LABORATORY ID ANALYTE VALUE INTERPRETIVE
QUALIFIER*
QUALIFIER REASON CODE*
DETECTION LIMIT
UNITS
5/28/98 HRI-98-02E (Special Area 13) L3172-10 PCB-144/135 9.8 0.11 ng/g-wet weight 5/28/98 HRI-98-02E (Special Area 13) L3172-10 PCB-149 53 0.11 ng/g-wet weight 5/28/98 HRI-98-02E (Special Area 13) L3172-10 PCB-134 /143 2.7 0.11 ng/g-wet weight 5/28/98 HRI-98-02E (Special Area 13) L3172-10 PCB-131 0.76 0.11 ng/g-wet weight 5/28/98 HRI-98-02E (Special Area 13) L3172-10 PCB-146 8.9 0.07 ng/g-wet weight 5/28/98 HRI-98-02E (Special Area 13) L3172-10 PCB-118 150 2.2 ng/g-wet weight 5/28/98 HRI-98-02E (Special Area 13) L3172-10 PCB-123 5.9 U 21 0.11 ng/g-wet weight 5/28/98 HRI-98-02E (Special Area 13) L3172-10 PCB-105 80 0.1 ng/g-wet weight 5/28/98 HRI-98-02E (Special Area 13) L3172-10 PCB-153 80 0.1 ng/g-wet weight 5/28/98 HRI-98-02E (Special Area 13) L3172-10 PCB-132/168 24 0.16 ng/g-wet weight 5/28/98 HRI-98-02E (Special Area 13) L3172-10 PCB-141 13 0.16 ng/g-wet weight 5/28/98 HRI-98-02E (Special Area 13) L3172-10 PCB-130 5.3 0.12 ng/g-wet weight 5/28/98 HRI-98-02E (Special Area 13) L3172-10 PCB-137 4.5 0.12 ng/g-wet weight 5/28/98 HRI-98-02E (Special Area 13) L3172-10 PCB-138 120 0.12 ng/g-wet weight 5/28/98 HRI-98-02E (Special Area 13) L3172-10 PCB-158 11 0.12 ng/g-wet weight 5/28/98 HRI-98-02E (Special Area 13) L3172-10 PCB-129 3.2 0.12 ng/g-wet weight 5/28/98 HRI-98-02E (Special Area 13) L3172-10 PCB-128 17 0.18 ng/g-wet weight 5/28/98 HRI-98-02E (Special Area 13) L3172-10 PCB-167 3.5 U 21 0.12 ng/g-wet weight 5/28/98 HRI-98-02E (Special Area 13) L3172-10 PCB-156 14 0.2 ng/g-wet weight 5/28/98 HRI-98-02E (Special Area 13) L3172-10 PCB-157 3.4 0.2 ng/g-wet weight 5/28/98 HRI-98-02E (Special Area 13) L3172-10 PCB-169 1.5 0.12 ng/g-wet weight 5/28/98 HRI-98-02E (Special Area 13) L3172-10 PCB-184 1.0 U 21 0.18 ng/g-wet weight 5/28/98 HRI-98-02E (Special Area 13) L3172-10 PCB-179 3.7 0.18 ng/g-wet weight 5/28/98 HRI-98-02E (Special Area 13) L3172-10 PCB-176 1.2 0.18 ng/g-wet weight 5/28/98 HRI-98-02E (Special Area 13) L3172-10 PCB-178 4.9 0.18 ng/g-wet weight 5/28/98 HRI-98-02E (Special Area 13) L3172-10 PCB-175 0.48 0.18 ng/g-wet weight 5/28/98 HRI-98-02E (Special Area 13) L3172-10 PCB-187/182 18 0.18 ng/g-wet weight 5/28/98 HRI-98-02E (Special Area 13) L3172-10 PCB-183 6.5 0.21 ng/g-wet weight 5/28/98 HRI-98-02E (Special Area 13) L3172-10 PCB-185 0.8 0.21 ng/g-wet weight 5/28/98 HRI-98-02E (Special Area 13) L3172-10 PCB-174 /181 7.3 0.21 ng/g-wet weight 5/28/98 HRI-98-02E (Special Area 13) L3172-10 PCB-177 6.3 0.21 ng/g-wet weight 5/28/98 HRI-98-02E (Special Area 13) L3172-10 PCB-171 2.8 0.23 ng/g-wet weight 5/28/98 HRI-98-02E (Special Area 13) L3172-10 PCB-172 1.6 0.21 ng/g-wet weight 5/28/98 HRI-98-02E (Special Area 13) L3172-10 PCB-180 25 0.21 ng/g-wet weight 5/28/98 HRI-98-02E (Special Area 13) L3172-10 PCB-193 1.6 0.21 ng/g-wet weight
*See Qualifier Codes table at end. Page 36 of 75

Aquatic Insects Pesticide and PCB Data
SAMPLING DATE FIELD ID LABORATORY ID ANALYTE VALUE INTERPRETIVE
QUALIFIER*
QUALIFIER REASON CODE*
DETECTION LIMIT
UNITS
5/28/98 HRI-98-02E (Special Area 13) L3172-10 PCB-191 0.45 0.21 ng/g-wet weight 5/28/98 HRI-98-02E (Special Area 13) L3172-10 PCB-170 /190 15 0.31 ng/g-wet weight 5/28/98 HRI-98-02E (Special Area 13) L3172-10 PCB-189 0.69 0.31 ng/g-wet weight 5/28/98 HRI-98-02E (Special Area 13) L3172-10 PCB-201 (BZ#200) 0.94 U 21 0.18 ng/g-wet weight 5/28/98 HRI-98-02E (Special Area 13) L3172-10 PCB-197 0.6 0.36 ng/g-wet weight 5/28/98 HRI-98-02E (Special Area 13) L3172-10 PCB-200 (BZ#199) 0.77 0.36 ng/g-wet weight 5/28/98 HRI-98-02E (Special Area 13) L3172-10 PCB-198 0.43 0.36 ng/g-wet weight 5/28/98 HRI-98-02E (Special Area 13) L3172-10 PCB-199 (BZ#201) 7.2 0.36 ng/g-wet weight 5/28/98 HRI-98-02E (Special Area 13) L3172-10 PCB-196/203 7.5 0.34 ng/g-wet weight 5/28/98 HRI-98-02E (Special Area 13) L3172-10 PCB-195 1.5 0.34 ng/g-wet weight 5/28/98 HRI-98-02E (Special Area 13) L3172-10 PCB-194 6.1 0.51 ng/g-wet weight 5/28/98 HRI-98-02E (Special Area 13) L3172-10 PCB-205 0.52 0.51 ng/g-wet weight 5/28/98 HRI-98-02E (Special Area 13) L3172-10 PCB-208 0.81 U 21 0.39 ng/g-wet weight 5/28/98 HRI-98-02E (Special Area 13) L3172-10 PCB-207 ND U 0.39 ng/g-wet weight 5/28/98 HRI-98-02E (Special Area 13) L3172-10 PCB-206 1.8 0.39 ng/g-wet weight 5/28/98 HRI-98-02E (Special Area 13) L3172-10 PCB-209 0.52 U 21 0.37 ng/g-wet weight 6/16/98 HRI-98-03A (Saratoga Battlefield) L3172-11 % Lipids 5.0 Percent 6/16/98 HRI-98-03A (Saratoga Battlefield) L3172-11 Hexachlorobenzene 0.43 0.12 ng/g-wet weight 6/16/98 HRI-98-03A (Saratoga Battlefield) L3172-11 alpha HCH ND U 0.38 ng/g-wet weight 6/16/98 HRI-98-03A (Saratoga Battlefield) L3172-11 beta HCH ND U 0.50 ng/g-wet weight 6/16/98 HRI-98-03A (Saratoga Battlefield) L3172-11 gamma HCH 3.2 U 21 0.37 ng/g-wet weight 6/16/98 HRI-98-03A (Saratoga Battlefield) L3172-11 delta HCH ND U 0.37 ng/g-wet weight 6/16/98 HRI-98-03A (Saratoga Battlefield) L3172-11 Heptachlor ND UJ 10 0.79 ng/g-wet weight 6/16/98 HRI-98-03A (Saratoga Battlefield) L3172-11 Aldrin ND UJ 10 0.25 ng/g-wet weight 6/16/98 HRI-98-03A (Saratoga Battlefield) L3172-11 Oxychlordane ND UJ 10 2.3 ng/g-wet weight 6/16/98 HRI-98-03A (Saratoga Battlefield) L3172-11 gamma-Chlordane (trans-) ND U 0.35 ng/g-wet weight 6/16/98 HRI-98-03A (Saratoga Battlefield) L3172-11 alpha-Chlordane (cis-) ND U 0.31 ng/g-wet weight 6/16/98 HRI-98-03A (Saratoga Battlefield) L3172-11 o,p'-DDE 0.13 0.09 ng/g-wet weight 6/16/98 HRI-98-03A (Saratoga Battlefield) L3172-11 p,p'-DDE 6.5 0.11 ng/g-wet weight 6/16/98 HRI-98-03A (Saratoga Battlefield) L3172-11 trans-Nonachlor 0.39 J 10 0.10 ng/g-wet weight 6/16/98 HRI-98-03A (Saratoga Battlefield) L3172-11 o,p'-DDD 0.16 0.04 ng/g-wet weight 6/16/98 HRI-98-03A (Saratoga Battlefield) L3172-11 p,p'-DDD 0.27 0.04 ng/g-wet weight 6/16/98 HRI-98-03A (Saratoga Battlefield) L3172-11 o,p'-DDT 0.16 0.09 ng/g-wet weight 6/16/98 HRI-98-03A (Saratoga Battlefield) L3172-11 p,p'-DDT 0.44 0.11 ng/g-wet weight 6/16/98 HRI-98-03A (Saratoga Battlefield) L3172-11 Mirex ND UJ 10 0.11 ng/g-wet weight
*See Qualifier Codes table at end. Page 37 of 75

Aquatic Insects Pesticide and PCB Data
SAMPLING DATE FIELD ID LABORATORY ID ANALYTE VALUE INTERPRETIVE
QUALIFIER*
QUALIFIER REASON CODE*
DETECTION LIMIT
UNITS
6/16/98 HRI-98-03A (Saratoga Battlefield) L3172-11 Photomirex R 5A 6/16/98 HRI-98-03A (Saratoga Battlefield) L3172-11 Heptachlor Epoxide 0.31 UJ 7,10 0.12 ng/g-wet weight 6/16/98 HRI-98-03A (Saratoga Battlefield) L3172-11 Dieldrin 0.39 NJ 3 0.1 ng/g-wet weight 6/16/98 HRI-98-03A (Saratoga Battlefield) L3172-11 Endrin ND UJ 10 0.2 ng/g-wet weight 6/16/98 HRI-98-03A (Saratoga Battlefield) L3172-11 Aroclor 1242 1900 NJ 14 18 ng/g-wet weight 6/16/98 HRI-98-03A (Saratoga Battlefield) L3172-11 Aroclor 1248 ND U 1.4 ng/g-wet weight 6/16/98 HRI-98-03A (Saratoga Battlefield) L3172-11 Aroclor 1254 920 NJ 14 4.1 ng/g-wet weight 6/16/98 HRI-98-03A (Saratoga Battlefield) L3172-11 Aroclor 1260 130 NJ 14 2.5 ng/g-wet weight 6/16/98 HRI-98-03A (Saratoga Battlefield) L3172-11 PCB-6 8.0 0.08 ng/g-wet weight 6/16/98 HRI-98-03A (Saratoga Battlefield) L3172-11 PCB-4/10 110 0.07 ng/g-wet weight 6/16/98 HRI-98-03A (Saratoga Battlefield) L3172-11 PCB-7/9 1.9 0.07 ng/g-wet weight 6/16/98 HRI-98-03A (Saratoga Battlefield) L3172-11 PCB-8/5 33 0.07 ng/g-wet weight 6/16/98 HRI-98-03A (Saratoga Battlefield) L3172-11 PCB-15 39 0.11 ng/g-wet weight 6/16/98 HRI-98-03A (Saratoga Battlefield) L3172-11 PCB-19 73 0.10 ng/g-wet weight 6/16/98 HRI-98-03A (Saratoga Battlefield) L3172-11 PCB-18 51 0.10 ng/g-wet weight 6/16/98 HRI-98-03A (Saratoga Battlefield) L3172-11 PCB-17 60 0.10 ng/g-wet weight 6/16/98 HRI-98-03A (Saratoga Battlefield) L3172-11 PCB-24/27 84 0.10 ng/g-wet weight 6/16/98 HRI-98-03A (Saratoga Battlefield) L3172-11 PCB-16/32 120 0.10 ng/g-wet weight 6/16/98 HRI-98-03A (Saratoga Battlefield) L3172-11 PCB-26 71 0.08 ng/g-wet weight 6/16/98 HRI-98-03A (Saratoga Battlefield) L3172-11 PCB-25 18 0.08 ng/g-wet weight 6/16/98 HRI-98-03A (Saratoga Battlefield) L3172-11 PCB-31/28 300 1.0 ng/g-wet weight 6/16/98 HRI-98-03A (Saratoga Battlefield) L3172-11 PCB-33 /20 12 0.08 ng/g-wet weight 6/16/98 HRI-98-03A (Saratoga Battlefield) L3172-11 PCB-22 11 0.08 ng/g-wet weight 6/16/98 HRI-98-03A (Saratoga Battlefield) L3172-11 PCB-37 16 0.08 ng/g-wet weight 6/16/98 HRI-98-03A (Saratoga Battlefield) L3172-11 PCB-53 52 0.18 ng/g-wet weight 6/16/98 HRI-98-03A (Saratoga Battlefield) L3172-11 PCB-45 8.9 0.18 ng/g-wet weight 6/16/98 HRI-98-03A (Saratoga Battlefield) L3172-11 PCB-46 3.0 0.18 ng/g-wet weight 6/16/98 HRI-98-03A (Saratoga Battlefield) L3172-11 PCB-52 230 1.0 ng/g-wet weight 6/16/98 HRI-98-03A (Saratoga Battlefield) L3172-11 PCB-49 250 1.3 ng/g-wet weight 6/16/98 HRI-98-03A (Saratoga Battlefield) L3172-11 PCB-47/48 220 1.3 ng/g-wet weight 6/16/98 HRI-98-03A (Saratoga Battlefield) L3172-11 PCB-44 41 0.21 ng/g-wet weight 6/16/98 HRI-98-03A (Saratoga Battlefield) L3172-11 PCB-42 35 0.21 ng/g-wet weight 6/16/98 HRI-98-03A (Saratoga Battlefield) L3172-11 PCB-41/71/64 130 0.21 ng/g-wet weight 6/16/98 HRI-98-03A (Saratoga Battlefield) L3172-11 PCB-40 7.2 0.23 ng/g-wet weight 6/16/98 HRI-98-03A (Saratoga Battlefield) L3172-11 PCB-74 /61 110 0.23 ng/g-wet weight
*See Qualifier Codes table at end. Page 38 of 75

Aquatic Insects Pesticide and PCB Data
SAMPLING DATE FIELD ID LABORATORY ID ANALYTE VALUE INTERPRETIVE
QUALIFIER*
QUALIFIER REASON CODE*
DETECTION LIMIT
UNITS
6/16/98 HRI-98-03A (Saratoga Battlefield) L3172-11 PCB-70/76 130 0.23 ng/g-wet weight 6/16/98 HRI-98-03A (Saratoga Battlefield) L3172-11 PCB-66 /80 92 0.14 ng/g-wet weight 6/16/98 HRI-98-03A (Saratoga Battlefield) L3172-11 PCB-81 3.0 0.14 ng/g-wet weight 6/16/98 HRI-98-03A (Saratoga Battlefield) L3172-11 PCB-56/60 38 0.14 ng/g-wet weight 6/16/98 HRI-98-03A (Saratoga Battlefield) L3172-11 PCB-77 10 U 21 0.14 ng/g-wet weight 6/16/98 HRI-98-03A (Saratoga Battlefield) L3172-11 PCB-95 42 0.1 ng/g-wet weight 6/16/98 HRI-98-03A (Saratoga Battlefield) L3172-11 PCB-119 3.1 0.1 ng/g-wet weight 6/16/98 HRI-98-03A (Saratoga Battlefield) L3172-11 PCB-91 18 0.1 ng/g-wet weight 6/16/98 HRI-98-03A (Saratoga Battlefield) L3172-11 PCB-84 8.5 0.1 ng/g-wet weight 6/16/98 HRI-98-03A (Saratoga Battlefield) L3172-11 PCB-90/101/89 63 0.10 ng/g-wet weight 6/16/98 HRI-98-03A (Saratoga Battlefield) L3172-11 PCB-99 39 0.10 ng/g-wet weight 6/16/98 HRI-98-03A (Saratoga Battlefield) L3172-11 PCB-83 4.4 0.16 ng/g-wet weight 6/16/98 HRI-98-03A (Saratoga Battlefield) L3172-11 PCB-97 /86 16 0.16 ng/g-wet weight 6/16/98 HRI-98-03A (Saratoga Battlefield) L3172-11 PCB-87 34 0.16 ng/g-wet weight 6/16/98 HRI-98-03A (Saratoga Battlefield) L3172-11 PCB-85 19 0.16 ng/g-wet weight 6/16/98 HRI-98-03A (Saratoga Battlefield) L3172-11 PCB-110 100 0.16 ng/g-wet weight 6/16/98 HRI-98-03A (Saratoga Battlefield) L3172-11 PCB-82 3.6 0.1 ng/g-wet weight 6/16/98 HRI-98-03A (Saratoga Battlefield) L3172-11 PCB-107 5.0 0.1 ng/g-wet weight 6/16/98 HRI-98-03A (Saratoga Battlefield) L3172-11 PCB-114 1.8 0.1 ng/g-wet weight 6/16/98 HRI-98-03A (Saratoga Battlefield) L3172-11 PCB-126 3.5 0.09 ng/g-wet weight 6/16/98 HRI-98-03A (Saratoga Battlefield) L3172-11 PCB-136 7.8 0.15 ng/g-wet weight 6/16/98 HRI-98-03A (Saratoga Battlefield) L3172-11 PCB-151 11 0.15 ng/g-wet weight 6/16/98 HRI-98-03A (Saratoga Battlefield) L3172-11 PCB-144/135 9.8 0.15 ng/g-wet weight 6/16/98 HRI-98-03A (Saratoga Battlefield) L3172-11 PCB-149 42 0.15 ng/g-wet weight 6/16/98 HRI-98-03A (Saratoga Battlefield) L3172-11 PCB-134 /143 3.2 0.15 ng/g-wet weight 6/16/98 HRI-98-03A (Saratoga Battlefield) L3172-11 PCB-131 0.23 0.15 ng/g-wet weight 6/16/98 HRI-98-03A (Saratoga Battlefield) L3172-11 PCB-146 7.8 0.10 ng/g-wet weight 6/16/98 HRI-98-03A (Saratoga Battlefield) L3172-11 PCB-118 62 0.1 ng/g-wet weight 6/16/98 HRI-98-03A (Saratoga Battlefield) L3172-11 PCB-123 3.0 0.1 ng/g-wet weight 6/16/98 HRI-98-03A (Saratoga Battlefield) L3172-11 PCB-105 24 0.12 ng/g-wet weight 6/16/98 HRI-98-03A (Saratoga Battlefield) L3172-11 PCB-153 51 0.13 ng/g-wet weight 6/16/98 HRI-98-03A (Saratoga Battlefield) L3172-11 PCB-132/168 14 0.2 ng/g-wet weight 6/16/98 HRI-98-03A (Saratoga Battlefield) L3172-11 PCB-141 5.3 0.2 ng/g-wet weight 6/16/98 HRI-98-03A (Saratoga Battlefield) L3172-11 PCB-130 3.0 0.16 ng/g-wet weight 6/16/98 HRI-98-03A (Saratoga Battlefield) L3172-11 PCB-137 2.2 0.16 ng/g-wet weight
*See Qualifier Codes table at end. Page 39 of 75

Aquatic Insects Pesticide and PCB Data
SAMPLING DATE FIELD ID LABORATORY ID ANALYTE VALUE INTERPRETIVE
QUALIFIER*
QUALIFIER REASON CODE*
DETECTION LIMIT
UNITS
6/16/98 HRI-98-03A (Saratoga Battlefield) L3172-11 PCB-138 65 0.16 ng/g-wet weight 6/16/98 HRI-98-03A (Saratoga Battlefield) L3172-11 PCB-158 4.2 0.16 ng/g-wet weight 6/16/98 HRI-98-03A (Saratoga Battlefield) L3172-11 PCB-129 1.5 0.16 ng/g-wet weight 6/16/98 HRI-98-03A (Saratoga Battlefield) L3172-11 PCB-128 8.2 0.22 ng/g-wet weight 6/16/98 HRI-98-03A (Saratoga Battlefield) L3172-11 PCB-167 1.6 U 21 0.16 ng/g-wet weight 6/16/98 HRI-98-03A (Saratoga Battlefield) L3172-11 PCB-156 5.8 0.24 ng/g-wet weight 6/16/98 HRI-98-03A (Saratoga Battlefield) L3172-11 PCB-157 1.5 0.24 ng/g-wet weight 6/16/98 HRI-98-03A (Saratoga Battlefield) L3172-11 PCB-169 ND U 0.16 ng/g-wet weight 6/16/98 HRI-98-03A (Saratoga Battlefield) L3172-11 PCB-184 ND U 0.13 ng/g-wet weight 6/16/98 HRI-98-03A (Saratoga Battlefield) L3172-11 PCB-179 3.9 0.13 ng/g-wet weight 6/16/98 HRI-98-03A (Saratoga Battlefield) L3172-11 PCB-176 0.86 0.13 ng/g-wet weight 6/16/98 HRI-98-03A (Saratoga Battlefield) L3172-11 PCB-178 4.5 0.13 ng/g-wet weight 6/16/98 HRI-98-03A (Saratoga Battlefield) L3172-11 PCB-175 0.34 0.13 ng/g-wet weight 6/16/98 HRI-98-03A (Saratoga Battlefield) L3172-11 PCB-187/182 16 0.13 ng/g-wet weight 6/16/98 HRI-98-03A (Saratoga Battlefield) L3172-11 PCB-183 3.4 0.15 ng/g-wet weight 6/16/98 HRI-98-03A (Saratoga Battlefield) L3172-11 PCB-185 0.45 0.15 ng/g-wet weight 6/16/98 HRI-98-03A (Saratoga Battlefield) L3172-11 PCB-174 /181 4.2 0.15 ng/g-wet weight 6/16/98 HRI-98-03A (Saratoga Battlefield) L3172-11 PCB-177 4.4 0.15 ng/g-wet weight 6/16/98 HRI-98-03A (Saratoga Battlefield) L3172-11 PCB-171 1.7 0.17 ng/g-wet weight 6/16/98 HRI-98-03A (Saratoga Battlefield) L3172-11 PCB-172 1.3 0.16 ng/g-wet weight 6/16/98 HRI-98-03A (Saratoga Battlefield) L3172-11 PCB-180 15 0.16 ng/g-wet weight 6/16/98 HRI-98-03A (Saratoga Battlefield) L3172-11 PCB-193 1.2 0.16 ng/g-wet weight 6/16/98 HRI-98-03A (Saratoga Battlefield) L3172-11 PCB-191 0.28 0.16 ng/g-wet weight 6/16/98 HRI-98-03A (Saratoga Battlefield) L3172-11 PCB-170 /190 7.9 0.21 ng/g-wet weight 6/16/98 HRI-98-03A (Saratoga Battlefield) L3172-11 PCB-189 0.43 0.21 ng/g-wet weight 6/16/98 HRI-98-03A (Saratoga Battlefield) L3172-11 PCB-201 (BZ#200) 0.71 0.14 ng/g-wet weight 6/16/98 HRI-98-03A (Saratoga Battlefield) L3172-11 PCB-197 0.35 0.25 ng/g-wet weight 6/16/98 HRI-98-03A (Saratoga Battlefield) L3172-11 PCB-200 (BZ#199) 0.61 0.25 ng/g-wet weight 6/16/98 HRI-98-03A (Saratoga Battlefield) L3172-11 PCB-198 0.41 0.25 ng/g-wet weight 6/16/98 HRI-98-03A (Saratoga Battlefield) L3172-11 PCB-199 (BZ#201) 7.1 0.25 ng/g-wet weight 6/16/98 HRI-98-03A (Saratoga Battlefield) L3172-11 PCB-196/203 5.5 0.23 ng/g-wet weight 6/16/98 HRI-98-03A (Saratoga Battlefield) L3172-11 PCB-195 1.1 0.23 ng/g-wet weight 6/16/98 HRI-98-03A (Saratoga Battlefield) L3172-11 PCB-194 4.2 0.31 ng/g-wet weight 6/16/98 HRI-98-03A (Saratoga Battlefield) L3172-11 PCB-205 ND U 0.31 ng/g-wet weight 6/16/98 HRI-98-03A (Saratoga Battlefield) L3172-11 PCB-208 1.1 0.29 ng/g-wet weight
*See Qualifier Codes table at end. Page 40 of 75

Aquatic Insects Pesticide and PCB Data
SAMPLING DATE FIELD ID LABORATORY ID ANALYTE VALUE INTERPRETIVE
QUALIFIER*
QUALIFIER REASON CODE*
DETECTION LIMIT
UNITS
6/16/98 HRI-98-03A (Saratoga Battlefield) L3172-11 PCB-207 0.29 0.29 ng/g-wet weight 6/16/98 HRI-98-03A (Saratoga Battlefield) L3172-11 PCB-206 1.7 0.29 ng/g-wet weight 6/16/98 HRI-98-03A (Saratoga Battlefield) L3172-11 PCB-209 0.44 0.19 ng/g-wet weight 6/16/98 HRI-98-03B (Saratoga Battlefield) L3172-12 % Lipids 5.1 Percent 6/16/98 HRI-98-03B (Saratoga Battlefield) L3172-12 Hexachlorobenzene 0.54 U 7 0.07 ng/g-wet weight 6/16/98 HRI-98-03B (Saratoga Battlefield) L3172-12 alpha HCH 0.35 U 21 0.2 ng/g-wet weight 6/16/98 HRI-98-03B (Saratoga Battlefield) L3172-12 beta HCH ND U 0.28 ng/g-wet weight 6/16/98 HRI-98-03B (Saratoga Battlefield) L3172-12 gamma HCH 0.66 U 21 0.2 ng/g-wet weight 6/16/98 HRI-98-03B (Saratoga Battlefield) L3172-12 delta HCH ND U 0.25 ng/g-wet weight 6/16/98 HRI-98-03B (Saratoga Battlefield) L3172-12 Heptachlor ND U 2.0 ng/g-wet weight 6/16/98 HRI-98-03B (Saratoga Battlefield) L3172-12 Aldrin ND U 0.21 ng/g-wet weight 6/16/98 HRI-98-03B (Saratoga Battlefield) L3172-12 Oxychlordane ND U 0.5 ng/g-wet weight 6/16/98 HRI-98-03B (Saratoga Battlefield) L3172-12 gamma-Chlordane (trans-) ND U 0.24 ng/g-wet weight 6/16/98 HRI-98-03B (Saratoga Battlefield) L3172-12 alpha-Chlordane (cis-) 0.28 0.21 ng/g-wet weight 6/16/98 HRI-98-03B (Saratoga Battlefield) L3172-12 o,p'-DDE 0.16 0.04 ng/g-wet weight 6/16/98 HRI-98-03B (Saratoga Battlefield) L3172-12 p,p'-DDE 6.4 0.05 ng/g-wet weight 6/16/98 HRI-98-03B (Saratoga Battlefield) L3172-12 trans-Nonachlor 0.57 0.10 ng/g-wet weight 6/16/98 HRI-98-03B (Saratoga Battlefield) L3172-12 o,p'-DDD 0.26 U 21 0.04 ng/g-wet weight 6/16/98 HRI-98-03B (Saratoga Battlefield) L3172-12 p,p'-DDD 0.44 U 21 0.05 ng/g-wet weight 6/16/98 HRI-98-03B (Saratoga Battlefield) L3172-12 o,p'-DDT 0.3 0.18 ng/g-wet weight 6/16/98 HRI-98-03B (Saratoga Battlefield) L3172-12 p,p'-DDT 0.68 0.23 ng/g-wet weight 6/16/98 HRI-98-03B (Saratoga Battlefield) L3172-12 Mirex ND U 0.12 ng/g-wet weight 6/16/98 HRI-98-03B (Saratoga Battlefield) L3172-12 Photomirex R 14 6/16/98 HRI-98-03B (Saratoga Battlefield) L3172-12 Heptachlor Epoxide ND U 0.55 ng/g-wet weight 6/16/98 HRI-98-03B (Saratoga Battlefield) L3172-12 alpha-Endosulphan (I) ND U 0.22 ng/g-wet weight 6/16/98 HRI-98-03B (Saratoga Battlefield) L3172-12 Dieldrin 0.48 NJ 3 0.13 ng/g-wet weight 6/16/98 HRI-98-03B (Saratoga Battlefield) L3172-12 Endrin ND UJ 10 0.34 ng/g-wet weight 6/16/98 HRI-98-03B (Saratoga Battlefield) L3172-12 beta-Endosulphan (II) ND U 0.25 ng/g-wet weight 6/16/98 HRI-98-03B (Saratoga Battlefield) L3172-12 Endrin Aldehyde 0.29 U 7 0.25 ng/g-wet weight 6/16/98 HRI-98-03B (Saratoga Battlefield) L3172-12 Endosulphan Sulphate ND U 0.29 ng/g-wet weight 6/16/98 HRI-98-03B (Saratoga Battlefield) L3172-12 Endrin Ketone ND U 0.15 ng/g-wet weight 6/16/98 HRI-98-03B (Saratoga Battlefield) L3172-12 Methoxychlor ND UJ 10 0.65 ng/g-wet weight 6/16/98 HRI-98-03B (Saratoga Battlefield) L3172-12 Aroclor 1242 1700 NJ 14 9.3 ng/g-wet weight 6/16/98 HRI-98-03B (Saratoga Battlefield) L3172-12 Aroclor 1248 ND U 0.77 ng/g-wet weight 6/16/98 HRI-98-03B (Saratoga Battlefield) L3172-12 Aroclor 1254 1100 NJ 14 2.9 ng/g-wet weight
*See Qualifier Codes table at end. Page 41 of 75

Aquatic Insects Pesticide and PCB Data
SAMPLING DATE FIELD ID LABORATORY ID ANALYTE VALUE INTERPRETIVE
QUALIFIER*
QUALIFIER REASON CODE*
DETECTION LIMIT
UNITS
6/16/98 HRI-98-03B (Saratoga Battlefield) L3172-12 Aroclor 1260 180 NJ 14 1.7 ng/g-wet weight 6/16/98 HRI-98-03B (Saratoga Battlefield) L3172-12 PCB-6 ND U 0.05 ng/g-wet weight 6/16/98 HRI-98-03B (Saratoga Battlefield) L3172-12 PCB-4/10 97 0.02 ng/g-wet weight 6/16/98 HRI-98-03B (Saratoga Battlefield) L3172-12 PCB-7/9 2.0 0.02 ng/g-wet weight 6/16/98 HRI-98-03B (Saratoga Battlefield) L3172-12 PCB-8/5 32 0.02 ng/g-wet weight 6/16/98 HRI-98-03B (Saratoga Battlefield) L3172-12 PCB-15 39 0.04 ng/g-wet weight 6/16/98 HRI-98-03B (Saratoga Battlefield) L3172-12 PCB-19 84 0.05 ng/g-wet weight 6/16/98 HRI-98-03B (Saratoga Battlefield) L3172-12 PCB-18 52 0.05 ng/g-wet weight 6/16/98 HRI-98-03B (Saratoga Battlefield) L3172-12 PCB-17 61 0.05 ng/g-wet weight 6/16/98 HRI-98-03B (Saratoga Battlefield) L3172-12 PCB-24/27 R 14 6/16/98 HRI-98-03B (Saratoga Battlefield) L3172-12 PCB-16/32 110 0.61 ng/g-wet weight 6/16/98 HRI-98-03B (Saratoga Battlefield) L3172-12 PCB-26 88 0.04 ng/g-wet weight 6/16/98 HRI-98-03B (Saratoga Battlefield) L3172-12 PCB-25 20 0.04 ng/g-wet weight 6/16/98 HRI-98-03B (Saratoga Battlefield) L3172-12 PCB-31/28 280 0.52 ng/g-wet weight 6/16/98 HRI-98-03B (Saratoga Battlefield) L3172-12 PCB-33 /20 15 0.04 ng/g-wet weight 6/16/98 HRI-98-03B (Saratoga Battlefield) L3172-12 PCB-22 14 0.04 ng/g-wet weight 6/16/98 HRI-98-03B (Saratoga Battlefield) L3172-12 PCB-37 8.4 0.04 ng/g-wet weight 6/16/98 HRI-98-03B (Saratoga Battlefield) L3172-12 PCB-53 66 0.11 ng/g-wet weight 6/16/98 HRI-98-03B (Saratoga Battlefield) L3172-12 PCB-45 11 0.11 ng/g-wet weight 6/16/98 HRI-98-03B (Saratoga Battlefield) L3172-12 PCB-46 3.4 0.11 ng/g-wet weight 6/16/98 HRI-98-03B (Saratoga Battlefield) L3172-12 PCB-52 210 0.55 ng/g-wet weight 6/16/98 HRI-98-03B (Saratoga Battlefield) L3172-12 PCB-49 240 0.74 ng/g-wet weight 6/16/98 HRI-98-03B (Saratoga Battlefield) L3172-12 PCB-47/48 210 0.74 ng/g-wet weight 6/16/98 HRI-98-03B (Saratoga Battlefield) L3172-12 PCB-44 52 0.13 ng/g-wet weight 6/16/98 HRI-98-03B (Saratoga Battlefield) L3172-12 PCB-42 44 0.13 ng/g-wet weight 6/16/98 HRI-98-03B (Saratoga Battlefield) L3172-12 PCB-41/71/64 170 0.13 ng/g-wet weight 6/16/98 HRI-98-03B (Saratoga Battlefield) L3172-12 PCB-40 8.4 0.15 ng/g-wet weight 6/16/98 HRI-98-03B (Saratoga Battlefield) L3172-12 PCB-74 /61 150 0.15 ng/g-wet weight 6/16/98 HRI-98-03B (Saratoga Battlefield) L3172-12 PCB-70/76 170 0.15 ng/g-wet weight 6/16/98 HRI-98-03B (Saratoga Battlefield) L3172-12 PCB-66 /80 110 0.09 ng/g-wet weight 6/16/98 HRI-98-03B (Saratoga Battlefield) L3172-12 PCB-81 3.8 U 21 0.09 ng/g-wet weight 6/16/98 HRI-98-03B (Saratoga Battlefield) L3172-12 PCB-56/60 53 0.09 ng/g-wet weight 6/16/98 HRI-98-03B (Saratoga Battlefield) L3172-12 PCB-77 15 U 21 0.09 ng/g-wet weight 6/16/98 HRI-98-03B (Saratoga Battlefield) L3172-12 PCB-95 45 0.07 ng/g-wet weight 6/16/98 HRI-98-03B (Saratoga Battlefield) L3172-12 PCB-119 4.0 0.07 ng/g-wet weight
*See Qualifier Codes table at end. Page 42 of 75

Aquatic Insects Pesticide and PCB Data
SAMPLING DATE FIELD ID LABORATORY ID ANALYTE VALUE INTERPRETIVE
QUALIFIER*
QUALIFIER REASON CODE*
DETECTION LIMIT
UNITS
6/16/98 HRI-98-03B (Saratoga Battlefield) L3172-12 PCB-91 22 0.07 ng/g-wet weight 6/16/98 HRI-98-03B (Saratoga Battlefield) L3172-12 PCB-84 9.6 0.07 ng/g-wet weight 6/16/98 HRI-98-03B (Saratoga Battlefield) L3172-12 PCB-90/101/89 67 0.07 ng/g-wet weight 6/16/98 HRI-98-03B (Saratoga Battlefield) L3172-12 PCB-99 45 0.07 ng/g-wet weight 6/16/98 HRI-98-03B (Saratoga Battlefield) L3172-12 PCB-83 5.1 0.12 ng/g-wet weight 6/16/98 HRI-98-03B (Saratoga Battlefield) L3172-12 PCB-97 /86 20 0.12 ng/g-wet weight 6/16/98 HRI-98-03B (Saratoga Battlefield) L3172-12 PCB-87 45 0.12 ng/g-wet weight 6/16/98 HRI-98-03B (Saratoga Battlefield) L3172-12 PCB-85 23 0.12 ng/g-wet weight 6/16/98 HRI-98-03B (Saratoga Battlefield) L3172-12 PCB-110 120 0.12 ng/g-wet weight 6/16/98 HRI-98-03B (Saratoga Battlefield) L3172-12 PCB-82 4.7 0.07 ng/g-wet weight 6/16/98 HRI-98-03B (Saratoga Battlefield) L3172-12 PCB-107 6.6 0.07 ng/g-wet weight 6/16/98 HRI-98-03B (Saratoga Battlefield) L3172-12 PCB-114 2.9 0.07 ng/g-wet weight 6/16/98 HRI-98-03B (Saratoga Battlefield) L3172-12 PCB-126 4.4 0.07 ng/g-wet weight 6/16/98 HRI-98-03B (Saratoga Battlefield) L3172-12 PCB-136 9.4 0.11 ng/g-wet weight 6/16/98 HRI-98-03B (Saratoga Battlefield) L3172-12 PCB-151 15 0.11 ng/g-wet weight 6/16/98 HRI-98-03B (Saratoga Battlefield) L3172-12 PCB-144/135 12 0.11 ng/g-wet weight 6/16/98 HRI-98-03B (Saratoga Battlefield) L3172-12 PCB-149 50 0.11 ng/g-wet weight 6/16/98 HRI-98-03B (Saratoga Battlefield) L3172-12 PCB-134 /143 4.2 0.11 ng/g-wet weight 6/16/98 HRI-98-03B (Saratoga Battlefield) L3172-12 PCB-131 0.44 0.11 ng/g-wet weight 6/16/98 HRI-98-03B (Saratoga Battlefield) L3172-12 PCB-146 11 0.07 ng/g-wet weight 6/16/98 HRI-98-03B (Saratoga Battlefield) L3172-12 PCB-118 68 0.07 ng/g-wet weight 6/16/98 HRI-98-03B (Saratoga Battlefield) L3172-12 PCB-123 3.9 U 21 0.07 ng/g-wet weight 6/16/98 HRI-98-03B (Saratoga Battlefield) L3172-12 PCB-105 27 0.07 ng/g-wet weight 6/16/98 HRI-98-03B (Saratoga Battlefield) L3172-12 PCB-153 37 0.06 ng/g-wet weight 6/16/98 HRI-98-03B (Saratoga Battlefield) L3172-12 PCB-132/168 9.7 0.09 ng/g-wet weight 6/16/98 HRI-98-03B (Saratoga Battlefield) L3172-12 PCB-141 4.9 0.09 ng/g-wet weight 6/16/98 HRI-98-03B (Saratoga Battlefield) L3172-12 PCB-130 2.8 0.07 ng/g-wet weight 6/16/98 HRI-98-03B (Saratoga Battlefield) L3172-12 PCB-137 2.1 0.07 ng/g-wet weight 6/16/98 HRI-98-03B (Saratoga Battlefield) L3172-12 PCB-138 53 0.07 ng/g-wet weight 6/16/98 HRI-98-03B (Saratoga Battlefield) L3172-12 PCB-158 3.6 0.07 ng/g-wet weight 6/16/98 HRI-98-03B (Saratoga Battlefield) L3172-12 PCB-129 1.5 0.07 ng/g-wet weight 6/16/98 HRI-98-03B (Saratoga Battlefield) L3172-12 PCB-128 10 0.1 ng/g-wet weight 6/16/98 HRI-98-03B (Saratoga Battlefield) L3172-12 PCB-167 2.1 U 21 0.07 ng/g-wet weight 6/16/98 HRI-98-03B (Saratoga Battlefield) L3172-12 PCB-156 6.8 0.11 ng/g-wet weight 6/16/98 HRI-98-03B (Saratoga Battlefield) L3172-12 PCB-157 2.1 0.11 ng/g-wet weight
*See Qualifier Codes table at end. Page 43 of 75

Aquatic Insects Pesticide and PCB Data
SAMPLING DATE FIELD ID LABORATORY ID ANALYTE VALUE INTERPRETIVE
QUALIFIER*
QUALIFIER REASON CODE*
DETECTION LIMIT
UNITS
6/16/98 HRI-98-03B (Saratoga Battlefield) L3172-12 PCB-169 1.3 0.07 ng/g-wet weight 6/16/98 HRI-98-03B (Saratoga Battlefield) L3172-12 PCB-184 ND U 0.09 ng/g-wet weight 6/16/98 HRI-98-03B (Saratoga Battlefield) L3172-12 PCB-179 3.1 0.09 ng/g-wet weight 6/16/98 HRI-98-03B (Saratoga Battlefield) L3172-12 PCB-176 0.74 0.09 ng/g-wet weight 6/16/98 HRI-98-03B (Saratoga Battlefield) L3172-12 PCB-178 4.1 0.09 ng/g-wet weight 6/16/98 HRI-98-03B (Saratoga Battlefield) L3172-12 PCB-175 0.24 0.09 ng/g-wet weight 6/16/98 HRI-98-03B (Saratoga Battlefield) L3172-12 PCB-187/182 18 0.09 ng/g-wet weight 6/16/98 HRI-98-03B (Saratoga Battlefield) L3172-12 PCB-183 8.8 0.11 ng/g-wet weight 6/16/98 HRI-98-03B (Saratoga Battlefield) L3172-12 PCB-185 0.53 0.11 ng/g-wet weight 6/16/98 HRI-98-03B (Saratoga Battlefield) L3172-12 PCB-174 /181 4.8 0.11 ng/g-wet weight 6/16/98 HRI-98-03B (Saratoga Battlefield) L3172-12 PCB-177 5.0 0.11 ng/g-wet weight 6/16/98 HRI-98-03B (Saratoga Battlefield) L3172-12 PCB-171 1.7 0.12 ng/g-wet weight 6/16/98 HRI-98-03B (Saratoga Battlefield) L3172-12 PCB-172 1.5 0.11 ng/g-wet weight 6/16/98 HRI-98-03B (Saratoga Battlefield) L3172-12 PCB-180 16 0.11 ng/g-wet weight 6/16/98 HRI-98-03B (Saratoga Battlefield) L3172-12 PCB-193 1.5 0.11 ng/g-wet weight 6/16/98 HRI-98-03B (Saratoga Battlefield) L3172-12 PCB-191 0.31 0.11 ng/g-wet weight 6/16/98 HRI-98-03B (Saratoga Battlefield) L3172-12 PCB-170 /190 12 0.16 ng/g-wet weight 6/16/98 HRI-98-03B (Saratoga Battlefield) L3172-12 PCB-189 0.79 0.16 ng/g-wet weight 6/16/98 HRI-98-03B (Saratoga Battlefield) L3172-12 PCB-201 (BZ#200) 0.72 0.10 ng/g-wet weight 6/16/98 HRI-98-03B (Saratoga Battlefield) L3172-12 PCB-197 0.26 0.19 ng/g-wet weight 6/16/98 HRI-98-03B (Saratoga Battlefield) L3172-12 PCB-200 (BZ#199) 0.96 0.19 ng/g-wet weight 6/16/98 HRI-98-03B (Saratoga Battlefield) L3172-12 PCB-198 0.53 U 21 0.19 ng/g-wet weight 6/16/98 HRI-98-03B (Saratoga Battlefield) L3172-12 PCB-199 (BZ#201) 11 0.19 ng/g-wet weight 6/16/98 HRI-98-03B (Saratoga Battlefield) L3172-12 PCB-196/203 8.1 0.18 ng/g-wet weight 6/16/98 HRI-98-03B (Saratoga Battlefield) L3172-12 PCB-195 1.7 0.18 ng/g-wet weight 6/16/98 HRI-98-03B (Saratoga Battlefield) L3172-12 PCB-194 5.7 0.27 ng/g-wet weight 6/16/98 HRI-98-03B (Saratoga Battlefield) L3172-12 PCB-205 0.38 0.27 ng/g-wet weight 6/16/98 HRI-98-03B (Saratoga Battlefield) L3172-12 PCB-208 1.3 0.22 ng/g-wet weight 6/16/98 HRI-98-03B (Saratoga Battlefield) L3172-12 PCB-207 0.36 0.22 ng/g-wet weight 6/16/98 HRI-98-03B (Saratoga Battlefield) L3172-12 PCB-206 2.0 0.22 ng/g-wet weight 6/16/98 HRI-98-03B (Saratoga Battlefield) L3172-12 PCB-209 0.44 U 21 0.19 ng/g-wet weight 6/16/98 HRI-98-03C (Saratoga Battlefield) L3172-13 % Lipids 4.9 Percent 6/16/98 HRI-98-03C (Saratoga Battlefield) L3172-13 Hexachlorobenzene 0.48 U 7 0.08 ng/g-wet weight 6/16/98 HRI-98-03C (Saratoga Battlefield) L3172-13 alpha HCH ND U 0.38 ng/g-wet weight 6/16/98 HRI-98-03C (Saratoga Battlefield) L3172-13 beta HCH ND U 0.51 ng/g-wet weight
*See Qualifier Codes table at end. Page 44 of 75

Aquatic Insects Pesticide and PCB Data
SAMPLING DATE FIELD ID LABORATORY ID ANALYTE VALUE INTERPRETIVE
QUALIFIER*
QUALIFIER REASON CODE*
DETECTION LIMIT
UNITS
6/16/98 HRI-98-03C (Saratoga Battlefield) L3172-13 gamma HCH 0.86 U 21 0.38 ng/g-wet weight 6/16/98 HRI-98-03C (Saratoga Battlefield) L3172-13 delta HCH ND U 0.38 ng/g-wet weight 6/16/98 HRI-98-03C (Saratoga Battlefield) L3172-13 Heptachlor ND U 2.0 ng/g-wet weight 6/16/98 HRI-98-03C (Saratoga Battlefield) L3172-13 Aldrin ND U 0.22 ng/g-wet weight 6/16/98 HRI-98-03C (Saratoga Battlefield) L3172-13 Oxychlordane ND U 2.2 ng/g-wet weight 6/16/98 HRI-98-03C (Saratoga Battlefield) L3172-13 gamma-Chlordane (trans-) ND U 0.3 ng/g-wet weight 6/16/98 HRI-98-03C (Saratoga Battlefield) L3172-13 alpha-Chlordane (cis-) ND U 0.26 ng/g-wet weight 6/16/98 HRI-98-03C (Saratoga Battlefield) L3172-13 o,p'-DDE 0.22 U 21 0.12 ng/g-wet weight 6/16/98 HRI-98-03C (Saratoga Battlefield) L3172-13 p,p'-DDE 6.9 0.14 ng/g-wet weight 6/16/98 HRI-98-03C (Saratoga Battlefield) L3172-13 trans-Nonachlor 0.62 0.14 ng/g-wet weight 6/16/98 HRI-98-03C (Saratoga Battlefield) L3172-13 o,p'-DDD 0.24 0.06 ng/g-wet weight 6/16/98 HRI-98-03C (Saratoga Battlefield) L3172-13 p,p'-DDD 0.30 0.06 ng/g-wet weight 6/16/98 HRI-98-03C (Saratoga Battlefield) L3172-13 o,p'-DDT 0.54 0.07 ng/g-wet weight 6/16/98 HRI-98-03C (Saratoga Battlefield) L3172-13 p,p'-DDT 0.47 0.09 ng/g-wet weight 6/16/98 HRI-98-03C (Saratoga Battlefield) L3172-13 Mirex ND U 0.14 ng/g-wet weight 6/16/98 HRI-98-03C (Saratoga Battlefield) L3172-13 Photomirex R 5A 6/16/98 HRI-98-03C (Saratoga Battlefield) L3172-13 Heptachlor Epoxide ND U 0.75 ng/g-wet weight 6/16/98 HRI-98-03C (Saratoga Battlefield) L3172-13 alpha-Endosulphan (I) ND U 0.16 ng/g-wet weight 6/16/98 HRI-98-03C (Saratoga Battlefield) L3172-13 Dieldrin 0.47 NJ 3 0.11 ng/g-wet weight 6/16/98 HRI-98-03C (Saratoga Battlefield) L3172-13 Endrin ND UJ 10 0.28 ng/g-wet weight 6/16/98 HRI-98-03C (Saratoga Battlefield) L3172-13 beta-Endosulphan (II) ND U 0.18 ng/g-wet weight 6/16/98 HRI-98-03C (Saratoga Battlefield) L3172-13 Endrin Aldehyde 0.29 U 7 0.21 ng/g-wet weight 6/16/98 HRI-98-03C (Saratoga Battlefield) L3172-13 Endosulphan Sulphate ND U 0.21 ng/g-wet weight 6/16/98 HRI-98-03C (Saratoga Battlefield) L3172-13 Endrin Ketone ND U 0.12 ng/g-wet weight 6/16/98 HRI-98-03C (Saratoga Battlefield) L3172-13 Methoxychlor ND UJ 10 0.53 ng/g-wet weight 6/16/98 HRI-98-03C (Saratoga Battlefield) L3172-13 Aroclor 1242 2400 NJ 14 6.2 ng/g-wet weight 6/16/98 HRI-98-03C (Saratoga Battlefield) L3172-13 Aroclor 1248 ND U 1.5 ng/g-wet weight 6/16/98 HRI-98-03C (Saratoga Battlefield) L3172-13 Aroclor 1254 1200 NJ 14 6.2 ng/g-wet weight 6/16/98 HRI-98-03C (Saratoga Battlefield) L3172-13 Aroclor 1260 150 NJ 14 2.4 ng/g-wet weight 6/16/98 HRI-98-03C (Saratoga Battlefield) L3172-13 PCB-6 ND U 0.03 ng/g-wet weight 6/16/98 HRI-98-03C (Saratoga Battlefield) L3172-13 PCB-4/10 150 0.06 ng/g-wet weight 6/16/98 HRI-98-03C (Saratoga Battlefield) L3172-13 PCB-7/9 3.9 0.06 ng/g-wet weight 6/16/98 HRI-98-03C (Saratoga Battlefield) L3172-13 PCB-8/5 73 0.06 ng/g-wet weight 6/16/98 HRI-98-03C (Saratoga Battlefield) L3172-13 PCB-15 56 0.1 ng/g-wet weight 6/16/98 HRI-98-03C (Saratoga Battlefield) L3172-13 PCB-19 150 0.10 ng/g-wet weight
*See Qualifier Codes table at end. Page 45 of 75

Aquatic Insects Pesticide and PCB Data
SAMPLING DATE FIELD ID LABORATORY ID ANALYTE VALUE INTERPRETIVE
QUALIFIER*
QUALIFIER REASON CODE*
DETECTION LIMIT
UNITS
6/16/98 HRI-98-03C (Saratoga Battlefield) L3172-13 PCB-18 79 0.10 ng/g-wet weight 6/16/98 HRI-98-03C (Saratoga Battlefield) L3172-13 PCB-17 90 0.10 ng/g-wet weight 6/16/98 HRI-98-03C (Saratoga Battlefield) L3172-13 PCB-24/27 160 0.41 ng/g-wet weight 6/16/98 HRI-98-03C (Saratoga Battlefield) L3172-13 PCB-16/32 160 0.41 ng/g-wet weight 6/16/98 HRI-98-03C (Saratoga Battlefield) L3172-13 PCB-26 120 0.08 ng/g-wet weight 6/16/98 HRI-98-03C (Saratoga Battlefield) L3172-13 PCB-25 27 0.08 ng/g-wet weight 6/16/98 HRI-98-03C (Saratoga Battlefield) L3172-13 PCB-31/28 400 0.35 ng/g-wet weight 6/16/98 HRI-98-03C (Saratoga Battlefield) L3172-13 PCB-33 /20 24 0.08 ng/g-wet weight 6/16/98 HRI-98-03C (Saratoga Battlefield) L3172-13 PCB-22 20 0.08 ng/g-wet weight 6/16/98 HRI-98-03C (Saratoga Battlefield) L3172-13 PCB-37 11 0.08 ng/g-wet weight 6/16/98 HRI-98-03C (Saratoga Battlefield) L3172-13 PCB-53 84 0.15 ng/g-wet weight 6/16/98 HRI-98-03C (Saratoga Battlefield) L3172-13 PCB-45 15 0.15 ng/g-wet weight 6/16/98 HRI-98-03C (Saratoga Battlefield) L3172-13 PCB-46 3.9 0.15 ng/g-wet weight 6/16/98 HRI-98-03C (Saratoga Battlefield) L3172-13 PCB-52 270 0.6 ng/g-wet weight 6/16/98 HRI-98-03C (Saratoga Battlefield) L3172-13 PCB-49 300 0.8 ng/g-wet weight 6/16/98 HRI-98-03C (Saratoga Battlefield) L3172-13 PCB-47/48 270 0.8 ng/g-wet weight 6/16/98 HRI-98-03C (Saratoga Battlefield) L3172-13 PCB-44 66 0.19 ng/g-wet weight 6/16/98 HRI-98-03C (Saratoga Battlefield) L3172-13 PCB-42 55 0.19 ng/g-wet weight 6/16/98 HRI-98-03C (Saratoga Battlefield) L3172-13 PCB-41/71/64 190 0.19 ng/g-wet weight 6/16/98 HRI-98-03C (Saratoga Battlefield) L3172-13 PCB-40 9.7 0.22 ng/g-wet weight 6/16/98 HRI-98-03C (Saratoga Battlefield) L3172-13 PCB-74 /61 150 0.22 ng/g-wet weight 6/16/98 HRI-98-03C (Saratoga Battlefield) L3172-13 PCB-70/76 190 0.22 ng/g-wet weight 6/16/98 HRI-98-03C (Saratoga Battlefield) L3172-13 PCB-66 /80 120 0.13 ng/g-wet weight 6/16/98 HRI-98-03C (Saratoga Battlefield) L3172-13 PCB-81 4.0 U 21 0.13 ng/g-wet weight 6/16/98 HRI-98-03C (Saratoga Battlefield) L3172-13 PCB-56/60 52 0.13 ng/g-wet weight 6/16/98 HRI-98-03C (Saratoga Battlefield) L3172-13 PCB-77 14 U 21 0.13 ng/g-wet weight 6/16/98 HRI-98-03C (Saratoga Battlefield) L3172-13 PCB-95 50 0.15 ng/g-wet weight 6/16/98 HRI-98-03C (Saratoga Battlefield) L3172-13 PCB-119 3.7 0.15 ng/g-wet weight 6/16/98 HRI-98-03C (Saratoga Battlefield) L3172-13 PCB-91 21 0.15 ng/g-wet weight 6/16/98 HRI-98-03C (Saratoga Battlefield) L3172-13 PCB-84 9.7 0.15 ng/g-wet weight 6/16/98 HRI-98-03C (Saratoga Battlefield) L3172-13 PCB-90/101/89 71 0.15 ng/g-wet weight 6/16/98 HRI-98-03C (Saratoga Battlefield) L3172-13 PCB-99 47 0.15 ng/g-wet weight 6/16/98 HRI-98-03C (Saratoga Battlefield) L3172-13 PCB-83 4.9 0.25 ng/g-wet weight 6/16/98 HRI-98-03C (Saratoga Battlefield) L3172-13 PCB-97 /86 20 0.25 ng/g-wet weight 6/16/98 HRI-98-03C (Saratoga Battlefield) L3172-13 PCB-87 44 0.25 ng/g-wet weight
*See Qualifier Codes table at end. Page 46 of 75
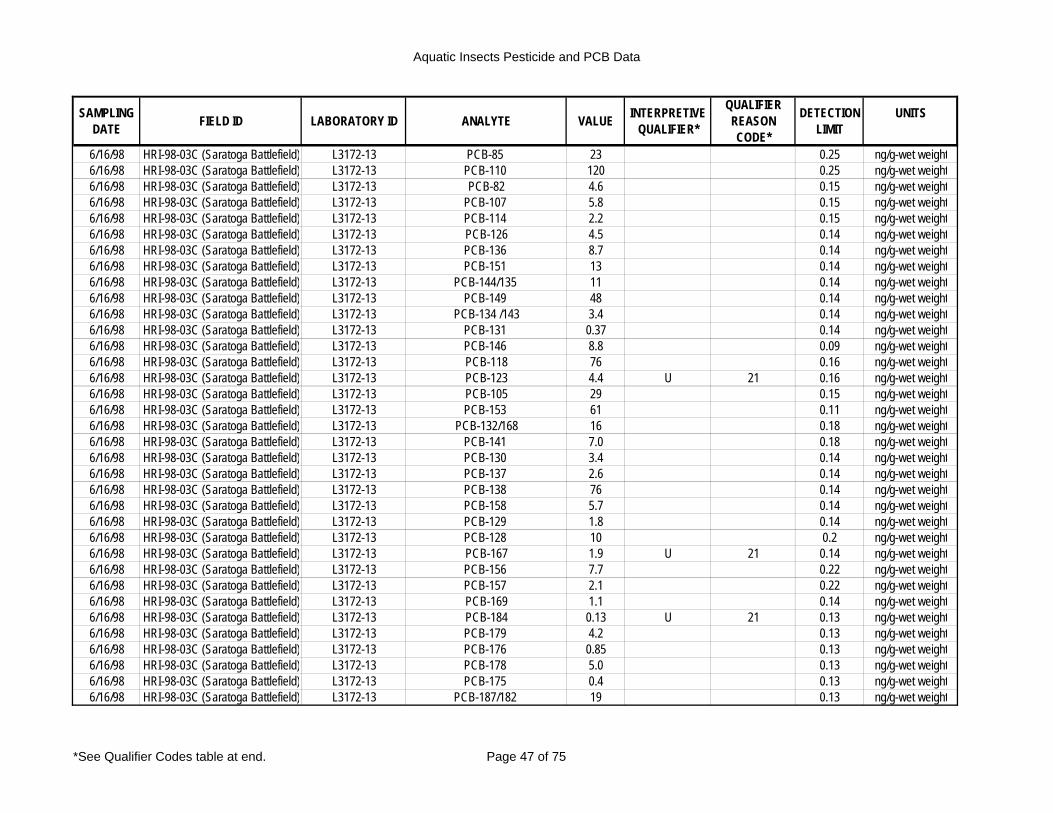
Aquatic Insects Pesticide and PCB Data
SAMPLING DATE FIELD ID LABORATORY ID ANALYTE VALUE INTERPRETIVE
QUALIFIER*
QUALIFIER REASON CODE*
DETECTION LIMIT
UNITS
6/16/98 HRI-98-03C (Saratoga Battlefield) L3172-13 PCB-85 23 0.25 ng/g-wet weight 6/16/98 HRI-98-03C (Saratoga Battlefield) L3172-13 PCB-110 120 0.25 ng/g-wet weight 6/16/98 HRI-98-03C (Saratoga Battlefield) L3172-13 PCB-82 4.6 0.15 ng/g-wet weight 6/16/98 HRI-98-03C (Saratoga Battlefield) L3172-13 PCB-107 5.8 0.15 ng/g-wet weight 6/16/98 HRI-98-03C (Saratoga Battlefield) L3172-13 PCB-114 2.2 0.15 ng/g-wet weight 6/16/98 HRI-98-03C (Saratoga Battlefield) L3172-13 PCB-126 4.5 0.14 ng/g-wet weight 6/16/98 HRI-98-03C (Saratoga Battlefield) L3172-13 PCB-136 8.7 0.14 ng/g-wet weight 6/16/98 HRI-98-03C (Saratoga Battlefield) L3172-13 PCB-151 13 0.14 ng/g-wet weight 6/16/98 HRI-98-03C (Saratoga Battlefield) L3172-13 PCB-144/135 11 0.14 ng/g-wet weight 6/16/98 HRI-98-03C (Saratoga Battlefield) L3172-13 PCB-149 48 0.14 ng/g-wet weight 6/16/98 HRI-98-03C (Saratoga Battlefield) L3172-13 PCB-134 /143 3.4 0.14 ng/g-wet weight 6/16/98 HRI-98-03C (Saratoga Battlefield) L3172-13 PCB-131 0.37 0.14 ng/g-wet weight 6/16/98 HRI-98-03C (Saratoga Battlefield) L3172-13 PCB-146 8.8 0.09 ng/g-wet weight 6/16/98 HRI-98-03C (Saratoga Battlefield) L3172-13 PCB-118 76 0.16 ng/g-wet weight 6/16/98 HRI-98-03C (Saratoga Battlefield) L3172-13 PCB-123 4.4 U 21 0.16 ng/g-wet weight 6/16/98 HRI-98-03C (Saratoga Battlefield) L3172-13 PCB-105 29 0.15 ng/g-wet weight 6/16/98 HRI-98-03C (Saratoga Battlefield) L3172-13 PCB-153 61 0.11 ng/g-wet weight 6/16/98 HRI-98-03C (Saratoga Battlefield) L3172-13 PCB-132/168 16 0.18 ng/g-wet weight 6/16/98 HRI-98-03C (Saratoga Battlefield) L3172-13 PCB-141 7.0 0.18 ng/g-wet weight 6/16/98 HRI-98-03C (Saratoga Battlefield) L3172-13 PCB-130 3.4 0.14 ng/g-wet weight 6/16/98 HRI-98-03C (Saratoga Battlefield) L3172-13 PCB-137 2.6 0.14 ng/g-wet weight 6/16/98 HRI-98-03C (Saratoga Battlefield) L3172-13 PCB-138 76 0.14 ng/g-wet weight 6/16/98 HRI-98-03C (Saratoga Battlefield) L3172-13 PCB-158 5.7 0.14 ng/g-wet weight 6/16/98 HRI-98-03C (Saratoga Battlefield) L3172-13 PCB-129 1.8 0.14 ng/g-wet weight 6/16/98 HRI-98-03C (Saratoga Battlefield) L3172-13 PCB-128 10 0.2 ng/g-wet weight 6/16/98 HRI-98-03C (Saratoga Battlefield) L3172-13 PCB-167 1.9 U 21 0.14 ng/g-wet weight 6/16/98 HRI-98-03C (Saratoga Battlefield) L3172-13 PCB-156 7.7 0.22 ng/g-wet weight 6/16/98 HRI-98-03C (Saratoga Battlefield) L3172-13 PCB-157 2.1 0.22 ng/g-wet weight 6/16/98 HRI-98-03C (Saratoga Battlefield) L3172-13 PCB-169 1.1 0.14 ng/g-wet weight 6/16/98 HRI-98-03C (Saratoga Battlefield) L3172-13 PCB-184 0.13 U 21 0.13 ng/g-wet weight 6/16/98 HRI-98-03C (Saratoga Battlefield) L3172-13 PCB-179 4.2 0.13 ng/g-wet weight 6/16/98 HRI-98-03C (Saratoga Battlefield) L3172-13 PCB-176 0.85 0.13 ng/g-wet weight 6/16/98 HRI-98-03C (Saratoga Battlefield) L3172-13 PCB-178 5.0 0.13 ng/g-wet weight 6/16/98 HRI-98-03C (Saratoga Battlefield) L3172-13 PCB-175 0.4 0.13 ng/g-wet weight 6/16/98 HRI-98-03C (Saratoga Battlefield) L3172-13 PCB-187/182 19 0.13 ng/g-wet weight
*See Qualifier Codes table at end. Page 47 of 75

Aquatic Insects Pesticide and PCB Data
SAMPLING DATE FIELD ID LABORATORY ID ANALYTE VALUE INTERPRETIVE
QUALIFIER*
QUALIFIER REASON CODE*
DETECTION LIMIT
UNITS
6/16/98 HRI-98-03C (Saratoga Battlefield) L3172-13 PCB-183 4.4 0.15 ng/g-wet weight 6/16/98 HRI-98-03C (Saratoga Battlefield) L3172-13 PCB-185 0.67 0.15 ng/g-wet weight 6/16/98 HRI-98-03C (Saratoga Battlefield) L3172-13 PCB-174 /181 4.8 0.15 ng/g-wet weight 6/16/98 HRI-98-03C (Saratoga Battlefield) L3172-13 PCB-177 5.1 0.15 ng/g-wet weight 6/16/98 HRI-98-03C (Saratoga Battlefield) L3172-13 PCB-171 1.9 0.16 ng/g-wet weight 6/16/98 HRI-98-03C (Saratoga Battlefield) L3172-13 PCB-172 1.5 0.15 ng/g-wet weight 6/16/98 HRI-98-03C (Saratoga Battlefield) L3172-13 PCB-180 17 0.15 ng/g-wet weight 6/16/98 HRI-98-03C (Saratoga Battlefield) L3172-13 PCB-193 1.2 0.15 ng/g-wet weight 6/16/98 HRI-98-03C (Saratoga Battlefield) L3172-13 PCB-191 0.43 0.15 ng/g-wet weight 6/16/98 HRI-98-03C (Saratoga Battlefield) L3172-13 PCB-170 /190 10 0.22 ng/g-wet weight 6/16/98 HRI-98-03C (Saratoga Battlefield) L3172-13 PCB-189 0.5 0.22 ng/g-wet weight 6/16/98 HRI-98-03C (Saratoga Battlefield) L3172-13 PCB-201 (BZ#200) 0.66 0.25 ng/g-wet weight 6/16/98 HRI-98-03C (Saratoga Battlefield) L3172-13 PCB-197 ND U 0.49 ng/g-wet weight 6/16/98 HRI-98-03C (Saratoga Battlefield) L3172-13 PCB-200 (BZ#199) 0.53 0.49 ng/g-wet weight 6/16/98 HRI-98-03C (Saratoga Battlefield) L3172-13 PCB-198 ND U 0.49 ng/g-wet weight 6/16/98 HRI-98-03C (Saratoga Battlefield) L3172-13 PCB-199 (BZ#201) 8.8 0.49 ng/g-wet weight 6/16/98 HRI-98-03C (Saratoga Battlefield) L3172-13 PCB-196/203 7.0 0.47 ng/g-wet weight 6/16/98 HRI-98-03C (Saratoga Battlefield) L3172-13 PCB-195 1.5 0.47 ng/g-wet weight 6/16/98 HRI-98-03C (Saratoga Battlefield) L3172-13 PCB-194 5.7 0.7 ng/g-wet weight 6/16/98 HRI-98-03C (Saratoga Battlefield) L3172-13 PCB-205 ND U 0.7 ng/g-wet weight 6/16/98 HRI-98-03C (Saratoga Battlefield) L3172-13 PCB-208 1.4 0.35 ng/g-wet weight 6/16/98 HRI-98-03C (Saratoga Battlefield) L3172-13 PCB-207 ND U 0.35 ng/g-wet weight 6/16/98 HRI-98-03C (Saratoga Battlefield) L3172-13 PCB-206 2.1 0.35 ng/g-wet weight 6/16/98 HRI-98-03C (Saratoga Battlefield) L3172-13 PCB-209 0.79 U 21 0.41 ng/g-wet weight 6/16/98 HRI-98-03D (Saratoga Battlefield) L3172-14 % Lipids 4.7 Percent 6/16/98 HRI-98-03D (Saratoga Battlefield) L3172-14 Hexachlorobenzene 0.37 U 7 0.09 ng/g-wet weight 6/16/98 HRI-98-03D (Saratoga Battlefield) L3172-14 alpha HCH ND U 0.4 ng/g-wet weight 6/16/98 HRI-98-03D (Saratoga Battlefield) L3172-14 beta HCH ND U 0.54 ng/g-wet weight 6/16/98 HRI-98-03D (Saratoga Battlefield) L3172-14 gamma HCH 1.4 U 21 0.4 ng/g-wet weight 6/16/98 HRI-98-03D (Saratoga Battlefield) L3172-14 delta HCH ND U 0.4 ng/g-wet weight 6/16/98 HRI-98-03D (Saratoga Battlefield) L3172-14 Heptachlor ND U 1.7 ng/g-wet weight 6/16/98 HRI-98-03D (Saratoga Battlefield) L3172-14 Aldrin ND U 0.35 ng/g-wet weight 6/16/98 HRI-98-03D (Saratoga Battlefield) L3172-14 Oxychlordane ND U 3.2 ng/g-wet weight 6/16/98 HRI-98-03D (Saratoga Battlefield) L3172-14 gamma-Chlordane (trans-) ND U 0.19 ng/g-wet weight 6/16/98 HRI-98-03D (Saratoga Battlefield) L3172-14 alpha-Chlordane (cis-) 0.28 0.16 ng/g-wet weight
*See Qualifier Codes table at end. Page 48 of 75

Aquatic Insects Pesticide and PCB Data
SAMPLING DATE FIELD ID LABORATORY ID ANALYTE VALUE INTERPRETIVE
QUALIFIER*
QUALIFIER REASON CODE*
DETECTION LIMIT
UNITS
6/16/98 HRI-98-03D (Saratoga Battlefield) L3172-14 o,p'-DDE 0.14 0.05 ng/g-wet weight 6/16/98 HRI-98-03D (Saratoga Battlefield) L3172-14 p,p'-DDE 6.1 0.06 ng/g-wet weight 6/16/98 HRI-98-03D (Saratoga Battlefield) L3172-14 trans-Nonachlor 0.52 0.12 ng/g-wet weight 6/16/98 HRI-98-03D (Saratoga Battlefield) L3172-14 o,p'-DDD 0.20 U 21 0.07 ng/g-wet weight 6/16/98 HRI-98-03D (Saratoga Battlefield) L3172-14 p,p'-DDD 0.28 0.08 ng/g-wet weight 6/16/98 HRI-98-03D (Saratoga Battlefield) L3172-14 o,p'-DDT 0.23 0.14 ng/g-wet weight 6/16/98 HRI-98-03D (Saratoga Battlefield) L3172-14 p,p'-DDT 0.42 0.18 ng/g-wet weight 6/16/98 HRI-98-03D (Saratoga Battlefield) L3172-14 Mirex ND U 0.1 ng/g-wet weight 6/16/98 HRI-98-03D (Saratoga Battlefield) L3172-14 Photomirex R 5A 6/16/98 HRI-98-03D (Saratoga Battlefield) L3172-14 Heptachlor Epoxide ND U 1.2 ng/g-wet weight 6/16/98 HRI-98-03D (Saratoga Battlefield) L3172-14 alpha-Endosulphan (I) ND U 0.14 ng/g-wet weight 6/16/98 HRI-98-03D (Saratoga Battlefield) L3172-14 Dieldrin 0.45 NJ 3 0.1 ng/g-wet weight 6/16/98 HRI-98-03D (Saratoga Battlefield) L3172-14 Endrin ND UJ 10 0.25 ng/g-wet weight 6/16/98 HRI-98-03D (Saratoga Battlefield) L3172-14 beta-Endosulphan (II) ND U 0.16 ng/g-wet weight 6/16/98 HRI-98-03D (Saratoga Battlefield) L3172-14 Endrin Aldehyde 0.29 U 7 0.19 ng/g-wet weight 6/16/98 HRI-98-03D (Saratoga Battlefield) L3172-14 Endosulphan Sulphate ND U 0.18 ng/g-wet weight 6/16/98 HRI-98-03D (Saratoga Battlefield) L3172-14 Endrin Ketone ND U 0.11 ng/g-wet weight 6/16/98 HRI-98-03D (Saratoga Battlefield) L3172-14 Methoxychlor ND UJ 10 0.48 ng/g-wet weight 6/16/98 HRI-98-03D (Saratoga Battlefield) L3172-14 Aroclor 1242 1900 NJ 14 2.5 ng/g-wet weight 6/16/98 HRI-98-03D (Saratoga Battlefield) L3172-14 Aroclor 1248 ND U 2.5 ng/g-wet weight 6/16/98 HRI-98-03D (Saratoga Battlefield) L3172-14 Aroclor 1254 970 NJ 14 2.7 ng/g-wet weight 6/16/98 HRI-98-03D (Saratoga Battlefield) L3172-14 Aroclor 1260 120 NJ 14 3.2 ng/g-wet weight 6/16/98 HRI-98-03D (Saratoga Battlefield) L3172-14 PCB-6 ND U 0.05 ng/g-wet weight 6/16/98 HRI-98-03D (Saratoga Battlefield) L3172-14 PCB-4/10 98 0.07 ng/g-wet weight 6/16/98 HRI-98-03D (Saratoga Battlefield) L3172-14 PCB-7/9 2.0 0.07 ng/g-wet weight 6/16/98 HRI-98-03D (Saratoga Battlefield) L3172-14 PCB-8/5 29 0.07 ng/g-wet weight 6/16/98 HRI-98-03D (Saratoga Battlefield) L3172-14 PCB-15 34 0.12 ng/g-wet weight 6/16/98 HRI-98-03D (Saratoga Battlefield) L3172-14 PCB-19 89 0.16 ng/g-wet weight 6/16/98 HRI-98-03D (Saratoga Battlefield) L3172-14 PCB-18 49 0.16 ng/g-wet weight 6/16/98 HRI-98-03D (Saratoga Battlefield) L3172-14 PCB-17 57 0.16 ng/g-wet weight 6/16/98 HRI-98-03D (Saratoga Battlefield) L3172-14 PCB-24/27 110 0.16 ng/g-wet weight 6/16/98 HRI-98-03D (Saratoga Battlefield) L3172-14 PCB-16/32 110 0.16 ng/g-wet weight 6/16/98 HRI-98-03D (Saratoga Battlefield) L3172-14 PCB-26 78 0.14 ng/g-wet weight 6/16/98 HRI-98-03D (Saratoga Battlefield) L3172-14 PCB-25 18 0.14 ng/g-wet weight 6/16/98 HRI-98-03D (Saratoga Battlefield) L3172-14 PCB-31/28 340 0.14 ng/g-wet weight
*See Qualifier Codes table at end. Page 49 of 75

Aquatic Insects Pesticide and PCB Data
SAMPLING DATE FIELD ID LABORATORY ID ANALYTE VALUE INTERPRETIVE
QUALIFIER*
QUALIFIER REASON CODE*
DETECTION LIMIT
UNITS
6/16/98 HRI-98-03D (Saratoga Battlefield) L3172-14 PCB-33 /20 14 0.14 ng/g-wet weight 6/16/98 HRI-98-03D (Saratoga Battlefield) L3172-14 PCB-22 13 0.14 ng/g-wet weight 6/16/98 HRI-98-03D (Saratoga Battlefield) L3172-14 PCB-37 8.0 0.14 ng/g-wet weight 6/16/98 HRI-98-03D (Saratoga Battlefield) L3172-14 PCB-53 59 0.07 ng/g-wet weight 6/16/98 HRI-98-03D (Saratoga Battlefield) L3172-14 PCB-45 11 0.07 ng/g-wet weight 6/16/98 HRI-98-03D (Saratoga Battlefield) L3172-14 PCB-46 3.3 0.07 ng/g-wet weight 6/16/98 HRI-98-03D (Saratoga Battlefield) L3172-14 PCB-52 230 0.3 ng/g-wet weight 6/16/98 HRI-98-03D (Saratoga Battlefield) L3172-14 PCB-49 240 0.39 ng/g-wet weight 6/16/98 HRI-98-03D (Saratoga Battlefield) L3172-14 PCB-47/48 210 0.39 ng/g-wet weight 6/16/98 HRI-98-03D (Saratoga Battlefield) L3172-14 PCB-44 52 0.08 ng/g-wet weight 6/16/98 HRI-98-03D (Saratoga Battlefield) L3172-14 PCB-42 44 0.08 ng/g-wet weight 6/16/98 HRI-98-03D (Saratoga Battlefield) L3172-14 PCB-41/71/64 150 0.08 ng/g-wet weight 6/16/98 HRI-98-03D (Saratoga Battlefield) L3172-14 PCB-40 8.1 0.10 ng/g-wet weight 6/16/98 HRI-98-03D (Saratoga Battlefield) L3172-14 PCB-74 /61 110 0.10 ng/g-wet weight 6/16/98 HRI-98-03D (Saratoga Battlefield) L3172-14 PCB-70/76 130 0.10 ng/g-wet weight 6/16/98 HRI-98-03D (Saratoga Battlefield) L3172-14 PCB-66 /80 89 0.06 ng/g-wet weight 6/16/98 HRI-98-03D (Saratoga Battlefield) L3172-14 PCB-81 3.5 U 21 0.06 ng/g-wet weight 6/16/98 HRI-98-03D (Saratoga Battlefield) L3172-14 PCB-56/60 39 0.06 ng/g-wet weight 6/16/98 HRI-98-03D (Saratoga Battlefield) L3172-14 PCB-77 14 U 21 0.06 ng/g-wet weight 6/16/98 HRI-98-03D (Saratoga Battlefield) L3172-14 PCB-95 43 0.07 ng/g-wet weight 6/16/98 HRI-98-03D (Saratoga Battlefield) L3172-14 PCB-119 3.2 0.07 ng/g-wet weight 6/16/98 HRI-98-03D (Saratoga Battlefield) L3172-14 PCB-91 17 0.07 ng/g-wet weight 6/16/98 HRI-98-03D (Saratoga Battlefield) L3172-14 PCB-84 9.1 0.07 ng/g-wet weight 6/16/98 HRI-98-03D (Saratoga Battlefield) L3172-14 PCB-90/101/89 60 0.07 ng/g-wet weight 6/16/98 HRI-98-03D (Saratoga Battlefield) L3172-14 PCB-99 38 0.07 ng/g-wet weight 6/16/98 HRI-98-03D (Saratoga Battlefield) L3172-14 PCB-83 4.5 0.11 ng/g-wet weight 6/16/98 HRI-98-03D (Saratoga Battlefield) L3172-14 PCB-97 /86 18 0.11 ng/g-wet weight 6/16/98 HRI-98-03D (Saratoga Battlefield) L3172-14 PCB-87 38 0.11 ng/g-wet weight 6/16/98 HRI-98-03D (Saratoga Battlefield) L3172-14 PCB-85 20 0.11 ng/g-wet weight 6/16/98 HRI-98-03D (Saratoga Battlefield) L3172-14 PCB-110 110 0.11 ng/g-wet weight 6/16/98 HRI-98-03D (Saratoga Battlefield) L3172-14 PCB-82 3.8 0.07 ng/g-wet weight 6/16/98 HRI-98-03D (Saratoga Battlefield) L3172-14 PCB-107 5.0 0.07 ng/g-wet weight 6/16/98 HRI-98-03D (Saratoga Battlefield) L3172-14 PCB-114 2.1 U 21 0.07 ng/g-wet weight 6/16/98 HRI-98-03D (Saratoga Battlefield) L3172-14 PCB-126 3.9 0.06 ng/g-wet weight 6/16/98 HRI-98-03D (Saratoga Battlefield) L3172-14 PCB-136 9.0 0.17 ng/g-wet weight
*See Qualifier Codes table at end. Page 50 of 75

Aquatic Insects Pesticide and PCB Data
SAMPLING DATE FIELD ID LABORATORY ID ANALYTE VALUE INTERPRETIVE
QUALIFIER*
QUALIFIER REASON CODE*
DETECTION LIMIT
UNITS
6/16/98 HRI-98-03D (Saratoga Battlefield) L3172-14 PCB-151 13 0.17 ng/g-wet weight 6/16/98 HRI-98-03D (Saratoga Battlefield) L3172-14 PCB-144/135 10 0.17 ng/g-wet weight 6/16/98 HRI-98-03D (Saratoga Battlefield) L3172-14 PCB-149 42 0.17 ng/g-wet weight 6/16/98 HRI-98-03D (Saratoga Battlefield) L3172-14 PCB-134 /143 3.5 0.17 ng/g-wet weight 6/16/98 HRI-98-03D (Saratoga Battlefield) L3172-14 PCB-131 0.24 U 21 0.17 ng/g-wet weight 6/16/98 HRI-98-03D (Saratoga Battlefield) L3172-14 PCB-146 8.2 0.11 ng/g-wet weight 6/16/98 HRI-98-03D (Saratoga Battlefield) L3172-14 PCB-118 61 0.07 ng/g-wet weight 6/16/98 HRI-98-03D (Saratoga Battlefield) L3172-14 PCB-123 3.5 U 21 0.07 ng/g-wet weight 6/16/98 HRI-98-03D (Saratoga Battlefield) L3172-14 PCB-105 22 0.08 ng/g-wet weight 6/16/98 HRI-98-03D (Saratoga Battlefield) L3172-14 PCB-153 49 0.15 ng/g-wet weight 6/16/98 HRI-98-03D (Saratoga Battlefield) L3172-14 PCB-132/168 14 0.24 ng/g-wet weight 6/16/98 HRI-98-03D (Saratoga Battlefield) L3172-14 PCB-141 6 0.24 ng/g-wet weight 6/16/98 HRI-98-03D (Saratoga Battlefield) L3172-14 PCB-130 3.1 0.18 ng/g-wet weight 6/16/98 HRI-98-03D (Saratoga Battlefield) L3172-14 PCB-137 2.1 0.18 ng/g-wet weight 6/16/98 HRI-98-03D (Saratoga Battlefield) L3172-14 PCB-138 62 0.18 ng/g-wet weight 6/16/98 HRI-98-03D (Saratoga Battlefield) L3172-14 PCB-158 4.6 0.18 ng/g-wet weight 6/16/98 HRI-98-03D (Saratoga Battlefield) L3172-14 PCB-129 1.7 0.18 ng/g-wet weight 6/16/98 HRI-98-03D (Saratoga Battlefield) L3172-14 PCB-128 8.1 0.27 ng/g-wet weight 6/16/98 HRI-98-03D (Saratoga Battlefield) L3172-14 PCB-167 1.3 U 21 0.18 ng/g-wet weight 6/16/98 HRI-98-03D (Saratoga Battlefield) L3172-14 PCB-156 5.6 0.3 ng/g-wet weight 6/16/98 HRI-98-03D (Saratoga Battlefield) L3172-14 PCB-157 1.5 0.3 ng/g-wet weight 6/16/98 HRI-98-03D (Saratoga Battlefield) L3172-14 PCB-169 0.88 0.18 ng/g-wet weight 6/16/98 HRI-98-03D (Saratoga Battlefield) L3172-14 PCB-184 ND U 0.17 ng/g-wet weight 6/16/98 HRI-98-03D (Saratoga Battlefield) L3172-14 PCB-179 4.2 0.17 ng/g-wet weight 6/16/98 HRI-98-03D (Saratoga Battlefield) L3172-14 PCB-176 0.88 0.17 ng/g-wet weight 6/16/98 HRI-98-03D (Saratoga Battlefield) L3172-14 PCB-178 4.5 0.17 ng/g-wet weight 6/16/98 HRI-98-03D (Saratoga Battlefield) L3172-14 PCB-175 0.31 0.17 ng/g-wet weight 6/16/98 HRI-98-03D (Saratoga Battlefield) L3172-14 PCB-187/182 16 0.17 ng/g-wet weight 6/16/98 HRI-98-03D (Saratoga Battlefield) L3172-14 PCB-183 3.6 0.19 ng/g-wet weight 6/16/98 HRI-98-03D (Saratoga Battlefield) L3172-14 PCB-185 0.48 0.19 ng/g-wet weight 6/16/98 HRI-98-03D (Saratoga Battlefield) L3172-14 PCB-174 /181 3.9 0.19 ng/g-wet weight 6/16/98 HRI-98-03D (Saratoga Battlefield) L3172-14 PCB-177 4.5 0.19 ng/g-wet weight 6/16/98 HRI-98-03D (Saratoga Battlefield) L3172-14 PCB-171 1.6 0.21 ng/g-wet weight 6/16/98 HRI-98-03D (Saratoga Battlefield) L3172-14 PCB-172 1.1 0.19 ng/g-wet weight 6/16/98 HRI-98-03D (Saratoga Battlefield) L3172-14 PCB-180 14 0.19 ng/g-wet weight
*See Qualifier Codes table at end. Page 51 of 75

Aquatic Insects Pesticide and PCB Data
SAMPLING DATE FIELD ID LABORATORY ID ANALYTE VALUE INTERPRETIVE
QUALIFIER*
QUALIFIER REASON CODE*
DETECTION LIMIT
UNITS
6/16/98 HRI-98-03D (Saratoga Battlefield) L3172-14 PCB-193 1.2 0.19 ng/g-wet weight 6/16/98 HRI-98-03D (Saratoga Battlefield) L3172-14 PCB-191 0.33 0.19 ng/g-wet weight 6/16/98 HRI-98-03D (Saratoga Battlefield) L3172-14 PCB-170 /190 7.8 0.29 ng/g-wet weight 6/16/98 HRI-98-03D (Saratoga Battlefield) L3172-14 PCB-189 0.37 0.29 ng/g-wet weight 6/16/98 HRI-98-03D (Saratoga Battlefield) L3172-14 PCB-201 (BZ#200) 0.57 0.22 ng/g-wet weight 6/16/98 HRI-98-03D (Saratoga Battlefield) L3172-14 PCB-197 ND U 0.44 ng/g-wet weight 6/16/98 HRI-98-03D (Saratoga Battlefield) L3172-14 PCB-200 (BZ#199) 0.70 0.44 ng/g-wet weight 6/16/98 HRI-98-03D (Saratoga Battlefield) L3172-14 PCB-198 ND U 0.44 ng/g-wet weight 6/16/98 HRI-98-03D (Saratoga Battlefield) L3172-14 PCB-199 (BZ#201) 6.6 0.44 ng/g-wet weight 6/16/98 HRI-98-03D (Saratoga Battlefield) L3172-14 PCB-196/203 5.3 0.42 ng/g-wet weight 6/16/98 HRI-98-03D (Saratoga Battlefield) L3172-14 PCB-195 1.1 0.42 ng/g-wet weight 6/16/98 HRI-98-03D (Saratoga Battlefield) L3172-14 PCB-194 4.1 0.62 ng/g-wet weight 6/16/98 HRI-98-03D (Saratoga Battlefield) L3172-14 PCB-205 ND U 0.62 ng/g-wet weight 6/16/98 HRI-98-03D (Saratoga Battlefield) L3172-14 PCB-208 1.0 0.45 ng/g-wet weight 6/16/98 HRI-98-03D (Saratoga Battlefield) L3172-14 PCB-207 ND U 0.45 ng/g-wet weight 6/16/98 HRI-98-03D (Saratoga Battlefield) L3172-14 PCB-206 1.6 0.45 ng/g-wet weight 6/16/98 HRI-98-03D (Saratoga Battlefield) L3172-14 PCB-209 0.58 U 21 0.52 ng/g-wet weight 6/16/98 HRI-98-03E (Saratoga Battlefield) L3172-15 % Lipids 5.2 Percent 6/16/98 HRI-98-03E (Saratoga Battlefield) L3172-15 Hexachlorobenzene 0.52 U 7 0.12 ng/g-wet weight 6/16/98 HRI-98-03E (Saratoga Battlefield) L3172-15 alpha HCH ND U 0.3 ng/g-wet weight 6/16/98 HRI-98-03E (Saratoga Battlefield) L3172-15 beta HCH ND U 0.41 ng/g-wet weight 6/16/98 HRI-98-03E (Saratoga Battlefield) L3172-15 gamma HCH 1.3 U 21 0.3 ng/g-wet weight 6/16/98 HRI-98-03E (Saratoga Battlefield) L3172-15 delta HCH ND U 0.3 ng/g-wet weight 6/16/98 HRI-98-03E (Saratoga Battlefield) L3172-15 Heptachlor ND U 1.6 ng/g-wet weight 6/16/98 HRI-98-03E (Saratoga Battlefield) L3172-15 Aldrin ND U 0.24 ng/g-wet weight 6/16/98 HRI-98-03E (Saratoga Battlefield) L3172-15 Oxychlordane ND U 2.5 ng/g-wet weight 6/16/98 HRI-98-03E (Saratoga Battlefield) L3172-15 gamma-Chlordane (trans-) ND U 0.2 ng/g-wet weight 6/16/98 HRI-98-03E (Saratoga Battlefield) L3172-15 alpha-Chlordane (cis-) 0.22 0.18 ng/g-wet weight 6/16/98 HRI-98-03E (Saratoga Battlefield) L3172-15 o,p'-DDE 0.14 0.05 ng/g-wet weight 6/16/98 HRI-98-03E (Saratoga Battlefield) L3172-15 p,p'-DDE 7.4 0.06 ng/g-wet weight 6/16/98 HRI-98-03E (Saratoga Battlefield) L3172-15 trans-Nonachlor 0.56 0.06 ng/g-wet weight 6/16/98 HRI-98-03E (Saratoga Battlefield) L3172-15 o,p'-DDD 0.17 U 21 0.06 ng/g-wet weight 6/16/98 HRI-98-03E (Saratoga Battlefield) L3172-15 p,p'-DDD 0.2 U 21 0.06 ng/g-wet weight 6/16/98 HRI-98-03E (Saratoga Battlefield) L3172-15 o,p'-DDT 0.2 0.07 ng/g-wet weight 6/16/98 HRI-98-03E (Saratoga Battlefield) L3172-15 p,p'-DDT 0.43 U 21 0.10 ng/g-wet weight
*See Qualifier Codes table at end. Page 52 of 75

Aquatic Insects Pesticide and PCB Data
SAMPLING DATE FIELD ID LABORATORY ID ANALYTE VALUE INTERPRETIVE
QUALIFIER*
QUALIFIER REASON CODE*
DETECTION LIMIT
UNITS
6/16/98 HRI-98-03E (Saratoga Battlefield) L3172-15 Mirex ND U 0.1 ng/g-wet weight 6/16/98 HRI-98-03E (Saratoga Battlefield) L3172-15 Photomirex R 5A 6/16/98 HRI-98-03E (Saratoga Battlefield) L3172-15 Heptachlor Epoxide ND U 0.7 ng/g-wet weight 6/16/98 HRI-98-03E (Saratoga Battlefield) L3172-15 alpha-Endosulphan (I) ND U 0.12 ng/g-wet weight 6/16/98 HRI-98-03E (Saratoga Battlefield) L3172-15 Dieldrin 0.45 NJ 3 0.08 ng/g-wet weight 6/16/98 HRI-98-03E (Saratoga Battlefield) L3172-15 Endrin ND UJ 10 0.21 ng/g-wet weight 6/16/98 HRI-98-03E (Saratoga Battlefield) L3172-15 beta-Endosulphan (II) ND U 0.13 ng/g-wet weight 6/16/98 HRI-98-03E (Saratoga Battlefield) L3172-15 Endrin Aldehyde 0.31 U 7 0.16 ng/g-wet weight 6/16/98 HRI-98-03E (Saratoga Battlefield) L3172-15 Endosulphan Sulphate ND U 0.16 ng/g-wet weight 6/16/98 HRI-98-03E (Saratoga Battlefield) L3172-15 Endrin Ketone ND U 0.09 ng/g-wet weight 6/16/98 HRI-98-03E (Saratoga Battlefield) L3172-15 Methoxychlor ND UJ 10 0.4 ng/g-wet weight 6/16/98 HRI-98-03E (Saratoga Battlefield) L3172-15 Aroclor 1242 2300 NJ 14 7.5 ng/g-wet weight 6/16/98 HRI-98-03E (Saratoga Battlefield) L3172-15 Aroclor 1248 ND U 1.3 ng/g-wet weight 6/16/98 HRI-98-03E (Saratoga Battlefield) L3172-15 Aroclor 1254 1000 NJ 14 2 ng/g-wet weight 6/16/98 HRI-98-03E (Saratoga Battlefield) L3172-15 Aroclor 1260 130 NJ 14 2.8 ng/g-wet weight 6/16/98 HRI-98-03E (Saratoga Battlefield) L3172-15 PCB-6 ND U 0.02 ng/g-wet weight 6/16/98 HRI-98-03E (Saratoga Battlefield) L3172-15 PCB-4/10 140 U 21 0.05 ng/g-wet weight 6/16/98 HRI-98-03E (Saratoga Battlefield) L3172-15 PCB-7/9 3.6 0.05 ng/g-wet weight 6/16/98 HRI-98-03E (Saratoga Battlefield) L3172-15 PCB-8/5 84 0.05 ng/g-wet weight 6/16/98 HRI-98-03E (Saratoga Battlefield) L3172-15 PCB-15 61 0.08 ng/g-wet weight 6/16/98 HRI-98-03E (Saratoga Battlefield) L3172-15 PCB-19 150 0.09 ng/g-wet weight 6/16/98 HRI-98-03E (Saratoga Battlefield) L3172-15 PCB-18 80 0.09 ng/g-wet weight 6/16/98 HRI-98-03E (Saratoga Battlefield) L3172-15 PCB-17 88 0.09 ng/g-wet weight 6/16/98 HRI-98-03E (Saratoga Battlefield) L3172-15 PCB-24/27 150 0.49 ng/g-wet weight 6/16/98 HRI-98-03E (Saratoga Battlefield) L3172-15 PCB-16/32 170 0.49 ng/g-wet weight 6/16/98 HRI-98-03E (Saratoga Battlefield) L3172-15 PCB-26 100 0.07 ng/g-wet weight 6/16/98 HRI-98-03E (Saratoga Battlefield) L3172-15 PCB-25 25 0.07 ng/g-wet weight 6/16/98 HRI-98-03E (Saratoga Battlefield) L3172-15 PCB-31/28 350 0.41 ng/g-wet weight 6/16/98 HRI-98-03E (Saratoga Battlefield) L3172-15 PCB-33 /20 15 0.07 ng/g-wet weight 6/16/98 HRI-98-03E (Saratoga Battlefield) L3172-15 PCB-22 14 0.07 ng/g-wet weight 6/16/98 HRI-98-03E (Saratoga Battlefield) L3172-15 PCB-37 7.7 0.07 ng/g-wet weight 6/16/98 HRI-98-03E (Saratoga Battlefield) L3172-15 PCB-53 71 0.13 ng/g-wet weight 6/16/98 HRI-98-03E (Saratoga Battlefield) L3172-15 PCB-45 14 0.13 ng/g-wet weight 6/16/98 HRI-98-03E (Saratoga Battlefield) L3172-15 PCB-46 4.1 0.13 ng/g-wet weight 6/16/98 HRI-98-03E (Saratoga Battlefield) L3172-15 PCB-52 240 0.9 ng/g-wet weight
*See Qualifier Codes table at end. Page 53 of 75

Aquatic Insects Pesticide and PCB Data
SAMPLING DATE FIELD ID LABORATORY ID ANALYTE VALUE INTERPRETIVE
QUALIFIER*
QUALIFIER REASON CODE*
DETECTION LIMIT
UNITS
6/16/98 HRI-98-03E (Saratoga Battlefield) L3172-15 PCB-49 260 1.2 ng/g-wet weight 6/16/98 HRI-98-03E (Saratoga Battlefield) L3172-15 PCB-47/48 210 1.2 ng/g-wet weight 6/16/98 HRI-98-03E (Saratoga Battlefield) L3172-15 PCB-44 52 0.16 ng/g-wet weight 6/16/98 HRI-98-03E (Saratoga Battlefield) L3172-15 PCB-42 44 0.16 ng/g-wet weight 6/16/98 HRI-98-03E (Saratoga Battlefield) L3172-15 PCB-41/71/64 150 0.16 ng/g-wet weight 6/16/98 HRI-98-03E (Saratoga Battlefield) L3172-15 PCB-40 8.7 0.19 ng/g-wet weight 6/16/98 HRI-98-03E (Saratoga Battlefield) L3172-15 PCB-74 /61 120 0.19 ng/g-wet weight 6/16/98 HRI-98-03E (Saratoga Battlefield) L3172-15 PCB-70/76 140 0.19 ng/g-wet weight 6/16/98 HRI-98-03E (Saratoga Battlefield) L3172-15 PCB-66 /80 96 0.11 ng/g-wet weight 6/16/98 HRI-98-03E (Saratoga Battlefield) L3172-15 PCB-81 3.7 U 21 0.11 ng/g-wet weight 6/16/98 HRI-98-03E (Saratoga Battlefield) L3172-15 PCB-56/60 43 0.11 ng/g-wet weight 6/16/98 HRI-98-03E (Saratoga Battlefield) L3172-15 PCB-77 13 U 21 0.11 ng/g-wet weight 6/16/98 HRI-98-03E (Saratoga Battlefield) L3172-15 PCB-95 43 0.05 ng/g-wet weight 6/16/98 HRI-98-03E (Saratoga Battlefield) L3172-15 PCB-119 3.2 0.05 ng/g-wet weight 6/16/98 HRI-98-03E (Saratoga Battlefield) L3172-15 PCB-91 18 0.05 ng/g-wet weight 6/16/98 HRI-98-03E (Saratoga Battlefield) L3172-15 PCB-84 10 0.05 ng/g-wet weight 6/16/98 HRI-98-03E (Saratoga Battlefield) L3172-15 PCB-90/101/89 65 0.05 ng/g-wet weight 6/16/98 HRI-98-03E (Saratoga Battlefield) L3172-15 PCB-99 39 0.05 ng/g-wet weight 6/16/98 HRI-98-03E (Saratoga Battlefield) L3172-15 PCB-83 5.1 0.08 ng/g-wet weight 6/16/98 HRI-98-03E (Saratoga Battlefield) L3172-15 PCB-97 /86 19 0.08 ng/g-wet weight 6/16/98 HRI-98-03E (Saratoga Battlefield) L3172-15 PCB-87 42 0.08 ng/g-wet weight 6/16/98 HRI-98-03E (Saratoga Battlefield) L3172-15 PCB-85 20 0.08 ng/g-wet weight 6/16/98 HRI-98-03E (Saratoga Battlefield) L3172-15 PCB-110 110 0.08 ng/g-wet weight 6/16/98 HRI-98-03E (Saratoga Battlefield) L3172-15 PCB-82 4.4 0.05 ng/g-wet weight 6/16/98 HRI-98-03E (Saratoga Battlefield) L3172-15 PCB-107 5.2 0.05 ng/g-wet weight 6/16/98 HRI-98-03E (Saratoga Battlefield) L3172-15 PCB-114 2.0 U 21 0.05 ng/g-wet weight 6/16/98 HRI-98-03E (Saratoga Battlefield) L3172-15 PCB-126 3.7 0.05 ng/g-wet weight 6/16/98 HRI-98-03E (Saratoga Battlefield) L3172-15 PCB-136 8.9 0.08 ng/g-wet weight 6/16/98 HRI-98-03E (Saratoga Battlefield) L3172-15 PCB-151 12 0.08 ng/g-wet weight 6/16/98 HRI-98-03E (Saratoga Battlefield) L3172-15 PCB-144/135 9.8 0.08 ng/g-wet weight 6/16/98 HRI-98-03E (Saratoga Battlefield) L3172-15 PCB-149 41 0.08 ng/g-wet weight 6/16/98 HRI-98-03E (Saratoga Battlefield) L3172-15 PCB-134 /143 3.3 0.08 ng/g-wet weight 6/16/98 HRI-98-03E (Saratoga Battlefield) L3172-15 PCB-131 0.29 U 21 0.08 ng/g-wet weight 6/16/98 HRI-98-03E (Saratoga Battlefield) L3172-15 PCB-146 8.0 0.05 ng/g-wet weight 6/16/98 HRI-98-03E (Saratoga Battlefield) L3172-15 PCB-118 65 0.05 ng/g-wet weight
*See Qualifier Codes table at end. Page 54 of 75

Aquatic Insects Pesticide and PCB Data
SAMPLING DATE FIELD ID LABORATORY ID ANALYTE VALUE INTERPRETIVE
QUALIFIER*
QUALIFIER REASON CODE*
DETECTION LIMIT
UNITS
6/16/98 HRI-98-03E (Saratoga Battlefield) L3172-15 PCB-123 3.7 U 21 0.05 ng/g-wet weight 6/16/98 HRI-98-03E (Saratoga Battlefield) L3172-15 PCB-105 24 0.05 ng/g-wet weight 6/16/98 HRI-98-03E (Saratoga Battlefield) L3172-15 PCB-153 51 0.07 ng/g-wet weight 6/16/98 HRI-98-03E (Saratoga Battlefield) L3172-15 PCB-132/168 14 0.11 ng/g-wet weight 6/16/98 HRI-98-03E (Saratoga Battlefield) L3172-15 PCB-141 5.7 0.11 ng/g-wet weight 6/16/98 HRI-98-03E (Saratoga Battlefield) L3172-15 PCB-130 2.9 0.08 ng/g-wet weight 6/16/98 HRI-98-03E (Saratoga Battlefield) L3172-15 PCB-137 2.2 0.08 ng/g-wet weight 6/16/98 HRI-98-03E (Saratoga Battlefield) L3172-15 PCB-138 61 0.08 ng/g-wet weight 6/16/98 HRI-98-03E (Saratoga Battlefield) L3172-15 PCB-158 4.3 0.08 ng/g-wet weight 6/16/98 HRI-98-03E (Saratoga Battlefield) L3172-15 PCB-129 1.7 0.08 ng/g-wet weight 6/16/98 HRI-98-03E (Saratoga Battlefield) L3172-15 PCB-128 7.7 0.12 ng/g-wet weight 6/16/98 HRI-98-03E (Saratoga Battlefield) L3172-15 PCB-167 1.6 U 21 0.08 ng/g-wet weight 6/16/98 HRI-98-03E (Saratoga Battlefield) L3172-15 PCB-156 6.2 0.13 ng/g-wet weight 6/16/98 HRI-98-03E (Saratoga Battlefield) L3172-15 PCB-157 1.6 0.13 ng/g-wet weight 6/16/98 HRI-98-03E (Saratoga Battlefield) L3172-15 PCB-169 0.91 0.08 ng/g-wet weight 6/16/98 HRI-98-03E (Saratoga Battlefield) L3172-15 PCB-184 ND U 0.17 ng/g-wet weight 6/16/98 HRI-98-03E (Saratoga Battlefield) L3172-15 PCB-179 3.8 0.15 ng/g-wet weight 6/16/98 HRI-98-03E (Saratoga Battlefield) L3172-15 PCB-176 0.86 0.15 ng/g-wet weight 6/16/98 HRI-98-03E (Saratoga Battlefield) L3172-15 PCB-178 4.2 0.15 ng/g-wet weight 6/16/98 HRI-98-03E (Saratoga Battlefield) L3172-15 PCB-175 0.22 U 21 0.15 ng/g-wet weight 6/16/98 HRI-98-03E (Saratoga Battlefield) L3172-15 PCB-187/182 15 0.15 ng/g-wet weight 6/16/98 HRI-98-03E (Saratoga Battlefield) L3172-15 PCB-183 3.3 0.17 ng/g-wet weight 6/16/98 HRI-98-03E (Saratoga Battlefield) L3172-15 PCB-185 0.56 0.17 ng/g-wet weight 6/16/98 HRI-98-03E (Saratoga Battlefield) L3172-15 PCB-174 /181 3.7 0.17 ng/g-wet weight 6/16/98 HRI-98-03E (Saratoga Battlefield) L3172-15 PCB-177 4.5 0.17 ng/g-wet weight 6/16/98 HRI-98-03E (Saratoga Battlefield) L3172-15 PCB-171 1.7 0.18 ng/g-wet weight 6/16/98 HRI-98-03E (Saratoga Battlefield) L3172-15 PCB-172 1.3 0.17 ng/g-wet weight 6/16/98 HRI-98-03E (Saratoga Battlefield) L3172-15 PCB-180 15 0.17 ng/g-wet weight 6/16/98 HRI-98-03E (Saratoga Battlefield) L3172-15 PCB-193 1.1 0.17 ng/g-wet weight 6/16/98 HRI-98-03E (Saratoga Battlefield) L3172-15 PCB-191 0.23 0.17 ng/g-wet weight 6/16/98 HRI-98-03E (Saratoga Battlefield) L3172-15 PCB-170 /190 8.4 0.26 ng/g-wet weight 6/16/98 HRI-98-03E (Saratoga Battlefield) L3172-15 PCB-189 0.45 0.26 ng/g-wet weight 6/16/98 HRI-98-03E (Saratoga Battlefield) L3172-15 PCB-201 (BZ#200) 0.52 0.19 ng/g-wet weight 6/16/98 HRI-98-03E (Saratoga Battlefield) L3172-15 PCB-197 ND U 0.37 ng/g-wet weight 6/16/98 HRI-98-03E (Saratoga Battlefield) L3172-15 PCB-200 (BZ#199) 0.74 0.37 ng/g-wet weight
*See Qualifier Codes table at end. Page 55 of 75

Aquatic Insects Pesticide and PCB Data
SAMPLING DATE FIELD ID LABORATORY ID ANALYTE VALUE INTERPRETIVE
QUALIFIER*
QUALIFIER REASON CODE*
DETECTION LIMIT
UNITS
6/16/98 HRI-98-03E (Saratoga Battlefield) L3172-15 PCB-198 ND U 0.37 ng/g-wet weight 6/16/98 HRI-98-03E (Saratoga Battlefield) L3172-15 PCB-199 (BZ#201) 6.6 0.37 ng/g-wet weight 6/16/98 HRI-98-03E (Saratoga Battlefield) L3172-15 PCB-196/203 5.5 0.36 ng/g-wet weight 6/16/98 HRI-98-03E (Saratoga Battlefield) L3172-15 PCB-195 1.3 0.36 ng/g-wet weight 6/16/98 HRI-98-03E (Saratoga Battlefield) L3172-15 PCB-194 4.8 0.53 ng/g-wet weight 6/16/98 HRI-98-03E (Saratoga Battlefield) L3172-15 PCB-205 ND U 0.53 ng/g-wet weight 6/16/98 HRI-98-03E (Saratoga Battlefield) L3172-15 PCB-208 1.2 0.39 ng/g-wet weight 6/16/98 HRI-98-03E (Saratoga Battlefield) L3172-15 PCB-207 ND U 0.39 ng/g-wet weight 6/16/98 HRI-98-03E (Saratoga Battlefield) L3172-15 PCB-206 1.7 0.39 ng/g-wet weight 6/16/98 HRI-98-03E (Saratoga Battlefield) L3172-15 PCB-209 0.56 U 21 0.3 ng/g-wet weight 6/24/98 HRI-98-04A (Chelsea) L3172-16 % Lipids 3.1 Percent 6/24/98 HRI-98-04A (Chelsea) L3172-16 Hexachlorobenzene 0.34 U 7 0.07 ng/g-wet weight 6/24/98 HRI-98-04A (Chelsea) L3172-16 alpha HCH ND U 0.23 ng/g-wet weight 6/24/98 HRI-98-04A (Chelsea) L3172-16 beta HCH ND U 0.31 ng/g-wet weight 6/24/98 HRI-98-04A (Chelsea) L3172-16 gamma HCH ND U 0.23 ng/g-wet weight 6/24/98 HRI-98-04A (Chelsea) L3172-16 delta HCH ND U 0.23 ng/g-wet weight 6/24/98 HRI-98-04A (Chelsea) L3172-16 Heptachlor ND U 2.5 ng/g-wet weight 6/24/98 HRI-98-04A (Chelsea) L3172-16 Aldrin ND U 0.32 ng/g-wet weight 6/24/98 HRI-98-04A (Chelsea) L3172-16 Oxychlordane ND U 1.3 ng/g-wet weight 6/24/98 HRI-98-04A (Chelsea) L3172-16 gamma-Chlordane (trans-) ND U 0.26 ng/g-wet weight 6/24/98 HRI-98-04A (Chelsea) L3172-16 alpha-Chlordane (cis-) ND U 0.22 ng/g-wet weight 6/24/98 HRI-98-04A (Chelsea) L3172-16 o,p'-DDE 0.21 U 21 0.08 ng/g-wet weight 6/24/98 HRI-98-04A (Chelsea) L3172-16 p,p'-DDE 27 0.10 ng/g-wet weight 6/24/98 HRI-98-04A (Chelsea) L3172-16 trans-Nonachlor 0.72 0.15 ng/g-wet weight 6/24/98 HRI-98-04A (Chelsea) L3172-16 o,p'-DDD 0.28 0.07 ng/g-wet weight 6/24/98 HRI-98-04A (Chelsea) L3172-16 p,p'-DDD 0.83 0.08 ng/g-wet weight 6/24/98 HRI-98-04A (Chelsea) L3172-16 o,p'-DDT 0.29 0.09 ng/g-wet weight 6/24/98 HRI-98-04A (Chelsea) L3172-16 p,p'-DDT 0.68 0.12 ng/g-wet weight 6/24/98 HRI-98-04A (Chelsea) L3172-16 Mirex ND U 0.21 ng/g-wet weight 6/24/98 HRI-98-04A (Chelsea) L3172-16 Photomirex R 5A 6/24/98 HRI-98-04A (Chelsea) L3172-16 Heptachlor Epoxide ND U 0.12 ng/g-wet weight 6/24/98 HRI-98-04A (Chelsea) L3172-16 alpha-Endosulphan (I) ND U 0.21 ng/g-wet weight 6/24/98 HRI-98-04A (Chelsea) L3172-16 Dieldrin 1.4 NJ 3 0.1 ng/g-wet weight 6/24/98 HRI-98-04A (Chelsea) L3172-16 Endrin ND UJ 10 0.25 ng/g-wet weight 6/24/98 HRI-98-04A (Chelsea) L3172-16 beta-Endosulphan (II) ND U 0.24 ng/g-wet weight
*See Qualifier Codes table at end. Page 56 of 75

Aquatic Insects Pesticide and PCB Data
SAMPLING DATE FIELD ID LABORATORY ID ANALYTE VALUE INTERPRETIVE
QUALIFIER*
QUALIFIER REASON CODE*
DETECTION LIMIT
UNITS
6/24/98 HRI-98-04A (Chelsea) L3172-16 Endrin Aldehyde 0.28 U 7 0.19 ng/g-wet weight 6/24/98 HRI-98-04A (Chelsea) L3172-16 Endosulphan Sulphate ND U 0.28 ng/g-wet weight 6/24/98 HRI-98-04A (Chelsea) L3172-16 Endrin Ketone ND U 0.11 ng/g-wet weight 6/24/98 HRI-98-04A (Chelsea) L3172-16 Methoxychlor ND UJ 10 0.48 ng/g-wet weight 6/24/98 HRI-98-04A (Chelsea) L3172-16 Aroclor 1242 60 NJ 14 1.3 ng/g-wet weight 6/24/98 HRI-98-04A (Chelsea) L3172-16 Aroclor 1248 ND U 1.3 ng/g-wet weight 6/24/98 HRI-98-04A (Chelsea) L3172-16 Aroclor 1254 140 NJ 14 3.8 ng/g-wet weight 6/24/98 HRI-98-04A (Chelsea) L3172-16 Aroclor 1260 53 NJ 14 2.7 ng/g-wet weight 6/24/98 HRI-98-04A (Chelsea) L3172-16 PCB-6 0.14 0.05 ng/g-wet weight 6/24/98 HRI-98-04A (Chelsea) L3172-16 PCB-4/10 0.49 0.08 ng/g-wet weight 6/24/98 HRI-98-04A (Chelsea) L3172-16 PCB-7/9 0.13 U 21 0.08 ng/g-wet weight 6/24/98 HRI-98-04A (Chelsea) L3172-16 PCB-8/5 0.41 0.08 ng/g-wet weight 6/24/98 HRI-98-04A (Chelsea) L3172-16 PCB-15 1.0 U 21 0.13 ng/g-wet weight 6/24/98 HRI-98-04A (Chelsea) L3172-16 PCB-19 0.7 0.08 ng/g-wet weight 6/24/98 HRI-98-04A (Chelsea) L3172-16 PCB-18 2.1 0.08 ng/g-wet weight 6/24/98 HRI-98-04A (Chelsea) L3172-16 PCB-17 2.3 0.08 ng/g-wet weight 6/24/98 HRI-98-04A (Chelsea) L3172-16 PCB-24/27 0.98 0.08 ng/g-wet weight 6/24/98 HRI-98-04A (Chelsea) L3172-16 PCB-16/32 2.3 0.08 ng/g-wet weight 6/24/98 HRI-98-04A (Chelsea) L3172-16 PCB-26 1.6 0.07 ng/g-wet weight 6/24/98 HRI-98-04A (Chelsea) L3172-16 PCB-25 0.79 0.07 ng/g-wet weight 6/24/98 HRI-98-04A (Chelsea) L3172-16 PCB-31/28 11 0.07 ng/g-wet weight 6/24/98 HRI-98-04A (Chelsea) L3172-16 PCB-33 /20 0.62 0.07 ng/g-wet weight 6/24/98 HRI-98-04A (Chelsea) L3172-16 PCB-22 0.51 0.07 ng/g-wet weight 6/24/98 HRI-98-04A (Chelsea) L3172-16 PCB-37 0.72 0.07 ng/g-wet weight 6/24/98 HRI-98-04A (Chelsea) L3172-16 PCB-53 1.5 0.12 ng/g-wet weight 6/24/98 HRI-98-04A (Chelsea) L3172-16 PCB-45 0.43 0.12 ng/g-wet weight 6/24/98 HRI-98-04A (Chelsea) L3172-16 PCB-46 0.3 0.12 ng/g-wet weight 6/24/98 HRI-98-04A (Chelsea) L3172-16 PCB-52 12 0.12 ng/g-wet weight 6/24/98 HRI-98-04A (Chelsea) L3172-16 PCB-49 18 0.15 ng/g-wet weight 6/24/98 HRI-98-04A (Chelsea) L3172-16 PCB-47/48 13 0.15 ng/g-wet weight 6/24/98 HRI-98-04A (Chelsea) L3172-16 PCB-44 3.9 0.14 ng/g-wet weight 6/24/98 HRI-98-04A (Chelsea) L3172-16 PCB-42 2.7 0.14 ng/g-wet weight 6/24/98 HRI-98-04A (Chelsea) L3172-16 PCB-41/71/64 8.9 0.14 ng/g-wet weight 6/24/98 HRI-98-04A (Chelsea) L3172-16 PCB-40 1.5 0.16 ng/g-wet weight 6/24/98 HRI-98-04A (Chelsea) L3172-16 PCB-74 /61 5.4 0.16 ng/g-wet weight
*See Qualifier Codes table at end. Page 57 of 75

Aquatic Insects Pesticide and PCB Data
SAMPLING DATE FIELD ID LABORATORY ID ANALYTE VALUE INTERPRETIVE
QUALIFIER*
QUALIFIER REASON CODE*
DETECTION LIMIT
UNITS
6/24/98 HRI-98-04A (Chelsea) L3172-16 PCB-70/76 6.9 0.16 ng/g-wet weight 6/24/98 HRI-98-04A (Chelsea) L3172-16 PCB-66 /80 4.9 0.10 ng/g-wet weight 6/24/98 HRI-98-04A (Chelsea) L3172-16 PCB-81 0.63 U 21 0.10 ng/g-wet weight 6/24/98 HRI-98-04A (Chelsea) L3172-16 PCB-56/60 2.3 0.10 ng/g-wet weight 6/24/98 HRI-98-04A (Chelsea) L3172-16 PCB-77 1.6 U 21 0.10 ng/g-wet weight 6/24/98 HRI-98-04A (Chelsea) L3172-16 PCB-95 4.3 0.09 ng/g-wet weight 6/24/98 HRI-98-04A (Chelsea) L3172-16 PCB-119 0.56 0.09 ng/g-wet weight 6/24/98 HRI-98-04A (Chelsea) L3172-16 PCB-91 1.2 0.09 ng/g-wet weight 6/24/98 HRI-98-04A (Chelsea) L3172-16 PCB-84 1.0 0.09 ng/g-wet weight 6/24/98 HRI-98-04A (Chelsea) L3172-16 PCB-90/101/89 9.7 0.09 ng/g-wet weight 6/24/98 HRI-98-04A (Chelsea) L3172-16 PCB-99 5.3 0.09 ng/g-wet weight 6/24/98 HRI-98-04A (Chelsea) L3172-16 PCB-83 1.2 0.16 ng/g-wet weight 6/24/98 HRI-98-04A (Chelsea) L3172-16 PCB-97 /86 2.4 0.16 ng/g-wet weight 6/24/98 HRI-98-04A (Chelsea) L3172-16 PCB-87 6.2 0.16 ng/g-wet weight 6/24/98 HRI-98-04A (Chelsea) L3172-16 PCB-85 2.2 0.16 ng/g-wet weight 6/24/98 HRI-98-04A (Chelsea) L3172-16 PCB-110 13 0.16 ng/g-wet weight 6/24/98 HRI-98-04A (Chelsea) L3172-16 PCB-82 0.38 0.09 ng/g-wet weight 6/24/98 HRI-98-04A (Chelsea) L3172-16 PCB-107 1.8 0.09 ng/g-wet weight 6/24/98 HRI-98-04A (Chelsea) L3172-16 PCB-114 0.35 0.09 ng/g-wet weight 6/24/98 HRI-98-04A (Chelsea) L3172-16 PCB-126 1.2 0.09 ng/g-wet weight 6/24/98 HRI-98-04A (Chelsea) L3172-16 PCB-136 1.0 0.10 ng/g-wet weight 6/24/98 HRI-98-04A (Chelsea) L3172-16 PCB-151 3.2 0.10 ng/g-wet weight 6/24/98 HRI-98-04A (Chelsea) L3172-16 PCB-144/135 2.5 0.10 ng/g-wet weight 6/24/98 HRI-98-04A (Chelsea) L3172-16 PCB-149 6.6 0.10 ng/g-wet weight 6/24/98 HRI-98-04A (Chelsea) L3172-16 PCB-134 /143 1.1 0.10 ng/g-wet weight 6/24/98 HRI-98-04A (Chelsea) L3172-16 PCB-131 ND U 0.10 ng/g-wet weight 6/24/98 HRI-98-04A (Chelsea) L3172-16 PCB-146 2.4 0.06 ng/g-wet weight 6/24/98 HRI-98-04A (Chelsea) L3172-16 PCB-118 7.2 0.1 ng/g-wet weight 6/24/98 HRI-98-04A (Chelsea) L3172-16 PCB-123 0.67 0.1 ng/g-wet weight 6/24/98 HRI-98-04A (Chelsea) L3172-16 PCB-105 2.0 0.10 ng/g-wet weight 6/24/98 HRI-98-04A (Chelsea) L3172-16 PCB-153 13 0.07 ng/g-wet weight 6/24/98 HRI-98-04A (Chelsea) L3172-16 PCB-132/168 1.4 0.11 ng/g-wet weight 6/24/98 HRI-98-04A (Chelsea) L3172-16 PCB-141 2.4 0.12 ng/g-wet weight 6/24/98 HRI-98-04A (Chelsea) L3172-16 PCB-130 1.1 0.09 ng/g-wet weight 6/24/98 HRI-98-04A (Chelsea) L3172-16 PCB-137 0.64 0.09 ng/g-wet weight
*See Qualifier Codes table at end. Page 58 of 75
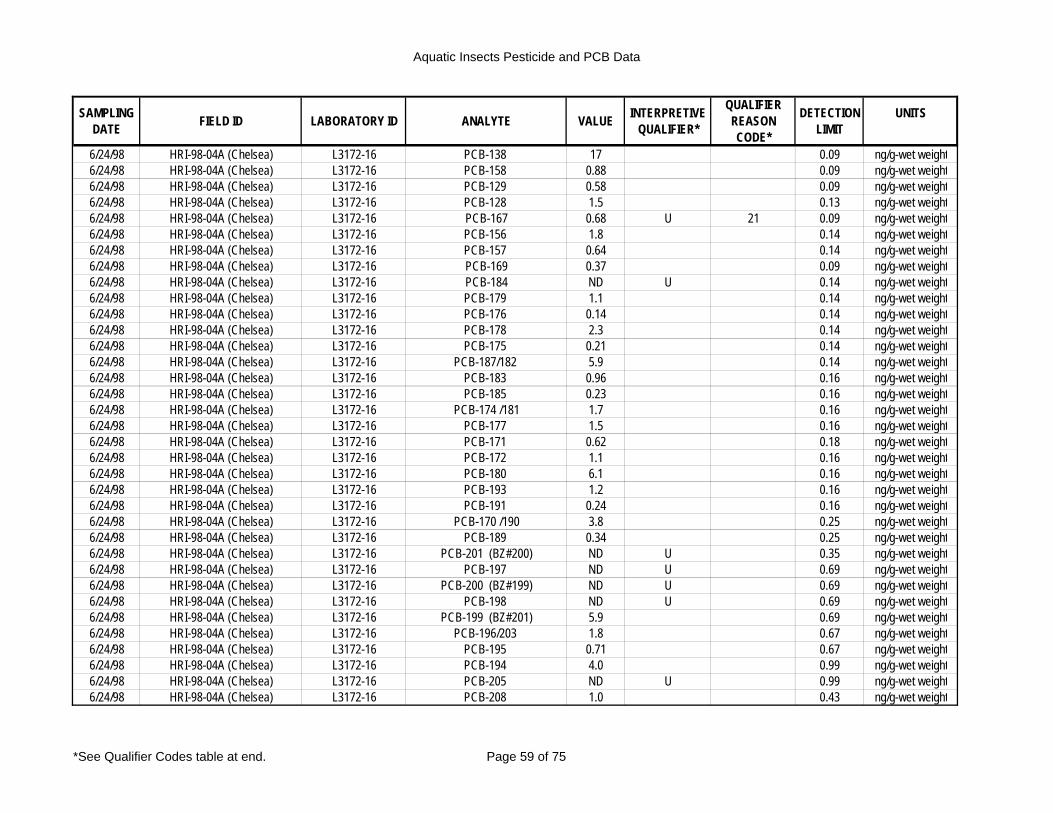
Aquatic Insects Pesticide and PCB Data
SAMPLING DATE FIELD ID LABORATORY ID ANALYTE VALUE INTERPRETIVE
QUALIFIER*
QUALIFIER REASON CODE*
DETECTION LIMIT
UNITS
6/24/98 HRI-98-04A (Chelsea) L3172-16 PCB-138 17 0.09 ng/g-wet weight 6/24/98 HRI-98-04A (Chelsea) L3172-16 PCB-158 0.88 0.09 ng/g-wet weight 6/24/98 HRI-98-04A (Chelsea) L3172-16 PCB-129 0.58 0.09 ng/g-wet weight 6/24/98 HRI-98-04A (Chelsea) L3172-16 PCB-128 1.5 0.13 ng/g-wet weight 6/24/98 HRI-98-04A (Chelsea) L3172-16 PCB-167 0.68 U 21 0.09 ng/g-wet weight 6/24/98 HRI-98-04A (Chelsea) L3172-16 PCB-156 1.8 0.14 ng/g-wet weight 6/24/98 HRI-98-04A (Chelsea) L3172-16 PCB-157 0.64 0.14 ng/g-wet weight 6/24/98 HRI-98-04A (Chelsea) L3172-16 PCB-169 0.37 0.09 ng/g-wet weight 6/24/98 HRI-98-04A (Chelsea) L3172-16 PCB-184 ND U 0.14 ng/g-wet weight 6/24/98 HRI-98-04A (Chelsea) L3172-16 PCB-179 1.1 0.14 ng/g-wet weight 6/24/98 HRI-98-04A (Chelsea) L3172-16 PCB-176 0.14 0.14 ng/g-wet weight 6/24/98 HRI-98-04A (Chelsea) L3172-16 PCB-178 2.3 0.14 ng/g-wet weight 6/24/98 HRI-98-04A (Chelsea) L3172-16 PCB-175 0.21 0.14 ng/g-wet weight 6/24/98 HRI-98-04A (Chelsea) L3172-16 PCB-187/182 5.9 0.14 ng/g-wet weight 6/24/98 HRI-98-04A (Chelsea) L3172-16 PCB-183 0.96 0.16 ng/g-wet weight 6/24/98 HRI-98-04A (Chelsea) L3172-16 PCB-185 0.23 0.16 ng/g-wet weight 6/24/98 HRI-98-04A (Chelsea) L3172-16 PCB-174 /181 1.7 0.16 ng/g-wet weight 6/24/98 HRI-98-04A (Chelsea) L3172-16 PCB-177 1.5 0.16 ng/g-wet weight 6/24/98 HRI-98-04A (Chelsea) L3172-16 PCB-171 0.62 0.18 ng/g-wet weight 6/24/98 HRI-98-04A (Chelsea) L3172-16 PCB-172 1.1 0.16 ng/g-wet weight 6/24/98 HRI-98-04A (Chelsea) L3172-16 PCB-180 6.1 0.16 ng/g-wet weight 6/24/98 HRI-98-04A (Chelsea) L3172-16 PCB-193 1.2 0.16 ng/g-wet weight 6/24/98 HRI-98-04A (Chelsea) L3172-16 PCB-191 0.24 0.16 ng/g-wet weight 6/24/98 HRI-98-04A (Chelsea) L3172-16 PCB-170 /190 3.8 0.25 ng/g-wet weight 6/24/98 HRI-98-04A (Chelsea) L3172-16 PCB-189 0.34 0.25 ng/g-wet weight 6/24/98 HRI-98-04A (Chelsea) L3172-16 PCB-201 (BZ#200) ND U 0.35 ng/g-wet weight 6/24/98 HRI-98-04A (Chelsea) L3172-16 PCB-197 ND U 0.69 ng/g-wet weight 6/24/98 HRI-98-04A (Chelsea) L3172-16 PCB-200 (BZ#199) ND U 0.69 ng/g-wet weight 6/24/98 HRI-98-04A (Chelsea) L3172-16 PCB-198 ND U 0.69 ng/g-wet weight 6/24/98 HRI-98-04A (Chelsea) L3172-16 PCB-199 (BZ#201) 5.9 0.69 ng/g-wet weight 6/24/98 HRI-98-04A (Chelsea) L3172-16 PCB-196/203 1.8 0.67 ng/g-wet weight 6/24/98 HRI-98-04A (Chelsea) L3172-16 PCB-195 0.71 0.67 ng/g-wet weight 6/24/98 HRI-98-04A (Chelsea) L3172-16 PCB-194 4.0 0.99 ng/g-wet weight 6/24/98 HRI-98-04A (Chelsea) L3172-16 PCB-205 ND U 0.99 ng/g-wet weight 6/24/98 HRI-98-04A (Chelsea) L3172-16 PCB-208 1.0 0.43 ng/g-wet weight
*See Qualifier Codes table at end. Page 59 of 75

Aquatic Insects Pesticide and PCB Data
SAMPLING DATE FIELD ID LABORATORY ID ANALYTE VALUE INTERPRETIVE
QUALIFIER*
QUALIFIER REASON CODE*
DETECTION LIMIT
UNITS
6/24/98 HRI-98-04A (Chelsea) L3172-16 PCB-207 ND U 0.43 ng/g-wet weight 6/24/98 HRI-98-04A (Chelsea) L3172-16 PCB-206 1.8 0.43 ng/g-wet weight 6/24/98 HRI-98-04A (Chelsea) L3172-16 PCB-209 1.0 U 21 0.78 ng/g-wet weight 6/24/98 HRI-98-04B (Chelsea) L3172-17 % Lipids 3.0 Percent 6/24/98 HRI-98-04B (Chelsea) L3172-17 Hexachlorobenzene 0.31 U 7 0.09 ng/g-wet weight 6/24/98 HRI-98-04B (Chelsea) L3172-17 alpha HCH ND U 0.15 ng/g-wet weight 6/24/98 HRI-98-04B (Chelsea) L3172-17 beta HCH ND U 0.21 ng/g-wet weight 6/24/98 HRI-98-04B (Chelsea) L3172-17 gamma HCH ND U 0.15 ng/g-wet weight 6/24/98 HRI-98-04B (Chelsea) L3172-17 delta HCH ND U 0.18 ng/g-wet weight 6/24/98 HRI-98-04B (Chelsea) L3172-17 Heptachlor ND U 2.3 ng/g-wet weight 6/24/98 HRI-98-04B (Chelsea) L3172-17 Aldrin ND U 0.26 ng/g-wet weight 6/24/98 HRI-98-04B (Chelsea) L3172-17 Oxychlordane ND U 1.8 ng/g-wet weight 6/24/98 HRI-98-04B (Chelsea) L3172-17 gamma-Chlordane (trans-) ND U 0.35 ng/g-wet weight 6/24/98 HRI-98-04B (Chelsea) L3172-17 alpha-Chlordane (cis-) ND U 0.3 ng/g-wet weight 6/24/98 HRI-98-04B (Chelsea) L3172-17 o,p'-DDE 0.19 U 21 0.12 ng/g-wet weight 6/24/98 HRI-98-04B (Chelsea) L3172-17 p,p'-DDE 29 0.14 ng/g-wet weight 6/24/98 HRI-98-04B (Chelsea) L3172-17 trans-Nonachlor 0.54 0.15 ng/g-wet weight 6/24/98 HRI-98-04B (Chelsea) L3172-17 o,p'-DDD 0.2 0.1 ng/g-wet weight 6/24/98 HRI-98-04B (Chelsea) L3172-17 p,p'-DDD 0.78 0.12 ng/g-wet weight 6/24/98 HRI-98-04B (Chelsea) L3172-17 o,p'-DDT 0.38 0.13 ng/g-wet weight 6/24/98 HRI-98-04B (Chelsea) L3172-17 p,p'-DDT 0.89 0.16 ng/g-wet weight 6/24/98 HRI-98-04B (Chelsea) L3172-17 Mirex ND U 0.18 ng/g-wet weight 6/24/98 HRI-98-04B (Chelsea) L3172-17 Photomirex R 5A 6/24/98 HRI-98-04B (Chelsea) L3172-17 Heptachlor Epoxide ND U 0.09 ng/g-wet weight 6/24/98 HRI-98-04B (Chelsea) L3172-17 alpha-Endosulphan (I) ND U 0.31 ng/g-wet weight 6/24/98 HRI-98-04B (Chelsea) L3172-17 Dieldrin 0.66 NJ 3 0.08 ng/g-wet weight 6/24/98 HRI-98-04B (Chelsea) L3172-17 Endrin ND UJ 10 0.2 ng/g-wet weight 6/24/98 HRI-98-04B (Chelsea) L3172-17 beta-Endosulphan (II) ND U 0.36 ng/g-wet weight 6/24/98 HRI-98-04B (Chelsea) L3172-17 Endrin Aldehyde 0.28 U 7 0.15 ng/g-wet weight 6/24/98 HRI-98-04B (Chelsea) L3172-17 Endosulphan Sulphate ND U 0.42 ng/g-wet weight 6/24/98 HRI-98-04B (Chelsea) L3172-17 Endrin Ketone ND U 0.09 ng/g-wet weight 6/24/98 HRI-98-04B (Chelsea) L3172-17 Methoxychlor ND UJ 10 0.38 ng/g-wet weight 6/24/98 HRI-98-04B (Chelsea) L3172-17 Aroclor 1242 58 NJ 14 1.3 ng/g-wet weight 6/24/98 HRI-98-04B (Chelsea) L3172-17 Aroclor 1248 ND U 1.3 ng/g-wet weight 6/24/98 HRI-98-04B (Chelsea) L3172-17 Aroclor 1254 130 NJ 14 1.9 ng/g-wet weight
*See Qualifier Codes table at end. Page 60 of 75

Aquatic Insects Pesticide and PCB Data
SAMPLING DATE FIELD ID LABORATORY ID ANALYTE VALUE INTERPRETIVE
QUALIFIER*
QUALIFIER REASON CODE*
DETECTION LIMIT
UNITS
6/24/98 HRI-98-04B (Chelsea) L3172-17 Aroclor 1260 41 NJ 14 5.7 ng/g-wet weight 6/24/98 HRI-98-04B (Chelsea) L3172-17 PCB-6 ND U 0.1 ng/g-wet weight 6/24/98 HRI-98-04B (Chelsea) L3172-17 PCB-4/10 0.35 U 21 0.10 ng/g-wet weight 6/24/98 HRI-98-04B (Chelsea) L3172-17 PCB-7/9 0.15 U 21 0.10 ng/g-wet weight 6/24/98 HRI-98-04B (Chelsea) L3172-17 PCB-8/5 0.41 0.10 ng/g-wet weight 6/24/98 HRI-98-04B (Chelsea) L3172-17 PCB-15 1.1 U 21 0.16 ng/g-wet weight 6/24/98 HRI-98-04B (Chelsea) L3172-17 PCB-19 0.46 0.09 ng/g-wet weight 6/24/98 HRI-98-04B (Chelsea) L3172-17 PCB-18 1.6 0.09 ng/g-wet weight 6/24/98 HRI-98-04B (Chelsea) L3172-17 PCB-17 2.1 0.09 ng/g-wet weight 6/24/98 HRI-98-04B (Chelsea) L3172-17 PCB-24/27 0.7 0.09 ng/g-wet weight 6/24/98 HRI-98-04B (Chelsea) L3172-17 PCB-16/32 1.8 0.09 ng/g-wet weight 6/24/98 HRI-98-04B (Chelsea) L3172-17 PCB-26 1.4 0.08 ng/g-wet weight 6/24/98 HRI-98-04B (Chelsea) L3172-17 PCB-25 0.72 0.08 ng/g-wet weight 6/24/98 HRI-98-04B (Chelsea) L3172-17 PCB-31/28 12 0.08 ng/g-wet weight 6/24/98 HRI-98-04B (Chelsea) L3172-17 PCB-33 /20 0.59 0.08 ng/g-wet weight 6/24/98 HRI-98-04B (Chelsea) L3172-17 PCB-22 0.49 0.08 ng/g-wet weight 6/24/98 HRI-98-04B (Chelsea) L3172-17 PCB-37 0.58 0.08 ng/g-wet weight 6/24/98 HRI-98-04B (Chelsea) L3172-17 PCB-53 1.2 0.16 ng/g-wet weight 6/24/98 HRI-98-04B (Chelsea) L3172-17 PCB-45 0.34 0.16 ng/g-wet weight 6/24/98 HRI-98-04B (Chelsea) L3172-17 PCB-46 0.19 U 21 0.16 ng/g-wet weight 6/24/98 HRI-98-04B (Chelsea) L3172-17 PCB-52 12 0.16 ng/g-wet weight 6/24/98 HRI-98-04B (Chelsea) L3172-17 PCB-49 16 0.2 ng/g-wet weight 6/24/98 HRI-98-04B (Chelsea) L3172-17 PCB-47/48 13 0.2 ng/g-wet weight 6/24/98 HRI-98-04B (Chelsea) L3172-17 PCB-44 3.7 0.19 ng/g-wet weight 6/24/98 HRI-98-04B (Chelsea) L3172-17 PCB-42 2.5 0.19 ng/g-wet weight 6/24/98 HRI-98-04B (Chelsea) L3172-17 PCB-41/71/64 9.4 0.19 ng/g-wet weight 6/24/98 HRI-98-04B (Chelsea) L3172-17 PCB-40 1.4 0.22 ng/g-wet weight 6/24/98 HRI-98-04B (Chelsea) L3172-17 PCB-74 /61 5.6 0.22 ng/g-wet weight 6/24/98 HRI-98-04B (Chelsea) L3172-17 PCB-70/76 7.9 0.22 ng/g-wet weight 6/24/98 HRI-98-04B (Chelsea) L3172-17 PCB-66 /80 4.9 0.13 ng/g-wet weight 6/24/98 HRI-98-04B (Chelsea) L3172-17 PCB-81 0.57 U 21 0.13 ng/g-wet weight 6/24/98 HRI-98-04B (Chelsea) L3172-17 PCB-56/60 2.3 0.13 ng/g-wet weight 6/24/98 HRI-98-04B (Chelsea) L3172-17 PCB-77 1.6 U 21 0.13 ng/g-wet weight 6/24/98 HRI-98-04B (Chelsea) L3172-17 PCB-95 3.6 0.05 ng/g-wet weight 6/24/98 HRI-98-04B (Chelsea) L3172-17 PCB-119 0.5 U 21 0.05 ng/g-wet weight
*See Qualifier Codes table at end. Page 61 of 75

Aquatic Insects Pesticide and PCB Data
SAMPLING DATE FIELD ID LABORATORY ID ANALYTE VALUE INTERPRETIVE
QUALIFIER*
QUALIFIER REASON CODE*
DETECTION LIMIT
UNITS
6/24/98 HRI-98-04B (Chelsea) L3172-17 PCB-91 1.2 0.05 ng/g-wet weight 6/24/98 HRI-98-04B (Chelsea) L3172-17 PCB-84 0.99 0.05 ng/g-wet weight 6/24/98 HRI-98-04B (Chelsea) L3172-17 PCB-90/101/89 9.3 0.05 ng/g-wet weight 6/24/98 HRI-98-04B (Chelsea) L3172-17 PCB-99 5.1 0.05 ng/g-wet weight 6/24/98 HRI-98-04B (Chelsea) L3172-17 PCB-83 1.1 U 21 0.08 ng/g-wet weight 6/24/98 HRI-98-04B (Chelsea) L3172-17 PCB-97 /86 2.2 0.08 ng/g-wet weight 6/24/98 HRI-98-04B (Chelsea) L3172-17 PCB-87 5.8 0.08 ng/g-wet weight 6/24/98 HRI-98-04B (Chelsea) L3172-17 PCB-85 2.1 0.08 ng/g-wet weight 6/24/98 HRI-98-04B (Chelsea) L3172-17 PCB-110 14 0.08 ng/g-wet weight 6/24/98 HRI-98-04B (Chelsea) L3172-17 PCB-82 0.41 0.05 ng/g-wet weight 6/24/98 HRI-98-04B (Chelsea) L3172-17 PCB-107 1.9 0.05 ng/g-wet weight 6/24/98 HRI-98-04B (Chelsea) L3172-17 PCB-114 0.34 0.05 ng/g-wet weight 6/24/98 HRI-98-04B (Chelsea) L3172-17 PCB-126 1.1 0.04 ng/g-wet weight 6/24/98 HRI-98-04B (Chelsea) L3172-17 PCB-136 0.79 0.36 ng/g-wet weight 6/24/98 HRI-98-04B (Chelsea) L3172-17 PCB-151 2.5 0.36 ng/g-wet weight 6/24/98 HRI-98-04B (Chelsea) L3172-17 PCB-144/135 1.9 0.36 ng/g-wet weight 6/24/98 HRI-98-04B (Chelsea) L3172-17 PCB-149 5.1 0.36 ng/g-wet weight 6/24/98 HRI-98-04B (Chelsea) L3172-17 PCB-134 /143 0.91 0.36 ng/g-wet weight 6/24/98 HRI-98-04B (Chelsea) L3172-17 PCB-131 ND U 0.36 ng/g-wet weight 6/24/98 HRI-98-04B (Chelsea) L3172-17 PCB-146 2.0 0.23 ng/g-wet weight 6/24/98 HRI-98-04B (Chelsea) L3172-17 PCB-118 7.1 0.05 ng/g-wet weight 6/24/98 HRI-98-04B (Chelsea) L3172-17 PCB-123 0.11 0.05 ng/g-wet weight 6/24/98 HRI-98-04B (Chelsea) L3172-17 PCB-105 1.9 0.04 ng/g-wet weight 6/24/98 HRI-98-04B (Chelsea) L3172-17 PCB-153 11 0.24 ng/g-wet weight 6/24/98 HRI-98-04B (Chelsea) L3172-17 PCB-132/168 1.3 0.38 ng/g-wet weight 6/24/98 HRI-98-04B (Chelsea) L3172-17 PCB-141 2.2 0.4 ng/g-wet weight 6/24/98 HRI-98-04B (Chelsea) L3172-17 PCB-130 0.89 0.3 ng/g-wet weight 6/24/98 HRI-98-04B (Chelsea) L3172-17 PCB-137 0.47 0.3 ng/g-wet weight 6/24/98 HRI-98-04B (Chelsea) L3172-17 PCB-138 15 0.3 ng/g-wet weight 6/24/98 HRI-98-04B (Chelsea) L3172-17 PCB-158 0.84 0.3 ng/g-wet weight 6/24/98 HRI-98-04B (Chelsea) L3172-17 PCB-129 ND U 0.3 ng/g-wet weight 6/24/98 HRI-98-04B (Chelsea) L3172-17 PCB-128 1.3 0.44 ng/g-wet weight 6/24/98 HRI-98-04B (Chelsea) L3172-17 PCB-167 0.61 U 21 0.3 ng/g-wet weight 6/24/98 HRI-98-04B (Chelsea) L3172-17 PCB-156 1.8 0.49 ng/g-wet weight 6/24/98 HRI-98-04B (Chelsea) L3172-17 PCB-157 0.55 0.49 ng/g-wet weight
*See Qualifier Codes table at end. Page 62 of 75

Aquatic Insects Pesticide and PCB Data
SAMPLING DATE FIELD ID LABORATORY ID ANALYTE VALUE INTERPRETIVE
QUALIFIER*
QUALIFIER REASON CODE*
DETECTION LIMIT
UNITS
6/24/98 HRI-98-04B (Chelsea) L3172-17 PCB-169 0.34 0.3 ng/g-wet weight 6/24/98 HRI-98-04B (Chelsea) L3172-17 PCB-184 ND U 0.3 ng/g-wet weight 6/24/98 HRI-98-04B (Chelsea) L3172-17 PCB-179 0.65 0.3 ng/g-wet weight 6/24/98 HRI-98-04B (Chelsea) L3172-17 PCB-176 ND U 0.3 ng/g-wet weight 6/24/98 HRI-98-04B (Chelsea) L3172-17 PCB-178 1.6 0.3 ng/g-wet weight 6/24/98 HRI-98-04B (Chelsea) L3172-17 PCB-175 ND U 0.3 ng/g-wet weight 6/24/98 HRI-98-04B (Chelsea) L3172-17 PCB-187/182 3.9 0.3 ng/g-wet weight 6/24/98 HRI-98-04B (Chelsea) L3172-17 PCB-183 0.68 0.35 ng/g-wet weight 6/24/98 HRI-98-04B (Chelsea) L3172-17 PCB-185 ND U 0.35 ng/g-wet weight 6/24/98 HRI-98-04B (Chelsea) L3172-17 PCB-174 /181 1.1 0.35 ng/g-wet weight 6/24/98 HRI-98-04B (Chelsea) L3172-17 PCB-177 0.85 0.35 ng/g-wet weight 6/24/98 HRI-98-04B (Chelsea) L3172-17 PCB-171 0.4 0.38 ng/g-wet weight 6/24/98 HRI-98-04B (Chelsea) L3172-17 PCB-172 1.1 0.34 ng/g-wet weight 6/24/98 HRI-98-04B (Chelsea) L3172-17 PCB-180 4.9 0.34 ng/g-wet weight 6/24/98 HRI-98-04B (Chelsea) L3172-17 PCB-193 0.82 0.34 ng/g-wet weight 6/24/98 HRI-98-04B (Chelsea) L3172-17 PCB-191 ND U 0.34 ng/g-wet weight 6/24/98 HRI-98-04B (Chelsea) L3172-17 PCB-170 /190 3.0 0.52 ng/g-wet weight 6/24/98 HRI-98-04B (Chelsea) L3172-17 PCB-189 ND U 0.52 ng/g-wet weight 6/24/98 HRI-98-04B (Chelsea) L3172-17 PCB-201 (BZ#200) ND U 0.27 ng/g-wet weight 6/24/98 HRI-98-04B (Chelsea) L3172-17 PCB-197 ND U 0.53 ng/g-wet weight 6/24/98 HRI-98-04B (Chelsea) L3172-17 PCB-200 (BZ#199) ND U 0.52 ng/g-wet weight 6/24/98 HRI-98-04B (Chelsea) L3172-17 PCB-198 ND U 0.53 ng/g-wet weight 6/24/98 HRI-98-04B (Chelsea) L3172-17 PCB-199 (BZ#201) 4.6 0.53 ng/g-wet weight 6/24/98 HRI-98-04B (Chelsea) L3172-17 PCB-196/203 1.1 0.51 ng/g-wet weight 6/24/98 HRI-98-04B (Chelsea) L3172-17 PCB-195 ND U 0.51 ng/g-wet weight 6/24/98 HRI-98-04B (Chelsea) L3172-17 PCB-194 3.3 0.75 ng/g-wet weight 6/24/98 HRI-98-04B (Chelsea) L3172-17 PCB-205 ND U 0.75 ng/g-wet weight 6/24/98 HRI-98-04B (Chelsea) L3172-17 PCB-208 0.39 U 21 0.31 ng/g-wet weight 6/24/98 HRI-98-04B (Chelsea) L3172-17 PCB-207 ND U 0.31 ng/g-wet weight 6/24/98 HRI-98-04B (Chelsea) L3172-17 PCB-206 1.2 0.31 ng/g-wet weight 6/24/98 HRI-98-04B (Chelsea) L3172-17 PCB-209 ND U 0.72 ng/g-wet weight 6/24/98 HRI-98-04C (Chelsea) L3172-18 % Lipids 3.1 Percent 6/24/98 HRI-98-04C (Chelsea) L3172-18 Hexachlorobenzene 0.35 U 7 0.06 ng/g-wet weight 6/24/98 HRI-98-04C (Chelsea) L3172-18 alpha HCH ND U 0.43 ng/g-wet weight 6/24/98 HRI-98-04C (Chelsea) L3172-18 beta HCH ND U 0.59 ng/g-wet weight
*See Qualifier Codes table at end. Page 63 of 75

Aquatic Insects Pesticide and PCB Data
SAMPLING DATE FIELD ID LABORATORY ID ANALYTE VALUE INTERPRETIVE
QUALIFIER*
QUALIFIER REASON CODE*
DETECTION LIMIT
UNITS
6/24/98 HRI-98-04C (Chelsea) L3172-18 gamma HCH ND U 0.43 ng/g-wet weight 6/24/98 HRI-98-04C (Chelsea) L3172-18 delta HCH ND U 0.43 ng/g-wet weight 6/24/98 HRI-98-04C (Chelsea) L3172-18 Heptachlor ND U 2.0 ng/g-wet weight 6/24/98 HRI-98-04C (Chelsea) L3172-18 Aldrin ND U 0.47 ng/g-wet weight 6/24/98 HRI-98-04C (Chelsea) L3172-18 Oxychlordane ND U 2.2 ng/g-wet weight 6/24/98 HRI-98-04C (Chelsea) L3172-18 gamma-Chlordane (trans-) ND U 0.42 ng/g-wet weight 6/24/98 HRI-98-04C (Chelsea) L3172-18 alpha-Chlordane (cis-) ND U 0.36 ng/g-wet weight 6/24/98 HRI-98-04C (Chelsea) L3172-18 o,p'-DDE 0.75 J 13 0.06 ng/g-wet weight 6/24/98 HRI-98-04C (Chelsea) L3172-18 p,p'-DDE 150 J 13 0.07 ng/g-wet weight 6/24/98 HRI-98-04C (Chelsea) L3172-18 trans-Nonachlor 0.93 0.24 ng/g-wet weight 6/24/98 HRI-98-04C (Chelsea) L3172-18 o,p'-DDD 0.83 0.07 ng/g-wet weight 6/24/98 HRI-98-04C (Chelsea) L3172-18 p,p'-DDD 1.3 0.08 ng/g-wet weight 6/24/98 HRI-98-04C (Chelsea) L3172-18 o,p'-DDT 1.8 0.10 ng/g-wet weight 6/24/98 HRI-98-04C (Chelsea) L3172-18 p,p'-DDT 1.1 0.12 ng/g-wet weight 6/24/98 HRI-98-04C (Chelsea) L3172-18 Mirex ND U 0.14 ng/g-wet weight 6/24/98 HRI-98-04C (Chelsea) L3172-18 Photomirex R 5A 6/24/98 HRI-98-04C (Chelsea) L3172-18 Heptachlor Epoxide ND U 0.2 ng/g-wet weight 6/24/98 HRI-98-04C (Chelsea) L3172-18 alpha-Endosulphan (I) ND U 0.17 ng/g-wet weight 6/24/98 HRI-98-04C (Chelsea) L3172-18 Dieldrin 4.9 NJ 3 0.11 ng/g-wet weight 6/24/98 HRI-98-04C (Chelsea) L3172-18 Endrin ND UJ 10 0.29 ng/g-wet weight 6/24/98 HRI-98-04C (Chelsea) L3172-18 beta-Endosulphan (II) ND U 0.2 ng/g-wet weight 6/24/98 HRI-98-04C (Chelsea) L3172-18 Endrin Aldehyde 0.3 U 7 0.22 ng/g-wet weight 6/24/98 HRI-98-04C (Chelsea) L3172-18 Endosulphan Sulphate ND U 0.23 ng/g-wet weight 6/24/98 HRI-98-04C (Chelsea) L3172-18 Endrin Ketone ND U 0.12 ng/g-wet weight 6/24/98 HRI-98-04C (Chelsea) L3172-18 Methoxychlor ND UJ 10 0.54 ng/g-wet weight 6/24/98 HRI-98-04C (Chelsea) L3172-18 Aroclor 1242 59 NJ 14 1.7 ng/g-wet weight 6/24/98 HRI-98-04C (Chelsea) L3172-18 Aroclor 1248 ND U 1.7 ng/g-wet weight 6/24/98 HRI-98-04C (Chelsea) L3172-18 Aroclor 1254 140 NJ 14 3.0 ng/g-wet weight 6/24/98 HRI-98-04C (Chelsea) L3172-18 Aroclor 1260 55 NJ 14 4.0 ng/g-wet weight 6/24/98 HRI-98-04C (Chelsea) L3172-18 PCB-6 ND U 0.04 ng/g-wet weight 6/24/98 HRI-98-04C (Chelsea) L3172-18 PCB-4/10 0.42 0.06 ng/g-wet weight 6/24/98 HRI-98-04C (Chelsea) L3172-18 PCB-7/9 0.2 U 21 0.06 ng/g-wet weight 6/24/98 HRI-98-04C (Chelsea) L3172-18 PCB-8/5 0.46 0.06 ng/g-wet weight 6/24/98 HRI-98-04C (Chelsea) L3172-18 PCB-15 1.0 U 21 0.10 ng/g-wet weight 6/24/98 HRI-98-04C (Chelsea) L3172-18 PCB-19 0.52 0.11 ng/g-wet weight
*See Qualifier Codes table at end. Page 64 of 75

Aquatic Insects Pesticide and PCB Data
SAMPLING DATE FIELD ID LABORATORY ID ANALYTE VALUE INTERPRETIVE
QUALIFIER*
QUALIFIER REASON CODE*
DETECTION LIMIT
UNITS
6/24/98 HRI-98-04C (Chelsea) L3172-18 PCB-18 2.0 0.11 ng/g-wet weight 6/24/98 HRI-98-04C (Chelsea) L3172-18 PCB-17 2.6 0.11 ng/g-wet weight 6/24/98 HRI-98-04C (Chelsea) L3172-18 PCB-24/27 0.94 0.11 ng/g-wet weight 6/24/98 HRI-98-04C (Chelsea) L3172-18 PCB-16/32 2.0 0.11 ng/g-wet weight 6/24/98 HRI-98-04C (Chelsea) L3172-18 PCB-26 1.4 0.09 ng/g-wet weight 6/24/98 HRI-98-04C (Chelsea) L3172-18 PCB-25 0.72 0.09 ng/g-wet weight 6/24/98 HRI-98-04C (Chelsea) L3172-18 PCB-31/28 11 0.09 ng/g-wet weight 6/24/98 HRI-98-04C (Chelsea) L3172-18 PCB-33 /20 0.71 0.09 ng/g-wet weight 6/24/98 HRI-98-04C (Chelsea) L3172-18 PCB-22 0.56 0.09 ng/g-wet weight 6/24/98 HRI-98-04C (Chelsea) L3172-18 PCB-37 0.60 0.09 ng/g-wet weight 6/24/98 HRI-98-04C (Chelsea) L3172-18 PCB-53 1.6 0.13 ng/g-wet weight 6/24/98 HRI-98-04C (Chelsea) L3172-18 PCB-45 0.49 0.13 ng/g-wet weight 6/24/98 HRI-98-04C (Chelsea) L3172-18 PCB-46 0.24 0.13 ng/g-wet weight 6/24/98 HRI-98-04C (Chelsea) L3172-18 PCB-52 13 0.13 ng/g-wet weight 6/24/98 HRI-98-04C (Chelsea) L3172-18 PCB-49 19 0.16 ng/g-wet weight 6/24/98 HRI-98-04C (Chelsea) L3172-18 PCB-47/48 15 0.16 ng/g-wet weight 6/24/98 HRI-98-04C (Chelsea) L3172-18 PCB-44 4.3 0.16 ng/g-wet weight 6/24/98 HRI-98-04C (Chelsea) L3172-18 PCB-42 3.2 0.16 ng/g-wet weight 6/24/98 HRI-98-04C (Chelsea) L3172-18 PCB-41/71/64 9.9 0.16 ng/g-wet weight 6/24/98 HRI-98-04C (Chelsea) L3172-18 PCB-40 1.6 0.18 ng/g-wet weight 6/24/98 HRI-98-04C (Chelsea) L3172-18 PCB-74 /61 5.9 0.18 ng/g-wet weight 6/24/98 HRI-98-04C (Chelsea) L3172-18 PCB-70/76 7.8 0.18 ng/g-wet weight 6/24/98 HRI-98-04C (Chelsea) L3172-18 PCB-66 /80 5.2 0.11 ng/g-wet weight 6/24/98 HRI-98-04C (Chelsea) L3172-18 PCB-81 0.53 U 21 0.11 ng/g-wet weight 6/24/98 HRI-98-04C (Chelsea) L3172-18 PCB-56/60 2.5 0.11 ng/g-wet weight 6/24/98 HRI-98-04C (Chelsea) L3172-18 PCB-77 1.9 U 21 0.11 ng/g-wet weight 6/24/98 HRI-98-04C (Chelsea) L3172-18 PCB-95 4.2 0.07 ng/g-wet weight 6/24/98 HRI-98-04C (Chelsea) L3172-18 PCB-119 0.58 0.07 ng/g-wet weight 6/24/98 HRI-98-04C (Chelsea) L3172-18 PCB-91 1.2 0.07 ng/g-wet weight 6/24/98 HRI-98-04C (Chelsea) L3172-18 PCB-84 1.0 0.07 ng/g-wet weight 6/24/98 HRI-98-04C (Chelsea) L3172-18 PCB-90/101/89 11 0.07 ng/g-wet weight 6/24/98 HRI-98-04C (Chelsea) L3172-18 PCB-99 5.4 0.07 ng/g-wet weight 6/24/98 HRI-98-04C (Chelsea) L3172-18 PCB-83 1.1 0.12 ng/g-wet weight 6/24/98 HRI-98-04C (Chelsea) L3172-18 PCB-97 /86 2.4 0.12 ng/g-wet weight 6/24/98 HRI-98-04C (Chelsea) L3172-18 PCB-87 5.8 0.12 ng/g-wet weight
*See Qualifier Codes table at end. Page 65 of 75

Aquatic Insects Pesticide and PCB Data
SAMPLING DATE FIELD ID LABORATORY ID ANALYTE VALUE INTERPRETIVE
QUALIFIER*
QUALIFIER REASON CODE*
DETECTION LIMIT
UNITS
6/24/98 HRI-98-04C (Chelsea) L3172-18 PCB-85 2.8 0.12 ng/g-wet weight 6/24/98 HRI-98-04C (Chelsea) L3172-18 PCB-110 14 0.12 ng/g-wet weight 6/24/98 HRI-98-04C (Chelsea) L3172-18 PCB-82 0.41 0.07 ng/g-wet weight 6/24/98 HRI-98-04C (Chelsea) L3172-18 PCB-107 1.8 0.07 ng/g-wet weight 6/24/98 HRI-98-04C (Chelsea) L3172-18 PCB-114 0.34 0.07 ng/g-wet weight 6/24/98 HRI-98-04C (Chelsea) L3172-18 PCB-126 1.1 0.07 ng/g-wet weight 6/24/98 HRI-98-04C (Chelsea) L3172-18 PCB-136 0.87 U 21 0.24 ng/g-wet weight 6/24/98 HRI-98-04C (Chelsea) L3172-18 PCB-151 3.0 0.24 ng/g-wet weight 6/24/98 HRI-98-04C (Chelsea) L3172-18 PCB-144/135 2.2 0.24 ng/g-wet weight 6/24/98 HRI-98-04C (Chelsea) L3172-18 PCB-149 6.1 0.24 ng/g-wet weight 6/24/98 HRI-98-04C (Chelsea) L3172-18 PCB-134 /143 1.1 0.24 ng/g-wet weight 6/24/98 HRI-98-04C (Chelsea) L3172-18 PCB-131 ND U 0.24 ng/g-wet weight 6/24/98 HRI-98-04C (Chelsea) L3172-18 PCB-146 2.3 0.16 ng/g-wet weight 6/24/98 HRI-98-04C (Chelsea) L3172-18 PCB-118 7.5 0.08 ng/g-wet weight 6/24/98 HRI-98-04C (Chelsea) L3172-18 PCB-123 0.12 0.08 ng/g-wet weight 6/24/98 HRI-98-04C (Chelsea) L3172-18 PCB-105 2.1 0.08 ng/g-wet weight 6/24/98 HRI-98-04C (Chelsea) L3172-18 PCB-153 13 0.18 ng/g-wet weight 6/24/98 HRI-98-04C (Chelsea) L3172-18 PCB-132/168 1.3 0.27 ng/g-wet weight 6/24/98 HRI-98-04C (Chelsea) L3172-18 PCB-141 2.3 U 21 0.29 ng/g-wet weight 6/24/98 HRI-98-04C (Chelsea) L3172-18 PCB-130 1.2 0.21 ng/g-wet weight 6/24/98 HRI-98-04C (Chelsea) L3172-18 PCB-137 0.65 0.21 ng/g-wet weight 6/24/98 HRI-98-04C (Chelsea) L3172-18 PCB-138 17 0.21 ng/g-wet weight 6/24/98 HRI-98-04C (Chelsea) L3172-18 PCB-158 0.7 0.21 ng/g-wet weight 6/24/98 HRI-98-04C (Chelsea) L3172-18 PCB-129 0.63 0.21 ng/g-wet weight 6/24/98 HRI-98-04C (Chelsea) L3172-18 PCB-128 1.1 0.31 ng/g-wet weight 6/24/98 HRI-98-04C (Chelsea) L3172-18 PCB-167 0.65 U 21 0.21 ng/g-wet weight 6/24/98 HRI-98-04C (Chelsea) L3172-18 PCB-156 1.6 0.35 ng/g-wet weight 6/24/98 HRI-98-04C (Chelsea) L3172-18 PCB-157 0.65 0.35 ng/g-wet weight 6/24/98 HRI-98-04C (Chelsea) L3172-18 PCB-169 0.43 0.21 ng/g-wet weight 6/24/98 HRI-98-04C (Chelsea) L3172-18 PCB-184 ND U 0.21 ng/g-wet weight 6/24/98 HRI-98-04C (Chelsea) L3172-18 PCB-179 0.89 0.21 ng/g-wet weight 6/24/98 HRI-98-04C (Chelsea) L3172-18 PCB-176 ND U 0.21 ng/g-wet weight 6/24/98 HRI-98-04C (Chelsea) L3172-18 PCB-178 2.2 0.21 ng/g-wet weight 6/24/98 HRI-98-04C (Chelsea) L3172-18 PCB-175 ND U 0.21 ng/g-wet weight 6/24/98 HRI-98-04C (Chelsea) L3172-18 PCB-187/182 5.9 0.21 ng/g-wet weight
*See Qualifier Codes table at end. Page 66 of 75

Aquatic Insects Pesticide and PCB Data
SAMPLING DATE FIELD ID LABORATORY ID ANALYTE VALUE INTERPRETIVE
QUALIFIER*
QUALIFIER REASON CODE*
DETECTION LIMIT
UNITS
6/24/98 HRI-98-04C (Chelsea) L3172-18 PCB-183 0.87 0.24 ng/g-wet weight 6/24/98 HRI-98-04C (Chelsea) L3172-18 PCB-185 0.28 0.24 ng/g-wet weight 6/24/98 HRI-98-04C (Chelsea) L3172-18 PCB-174 /181 1.8 0.24 ng/g-wet weight 6/24/98 HRI-98-04C (Chelsea) L3172-18 PCB-177 1.3 0.24 ng/g-wet weight 6/24/98 HRI-98-04C (Chelsea) L3172-18 PCB-171 0.62 0.26 ng/g-wet weight 6/24/98 HRI-98-04C (Chelsea) L3172-18 PCB-172 0.96 0.24 ng/g-wet weight 6/24/98 HRI-98-04C (Chelsea) L3172-18 PCB-180 6.5 0.24 ng/g-wet weight 6/24/98 HRI-98-04C (Chelsea) L3172-18 PCB-193 1.2 0.24 ng/g-wet weight 6/24/98 HRI-98-04C (Chelsea) L3172-18 PCB-191 0.32 0.24 ng/g-wet weight 6/24/98 HRI-98-04C (Chelsea) L3172-18 PCB-170 /190 3.9 0.37 ng/g-wet weight 6/24/98 HRI-98-04C (Chelsea) L3172-18 PCB-189 ND U 0.37 ng/g-wet weight 6/24/98 HRI-98-04C (Chelsea) L3172-18 PCB-201 (BZ#200) ND U 0.18 ng/g-wet weight 6/24/98 HRI-98-04C (Chelsea) L3172-18 PCB-197 ND U 0.36 ng/g-wet weight 6/24/98 HRI-98-04C (Chelsea) L3172-18 PCB-200 (BZ#199) ND U 0.36 ng/g-wet weight 6/24/98 HRI-98-04C (Chelsea) L3172-18 PCB-198 0.49 0.36 ng/g-wet weight 6/24/98 HRI-98-04C (Chelsea) L3172-18 PCB-199 (BZ#201) 7.3 0.36 ng/g-wet weight 6/24/98 HRI-98-04C (Chelsea) L3172-18 PCB-196/203 1.7 0.35 ng/g-wet weight 6/24/98 HRI-98-04C (Chelsea) L3172-18 PCB-195 0.69 U 21 0.35 ng/g-wet weight 6/24/98 HRI-98-04C (Chelsea) L3172-18 PCB-194 4.8 0.51 ng/g-wet weight 6/24/98 HRI-98-04C (Chelsea) L3172-18 PCB-205 0.61 U 21 0.51 ng/g-wet weight 6/24/98 HRI-98-04C (Chelsea) L3172-18 PCB-208 1.0 0.47 ng/g-wet weight 6/24/98 HRI-98-04C (Chelsea) L3172-18 PCB-207 ND U 0.47 ng/g-wet weight 6/24/98 HRI-98-04C (Chelsea) L3172-18 PCB-206 1.5 U 21 0.47 ng/g-wet weight 6/24/98 HRI-98-04C (Chelsea) L3172-18 PCB-209 0.66 U 21 0.46 ng/g-wet weight 6/24/98 HRI-98-04D (Chelsea) L3172-19 % Lipids 3.1 Percent 6/24/98 HRI-98-04D (Chelsea) L3172-19 Hexachlorobenzene 0.3 U 7 0.15 ng/g-wet weight 6/24/98 HRI-98-04D (Chelsea) L3172-19 alpha HCH ND U 0.41 ng/g-wet weight 6/24/98 HRI-98-04D (Chelsea) L3172-19 beta HCH ND U 0.56 ng/g-wet weight 6/24/98 HRI-98-04D (Chelsea) L3172-19 gamma HCH ND U 0.41 ng/g-wet weight 6/24/98 HRI-98-04D (Chelsea) L3172-19 delta HCH ND U 0.41 ng/g-wet weight 6/24/98 HRI-98-04D (Chelsea) L3172-19 Heptachlor ND U 2.2 ng/g-wet weight 6/24/98 HRI-98-04D (Chelsea) L3172-19 Aldrin ND U 0.41 ng/g-wet weight 6/24/98 HRI-98-04D (Chelsea) L3172-19 Oxychlordane ND U 1.2 ng/g-wet weight 6/24/98 HRI-98-04D (Chelsea) L3172-19 gamma-Chlordane (trans-) ND U 0.24 ng/g-wet weight 6/24/98 HRI-98-04D (Chelsea) L3172-19 alpha-Chlordane (cis-) ND U 0.2 ng/g-wet weight
*See Qualifier Codes table at end. Page 67 of 75

Aquatic Insects Pesticide and PCB Data
SAMPLING DATE FIELD ID LABORATORY ID ANALYTE VALUE INTERPRETIVE
QUALIFIER*
QUALIFIER REASON CODE*
DETECTION LIMIT
UNITS
6/24/98 HRI-98-04D (Chelsea) L3172-19 o,p'-DDE 0.36 0.09 ng/g-wet weight 6/24/98 HRI-98-04D (Chelsea) L3172-19 p,p'-DDE 53 0.11 ng/g-wet weight 6/24/98 HRI-98-04D (Chelsea) L3172-19 trans-Nonachlor 0.64 0.23 ng/g-wet weight 6/24/98 HRI-98-04D (Chelsea) L3172-19 o,p'-DDD 0.34 0.05 ng/g-wet weight 6/24/98 HRI-98-04D (Chelsea) L3172-19 p,p'-DDD 0.88 0.05 ng/g-wet weight 6/24/98 HRI-98-04D (Chelsea) L3172-19 o,p'-DDT 0.76 0.11 ng/g-wet weight 6/24/98 HRI-98-04D (Chelsea) L3172-19 p,p'-DDT 0.71 0.14 ng/g-wet weight 6/24/98 HRI-98-04D (Chelsea) L3172-19 Mirex ND U 0.18 ng/g-wet weight 6/24/98 HRI-98-04D (Chelsea) L3172-19 Photomirex R 5A 6/24/98 HRI-98-04D (Chelsea) L3172-19 Heptachlor Epoxide ND U 0.25 ng/g-wet weight 6/24/98 HRI-98-04D (Chelsea) L3172-19 alpha-Endosulphan (I) ND U 0.28 ng/g-wet weight 6/24/98 HRI-98-04D (Chelsea) L3172-19 Dieldrin 1.4 NJ 3 0.12 ng/g-wet weight 6/24/98 HRI-98-04D (Chelsea) L3172-19 Endrin ND UJ 10 0.32 ng/g-wet weight 6/24/98 HRI-98-04D (Chelsea) L3172-19 beta-Endosulphan (II) ND U 0.32 ng/g-wet weight 6/24/98 HRI-98-04D (Chelsea) L3172-19 Endrin Aldehyde 0.29 U 7 0.24 ng/g-wet weight 6/24/98 HRI-98-04D (Chelsea) L3172-19 Endosulphan Sulphate ND U 0.38 ng/g-wet weight 6/24/98 HRI-98-04D (Chelsea) L3172-19 Endrin Ketone ND U 0.14 ng/g-wet weight 6/24/98 HRI-98-04D (Chelsea) L3172-19 Methoxychlor ND UJ 10 0.59 ng/g-wet weight 6/24/98 HRI-98-04D (Chelsea) L3172-19 Aroclor 1242 54 NJ 14 1.4 ng/g-wet weight 6/24/98 HRI-98-04D (Chelsea) L3172-19 Aroclor 1248 ND U 1.4 ng/g-wet weight 6/24/98 HRI-98-04D (Chelsea) L3172-19 Aroclor 1254 130 NJ 14 2.0 ng/g-wet weight 6/24/98 HRI-98-04D (Chelsea) L3172-19 Aroclor 1260 52 NJ 14 2.4 ng/g-wet weight 6/24/98 HRI-98-04D (Chelsea) L3172-19 PCB-6 ND U 0.08 ng/g-wet weight 6/24/98 HRI-98-04D (Chelsea) L3172-19 PCB-4/10 0.38 0.05 ng/g-wet weight 6/24/98 HRI-98-04D (Chelsea) L3172-19 PCB-7/9 0.4 U 21 0.05 ng/g-wet weight 6/24/98 HRI-98-04D (Chelsea) L3172-19 PCB-8/5 0.34 0.05 ng/g-wet weight 6/24/98 HRI-98-04D (Chelsea) L3172-19 PCB-15 0.87 0.07 ng/g-wet weight 6/24/98 HRI-98-04D (Chelsea) L3172-19 PCB-19 0.54 0.10 ng/g-wet weight 6/24/98 HRI-98-04D (Chelsea) L3172-19 PCB-18 1.6 0.10 ng/g-wet weight 6/24/98 HRI-98-04D (Chelsea) L3172-19 PCB-17 2.0 0.10 ng/g-wet weight 6/24/98 HRI-98-04D (Chelsea) L3172-19 PCB-24/27 0.71 0.10 ng/g-wet weight 6/24/98 HRI-98-04D (Chelsea) L3172-19 PCB-16/32 1.9 0.10 ng/g-wet weight 6/24/98 HRI-98-04D (Chelsea) L3172-19 PCB-26 1.2 0.08 ng/g-wet weight 6/24/98 HRI-98-04D (Chelsea) L3172-19 PCB-25 0.74 0.08 ng/g-wet weight 6/24/98 HRI-98-04D (Chelsea) L3172-19 PCB-31/28 11 0.08 ng/g-wet weight
*See Qualifier Codes table at end. Page 68 of 75

Aquatic Insects Pesticide and PCB Data
SAMPLING DATE FIELD ID LABORATORY ID ANALYTE VALUE INTERPRETIVE
QUALIFIER*
QUALIFIER REASON CODE*
DETECTION LIMIT
UNITS
6/24/98 HRI-98-04D (Chelsea) L3172-19 PCB-33 /20 0.67 0.08 ng/g-wet weight 6/24/98 HRI-98-04D (Chelsea) L3172-19 PCB-22 0.52 0.08 ng/g-wet weight 6/24/98 HRI-98-04D (Chelsea) L3172-19 PCB-37 0.56 0.08 ng/g-wet weight 6/24/98 HRI-98-04D (Chelsea) L3172-19 PCB-53 1.3 0.15 ng/g-wet weight 6/24/98 HRI-98-04D (Chelsea) L3172-19 PCB-45 0.44 U 21 0.15 ng/g-wet weight 6/24/98 HRI-98-04D (Chelsea) L3172-19 PCB-46 0.22 0.15 ng/g-wet weight 6/24/98 HRI-98-04D (Chelsea) L3172-19 PCB-52 11 0.15 ng/g-wet weight 6/24/98 HRI-98-04D (Chelsea) L3172-19 PCB-49 16 0.19 ng/g-wet weight 6/24/98 HRI-98-04D (Chelsea) L3172-19 PCB-47/48 13 0.19 ng/g-wet weight 6/24/98 HRI-98-04D (Chelsea) L3172-19 PCB-44 3.7 0.18 ng/g-wet weight 6/24/98 HRI-98-04D (Chelsea) L3172-19 PCB-42 2.7 0.18 ng/g-wet weight 6/24/98 HRI-98-04D (Chelsea) L3172-19 PCB-41/71/64 9 0.18 ng/g-wet weight 6/24/98 HRI-98-04D (Chelsea) L3172-19 PCB-40 1.4 0.21 ng/g-wet weight 6/24/98 HRI-98-04D (Chelsea) L3172-19 PCB-74 /61 5.4 0.21 ng/g-wet weight 6/24/98 HRI-98-04D (Chelsea) L3172-19 PCB-70/76 7.1 0.21 ng/g-wet weight 6/24/98 HRI-98-04D (Chelsea) L3172-19 PCB-66 /80 4.6 0.12 ng/g-wet weight 6/24/98 HRI-98-04D (Chelsea) L3172-19 PCB-81 0.58 U 21 0.12 ng/g-wet weight 6/24/98 HRI-98-04D (Chelsea) L3172-19 PCB-56/60 2.3 0.12 ng/g-wet weight 6/24/98 HRI-98-04D (Chelsea) L3172-19 PCB-77 1.6 U 21 0.12 ng/g-wet weight 6/24/98 HRI-98-04D (Chelsea) L3172-19 PCB-95 3.6 0.05 ng/g-wet weight 6/24/98 HRI-98-04D (Chelsea) L3172-19 PCB-119 0.53 0.05 ng/g-wet weight 6/24/98 HRI-98-04D (Chelsea) L3172-19 PCB-91 1.1 0.05 ng/g-wet weight 6/24/98 HRI-98-04D (Chelsea) L3172-19 PCB-84 0.82 0.05 ng/g-wet weight 6/24/98 HRI-98-04D (Chelsea) L3172-19 PCB-90/101/89 9.2 0.05 ng/g-wet weight 6/24/98 HRI-98-04D (Chelsea) L3172-19 PCB-99 4.9 0.05 ng/g-wet weight 6/24/98 HRI-98-04D (Chelsea) L3172-19 PCB-83 1.2 0.08 ng/g-wet weight 6/24/98 HRI-98-04D (Chelsea) L3172-19 PCB-97 /86 2.1 0.08 ng/g-wet weight 6/24/98 HRI-98-04D (Chelsea) L3172-19 PCB-87 5.7 0.08 ng/g-wet weight 6/24/98 HRI-98-04D (Chelsea) L3172-19 PCB-85 2.6 0.08 ng/g-wet weight 6/24/98 HRI-98-04D (Chelsea) L3172-19 PCB-110 12 0.08 ng/g-wet weight 6/24/98 HRI-98-04D (Chelsea) L3172-19 PCB-82 0.4 0.05 ng/g-wet weight 6/24/98 HRI-98-04D (Chelsea) L3172-19 PCB-107 1.8 0.05 ng/g-wet weight 6/24/98 HRI-98-04D (Chelsea) L3172-19 PCB-114 0.29 0.05 ng/g-wet weight 6/24/98 HRI-98-04D (Chelsea) L3172-19 PCB-126 1.1 0.04 ng/g-wet weight 6/24/98 HRI-98-04D (Chelsea) L3172-19 PCB-136 0.77 0.11 ng/g-wet weight
*See Qualifier Codes table at end. Page 69 of 75

Aquatic Insects Pesticide and PCB Data
SAMPLING DATE FIELD ID LABORATORY ID ANALYTE VALUE INTERPRETIVE
QUALIFIER*
QUALIFIER REASON CODE*
DETECTION LIMIT
UNITS
6/24/98 HRI-98-04D (Chelsea) L3172-19 PCB-151 3.0 0.11 ng/g-wet weight 6/24/98 HRI-98-04D (Chelsea) L3172-19 PCB-144/135 2.2 0.11 ng/g-wet weight 6/24/98 HRI-98-04D (Chelsea) L3172-19 PCB-149 5.4 0.11 ng/g-wet weight 6/24/98 HRI-98-04D (Chelsea) L3172-19 PCB-134 /143 1.0 0.11 ng/g-wet weight 6/24/98 HRI-98-04D (Chelsea) L3172-19 PCB-131 ND U 0.11 ng/g-wet weight 6/24/98 HRI-98-04D (Chelsea) L3172-19 PCB-146 2.0 0.07 ng/g-wet weight 6/24/98 HRI-98-04D (Chelsea) L3172-19 PCB-118 6.9 0.06 ng/g-wet weight 6/24/98 HRI-98-04D (Chelsea) L3172-19 PCB-123 0.14 0.06 ng/g-wet weight 6/24/98 HRI-98-04D (Chelsea) L3172-19 PCB-105 2.0 0.05 ng/g-wet weight 6/24/98 HRI-98-04D (Chelsea) L3172-19 PCB-153 11 0.08 ng/g-wet weight 6/24/98 HRI-98-04D (Chelsea) L3172-19 PCB-132/168 1.2 0.12 ng/g-wet weight 6/24/98 HRI-98-04D (Chelsea) L3172-19 PCB-141 2.2 0.13 ng/g-wet weight 6/24/98 HRI-98-04D (Chelsea) L3172-19 PCB-130 0.94 0.10 ng/g-wet weight 6/24/98 HRI-98-04D (Chelsea) L3172-19 PCB-137 0.55 0.10 ng/g-wet weight 6/24/98 HRI-98-04D (Chelsea) L3172-19 PCB-138 16 0.10 ng/g-wet weight 6/24/98 HRI-98-04D (Chelsea) L3172-19 PCB-158 0.76 0.10 ng/g-wet weight 6/24/98 HRI-98-04D (Chelsea) L3172-19 PCB-129 0.68 0.10 ng/g-wet weight 6/24/98 HRI-98-04D (Chelsea) L3172-19 PCB-128 1.3 0.14 ng/g-wet weight 6/24/98 HRI-98-04D (Chelsea) L3172-19 PCB-167 0.73 U 21 0.10 ng/g-wet weight 6/24/98 HRI-98-04D (Chelsea) L3172-19 PCB-156 1.9 0.16 ng/g-wet weight 6/24/98 HRI-98-04D (Chelsea) L3172-19 PCB-157 0.62 0.16 ng/g-wet weight 6/24/98 HRI-98-04D (Chelsea) L3172-19 PCB-169 0.38 0.10 ng/g-wet weight 6/24/98 HRI-98-04D (Chelsea) L3172-19 PCB-184 ND U 0.13 ng/g-wet weight 6/24/98 HRI-98-04D (Chelsea) L3172-19 PCB-179 0.84 0.13 ng/g-wet weight 6/24/98 HRI-98-04D (Chelsea) L3172-19 PCB-176 ND U 0.13 ng/g-wet weight 6/24/98 HRI-98-04D (Chelsea) L3172-19 PCB-178 2.0 0.13 ng/g-wet weight 6/24/98 HRI-98-04D (Chelsea) L3172-19 PCB-175 0.2 0.13 ng/g-wet weight 6/24/98 HRI-98-04D (Chelsea) L3172-19 PCB-187/182 4.9 0.13 ng/g-wet weight 6/24/98 HRI-98-04D (Chelsea) L3172-19 PCB-183 0.83 0.15 ng/g-wet weight 6/24/98 HRI-98-04D (Chelsea) L3172-19 PCB-185 0.28 0.15 ng/g-wet weight 6/24/98 HRI-98-04D (Chelsea) L3172-19 PCB-174 /181 1.6 0.15 ng/g-wet weight 6/24/98 HRI-98-04D (Chelsea) L3172-19 PCB-177 1.1 0.15 ng/g-wet weight 6/24/98 HRI-98-04D (Chelsea) L3172-19 PCB-171 0.44 0.16 ng/g-wet weight 6/24/98 HRI-98-04D (Chelsea) L3172-19 PCB-172 1.3 0.15 ng/g-wet weight 6/24/98 HRI-98-04D (Chelsea) L3172-19 PCB-180 6.2 0.15 ng/g-wet weight
*See Qualifier Codes table at end. Page 70 of 75

Aquatic Insects Pesticide and PCB Data
SAMPLING DATE FIELD ID LABORATORY ID ANALYTE VALUE INTERPRETIVE
QUALIFIER*
QUALIFIER REASON CODE*
DETECTION LIMIT
UNITS
6/24/98 HRI-98-04D (Chelsea) L3172-19 PCB-193 0.99 0.15 ng/g-wet weight 6/24/98 HRI-98-04D (Chelsea) L3172-19 PCB-191 0.26 0.15 ng/g-wet weight 6/24/98 HRI-98-04D (Chelsea) L3172-19 PCB-170 /190 3.6 0.23 ng/g-wet weight 6/24/98 HRI-98-04D (Chelsea) L3172-19 PCB-189 0.3 0.23 ng/g-wet weight 6/24/98 HRI-98-04D (Chelsea) L3172-19 PCB-201 (BZ#200) ND U 0.26 ng/g-wet weight 6/24/98 HRI-98-04D (Chelsea) L3172-19 PCB-197 ND U 0.51 ng/g-wet weight 6/24/98 HRI-98-04D (Chelsea) L3172-19 PCB-200 (BZ#199) ND U 0.51 ng/g-wet weight 6/24/98 HRI-98-04D (Chelsea) L3172-19 PCB-198 ND U 0.51 ng/g-wet weight 6/24/98 HRI-98-04D (Chelsea) L3172-19 PCB-199 (BZ#201) 6.6 0.51 ng/g-wet weight 6/24/98 HRI-98-04D (Chelsea) L3172-19 PCB-196/203 1.8 0.5 ng/g-wet weight 6/24/98 HRI-98-04D (Chelsea) L3172-19 PCB-195 0.85 0.5 ng/g-wet weight 6/24/98 HRI-98-04D (Chelsea) L3172-19 PCB-194 4.9 0.73 ng/g-wet weight 6/24/98 HRI-98-04D (Chelsea) L3172-19 PCB-205 ND U 0.73 ng/g-wet weight 6/24/98 HRI-98-04D (Chelsea) L3172-19 PCB-208 1.2 0.37 ng/g-wet weight 6/24/98 HRI-98-04D (Chelsea) L3172-19 PCB-207 ND U 0.37 ng/g-wet weight 6/24/98 HRI-98-04D (Chelsea) L3172-19 PCB-206 1.7 0.37 ng/g-wet weight 6/24/98 HRI-98-04D (Chelsea) L3172-19 PCB-209 0.62 U 21 0.39 ng/g-wet weight 6/24/98 HRI-98-04E (Chelsea) L3172-20 % Lipids 3.2 Percent 6/24/98 HRI-98-04E (Chelsea) L3172-20 Hexachlorobenzene 0.32 U 7 0.15 ng/g-wet weight 6/24/98 HRI-98-04E (Chelsea) L3172-20 alpha HCH ND U 0.3 ng/g-wet weight 6/24/98 HRI-98-04E (Chelsea) L3172-20 beta HCH ND U 0.41 ng/g-wet weight 6/24/98 HRI-98-04E (Chelsea) L3172-20 gamma HCH ND U 0.3 ng/g-wet weight 6/24/98 HRI-98-04E (Chelsea) L3172-20 delta HCH ND U 0.3 ng/g-wet weight 6/24/98 HRI-98-04E (Chelsea) L3172-20 Heptachlor ND U 1.5 ng/g-wet weight 6/24/98 HRI-98-04E (Chelsea) L3172-20 Aldrin ND U 0.5 ng/g-wet weight 6/24/98 HRI-98-04E (Chelsea) L3172-20 Oxychlordane ND U 1.8 ng/g-wet weight 6/24/98 HRI-98-04E (Chelsea) L3172-20 gamma-Chlordane (trans-) ND U 0.29 ng/g-wet weight 6/24/98 HRI-98-04E (Chelsea) L3172-20 alpha-Chlordane (cis-) ND U 0.25 ng/g-wet weight 6/24/98 HRI-98-04E (Chelsea) L3172-20 o,p'-DDE 0.42 0.08 ng/g-wet weight 6/24/98 HRI-98-04E (Chelsea) L3172-20 p,p'-DDE 67 0.10 ng/g-wet weight 6/24/98 HRI-98-04E (Chelsea) L3172-20 trans-Nonachlor 0.95 0.12 ng/g-wet weight 6/24/98 HRI-98-04E (Chelsea) L3172-20 o,p'-DDD 0.4 U 21 0.05 ng/g-wet weight 6/24/98 HRI-98-04E (Chelsea) L3172-20 p,p'-DDD 0.99 0.06 ng/g-wet weight 6/24/98 HRI-98-04E (Chelsea) L3172-20 o,p'-DDT 0.74 0.11 ng/g-wet weight 6/24/98 HRI-98-04E (Chelsea) L3172-20 p,p'-DDT 1.0 0.15 ng/g-wet weight
*See Qualifier Codes table at end. Page 71 of 75

Aquatic Insects Pesticide and PCB Data
SAMPLING DATE FIELD ID LABORATORY ID ANALYTE VALUE INTERPRETIVE
QUALIFIER*
QUALIFIER REASON CODE*
DETECTION LIMIT
UNITS
6/24/98 HRI-98-04E (Chelsea) L3172-20 Mirex ND U 0.17 ng/g-wet weight 6/24/98 HRI-98-04E (Chelsea) L3172-20 Photomirex R 5A 6/24/98 HRI-98-04E (Chelsea) L3172-20 Heptachlor Epoxide ND U 0.2 ng/g-wet weight 6/24/98 HRI-98-04E (Chelsea) L3172-20 alpha-Endosulphan (I) ND U 0.19 ng/g-wet weight 6/24/98 HRI-98-04E (Chelsea) L3172-20 Dieldrin 3.9 NJ 3 0.13 ng/g-wet weight 6/24/98 HRI-98-04E (Chelsea) L3172-20 Endrin ND UJ 10 0.33 ng/g-wet weight 6/24/98 HRI-98-04E (Chelsea) L3172-20 beta-Endosulphan (II) ND U 0.22 ng/g-wet weight 6/24/98 HRI-98-04E (Chelsea) L3172-20 Endrin Aldehyde 0.32 U 7 0.25 ng/g-wet weight 6/24/98 HRI-98-04E (Chelsea) L3172-20 Endosulphan Sulphate ND U 0.26 ng/g-wet weight 6/24/98 HRI-98-04E (Chelsea) L3172-20 Endrin Ketone ND U 0.14 ng/g-wet weight 6/24/98 HRI-98-04E (Chelsea) L3172-20 Methoxychlor ND UJ 10 0.62 ng/g-wet weight 6/24/98 HRI-98-04E (Chelsea) L3172-20 Aroclor 1242 68 NJ 14 1.8 ng/g-wet weight 6/24/98 HRI-98-04E (Chelsea) L3172-20 Aroclor 1248 ND U 1.8 ng/g-wet weight 6/24/98 HRI-98-04E (Chelsea) L3172-20 Aroclor 1254 150 NJ 14 2.3 ng/g-wet weight 6/24/98 HRI-98-04E (Chelsea) L3172-20 Aroclor 1260 55 NJ 14 1.9 ng/g-wet weight 6/24/98 HRI-98-04E (Chelsea) L3172-20 PCB-6 ND U 0.06 ng/g-wet weight 6/24/98 HRI-98-04E (Chelsea) L3172-20 PCB-4/10 0.34 0.02 ng/g-wet weight 6/24/98 HRI-98-04E (Chelsea) L3172-20 PCB-7/9 1.0 U 21 0.02 ng/g-wet weight 6/24/98 HRI-98-04E (Chelsea) L3172-20 PCB-8/5 0.47 0.02 ng/g-wet weight 6/24/98 HRI-98-04E (Chelsea) L3172-20 PCB-15 1 0.03 ng/g-wet weight 6/24/98 HRI-98-04E (Chelsea) L3172-20 PCB-19 0.44 0.12 ng/g-wet weight 6/24/98 HRI-98-04E (Chelsea) L3172-20 PCB-18 1.7 0.12 ng/g-wet weight 6/24/98 HRI-98-04E (Chelsea) L3172-20 PCB-17 2.5 0.12 ng/g-wet weight 6/24/98 HRI-98-04E (Chelsea) L3172-20 PCB-24/27 0.75 0.12 ng/g-wet weight 6/24/98 HRI-98-04E (Chelsea) L3172-20 PCB-16/32 2.0 0.12 ng/g-wet weight 6/24/98 HRI-98-04E (Chelsea) L3172-20 PCB-26 1.4 0.10 ng/g-wet weight 6/24/98 HRI-98-04E (Chelsea) L3172-20 PCB-25 0.86 0.10 ng/g-wet weight 6/24/98 HRI-98-04E (Chelsea) L3172-20 PCB-31/28 14 0.10 ng/g-wet weight 6/24/98 HRI-98-04E (Chelsea) L3172-20 PCB-33 /20 0.76 0.10 ng/g-wet weight 6/24/98 HRI-98-04E (Chelsea) L3172-20 PCB-22 0.59 0.10 ng/g-wet weight 6/24/98 HRI-98-04E (Chelsea) L3172-20 PCB-37 0.92 U 21 0.10 ng/g-wet weight 6/24/98 HRI-98-04E (Chelsea) L3172-20 PCB-53 1.7 0.14 ng/g-wet weight 6/24/98 HRI-98-04E (Chelsea) L3172-20 PCB-45 0.49 0.14 ng/g-wet weight 6/24/98 HRI-98-04E (Chelsea) L3172-20 PCB-46 0.2 0.14 ng/g-wet weight 6/24/98 HRI-98-04E (Chelsea) L3172-20 PCB-52 14 0.14 ng/g-wet weight
*See Qualifier Codes table at end. Page 72 of 75

Aquatic Insects Pesticide and PCB Data
SAMPLING DATE FIELD ID LABORATORY ID ANALYTE VALUE INTERPRETIVE
QUALIFIER*
QUALIFIER REASON CODE*
DETECTION LIMIT
UNITS
6/24/98 HRI-98-04E (Chelsea) L3172-20 PCB-49 23 0.18 ng/g-wet weight 6/24/98 HRI-98-04E (Chelsea) L3172-20 PCB-47/48 17 0.18 ng/g-wet weight 6/24/98 HRI-98-04E (Chelsea) L3172-20 PCB-44 4.9 0.17 ng/g-wet weight 6/24/98 HRI-98-04E (Chelsea) L3172-20 PCB-42 3.4 0.17 ng/g-wet weight 6/24/98 HRI-98-04E (Chelsea) L3172-20 PCB-41/71/64 11 0.17 ng/g-wet weight 6/24/98 HRI-98-04E (Chelsea) L3172-20 PCB-40 1.8 0.19 ng/g-wet weight 6/24/98 HRI-98-04E (Chelsea) L3172-20 PCB-74 /61 6.5 0.19 ng/g-wet weight 6/24/98 HRI-98-04E (Chelsea) L3172-20 PCB-70/76 8.1 0.19 ng/g-wet weight 6/24/98 HRI-98-04E (Chelsea) L3172-20 PCB-66 /80 6.1 0.11 ng/g-wet weight 6/24/98 HRI-98-04E (Chelsea) L3172-20 PCB-81 0.77 U 21 0.11 ng/g-wet weight 6/24/98 HRI-98-04E (Chelsea) L3172-20 PCB-56/60 2.5 0.11 ng/g-wet weight 6/24/98 HRI-98-04E (Chelsea) L3172-20 PCB-77 1.9 U 21 0.11 ng/g-wet weight 6/24/98 HRI-98-04E (Chelsea) L3172-20 PCB-95 4.9 0.06 ng/g-wet weight 6/24/98 HRI-98-04E (Chelsea) L3172-20 PCB-119 0.69 0.06 ng/g-wet weight 6/24/98 HRI-98-04E (Chelsea) L3172-20 PCB-91 1.5 0.06 ng/g-wet weight 6/24/98 HRI-98-04E (Chelsea) L3172-20 PCB-84 1.1 0.06 ng/g-wet weight 6/24/98 HRI-98-04E (Chelsea) L3172-20 PCB-90/101/89 12 0.06 ng/g-wet weight 6/24/98 HRI-98-04E (Chelsea) L3172-20 PCB-99 6.1 0.06 ng/g-wet weight 6/24/98 HRI-98-04E (Chelsea) L3172-20 PCB-83 1.4 0.10 ng/g-wet weight 6/24/98 HRI-98-04E (Chelsea) L3172-20 PCB-97 /86 2.5 0.10 ng/g-wet weight 6/24/98 HRI-98-04E (Chelsea) L3172-20 PCB-87 6.3 0.10 ng/g-wet weight 6/24/98 HRI-98-04E (Chelsea) L3172-20 PCB-85 2.9 0.10 ng/g-wet weight 6/24/98 HRI-98-04E (Chelsea) L3172-20 PCB-110 16 0.10 ng/g-wet weight 6/24/98 HRI-98-04E (Chelsea) L3172-20 PCB-82 0.31 0.06 ng/g-wet weight 6/24/98 HRI-98-04E (Chelsea) L3172-20 PCB-107 1.9 0.06 ng/g-wet weight 6/24/98 HRI-98-04E (Chelsea) L3172-20 PCB-114 0.32 0.06 ng/g-wet weight 6/24/98 HRI-98-04E (Chelsea) L3172-20 PCB-126 1.2 0.05 ng/g-wet weight 6/24/98 HRI-98-04E (Chelsea) L3172-20 PCB-136 1.1 0.19 ng/g-wet weight 6/24/98 HRI-98-04E (Chelsea) L3172-20 PCB-151 3.4 0.19 ng/g-wet weight 6/24/98 HRI-98-04E (Chelsea) L3172-20 PCB-144/135 2.4 0.19 ng/g-wet weight 6/24/98 HRI-98-04E (Chelsea) L3172-20 PCB-149 7.5 0.19 ng/g-wet weight 6/24/98 HRI-98-04E (Chelsea) L3172-20 PCB-134 /143 0.9 0.19 ng/g-wet weight 6/24/98 HRI-98-04E (Chelsea) L3172-20 PCB-131 ND U 0.19 ng/g-wet weight 6/24/98 HRI-98-04E (Chelsea) L3172-20 PCB-146 2.3 0.12 ng/g-wet weight 6/24/98 HRI-98-04E (Chelsea) L3172-20 PCB-118 8.0 0.07 ng/g-wet weight
*See Qualifier Codes table at end. Page 73 of 75

Aquatic Insects Pesticide and PCB Data
SAMPLING DATE FIELD ID LABORATORY ID ANALYTE VALUE INTERPRETIVE
QUALIFIER*
QUALIFIER REASON CODE*
DETECTION LIMIT
UNITS
6/24/98 HRI-98-04E (Chelsea) L3172-20 PCB-123 0.11 U 21 0.07 ng/g-wet weight 6/24/98 HRI-98-04E (Chelsea) L3172-20 PCB-105 2.3 0.06 ng/g-wet weight 6/24/98 HRI-98-04E (Chelsea) L3172-20 PCB-153 14 0.12 ng/g-wet weight 6/24/98 HRI-98-04E (Chelsea) L3172-20 PCB-132/168 1.4 0.19 ng/g-wet weight 6/24/98 HRI-98-04E (Chelsea) L3172-20 PCB-141 2.0 0.2 ng/g-wet weight 6/24/98 HRI-98-04E (Chelsea) L3172-20 PCB-130 0.96 0.15 ng/g-wet weight 6/24/98 HRI-98-04E (Chelsea) L3172-20 PCB-137 0.68 0.15 ng/g-wet weight 6/24/98 HRI-98-04E (Chelsea) L3172-20 PCB-138 16 0.15 ng/g-wet weight 6/24/98 HRI-98-04E (Chelsea) L3172-20 PCB-158 0.78 0.15 ng/g-wet weight 6/24/98 HRI-98-04E (Chelsea) L3172-20 PCB-129 0.62 0.15 ng/g-wet weight 6/24/98 HRI-98-04E (Chelsea) L3172-20 PCB-128 1.4 0.22 ng/g-wet weight 6/24/98 HRI-98-04E (Chelsea) L3172-20 PCB-167 0.62 U 21 0.15 ng/g-wet weight 6/24/98 HRI-98-04E (Chelsea) L3172-20 PCB-156 1.9 0.24 ng/g-wet weight 6/24/98 HRI-98-04E (Chelsea) L3172-20 PCB-157 0.95 0.24 ng/g-wet weight 6/24/98 HRI-98-04E (Chelsea) L3172-20 PCB-169 0.57 0.15 ng/g-wet weight 6/24/98 HRI-98-04E (Chelsea) L3172-20 PCB-184 ND U 0.1 ng/g-wet weight 6/24/98 HRI-98-04E (Chelsea) L3172-20 PCB-179 1.1 0.1 ng/g-wet weight 6/24/98 HRI-98-04E (Chelsea) L3172-20 PCB-176 0.16 0.1 ng/g-wet weight 6/24/98 HRI-98-04E (Chelsea) L3172-20 PCB-178 2.0 0.1 ng/g-wet weight 6/24/98 HRI-98-04E (Chelsea) L3172-20 PCB-175 0.17 0.1 ng/g-wet weight 6/24/98 HRI-98-04E (Chelsea) L3172-20 PCB-187/182 5.4 0.1 ng/g-wet weight 6/24/98 HRI-98-04E (Chelsea) L3172-20 PCB-183 0.92 0.12 ng/g-wet weight 6/24/98 HRI-98-04E (Chelsea) L3172-20 PCB-185 0.28 0.12 ng/g-wet weight 6/24/98 HRI-98-04E (Chelsea) L3172-20 PCB-174 /181 1.5 0.12 ng/g-wet weight 6/24/98 HRI-98-04E (Chelsea) L3172-20 PCB-177 1.3 0.12 ng/g-wet weight 6/24/98 HRI-98-04E (Chelsea) L3172-20 PCB-171 0.59 0.13 ng/g-wet weight 6/24/98 HRI-98-04E (Chelsea) L3172-20 PCB-172 1.0 0.11 ng/g-wet weight 6/24/98 HRI-98-04E (Chelsea) L3172-20 PCB-180 6.6 0.11 ng/g-wet weight 6/24/98 HRI-98-04E (Chelsea) L3172-20 PCB-193 1.2 0.11 ng/g-wet weight 6/24/98 HRI-98-04E (Chelsea) L3172-20 PCB-191 0.18 0.11 ng/g-wet weight 6/24/98 HRI-98-04E (Chelsea) L3172-20 PCB-170 /190 3.8 0.17 ng/g-wet weight 6/24/98 HRI-98-04E (Chelsea) L3172-20 PCB-189 0.3 0.17 ng/g-wet weight 6/24/98 HRI-98-04E (Chelsea) L3172-20 PCB-201 (BZ#200) ND U 0.33 ng/g-wet weight 6/24/98 HRI-98-04E (Chelsea) L3172-20 PCB-197 ND U 0.65 ng/g-wet weight 6/24/98 HRI-98-04E (Chelsea) L3172-20 PCB-200 (BZ#199) ND U 0.65 ng/g-wet weight
*See Qualifier Codes table at end. Page 74 of 75

Aquatic Insects Pesticide and PCB Data
SAMPLING DATE FIELD ID LABORATORY ID ANALYTE VALUE INTERPRETIVE
QUALIFIER*
QUALIFIER REASON CODE*
DETECTION LIMIT
UNITS
6/24/98 HRI-98-04E (Chelsea) L3172-20 PCB-198 ND U 0.65 ng/g-wet weight 6/24/98 HRI-98-04E (Chelsea) L3172-20 PCB-199 (BZ#201) 6.3 0.65 ng/g-wet weight 6/24/98 HRI-98-04E (Chelsea) L3172-20 PCB-196/203 1.7 0.63 ng/g-wet weight 6/24/98 HRI-98-04E (Chelsea) L3172-20 PCB-195 ND U 0.63 ng/g-wet weight 6/24/98 HRI-98-04E (Chelsea) L3172-20 PCB-194 4.1 0.93 ng/g-wet weight 6/24/98 HRI-98-04E (Chelsea) L3172-20 PCB-205 ND U 0.93 ng/g-wet weight 6/24/98 HRI-98-04E (Chelsea) L3172-20 PCB-208 0.89 0.35 ng/g-wet weight 6/24/98 HRI-98-04E (Chelsea) L3172-20 PCB-207 ND U 0.35 ng/g-wet weight 6/24/98 HRI-98-04E (Chelsea) L3172-20 PCB-206 1.4 U 21 0.35 ng/g-wet weight 6/24/98 HRI-98-04E (Chelsea) L3172-20 PCB-209 0.5 U 21 0.32 ng/g-wet weight
*See Qualifier Codes table at end. Page 75 of 75

AQUATIC INSECT METALS EDD
SAMPLING DATE FIELD ID ANALYTE VALUE INTERPRETIVE QUALIFIER
QUALIFIER REASON
CODE
DETECTION LIMIT
UNITS
6/10/98 HRI-98-01A (Remnant #4) Chromium ND U 0.029 mg/kg-wet weight 6/10/98 HRI-98-01A (Remnant #4) Cadmium 0.043 0.002 mg/kg-wet weight 6/10/98 HRI-98-01A (Remnant #4) Lead 0.142 0.003 mg/kg-wet weight 6/10/98 HRI-98-01A (Remnant #4) Mercury 0.0396 J 14 0.0009 mg/kg-wet weight 6/10/98 HRI-98-01A (Remnant #4) % Total Solids 30.2 percent 6/10/98 HRI-98-01B (Remnant #4) Chromium 0.080 J 14 0.031 mg/kg-wet weight 6/10/98 HRI-98-01B (Remnant #4) Cadmium 0.041 0.002 mg/kg-wet weight 6/10/98 HRI-98-01B (Remnant #4) Lead 0.103 0.004 mg/kg-wet weight 6/10/98 HRI-98-01B (Remnant #4) Mercury 0.0380 J 14 0.0009 mg/kg-wet weight 6/10/98 HRI-98-01B (Remnant #4) % Total Solids 31.9 percent 6/10/98 HRI-98-01C (Remnant #4) Chromium 0.094 J 14 0.031 mg/kg-wet weight 6/10/98 HRI-98-01C (Remnant #4) Cadmium 0.045 0.002 mg/kg-wet weight 6/10/98 HRI-98-01C (Remnant #4) Lead 0.098 0.003 mg/kg-wet weight 6/10/98 HRI-98-01C (Remnant #4) Mercury 0.0372 J 14 0.0009 mg/kg-wet weight 6/10/98 HRI-98-01C (Remnant #4) % Total Solids 31.8 percent 6/10/98 HRI-98-01D (Remnant #4) Chromium 0.095 J 14 0.030 mg/kg-wet weight 6/10/98 HRI-98-01D (Remnant #4) Cadmium 0.043 0.002 mg/kg-wet weight 6/10/98 HRI-98-01D (Remnant #4) Lead 0.096 0.003 mg/kg-wet weight 6/10/98 HRI-98-01D (Remnant #4) Mercury 0.0376 J 14 0.0009 mg/kg-wet weight 6/10/98 HRI-98-01D (Remnant #4) % Total Solids 30.6 percent 6/10/98 HRI-98-01E (Remnant #4) Chromium 0.084 J 14 0.031 mg/kg-wet weight 6/10/98 HRI-98-01E (Remnant #4) Cadmium 0.048 0.002 mg/kg-wet weight 6/10/98 HRI-98-01E (Remnant #4) Lead 0.103 0.004 mg/kg-wet weight 6/10/98 HRI-98-01E (Remnant #4) Mercury 0.0408 J 14 0.0009 mg/kg-wet weight 6/10/98 HRI-98-01E (Remnant #4) % Total Solids 32.1 percent 5/28/98 HRI-98-02A (Special Area 13) Chromium 0.187 J 14 0.029 mg/kg-wet weight 5/28/98 HRI-98-02A (Special Area 13) Cadmium 0.082 0.002 mg/kg-wet weight 5/28/98 HRI-98-02A (Special Area 13) Lead 0.220 0.003 mg/kg-wet weight 5/28/98 HRI-98-02A (Special Area 13) Mercury 0.0297 J 14 0.0009 mg/kg-wet weight 5/28/98 HRI-98-02A (Special Area 13) % Total Solids 30.3 percent 5/28/98 HRI-98-02B (Special Area 13) Chromium 0.317 J 14 0.027 mg/kg-wet weight 5/28/98 HRI-98-02B (Special Area 13) Cadmium 0.080 0.001 mg/kg-wet weight 5/28/98 HRI-98-02B (Special Area 13) Lead 0.216 0.003 mg/kg-wet weight
Page 1 of 3

AQUATIC INSECT METALS EDD
SAMPLING DATE FIELD ID ANALYTE VALUE INTERPRETIVE QUALIFIER
QUALIFIER REASON
CODE
DETECTION LIMIT
UNITS
5/28/98 HRI-98-02B (Special Area 13) Mercury 0.0299 J 14 0.0008 mg/kg-wet weight 5/28/98 HRI-98-02B (Special Area 13) % Total Solids 27.7 percent 5/28/98 HRI-98-02C (Special Area 13) Chromium 0.098 J 14 0.027 mg/kg-wet weight 5/28/98 HRI-98-02C (Special Area 13) Cadmium 0.069 0.001 mg/kg-wet weight 5/28/98 HRI-98-02C (Special Area 13) Lead 0.376 0.003 mg/kg-wet weight 5/28/98 HRI-98-02C (Special Area 13) Mercury 0.0305 J 14 0.0008 mg/kg-wet weight 5/28/98 HRI-98-02C (Special Area 13) % Total Solids 28.0 percent 5/28/98 HRI-98-02D (Special Area 13) Chromium 0.027 J 14 0.029 mg/kg-wet weight 5/28/98 HRI-98-02D (Special Area 13) Cadmium 0.080 0.001 mg/kg-wet weight 5/28/98 HRI-98-02D (Special Area 13) Lead 0.265 0.003 mg/kg-wet weight 5/28/98 HRI-98-02D (Special Area 13) Mercury 0.0280 J 14 0.0009 mg/kg-wet weight 5/28/98 HRI-98-02D (Special Area 13) % Total Solids 29.9 percent 5/28/98 HRI-98-02E (Special Area 13) Chromium 0.055 J 14 0.023 mg/kg-wet weight 5/28/98 HRI-98-02E (Special Area 13) Cadmium 0.062 0.001 mg/kg-wet weight 5/28/98 HRI-98-02E (Special Area 13) Lead 0.220 0.003 mg/kg-wet weight 5/28/98 HRI-98-02E (Special Area 13) Mercury 0.0301 J 14 0.0007 mg/kg-wet weight 5/28/98 HRI-98-02E (Special Area 13) % Total Solids 23.9 percent 6/16/98 HRI-98-03A (Saratoga Battlefield) Chromium 0.142 J 14 0.029 mg/kg-wet weight 6/16/98 HRI-98-03A (Saratoga Battlefield) Cadmium 0.065 0.001 mg/kg-wet weight 6/16/98 HRI-98-03A (Saratoga Battlefield) Lead 0.088 0.003 mg/kg-wet weight 6/16/98 HRI-98-03A (Saratoga Battlefield) Mercury 0.0385 J 14 0.0009 mg/kg-wet weight 6/16/98 HRI-98-03A (Saratoga Battlefield) % Total Solids 29.4 percent 6/16/98 HRI-98-03B (Saratoga Battlefield) Chromium 0.150 J 14 0.030 mg/kg-wet weight 6/16/98 HRI-98-03B (Saratoga Battlefield) Cadmium 0.088 0.002 mg/kg-wet weight 6/16/98 HRI-98-03B (Saratoga Battlefield) Lead 0.145 0.003 mg/kg-wet weight 6/16/98 HRI-98-03B (Saratoga Battlefield) Mercury 0.0402 J 14 0.0009 mg/kg-wet weight 6/16/98 HRI-98-03B (Saratoga Battlefield) % Total Solids 30.7 percent 6/16/98 HRI-98-03C (Saratoga Battlefield) Chromium 0.288 J 14 0.031 mg/kg-wet weight 6/16/98 HRI-98-03C (Saratoga Battlefield) Cadmium 0.084 0.002 mg/kg-wet weight 6/16/98 HRI-98-03C (Saratoga Battlefield) Lead 0.110 0.003 mg/kg-wet weight 6/16/98 HRI-98-03C (Saratoga Battlefield) Mercury 0.0496 J 14 0.0009 mg/kg-wet weight 6/16/98 HRI-98-03C (Saratoga Battlefield) % Total Solids 31.6 percent 6/16/98 HRI-98-03D (Saratoga Battlefield) Chromium 0.093 J 14 0.032 mg/kg-wet weight
Page 2 of 3
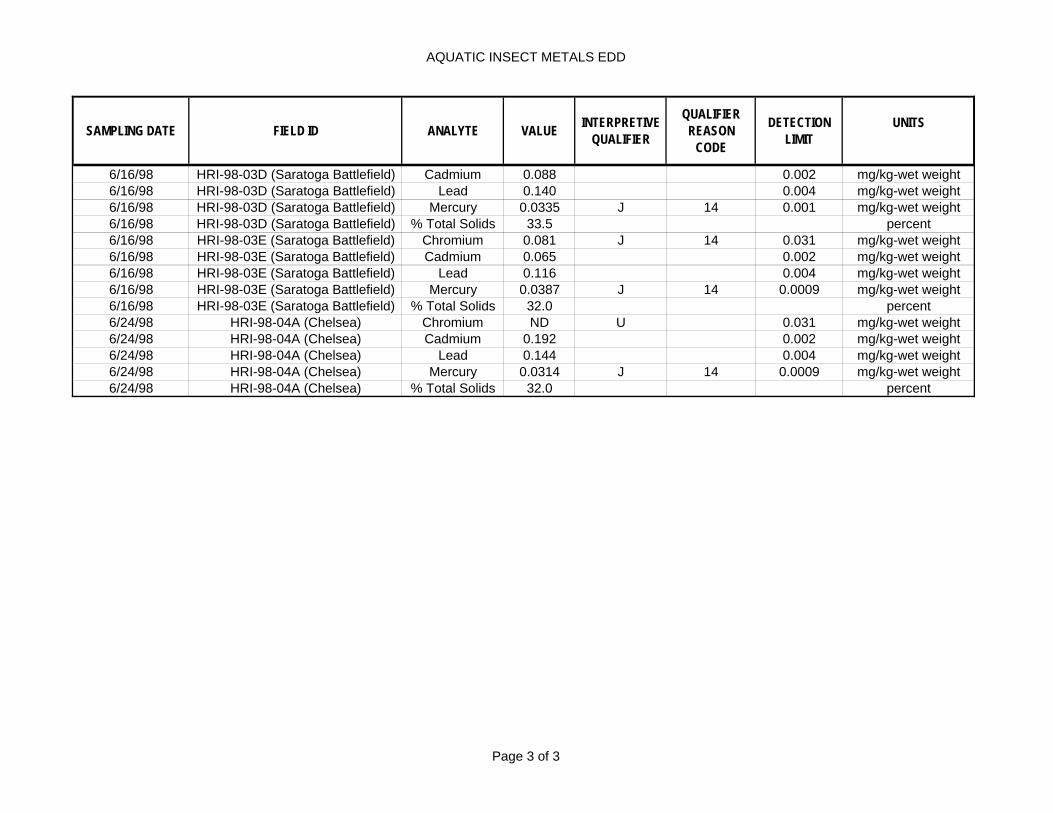
AQUATIC INSECT METALS EDD
SAMPLING DATE FIELD ID ANALYTE VALUE INTERPRETIVE QUALIFIER
QUALIFIER REASON
CODE
DETECTION LIMIT
UNITS
6/16/98 HRI-98-03D (Saratoga Battlefield) Cadmium 0.088 0.002 mg/kg-wet weight 6/16/98 HRI-98-03D (Saratoga Battlefield) Lead 0.140 0.004 mg/kg-wet weight 6/16/98 HRI-98-03D (Saratoga Battlefield) Mercury 0.0335 J 14 0.001 mg/kg-wet weight 6/16/98 HRI-98-03D (Saratoga Battlefield) % Total Solids 33.5 percent 6/16/98 HRI-98-03E (Saratoga Battlefield) Chromium 0.081 J 14 0.031 mg/kg-wet weight 6/16/98 HRI-98-03E (Saratoga Battlefield) Cadmium 0.065 0.002 mg/kg-wet weight 6/16/98 HRI-98-03E (Saratoga Battlefield) Lead 0.116 0.004 mg/kg-wet weight 6/16/98 HRI-98-03E (Saratoga Battlefield) Mercury 0.0387 J 14 0.0009 mg/kg-wet weight 6/16/98 HRI-98-03E (Saratoga Battlefield) % Total Solids 32.0 percent 6/24/98 HRI-98-04A (Chelsea) Chromium ND U 0.031 mg/kg-wet weight 6/24/98 HRI-98-04A (Chelsea) Cadmium 0.192 0.002 mg/kg-wet weight 6/24/98 HRI-98-04A (Chelsea) Lead 0.144 0.004 mg/kg-wet weight 6/24/98 HRI-98-04A (Chelsea) Mercury 0.0314 J 14 0.0009 mg/kg-wet weight 6/24/98 HRI-98-04A (Chelsea) % Total Solids 32.0 percent
Page 3 of 3

Qualifier Codes
Interpretive Qualifier Definitions
J The analyte was positively identified; the associated numerical value is the approximate concentration of the analyte in the sample.
UJ The analyte should not be considered detected above the reported value, and the reported value is an estimated detection limit.
U The analyte was analyzed for, but was not detected above the reported value.
NJ The analyte was tentatively identified and the associated numerical value is an estimated quantity. R Rejected. The data could not be reported, see data validation report for details.
Validation Qualifier Reason Codes 3 Compound confirmation not performed.
5A Initial Calibration not performed 7 Blank Contamination 9 Laboratory Duplicate Precision (RPD > 30%)
10 LCS (percent recovery outside MQO ) 13 Surrogate (percent recovery outside MQO) 14 Other (see data validation report) 21 Potential False Positive


Related Documents