copyright © hutchinson associates 2006 Organizational Network Analysis Patti Anklam

Organizational Network Analysis
Dec 31, 2015
Organizational Network Analysis. Patti Anklam. An Organizational x-Ray. Each circle represents a person An arrow from one person to another indicates a communication flow Colors indicate functional groups (or could represent geographies, departments, or other classifications) - PowerPoint PPT Presentation
Welcome message from author
This document is posted to help you gain knowledge. Please leave a comment to let me know what you think about it! Share it to your friends and learn new things together.
Transcript
copyright © hutchinson associates 2006
Organizational Network Analysis
Patti Anklam

copyright © hutchinson associates
2006 2
An Organizational x-Ray
•Each circle represents a person•An arrow from one person to another indicates a communication flow •Colors indicate functional groups (or could represent geographies, departments, or other classifications)•The larger the circle, the more senior the person in the hierarchy•People in the center are the most connected
copyright © hutchinson associates
2006 3
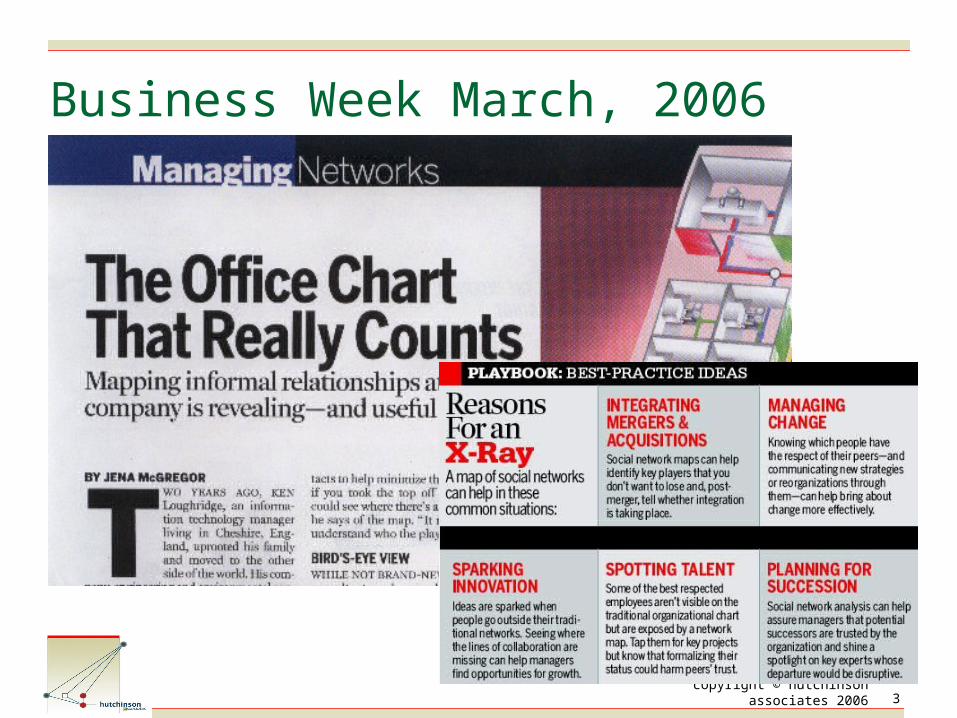
Business Week March, 2006

copyright © hutchinson associates
2006 4
Organizational Network Analysis Is being used by many of the Fortune 100 to:
Assess current communications and decision-making flows
Make decisions about designing collaboration and communications frameworks that address issues of geographic, hierarchic, functional, and role-based
Network Roundtable Consortium at UVA has over 60 members engaged in research and practice
copyright © hutchinson associates
2006 5
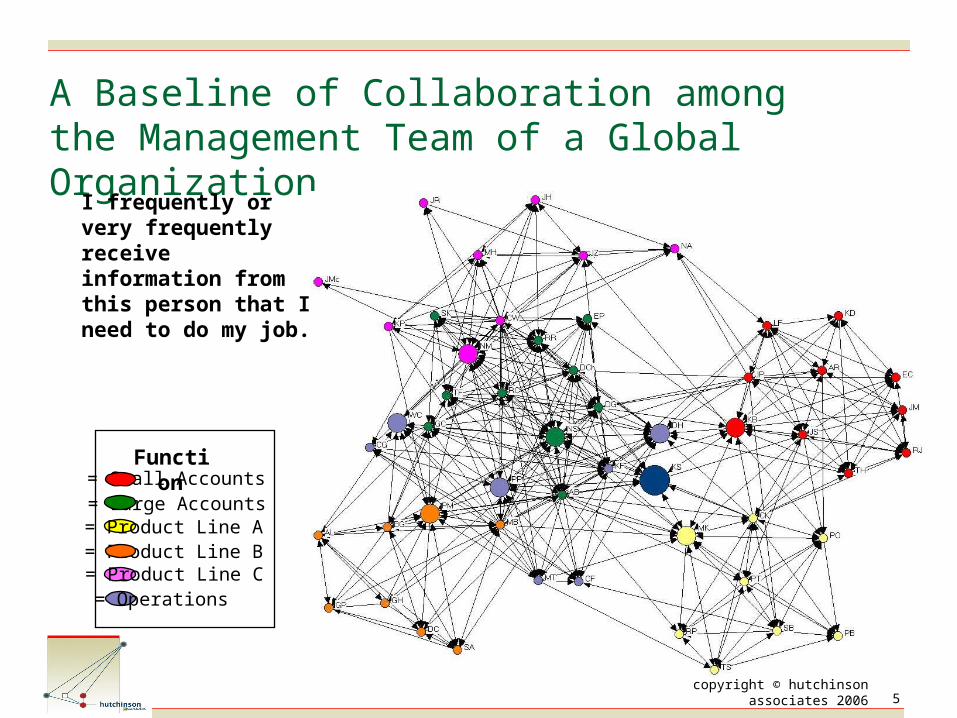
A Baseline of Collaboration among the Management Team of a Global Organization
= Large Accounts= Small Accounts
= Product Line A
Function
= Product Line B= Product Line C= Operations
I frequently or very frequently receive information from this person that I need to do my job.
copyright © hutchinson associates
2006 6
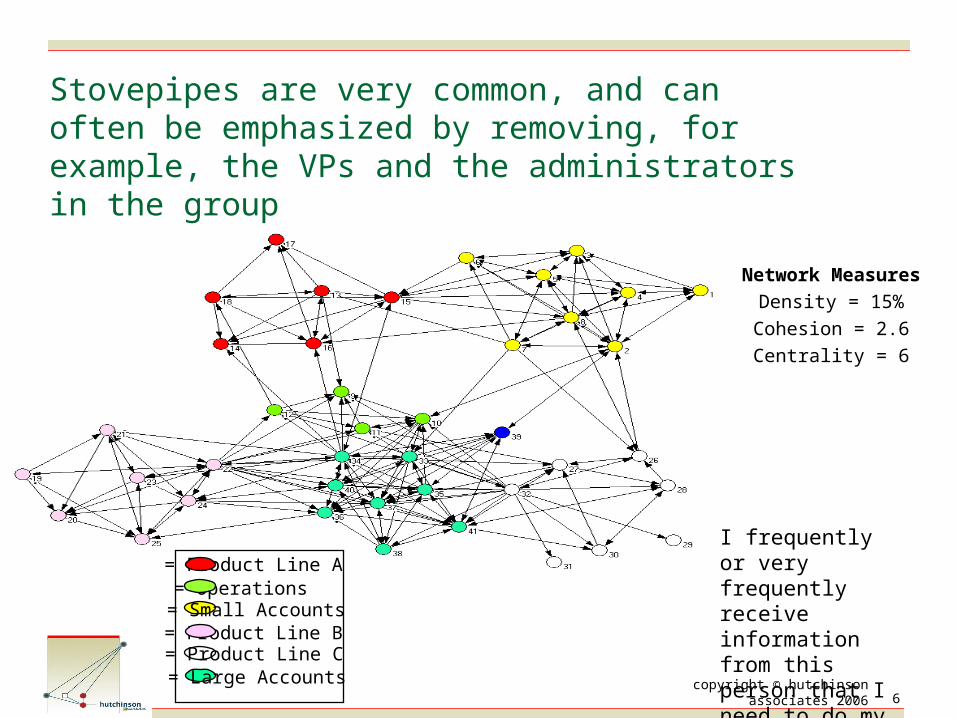
Stovepipes are very common, and can often be emphasized by removing, for example, the VPs and the administrators in the group
= Operations= Product Line A
= Small Accounts= Product Line B= Product Line C= Large Accounts
I frequently or very frequently receive information from this person that I need to do my job.
Network Measures
Density = 15%Cohesion = 2.6Centrality = 6
copyright © hutchinson associates
2006 7
So we come to the big, “So what?” Often the presentation of the results provides
sufficient self-awareness for the group to move into action
Typical actions fall into three broad categories: Make an organizational shift or adjustment: role change,
role addition, relocation, etc. Increase the knowledge capacity of the organization:
provide opportunities for people to meet, to find one another on the web, add blogs, etc.
Focus on individual behaviors of key people to distribute knowledge sharing across the organization
copyright © hutchinson associates
2006 8
Impact of this Analysis Project
Organizational response: change the context Established new roles for liaison Clarified role of “single point of contact”
Develop the networks of relationships Within groups: face-to-face Across groups: put people on teams together Establish cross-group presence at staff meetings
Individual Reallocation of decision-making Private and public commitments to change behavior
Related Documents