RESEARCH Open Access Organizational forms and technical efficiency of the dairy processing industry in Southern Brazil Caetano Luiz Beber 1* , Sebastian Lakner 1,2 and Ioannis Skevas 3 * Correspondence: cbeber@gwdg. de 1 Department of Agricultural Economics and Rural Development, Georg-August-University Göttingen, Platz der Göttinger Sieben 5, 37073 Gottingen, Germany Full list of author information is available at the end of the article Abstract The objective of this article is to assess the determinants of the technical efficiency of dairy processing firms in Southern Brazil while accounting for their different organizational forms, namely cooperatives and investor-owned firms. The data from 243 milk processors in southern Brazil, including firm structure, management capacity, and organizational choice of dairies, were analyzed. A production frontier is specified to estimate technical efficiency and identify its potential driving sources. Bayesian techniques are used to estimate the model. An average efficiency of 77% indicates that the actual output is 23% below its potential, which implies that output could, on average, be increased by approximately 31.6%, under ceteris paribus conditions. Economies of scale were also detected. The analysis reveals that the management capacity within companies is the main determinant of efficiency. Idle capacities of processing plants are an important source of inefficiencies and cooperatives are more efficient than investor-owned firms, despite their transaction costs potentially being higher and the five vaguely defined property rights inherent to the traditional cooperatives which they must overcome. Knowledge about the cooperatives’ objectives other than profit maximization would provide a more realistic comparison against investor-owned firms. This study assessed the determinants of the efficiency levels of dairy processing companies in an emerging economy using a unique own dataset with data collected at a plant level. Based on the results, manifold managerial and political implications have been derived that can benefit the dairy industry of developing and emerging economies. Keywords: Dairy processing firms, Technical efficiency, Brazilian dairy sector, Dairy cooperatives Introduction The dairy industry is a key agribusiness sector for rural value creation and important for food security in remote rural areas. In Brazil, the dairy industry corresponds to 5.8% of the total value share in national agricultural GDP and 15% of animal produc- tion (IBGE 2017). It also generates around 4.7 million jobs. In 2017, 1.17 million farms produced 33.5 billion liters of milk, making it the fourth largest producer in the world. © The Author(s). 2021 Open Access This article is licensed under a Creative Commons Attribution 4.0 International License, which permits use, sharing, adaptation, distribution and reproduction in any medium or format, as long as you give appropriate credit to the original author(s) and the source, provide a link to the Creative Commons licence, and indicate if changes were made. The images or other third party material in this article are included in the article's Creative Commons licence, unless indicated otherwise in a credit line to the material. If material is not included in the article's Creative Commons licence and your intended use is not permitted by statutory regulation or exceeds the permitted use, you will need to obtain permission directly from the copyright holder. To view a copy of this licence, visit http://creativecommons.org/licenses/by/4.0/. Agricultural and Food Economics Beber et al. Agricultural and Food Economics (2021) 9:23 https://doi.org/10.1186/s40100-021-00195-3

Welcome message from author
This document is posted to help you gain knowledge. Please leave a comment to let me know what you think about it! Share it to your friends and learn new things together.
Transcript

RESEARCH Open Access
Organizational forms and technicalefficiency of the dairy processing industryin Southern BrazilCaetano Luiz Beber1* , Sebastian Lakner1,2 and Ioannis Skevas3
* Correspondence: [email protected] of AgriculturalEconomics and Rural Development,Georg-August-University Göttingen,Platz der Göttinger Sieben 5, 37073Gottingen, GermanyFull list of author information isavailable at the end of the article
Abstract
The objective of this article is to assess the determinants of the technical efficiencyof dairy processing firms in Southern Brazil while accounting for their differentorganizational forms, namely cooperatives and investor-owned firms. The data from243 milk processors in southern Brazil, including firm structure, managementcapacity, and organizational choice of dairies, were analyzed. A production frontier isspecified to estimate technical efficiency and identify its potential driving sources.Bayesian techniques are used to estimate the model. An average efficiency of 77%indicates that the actual output is 23% below its potential, which implies that outputcould, on average, be increased by approximately 31.6%, under ceteris paribusconditions. Economies of scale were also detected. The analysis reveals that themanagement capacity within companies is the main determinant of efficiency. Idlecapacities of processing plants are an important source of inefficiencies andcooperatives are more efficient than investor-owned firms, despite their transactioncosts potentially being higher and the five vaguely defined property rights inherentto the traditional cooperatives which they must overcome. Knowledge about thecooperatives’ objectives other than profit maximization would provide a morerealistic comparison against investor-owned firms. This study assessed thedeterminants of the efficiency levels of dairy processing companies in an emergingeconomy using a unique own dataset with data collected at a plant level. Based onthe results, manifold managerial and political implications have been derived thatcan benefit the dairy industry of developing and emerging economies.
Keywords: Dairy processing firms, Technical efficiency, Brazilian dairy sector, Dairycooperatives
IntroductionThe dairy industry is a key agribusiness sector for rural value creation and important
for food security in remote rural areas. In Brazil, the dairy industry corresponds to
5.8% of the total value share in national agricultural GDP and 15% of animal produc-
tion (IBGE 2017). It also generates around 4.7 million jobs. In 2017, 1.17 million farms
produced 33.5 billion liters of milk, making it the fourth largest producer in the world.
© The Author(s). 2021 Open Access This article is licensed under a Creative Commons Attribution 4.0 International License, whichpermits use, sharing, adaptation, distribution and reproduction in any medium or format, as long as you give appropriate credit to theoriginal author(s) and the source, provide a link to the Creative Commons licence, and indicate if changes were made. The images orother third party material in this article are included in the article's Creative Commons licence, unless indicated otherwise in a creditline to the material. If material is not included in the article's Creative Commons licence and your intended use is not permitted bystatutory regulation or exceeds the permitted use, you will need to obtain permission directly from the copyright holder. To view acopy of this licence, visit http://creativecommons.org/licenses/by/4.0/.
Agricultural and FoodEconomics
Beber et al. Agricultural and Food Economics (2021) 9:23 https://doi.org/10.1186/s40100-021-00195-3
Since the early 1990s to the present, Brazilian dairy processing has been consolidating
and undergoing a process of rapid restructuring and multi-nationalization.
The rise of supermarkets and the deregulation of the dairy market that occurred in
the early 1990s freed retail and farm prices, which brought a sharp increase in firm’s
competition on price and cost cutting. This has led to the entrance of large multi-
national processors in the sector (Carvalho 2008; Chaddad and Jank 2006). National
companies were slow to respond to this path of consolidation, mainly for political and
management problems (Beber et al. 2018). Cooperatives and investor-owned firms
(IOFs) adopted different strategies to adapt to this new context. However, the shut-
down of dairy enterprises was inevitable, taking thousands of farmers along, causing ir-
reparable damages to family farms.
Sustaining the participation of these dairies with solid technological and economic
performances, although challenging, is crucial for farmers and rural communities, even
more so in developing and emerging economies (Nguyen et al. 2018). This is especially
true in the case of cooperatives, which might pursue other objectives besides that of
pure profit maximization (Franken and Cook 2013; Soboh et al. 2012). In several cases,
the cooperatives’ objectives are, e.g., to maximize members’ benefits. They might also
provide important social functions in rural areas as, e.g., collecting milk from remote
farming locations (Magalhães 2007) or offering inputs at lower costs or feed and
veterinary services. These actions considerably improve farmers’ profits and incomes
(Chagwiza et al. 2016; Gupta and Roy 2012). While it is relatively easy for cooperatives
to enter modern agri-food chains, it is challenging to sustain their participation by
following the market requirements, especially for the traditional cooperatives (Berdegué
2001). This context shows evidences of low competitiveness of the processing compan-
ies, especially the cooperatives. In southern Brazil, such cooperatives also face a mix of
difficult challenges: to reorganize the supply chain in their coverage area, to collect milk
over long distances, to transfer technological and managerial improvements for
farmers, and to have qualified human resources (Beber et al. 2019, 2018). Measuring
companies’ efficiency levels and identify their determinants might offer important infor-
mation for policy makers and managers to promote the resilience of production sys-
tems and rural communities.
Based on this background, the main research-question here is which is the right legal
set-up for dairy supply processing companies in developing and emerging economies?
This paper aims to investigate and display the efficiency and productivity differences of
such a typical institutional set-up in a way which reflects the different organizational
forms, namely cooperatives vs IOFs. Therefore, this study adds to the firm-organization
literature by defining the production frontier and estimating the technical efficiency
(TE) levels of dairy processing companies. In summary, the literature is controversial in
what concerns the efficiency of cooperatives and our study contributes with further in-
sights into these debates.
Therefore, in this study, we assess a set of determinants that, according to the litera-
ture, may have a significant impact on the (in)efficiency of dairy processing companies.
First, we included “cooperatives” as a determinant of efficiency. Among the few empir-
ical studies comparing the TE of dairy cooperatives and IOFs, we found different re-
sults showing that both cooperatives and IOFs can be more efficient depending on the
context, the data used, and the objective of the performance measured. Beckmann
Beber et al. Agricultural and Food Economics (2021) 9:23 Page 2 of 22

(2000) suggests that dairy cooperatives perform less efficiently than IOFs due to their
institutional form and their social functions in rural areas. Furesi et al. (2013) also
showed a higher efficiency in favor of IOFs, but found no technological differences be-
tween sheep dairy processing cooperatives and IOFs and Sardinia, Italy. The studies of
Porter and Scully (1987) and Ferrier and Porter (1991) corroborate, showing IOFs to be
more efficient. Hirsch et al. (2020), in an analysis of the European dairy industry, also
reveal that cooperatives are less efficient than IOFs and less flexible, possibly led by the
different objectives of cooperatives (maximizing members’ profits). In this study,
besides company age, the processing plant idleness was one of the main drivers of effi-
ciency. Chaddad (2007a) showed that cooperatives usually add value only in the initial
stages of the industrial process. Furthermore, and with few exceptions, agricultural
cooperatives in developing countries are generally not well prepared to develop a
competitive and efficient commercialization model (Ruiz-Guerra and Molina-Moreno
2014). This fact leads to an increased dependency on other companies to market the
farmers’ production. Scarce capital for investments, and their organizational character-
istics in general, usually slows down the development of such projects (Cook 1995).
The organizational structure of the traditional cooperatives1 has inherently “five vaguely
defined property rights” (Cook 1995) that impact negatively on their organization and
performance (Grashuis 2018). Furthermore, part of the literature also argues that in-
ternal transaction costs might decrease the efficiency of cooperatives. It may occur be-
cause their objectives and decision-making structures are not exclusively focused on
profits and returns on assets, but rather on the interests of the members (Beckmann
2000; Hirsch and Hartmann 2014).
Other authors suggest that cooperatives may be more efficient by having a more con-
servative financial structure. They argue that this can be important for dealing with cri-
sis and changes of policies and for paying higher prices to farmers (Soboh et al. 2014)
from one side. Form the other side, it may alleviate market imperfections and reduce
transaction costs for farmers, for example (von Braun et al. 1989). Other factors making
cooperatives succeed are also the homogeneity of member’s interests and low costs of
ownership. This holds even in the absence of serious market imperfections that would
make market contracting costly for the producers (Hansmann 1996). Singh et al. (2001)
assessing processing plants in India also found cooperatives to be more efficient. The
same outcome was found by Soboh et al. (2014) comparing the efficiency of European
dairy processing firms. They found cooperatives to be slightly less efficient but having a
more productive technology. Finally, Soboh et al. (2012) also used data from European
dairy processing firms to show that cooperatives could either outperform their IOF
counterparts or be outperformed by them, depending on the approach used to account
for the cooperatives’ differential objectives. Studies using approaches other than sto-
chastic frontier analysis (SFA) also found cooperatives to be at least as economically ef-
ficient as other potential forms of organization such as IOFs (Boyle 2004; Soboh et al.
2011). Soboh et al. (2011) also suggest that marketing cooperatives in the Irish dairy
1The Brazilian Federal Law 5764 of 1971 still does not allow for large variations on the traditionalcooperatives’ ownership and governance structures. Although it allows for a proportionality of shares andvotes, this mechanism is rarely found among the cooperatives in the country, and especially in the southernregion, where most of the cooperatives are formed by small-scale farmers. See Beber et al. (2018); Chaddad(2007b) and (2007a) for further details.
Beber et al. Agricultural and Food Economics (2021) 9:23 Page 3 of 22

sector behave “as if” they were profit maximizing companies regarding the prices paid
for the farmers’ milk.
Following other empirical studies, we assume in our study that the cooperatives’ ob-
jective is to maximize a company’s profits, and we want to investigate which
organizational form shows higher levels of efficiency based on the measured output. A
composite measure of the cooperative performance including other objectives2 the co-
operative might have, such as maximizing the members’ welfare, would rather offer a
more precise indicator of their overall performance (Franken and Cook 2013) and
should be considered in further studies.
In our set of determinants of (in)efficiencies, we also included the type of inspection
service adopted by the companies. With this, our intention is to verify whether the level
of sanitary restrictions and the commercialization area have any impact on the effi-
ciency levels. Just as with the sanitary aspects, the quality aspects of the milk processed
by the dairies are also included. We use an indirect approach, controlling for the com-
panies that have a program of payment based on quality premiums/penalties (and not
just quantity). Finally, we also investigate the effects of the idle capacities on
(in)efficiency.
This paper contributes to the literature in three ways—first, we investigate TE in an
intermediate step in the agri-food supply chain, while the vast majority of the literature
focuses on farm-level analysis. Despite the importance of the milk processing industry
for agribusiness in general, the literature investigating the TE of dairies is limited. Fur-
thermore, among the few empirical studies comparing the TE of dairy cooperatives and
IOFs, only a few of them have assessed the determinants of efficiency levels, such as
that of Hirsch et al. (2020). Second, we use a unique own dataset of 243 companies
with data collected at plant level. The few studies assessing TE at the same processing
level use general data from national statistics databases where little or no information
on management practices is available. Third, while most of the available studies on TE
in the processing stage refer to developed countries—where data is more easily
accessed—we conducted this analysis in an emerging economy. Data is often not avail-
able in developing and emerging countries because of the high participation share of
the informal activities (Wilkinson and Rocha 2006), especially in the dairy sector
(Revoredo-Giha and Renwick 2016) and the high costs of data collection.
This study uses data from Paraná, southern Brazil, one of the most promising and dy-
namic dairy production areas in the world3. The socioeconomic and structural charac-
teristics of this area make it an interesting case study for the assessment of attributes
with potential to promote the agro-industrialization in developing and emerging econ-
omies. Consequently, the results contribute for the rural development of several coun-
tries in South America, North, South and South-East Asia, Western Europe, and Africa,
where the dairy sector has an important participation on the agricultural income.
2For further discussion about this topic, Soboh et al. (2009) provide a general overview on the differentperformance measures according to the different objectives of the cooperatives, which range from profitmaximization to members’ welfare maximization and all possible combinations in between. However, theyalso highlight the complexity of comparing companies with such heterogeneity, thus arguing that: “Thelargest part of the existing work on Agricultural Marketing cooperatives assumes a single, well-defined ob-jective.” This is done for simplification throughout economic modelling and the objective of IOFs is thesimplest.3The southern region includes the states of Paraná, Santa Catarina, and Rio Grande do Sul.
Beber et al. Agricultural and Food Economics (2021) 9:23 Page 4 of 22

The article is organized as follows: in the next sections, we present the study area
with context of dairy processing companies in Brazil and how we propose to measure
the efficiency of processing companies. The methodological framework employed and
the Bayesian techniques used to estimate the model are shown in sequence, followed
by a description of the data. Next, the principal results and the discussion are then pre-
sented. The article ends with some concluding remarks and policy implications.
Study areaSouthern Brazil is today the largest dairy producing zone in the country and the state
of Paraná is the third largest dairy state in Brazil, producing 4.7 billion liters, or 13%
(8.9% in 2006) of the national production. This volume was produced by around 87,000
farmers, according to the last agricultural census in the country (IBGE 2018). In com-
parison to the previous censuses, it has observed a constant growth trend in the state.
From 2006 to 2017, there has been an increase of 78% in production, and 71% from
1996 to 2006. Internally, the state also shows large differences in farm sizes and tech-
nology adoption among its regions (IPARDES 2010).
Regarding the processing segment of the chain, in 2017 there were 3809 companies
involved in collecting, processing, reprocessing, and commercializing milk in the coun-
try. These companies employed 135,552 workers, of whom 10,798 (8.0%) in the 295
companies of Paraná (see supplementary material for a detailed description of the dairy
processing segment in Brazil). The dairy industry has grown considerably in the past
years in the whole country, pushed by the increased consumption of dairy products by
the rising middle-class consumers in Brazil. From 2007 to 2017, the Gross Value of In-
dustrial Production (GVIP) of the dairy processing industry has grown by 161.8% in
Brazil and 143.6% in Paraná.
It has also observed a higher share of products with higher added value in 2017
when compared to 2009 (Fig. 1). The participation of fluid milk decreased by − 10
percentage points and powder milk by − 2.7, while cheeses (+ 6.8) and dairy drinks
and yogurts (+ 2.2) increased.
However, these processing companies are not performing well in international mar-
kets. While the trade Brazilian balance of the whole agriculture and agro-food indus-
tries was positive at US$ 60 billion FOB in 2016, the same figure for dairy products
Fig. 1 Share of products in the total GVIP of dairy processing companies in 2009 and 2017. Source: IBGE -Industrial Research
Beber et al. Agricultural and Food Economics (2021) 9:23 Page 5 of 22

with higher added value such as cheese, yogurt, and derivates summed up to US$ −
141 million FOB,4 (OECD and FAO 2015; IBGE 2017). The dairy exports from Brazil
account for less than 1% of the total world exports (FAOSTAT 2019), representing a
low market share in the international market. This represents the low competitiveness
and development of the dairy processing segment in the country.
Another important aspect influencing the commercialization of dairy products in
Brazil is the inspection service for animal products. It is separated into Federal (SIF),
State (SIE), and Municipal (SIM) inspectorates,5 which only allow commercialization
within the scope of their territories. The SIF has more sanitary and quality restrictions
and also allows exports; the SIM has the least, allowing only commercialization at the
level of municipalities. In general, companies adopting the SIM are small companies
because its adoption is cheaper. Companies are allowed to move between such labels.
The Ministry of Agriculture, Livestock and Supply (MAPA) in Brazil intends to consoli-
date the national sanitary inspection systems and create the Brazilian System of Animal
Products Inspection (SISBI-POA). This consolidation would have the effect of levelling
sanitary parameters in accordance to the current SIF.
In general, most of the transactions between processing companies and producers are
done on the spot and the milk is paid based on volumes. However, the use of contracts
is growing as well as payments based on the quality and sanitary parameters of the
milk. This movement is mainly pushed by stronger institutions and the infrastructure
developed in recent years. Monetary incentives offered to dairy producers can encour-
age them to improve milk quality parameters overall. Botaro et al. (2013) have shown a
direct association with a payment program based on milk quality and the reduction of
both somatic cell count (SCC) and total bacterial count (TBC) in southern Brazil. Simi-
lar results were found by Nightingale et al. (2008) in the USA. Thus, we also assess the
effects of different criteria for milk payments on efficiency.
Only in the southern region of Brazil, the main dairy production area in the country
cooperatives collect 46.5% of the milk produced by the 300,000 small-scale family farms
(IBGE 2018, 2006; OCB/Embrapa 2015). The national census of dairy cooperatives
shows that they are losing market share in recent years6.
In 2002, the cooperatives in Brazil were responsible for 40% (5.3 billion liters) of the
total milk collected in the whole country, while 36% was collected in the country’s
southern region (Martins et al. 2004). This amount had generated a total revenue in
the whole country of RS$ 4.91 billion in 2002 or RS$ 0.93 per liter7.
From the total milk collected by the cooperatives, only 44.2% was industrialized,
thereof 49.4% by larger cooperatives. Cooperatives that industrialize less than one third
of their milk earned a gross revenue of about RS$ 0.46 per liter while those industrializ-
ing more than two thirds of their supplies received about RS$ 1.24 per liter. Unfortu-
nately, processing costs are not available for a comparison of profits. Nevertheless,
these numbers represent the higher revenue generated through the value adding,
4FOB - Free On Board, the exporter is responsible for all the costs until the goods are loaded in the agreedmanner of transport via air/sea/land.5The Brazilian quality and sanitary inspection systems are: SIF - Sistema de Inspeção Federal; SIE - Sistemade Inspeção Estadual; SIM - Sistema de Inspeção Municipal6Two censuses were conducted so far, the first in 2002 and the second in 2015.71 US$ = 2.697 RS$ (average 2002); 1.993 RS$ (average 2009); 3.39 RS$ (average 2015); 3.45 RS$ (average2016); 3.19 RS$ (average 2017).
Beber et al. Agricultural and Food Economics (2021) 9:23 Page 6 of 22
industrialization, and commercialization of processed products by larger cooperatives.
It also highlights the importance of economies of scale in the dairy sector (Boysen and
Schröder 2005; Mosheim and Lovell 2009).
The summary from the second national census of dairy cooperatives shows that the
shares of total milk collected by Brazilian cooperatives decreased from 2002 to 35.5%,
despite an increase in total volume (8.54 billion liters) (OCB/Embrapa 2015). However,
in the southern region, their participation increased by 10.5 percentage points in rela-
tion to 2002, showing their capacity to compete against the IOFs in the procurement of
milk. However, these procurement and capacity shifts were accompanied by very low
capacity utilization rates in the cooperatives in 2015. Their installed processing capacity
was reported as a total of 28 million liters/day, with 47% of idle capacity (unused in-
stalled capacity) for the whole of Brazil. In the southern region, the capacity represents
14.1 million liters/day with 41% of idle capacity. Idle capacities can have a considerable
impact on the efficiency levels as showed in the study of Hirsch et al. (2020). The total
revenue of dairy cooperatives in Brazil was listed at around RS$ 7.4 billion in 2015 or
RS$ 0.87 per liter. Less value was added per liter of milk compared to 2002. Cheeses
and dairy drinks account for less than 16% of the total revenue, evidence of a low share
of value-added products in their product portfolios.
Materials and methodsExponential stochastic frontier model
A stochastic production frontier is used to estimate firms’ TE. In particular, we assume
that Ν firms can produce output y by using a vector of inputs x∈RMþ . The production
frontier model (in logarithmic terms) can be written in the following way:
yi ¼ x0iβþ vi−ui; ð1Þ
where y is the logarithm of the output of production, x is a vector of the logarithm of
inputs, β is a vector of parameters to be estimated, vi is a two-sided symmetric error
term that accounts for white noise, and ui is a non-negative one-sided error component
that measures inefficiency. The output is specified as the total revenue of a firm (in
Reais), the vector of inputs x consists of transport distance, labor in number of em-
ployees, and total production capacity. While the two-sided error term vi is assumed to
follow a normal distribution with zero mean and variance σ2v, we assume an exponential
distribution for the inefficiency component ui with the rate parameter λi:
ui � Exp λið Þ ð2Þ
TE estimates, which are bounded on the unit interval, can be obtained by taking the
expectation of e−ui . However, since the objective of this study is not only to examine
the efficiency levels of dairy processing firms but also the determinants of their ineffi-
ciency, the rate parameter λi can be expressed as a function of firm-management char-
acteristics as follows:
λi ¼ ez0iδ ð3Þ
where z is a vector of potential determinants of TE and δ is the L × 1 vector of parame-
ters to be estimated.
Beber et al. Agricultural and Food Economics (2021) 9:23 Page 7 of 22

Bayesian inference
We use Bayesian techniques to estimate the model in Eqs. (1-3) (van den Broeck et al.
1994). Although Bayesian and frequentist techniques constitute two alternative ap-
proaches for measuring efficiency, we prefer the former mainly because latent variables
such as the inefficiency component are integrated out from the likelihood by simply
using simulation through the data augmentation technique, rather than numerical inte-
gration that the frequentist approach uses and can be unstable. Further advantages of
the Bayesian approach include the incorporation of prior beliefs in a transparent way
through the prior distributions and the construction of credible intervals based on the
posterior draws rather than on multiple additional hypothetical samples.
The exponential stochastic frontier model was first introduced by Aigner et al. (1977)
and Meeusen and van den Broeck (1977) and further extended by Koop et al. (1997)
who allowed for the rate parameter of the distribution to be a function of firm charac-
teristics in a panel data setting. The model was also used by Skevas et al. (2018) to cal-
culate the total factor productivity of dairy farms. The likelihood of the model is
written as:
p y; uf gjθ;X;Zð Þ ¼ τN�2
2πð ÞN�2
exp −τ2
XN
i¼1yi−x
0iβþ ui
� �2� �
� λi exp −λiXN
i¼1ui
n oð4Þ
where λi ¼ ez0iδ as presented in Eq. (3).
The complete data likelihood consists of two terms: (i) the probability density func-
tion (pdf) of the normal distribution, which is due to the normality assumption of the
error term vi and (ii) the pdf of the exponential distribution that is assumed for the in-
efficiency component ui.
The prior density includes three terms: two multivariate normal densities for the vec-
tors of parameters β and δ, where prior means are set equal to zero and the covariance
matrices are specified as diagonal with a value of 1000 on the diagonal entries, and the
inverse-Gamma density for the variance parameter σ2v with the shape and scale hyper-
parameters being set equal to 0.001. All parameters to be estimated are collected in a
vector θ ¼ ½β0; σ2v ; δ
0 �0. Then, the posterior distribution of the model is written as:
π θ; uf gjy;X;Zð Þ∝p y; uf gjθ;X;Zð Þ � p θð Þ ð5Þ
where p(y, {u}| θ, X, Z) is the complete data likelihood of the model, and p(θ) is the
prior density of the parameters to be estimated.
The model’s parameters are estimated using the Markov chain Monte Carlo
(MCMC) simulation as this is described in Koop et al. (1995), while the latent vari-
able ui is integrated out of the likelihood using data augmentation (for details, see
Tanner and Wong 1987).
Finally, estimation of the model is performed through BayES software which can be
accessed free of charge at https://www.bayeconsoft.com/index.html.
Beber et al. Agricultural and Food Economics (2021) 9:23 Page 8 of 22

Data and variable construction
In 2008/09, the Paraná Economic and Social Development Institute (IPARDES) con-
ducted a data collection to gather information from the dairy processing companies op-
erating in the state. Data was collected about the characteristics of companies, the
origin and quality control of raw milk, the technological structure, management prac-
tices, institutional choice, policy support, etc. The database is therefore a cross-section
covering 1 year prior to data collection. It included 301 units corresponding to 96% of
the 314 companies and 83% of the processed volume in the state.
From this database, we retained only 243 companies for our study, including 35 co-
operatives and 208 IOFs. The remaining 58 companies were excluded from the sample
because of excessive missing values on the variables of interest, or because of unreason-
able/abnormal values caused by problems during the data collection. We also removed
any dairies with their own herd (no transport involved) and those which processed
from 225 to 3900 l of milk per month (or 7.5 to 130 l per day). They are mostly family-
based farms, with no hired labor and no transport of milk, and generally they produce
a small amount of cheese to sell to the neighborhood. For obvious problems of com-
parison, they were removed from the sample.
The distribution of the companies by yearly turnover size categories is shown in
Table 1. The fourth column in this table presents the size categories adopted by the
IPARDES in Paraná. More than 78% of the companies are classified as micro and small
companies in the first three categories.
We specified the production function with one output (output index) and three in-
puts (total capacity of processing, labor, and transport). Raw milk is not included as an
input because it is reflected by the ×3 = total installed capacity of the companies since
the latter includes the amount of milk per day that the companies process. As evidence,
a correlation of 0.85 is found between × 3 and the raw milk. The choice of variables is
based on the literature on efficiency analysis, where industrial plants are the object of
analysis, as well as the authors’ knowledge of the under analysis. The database does not
provide other inputs used in the production, which are commonly found in the litera-
ture (Baran 2013; Doucouliagos and Hone 2000; Ferrier and Porter 1991; Soboh et al.
2014), like energy and consumables for example, and it does not provide the total rev-
enue of companies for confidentiality purposes”.
Therefore, we used an output index, represented in Brazilian currency (R$ Reais
1000), the most accurate approximation of the total outputs produced by each com-
pany. It is specified in Eq. (1) and its estimation is based on other known variables,
such as the monthly mean volume collected over the last 12 months, the rate of the
specific products produced by the company as available in the dataset, the volume of
Table 1 Size categories of companies in the sample
Size category Frequency Percent IPARDES categories
1. Below R$ 360,000 104 42.8 Micro
2. From R$ 360,001 to R$ 1,200,000 61 25.1 Micro
3. From R$ 1,200,001 to R$ 2,400,000 25 10.3 Small
4. From R$ 2,400,001 to R$ 10,500,000 36 14.8 Medium
5. From R$ 10,500,001 to R$ 60,000,000 11 4.5 Medium/large
6. Above R$ 60,000,001 6 2.4 Large
Beber et al. Agricultural and Food Economics (2021) 9:23 Page 9 of 22

milk necessary to produce each specific product, and their respective prices in that
year. With this estimation, we can capture the efficiencies related to the chosen mix of
products and their respective volumes. The use of physical values as outputs, though
rather seldom, deems appropriate to display the stochastic production frontier as an es-
timate for the technical relation between inputs and outputs. It has been also applied in
the existing literature (Kumbhakar et al. 2009; Mayen et al. 2010; Omondi et al. 2017).
However, quantities may hide information on products’ value added, innovations, re-
gional dominance, and other factors influencing prices and hence revenues, whether up
or down. Changes may occur for the most technically advanced companies, but we do
not expect many of them, ensuring the reliability of this study. Hence, the results
should be interpreted with some caution.
The inputs specified in the X vector in Eq. (1) are the following:
x1 = “Total capacity of processing” represents the full capacity in liters per month of
the processing plants, which is also a proxy for capital;
x2 = “Labor”, represented by the total number of employees in the company. The labor
variable represents the number of employees, as wages and/or salaries are not
available. Such a specification has also been used by Brümmer et al. (2002),
Doucouliagos and Hone (2000), and Ferrier and Porter (1991), who also measured
output in monetary terms;
x3 = “Transport” represents the maximum distance (in km) that each company has to
travel in order to collect the milk from the farthest farmer. This variable is included
because the dairy sector is very demanding in terms of transport since milk, as a
perishable product, has to be collected frequently, which means every 2 days in most
cases. Companies processing milk exclusively from their own herd have a value of
0.01.
Those were the best inputs in the dataset representing the production function. In
this study, the production function is specified in a Cobb-Douglas functional form8.
Table 2 provides the description of the output, input, and Zi variables. It shows coop-
eratives larger than IOFs.
Finally, the z vector in Eq. (3) includes four variables:
z1= “Used capacity of the plant,” defined as the percentage of the used capacity/total
capacity;
z2= A dummy for “cooperatives”;
z3= A dummy representing any “different criteria of payment” different from volume
of milk;
z4 = Three dummy variables are used for the “type of inspection service” adopted, one
for SIF which is the most restrictive and rigorous with 77 companies in the sample,
one for SIM which is the least restrictive with 62 companies in the sample, and one
8The translog would be preferred since it is a flexible functional form that does not impose any restrictionson substitution possibilities between inputs and outputs. However, formal model comparisons based on Bayesfactors suggest that the data favor the Cobb-Douglas specification against the translog. The results from thetwo specifications along with the model comparison quantities are presented in Table 6 in the Appendix.
Beber et al. Agricultural and Food Economics (2021) 9:23 Page 10 of 22

for SIE which is the mid-term with 104 companies in the sample. SIF is used as the
base category
Some theoretically important variables for efficiency such as firm age and prove-
nances of capital, among others, were also included in the initial model specification
but later dropped, not only due to being insignificant but most importantly, because
their chains did not converge.
Results and discussionProduction frontier and scale
Table 3 reports the results of the posterior means, standard deviations, and 90% cred-
ible intervals with respect to inputs and the variance parameters. The elasticities of
labor and total capacity are significant as their respective credible intervals do not con-
tain zero and positively fulfill the monotonicity condition. The positive output elastici-
ties in respect of these inputs indicate that if labor and total capacity increase by 1%,
output grows by 0.33% and 0.79% respectively, all other conditions being equal.
The result on the scale elasticity of 1.12 corroborates this, revealing that companies
operate under increasing returns of scale, which suggests that there is some potential
for firm growth or structural change. A study on the Chilean dairy sector has also
shown that 72.7% of firms are working with increasing returns to scale (Lakner et al.
2017). This result suggests that firms have a margin to grow through organic expansion
and/or mergers, continuing the process of consolidation of the dairy sector in Brazil.
Nderitu and Ndiritu (2018) suggests that mergers and acquisitions may lead to an in-
crease of companies’ market shares, create market dominance, and have a significant
positive effect on product price in the processed milk market in developing economies.
Table 2 Descriptive statistics of the output and inputs
Variable Full sample(n = 243)
Cooperatives(n = 35)
IOFs(n = 208)
Unit Mean (Std. dev.) Mean (Std. dev.) Mean (Std. dev.)
Frontier
y Output 1000 R$ 684,628.50 (2,268,836.00)
1,685,719 (5,255,695)
516,175.70 (1,132,705.00)
x1 Transport km 67.78 (99.58) 82.09 (184.71) 65.37 (77.13)
x2 Labor Persons 24.96 (51.76) 38.77 (99.1) 22.63 (38.48)
x3 Total capacity 1000 l 1,018,322 (2,454,208) 1,754,338 (4,623,248)
894,473 (1,850,341)
TE model
z1 Used capacity % 0.5 (0.23) 0.48 (0.25) 0.5 (0.23)
z2 Cooperatives Dummy 0.14 (0.35)
z3 Different paymentcriteria
Dummy 0.83 (0.38) 0.6 (0.5) 0.87 (0.34)
z4 Type of inspectionservice
3 dummies
SIM 0.26 (0.44) 0.43 (0.5) 0.23 (0.42)
SIE 0.43 (0.5) 0.34 (0.48) 0.44 (0.5)
SIF 0.32 (0.47) 0.23 (0.43) 0.33 (0.47)
Beber et al. Agricultural and Food Economics (2021) 9:23 Page 11 of 22

Examples of mergers of dairy processing companies are present all over the world, such
as Fonterra, Arla Foods, Dairy Farmers of America (DFA), Friesland-Campina,
Deutsches Milchkontor (DMK), Lactalis/Parmalat, and AMUL, among others.
The drivers of such mergers were the structural changes in the food industry, con-
solidation of the productive sector, necessity of technological progress, high price vola-
tility in the 1990s, and little growth in consumption. These drivers increased
competitiveness and forced firms, mostly cooperatives, to gain scale and improve their
operational efficiency in order to be competitive (Chaddad 2007a). Similar develop-
ments have been observed in Brazil over the past several years. Nevertheless, the pro-
portion of organizations merging remains low, either because of disorganization in the
sector or internal conflicts (Beber et al. 2019).
Technical efficiency
Average TE9 for all firms is 77% meaning that the actual output is 23% below its poten-
tial, which implies that output could, on average, be increased by approximately 31.6%
(i.e., ((100/77 − 1) × 100)). This percentage represents the relative measure of TE in
comparison to the most efficient companies in the respective sample. Figure 2 presents
a histogram of the distribution of the companies’ TE scores.
Most of the companies are concentrated in the upper levels of efficiency. However, a
significant number of companies are also seen at the very low levels, where 45 compan-
ies are below 0.6, indicating problems for achieving higher efficiency levels. In Table 4,
the mean efficiency of companies of each size category is represented. It shows the lar-
ger companies in the three upper categories as being more efficient. The heterogenous
results on TE suggest the coexistence of a “dual structure” in the milk processing in-
dustry in Paraná. Companies show a high level of technology adoption, marketing cam-
paigns, professionalism, and larger scales on the one side. On the other side, there are
companies based on small family farms and producers’ cooperatives for milk collection.
Table 3 Posterior means, standard deviations, and 90% intervals with respect to inputs, thedeterminants of lambda, and the variance parameter
Variable Mean Std. dev. 90% credible interval
Constant 0.292 0.050 [0.208, 0.374]
Transport costs 0.005 0.014 [− 0.018, 0.028]
Labor 0.325 0.048 [0.246, 0.404]
Production capacity 0.791 0.038 [0.728, 0.852]
Constant 1.291 0.436 [0.700, 2.135]
Used capacity 1.789 0.243 [1.417, 2.211]
Dummy for cooperatives 1.014 0.492 [0.282, 1.885]
Dummy for different payment criteria 0.066 0.296 [− 0.445, 0.529]
SIE 0.281 0.311 [− 0.244, 0.770]
SIM 0.738 0.424 [0.040, 1.436]
σv 0.356 0.027 [0.314, 0.401]
9The mean value of TE is obtained by taking the mean of minus the exponential of the posterior draws of u_iacross iterations and firms.
Beber et al. Agricultural and Food Economics (2021) 9:23 Page 12 of 22

These companies remain active for any reason that may guarantee them a market for
their products. It could be the remoteness and the anti-competitive effects in some
areas, ensured by a monopolistic/monopsonistic position (Hansmann 1996) as evi-
denced by Revoredo-Giha and Renwick (2016) in the Malawian dairy sector. They
showed that the processing industry has either market power in both the output and
input market and/or a niche market. The same is also evidenced by different studies of
SMEs in the food sector in Europe (Gardebroek et al. 2010; Ilbery and Kneafsey 1999;
Olsen et al. 2012; Shaw et al. 1999). These firms are offering the sole choice of dairy
products to some costumers and, in some cases, acting as the only buyers of milk from
the farmers. In the same direction, Lerman and Parliament (1991), using financial indi-
cators, also reveal that small-regional dairy cooperatives have higher profitability and
overall performance than larger ones.
Adding to this, in Paraná, some companies were created with the sole purpose of tak-
ing advantage of governmental programs for institutional purchase, like the “Programa
Leite das Crianças” (Children’s Milk Program) or the “Programa Leite do Paraná”
(Paraná’s Milk Program). Generally, such companies are new to the market and have
government purchases as their core business, which generates strong dependence. In
these cases, there are fewer incentives to professionalize the management, design mar-
keting strategies, or become more efficient.
Strong criticism on the effectiveness of such government incentives in the agricultural
sector is attributed to Schultz (1964). In his “poor, but efficient” hypothesis, he states
Fig. 2 Histogram of technical efficiency scores
Table 4 Mean TE of each size category of companies
Size category Mean TE. Std. Dev. Frequency
1. Below R$ 360,000 74.13 22.38 104
2. From R$ 360,001 to R$ 1,200,000 77.16 19.85 61
3. From R$ 1,200,001 to R$ 2,400,000 76.64 17.16 25
4. From R$ 2,400,001 to R$ 10,500,000 82.84 11.53 36
5. From R$ 10,500,001 to R$ 60,000,000 90.78 4.09 11
6. Above R$ 60,000,001 84.71 18.84 6
Beber et al. Agricultural and Food Economics (2021) 9:23 Page 13 of 22

that the provision of agricultural incentives will be ineffective in improving productivity
and incomes when investment opportunities are limited. For instance, in developing
and emerging countries, such opportunities could be limited due to technological ac-
cess and good managerial practices or even credit access. Therefore, the end of govern-
mental incentives generally determines the end of such firms (Beber et al. 2018).
Determinants of efficiency
Since one of the main contributions of this study lies in the explanation of TE hetero-
geneity due to firm-specific characteristics, we derived the marginal effects of the vari-
ables in z on TE10. These marginal effects are calculated at the mean values of the
continuous variables, while for the dummy variables they are calculated for discrete
changes from 0 to 1 and are presented in Table 5. Additionally, although there exists a
debate on whether marginal effects should be calculated unconditionally (Wang 2002)
or conditionally (Kumbhakar and Sun 2013) on the composed residual, we choose to
calculate them unconditionally on the composed residual, because inefficiency itself is
also obtained unconditional on the composed residual, as it is the case with the data
augmentation techniques used in the utilized Bayesian framework. Three out of four
marginal effects are statistically significant. The payment criteria for different volumes
of milk is not significant, so firms are not more or less efficient in paying prices to pro-
ducers based on quality or other characteristics of the milk. This characteristic might
have an effect on farmers’ efficiency, which should be further investigated.
Organizational form
Cooperatives are, in general, 0.09% more efficient than IOFs. The average efficiency of
cooperatives is 83.4, while that of IOFs is 76.411. The descriptive statistics in Table 2
shows that cooperatives have 3.3 times higher outputs than IOFs, but both have similar
used capacities of around 50%. At the same time, cooperatives have only 1.26 times
higher the maximum distance of transport and 1.71 times higher the labor. That means
that cooperatives are indeed using their inputs more efficiently than IOFs, contradicting
Hind (1999) who argued that cooperatives are less efficient in input use. On the other
hand, it corroborates the study of Soboh et al. (2014) which, using data from European
dairies, showed that cooperatives have higher physical productivity but are also more
marketing efficient. The alignment of the objectives of the cooperative and its members
can provide an advantage over the IOFs (Bontems and Fulton (2005). Reduction of risk
(confidence) and better technical support might also account for the higher quality
products supplied by the cooperatives’ farmers (Cechin et al. 2013). This result also
highlights the importance of scale in agriculture and that cooperatives offer a strategic
solution to increase scale (Linn and Maenhout 2019).
Weak institutions and their associated market imperfections, especially in rural zones
of developing and emerging economies, raise the costs of market contracting in
10Note that the variables in z associated with a positive parameter have a positive impact on lambda, anegative impact on inefficiency (given that inefficiency = 1/lambda) and consequently a positive effect onefficiency.11If we take the mean of minus the exponential of the posterior draws of u_i only across iterations, we get anefficiency score for each firm in the sample. Then, we can take (a) the mean of the efficiency scores forcooperatives and report it; (b) the mean for IOFs and report it; (c) the mean for firms adopting the SIE andreport it; and (d) the mean for firms adopting the SIF and report it.
Beber et al. Agricultural and Food Economics (2021) 9:23 Page 14 of 22

Paraná’s dairy sector (Beber et al. 2019). Thus, transactions within cooperatives are
likely to provide higher organizational efficiency, according to Hansmann (1996). The
same author argued that cooperatives might enjoy monopsony power to some extent,
due to the relative high distances from farmers to competing processing companies in
rural zones and the high perishability of the milk. Further studies accounting for such
contractual costs between farmers and cooperatives or IOFs and the cooperatives’ mon-
opsony power should provide further evidence on such hypotheses.
The more conservative financial structure of the cooperatives may also bring advan-
tages to dealing with such changes of context, crisis, and policies. Soboh et al. (2011)
have demonstrated that cooperatives have a stronger financial position than IOFs and
are well equipped for making any necessary investments for such adaptation. They are
on average less profitable but pay higher prices to farmers, are more attractive, and op-
erate more efficiently. However, different cooperative ownership structures are emer-
ging in the agri-food section in an attempt to seek external capital sources for large-
scale investments (Grashuis 2018). The loss of decision power by the farmers inside
such structures remains a question for the long-term survival of these cooperatives and
promotes an intense debate in the literature (Chaddad and Cook 2004).
Used capacity in processing plants
As expected, higher used capacity in processing plants increases the efficiency of the
firms. In this regard, an increase in used capacity of 1% leads to an efficiency increase
of 0.22%. It is also very likely to affect the efficient use of the input total capacity. Fig-
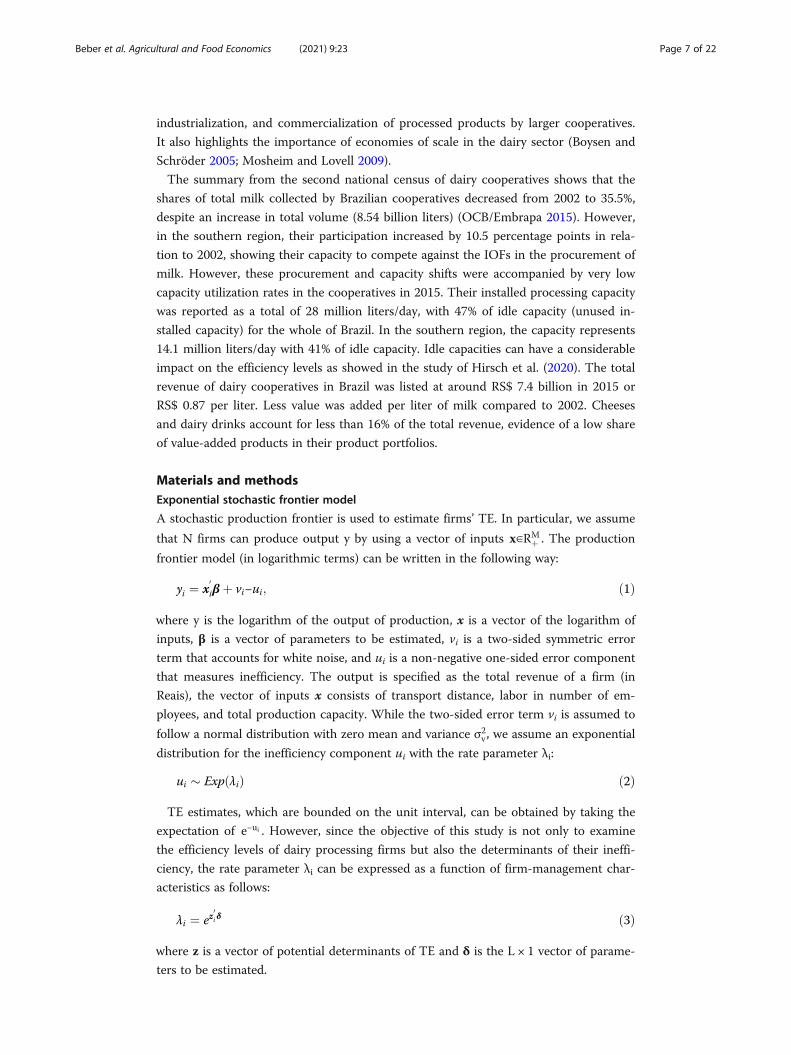
ure 3 shows the strong relation between TE and the used capacities.
It is important to highlight that we assumed the production technology operating at
static cost-minimizing input levels, where all inputs are fully adjusted to their long-run
equilibrium levels within one period. However, “total capacity” could instead be as-
sumed as a quasi-fixed input, i.e., not completely, instantaneously adjusted in response
to changes in factor prices and at no cost. This would imply that companies presenting
idleness in the short-term may not present it over the long term, as their total capaci-
ties are adjusted over time. A formal test of such long-term adjustment to this quasi-
fixed factor (total capacity) would confirm if those companies are indeed over-
capitalized and operating with inefficient idle capacities or, instead, achieving long-term
equilibrium with total capacity optimally adjusted (Kulatilaka 1985; Morrison 1985). In
the latter case, companies may still have idle capacity due to other management short-
comings, but its dimension would be rather smaller.
However, a previous study on the same area (Beber et al. 2019) provided us with a
strong indication that idle capacities are mostly due to management shortcomings and
Table 5 Marginal effects of the variables in Z on TE
Variable Mean Std. dev. 90% credible interval
Used capacity 0.219 0.032 [0.166, 0.272]
Dummy for cooperatives 0.092 0.035 [0.033, 0.147]
Dummy for different payment criteria 0.010 0.036 [− 0.049, 0.069]
SIE 0.035 0.037 [− 0.028, 0.095]
SIM 0.078 0.043 [0.005, 0.145]
Beber et al. Agricultural and Food Economics (2021) 9:23 Page 15 of 22
we therefore decided to include this variable in the efficiency model. In this parallel
study, the authors conducted semi-structured interviews with the managers and direc-
tors of processing companies in this region, asking directly about the existence and
sources of “idle capacities.” Most of the interviewees confirmed the existence of long-
term idle capacities (even in high-season periods) due to disputes in supply control, a
lack of loyalty among suppliers and poor management planning of processing among
others (Beber et al. 2019), reinforcing our decision. It therefore could not be considered
a short-term effect of cyclical fluctuation. It is also not possible to attribute these “idle
capacities” to an inflationary pressure on costs of changes in aggregate demand, as
since 2009, inflation has been under control and demand for dairy products has been
increasing in Brazil.
This indication of “over-capitalization” may also have an historical explanation. Dur-
ing the 1980s and 1990s, investment credits were given to cooperatives and other agri-
cultural processing companies without technical and managerial support. So huge
unplanned investments were made with these subsidized loans, with the building of
large processing plants without any strategic plan for their supply or for the
commercialization of their production. Idle capacities were therefore created (Escher
2011) which may persist over time (see descriptive statistics in Table 2). Indications of
over-capitalization leading to idleness of dairy processing plants are also evidenced in
the study of Furesi et al. (2013); however, the seasonal component indeed play a role in
this case.
Inspection services
Contrary to what was expected, the companies linked to the inspection services that
are more restrictive on sanitary and quality parameters for dairy products are shown to
be less efficient. Firms that adopt the SIE do not exhibit statistically significant (in)effi-
ciency differences when compared to those that adopt the SIF as the respected param-
eter estimate is statistically insignificant. However, the parameter with respect to SIM
Fig. 3 Scatter plot of TE and (log) used capacity of processing companies
Beber et al. Agricultural and Food Economics (2021) 9:23 Page 16 of 22

is positive and statistically significant, suggesting that firms that adopt the SIM are
more efficient than those that adopt the SIF.
The marginal effects presented on Table 5 reveal that firms adopting the SIM are
7.8% more efficient than those adopting the SIF. The average efficiency of companies
adopting SIE and SIF is similar, at 77.2; however, those adopting SIM have a higher
score of 78.1.
A possible explanation for this result is the fact that more stringent sanitary con-
ditions increase the use of factors such as labor, decreasing the efficiency of com-
panies, especially related to the use of this input. More workers might be needed
for companies to cope with the higher standards of SIF and SIE for instance. An-
other possible cause is that sanitary controls may not be the reason for the de-
crease in efficiency, but rather the market region. Companies adopting the SIM are
only allowed to sell their products inside the municipality. Generally such compan-
ies are specialized in more specific added-value products, competing on higher
margin products but at lower quantities than the large dairies. Mostly they do not
compete for the low-added-value products such as drinking milk, butter, or pow-
dered milk, for example, for production scale reasons. This result is probably ex-
plained by the portfolio of products produced to attend such markets, having
higher added-value products like special cheeses, yogurts, dulce de leche, among
others. For this reason, they may be competing in niches with products permitting
them to achieve higher outputs with the same amount of inputs (Ilbery and Kneaf-
sey 1999; Olsen et al. 2012; Shani and Chalasani 1992; Shaw et al. 1999). Further
studies on such niches should be conducted to confirm this hypothesis.
Conclusions and implicationsThis article specifies a stochastic production frontier and estimates the TE and its de-
terminants for processing companies in the State of Paraná in southern Brazil. The de-
terminants of inefficiency captured in this study relate to reducing their idle capacities
and management shortcomings in order to considerably improve efficiency. Another
important result concerns the adoption of the different inspection services. More re-
strictive ones regarding the sanitary characteristics of products decrease the efficiency
of companies. Cooperatives are in general more efficient than IOFs.
Cooperatives have developed a functioning business model which shows that inclu-
sion of cooperative members is possible, despite particular problems which they must
overcome, such as higher transaction costs and the five vaguely defined property rights
inherent to the traditional cooperatives. Descriptive results show that cooperatives in
Paraná have higher outputs, and the determinants of efficiency also show cooperatives
to be more efficient. They operate at a more efficient scale than the IOFs but also add
more value to the final products. Despite being more efficient, this organizational form
provides several benefits to the farmers besides the monetary, and therefore should be
supported by specific public policies.
Our results suggest that the investigated cooperatives might behave slightly differ-
ently to those of other cooperatives analyzed in the literature: In Brazil, since the mid-
1990s, a globalization/modernization movement of the dairy sector has been observed,
with consequent increased competitive pressures and concentration of processing com-
panies. This movement can be attributed to several political and organizational factors
Beber et al. Agricultural and Food Economics (2021) 9:23 Page 17 of 22

such as the liberalization of markets in Brazil that removed government control over
milk prices, the reduction of trade barriers, the creation of Mercosur—with Argentina
and Uruguay having a much more developed dairy sector competing in Brazil—and the
installation of large retailers undermining the local character of cooperatives, among
others (Beber et al. 2018). Companies, and specifically the cooperatives, are merging
and seemingly behaving in a more profit-oriented fashion, which extends the existing
view on cooperatives for this specific case of Brazil.
Considering a composite objective measure could be the subject of future re-
search in the comparison of cooperatives and IOFs. In this paper, we have used
the assumption of profit maximization. It should be noted in a broader sense that
cooperatives have a larger utility function beyond pure profit maximization, which
can be captured by qualitative variables like preferences or attitudes. Still, profit
takes a large proportion of the utility. Since these variables were not available, this
paper had to focus on the pure economic aspects of the utility function, which is
also done in other studies in the field.
Since companies operate under increasing returns to scale, a planned increase in
the size of companies through mergers and/or acquisitions or organic growth
would lead operations at a more efficient scale, specifically for the IOFs in our
sample which are smaller than the cooperatives, always carefully avoiding idleness.
The avoidance of unplanned overinvestments that might create such idleness is
crucial. Outsourcing and strategic alliances may also reduce idle capacity in dairy
firms and increase their competitiveness, particularly when combined with technical
assistance measures to reduce production seasonality among farmers. Policies pro-
moting technical assistance and facilitating merges and credit lines for expansion
would benefit companies in this regard.
Despite companies which adopt SIM are shown to be more efficient, this does not
mean that less concern for sanitary measures is the reason for such higher efficiency.
The literature shows evidence that higher sanitary measures may lead stakeholders to
access further markets in modern supply chains (Dries et al. 2009), but the necessary
investments to meet such requirements may also lead companies to exit (Noev et al.
2009). Some firms access more markets by achieving higher standards, but small com-
panies go bankrupt when such standards are simply imposed. With the implementation
of the new national inspection system in Brazil, a time for adaptation and a follow-up
of the transition process must therefore be carefully considered in order to avoid un-
necessary prejudices. Therefore, governmental support for the transition period must
be provided in order to avoid such exclusion.
Our results provided policymakers and managers with important information
with which to design measures to improve firm performance and minimize the risk
of hardship caused by the shutdown of dairy enterprises in rural communities.
Despite some changes having actually occurred in the dairy sector in southern
Brazil since the data was collected, they are not radical, as can be observed in the
“Study area” section. Companies are still facing the challenges which were present
in 2009, especially because since then, the crises of 2008 and 2015 that affected
several countries have slowed down investments and consequent progress. The
lower competitive pressures in the dairy sector in this zone, when compared to
other sectors such as soybean and meat, for example, have also slowed the
Beber et al. Agricultural and Food Economics (2021) 9:23 Page 18 of 22

evolution process. Thus, companies remain with inefficiencies and the need to
overcome them, ensuring these conclusions are relevant.
Other countries and Brazilian regions with similar characteristics can also benefit
from this study’s conclusions, which is the case of Minas Gerais and the northeast-
ern states, for instance. The dairy production in these states is also centered in
family farms, cooperatives, and SMEs, and also has quality and sanitary problems
and the same inspection services, likely facing similar challenges to improve effi-
ciency. The same is valid for the dairy sector of other countries, especially for
those dairy production zones in a lower or analogous socioeconomic and structural
level of development to southern Brazil. Policy makers and managers planning to
deal with the inefficiencies in their dairy industry can learn from these results, es-
pecially regarding the benefits of cooperatives and the problem of idleness in dairy
processing plants.
This study provides an insightful contribution to the literature on firm organization
in the agribusiness sector with the assessment of dairy processing companies in south-
ern Brazil. It contributes especially to the debates about the performances of the coop-
eratives, showing cooperatives to be more efficient than IOFs. Overall, our results
suggest a set of determinants that should be targeted at actions aiming to improve the
TE of dairy processing companies in southern Brazil, a prominent strong competitor in
the global dairy chain.
AppendixTable 6 Results from the Cobb-Douglas and translog specifications
Cobb-Douglas Translog
Variable Mean Std. dev. 90% C.I. Mean Std. dev. 90% C.I.
Constant 0.292 0.050 [0.208, 0.374] 0.115 0.067 [0.005, 0.226]
Tr. costs 0.005 0.014 [− 0.018, 0.028] 0.077 0.031 [0.025, 0.128]
Labor 0.325 0.048 [0.246, 0.404] 0.224 0.054 [0.135, 0.313]
Prod. cap. 0.791 0.038 [0.728, 0.852] 0.801 0.038 [0.739, 0.864]
Tr. costs x labor – – – − 0.025 0.022 [− 0.061, 0.011]
Tr. costs x Prod. cap. – – – 0.039 0.012 [0.018, 0.059]
Labor x Prod. cap. – – – − 0.138 0.079 [− 0.268, − 0.008]
Tr. costs2 – – – 0.003 0.012 [− 0.017, 0.023]
Labor2 – – – 0.267 0.109 [0.089, 0.447]
Prod. cap.2 – – – 0.069 0.062 [− 0.032, 0.171]
σv 0.356 0.027 [0.314, 0.401] 0.354 0.023 [0.317, 0.393]
Constant 1.291 0.436 [0.700, 2.135] 1.736 0.470 [1.011, 2.545]
Used capacity 1.789 0.244 [1.417, 2.211] 1.894 0.276 [1.467, 2.363]
D. cooperatives 1.014 0.492 [0.282, 1.885] 0.709 0.510 [− 0.055, 1.603]
D. payment criteria 0.066 0.296 [− 0.445, 0.529] − 0.185 0.320 [− 0.732, 0.317]
SIE 0.281 0.311 [− 0.244, 0.770] 0.243 0.337 [− 0.312, 0.782]
SIM 0.738 0.424 [0.040, 1.436] 0.615 0.465 [− 0.154, 1.375]
Marg. log lik. − 192.107 − 223.681
Post. prob. 1.000 0.000
Beber et al. Agricultural and Food Economics (2021) 9:23 Page 19 of 22

AbbreviationsFOB: Free On Board; GVIP: Gross Value of Industrial Production; IOF: Investor-owned firm; IPARDES: Paraná Economicand Social Development Institute; MAPA: Ministry of Agriculture, Livestock and Supply; SCC: Somatic cell count;SFA: Stochastic frontier analysis; SIE: State Inspection Service; SIF: Federal Inspection Service; SIM: Municipal InspectionService; SISBI-POA: Brazilian System of Animal Products Inspection; SME: Small and Medium Enterprise; TBC: Totalbacterial count; TE: Technical efficiency; UHT: Ultra-high temperature
Supplementary InformationThe online version contains supplementary material available at https://doi.org/10.1186/s40100-021-00195-3.
Additional file 1.
AcknowledgementsWe would like to thank the “Institute of Economic and Social Development of Paraná (IPARDES)” for providing us thedatabase used for the analysis.
Authors’ contributionsAll authors read and approved the final manuscript
FundingCAPES/CNPq Science without Borders - Brazil. Open Access funding enabled and organized by Projekt DEAL.
Availability of data and materialsThe data that support the findings of this study are available from “Institute of Economic and Social Development ofParaná (IPARDES)” but restrictions apply to the availability of these data, which were used under license for the currentstudy, and so are not publicly available. Data are however available from the authors upon reasonable request andwith permission of “Institute of Economic and Social Development of Paraná (IPARDES)”.
Declarations
Competing interestsThe authors declare that they have no competing interestsinterests.
Author details1Department of Agricultural Economics and Rural Development, Georg-August-University Göttingen, Platz derGöttinger Sieben 5, 37073 Gottingen, Germany. 2Chair of Agricultural Economics, Agricultural and EnvironmentalScience Faculty, University of Rostock, Justus-von-Liebig-Weg 7, 18059 Rostock, Germany. 3Department of FoodBusiness and Development, Cork University Business School, West Wing, Main Quadrangle, University College Cork,Cork, Ireland T12 K8AF.
Received: 25 August 2020 Revised: 4 May 2021Accepted: 21 May 2021
ReferencesAigner D, Lovell CAK, Schmidt P (1977) Formulation and estimation of stochastic frontier production function models. J.
Econom. 6:21–37 https://doi.org/10.1016/0304-4076(77)90052-5Baran J (2013) Efficiency of the production scale of Polish dairy companies based on Data Envelopment Analysis. Acta Sci Pol
Oeconomia 12:5–13Beber CL, Carpio AFR, Almadani MI, Theuvsen L (2019) Dairy supply chain in Southern Brazil: barriers to competitiveness. Int
Food Agribus Manag Rev:1–24 https://doi.org/10.22434/IFAMR2018.0091Beber CL, Theuvsen L, Otter V (2018) Organizational structures and the evolution of dairy cooperatives in Southern Brazil: a
life cycle analysis. J Co-op Organ Manag. https://doi.org/10.1016/j.jcom.2018.06.003Beckmann V (2000) Transaction costs and institutional choice in agriculture – between market, hierarchy and cooperation (in
German), Berliner Schriften zur Kooperationsforschung. Ed. Sigma, BerlinBerdegué J (2001) Cooperating to compete: associative peasant business firms in Chile. Wageningen University, WageningeBontems P, Fulton M (2005) Organizational structure and the endogeneity of cost: Cooperatives, For-Pro…t Firms and the
cost of procurement 1–37Botaro BG, Gameiro AH, dos Santos MV (2013) Quality based payment program and milk quality in dairy cooperatives of
Southern Brazil: an econometric analysis. Sci Agric 70:21–26Boysen O, Schröder C (2005) Economies of Scale in der Produktion versus Diseconomies im Transport: zum Strukturwandel in
der Milchindustrie, Diskussionsbeiträge des Fachbereichs Wirtschaftswissenschaft der Freien Universität BerlinVolkswirtschaftliche Reihe. Freie Univ, Berlin
Boyle GE (2004) The economic efficiency of Irish dairy marketing co-operatives. Agribusiness 20:143–153 https://doi.org/10.1002/agr.20000
Brümmer B, Glauben T, Thijssen G (2002) Decomposition of productivity growth using distance functions: the case of dairyfarms in three European countries. Am J Agric Econ 84:628–644
Carvalho VRF (2008) Tese - Reestruturação do Sistema Lácteo Mundial: Uma Análise da Inserção Brasileira. UniversidadeEstadual de Campinas - Instituto de Economia, Campinas
Cechin A, Bijman J, Pascucci S, Zylbersztajn D, Omta O (2013) Quality in Cooperatives versus investor-owned firms: evidencefrom broiler production in Paraná, Brazil. Manag Decis Econ 34:230–243 https://doi.org/10.1002/mde.2586
Beber et al. Agricultural and Food Economics (2021) 9:23 Page 20 of 22

Chaddad (2007a) Cooperativas no agronegócio do leite: mudanças organizacionais e estratégicas em resposta à globalização.Organ. Rurais Agroindustriais 9:69–78
Chaddad (2007b) The evolution of Brazilian dairy cooperatives: a life cycle approach. In: XLV Congresso Da Sober,"Conhecimentos Para Agricultura Do Futuro". Londrina, pp. 22–25
Chaddad FR, Cook ML (2004) Understanding new cooperative models: an ownership–control rights typology. Appl EconPerspect Policy 26:348–360 https://doi.org/10.1111/j.1467-9353.2004.00184.x
Chaddad FR, Jank MS (2006) The evolution of agricultural policies and agribusiness development in Brazil. Choices 21:85–90Chagwiza C, Muradian R, Ruben R (2016) Cooperative membership and dairy performance among smallholders in Ethiopia.
Food Policy 59:165–173 https://doi.org/10.1016/j.foodpol.2016.01.008Cook ML (1995) The Future of U.S. Agricultural cooperatives: a neo-institutional approach. Am J Agric Econ 77:1153–1159
https://doi.org/10.2307/1243338Doucouliagos H, Hone P (2000) The efficiency of the Australian dairy processing industry. Aust J Agric Resour Econ 44:423–
438Dries L, Germenji E, Noev N, Swinnen JFM (2009) Farmers, vertical coordination, and the restructuring of dairy supply chains
in Central and Eastern Europe. World Dev. 37:1742–1758 https://doi.org/10.1016/j.worlddev.2008.08.029Escher F (2011) Os Assaltos do Moinho Satânico nos Campos e os Contramovimentos da Agricultura Familiar (Master in Rural
Development). Universidade Federal do Rio Grande do Sul, Porto AlegreFAOSTAT (2019) Food and Agriculture Organization of the United Nations. FAOSTAT Statistics Database [WWW Document].
URL http://www.fao.org/faostat/en/#home. Accessed 18 Mar 2019Ferrier GD, Porter PK (1991) The productive efficiency of US milk processing co-operatives. J Agric Econ 42:161–173Franken JR, Cook ML (2013) Informing Measurement of Cooperative Performance, in: Interfirm Networks. Presented at the
International Conferences on Economics and Management of Networks – EMNet, Springer, Agadir, Morocco, pp 209–226Furesi R, Madau FA, Pulina P (2013) Technical efficiency in the sheep dairy industry: an application on the Sardinian (Italy)
sector. Agric Food Econ. 1:4 https://doi.org/10.1186/2193-7532-1-4Gardebroek C, Turi KN, Wijnands JHM (2010) Growth dynamics of dairy processing firms in the European Union. Agric Econ
41:285–291 https://doi.org/10.1111/j.1574-0862.2010.00447.xGrashuis J (2018) Joint ownership by farmers and investors in the agri-food industry: an exploratory study of the limited
cooperative association. Agric Food Econ 6:24 https://doi.org/10.1186/s40100-018-0118-0Gupta K, Roy D (2012) Gains from coordination in milkfed dairy in Punjab. J Agribus Dev Emerg Econ 2:92–114
https://doi.org/10.1108/20440831211272571Hansmann H (1996) The ownership of enterprise. The Belknap Press of Harvard University Press, CambridgeHind A (1999) Cooperative performance–is there a dilemma. J Coop. 14:30–43Hirsch S, Hartmann M (2014) Persistence of firm-level profitability in the European dairy processing industry. Agric Econ 45:
53–63 https://doi.org/10.1111/agec.12129Hirsch S, Mishra A, Möhring N, Finger R (2020) Revisiting firm flexibility and efficiency: evidence from the EU dairy processing
industry. Eur Rev Agric Econ https://doi.org/10.1093/erae/jbz003IBGE (2006) IBGE :: Instituto Brasileiro de Geografia e Estatística. Censo Agropecuário 2006. [WWW Document].
http://www.ibge.gov.br/home/ (Accessed 26 Oct 15).IBGE (2017) IBGE :: Instituto Brasileiro de Geografia e Estatística. Censo Agropecuário 2017. [WWW Document].
http://www.ibge.gov.br/home/ Accessed 11 Apr 15IBGE (2018) IBGE :: Instituto Brasileiro de Geografia e Estatística - Pesquisa da Pecuária Municipal [WWW Document].
http://www.ibge.gov.br/home/ (Accessed 26 Oct 15).Ilbery B, Kneafsey M (1999) Niche markets and regional speciality food products in Europe: towards a research agenda.
Environ Plan Econ Space 31:2207–2222 https://doi.org/10.1068/a312207IPARDES (2010) Caracterização da Indústria de Processamento e Transformação do Leite no Paraná. Instituto Paranaense de
Desenvolvimento Econômico e Social - IPARDES, CuritibaKoop G, Osiewalski J, Steel MFJ (1997) Bayesian efficiency analysis through individual effects: hospital cost frontiers.
J Econom. 76:77–105 https://doi.org/10.1016/0304-4076(95)01783-6Koop G, Steel MF, Osiewalski J (1995) Posterior analysis of stochastic frontier models using gibbs sampling. Comput Stat. 10:
353–373Kulatilaka N (1985) Tests on the validity of static equilibrium models. J Econom. 28:253–268Kumbhakar SC, Sun K (2013) Derivation of marginal effects of determinants of technical inefficiency. Econ Lett 120:249–253
https://doi.org/10.1016/j.econlet.2013.04.041Kumbhakar SC, Tsionas EG, Sipiläinen T (2009) Joint estimation of technology choice and technical efficiency: an
application to organic and conventional dairy farming. J Product Anal 31:151–161 https://doi.org/10.1007/s11123-008-0081-y
Lakner S, Brenes-Muñoz T, Brümmer B (2017) Technical Efficiency in Chilean Agribusiness Industry: A Metafrontier Approach.Agribusiness. https://doi.org/10.1002/agr.21493
Lerman Z, Parliament C (1991) Size and industry effects in the performance of agricultural cooperatives. Agric Econ 6:15–29https://doi.org/10.1016/0169-5150(91)90013-B
Linn T, Maenhout B (2019) The impact of environmental uncertainty on the performance of the rice supply chain in theAyeyarwaddy Region, Myanmar. Agric Food Econ 7:11 https://doi.org/10.1186/s40100-019-0128-6
Magalhães RS (2007) Habilidades sociais no mercado de leite. RAE-Rev Adm Empres 47:15–25Martins PDC, Álvares JG, Barros GDC, Nogueira Netto V, Barroso M (2004) O futuro do cooperativismo de leite.
Embrapa Gado de Leite, Juiz de Fora, MGMayen CD, Balagtas JV, Alexander CE (2010) Technology adoption and technical efficiency: organic and conventional dairy
farms in the United States. Am J Agric Econ 92:181–195Meeusen W, van Den Broeck J (1977) Efficiency estimation from Cobb-Douglas production functions with composed error.
Int Econ Rev. 18:435 https://doi.org/10.2307/2525757Morrison CJ (1985) Primal and dual capacity utilization: an application to productivity measurement in the U.S. automobile
industry. J Bus Econ Stat 3:312 https://doi.org/10.2307/1391716
Beber et al. Agricultural and Food Economics (2021) 9:23 Page 21 of 22

Mosheim R, Lovell CK (2009) Scale economies and inefficiency of US dairy farms. Am J Agric Econ 91:777–794Nderitu PC, Ndiritu SW (2018) Effects of mergers on processed milk market in Kenya. J Agribus Dev Emerg Econ 8:480–500
https://doi.org/10.1108/JADEE-04-2016-0021Nguyen VK, Thi Hai Yen H, Van Khai T, To LH, Duc NT (2018) Key analysis of the dairy value chain in Vietnam: the case of Bavi.
J Agribus Dev Emerg Econ 8:222–233 https://doi.org/10.1108/JADEE-06-2016-0041Nightingale C, Dhuyvetter K, Mitchell R, Schukken Y (2008) Influence of variable milk quality premiums on observed milk
quality. J Dairy Sci 91:1236–1244 https://doi.org/10.3168/jds.2007-0609Noev N, Dries L, Swinnen JFM (2009) Institutional change, contracts, and quality in transition agriculture: evidence from the
Bulgarian dairy sector. East Eur Econ 47:62–85 https://doi.org/10.2753/EEE0012-8775470404OCB/Embrapa, 2015. Censo das Cooperativas do Leite, 2015 – síntese dos resultados.OECD, FAO (2015) OECD-FAO Agricultural Outlook 2015, OECD-FAO Agricultural Outlook. OECD Publishing, ParisOlsen NV, Elvekrok I, Nilsen ER (2012) Drivers of food SMEs network success: 101 tales from Norway. Trends Food Sci Technol
26:120–128 https://doi.org/10.1016/j.tifs.2012.01.008Omondi I, Rao EJO, Karimov AA, Baltenweck I (2017) Processor linkages and farm household productivity: evidence from dairy
hubs in East. PROCESSOR LINKAGES AND FARM HOUSEHOLD PRODUCTIVITY. Agribusiness, Africa https://doi.org/10.1002/agr.21492
Porter PK, Scully GW (1987) Economic efficiency in cooperatives. J Law Econ 30:489–512Revoredo-Giha C, Renwick A (2016) Market structure and coherence of international cooperation: the case of the dairy sector
in Malawi. Agric Food Econ. 4:8 https://doi.org/10.1186/s40100-016-0052-yRuiz-Guerra I, Molina-Moreno V (2014) La intangibilidad de las cooperativas como ventaja competitiva. Coop. Desarro.
22:47–54Schultz TW (1964) Transforming traditional agriculture, science & its conceptual foundations. Yale University Press, New
HavenShani D, Chalasani S (1992) Exploiting niches using relationship marketing. J Consum Mark. 9:33–42Shaw DS, Shaw AC, Shaw SS, Leigh R (1999) The single European market and SMEs: a comparison of its effects in the food
and clothing sectors in the UK and Portugal. Reg Stud. 33:51–62 https://doi.org/10.1080/00343409950118913Singh S, Coelli T, Fleming E (2001) Performance of dairy plants in the cooperative and private sectors in India. Ann Public
Coop Econ. 72:453–479Skevas I, Emvalomatis G, Brümmer B (2018) Productivity growth measurement and decomposition under a dynamic
inefficiency specification: the case of German dairy farms. Eur J Oper Res 271:250–261 https://doi.org/10.1016/j.ejor.2018.04.050
Soboh R, Lansink AO, Dijk GV (2012) Efficiency of cooperatives and investor owned firms revisited: efficiency of cooperativesand IOF. J Agric Econ 63:142–157 https://doi.org/10.1111/j.1477-9552.2011.00324.x
Soboh RAME, Lansink AO, Giesen G, van Dijk G (2009) Performance measurement of the agricultural marketing cooperatives:the gap between theory and practice. Rev Agric Econ. 31:446–469 https://doi.org/10.1111/j.1467-9353.2009.01448.x
Soboh RAME, Lansink AO, Van Dijk G (2014) Efficiency of European dairy processing firms. NJAS - Wagening J Life Sci. 70–71:53–59 https://doi.org/10.1016/j.njas.2014.05.003
Soboh RAMER, Oude Lansink A, van Dijk G (2011) Distinguishing dairy cooperatives from investor-owned firms in Europeusing financial indicators. Agribusiness 27:34–46 https://doi.org/10.1002/agr.20246
Tanner MA, Wong WH (1987) The calculation of posterior distributions by data augmentation. J Am Stat Assoc 82:528–540https://doi.org/10.2307/2289457
van den Broeck J, Koop G, Osiewalski J, Steel MFJ (1994) Stochastic frontier models: a Bayesian perspective. J Econom. 61:273–303 https://doi.org/10.1016/0304-4076(94)90087-6
von Braun, J., Hotchkiss, D., Immink, M. (Eds.), 1989. Nontraditional export crops in Guatemala: effects on production, income,and nutrition, research report.
Wang H-J (2002) Heteroscedasticity and non-monotonic efficiency effects of a Stochastic Frontier Model, vol 19Wilkinson J, Rocha R (2006) Agri-processing and developing countries
Publisher’s NoteSpringer Nature remains neutral with regard to jurisdictional claims in published maps and institutional affiliations.
Beber et al. Agricultural and Food Economics (2021) 9:23 Page 22 of 22
Related Documents