“Organizational capital and global value chain participation: fostering productivity growth in the digital economy” Cecilia Jona-Lasinio* (ISTAT and University LUISS Guido Carli) Valentina Meliciani (University LUISS Guido Carli) Silvia Sopranzetti (Italian Ministry of Economy and Finance) Paper prepared for the IARIW-ESCoE Conference November 11-12, 2021 Session 3A Time: Thursday, November 11, 2021 [16:00-17:30 GMT+1]

Welcome message from author
This document is posted to help you gain knowledge. Please leave a comment to let me know what you think about it! Share it to your friends and learn new things together.
Transcript

“Organizational capital and global value chain participation:
fostering productivity growth in the digital economy”
Cecilia Jona-Lasinio*
(ISTAT and University LUISS Guido Carli)
Valentina Meliciani
(University LUISS Guido Carli)
Silvia Sopranzetti
(Italian Ministry of Economy and Finance)
Paper prepared for the IARIW-ESCoE Conference
November 11-12, 2021
Session 3A
Time: Thursday, November 11, 2021 [16:00-17:30 GMT+1]

1
Organizational capital and global value chain participation:
fostering productivity growth in the digital economy
Cecilia Jona-Lasinio*
(ISTAT and University LUISS Guido Carli)
Valentina Meliciani**
(University LUISS Guido Carli)
Silvia Sopranzetti***
(Italian Ministry of Economy and Finance)
Paper prepared for the IARIW Conference on Measuring Intangibles 2021
Do Not quote without author’s permission
Abstract
This paper investigates the impact of backward participation in global value chains (GVCs) on
productivity growth considering the mediating effect of organizational capital and distinguishing
between high and low digital intensive sectors (OECD, 2018). Using industry data from EUKLEMS,
WIOD and INTAN-Invest, the analysis focuses on a sample of eleven European economies plus the US
over the period 1998-2015. Our findings show: a) a positive and statistically significant productivity
impact of backward participation; b) a larger marginal effect of backward participation on productivity
growth in countries-industries with a higher intensity of organizational capital; c) a larger productivity
impact of backward participation and organizational capital in high digital sectors. The results suggest
the relevance of managerial capabilities to extract value from participation in global value chains,
particularly in high digital intensive sectors.
JEL Classification: F23, O30
Keywords: Organizational capital; global value chains; productivity growth; digitalization
* [email protected], ISTAT and Luiss Lab of European Economics.
**[email protected], Department of Business and Management. ***[email protected], MEF
2
Introduction
Widespread processes of globalization of value chains have impacted on productivity in advanced and
emerging countries. Criscuolo and Timmis (2017) identify several channels through which GVCs can
help enhancing productivity. First, there is the classical argument of gains from specialization: in a value
chain firms can specialise in the activities (the analogous to product specialization in the classical
literature on trade liberalization) in which they are relatively more efficient and outsource the others. A
second channel through which participation in GVCs can affect productivity is by allowing firms to have
access to a larger variety of cheaper and/or higher quality and/or higher technology imported inputs.
Third, GVCs can facilitate knowledge spillovers allowing interaction of domestic firms with foreign
multinational firms. Finally, similarly to the case of international trade, GVCs can give firms access to
larger markets and increase competition, thus favoring the development of the most productive firms and
inducing the exit of the least productive ones.
Empirical research in support of the theoretical predictions linking GVCs to productivity is however
limited. Contributions include older strands of work focusing on benefits to countries that initiate
offshoring (Feenstra and Hanson 1996; Egger and Egger 2006; Daveri and Jona-Lasinio 2008; Amiti and
Wei 2009; Winkler 2010), but also recent efforts that analyze the impact of vertical specialization on
countries participating in GVCs (Formai and Vergara Caffarelli 2016, Kummritz 2016, Taglioni and
Winkler 2016; Constantinescu et al., 2017). Despite the numerous channels identified in the literature by
which GVC participation can positively affect productivity growth, the empirical evidence is mixed.
But under what conditions GVC involvement increases productivity? And are there differences in the
impact based on the extent of digitalization of the sectors?
In this paper we argue that the gains in participation from GVC will be highly asymmetric between
countries and sectors depending on investment in organizational capital and the extent of sectoral
digitalization.
We build our hypotheses referring to an extensive theoretical and empirical literature documenting that
the adoption of information technologies (IT) requires changes in firms’ organisation (Brynjolfsson and
Hitt, 2000), and that it induces higher productivity gains in better-managed firms (Garicano and Heaton
2010, Bloom et al. 2012), because management practices and IT are complements. We extend this
literature to the study of the productivity impact of GVC participation by testing whether higher
investment in organizational capital magnifies the productivity gains from backward participation in
GVC and whether, due to the complementarity between organizational capital and IT, the gains are larger
in high digital industries.

3
The empirical analysis is developed adopting an augmented production function framework and testing
our model using industry data from EUKLEMS, WIOD and INTAN-Invest on a sample of eleven
European economies plus the US over the period 1998-2015.
Our main findings support the existence of a significant impact of backward participation in GVCs on
productivity growth which varies according to investment in organizational capital and the digital
intensity of the sector.
The paper is organised as follows: Section 2 reviews the literature and develops the research hypotheses;
Section 3 describes the data and provides some descriptive analysis. Section 4 discusses the empirical
strategy and the econometric results. Section 5 concludes.
2. Background literature and research questions
In this section we review the main results emerging from two distinct strands of the empirical literature
on the productivity impact of GVCs participation and on the role of organizational capital for productivity
growth and for value appropriation in GVCs and then we formulate our research question bridging these
two research fields.
GVC and productivity growth
The rising relevance of global value chains in modern economies stimulated new research efforts
investigating the relationship between firms’, industries’ and countries’ participation in GVCs and
productivity gains. Criscuolo and Timmis (2017) identify several channels through which GVCs can help
enhancing productivity. First, there is the classical argument of gains from specialization: in a value chain
firms can specialise in the activities (the analogous to product specialization in the classical literature on
trade liberalization) in which they are relatively more efficient and outsource the others. A second
channel through which participation in GVCs can affect productivity is by allowing firms to have access
to a larger variety of cheaper and/or higher quality and/or higher technology imported inputs. Third,
GVCs can facilitate knowledge spillovers allowing interaction of domestic firms with foreign
multinational firms. Finally, similarly to the case of international trade, GVCs can give firms access to
larger markets and increase competition, thus favoring the development of the most productive firms and
inducing the exit of the least productive ones.
Empirical research in support of the theoretical predictions linking GVCs to productivity is however
limited. Contributions include older strands of work focusing on benefits to countries that initiate
offshoring (Feenstra and Hanson 1996; Egger and Egger 2006; Daveri and Jona-Lasinio 2008; Amiti and

4
Wei 2009; Winkler 2010), but also recent efforts that analyze the impact of vertical specialization on
countries participating in GVCs (Formai and Vergara Caffarelli 2016, Kummritz 2016, Taglioni and
Winkler 2016; Constantinescu et al., 2017).
Focusing on the most recent efforts, Formai and Vergara Caffarelli (2016) investigate the relationship
between international fragmentation of production and (labour and total factor) productivity growth for
US industries between the 1990s and the 2000s using Input Output data provided by the Bureau of
Economic Analysis (BEA). They find that participation in GVCs positively affects labour productivity
and TFP in sectors with long and wide production chains in countries specialised in importing
intermediate goods.
Other studies have extended the analysis to a larger sample of countries using the OECD World Input
Output tables and measuring backward and forward participation in GVCs at the industry level. In
particular, Kummritz (2016) shows that an increase in GVC participation leads to higher domestic value
added and productivity in 54 countries independently of their income levels. Based on the preferred
instrumental variable specification, he finds that a one percent increase in backward GVC participation
generates an increase of 0.11% of domestic value added in the average industry but does not affect labour
productivity. On the other hand, a one percent increase in forward GVC participation causes an increase
of 0.60% of domestic value added and 0.33% of labour productivity.
Kordalska et al. (2016) on a panel covering 40 countries and 20 industries in the period 1995-2011 find
a positive link between TFP growth and the involvement of sectors in global value chains (measured as
the share of foreign value added in exports). Stronger effects are found in the manufacturing sectors.
Finally, Constantinescu et al. (2017), using data on trade in value added from the World Input-Output
Database, covering 13 sectors in 40 countries over 15 years find that participation in global value chains
is a relevant driver of labor productivity. Differently from Kummritz (2016) backward participation in
global value chains emerges as a particularly important factor affecting productivity growth.
An alternative approach has been suggested by Timmer (2017) arguing that Global Value Chains
challenge the traditional approaches to productivity measurement. He suggests evaluating a production
function where final output is produced using domestic and foreign factor inputs. Therefore, in this
approach the flow of intermediate inputs will be netted allowing to express the production function of a
final good exclusively in terms of factor inputs. The basis for this methodology is the analysis of the cost
shares of the production factors that can be identified from synthetic input-output tables. This approach
solves the problems linked to tracing the profits for intangible capital assets used in international
production.

5
Global value chains and productivity growth: the mediating role of organizational capital
This paper explores the mediating effect of organizational capital in the relationship between GVC
participation and productivity growth. In particular, we investigate whether a higher intensity of
organizational capital augments the productivity gains from GVC participation across countries and
industries.
This research question draws upon two streams of literature: the studies on the productivity impact of
organizational capital and management practices and the role of organizational capital in GVC.
Lev and Radhakrishnan (2005) define organizational capital as “unique systems and processes employed
in the investment, production, and sales activities of the enterprise, along with the incentives and
compensation systems governing its human resources”. They identify this collective resource as the
major factor of production “that is unique to the firm and thus capable of yielding abnormal—above cost
of capital—returns, thereby generating enterprise growth”. (Lev and Radhakrishnan, 2005, p.73).
This resource assumes a crucial role to cope with (and benefit from) fundamental changes in technology.
In the context of the productivity paradox associated to the diffusion of information technologies (IT) it
was found that only when certain organizational practices were combined with investments in IT, these
investments created significant increases in productivity (Bresnahan et al., 2000; 2002). This is because
to realize the potential benefits of computerization, investments in additional assets such as new
organizational processes and structures may be needed (Brynjolfsson and Hitt, 2000).
Several studies, using different methodologies and different measures of organizational capital1, have
provided empirical evidence of its positive effect on firms’ (Tronconi and Vittucci Marzetti, 2011; Hulten
and Hao, 2008; Lev and Radhakrishnan, 2005; Black and Linch, 2001), sectoral (Niebel et al., 2016);
Chen et al., 2016) and countries’ productivity (Jalava et al. 2007; Fukao et al. 2009; Hao et al. 2009; Van
Ark et al., 2009; Marrano et al., 2009; Corrado et al., 2009; Roth and Thum, 2013) 2.
These results are consistent with the findings of a related stream of literature investigating the role of
management practices (measured through survey data) for productivity gains. In particular Bloom and
1 Investment in organization capital has been measured in a number of ways in the literature. These include business
surveys (Black and Lynch 2005), part of the wage bill of managers (Squicciarini and Le Mouel 2012), the residual from a
production function (Lev and Radhakrishnan 2005), selling, general and administrative (SGA) expenses (De and Dutta, 2007;
Tronconi and Vittucci Marzetti 2011), revenues for the management consultant industry and trends in the cost and number of
persons employed in executive occupations (Corrado et al., 2005; Corrado et al., 2009; Roth and Thum, 2013) ; Eisfeldt and
Papanikolaou 2013;
2 Some of these studies do not disentangle the specific role of organizational capital but include it in a larger category of
intangible assets together with brand and training investments.

6
Van Reenen (2007) find, for a sample of advanced countries, that measures of management practices are
strongly associated with firm-level productivity, profitability, Tobin’s Q, and survival rates. Moreover
Bloom et al. (2017), extending the analysis to 34 countries from over 11,000 firms, model managerial
practices as a technology and find that they account for about 30% of total factor productivity differences
both between countries and across firms within countries.
But does organizational capital play a specific role in affecting the capability of firms, countries and
sectors to experience productivity gains from participation in GVC?
The firm level literature investigating value creation along the value chain has shown that the benefits
from participation in GVCs are very uneven across firms and countries. The classic example of the iPod
supply chain discussed by Dedrick, et al. (2010) shows that Apple captures between one-third and one-
half of an iPod’s retail value, Japanese firms such as Toshiba and Korean firms such as Samsung capture
another major share while firms and workers in China capture no more than two percent from assembling
the product. The capability of the different countries to appropriate a larger share of value is related to
the extent of their firms’ investment in knowledge-based capital and organizational capabilities to control
the value chain. While different intangible assets may contribute to appropriating the benefits from GVC
participation (particularly R&D and design at the upstream and marketing and advertising at the
downstream of the smiling curve; see Jona et al. 2019) organizational capital is expected to play a major
role by being the asset which allows coordinating the different stages of the value chain. Moreover,
according to the OECD (2013b), economic competencies, including firm-specific skills such as superior
management, brand equity and organisational structure, can be more valuable than other intangible assets
as they involve more tacit forms of knowledge and may therefore be more difficult to replicate than
innovative property or computerised information.
Bloom et al. (2018) present a heterogeneous-firm model in which management capabilities have a
positive effect on both production efficiency and product quality. They test the model on US and Chinese
firms and find that firms that are better managed are more likely to export and earn higher export revenues
and profits. This provides indirect evidence of the possible benefits of managerial capabilities in
mediating the impact of GVC participation on productivity.
Therefore, we expect that participation in GVCs will generate more value added in sectors and countries
where firms invest more in organizational capital.
Gereffi et al. (2005) identify different types of global value chain governance (hierarchy, captive,
relational, modular, and market) which range from high to low levels of explicit coordination and power
asymmetry. The key insight is that coordination and control of global-scale production systems, despite

7
their complexity, can be achieved without direct ownership. In captive value chains there is a high degree
of explicit coordination and a large measure of power asymmetry with the lead firm (or top management)
being the dominant party. This control requires high managerial capabilities on the side of the leading
firm as in the case of hierarchies. In order to achieve a more balanced power between the firms in the
GVC, suppliers need to develop specific assets, including organizational capabilities, as in relational and
modular value chains.
Organizational capital is also strategic in the coordination of global value chains. International
fragmentation of production requires the coordination of the various stages of production which are
spatially dispersed (Baldwin 2016). To realize the matching of production teams and ideas, GVC
integration requires managerial capabilities and a dense circulation of information flows to communicate
specifications, standards, technical know-how in addition to costs and other items (Gereffi et al. 2005).
The efficient organization of production in GVCs is thus mostly based on investments in managerial
capabilities (Durand and Milberg 2018).
The studies discussed so far suggest that the impact of GVC participation on productivity may depend
on investment in organizational capital. Moreover, we argue that this impact will differ across sectors
and will be stronger in digital sectors. In fact, organizational investment and ICT investment are highly
complementary (Brynjolfsson et al. 2002). Bloom et al. (2012) compared investment in IT of European
and American firms and showed that European firms did not experience the same gains from computers
as they were not able to change organizational and management practices. Finally, more recently Haskel
and Westlake (2017) provide several examples of complementarity between different intangibles
including software and organizational capabilities.
Based on this discussion, the purpose of this paper is to investigate the single and mediated impact of
GVC participation and investment in organizational capital on productivity growth and to analyse
whether the effect varies across sectors with different digital intensity.
3. Data and descriptive statistics
3.1 Intangible assets
Data on intangible investment are from INTAN Invest3 providing harmonized estimates of intangible
investments covering three broad groups of asset categories originally proposed by Corrado et al. (2005):
3 INTAN-invest is a research collaboration dedicated to improving the measurement and analysis of intangible assets
(www.intannvest.net)
8
computerized information, innovative property and economic competencies4. Computerized information
includes computer software and databases. Innovative property refers to the innovative activity built on
a scientific base of knowledge as well as to innovation and new product/process R&D more broadly
defined. Economic competencies indicate spending on strategic planning, worker training, redesigning
or reconfiguring existing products in existing markets, investment to retain or gain market share and
investment in brand names.
The Systems of National Accounts (2008) currently incorporates in the asset boundary only an array of
intangible assets namely R&D, mineral exploration, computer software and databases, entertainment,
literary and artistic originals, under the category ‘intellectual property products’. The remaining
intangibles identified by Corrado et al (2005) as investments, are treated as intermediate expenditures in
official statistics. The INTAN Invest initiative5 provides estimates for both National Account and Non-
National Account intangible investment.
A relevant characteristic of the INTAN-Invest measures of intangibles is that they are consistent with
National Account principles and are entirely based on official statistics. In this paper, we select from the
INTAN database information for the following set of intangible assets: R&D, Design, Advertising and
Market research (Brand), Training and Organizational capital6. The main original data source to build
indicators for these intangibles is Eurostat. Investment in Advertising and Market Research, Design and
Organizational Capital are calculated adopting an expenditure approach and resorting to expenditure data
by industry from the Use Tables, compiled according to the new classification system (NACE Rev2/CPA
2008). Additional information about data sources and estimation methods can be found in Corrado et al.
(2018).
3.2 Measures of GVC participation
The measure of backward participation used in our analysis is obtained from the World Input Output
Database (WIOD). The indicator is based on the work of Koopman et al. (2010, 2014) extending the
work of Hummels et al. (2001) and Johnson and Noguera (2012). Hummels et al. (2001) compute an
index of vertical specialization accounting for the use of imported inputs in producing goods that are then
4 For a detailed description of the methodology, see Corrado et al. (2018). These indicators have been used in many studies
especially for assessing their contribution to GDP and productivity growth (see e.g. Corrado et al. 2009, 2013, 2016, 2017).
6 The database used in this paper resorts to R&D expenditure from BERD and not to R&D National Account data to be
coherent with the EUKLEMS (2012) figures that were not yet adjusted to the new European System of National Accounts
(ESA 2010). Moreover, we do not use INTAN data on software since we include total Information and Communication
Technologies (ICT) capital taken from EUKLEMS.

9
exported. However, this indicator does not take into account that a country exports intermediates that are
used to produce final goods absorbed at home. By using input–output data for source and destination
countries simultaneously, Johnson and Noguera (2012) overcome this limitation and compute the ratio
of value added to gross exports as a measure of the intensity of production sharing. Finally, Koopman et
al. (2010, 2014) provide a full decomposition of value added including returned domestic value added
(domestic value added that comes back incorporated in foreign inputs produced with domestic inputs)
and the indirect exports to third countries. He proposes two measures of participation. These are the
backward and the forward participation indicators, which are respectively the importing and exporting
elements of GVCs (see Figure A1). The figure illustrates how gross exports can be decomposed into
many different constituent elements. At their most basic, gross exports are composed of domestic and
foreign value added which can themselves be further decomposed using Input-Output tables. For
example, the domestic value added that is embodied in exports can serve to produce final goods and
services (element (1) in figure A1) or it can be used to produce intermediates which are then used
domestically (2) or exported (3+4). Forward participation refers to the domestic value added in foreign
exports (3+4) while backward participation refers to the foreign value added in domestic exports (5+6).
In this paper we focus on backward participation which is closer to traditional indicators of offshoring
activity (such as the share of imported inputs in producing goods that are then exported). A variant of
this indicator decomposes value added, similarly across countries and sectors, but according to final
demand (Timmer et al. 2013; Los et al. 2015). This tracks not just the value added traded in the production
of exports, but also that used to satisfy domestic and international final demand7. Both measures (one
based on exports and one on final demand) involve similar calculation techniques, but the former is solely
concerned with exporting activities whereas the latter considers the origin of value added in GDP. The
difference is relevant because domestic final demand and gross export vectors are significantly different.
Since both measures have their pros and cons, we report the main econometric estimates using both the
indicator of backward linkages based on exports and the other based on final demand. We focus on
foreign value added in domestic exports over total exports (backward participation) for comparisons with
other studies (this is the measure of participation mostly used by the OECD, OECD 2013b) but we report
7 To provide an example of the difference in the two indicators, imagine that the total demand for BMW cars is 100 of which
60 are sales to German customers while 40 are exports. The cars are assembled outside Germany using a variety of components
such as car body parts, interior and exterior components, some of which are made in Germany, but others abroad. Out of the
total value of each car two thirds is domestic (German) value added and one third is foreign value added. Using the export
indicator the foreign value added in domestic exports of German cars would be (1/3)*40 while using the final demand indicator
it would be (1/3)*100 (counting also the cars that are consumed by German customers).

10
also estimates based on foreign value added in domestic final demand over total final demand (backward
participation based on final demand) to test the robustness of our findings. Much work on GVCs to date
uses the backward participation indicator and identifies one of the most salient features to be the rise in
the share of foreign value added used to produce exports (see for example OECD, 2013, Taglioni and
Wrinkler, 2016, Baldwin and Lopez-Gonzalez, 2015; Kowalski et al. 2015).
3.3 The database
The database employed in this paper merges data on tangible capital inputs, ICT capital as well as
standard growth accounting variables such as output and labour input from EUKLEMS8 (see O’Mahony
and Timmer 2009, for details) with data on intangibles from INTAN-Invest. Data cover the period 1998-
2014 for 9 European countries (AT, DE, DK, ES, FI, IT, NL, SE, UK) and 18 industries NACE REV 2.
3.4 Descriptive analysis
In this section we merge the evidence on backward participation, organizational capital and productivity
taking account the extent of digital intensity in the above mentioned three sectoral groups.
Figure 1 shows the average rate of growth of our main variable of interest: backward participation (based
on export), organizational capital, and labor productivity for the countries in our sample distinguishing
between high, medium and low digital intensive sectors. We exclude from our analysis the years of the
crisis (2008/2009) to examine the long-time trend removing the disturbance effects caused by the
exogenous shock.
In the medium digital intensive sector, all countries have experienced, on average, positive growth of
labour productivity, organizational capital and backward participation. United Kingdom, Austria,
Germany, and Sweden show the fastest organizational capital accumulation and, also, the highest average
labour productivity growth, while backward participation is higher for Finland, Denmark, and Italy.
The high digital sector presents a higher variation across countries. Labor productivity has increased in
most of the countries in our sample, except for Italy and Germany, while organizational capital
accumulation has decreased only in Italy and Spain. Differences in backward participation across
countries are more marked, with Denmark and Finland growing fast and Spain, Sweden and UK showing
a negative rate of growth.
Figure 1 - Productivity, backward participation, and organizational capital in the digital sectors
8 http://www.euklems.net

11
Source: Author’s calculation on EUKLEMS, WIOD and INTAN Invest data. Labor productivity is measured as real value
added per hours worked.
In the low digital intensive sector, there is more variation in the labour productivity growth. Denmark,
Spain, Italy, and UK slowed down, while other countries show positive growth rate even if not very high.
Backward participation growth raised in Austria and the UK while slowed down in the Netherlands.
Finally, intangible capital accumulation is relatively fast in Austria and the UK (in the same line of
backward participation) while it is almost stable in Denmark and Italy. On a general base for the high
and medium digital intensive sectors (except for Germany in high) organizational capital accumulation
and labor productivity growth move always in the same direction while, this relation is less strong in the
low digital sector. Backward participation shows a more heterogeneous behavior.
The main goal of our analysis is to investigate the productivity impact of GVC participation tacking into
account the complementary role of organizational capital. Therefore, figure 2 shows data on backward
participation vs labour productivity growth distinguishing between high, medium, and low digital
-.2
0.2
.4.6
ATDEDKES FI FR IT NLSEUK
High
0.1
.2.3
ATDEDKES FI FR IT NLSEUK
Medium
-.1
0.1
.2.3
.4
ATDEDKES FI FR IT NLSEUK
Low
Productivity growth Organizational capital growth
Backward participation growth

12
intensive sectors across the sample countries. The size of the dots represents the average per hour worked
organizational capital in our time span.
Correlation between productivity and backward participation growth is significantly positive in the high
and medium digital intensive sector while, in the low digital industries there is no a clear correlation.
Focusing on organizational capital, notice that countries with the highest growth rate of productivity and
backward participation are also those with the highest intensity of organizational capital in the high
digital sector. On the other hand, this relationship is less straightforward in medium and low digital
intensive sectors.
The data suggest that the links between backward participation and labour productivity vary substantially
with the extent of sectoral digitalization. At the same time, the contribution of managerial capabilities to
extract value from participation in global value chains seems to be relevant mainly in the high digital
intensive sector. Therefore, a deeper investigation of the multiple dimensions of this relationship is
warranted. This is the goal of the next section.

13
Figure 2 - Labour productivity, Organizational capital and Backward participation
Source: Author’s calculation on EUKLEMS, WIOD and INTAN Invest data
4 Empirical strategy
4.1 Econometric approach
Jona-Lasinio and Meliciani (2019) tested the impact of GVC participation taking into account the
mediating effect of intangible capital and found a statistically significant effect for non-R&D intangibles,
among which a major role is played by organizational capital. This paper offers a deeper exploration of
the relationship between GVC participation, organizational capital and productivity growth providing
estimates of a production function augmented with a measure of backward GVC participation.
First, we test the direct linkage between productivity growth and the intensity of organizational capital.
Then we evaluate the extent to which the productivity returns from participation are conditional to the
intensity of organizational capital across countries-industries. We adopt a difference-in-difference
empirical approach following Rajan and Zingales (1998) who estimated the impact of financial
development on economic growth in a model with country-industry interactions. Thus, our empirical
specification is as follows:

14
(1) ∆ln(Y/H)i,c,t = α1∆ln(KJ/H)i,c,t + α2∆ln(KI/H)i,c,t + α3ln(Pgvc)i,c,t-2 + α4ln(Korg/H)i,c
+ α5ln(Pgvc)i,c,t-2 *ln(Korg/H)i,c + λi + λt + ηi,c,t .
where variables vary by country c, industry i and time t; Y denotes value added adjusted to include
intangible capital (as in Corrado, Hulten, and Sichel 2005, 2009), H is total hours worked, KJ is for
J=ICT, NonICT capital, KI is for I=Total intangible, and non-R&D intangibles9, while Korg refers to
Organizational capital, Pgvc is backward participation and ln(Korg/H)i,c denotes country-industry’s
average (log) intensity of organizational capital, and λi , λt are industry and time dummies. The
interaction variable is symmetric with respect to the interacted terms as it does not say anything about
the causality between ln(Korg/H) and ln(Pgvc) (Brambor, Clark and Golder, 2006). Thus, we simply
assume that organizational capital is our conditional variable affecting the effect of backward
participation on productivity growth.
Overall, existing empirical evidence demonstrates that intangible capital affects productivity growth via
multiple mechanisms: directly, increasing capital deepening and interacting with other complementary
assets (Corrado et al 2013 and 2018); and indirectly, being a driver of innovation and generating
spillovers, mainly from non-R&D10 intangible assets (Corrado et al 2017). Most of these analyses find
also that among the asset categories of intangibles, economic competencies and in particular
organizational capital is the main driver of productivity growth.
Notice that the term we use to capture the differential impact of participation on productivity growth in
sectors intensive of organizational capital is the time average of organizational capital intensity of all
industries and countries interacted with the level of GVC participation in industry i country c, at time t-
2. The adoption of the average intensity in the interaction implies some restriction as it bounds the
elasticity of labor productivity as organizational capital intensity rises.
If our proxy for organizational capital intensity in equation (1) is correct, we should find α5 > 0, indicating
that each country industry experiences relatively higher productivity growth when participation in GVC
is complemented by higher organizational capital intensity. We include also the industry dummies to
control for the possible correlation between specific industry characteristics and our measure of capital
intensity. Ultimately, the estimation of equation (1) can be affected by structural identification problems
10 Non-R&D assets include Organizational capital, Training, Brand and Design.
15
related to measurement error, multicollinearity, and endogeneity of factor inputs. Thus, we also test our
results with IV and GMM estimation (Ackerberg et al 2015).
4.2 Empirical results
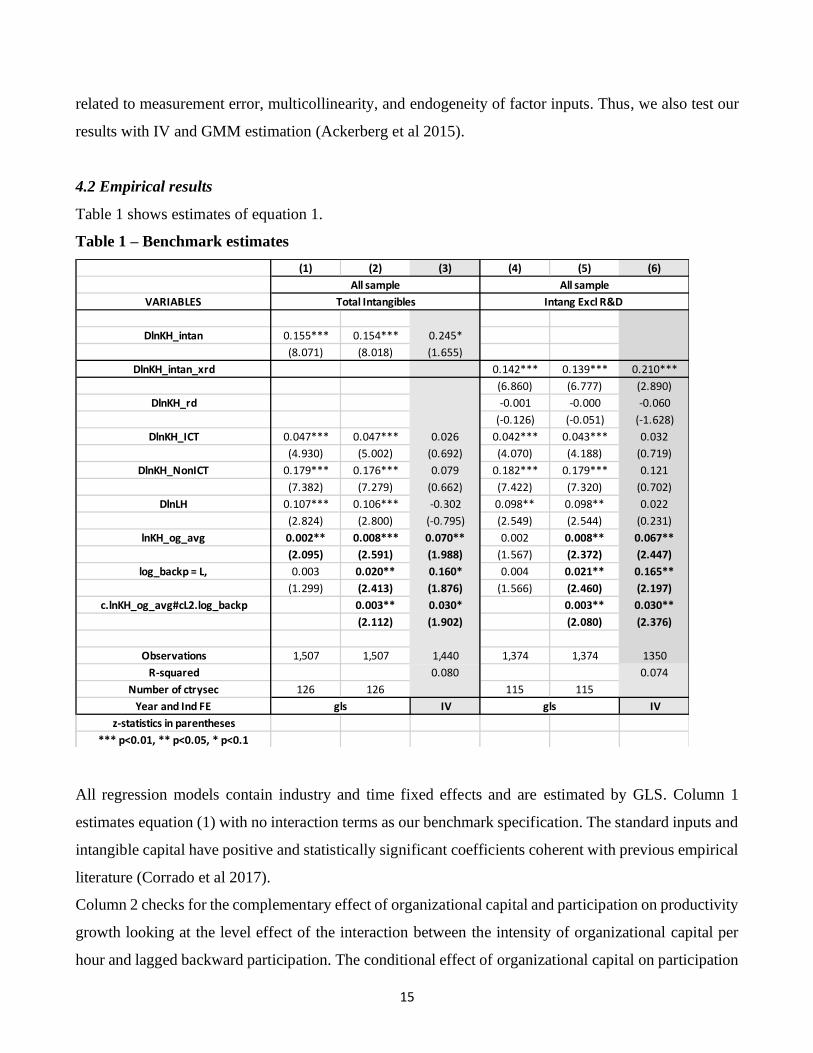
Table 1 shows estimates of equation 1.
Table 1 – Benchmark estimates
All regression models contain industry and time fixed effects and are estimated by GLS. Column 1
estimates equation (1) with no interaction terms as our benchmark specification. The standard inputs and
intangible capital have positive and statistically significant coefficients coherent with previous empirical
literature (Corrado et al 2017).
Column 2 checks for the complementary effect of organizational capital and participation on productivity
growth looking at the level effect of the interaction between the intensity of organizational capital per
hour and lagged backward participation. The conditional effect of organizational capital on participation
(1) (2) (3) (4) (5) (6)
VARIABLES
DlnKH_intan 0.155*** 0.154*** 0.245*
(8.071) (8.018) (1.655)
DlnKH_intan_xrd 0.142*** 0.139*** 0.210***
(6.860) (6.777) (2.890)
DlnKH_rd -0.001 -0.000 -0.060
(-0.126) (-0.051) (-1.628)
DlnKH_ICT 0.047*** 0.047*** 0.026 0.042*** 0.043*** 0.032
(4.930) (5.002) (0.692) (4.070) (4.188) (0.719)
DlnKH_NonICT 0.179*** 0.176*** 0.079 0.182*** 0.179*** 0.121
(7.382) (7.279) (0.662) (7.422) (7.320) (0.702)
DlnLH 0.107*** 0.106*** -0.302 0.098** 0.098** 0.022
(2.824) (2.800) (-0.795) (2.549) (2.544) (0.231)
lnKH_og_avg 0.002** 0.008*** 0.070** 0.002 0.008** 0.067**
(2.095) (2.591) (1.988) (1.567) (2.372) (2.447)
log_backp = L, 0.003 0.020** 0.160* 0.004 0.021** 0.165**
(1.299) (2.413) (1.876) (1.566) (2.460) (2.197)
c.lnKH_og_avg#cL2.log_backp 0.003** 0.030* 0.003** 0.030**
(2.112) (1.902) (2.080) (2.376)
Observations 1,507 1,507 1,440 1,374 1,374 1350
R-squared 0.080 0.074
Number of ctrysec 126 126 115 115
Year and Ind FE IV IV
z-statistics in parentheses
*** p<0.01, ** p<0.05, * p<0.1
gls gls
All sample All sample
Total Intangibles Intang Excl R&D

16
is confirmed also by the IV estimates in column 3 where the interaction coefficient is higher also
suggesting a downward endogeneity bias affecting both backward participation and organizational
capital in standard GLS estimates.
To judge the robustness of our findings, in Table 2, we also test the benchmark specification only for
services and for high and low digital intensive sectors. The identification of high and low digital intensive
sectors follows the classification proposed by Berlingieri et al (2019).
Table 2 – Testing industry characteristics
Note: All regressions contain country, industry and time fixed effects and controls for KNonICT and Labor composition.
The table shows that the main determinants of productivity growth hold also for service sectors, with
intangible investment playing a positive and significant role. However, when considering all sectors
together irrespective of their digital intensity, we find no complementary effect between organizational
capital and backward participation (columns 1 and 2).
(1) (2) (3) (4) (5) (6)
VARIABLES High digital Low digital High digital Low digital
DlnKH_intan_xrd 0.156*** 0.155*** 0.249*** 0.091*** 0.250*** -0.041
(7.782) (7.713) (7.982) (3.189) (3.184) (-0.280)
DlnKH_rd -0.003 -0.002 -0.014 0.014 0.007 0.026
(-0.290) (-0.264) (-0.892) (1.127) (0.174) (0.394)
DlnKH_ICT 0.044*** 0.045*** 0.026* 0.056*** -0.070 0.019
(4.345) (4.456) (1.757) (3.637) (-0.783) (0.180)
DlnKH_NonICT 0.200*** 0.198*** 0.211*** 0.184*** 0.253*** 0.208
(8.285) (8.172) (5.796) (4.960) (2.654) (1.345)
DlnLH 0.097*** 0.098*** 0.095* 0.116** 0.047 -0.512
(2.704) (2.708) (1.713) (2.293) (0.144) (-1.143)
lnKH_og_avg 0.001 0.006 0.024*** 0.000
(0.897) (1.528) (3.234) (0.091)
lnKH_og_avg,L 0.038*** 0.007
(3.627) (0.806)
log_backp = L, 0.004* 0.017* 0.052*** 0.011 0.083*** 0.030
(1.896) (1.860) (3.069) (0.761) (3.215) (1.082)
cL2.log_backp#c.lnKH_og_avg 0.002 0.009*** 0.001
(1.414) (2.997) (0.314)
cL2.log_backp#c.L2.lnKH_og_avg 0.014*** 0.003
(3.090) (0.821)
Observations 1,278 1,278 624 654 610 637
Number of ctrysec 107 107 52 55 0.284 0.040
Year and Ind FE
z-statistics in parentheses
*** p<0.01, ** p<0.05, * p<0.1
tot services
Intangibles excl R&D
IVgls

17
Columns 3 and 4 test the complementarity effect of organizational capital and backward participation
distinguishing between high and low digital industries. The estimates support the assumption of a strong
complementarity in high digital intensive sectors. In low digital intensive industries, most of the variables
are not statistically significant. These results indicate stronger productivity effects of GVC integration
complemented by investment in organizational capital in high digital intensive sectors. In columns 5 and
6 we check the robustness of results in columns 3 and 4 lagging at time t-2 organizational capital intensity
to investigate possible slower effect of managerial capabilities. Results in column 5 confirm a stronger
lagged mediating impact of organizational capital.
Overall, ss already shown by Jona-Lasinio and Meliciani (2019), our findings support the evidence that
managerial practices have a positive impact on firms’ productivity and profitability (Bloom and Van
Reenen 2007; Bloom et al. 2016) also when we consider GVC participation.
Conclusions
Our analysis aims at assessing the role of organizational capital in the relationship between participation
in GVC and productivity growth. We bridge the microeconomic literature on the role of organizational
capital in GVC with the sectoral studies on the impact of GVC participation on productivity growth.
Using country-industry-time data, we find a positive and statistically significant impact of backward
participation on productivity growth. We also find that the productivity returns from GVC participation
increase with investment in organizational capital. Finally, we look at differences across sectors
distinguishing between high digital and low digital sectors. We find that organizational capital has a
direct and mediating role on productivity growth only in high digital sectors. These results confirm the
complementarity between management practices and IT (Brynjolfsson and Hitt, 2000; Garicano and
Heaton 2010, Bloom et al. 2012).
Overall, our findings suggest that the productivity impact of GVC participation strongly depends on
investment in organizational capital especially in high digital intensive sectors. The strong asymmetries
in managerial capabilities across countries and sectors may, therefore, lead to very asymmetric
productivity gains from GVC participation (Durand and Milberg 2018).
The results of this paper suggest that further analysis considering different modes of participation
(backward and forward) and position in GVC, and different intangible assets, including the role of
training, would help qualifying further the conditions under which participation in GVC fosters
productivity growth.

18
References (TBC)
Ackerberg Daniel A. & Kevin Caves & Garth Frazer, 2015. "Identification Properties of Recent
Production Function Estimators," Econometrica, Econometric Society, vol. 83, pages 2411-2451,
November.
Amiti Mary & Shang-Jin Wei, (2009), "Service Offshoring and Productivity: Evidence from the US,"
The World Economy, Wiley Blackwell, vol. 32(2), pages 203-220, February.
Baldwin, Richard & Venables, Anthony J., (2013), "Spiders and snakes: Offshoring and agglomeration
in the global economy," Journal of International Economics, Elsevier, vol. 90(2), pages 245-254
Baldwin, R. and J. López-Gonzalez (2015), 'Supply-Chain Trade: A Portrait of Global Patterns and
Several Testable Hypotheses', The World Economy, 38, 1682-1721.
Baldwin, Richard & Robert-Nicoud, Frédéric, (2014), "Trade-in-goods and trade-in-tasks: An
integrating framework," Journal of International Economics, Elsevier, vol. 92(1), pages 51-62.
Baldwin, R. and B. Yan (2014), “Global Value Chains and the Productivity of Canadian Manufacturing
Firms”, Economic Analysis Research Paper Series No. 90, Statistics Canada, 2014.
Black, S. E., Lynch, L. M., 2001. How to compete: the impact of workplace practices and information
technology on productivity, in: Review of Economics and Statistics, 83(3), 434-445.
Bloom, R., Van Reenen, J., (2007), “Measuring and Explaining Management Practices Across Firms
and Countries”, Quarterly Journal of Economics, 122, 1351-1408.
Bloom, R., R. Sadun and J. Van Reenen (2016), “Management as a Technology”, NBER Working Paper
n. 22327.
Bloom, N., K. Manova, J. Van Reenen, S. Teng Sun, Z. Yu (2018), Managing Trade. Evidence from
China and the US, NBER Working Paper n. 24718.
Bontempi, M. E., Mairesse, J., 2008. Intangible capital and productivity: an exploration on a panel of
Italian manufacturing firms, in: National Bureau of Economic Research, No. 14108.
Brambor, Thomas, Clark, William Roberts and Golder, Matt, (2006), Understanding Interaction
Models: Improving Empirical Analyses, Political Analysis, 14, issue 01, p. 63-82,
https://EconPapers.repec.org/RePEc:cup:polals:v:14:y:2006:i:01:p:63-82_00.

19
Bresnahan, Timothy (1999) “Computerization and Wage Dispersion: An Analytic Reinterpretation,”
Economic Journal, CIX, 390–415.
Bresnahan, Timothy (2000), “The Changing Structure of Innovation in the Computer Industry,” in D.
Mowery et al., eds., U. S. Industry in 2000: Studies in Competitive Performance, Washington:
National Academy Press.
Bresnahan, T., Brynjolfsson, E. and L.M. Hitt (2002), “Information technology, workplace
organization , and the demand for skilled labor: firm-level evidence, Quarterly Journal of
Economics, 117 (1), pp. 339-376.
Brynjolfsson, E. and L.M. Hitt (2000), Beyond Computation: Information Technology, Organizational
Transformation and Business Performance, Journal of Economic Perspective, vol.14 (4), pp.
23–48
Chen, W., R. Gouma, B. Los and M. Timmer (2017). Measuring the Income to Intangibles in Goods
Production: A Global Value Chain Approach. WIPO Economic Research Working Paper No.
36. Geneva: WIPO.
Chun, H, T Miyagawa, H K Pyo, and K Tonogi (2015), “Do Intangibles Contribute to Productivity
Growth in East Asian Countries? Evidence from Japan and Korea,” RIETI Discussion Paper
Series, 15-E-055.
Cohen, Wesley M and Levinthal, Daniel A, (1989), ‘Innovation and Learning: The Two Faces of R&D’,
Economic Journal, 99, issue 397, p. 569-96.
Corrado, C., C. Hulten, and D. Sichel. 2005. “Measuring Capital and Technology: An Expanded
Framework.” In C. Corrado, J. Haltiwanger, and D. Sichel (eds.), Measuring Capital in the New
Economy, Volume 66 of NBER Studies in Income and Wealth. University of Chicago Press, 11–
46.
Corrado, C. A., D. E. Sichel and C. R. Hulten (2009), ‘Intangible capital and U.S. Economic growth,’
Review of Income and Wealth, 85, 661–685.
Corrado, C., J. Haskel, C. Jona-Lasinio and M. Iommi (2013), 'Innovation and intangible investment in
Europe, Japan and the United States', Oxford Review of Economic Policy, 29, 261-286.
Corrado, C., J. Haskel and C. Jona-Lasinio (2017), 'Knowledge Spillovers, ICT and Productivity
Growth', Oxford Bullettin of Economics and Statistics, 79, 0305-9049.

20
Corrado, C., J. Haskel, C. Jona-Lasinio and M. Iommi (2018), “Growth, tangible and intangible
investment in the EU and US before and since the Great Recession”, in Journal of Infrastructure,
Policy and Development, (2018) Volume 2 Issue 1. DOI: 10.24294/jipd.v2i1.205.
Constantinescu, Ileana Cristina, Mattoo, Aaditya and Ruta, Michele, (2017), ‘Does vertical specialization
increase productivity?’, No 7978, Policy Research Working Paper Series, The World Bank,
https://EconPapers.repec.org/RePEc:wbk:wbrwps:7978.
Criscuolo Chiara & Jonathan Timmis, (2017), "The Relationship Between Global Value Chains and
Productivity," International Productivity Monitor, Centre for the Study of Living Standards, vol.
32, pages 61-83, Spring.
Criscuolo, C., J. Timmis, and N. Johnstone (2015). “The Relationship Between GVCs And
Productivity”. OECD, Paris
Daveri F., C.Jona-Lasinio, (2008), “Off-shoring and Productivity Growth in the Italian Manufacturing
Industries”, in CESifo Economic Studies; vol. 3/08
Dedrick, J., K.L. Kramer and G. Linden (2010), 'Who Profits from Innovation in Global Value Chain?
A Study of the iPod and Notebook PCs', Industrial and Corporate Change, 19, 81-116.
ECB (2017), Economic Bulletin, Issue 8 / 2017 – Articles “The impact of global value chains on the
macroeconomic analysis of the euro area”, ECB working paper series.
Egger H. and P. Egger (2006), “International Outsourcing and the Productivity of Low-skilled Labour in
the EU”, Economic Inquiry, 44, 1
Everatt, D., T. Tsai and B. Chang (1999), 'The Acer Group’s China manufacturing decision. Richard
Ivey School of Business Case Series #9A99M009, University of Western Ontario.
Feenstra R.C. and G.H. Hanson (1996), “Globalization, Offshoring and Wage Inequality”, American
Economic Review, 86(2)
Formai Sara & Filippo Vergara Caffarelli, (2016), "Quantifying the productivity effects of global
sourcing," Temi di discussione (Economic working papers) 1075, Bank of Italy, Economic
Research and International Relations Area.

21
Fukao, K., T. Miyagawa, K. Mukai, Y. Shinoda and K. Tonogi (2009), 'Intangible Investment in Japan:
Measurement and Contribution to Economic Growth', Review of Income and Wealth 55, 717–
736.
Gene M. Grossman & Esteban Rossi-Hansberg, (2008)."Trading Tasks: A Simple Theory of
Offshoring," American Economic Review, American Economic Association, vol. 98(5), pages
1978-1997, December.
Gereffi, Gary, John Humphrey, and Timothy Sturgeon. 2005. “The Governance of Global Value
Chains.” Review of International Political Economy 12 (1). Taylor
Hao, J.X., V. Manole and B. van Ark (2008), 'Intangible Capital and Economic Growth – an International
Comparison', Economics Program Working Paper Series.
Hao J. and Harry X. Wu (2018) “Intangible Investment by Industry in China”, paper presented at the
35th IARIW conference, 2018.
Haskel, J, and S. Westlake (2018), "Capitalism without Capital: The Rise of the Intangible Economy’.
Princeton: Princeton University Press, 2018
Hulten, Charles and Xiaohui Hao, 2008. What is a company really worth? Intangible capital and the
“market to book value” puzzle. NBER Working Paper 14548, National Bureau of Economic
Research, December
Hummels, David, Ishii, Jun and Yi, Kei-Mu, (2001), The nature and growth of vertical specialization in
world trade, Journal of International Economics, 54, issue 1, p. 75-96,
Jalava, J., A. Pirkko and A. Aku (2007), 'Intangible Capital in the Finnish Business Sector 1975-2005',
Discussion Papers n. 1103, The Research Institute of the Finnish Economy.
Johnson, Robert and Noguera, Guillermo, (2012), Accounting for intermediates: Production sharing and
trade in value added, Journal of International Economics, 86, issue 2, p. 224-236,
Koopman, R., Z. Wang and S-J. Wei (2014), 'Tracing Value-Added and Double Counting in Gross
Exports', American Economic Review, 104, 459-94.
Kowalski, Przemyslaw, Javier López-Gonzalez, Alexandros Ragoussis, and Cristian Ugarte. 2015.
Participation of Developing Countries in Global Value Chains. OECD Trade Policy Papers No.
179. OECD Publishing, Paris.

22
Kordalska, A., J. Wolszczak-Derlacz, and A. Parteka (2016), “Global Value Chains and Productivity
Gains: A Cross-Country Analysis”, Collegium of Economic Analysis Annals, (41), pp.11–28.
Kummritz, Victor (2016), "Do Global Value Chains Cause Industrial Development?," CTEI Working
Papers series 01-2016, Centre for Trade and Economic Integration, The Graduate Institute.
Lev, B., Radhakrishnan, S., 2005. The valuation of organization capital. In: Corrado, C., Haltiwanger, J.,
Sichel, D. (Eds.), Measuring Capital in the New Economy. University of Chicago Press, Chicago,
IL, pp. 73–79.
Li, B. and Y. Liu (2014). Moving up the value chain. mimeo Boston University.
Los Bart & Marcel P. Timmer & Gaaitzen J. Vries, (2015),"How Global Are Global Value Chains? A
New Approach To Measure International Fragmentation," Journal of Regional Science, Wiley
Blackwell, vol. 55(1), pages 66-92, January
Marrano, M. G., J. Haskel, and G. Wallis (2009), 'What happened to the knowledge economy? ICT,
intangible investment and Britain’s productivity record revisited', Review of Income and Wealth,
55, 686–716.
Marrocu, E., Paci, R., Pontis, M., 2012. Intangible capital and firms’ productivity, in: Industrial and
Corporate Change, 21(2), 377-402.
Mudambi, R. (2007), 'Offshoring: economic geography and the multinational firm', Journal of
International Business Studies, 38, p. 206.
Mudambi, R. (2008), 'Location, control and innovation in knowledge-intensive industries', Journal of
Economic Geography, 8, 699–725.
OECD (2013a), 'Interconnected Economies. Benefiting from Global Value Chains', OECD
Publishing, Paris.
OECD (2013b), “Knowledge-based capital and upgrading in global value chains”, in: OECD: Supporting
Investment in Knowledge Capital, Growth and Innovation, Paris 2013, OECD Publishing, pp.
215-252.
Rajan, R. G. and L. Zingales. 1998. “Financial Dependence and Growth,” American Economic Review,
88(3): 559–586.
Shin, N., K.L. Kraemer, and J. Dedrick (2009), 'R&D, value chain location and firm performance in the

23
global electronics industry', Industry and Innovation, 16, 315–330.
Shin, N., K. L. Kraemer and J. Dedrick (2012), 'Value Capture in the Global Electronics Industry:
Empirical Evidence for the 'Smiling Curve' Concept', Industry and Innovation, 19, 89-107.
Taglioni Daria & Deborah Winkler, (2016), "Making Global Value Chains Work for Development,"
World Bank Publications, The World Bank, number 24426, August.
Timmer, Marcel P., Bart Los, Robert Stehrer, and Gaaitzen J. de Vries. (2013), 'Fragmentation, Incomes
and Jobs. An Analysis of European Competitiveness'. Economic Policy 28, 613 – 61.
Timmer, M., B. Los, R. Stehrer and G. de Vries (2014), 'Slicing Up Global Value Chains', Journal of
Economic Perspectives, 28, 99-118.
Timmer, M. (2017), “Productivity measurement in global value chains”, International Productivity
Monitor, Centre for the Study of Living Standards, vol. 33, pages 182-193, Fall.
Thum-Thysen Anna & Peter Voigt & Benat Bilbao-Osorio & Christoph Maier & Diana Ognyanova,
2017. "Unlocking Investment in Intangible Assets,"European Economy - Discussion Papers
2015 - 047, Directorate General Economic and Financial Affairs (DG ECFIN), European
Commission.
Tronconi, C., Marzetti Vittucci, G. (2011), “Organizational capital and firm performance. Empirical
evidence for European firms, Economics Letters, 112, 141-143.
Winkler, Deborah (2010), "Services Offshoring and its Impact on Productivity and Employment:
Evidence from Germany, 1995–2006," The World Economy, Wiley Blackwell, vol. 33(12),
pages 1672-1701, December.
Winkler, D. and T. Farole (2015), ‘Global Value Chain Integration and Productivity’, World Bank
Working Paper, 102986. Washington, DC: World Bank.
World Intellectual Property Report 2017 – Intangible Capital in Global Value Chains, WIPO 2017.

24
Appendix (TBC)
Figure A-1 Gross trade accounting framework
Source: adapted from WBG-IDE-OECD-UIBE-WTO (2017)
Domestic value added in exports Foreign value added in exports
(1) (2) (3) (5) (6) (4)

25
Table A1 –Testing 3 classes of digital intensity
Note: All regressions contain country, industry and time fixed effects. To control for endogeneity of capital inputs
we all specifications have been tested with GMM.
(1) (2) (3) (4) (5) (6)
VARIABLES High Medium Low High Medium Low
DlnKH_intan_xrd 0.396*** 0.095*** 0.133** 0.537** 0.196 -0.328
(7.790) (3.651) (2.429) (2.126) (1.209) (-0.772)
DlnKH_rd -0.026 -0.002 0.021 -0.132 -0.197 0.188
(-1.383) (-0.123) (1.026) (-1.232) (-1.238) (0.531)
DlnKH_ICT 0.018 0.061*** 0.029 -0.041 0.010 0.027
(0.884) (4.237) (1.260) (-0.557) (0.167) (0.254)
DlnKH_NonICT 0.156*** 0.121*** 0.245*** 0.219 0.220 0.174
(2.810) (3.719) (3.683) (0.811) (0.920) (0.385)
DlnLH 0.290** 0.111** -0.048 1.362* 0.210 -1.984
(2.267) (2.547) (-0.453) (1.735) (0.959) (-1.232)
lnKH_og_avg 0.031** 0.006 0.008 0.122** 0.087** 0.235
(2.356) (1.341) (0.779) (2.149) (2.054) (0.859)
log_backp = L, 0.065* 0.014 0.045 0.316** 0.155 0.526
(1.917) (1.314) (1.179) (2.114) (1.378) (0.737)
c.lnKH_og_avg#cL2.log_backp 0.011* 0.002 0.006 0.056** 0.036** 0.109
(1.843) (1.239) (0.994) (2.041) (2.020) (0.807)
Observations 360 552 462 350 552 450
Number of ctrysec 32 47 47 32 47 47
Year and Ind FE
z-statistics in parentheses
*** p<0.01, ** p<0.05, * p<0.1
GLS IV
Intangibles exc R&D
Related Documents


![Organizational Management - SAP Assignment ... Organizational Management ... Organizational Data Requirements for Supply Chain Management [page 40] Organizational …](https://static.cupdf.com/doc/110x72/5aa5a9fa7f8b9a7c1a8db4ef/organizational-management-sap-assignment-organizational-management-organizational.jpg)