Organic Produce: Who’s Eating it? A Demographic Profile of Organic Produce Consumers Rachael L. Dettmann Economic Research Service, USDA [email protected] Selected Paper prepared for presentation at the American Agricultural Economics Association Annual meeting, Orlando, FL, July 27-29, 2008.

Welcome message from author
This document is posted to help you gain knowledge. Please leave a comment to let me know what you think about it! Share it to your friends and learn new things together.
Transcript
Organic Produce: Who’s Eating it?
A Demographic Profile of Organic Produce Consumers
Rachael L. Dettmann Economic Research Service, USDA
Selected Paper prepared for presentation at the American Agricultural Economics Association Annual meeting, Orlando, FL, July 27-29, 2008.
1
Organic Produce: Who’s Eating it? A Demographic Profile of Organic Produce Consumers
Rachael L. Dettmann1
Fueled by an increasingly health conscious and environmentally aware consumer base,
organic produce, the largest organic sector, has experienced unprecedented growth in
recent years. With growth rates averaging 15 percent over the past eight years and sales
totaling $5.4 billion in 2006, organic produce is expected to play a consistently important
role within the organic industry with sales expected to increase an average of 7 percent
between 2007 and 2010 (Nutrition Business Journal, 2007).2 Understanding the types of
consumers who purchase organic produce is particularly important for growers,
processors, and retailers since organic produce has long been considered a ‘gateway’
product with consumers often entering the organic market by first purchasing organic
produce and subsequently widening their purchases to include other organic products
(Hartman, 2000, 2002).
Growth in organic food sales is induced both by growing consumer demand for
organic food and greater accessibility in retail outlets. Consumer demand for fresh
produce has exploded in recent years with per capita consumption of fruits and
vegetables increasing 27 percent between 1970 and 2005 (ERS USDA, 2007). In
response to growing demand from convenience orientated customers, retailers have
introduced and experienced booming sales in organic precut produce (such as bagged
salads and baby carrots). As a result of the upsurge in consumer demand, many food
retail outlets, including conventional supermarkets and mass merchandisers, have added
2
organic fruits and vegetables to their shelves, increasing consumer access to organic
produce.
As the organic market grows, a natural question arises: who is buying organic
food? Gaining insight into this issue is more than just an intellectual exercise, as
retailers and members of the organic industry (for example, farmers, processors,
distributors) can further maximize profits by understanding who buys their products.
One approach to discovering who buys organic food is to develop a profile of the organic
consumer by analyzing purchase and household demographic data, with the intent of
identifying which consumers are more likely to buy organic food, or in this case, organic
produce. This type of analysis was not possible until the recent addition of organic
products to the Nielsen Homescan dataset, opening up new possibilities for consumer
research. For the purpose of organic research, Homescan data provides the richest
information currently available since it captures purchasing patterns for each household,
as well as providing demographic information about each panel household.
This paper uses purchase and household demographic data to characterize organic
produce consumers, and is part of an ongoing, broader effort to gain insight into organic
consumers.
To accomplish this, produce purchase information from Nielsen’s 2006 panel of
41,000 households is utilized. Two research objectives are achieved: one, which
demographic characteristics influence the likelihood that a household will buy organic
produce, and two, once the decision to buy organic produce is made, what share of
produce purchases will be organic? A Heckman two-stage model is used to examine this
3
decision, since it is assumed consumers make purchase decisions in two phases. The first
stage examines which demographic characteristics influence the likelihood that
consumers purchase organic produce, and the second stage analyzes which demographic
factors influence the share of produce expenditures devoted to organic produce.
Literature Review
Most studies attempting to profile organic consumers rely on surveys conducted by the
industry or academic researchers; these studies often come to conflicting conclusions.
Most research typically addresses one of the following questions: What preferences drive
consumers to purchase organic, what organic products are consumers purchasing, and
who is buying organic food? The Hartman Group’s surveys are the most widely cited;
their studies have been conducted periodically since at least 2000.
Hartman initially focused on identifying consumer rationale for buying organic
products. According to Hartman and others in the industry, including the natural foods
retailer Whole Foods Market, consumers state they buy organic foods because of their
superior taste, environmental benefits of organic production systems, and nutrition and
health concerns (Whole Foods Market, 2004; Hartman, 2002). Others found that
consumers purchase organic food products for food safety reasons and interest in trying
new products (Govindasamy and Italia, 1990). Recently Hartman’s focus has shifted to
understanding the demographic profile of organic consumers. Results of their 2004
survey indicate that half of frequent organic food purchasers have incomes below
$50,000, and African-Americans, Asian-Americans and Hispanics use more organic
4
products (Howie, 2004; Barry, 2004.) The most recent Hartman study (2006) indicated
Asians and Hispanics were the two ethnic groups (when considering Asians, Hispanics,
Whites, and African-Americans) most likely to have purchased organic products in the
previous three months, while core consumers (defined by the Hartman Group as
consumers committed to an organic lifestyle) were most likely to be Hispanic and
African-American (Baxter, 2006; Hartman, 2006.)
Some of the industry findings, particularly those concerning race, are contradicted
by academic research. Caucasian consumers, those with more education, and those with
higher incomes were more likely to purchase organic vegetables, but less likely to spend
a higher share of their vegetable income on organic vegetables (Dettmann and Dimitri,
2007). Relative to African-American consumers, Caucasians were more likely to
purchase organic produce. African-American consumers, however, were found to have
more confidence in organic labels, and thus were more likely to try organic products
(Zepeda et al., 2006). Contradicting these three studies, Stevens-Garmon et al (2007)
reported Asian and African Americans were more likely to purchase organic produce
compared to Caucasian and Hispanic consumers.
Households with graduate degrees were less likely to buy organic produce, while
households with children under 18 were more likely to buy organic produce (Thompson
and Kidwell, 1998). Consumers with three or more children and those over 50 years old
were less likely to buy organic produce, while households with some college education
were more likely to purchase organic produce (Govindasamy et al., 2001). In a stated
choice experiment Byrne et al. (1991) found that women without a college degree and
5
those in higher income brackets were most likely to purchase organic produce. Wang
and Sun (2003) also incorporated a stated choice experiment to find that younger
consumers with smaller households and larger incomes were most likely to purchase
organic produce.
Market research produced by the Hartman group in 2004 and 2006 and a wide
variety of academic studies have attempted to provide demographic profiles of organic
consumers; however, the results are conflicting and fail to paint a consistent picture of the
‘typical’ organic consumer. Further, while stated choice studies provide insight into
consumer willingness to purchase organic food, there is often a difference between what
consumers say they will purchase and what they actually purchase. This study
contributes to the current body of literature by relying on actual purchase and
demographic data to investigate which factors contribute to a higher likelihood of buying
organic foods, and further expanding our understanding of organic consumers.
Data Description and Summary Statistics
This paper makes use of the 2006 Nielsen Homescan dataset, which is unique in that it
records household grocery purchases from a wide variety of retail outlets, along with
household demographic information, for 41,000 households.3 Every time a household
purchases groceries, they scan their purchases into the database by using a Nielsen
scanner kept in their home. The households in the Nielsen data set comprise a stratified
random sample, selected on both demographic and geographic targets. Stratification
ensures that the sample matches the demographic profile of consumers according to the
6
U.S. Census (down to the census tract level). The household was the primary sampling
unit and there was no intentional clustering. All analysis incorporates the household level
projection factor (Nielsen sample weights, which reflect the demographic distribution of
the US population) to estimate model coefficients, and sample statistics, including
proportions, means, and standard errors.
The design of the Nielsen dataset constrained the analysis to pre-packaged
organic produce with universal product codes (UPC). Random weight produce purchases,
such as bulk apples or lettuce, were excluded since Nielsen does not distinguish between
organic and conventional products for products sold by the pound.4 Within the panel,
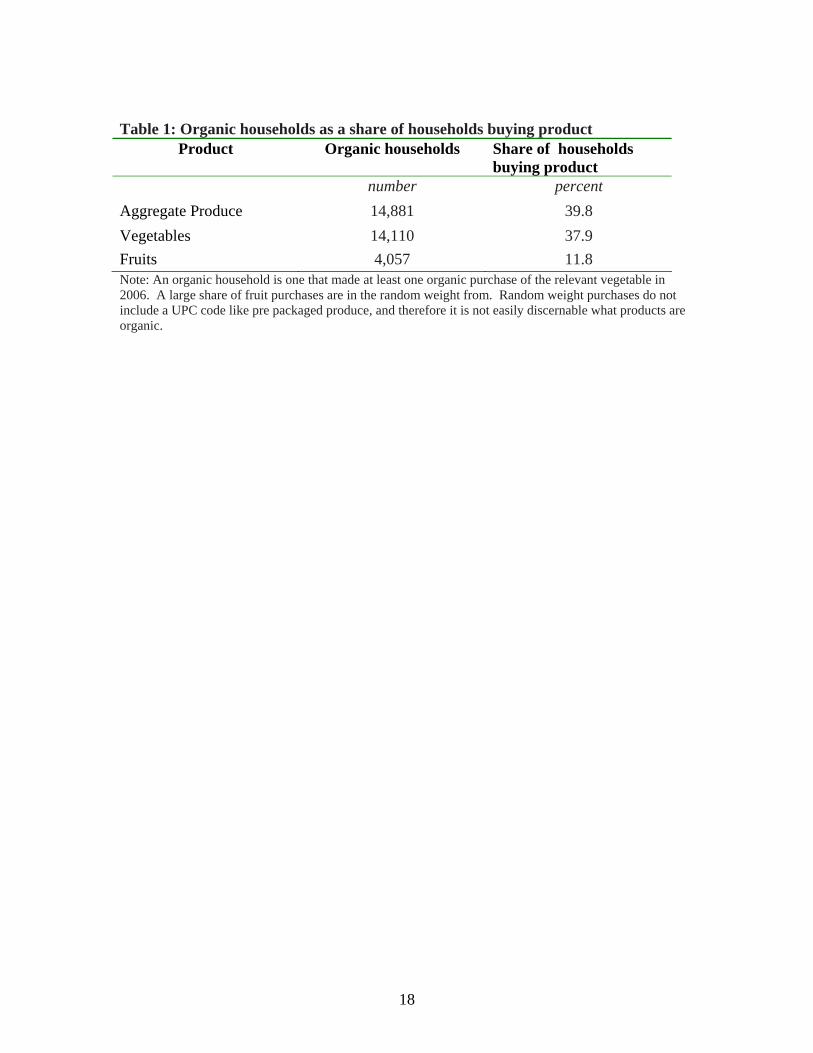
37,414 households purchased prepackaged produce, and 14,881 (39.9 percent) of the
households made at least one purchase of organic prepackaged produce in 2006, (table 1).
The majority of produce purchases were prepackaged vegetables (77 percent), with the
remaining 22 percent of produce purchasing being prepackaged fruit.
Nielsen reports demographic information (education level, age and racial/ethnic
composition) for both the female and the male heads of households.5 In this study,
demographic information for either the female or the male head of household was used
based on the following rule, which implicitly assumes that females make the majority of
grocery purchases: if a female was present in the household, her demographic
information was used in the model, otherwise the male’s demographic information was
used. This rule was followed for race/ethnicity, age and education. Income and presence
of children are reported for the entire household.
7
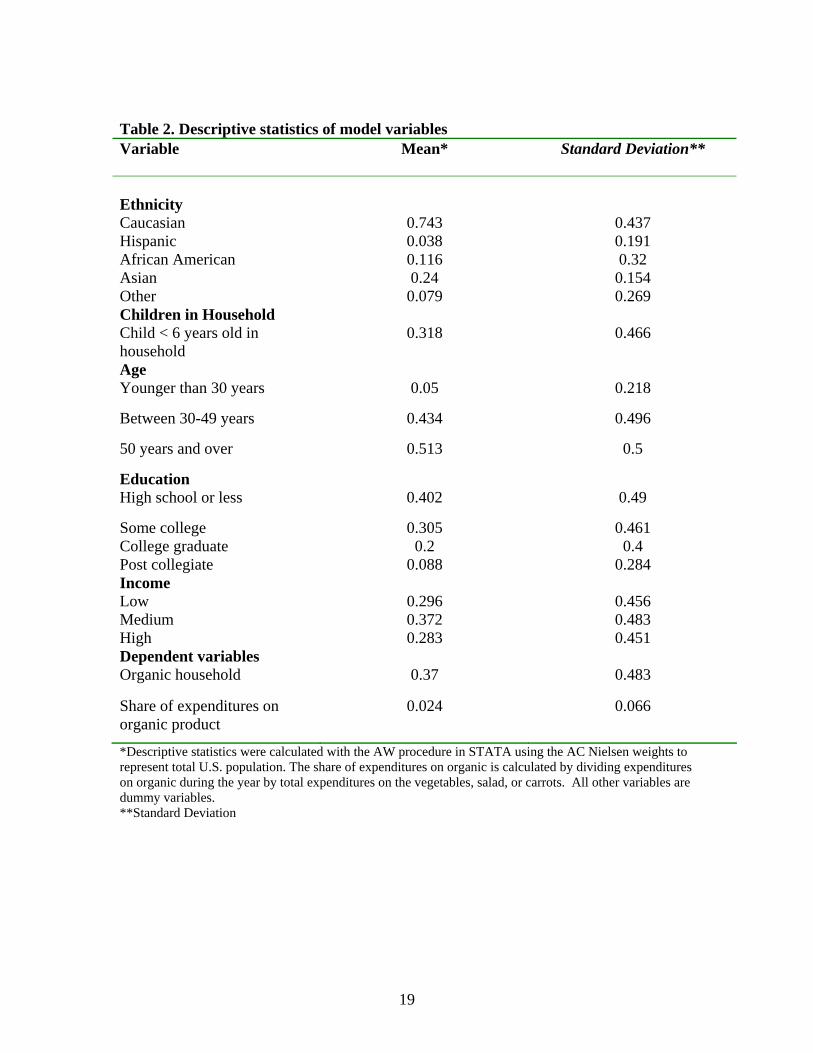
Table 2 presents summary statistics of the model’s variables, which include:
race/ethnicity of the household head, presence of young children, age of household head,
education of household head, and household income. Race/ethnicity consists of five
categories, representing Caucasian, Asian, African-American, Hispanic, and Other. Age
of the household head includes three groups: those less than 30, 30-49 years, and 50 and
older. Education of household head has four categories: high school education or less,
some college, college graduate, and post graduate work. The baseline consumer (ie, those
for whom the dummy variable is omitted) is Caucasian, under 30, with a high school
education or less.
In order to capture whether the presence of children in households influences a
household’s decision to purchase organic vegetables, households with at least one child
under 18 were assigned to one group, and households with no children were assigned to
another. The final variable included in the model is income. Nielsen classifies household
income into 16 grouped categories, ranging from a low of under $5,000 a year to a high
of over $100,000 per year, which were reclassified into three categories: low, middle and
upper incomes. Low incomes included all households with incomes below $30,000,
middle incomes were households between $30,000 and $70,000, and upper incomes were
households with incomes greater than $70,000 a year.
In categorizing market or geographic areas, Nielsen divides households into 52
different market groups, which they define as market identifications (market IDs). These
market IDs segment households in both urban and rural markets, and are included in this
analysis to account for factors omitted from the model, which are presumably uniform
8
within each market but vary across market. The main model specific factors captured by
the market ID are consumer preferences regarding organic foods or availability of organic
products in the different market areas.6
The final two variables are the dependent variables used in the two stages of the
model: organic household and organic share. Used as the first stage discrete dependent
variable, an organic household is defined as a household who makes at least one purchase
of a relevant organic product (that is, total vegetables, salads, or carrots) during the year.
In order to calculate the organic shares for each product (second stage dependent
variable), household expenditures on the relevant organic product are divided by total
household expenditures on the same product; for example, the organic share for carrots
equals the expenditures on organic carrots divided by total expenditure on carrots for
each household. This variable ranges from 0, for households that buy no organic, to 1,
for households buying only organic.
Methodology and Conceptual Model The analysis is organized around the concept that the decision to buy organic vegetables
occurs in two stages. A consumer first chooses whether to purchase organic vegetables.
Once she decides to buy organic, she then decides how much money to devote to such
purchases. This two-stage decision is modeled using the Heckman model. The first stage
decision (whether to buy organic) is estimated in a probit model, and the second stage
(how much to buy) is estimated with ordinary least squares. This approach was first
9
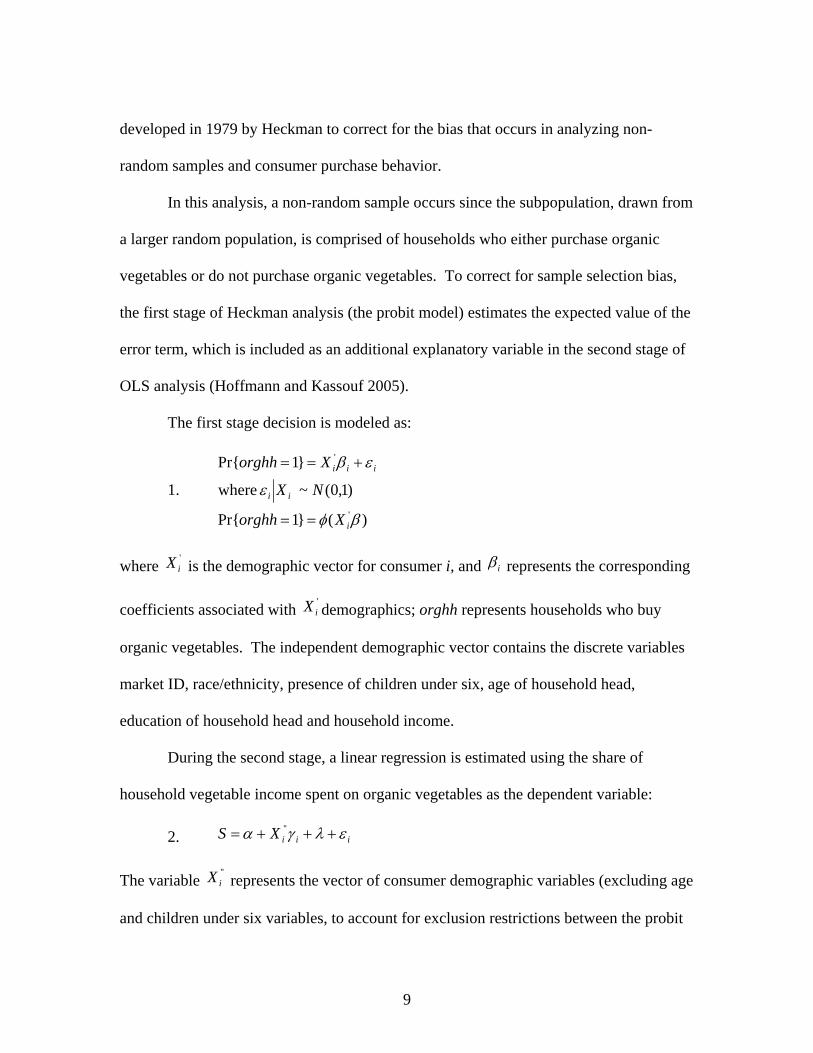
developed in 1979 by Heckman to correct for the bias that occurs in analyzing non-
random samples and consumer purchase behavior.
In this analysis, a non-random sample occurs since the subpopulation, drawn from
a larger random population, is comprised of households who either purchase organic
vegetables or do not purchase organic vegetables. To correct for sample selection bias,
the first stage of Heckman analysis (the probit model) estimates the expected value of the
error term, which is included as an additional explanatory variable in the second stage of
OLS analysis (Hoffmann and Kassouf 2005).
The first stage decision is modeled as:
1.
)(}1Pr{
)1,0(~ where
}1Pr{
'
'
βφ
ε
εβ
i
ii
iii
Xorghh
NX
Xorghh
==
+==
where 'iX is the demographic vector for consumer i, and iβ represents the corresponding
coefficients associated with 'iX demographics; orghh represents households who buy
organic vegetables. The independent demographic vector contains the discrete variables
market ID, race/ethnicity, presence of children under six, age of household head,
education of household head and household income.
During the second stage, a linear regression is estimated using the share of
household vegetable income spent on organic vegetables as the dependent variable:
2. iiiXS ελγα +++= ''
The variable ''
iX represents the vector of consumer demographic variables (excluding age
and children under six variables, to account for exclusion restrictions between the probit
10
and OLS model), as well as iγ , the corresponding coefficients for ''
iX characteristics.
Sample selection is accounted for by the inverse mills ratio,λ , estimated in the first
stage.
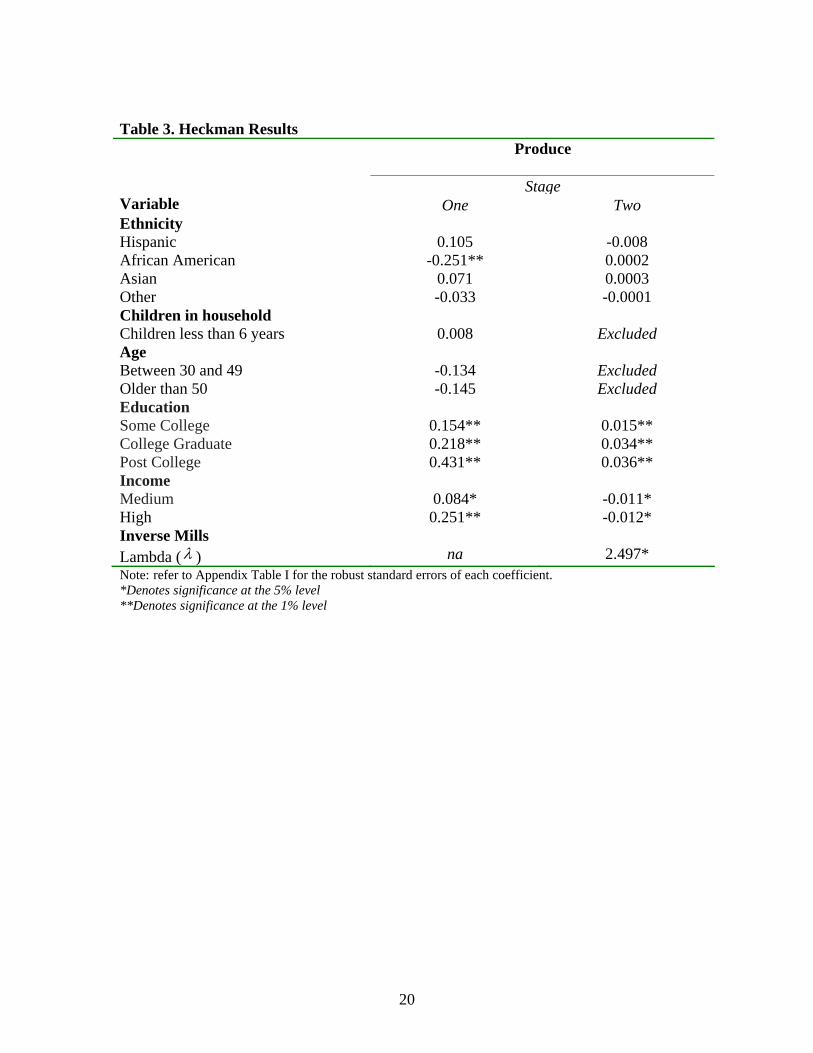
Model results
The Heckman model was used to understand the demographics that impacted the
probability of purchasing organic pre-packaged produce, and which demographics
impacted the share of household produce expenditures spent on organic produce; model
results are detailed in table 3. The first stage chi-squared test statistic, which tests for
sample selection bias, was statistically significant at the five percent level and therefore
justified employing the Heckman model for this analysis. Within the first stage of results
education, household income and one race variable were statistically significant,
revealing that African-Americans were less likely to purchase organic produce when
compared to Caucasians. Conversely, higher levels of education and incomes increased a
consumer’s likelihood of purchasing organic produce, when compared to consumers
without college education, and those with incomes below $30,000.
Within the second stage of results, variable categories of education and household
income remained statistically significant. The share spent on organic produce increased
for consumers with higher education levels, while increasing household incomes had a
negative impact on the organic share of produce expenditures. According to these results,
while higher income households were more likely to try organic vegetables, they were
11
less likely to consistently dedicate significant shares of their income to purchasing
organic vegetables.
Concluding Remarks
Both industry and academic studies have investigated the demographic profile of the
organic consumer, and to date, these studies have yielded conflicting results. This paper
adds to the current body of literature by analyzing purchase and demographic data, in an
effort to develop a demographic profile of the organic produce consumer. When the
results are compared to past literature, the findings both support and contradict past
works.
African American households are less likely to purchase organic vegetables when
compared to Caucasian households. These results are consistent with Zepeda et al.’s
focus groups and Hartman’s findings. Zepeda et al. found that African Americans were
less apt to purchase organic products, since many were unfamiliar with the products, or
had little access to them. Hartman’s results that Hispanic households were more likely to
be core consumers were not confirmed by this analysis.
Education and income were also significant factors throughout the model.
Increases in education led to higher likelihoods of purchasing organic produce, and
spending a greater share of household income on fruits and vegetables. These results
were contradictory to Thompson and Kidwell’s finding that consumers with graduate
degrees were less likely to purchase organic products.
12
Household income produced predictable results in the first decision stage
(whether to buy organic), but presented surprising results in the second decision stage
(how much to buy). In the first stage of the organic purchase decision, increases in
income levels led to an increase in the likelihood of purchasing organic vegetables,
consistent with Wang and Sun’s findings that higher income households were more likely
to purchase organic. This makes sense since lower income households face stringent
budget constraints and may be unable to afford higher priced organic vegetables.
However, when deciding how much organic to buy, higher income households were not
likely to spend as much on organic vegetables proportionate to their expenditures on
vegetables. This suggests higher income households were more likely to try organic
vegetables, but unlikely to consistently devote a large share of their expenditures towards
organic vegetables.
This paper builds off of Dettmann and Dimitri’s (2007) previous work which
examined the demographics of organic vegetable consumers. Similar to this paper’s
findings, Dettmann and Dimitri found increasing levels of education and income
increased the likelihood consumers would purchase organic vegetables. African
Americans were less likely to purchase organic compared to Caucasians but differed in
this paper’s findings by stating if African Americans did purchase organic vegetables,
they were more likely to spend a greater share of their vegetable budget on organic
vegetables.
As with most research endeavors, data limitations were encountered. The largest
constraint is that the data do not account for consumer preferences that underlie a
13
consumer’s decision to purchase organic products. Expanding the model to include
variables that capture non demographic factors leading to a consumer’s choice to
purchase organic vegetables would likely strengthen the results. One way to gather this
hard to find information would be to ask households in the Nielsen panel questions that
capture their preferences about health and environmental issues. Including such
information would make it possible to fine tune the analysis of the organic consumer’s
demographic profile.
As organic markets continue to grow, understanding the demographic factors that
influence a consumer’s choice to purchase organic vegetables as well as the factors that
influence the share of organic vegetables purchased can help guide those making organic
marketing and production decisions. From these results, well educated Caucasians with
higher incomes are the most likely sector to focus marketing of organic vegetables.
However, these results also provide an understanding of demographic groups that are
missing from the organic vegetable consumer profile, such as African Americans.
Further research should explore why minorities are less likely to purchase organic
vegetables, which may provide insight into ways to target marketing organic vegetables
to this large undeveloped market segment. Given that organic vegetables are a gateway
product, future research might aim at comparing these findings with those of other
organic product sectors.
14
1 Dettmann is an economist with the Economic Research Service of the US Department of Agriculture. The
views expressed here are those of the author and not necessarily those of the Economic Research Service or
the Department of Agriculture. The author thanks Carolyn Dimitri, Danny Pick, and Barry Krissoff for
insightful comments. All remaining errors are the responsibility of the author.
2 Organic is defined as products grown or processed in accordance with the standards set out by USDA’s
National Organic Program (United States Department of Agriculture, 2002).
3In order to be included in the panel, households were required to record weekly purchase information for a
minimum of 10 months per year.
4Random weight produce purchases comprised 21 percent of the total vegetable purchases in the dataset.
One possible way to incorporate random weight purchases would have involved sorting through the dataset,
item by item, to identify which random weight products were organic according to product title. This
would have introduced a significant amount of error, since there is no guarantee that all organic products
had the word “organic” in the Nielsen description field.
5Please refer to Appendix A for a complete summary of variable descriptions and variable frequencies
within all four datasets.
6Dummy variables for each of the markets are used in the analysis to account for differences between
market areas; results are not reported. Interested readers can contact the authors for these results.
15
References Barry, M. 2004. “The New World Order: Organic Consumer Lifestyle Segmentation.”
[N]sight. Volume VI, Number 2. Baxter, Brent. 2006. “Who’s Buying Organic? Demographics 2006,” Hartbeat Taking the
Pulse of the Marketplace, May 17. Accessed at http://ww.hartman-group.com/products/HB/2006_05_17.html; August 3, 2006
Bryne, Patrick et al. 1991. “Analysis of Consumer Attitudes Toward Organic Produce
and Purchase Likelihood.” Journal of Food Distribution Research. Pages 49-62. Dettmann, R. and C. Dimitri. “Who’s Buying Organic Vegetables? Demographic
Characteristics of U.S. Consumers.” Journal of Food Products Marketing, in press.
Govindasamy, R. et al. 2001. “Empirically Evaluating Consumer Characteristics and
Satisfaction with Organic Products.” P-02139-1-01, New Jersey Agricultural Experiment Station, Rutgers University, New Brunswick, NJ, May.
Govidnasamy, R. and J. Italia. 1990. “Predicting Willingness to Pay a Premium for
Organically Grown Fresh Produce.” Journal of Food Distribution Research. Volume 30, Number 2, pages 44-53.
Greene, William H. 1993. Econometric Analysis. Macmillion Publishing Company. New
York, Oxford, Singapore, Sydney. Hartman Group. 2000. The Organic Consumer Profile, The Hartman Group, Bellevue,
WA. Hartman Group. 2002. Hartman Organic Research Review: A Compilation of National
Organic Research Conducted by the Hartman Group. Bellevue, Washington. Hartman Group. 2004. Organic Food and Beverage Trends. Bellevue Washington. Hartman Group. 2006. Organic2006: Consumer attitudes & behavior five years later &
into the future. Bellevue, WA. Heckman, J. 1980. “Sample Selection Bias as a Specification Error.” Econometrica,
Volume 47, pages 153-161. Hoffmann, Rodolfo and Ana Lucia Kassouf. 2005. “Deriving Conditional and
Unconditional Marginal Effects in Log Earnings Equations Estimated by Heckman’s Procedure.” Applied Economics. Volume 37, pages 1303-1311.
16
Howie, M. 2004. “Research Roots Out Myths Behind Buying Organic Foods.”
Feedstuffs. March 29. Loureiro, M. and S. Hine. “Discovering Niche Markets: A Comparison of Willingness to
Pay for a Local (Colorado Grown), Organic, and GMO-Free Product.” Selected Paper presented at Annual Meeting of the American Agricultural Economics Association, Chicago, IL. 2001.
Loureiro, M., J. McCluskey, and R. Mittlehammer. 2001. “Assessing Consumer
Preferences for Organic, Eco-labeled, and Regular Apples.” Journal of Agricultural and Resource Economics. December.
Nutrition Business Journal (NBJ). 2007. U.S. Organic Food Sales ($Mil) 1997-2010e. Stevens-Garmon, J., C.L. Huang, and B. Lin. 2007. “Organic Demand: A Profile of
Consumers in the Fresh Produce Market.” Choices, the Magazine of Food, Farm, and Resource Issues v22, n2: 109-115.
Thompson, G. and L. Glaser. 2001. “National Demand for Organic and Conventional
Baby Foods,” Selected Paper presented at Annual Meeting of the Western Agricultural Economics Association, Logan, Utah, July 8-11.
Thompson, G. and J. Kidwell. 1998. “Explaining the Choice of Organic Produce:
Cosmetic Defects, Prices, and Consumer Preferences.” American Journal of Agricultural Economics v80, n2 (May): 277-8
Thompson, G.D., 1998, Consumer Demand for Organic Foods: What We Know and
What We Need to Know, American Journal of Agricultural Economics, 80: 1113-1118.
United States Department of Agriculture. 2002. Organic Food Standards and Their
Labels: the Facts. National Organic Program, April 2002, updated January 2007, accessed February 7, 2007 at http://www.ams.usda.gov/nop/Consumers/brochure.html.
Wang, Qingbin and Junjie Sun. 2003. “Consumer Preferences and Demand for Organic
Food: Evidence from a Vermont Survey.” Selected Paper Presented at the American Agricultural Economics Association Annual Meeting, Montreal Canada, 2003.
Whole Foods Market. 2004. “Organic Foods Continue to Grow in Popularity According
to Whole Foods Market Survey.” Press release, October 2004, accessed May 7, 2007 at

17
http://www.wholefoodsmarket.com/company/pr_10-21-04.html Zepeda, Lydia et al. 2006. “Organic Food Demand: A Focus Group Study Involving
Caucasian and African-American Shoppers.” Agricultural and Human Values. Volume 23, Pages 385-394.
18
Table 1: Organic households as a share of households buying product Product Organic households Share of households
buying product number percent Aggregate Produce 14,881 39.8 Vegetables 14,110 37.9 Fruits 4,057 11.8 Note: An organic household is one that made at least one organic purchase of the relevant vegetable in 2006. A large share of fruit purchases are in the random weight from. Random weight purchases do not include a UPC code like pre packaged produce, and therefore it is not easily discernable what products are organic.
19
Table 2. Descriptive statistics of model variables Variable Mean*
Standard Deviation**
Ethnicity Caucasian 0.743 0.437 Hispanic 0.038 0.191 African American 0.116 0.32 Asian 0.24 0.154 Other 0.079 0.269 Children in Household Child < 6 years old in household
0.318 0.466
Age Younger than 30 years 0.05 0.218
Between 30-49 years 0.434 0.496
50 years and over 0.513 0.5
Education High school or less 0.402 0.49
Some college 0.305 0.461 College graduate 0.2 0.4 Post collegiate 0.088 0.284 Income Low 0.296 0.456 Medium 0.372 0.483 High 0.283 0.451 Dependent variables Organic household 0.37 0.483
Share of expenditures on organic product
0.024 0.066
*Descriptive statistics were calculated with the AW procedure in STATA using the AC Nielsen weights to represent total U.S. population. The share of expenditures on organic is calculated by dividing expenditures on organic during the year by total expenditures on the vegetables, salad, or carrots. All other variables are dummy variables. **Standard Deviation
20
Table 3. Heckman Results Produce
Stage
Variable One Two Ethnicity Hispanic 0.105 -0.008 African American -0.251** 0.0002 Asian 0.071 0.0003 Other -0.033 -0.0001 Children in household Children less than 6 years 0.008 Excluded Age Between 30 and 49 -0.134 Excluded Older than 50 -0.145 Excluded Education Some College 0.154** 0.015** College Graduate 0.218** 0.034** Post College 0.431** 0.036** Income Medium 0.084* -0.011* High 0.251** -0.012* Inverse Mills Lambda (λ ) na 2.497* Note: refer to Appendix Table I for the robust standard errors of each coefficient. *Denotes significance at the 5% level **Denotes significance at the 1% level

21
Appendix Table I. Robust Standard Errors for Heckman Results
Produce
Stage
Variable One Two Ethnicity Hispanic 0.0687 0.006 African American 0.0396 0.006 Asian 0.0783 0.008 Other 0.0521 0.005 Children in Household Children less than 6 years 0.0334 excluded Age Between 30 and 49 0.0762 excluded Older than 50 0.0789 excluded Education Some College 0.0300 0.003 College Graduate 0.0334 0.004 Post College 0.0438 0.005 Income Medium 0.0289 0.004 High 0.0325 0.004 Inverse Mills Lambda (λ ) na 0.004
Related Documents