Review ORGANIC AND INORGANIC ANALYSIS WITH MSER MICROPROBE MASS SPECTROMETRY. PART I: INSTRUMENTATIONAND METHODOLOGY Luc Van Vaeck, Herbert Struyf, Wim Van Roy, and Fred Adams Department of Chemistry, University of Antwerp, Universiteitsplein 1, B-2610 Wilrijk, Belgium 1. INTRODUCTION The proliferating use of lasers in mass Spectrometry has given rise to a vast number of techniques and applications, where the benefits of these highly intense, monochromatic, coherent, and directional radiation sources have been exploited at each stage of the mass spectrometric experiment, from evaporation, through ionization, to ion excitation in MS” ( 1-21. Several reviews cover the early approaches (3-7). To summarize, laser mass spectrometry started in the early 1960s. when high power lasers were employed for the first time to vaporize and/or atomize nonconducting materials. Trace analysis in dielectric samples posed problems to the then common spark-source mass spectrometric method (8-9). Later, organic chemists increasingly started to appreciate the laser to perform soft ionization of thermolabile and polar solid compounds, intractableby direct probe and gas phase ionization (I 0- 1 1 ). The method became known as “laser desorption mass spectrometry” (LDMSJ, although desorption and ionization (DI) occurred in one step, and was used purely for structural characterization. Finally, laser microprobe mass spec- trometry (LMMS) was developed and commercialized from the late 1970s onward. Focused UV laser pulses are employed to desorb and ionize the solid in one step. The lateral resolution can be pushed to the diffraction limit of about 0.5 pm, although 1-3 p m is a more common value in routine measurements. Essentially, two types of mass analyzers are used. Time-of-flight (TOF) analyzers provide high transmission and, hence, sensitivity, together with panoramic spectrum registration, whereas Fourier transform mass spectrome- ters (FTMS) fulfill the need for high mass resolution and mass accuracy. Instruments of both types are commercially available. The role of LMMS jn analytical chemistry can be addressed through the topic of local analysis. In the 1970s. the instrumental progress with respect to sensitivity was exploited in two ways. On the one hand, trace analysis methods were refined to determine sub-ppb concentrations in, for instance, milligram amounts of samples. On the other hand, microprobes were elaborated to characterize the chemical composition of micrometer-size vol- umes or micro-objects. The interest in local analysis arises from numerous applications in science and technology. For instance, biomedicine needs microprobes to study toxic elements, drugs, and metabolites at the subcellular level. The characterization of individual aerosol particles in environmental research permits source identification, study of heterogeneousreactions in the atmosphere, etc. Material technology relies on microprobes to monitor microscopical heterogeneities and surface anomalies. The inadequate disper- sion of reagents in the production of polymers is often detectable only on the 1 0-pm scale. Inclusions and microchemical changes in metals that occur upon heating alter mechanical strength, appearance, and resistance to corrosion, etc. Local contaminants may deteriorate the quality of surface coatings. Received 12 August 1994; accepted 21 October 1994. Mass Spectrometry Reviews, 1994, /3, 189-208 0 1995 by John Wiley & Sons, Inc. ccc 0277-7037/95/030189-20

Welcome message from author
This document is posted to help you gain knowledge. Please leave a comment to let me know what you think about it! Share it to your friends and learn new things together.
Transcript
Review ORGANIC AND INORGANIC ANALYSIS WITH MSER MICROPROBE MASS SPECTROMETRY. PART I: INSTRUMENTATION AND METHODOLOGY
Luc Van Vaeck, Herbert Struyf, Wim Van Roy, and Fred Adams Department of Chemistry, University of Antwerp, Universiteitsplein 1, B-2610 Wilrijk, Belgium
1. INTRODUCTION
The proliferating use of lasers in mass Spectrometry has given rise to a vast number of techniques and applications, where the benefits of these highly intense, monochromatic, coherent, and directional radiation sources have been exploited at each stage of the mass spectrometric experiment, from evaporation, through ionization, to ion excitation in MS” ( 1-21. Several reviews cover the early approaches (3-7). To summarize, laser mass spectrometry started in the early 1960s. when high power lasers were employed for the first time to vaporize and/or atomize nonconducting materials. Trace analysis in dielectric samples posed problems to the then common spark-source mass spectrometric method (8-9). Later, organic chemists increasingly started to appreciate the laser to perform soft ionization of thermolabile and polar solid compounds, intractable by direct probe and gas phase ionization (I 0- 1 1 ) . The method became known as “laser desorption mass spectrometry” (LDMSJ, although desorption and ionization (DI) occurred in one step, and was used purely for structural characterization. Finally, laser microprobe mass spec- trometry (LMMS) was developed and commercialized from the late 1970s onward. Focused UV laser pulses are employed to desorb and ionize the solid in one step. The lateral resolution can be pushed to the diffraction limit of about 0.5 pm, although 1-3 p m is a more common value in routine measurements.
Essentially, two types of mass analyzers are used. Time-of-flight (TOF) analyzers provide high transmission and, hence, sensitivity, together with panoramic spectrum registration, whereas Fourier transform mass spectrome- ters (FTMS) fulfill the need for high mass resolution and mass accuracy. Instruments of both types are commercially available.
The role of LMMS jn analytical chemistry can be addressed through the topic of local analysis. In the 1970s. the instrumental progress with respect to sensitivity was exploited in two ways. On the one hand, trace analysis methods were refined to determine sub-ppb concentrations in, for instance, milligram amounts of samples. On the other hand, microprobes were elaborated to characterize the chemical composition of micrometer-size vol- umes or micro-objects. The interest in local analysis arises from numerous applications in science and technology. For instance, biomedicine needs microprobes to study toxic elements, drugs, and metabolites at the subcellular level. The characterization of individual aerosol particles in environmental research permits source identification, study of heterogeneous reactions in the atmosphere, etc. Material technology relies on microprobes to monitor microscopical heterogeneities and surface anomalies. The inadequate disper- sion of reagents in the production of polymers is often detectable only on the 1 0-pm scale. Inclusions and microchemical changes in metals that occur upon heating alter mechanical strength, appearance, and resistance to corrosion, etc. Local contaminants may deteriorate the quality of surface coatings.
Received 12 August 1994; accepted 21 October 1994.
Mass Spectrometry Reviews, 1994, /3, 189-208 0 1995 by John Wiley & Sons, Inc. ccc 0277-7037/95/030189-20
VAN VAECK ETAL.
Practical problem-solving requires that information be gained about organic as well as inorganic constituents, preferably on the same instrument, in conduct- ing and dielectric samples. Qualitative information is often sufficient.
A survey of the experiments in the proceedings of the triennial user’s meetings gives the impression that LMMS can handle a variety of problems, organic and inorganic in nature, in a broad range of samples, conducting and nonconducting materials, thin sections as well as bulk materials ( 12- 15). Depending on the power-density regime, elemental analysis and detailed speciation of inorganic compounds or structural characterization of organic molecules can be achieved. Speciation results from the generation of cluster ions, consisting of the main building blocks or structural moieties of the original molecule The growing awareness of the problems and limitations of the methodology has somewhat tempered initial enthusiasm, but still, the potential applicability of laser microbeam irradiation of solids motivates further develop- ment of instruments and methods of procedure. TOF LMMS research has also yielded the well-known matrix-assisted laser desorption ionization (MALDI) technique, capable of generating “giant” ions in the 200-300 kDA range ( 16- 17). In spite of the significance of this breakthrough, the rapidly prolifer- ating literature on MALDI is beyond the scope of this review, which will focus only on LMMS as a means to perform local analysis.
This review comprises two parts. The first one briefly summarizes relevant aspects of the instrumentation, both the experimental setups and the commer- cial ones. Due to the versatility of the technique with respect to samples and obtainable information, methodological aspects become extremely important. The main steps in the analytical procedure are discussed systematically. Attention is focused on sample preparation, the relationship between power density regime during ionization and the obtainable information, signal registration and, specifically, the measurement of isotope patterns, quantifica- tion, information depth, and depth-profiling capabilities. The current concepts about ion formation are mentioned, and the differences between TOF and FT LMMS are discussed from a practical point of view. Finally, the analytical capabilities of LMMS are compared to the other current techniques for local and surface analysis.
The major strength of LMMS resides in its capability to yield qualitative information on inorganic and organic constituents. However, the interpreta- tion of the resulting mass spectra in terms of the structure of the analyzed material is not straightforward. As a result, the first section of Part I1 focuses on the data obtained from the analysis of pure compounds. The comparative as opposed to deductive interpretation is discussed. Subsequently, attention is
focused on selected applications in the fields of biomedicine and biology, environmental studies, asbestos research, and material sciences. Also, practical problem-solving cases and industrial applications are discussed. In this way, the review attempts to give the potential user a practical idea about the possibilities and the results to be expected, as well as the limitations and the problems to be dealt with when LMMS is applied to a given analytical task.
Finally, it must be noted that the characteristic ions detected by FT LMMS are not exactly the same as by TOF LMMS. The main reason is probably related to the design of the mass analyzers involved, namely the acceptance characteristics with respect to the initial energy distribution and emission angle of the ions. the time-period of ion generation compatible with the mass separation process, and the time-interval elapsing between formation and detection of the ions. As a result, an explicit distinction is made throughout the text between data from FT and TOF LMMS. 0 1995 John Wiley & Sons, Inc.
190
LASER MICROPROBE MASS SPECTROMETRY I
ings permit analysis of the reflection or the transmis- sion geometry. Samples up to 20 mm in diameter and 10 mm thick can be accommodated for analysis in reflection. The ionizing laser is a Q-switched Nd:YAG, delivering about 8mJ at 266nm ( T = 511s) after fre- quency-quadrupling. The beam is focused to a spot of 1-3 p m by Cassegrain optics, which are free from chromatic aberration and, hence, facilitate the use of different wavelengths. A collinearly aligned, continu- ous low-power He-Ne (2 mW, 633 nm) laser projects a visible spot onto the sample. The region to be analyzed is positioned by means of micromanipulators under microscopical observation. The laser intensity can be varied to obtain power densities between 10' and 10" W cm-2 on the sample during UV-irradiation. The ion reflector improves the mass resolution. Detection occurs by an electron multiplier, which feeds the signal to a 100-MHz 8-bit transient recorder. Detection limits for elemental iron ions from a doped resin sample are on the order of l ppm (25). Note, however, that the perforation or crater size diameter can be smaller than the irradiated area, depending on the applied power density. Mass resolution exceeds 500 for the lead isotopes, and crater diameters in metals typically range between 1-3 p m (26). The transmission of the mass spectrometer was shown to be ca. 10% (19).
The LAMMA lOOO@ instrument exclusively works in the reflection mode. The beam is directed onto the sample at an angle less than 45". Under threshold conditions, crater diameters of about 2 p m are feasible when the theoretical irradiation spot is 3 p m (27). Detection limits are in the ppm range for elemental ions. Little information is available on the detection limits of organic molecules, but 4 X lo9 molecules or about 2 picogram of an organic complex at the surface of a metal substrate are reported to be sufficient to record a full mass spectrum with a signal-to-noise ratio exceeding 100 (28). The LAMMA 500@ is suitable only for analysis in transmission. A UV-transparent microscope objective is used for sample observation and laser-beam focusing. The lens is mounted outside the vacuum, and the sample is positioned behind a thin quartz window in the source chamber. In principle, the optics enable the achievement of the diffraction-limited spot of 0.5 p m at 266 nm and corresponding perfor- ation diameters on thin sections of 0.5 p m (29-30). Several publications report detection limits for elemen- tal ions from doped resin sections in the range of 0.1 ppm (30-32). As to organic molecules, evaporation of tetrabutyl ammonium iodide microparticles in the 1-10 femtogram range containing 107-108 molecules permits the recording of a full mass spectrum (33). The mass resolution for the lead isotopes is reported to be 850 (31). However, in our experience, the separation
11. INSTRUMENTATION AND ANALYTICAL SPECIFICATIONS
Depending on the geometry of laser and MS, LMMS instruments operate in transmission or reflection. In transmission mode, the laser beam impinges on one side of the specimen and the ions are extracted along the same axis from the opposite side, facing the mass spectrometer. This geometry is designed to analyze thin samples, less than 1-2 p m thick; e.g., biological sections or small particles adhering on a 1-nm-thick polymer film. In reflection mode, the laser beam strikes the sample, perpendicularly or under 45", but on the side facing the mass spectrometer. Compounds present at the surface of bulk samples can be analyzed.
A. TOF LMMS
The choice of the combination of a TOF analyzer with focused laser irradiation is motivated primarily by three considerations. First, laser microbeam irradiation of a sample during approximately 10 ns at power densities up to 10" W cm-2 leads to the formation of an initial ion cluster, essentially during the laser pulse (6). This so-called prompt ionization permits the elimi- nation of a gate electrode in front of the drift tube and the use of continuously applied DC voltages on the mass spectrometer. Second, microprobe applications require the utmost sensitivity, and, hence, the analyzer with the best transmission. Considering a spot of about 1 pm, the amount of evaporated material per laser shot is less than 10-l2g. Taking, e.g., a l-ppm-com- ponent with a molecular weight of 100, single laser interaction yields about 10' neutrals. To obtain the number of detectable ions, the ionization yield, the transmission of the ion optics and mass spectrometer, and the distribution of the total ion current over several peaks must be taken into account. It has been estimated that approximately 1 ion arrives at the detector in TOF LMMS for every 103-104 atoms vaporized under optimum conditions (18-19). Third, TOF analyzers inherently permit panoramic registra- tion within a quasi-unlimited m/z range.
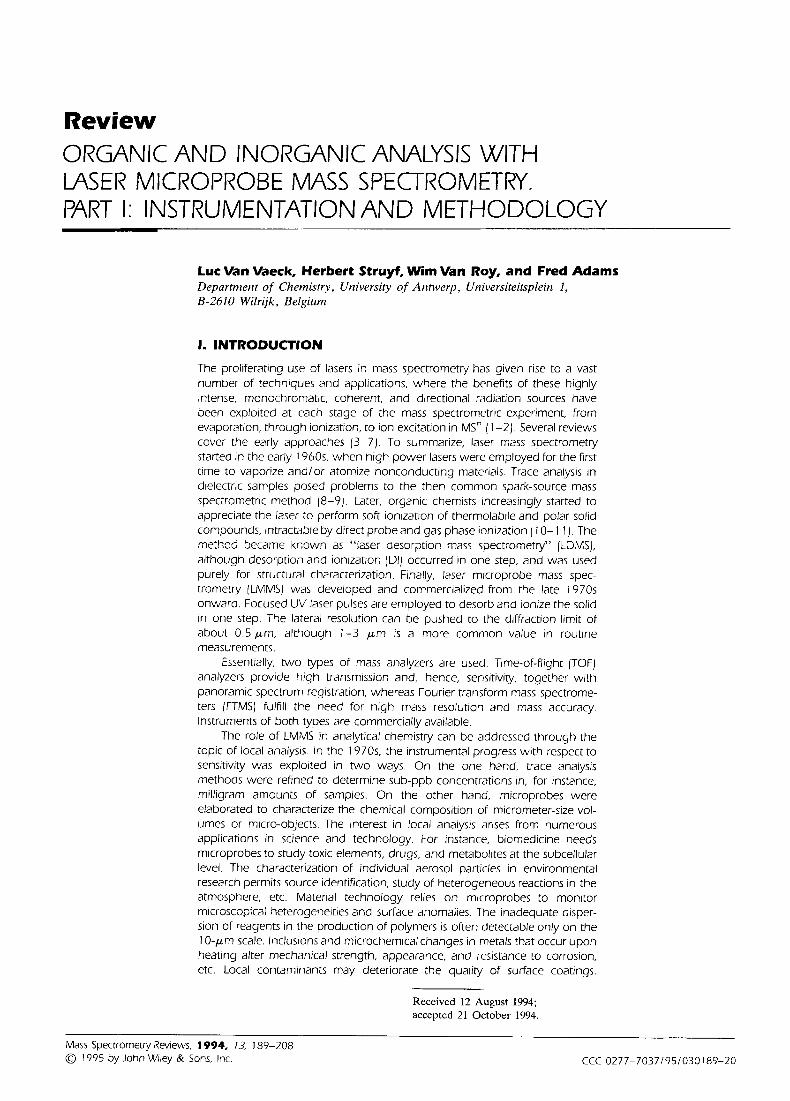
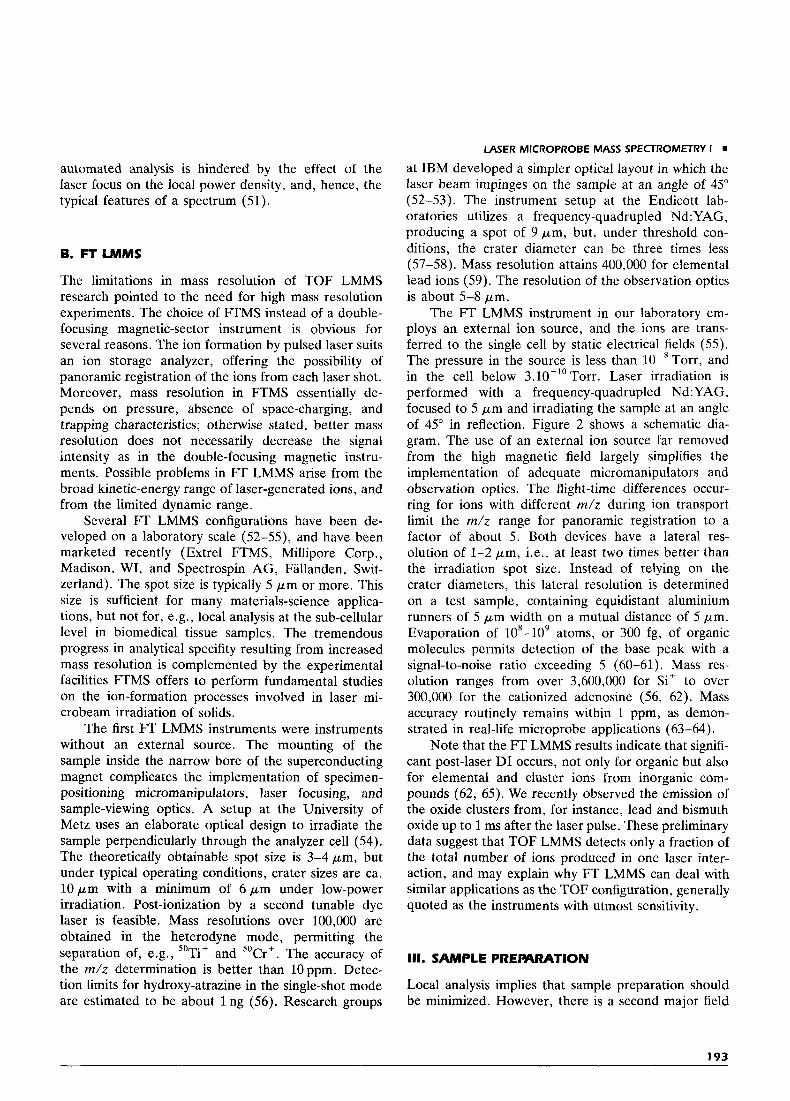
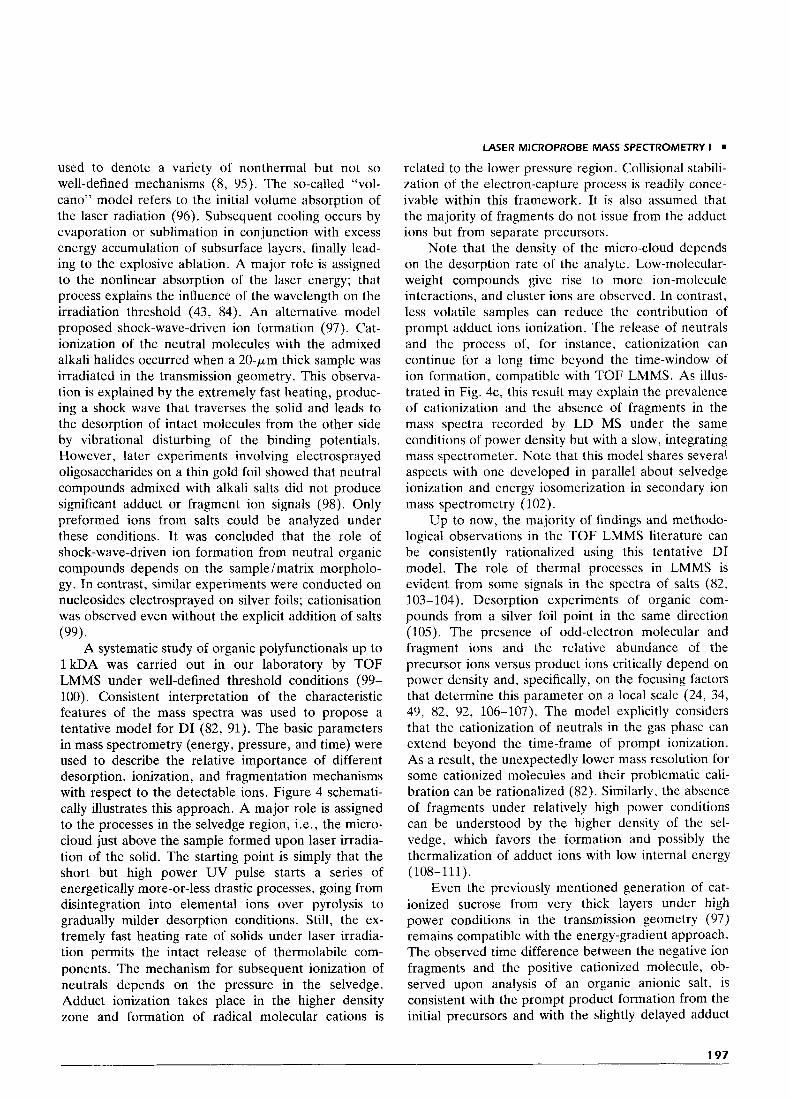
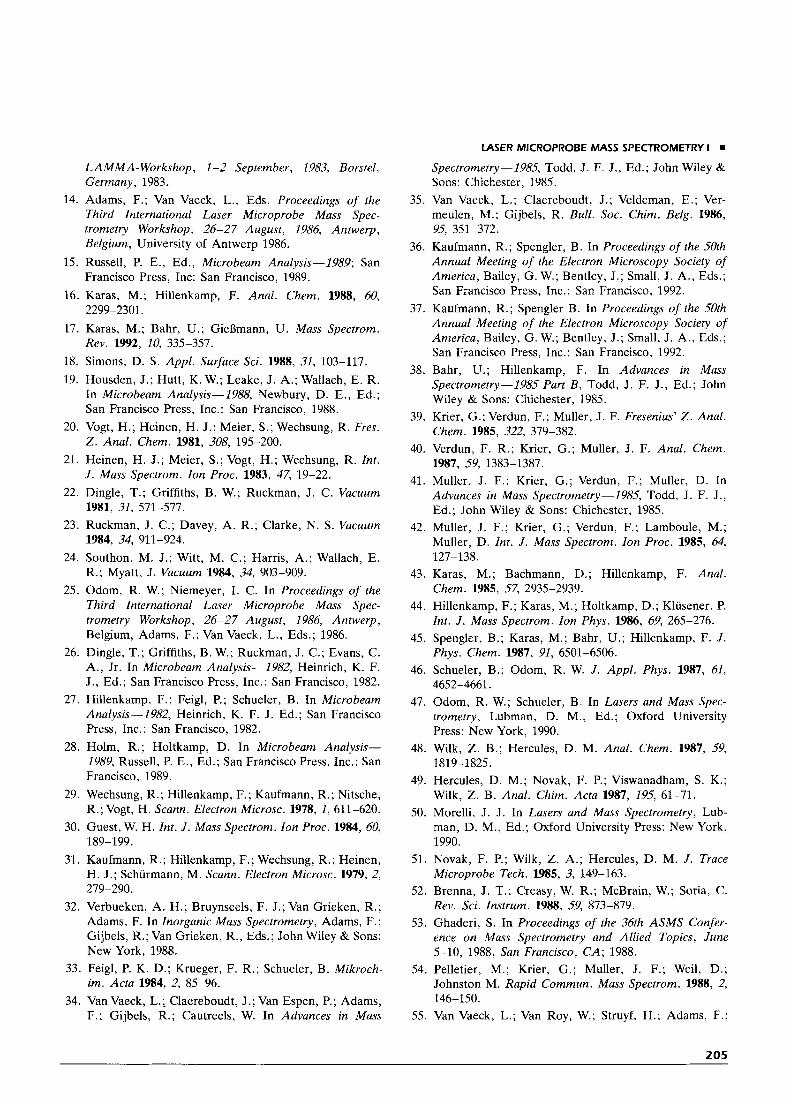
Commercially available equipment involves the LAMMA 500@ (20) and LAMMA-lOOO@ (21), initial- ly marketed by Leybold-Heraeus (Cologne, Germany) and now by SPECS (Berlin, Germany). The LIMA- 2A@ instrument (22-24) was first sold by Cambridge Mass Spectrometry (Cambridge, U.K.) and now by Kratos (Manchester, U.K.). Apart from the viewing and laser-beam focusing optics, the main functional parts of the three instruments are comparably de- signed. Figure 1 shows the block diagram of the LIMA instrument. Interchangeable lens and specimen mount-
191
VAN VAECK ET AL.
FIGURE 1. Schematic diagram of the LIMA 2A" laser microprobe mass spectrometer with time-of- flight mass analyzer. Reprinted from LIMA Technical documentation, 1985, with the permission of Kratos Analytical.
power is confined for organic ions to about 500 accord- ing to the 10% valley criterion (34). The dependence of the mass resolution on the time definition of the initially generated ion packet may account for this difference (35).
Recently, a so-called LAMMA 2000 reflection type instrument has been developed in order to overcome some of the limitations of the previous laser micro- probes with respect to spatial resolution, mass res- olution, sample observation capabilities, and the lack of real mapping facilities (36-37). Here, the optical design is based on a confocal UV-scanning microscope. The ionizing beam strikes the sample perpendicularly, and the ions are extracted through the perforated center of the focusing lens. True diffraction-limited resolution is obtained routinely in the reflection mode (0.5 p m at 266 nm). Several changes to the MS were introduced to improve the detection of large m/z ions. An x/y/z-piezo-driven specimen stage permits ana- lytical mapping. Mass resolution is pushed up to 4,500 for the lead isotopes (36).
Several researchers have modified their LAMMA
instrument on a laboratory scale. Specifically, the tunable dye and excimer lasers have been implemented to optimize the experimental conditions (38-40). The use of a wavelength that matches the sample absorp- tion maximum improves the detection limit by almost two orders of magnitude and can possibly eliminate interferences (40-42). The use of shorter wavelength lasers permits a lower threshold of irradiance of or- ganic compounds (38, 43-45). In spite of the potential gain in sensitivity and selectivity without an increase of sample consumption and, hence, spatial resolution, remarkably few attempts were made to implement post-ionization (46). The timing between the two lasers was revealed to be a critical item. Several applications have been described, involving the reduction of inter- ferences from organic surface contaminants on the detection of elemental ions and the elimination of the discrimination between Ga and As existing in the one- step laser DI, requiring 2 and 3 photons, respectively (47). Finally, motorization of the sample positioners has been tried in order to achieve mapping [48]. Although successful applications are feasible (49-50),
192
automated analysis is hindered by the effect of the laser focus on the local power density, and, hence, the typical features of a spectrum (51).
6. FTLMMS
The limitations in mass resolution of TOF LMMS research pointed to the need for high mass resolution experiments. The choice of FTMS instead of a double- focusing magnetic-sector instrument is obvious for several reasons. The ion formation by pulsed laser suits an ion storage analyzer, offering the possibility of panoramic registration of the ions from each laser shot. Moreover, mass resolution in FTMS essentially de- pends on pressure, absence of space-charging, and trapping characteristics; otherwise stated, better mass resolution does not necessarily decrease the signal intensity as in the double-focusing magnetic instru- ments. Possible problems in FT LMMS arise from the broad kinetic-energy range of laser-generated ions, and from the limited dynamic range.
Several FT LMMS configurations have been de- veloped on a laboratory scale (52-55), and have been marketed recently (Extrel FTMS, Millipore Corp., Madison, WI, and Spectrospin AG, Fallanden, Swit- zerland). The spot size is typically 5 p m or more. This size is sufficient for many materials-science applica- tions, but not for, e.g., local analysis at the sub-cellular level in biomedical tissue samples. The tremendous progress in analytical specifity resulting from increased mass resolution is complemented by the experimental facilities FTMS offers to perform fundamental studies on the ion-formation processes involved in laser mi- crobeam irradiation of solids.
The first FT LMMS instruments were instruments without an external source. The mounting of the sample inside the narrow bore of the superconducting magnet complicates the implementation of specimen- positioning micromanipulators, laser focusing, and sample-viewing optics. A setup at the University of Metz uses an elaborate optical design to irradiate the sample perpendicularly through the analyzer cell (54). The theoretically obtainable spot size is 3-4 pm, but under typical operating conditions, crater sizes are ca. 1 0 p m with a minimum of 6 p m under low-power irradiation. Post-ionization by a second tunable dye laser is feasible. Mass resolutions over 100,000 are obtained in the heterodyne mode, permitting the separation of, e.g., ''Ti+ and 'OCr+. The accuracy of the m/z determination is better than 10ppm. Detec- tion limits for hydroxy-atrazine in the single-shot mode are estimated to be about 1 ng (56). Research groups
W E R MICROPROBE MASS SPECTROMETRY I
at IBM developed a simpler optical layout in which the laser beam impinges on the sample at an angle of 45" (52-53). The instrument setup at the Endicott lab- oratories utilizes a frequency-quadrupled Nd:YAG, producing a spot of 9 pm, but, under threshold con- ditions, the crater diameter can be three times less (57-58). Mass resolution attains 400,000 for elemental lead ions (59). The resolution of the observation optics is about 5-8 pm.
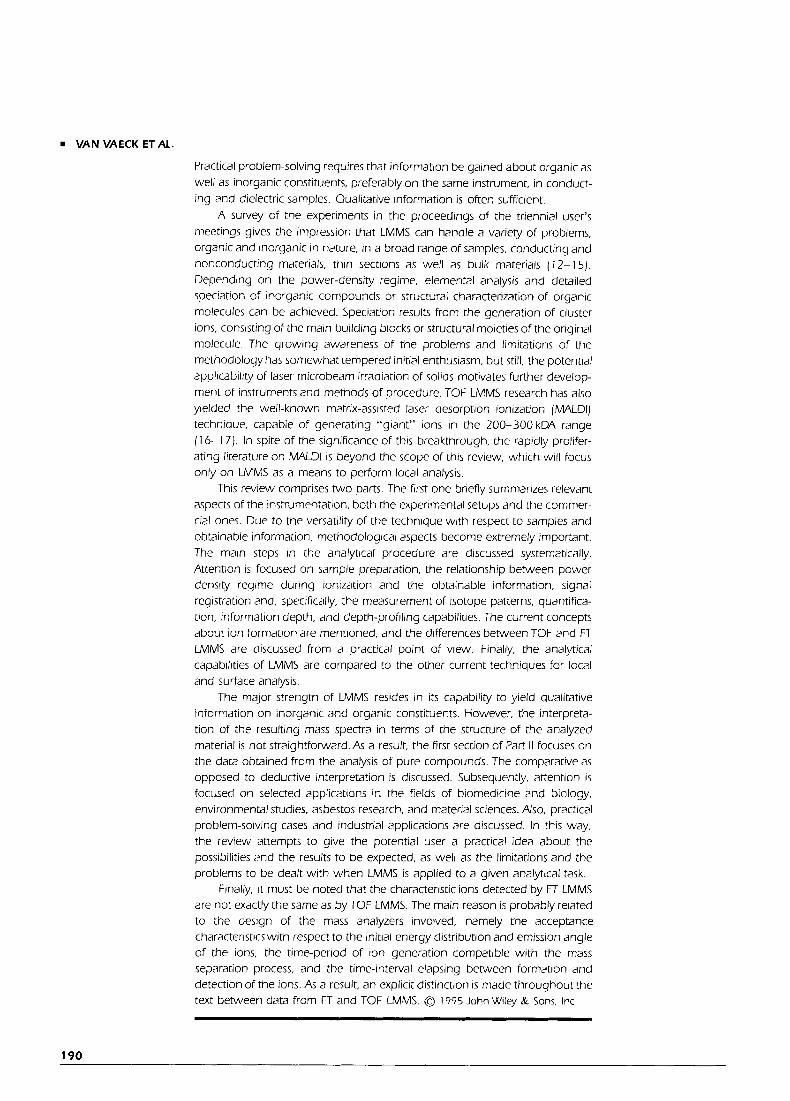
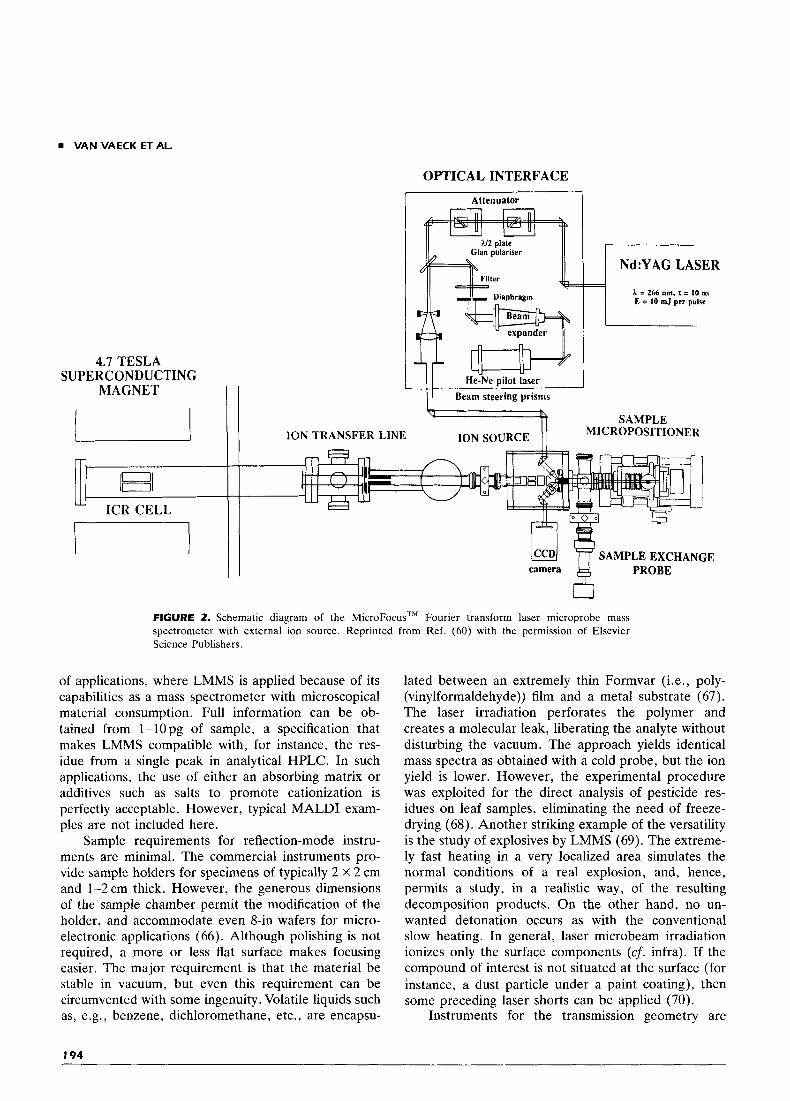
The FT LMMS instrument in our laboratory em- ploys an external ion source, and the ions are trans- ferred to the single cell by static electrical fields ( 5 5 ) . The pressure in the source is less than 10-XTorr, and in the cell below 3.10-''Torr. Laser irradiation is performed with a frequency-quadrupled Nd:YAG, focused to 5 p m and irradiating the sample at an angle of 45" in reflection. Figure 2 shows a schematic dia- gram. The use of an external ion source far removed from the high magnetic field largely simplifies the implementation of adequate micromanipulators and observation optics. The flight-time differences occur- ring for ions with different m/z during ion transport limit the m/z range for panoramic registration to a factor of about 5 . Both devices have a lateral res- olution of 1-2 pm, i.e., at least two times better than the irradiation spot size. Instead of relying on the crater diameters, this lateral resolution is determined on a test sample, containing equidistant aluminium runners of 5 p m width on a mutual distance of 5 pm. Evaporation of 108-109 atoms, or 300 fg, of organic molecules permits detection of the base peak with a signal-to-noise ratio exceeding 5 (60-61). Mass res- olution ranges from over 3,600,000 for Si' to over 300,000 for the cationized adenosine (56, 62). Mass accuracy routinely remains within 1 ppm, as demon- strated in real-life microprobe applications (63-64).
Note that the FT LMMS results indicate that signifi- cant post-laser DI occurs, not only for organic but also for elemental and cluster ions from inorganic com- pounds (62, 65). We recently observed the emission of the oxide clusters from, for instance, lead and bismuth oxide up to 1 ms after the laser pulse. These preliminary data suggest that TOF LMMS detects only a fraction of the total number of ions produced in one laser inter- action, and may explain why FT LMMS can deal with similar applications as the TOF configuration, generally quoted as the instruments with utmost sensitivity.
111. SAMPLE PREIWRATION
Local analysis implies that sample preparation should be minimized. However, there is a second major field
193
VAN VAECK ET AL.
4.7 TESLA SUPERCONDUCTING
MAGNET I t
OPTICAL INTERFACE
Attenuator
Clan polariser 1, A = 266 nm, T = 10 ns E = 10 mJ per pulse
He-Ne pilot laser Beam steering prisms
SAMPLE MICROPOSITIONER ION SOURCE ION TRANSFER LINE
' l l SAMPLE EXCHANGE camera PROBE
FIGURE 2. Schematic diagram of the MicroFocus'M Fourier transform laser microprobe mass spectrometer with external ion source. Reprinted from Ref. (60) with the permission of Elsevier Science Publishers.
of applications, where LMMS is applied because of its capabilities as a mass spectrometer with microscopical material consumption. Full information can be ob- tained from 1-lOpg of sample, a specification that makes LMMS compatible with, for instance, the res- idue from a single peak in analytical HPLC. In such applications, the use of either an absorbing matrix or additives such as salts to promote cationization is perfectly acceptable. However, typical MALDI exam- ples are not included here.
Sample requirements for reflection-mode instru- ments are minimal. The commercial instruments pro- vide sample holders for specimens of typically 2 X 2 cm and 1-2 cm thick. However, the generous dimensions of the sample chamber permit the modification of the holder, and accommodate even 8-in wafers for micro- electronic applications (66). Although polishing is not required, a more or less flat surface makes focusing easier. The major requirement is that the material be stable in vacuum, but even this requirement can be circumvented with some ingenuity. Volatile liquids such as, e.g., benzene, dichloromethane, etc., are encapsu-
lated between an extremely thin Formvar (i.e., poly- (vinylformaldehyde)) film and a metal substrate (67). The laser irradiation perforates the polymer and creates a molecular leak, liberating the analyte without disturbing the vacuum. The approach yields identical mass spectra as obtained with a cold probe, but the ion yield is lower. However, the experimental procedure was exploited for the direct analysis of pesticide res- idues on leaf samples, eliminating the need of freeze- drying (68). Another striking example of the versatility is the study of explosives by LMMS (69). The extreme- ly fast heating in a very localized area simulates the normal conditions of a real explosion, and, hence, permits a study, in a realistic way, of the resulting decomposition products. On the other hand, no un- wanted detonation occurs as with the conventional slow heating. In general, laser microbeam irradiation ionizes only the surface components (cf. infra). If the compound of interest is not situated at the surface (for instance, a dust particle under a paint coating), then some preceding laser shorts can be applied (70).
Instruments for the transmission geometry are
194
designed for the analysis of thin films, typically 1-2 p m thick, and are ideal for biological sections, such as those used for morphological studies by optical and/or electron microscopy. However, major problems arise from the conventionally used embedding procedures of the tissue. These methods are well-suited to preserve sample morphology, but can induce severe alterations of the microchemical composition, e.g., by contamina- tion from the various reagents and redistribution of the soluble elements (71-73). Freeze-dried cryo-sections are, therefore, the preferred material at the cost, however, of complicated section preparation proce- dures and possible loss of morphological information, because LMMS requires relatively thick samples of 1 pm. Transmission-type instruments are handicapped for most materials science applications, because the preparation of sections is often cumbersome, even impossible. However, this geometry is suitable for the characterization of micrometer-size particulates. The sample is prepared by simply touching the ground powder with a Formvar-coated electron-microscopy grid. Only the micrometer-size particulates adhere to the polymer. For air pollution studies, Formvar-coated grids can also be mounted directly in aerosol collection systems such as cascade impactors (74-75). In the case of filtration samplers, the fibers of the top layer can be removed. The laser beam is directed onto the adhering particles. The spectra show no signals from the sup- porting film (76). Large particles or micro-objects, up to 150 p m can be analyzed by directing the laser beam at a grazing angle (77). Similarly, 15 p m sections of soils were studied (78). Alternatively, a two-step approach has been proposed for thick specimens, which cannot be sectioned (74). First, the laser is used to ablate the analyte, and some of the evaporated material redeposits on the quartz window. Subsequent- ly, the recondensed material is analyzed. However, this procedure holds the risk of selective evaporation in the first step. A specific approach for volatile samples that are unstable in the vacuum has been developed by replacing the quartz window with a thin polymer film of, e.g., 0.3 p m (79). The sample is positioned on the atmospheric side. The laser perforates the polymer, and some of the ions and neutrals are released into the mass spectrometer.
IV. EXPERIMENTAL POWER DENSITY CONDITIONS FOR IONIZATION
Depending on the power density during irradiation, different types of information about the local chemical composition can be obtained (8, 80-81). The genera- tion of elemental ions is optimized under high ir-
LASER MICROPROBE MASS SPECTROMETRY I
radiance; i.e., between 10’ and 10” W-cm-’. Much milder conditions, typically around lo6 W. cm-’, are needed for the generation of structural ions from organic compounds up to, e.g., 1 kDa (82). Speciation of inorganic substances may require a somewhat higher power density than organic molecules, but they remain far under the elemental regime (63, 82-83).
In practical analysis, the delineation of the power density regimes is not obvious. First of all, it is difficult to determine prior to analysis how much energy per pulse should be applied to achieve precisely a given power density in the ionized microvolume. Indeed, the conditions under which the actual ion formation takes place depend on the local energy deposition, which in turn is affected by the properties of both the evapo- rated microvolume and the sample material in the immediate vicinity. Deposition of energy by means of UV photons onto the solid sample is primarily a function of the optical properties (UV absorption) and sample micro-morphology (refraction at interfaces of, e.g., microcrystalline material) (84). These properties are not directly related to the chemical composition, and their assessment on a p m scale poses problems, especially in heterogeneous samples.
Second, the experimental determination of the actually applied power density on the sample is not straightforward. The crater left after interaction refers to the evaporated, not to the irradiated, area. More- over, the exact positioning of the sample’s surface in the waist of the laser beam is important to reproduce the “unknown” power density from shot to shot. In practice, focusing is not trivial because of the com- promises made in the observation-microscope designs of LMMS instruments.
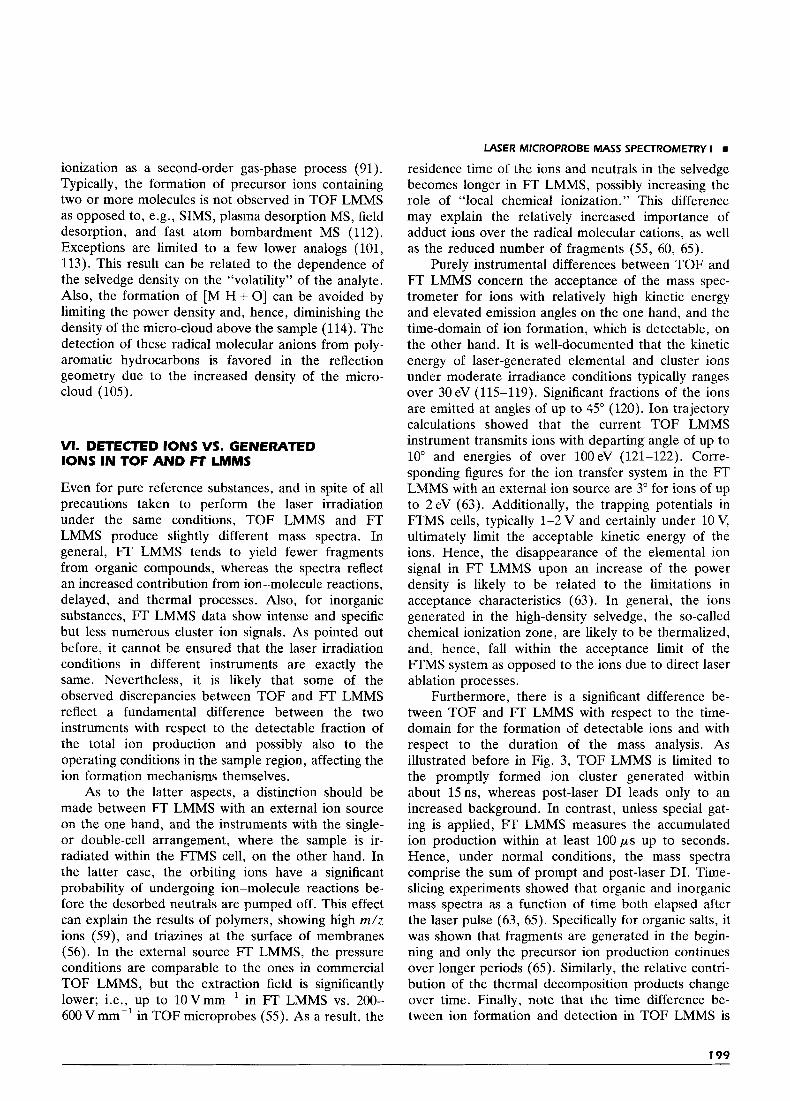
Third, the relationship between the actually de- tected ions and the local power density regime is a rather complicated one. The power density is a mea- sure of the total energy input in the sample and the time during which it is applied. However, the laser pulse triggers a range of ion-formation processes, where relative contribution may vary with time. For instance, ablation occurs first, but the more thermal mechanisms happen later. Similarly, it was observed in TOF LDMS with a gate in front of the drift tube that fragments of cyclosporin are formed only in the begin- ning and that protonated molecules are generated later (85). Similar observations have been made in FT LMMS (65). Finally, the mass spectrometer’s charac- teristics in terms of time-domain, acceptance, and transmission as a function of the ion’s energy and emission angle are essential to link the detected ions to the ones formed. Information about the latter aspects can be readily derived from the physics of the instru- ment, ion trajectory calculations, etc. Hence, in order
195
VAN VAECK ET AL.
Im 1 ..“r* .* 6 /;T+==@j---J-J
{ / 7 @ q j , J 0 0 *e*b
“11 t
1 I & f t
mlz TIME - OF - FLIGHT MASS SPECTROMETER
I , ..* t .;.** .$a>; *;to
/ t
mlZ
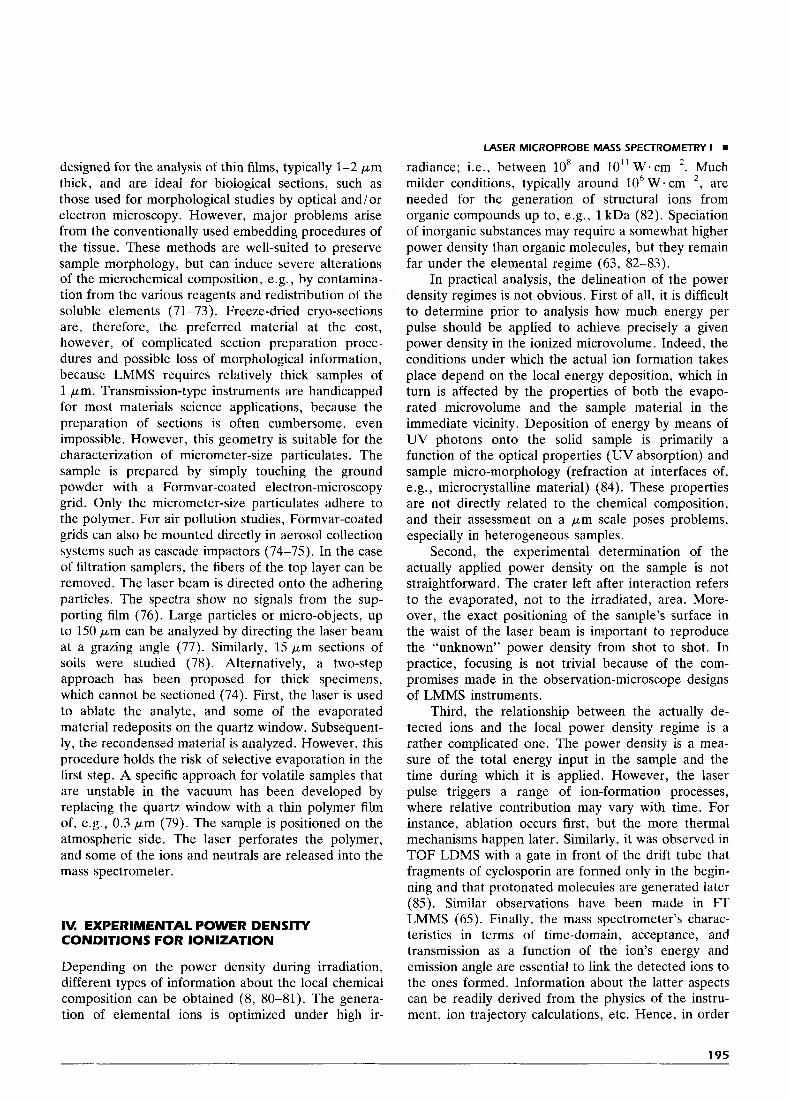
Time-dependency of ion bunch formation : effect, on mass resolution.
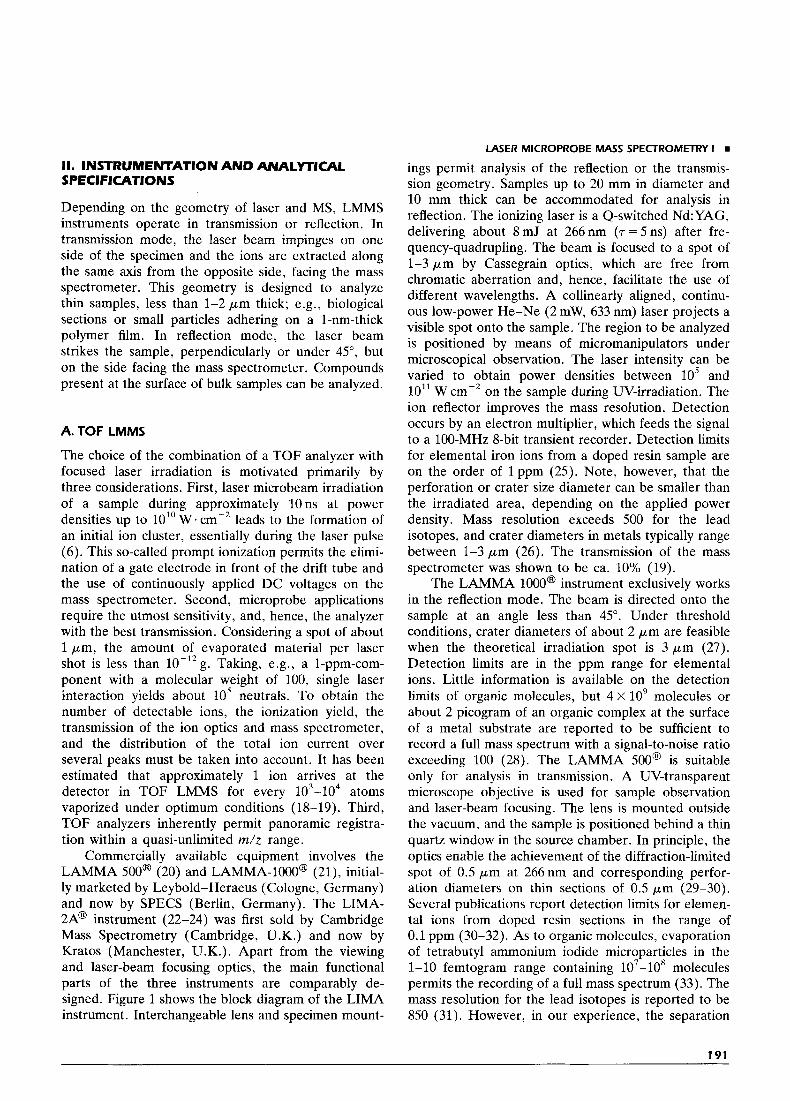
FIGURE 3. Effect of time-definition of ion-cluster formation on mass resolution in TOF LMMS Reprinted from Ref. (35) with the permission of the editor, H. P. Thun.
to relate mass spectra to the local energy regime, the experimental methodology must permit the delinea- tion, as far as possible, of the time-domain responsible for the detected ions. Time-gating information is di- rectly available in FTMS, whereas, in the current TOF LMMS with continuous ion extraction, mass resolution and calibration of the m/z scale can be used to assess the time-frame within which the detected ions are formed (82). Figure 3 illustrates the principle of this approach (35). Post-laser DI is characterized by a much lower mass resolution than the one normally feasible with promptly-formed ions in the same m/z range. Additional confirmation comes from the m/z value, shifting to higher mass. Different accelerating voltages and corresponding calibrations of the instru- ment permit the observation of larger or smaller m/z shifts, because these shifts are due to the same time delay.
V. CURRENT CONCEPTS ABOUT ION FORMATION
The mass spectra from inorganic substances typically contain the signals from elemental ions as well as a series of higher m/z clusters, comprising one or more building blocks of the original molecule and a charged species; i.e., an elemental ion or a small stable frag- ment. Their formation mechanism and, specifically, the possible role of direct emission, fragmentation, and/or recombination processes by ion-molecule interactions
still remains to be determined in more detail (63,
With respect to organic neutral compounds of up to 1 kDa, LMMS results generally contain some low m/z elemental ions, a series of intense organic frag- ments, usually accompanied by the signal of proton- ated or cationized molecules in the positive ion mode, and the deprotonated molecules in the negative-ion mass spectra (82, 91). Depending on the structure and the locally applied energy regime, the precursor peak can be due to radical molecular ions (82, 92). For organic salts, the preformed ion is detected as an intense signal. For ion formation mechanisms, several models exist.
One of the very first proposals to explain ion formation involved the existence of several physically separated ionization regions (93). Direct ionization in the center of the analyzed area is responsible for elemental ion formation, whereas ejection of high molecular-weight ions and neutrals is caused by the shock wave in the peripheral region. Ion-molecule reactions occur in the gas phase of the selvedge, but also the idea of a so-called solid state chemical ioniza- tion is introduced (94). Additional models for the organic ion formation have been based on specific experiments. Essentially, there are two different series of concepts. On the one hand, ion formation is related to collective nonequilibrium processes, whereas, on the other hand, the thermal nature of the DI and ioniza- tion in the selvedge is assumed.
Sometimes, the term “true laser desorption” is
86-90).
196
LASER MICROPROBE MASS SPECTROMETRY I
related to the lower pressure region. Collisional stabili- zation of the electron-capture process is readily conce- ivable within this framework. It is also assumed that the majority of fragments do not issue from the adduct ions but from separate precursors.
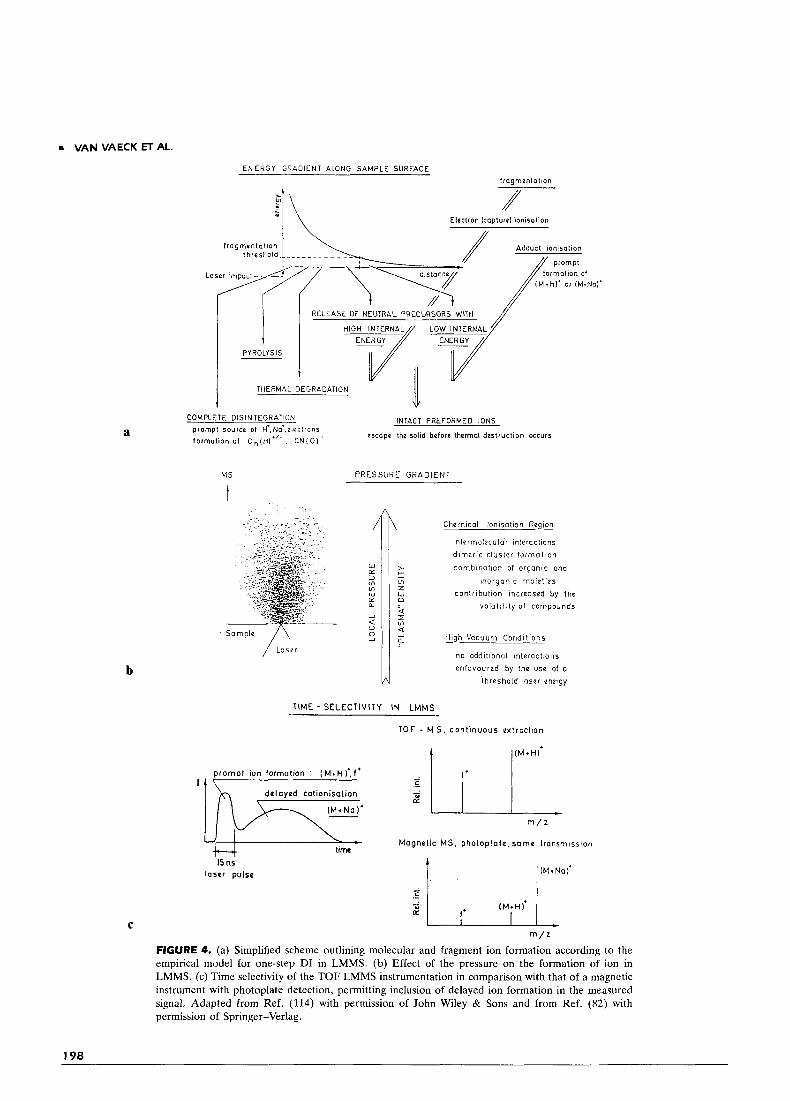
Note that the density of the micro-cloud depends on the desorption rate of the analyte. Low-molecular- weight compounds give rise to more ion-molecule interactions, and cluster ions are observed. In contrast, less volatile samples can reduce the contribution of prompt adduct ions ionization. The release of neutrals and the process of, for instance, cationization can continue for a long time beyond the time-window of ion formation, compatible with TOF LMMS. As illus- trated in Fig. 4c, this result may explain the prevalence of cationization and the absence of fragments in the mass spectra recorded by LD MS under the same conditions of power density but with a slow, integrating mass spectrometer. Note that this model shares several aspects with one developed in parallel about selvedge ionization and energy iosomerization in secondary ion mass spectrometry (102).
Up to now, the majority of findings and methodo- logical observations in the TOF LMMS literature can be consistently rationalized using this tentative DI model. The role of thermal processes in LMMS is evident from some signals in the spectra of salts (82, 103-104). Desorption experiments of organic com- pounds from a silver foil point in the same direction (105). The presence of odd-electron molecular and fragment ions and the relative abundance of the precursor ions versus product ions critically depend on power density and, specifically, on the focusing factors that determine this parameter on a local scale (24, 34, 49, 82, 92, 106-107). The model explicitly considers that the cationization of neutrals in the gas phase can extend beyond the time-frame of prompt ionization. As a result, the unexpectedly lower mass resolution for some cationized molecules and their problematic cali- bration can be rationalized (82). Similarly, the absence of fragments under relatively high power conditions can be understood by the higher density of the sel- vedge, which favors the formation and possibly the thermalization of adduct ions with low internal energy
Even the previously mentioned generation of cat- ionized sucrose from very thick layers under high power conditions in the transmission geometry (97) remains compatible with the energy-gradient approach. The observed time difference between the negative ion fragments and the positive cationized molecule, ob- served upon analysis of an organic anionic salt, is consistent with the prompt product formation from the initial precursors and with the slightly delayed adduct
(108-1 11).
used to denote a variety of nonthermal but not so well-defined mechanisms (8, 95). The so-called “vol- cano” model refers to the initial volume absorption of the laser radiation (96). Subsequent cooling occurs by evaporation or sublimation in conjunction with excess energy accumulation of subsurface layers, finally lead- ing to the explosive ablation. A major role is assigned to the nonlinear absorption of the laser energy; that process explains the influence of the wavelength on the irradiation threshold (43, 84). An alternative model proposed shock-wave-driven ion formation (97). Cat- ionization of the neutral molecules with the admixed alkali halides occurred when a 20-pm thick sample was irradiated in the transmission geometry. This observa- tion is explained by the extremely fast heating, produc- ing a shock wave that traverses the solid and leads to the desorption of intact molecules from the other side by vibrational disturbing of the binding potentials. However, later experiments involving electrosprayed oligosaccharides on a thin gold foil showed that neutral compounds admixed with alkali salts did not produce significant adduct or fragment ion signals (98). Only preformed ions from salts could be analyzed under these conditions. It was concluded that the role of shock-wave-driven ion formation from neutral organic compounds depends on the sample /matrix morpholo- gy. In contrast, similar experiments were conducted on nucleosides electrosprayed on silver foils; cationisation was observed even without the explicit addition of salts
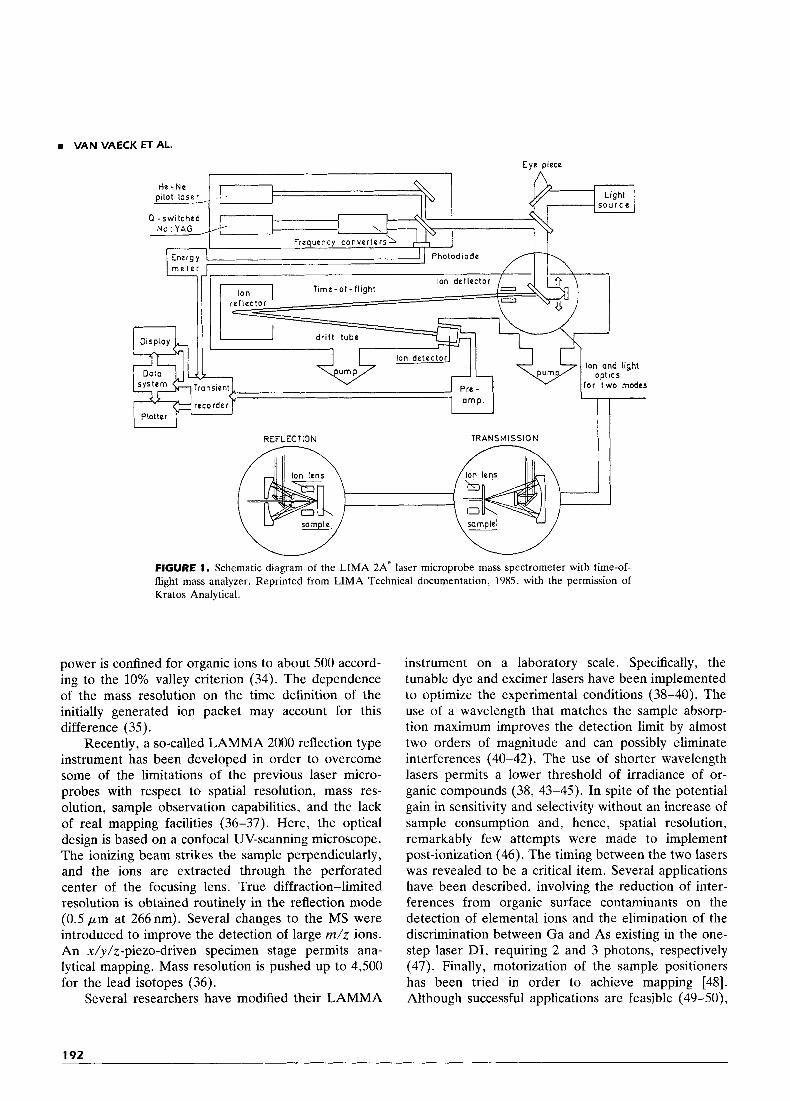
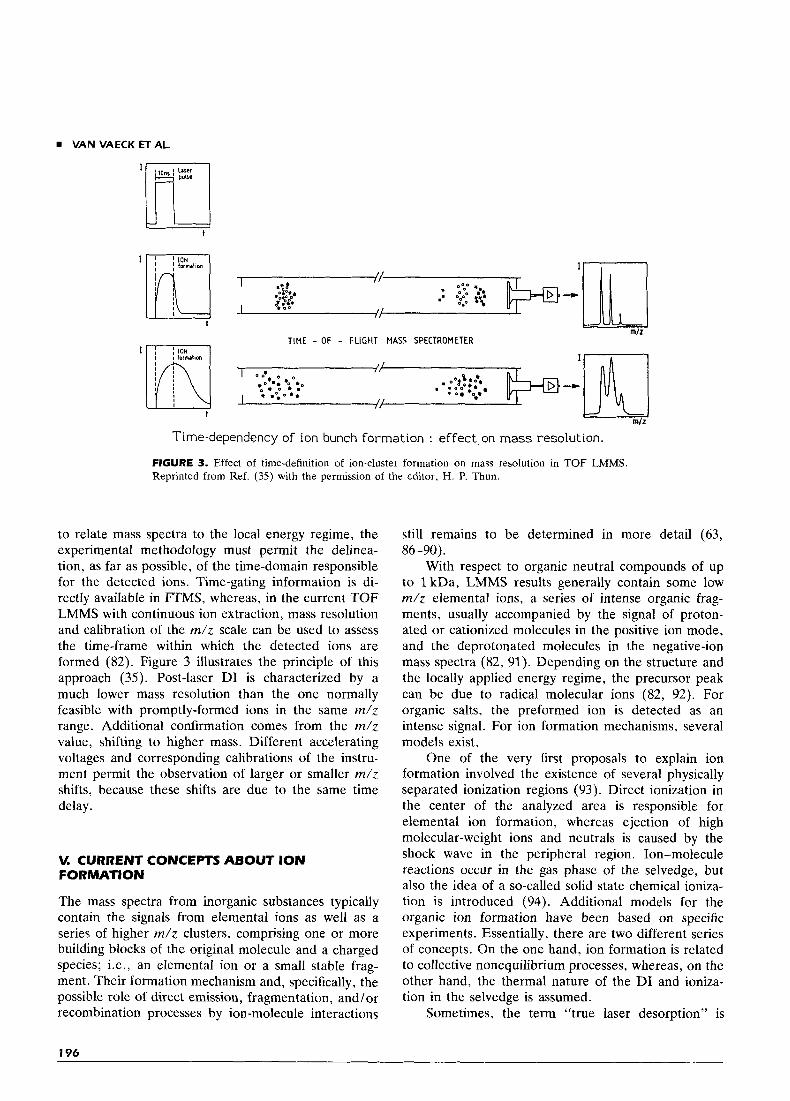
A systematic study of organic polyfunctionals up to 1 kDA was carried out in our laboratory by TOF LMMS under well-defined threshold conditions (99- 100). Consistent interpretation of the characteristic features of the mass spectra was used to propose a tentative model for DI (82, 91). The basic parameters in mass spectrometry (energy, pressure, and time) were used to describe the relative importance of different desorption, ionization, and fragmentation mechanisms with respect to the detectable ions. Figure 4 schemati- cally illustrates this approach. A major role is assigned to the processes in the selvedge region, i.e., the micro- cloud just above the sample formed upon laser irradia- tion of the solid. The starting point is simply that the short but high power UV pulse starts a series of energetically more-or-less drastic processes, going from disintegration into elemental ions over pyrolysis to gradually milder desorption conditions. Still, the ex- tremely fast heating rate of solids under laser irradia- tion permits the intact release of thermolabile com- ponents. The mechanism for subsequent ionization of neutrals depends on the pressure in the selvedge. Adduct ionization takes place in the higher density zone and formation of radical molecular cations is
(99).
197
rn VAN VAECK ET AL.
a
b
C
ENERGY GRADIENT ALONG SAMPLE SURFACE
$I \\ lmgmentation
Eleclron kopturel ionisation * I \
1 I RELEASE OF NEUTRAL PRECURSORS WITH // I PYROLYSIS
HIGH INTERNAL LOW INTERNAL '
THERMAL DEGRADATION 1 INTACT PREFORMED IONS COMPLETE OlSlNTEGRAliON
escape the solid before thermal destruction occurs prompt source of H'.Na'.oleclron5 formation of C n ( H l " - , C N I O I '
MS PRESSURE G R A D l E N l
t
W
TIME - S E L E C T I V I T Y IN LMMS
Chemical lonisa1ion Region
intermolecular interactions
d imer ic c lus ter forrna t ion
combinat ion of organic and
inorgonic moiet ies
conl r ibut ion increased by the
v o l a t i l i t y o f compounds
High Vacuum Candi l ions
no addit ional interactions
enfavoured by the use of a
threshold laser energy
TOF ~ M S . c o n l i n u o u s e x t r o c l i o n
p r o m p t ion formofion ' (M+H) ' , f '
d e l a y e d colionisotion
m / z
M a g n e t i c M S . p h o t o p l a t e . some t r o n s m i s s i o n l ime
IS ns l o s e r p u l s e
m / =
FIGURE 4. (a) Simplified scheme outlining molecular and fragment ion formation according to the empirical model for one-step DI in LMMS. (b) Effect of the pressure on the formation of ion in LMMS. (c) Time selectivity of the TOF LMMS instrumentation in comparison with that of a magnetic instrument with photoplate detection, permitting inclusion of delayed ion formation in the measured signal. Adapted from Ref. (114) with permission of John Wiley & Sons and from Ref. (82) with permission of Springer-Verlag.
W E R MICROPROBE MASS SPECTROMETRY I
residence time of the ions and neutrals in the selvedge becomes longer in FT LMMS, possibly increasing the role of “local chemical ionization.” This difference may explain the relatively increased importance of adduct ions over the radical molecular cations, as well as the reduced number of fragments (55, 60, 65).
Purely instrumental differences between TOF and FT LMMS concern the acceptance of the mass spec- trometer for ions with relatively high kinetic energy and elevated emission angles on the one hand, and the time-domain of ion formation, which is detectable, on the other hand. It is well-documented that the kinetic energy of laser-generated elemental and cluster ions under moderate irradiance conditions typically ranges over 30 eV (115-119). Significant fractions of the ions are emitted at angles of up to 45” (120). Ion trajectory calculations showed that the current TOF LMMS instrument transmits ions with departing angle of up to lo” and energies of over 1OOeV (121-122). Corre- sponding figures for the ion transfer system in the FT LMMS with an external ion source are 3” for ions of up to 2 eV (63). Additionally, the trapping potentials in FTMS cells, typically 1-2 V and certainly under 10 V, ultimately limit the acceptable kinetic energy of the ions. Hence, the disappearance of the elemental ion signal in FT LMMS upon an increase of the power density is likely to be related to the limitations in acceptance characteristics (63). In general, the ions generated in the high-density selvedge, the so-called chemical ionization zone, are likely to be thermalized, and, hence, fall within the acceptance limit of the FTMS system as opposed to the ions due to direct laser ablation processes.
Furthermore, there is a significant difference be- tween TOF and FT LMMS with respect to the time- domain for the formation of detectable ions and with respect to the duration of the mass analysis. As illustrated before in Fig. 3, TOF LMMS is limited to the promptly formed ion cluster generated within about 15ns, whereas post-laser DI leads only to an increased background. In contrast, unless special gat- ing is applied, F T LMMS measures the accumulated ion production within at least 100 ps up to seconds. Hence, under normal conditions, the mass spectra comprise the sum of prompt and post-laser DI. Time- slicing experiments showed that organic and inorganic mass spectra as a function of time both elapsed after the laser pulse (63, 65). Specifically for organic salts, it was shown that fragments are generated in the begin- ning and only the precursor ion production continues over longer periods (65). Similarly, the relative contri- bution of the thermal decomposition products change over time. Finally, note that the time difference be- tween ion formation and detection in TOF LMMS is
ionization as a second-order gas-phase process (91). Typically, the formation of precursor ions containing two or more molecules is not observed in TOF LMMS as opposed to, e.g., SIMS, plasma desorption MS, field desorption, and fast atom bombardment MS (112). Exceptions are limited to a few lower analogs (101, 113). This result can be related to the dependence of the selvedge density on the “volatility” of the analyte. Also, the formation of [M H + 01 can be avoided by limiting the power density and, hence, diminishing the density of the micro-cloud above the sample (114). The detection of these radical molecular anions from poly- aromatic hydrocarbons is favored in the reflection geometry due to the increased density of the micro- cloud (105).
VI. DETECTED IONS VS. GENERATED IONS IN TOF AND FI’ LMMS
Even for pure reference substances, and in spite of all precautions taken to perform the laser irradiation under the same conditions, TOF LMMS and FT LMMS produce slightly different mass spectra. In general, FT LMMS tends to yield fewer fragments from organic compounds, whereas the spectra reflect an increased contribution from ion-molecule reactions, delayed, and thermal processes. Also, for inorganic substances, FT LMMS data show intense and specific but less numerous cluster ion signals. As pointed out before, it cannot be ensured that the laser irradiation conditions in different instruments are exactly the same. Nevertheless, it is likely that some of the observed discrepancies between TOF and FT LMMS reflect a fundamental difference between the two instruments with respect to the detectable fraction of the total ion production and possibly also to the operating conditions in the sample region, affecting the ion formation mechanisms themselves.
As to the latter aspects, a distinction should be made between FT LMMS with an external ion source on the one hand, and the instruments with the single- or double-cell arrangement, where the sample is ir- radiated within the FTMS cell, on the other hand. In the latter case, the orbiting ions have a significant probability of undergoing ion-molecule reactions be- fore the desorbed neutrals are pumped off. This effect can explain the results of polymers, showing high m/z ions (59), and triazines at the surface of membranes (56). In the external source FT LMMS, the pressure conditions are comparable to the ones in commercial TOF LMMS, but the extraction field is significantly lower; i.e., up to 10vmmP1 in FT LMMS vs. 200- 600 V mm-’ in TOF microprobes (55). As a result, the
199
VAN VAECK ET AL.
less than 500 ps, depending on the m/z and accelerat- ing voltage, whereas high resolution FTMS measure- ments typically take from 0.5 to several seconds. Obviously, ions have to be stable during the corre- sponding periods, and this requirement puts different limits on the internal energy of the detectable ions from the initial ion cluster.
It is clear that much more research is required to fully eludicate all of these aspects. It is also likely that the TOF LMMS and FT LMMS results will always show more or less different features and, hence, it can be foreseen that the application areas may differ as well. It is not yet evident, for instance, to what extent elemental ion detection under relatively high power density conditions can be dealt with by FT LMMS. So far, it seems essential to explicitly make a distinction between FT and TOF LMMS results.
VII. SIGNAL REGISTRATION
Each laser pulse produces a sufficient number of ions for the different m/z. In TOF LMMS, an electron multiplier with a fast transient recorder (TR) can be used to record a complete mass spectrum. Depending on the accelerating voltage, the length of the drift tube, and the m/z of the ions, the peak width is typically less than 100ns, and the sampling frequency of the TR must be at least 100MHz. Memory capacity must be sufficient to cover several hundreds of ps, e.g., the flight time differences between ions of m/z 20-1,000. Even qualitative experiments require a large dynamic range, because the low m/z ions (e.g., the prolific Na and K elemental ions) are usually much more abundant than the high-mass ions. The low mass resolution makes reliable isotope ratios necessary to support the assignment of the peaks. Quantitative analysis requires correct measurement of peak intensities. Digitization is facilitated, because one can usually sample faster over a limited m/z range. However, fast recovery times of the electron multiplier and preamplifier circuitry after high currents are sometimes problematic unless a pulsed grid is mounted in front of the electron multi- plier.
Abundant literature data were obtained using the older TR initially supplied with the commercial instru- ments. The availability of a 2,000-channel memory required a reduction of the sampling rate to about 20 MHz for panoramic registration over about m/z 500, but, under these conditions, there are only four significant levels on the intensity scale. It is clear that mass resolution and reliability of isotope patterns become problematic under such conditions. Properly used in a small m/z range, a 4-bit effective resolution
could be obtained (123), corresponding to a relative standard deviation of 5% on the ratios of the major lead isotopes (124).
A more disturbing effect is that the isotope ratio of Li/ Li continuously decreases from about 12 to only 2
when the signal increases by a factor of 50. This detector nonlinearity effect was assigned to space- charge limitations of the electron multiplier, and a correction formula was proposed (123). The practical applicability of the nonlinearity correction on isotope measurements was demonstrated (125). Additionally, systematic overestimation of the major isotope occurs as a result of the analog-to-digital (A/D) conversion in the TR (126). Finally, additional post-acceleration is required to improve the sensitivity for the high-mass ions from, e.g., 1 kDa upwards (67, 127).
The progress in TR technology resolved many of these problems. An effective bit resolution approach- ing 8 for a 10-MHz input signal with a 32-k memory size is now common (123, 128). Connected to a dedicated user-friendly computer, the capabilities of TOF LMMS for panoramic registration can be ex- ploited routinely (129). Furthermore, isotope ratios between 2-30 can be measured with an accuracy of 1.5 and 15%, respectively, and the precision varies from 3-10% (80). The main condition is that ion currents should be limited to avoid excessive detector overload. The use of two transient recorders in parallel, each with a different input range, is advocated to increase the dynamic range (51, 123, 128, 130). This solution is adequate for qualitative experiments, but the problems due to nonlinear detector response remain.
Also, in FT LMMS signal registration imposes some limitations. To record broadband or full mass spectra, compromises have to be made concerning the digital resolution because of the memory size and the digitization rate. High resolution measurements are limited to the m/z range covered. The capabilities of FT LMMS for the determination of isotope ratios are still practically unexplored. Relative standard devia- tions of about 20% on the averaged broadband data from different laser shots have been reported (131). Comparative data with gas phase ionization in the cell show that the main problem resides in the shot-to-shot variability of the ion yield, hindering the careful optimization of the instrument. It should be noted, however, that the routinely available high-mass res- olution and ppm accuracy of the m/z determination in FTMS make the use of isotope patterns for identifica- tion purposes superfluous (61, 63). The dynamic range in FT LMMS is limited to about 100 by space-charge effects in the cell. Ejection of the major components can be applied to properly detect the minor con- stituents.
7 . 6
200
VIM. QUANTIZATION WITH LMMS 1.0
0 5
0 -
LQG 56Fc’ 1 6 4 ~ ~ . - 0 5
-1.0
-1.5
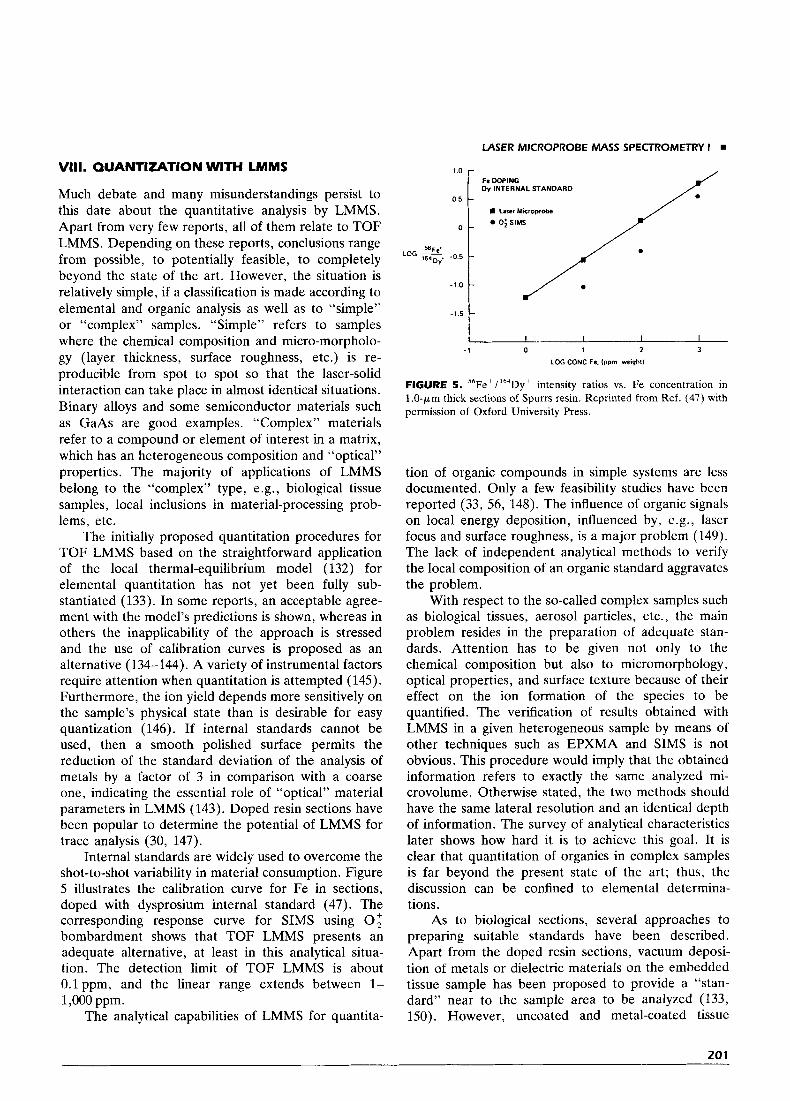
Much debate and many misunderstandings persist to this date about the quantitative analysis by LMMS. Apart from very few reports, all of them relate to TOF LMMS, Depending on these reports, conclusions range from possible, to potentially feasible, to completely beyond the state of the art. However, the situation is relatively simple, if a classification is made according to elemental and organic analysis as well as to “simple” or “complex” samples. “Simple” refers to samples where the chemical composition and micro-morpholo- gy (layer thickness, surface roughness, etc.) is re- producible from spot to spot so that the laser-solid interaction can take place in almost identical situations. Binary alloys and some semiconductor materials such as GaAs are good examples. “Complex” materials refer to a compound or element of interest in a matrix, which has an heterogeneous composition and “optical” properties. The majority of applications of LMMS belong to the “complex” type, e.g., biological tissue samples, local inclusions in material-processing prob- lems, etc.
The initially proposed quantitation procedures for TOF LMMS based on the straightforward application of the local thermal-equilibrium model (132) for elemental quantitation has not yet been fully sub- stantiated (133). In some reports, an acceptable agree- ment with the model’s predictions is shown, whereas in others the inapplicability of the approach is stressed and the use of calibration curves is proposed as an alternative (134-144). A variety of instrumental factors require attention when quantitation is attempted (145). Furthermore, the ion yield depends more sensitively on the sample’s physical state than is desirable for easy quantization (146). If internal standards cannot be used, then a smooth polished surface permits the reduction of the standard deviation of the analysis of metals by a factor of 3 in comparison with a coarse one, indicating the essential role of “optical” material parameters in LMMS (143). Doped resin sections have been popular to determine the potential of LMMS for trace analysis (30, 147).
Internal standards are widely used to overcome the shot-to-shot variability in material consumption. Figure 5 illustrates the calibration curve for Fe in sections, doped with dysprosium internal standard (47). The corresponding response curve for SIMS using 0; bombardment shows that TOF LMMS presents an adequate alternative, at least in this analytical situa- tion. The detection limit of TOF LMMS is about 0.1 ppm, and the linear range extends between 1- 1,000 ppm.
The analytical capabilities of LMMS for quantita-
-
-
-
-
-
LASER MICROPROBE MASS SPECTROMETRY I
Fe DOPING Dy INTERNAL STANDARD
8 Lner Miiroprobe
0; SIMS
/
I I I I I -1 0 1 2 3
LOG CONC Fe. lppm wevghtl
FIGURE 5 . 56Fe+/164Dy+ intensity ratios vs. Fe concentration in l.O-pm thick sections of Spurrs resin. Reprinted from Ref. (47) with permission of Oxford University Press.
tion of organic compounds in simple systems are less documented. Only a few feasibility studies have been reported (33, 56, 148). The influence of organic signals on local energy deposition, influenced by, e.g., laser focus and surface roughness, is a major problem (149). The lack of independent analytical methods to verify the local composition of an organic standard aggravates the problem.
With respect to the so-called complex samples such as biological tissues, aerosol particles, etc., the main problem resides in the preparation of adequate stan- dards. Attention has to be given not only to the chemical composition but also to micromorphology, optical properties, and surface texture because of their effect on the ion formation of the species to be quantified. The verification of results obtained with LMMS in a given heterogeneous sample by means of other techniques such as EPXMA and SIMS is not obvious. This procedure would imply that the obtained information refers to exactly the same analyzed mi- crovolume. Otherwise stated, the two methods should have the same lateral resolution and an identical depth of information. The survey of analytical characteristics later shows how hard it is to achieve this goal. It is clear that quantitation of organics in complex samples is far beyond the present state of the art; thus, the discussion can be confined to elemental determina- tions.
As to biological sections, several approaches to preparing suitable standards have been described. Apart from the doped resin sections, vacuum deposi- tion of metals or dielectric materials on the embedded tissue sample has been proposed to provide a “stan- dard” near to the sample area to be analyzed (133, 150). However, uncoated and metal-coated tissue
20 1
m VAN VAECK ET AL.
evaporate differently, as reflected by the crater size (151). A dielectric layer (e.g., MgF,) improves the situation. Alternatively, embedding ion exchange beads together with the analyte permits the assessment of the variability from, e.g., section thickness (152). Still other possibilities are reported (32). The problem of a real internal standard to assess the material consumption upon each laser shot has been dealt with by the use of a signal from the embedding medium (153), with the incorporation of, e.g., elements such as indium or lithium (154). This approach requires that the actually analyzed microvolume always contain a constant fraction of the matrix. Hence, ion implanta- tion can be a better alternative (47). A study of cryosections of doped albumin has led to the sug- gestion that power-sensitive element ratios such as, e.g., Sr/Rb or La/LaO could be used to improve the comparability of relative sensitivity factors (155).
The determination of elements in particulate mat- ter is well documented because of the wide interest in the application of LMMS to environmental problems. One of the main problems is the variation of the relative sensitivity factors with the type of sample; i.e., up to a factor of 10 between glass spheres and fly-ash (136). Nevertheless, a semi-quantitative assessment of the major elements in size-fractionated coal fly-ash particles is feasible, with standard deviations of less than 50% and an acceptable comparability with scan- ning electron microscopy /energy-dispersive X-ray anal- ysis data (156). The effect of sample morphology on the interelement quantitation has been studied using thin films, spheres, and irregularly shaped particles or shards with the same chemical composition (157). Geometry and particle size are again found to largely influence the relative sensitivity factors. This result makes questionable the simple crushing of homoge- neous bulk materials to obtain suitable reference materials for the transmission geometry analysis. Alter- natively, nebulization or atomization of liquids and the use of particle-size-selective aerosol sampling devices permit the loading of substrates with particles of a given size and with a known composition (74, 158- 160). However, real-life samples do not always have the simple and uniform characteristics of the model systems serving as standards. The strong dependence of the instrumental response to the analyte concen- tration on a variety of still poorly characterized param- eters makes the quantitation capabilities of TOF LMMS in complex samples rather unclear. It is still unknown whether the situation might improve for FT LMMS. It can be foreseen that the detection of prompt and post-laser DI processes can be helpful to reduce the shot-to-shot variations, but the inability to cope
with the high-energy ions undoubtedly represents a disadvantage for elemental analysis.
IX. ANALYTICAL CHARACTERISTICS OF LMMS AND OTHER CURRENT TECHNIQUES
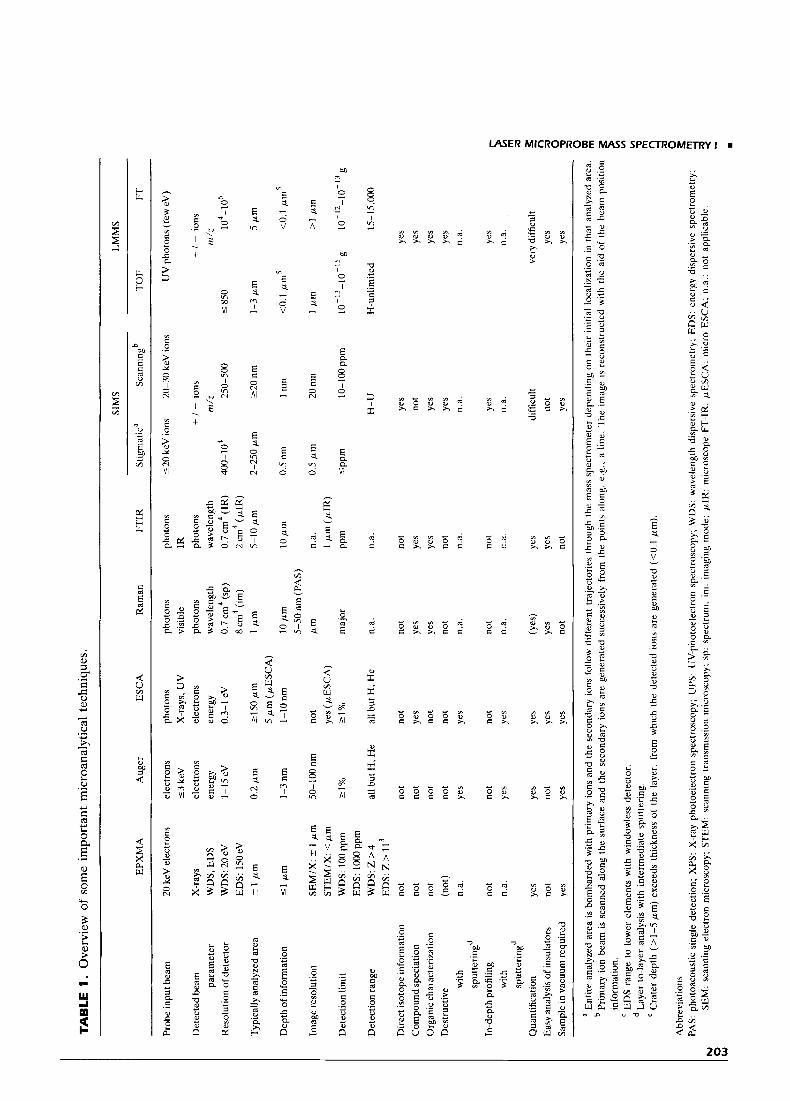
Mature and widely used techniques for local and surface analysis include electron probe X-ray micro- analysis (EPXMA), dynamic and static secondary ion mass spectrometry (SIMS), Auger electron spectros- copy, electron spectroscopy for chemical analysis (ESCA), micro-Raman, and microscope-FTIR spec- troscopy. Except for the latter two methods, charged beams are used to interact with the sample, and the problem of dielectrical materials charging up during analysis complicates analysis. With most of these tech- niques, information on only the elemental or inorganic sample composition is obtained. FTIR and Raman spectroscopy methods permit the determination of functionalities in an organic sample but not the molec- ular weight, nor are they capable of full periodic table coverage. Table 1 surveys the analytical features of LMMS in comparison with the other currently used methods for local and surface analysis. The indicated values for lateral resolution and sensitivity are indica- tive of only routine performance; exact figures may be more favorable under well-optimized conditions in specific cases.
LMMS does not provide ultimate lateral resolu- tion. It has been shown that splashing of molten material occurs out of the craters, so that an inter- crater distance exceeding the spot size is needed to avoid contamination from one spot to the other (161). Also, the quality of the observed image with an optical microscope is relatively poor in the commercial instru- ments. Commercial LMMS instruments are designed for spot analysis; hence, analytical mapping is usually not available, in contrast to EPXMA and dynamic SIMS in the ion microscope mode. The drastic effect of the laser focus on the recorded signal (cf. Section IV) reduces the potential benefits of automated analysis for routine applications. The quantitation capabilities are limited. The comparative use of TOF LMMS and micro-ESCA and AES for the study of oxide layers on stainless steel revealed that LMMS was especially useful because of its higher sensitivity and its capability to detect light elements (162). TOF LMMS was shown to exhibit better detection limits than dynamic SIMS for the analysis of elements in biological materials (47, 141).
It is of interest to discuss the difference between
202
TA
BL
E 1
. Ove
rvie
w o
f so
me
impo
rtan
t m
icro
anal
ytic
al t
echn
ique
s.
SIM
S LM
MS
EPX
MA
A
uger
E
SCA
R
aman
FT
IR
Stig
mat
ica
Scan
ning
' T
OF
FT
Prob
e in
put b
eam
Det
ecte
d be
am
para
met
er
Res
olut
ion
of d
etec
tor
Typi
cally
anal
yzed
are
a
Dep
th of
inf
orm
atio
n
Imag
e re
solu
tion
Det
ectio
n lim
it
Det
ectio
n ra
nge
Dir
ect i
soto
pe in
form
atio
n C
ompo
und s
peci
atio
n O
rgan
ic ch
arac
teri
zatio
n D
estr
uctiv
e with
sp
utte
ring
d
with
sp
utte
ring
d
In-d
epth
pro
filin
g
Qua
ntifi
catio
n Ea
sy a
naly
sis o
f in
sula
tors
Sa
mpl
e in
vacu
um r
equi
red
20 k
eV e
lect
rons
X-r
ays
WD
S, E
DS
WD
S: 2
0 eV
ED
S: 150 eV
2
1 p
m
SEM
IX: 2
1 p
m
STE
MIX
: < p
m
WD
S: 1
00 p
pm
ED
S: 1
000
ppm
W
DS
:Z>
4 ED
S: Z
> 11
3 not
not
not
(not
) n.
a.
not
n.a
elec
tron
s 5
3 ke
V
elec
tron
s en
ergy
1-
15 e
V
0.2
pm
1-3
nm
50-1
00 n
m
21
%
all b
ut H, H
e
not
not
no
t
not
Yes
not
Yes
Yes
not
Yes
phot
ons
X-r
ays,
UV
el
ectr
ons
ener
gy
0.3-
1 eV
2150
pm
5
pm
(pE
SC
A)
1-10
nm
not
yes (
pES
CA
) 2
1%
phot
ons
visi
ble
phot
ons
wav
elen
gth
0.7
cm4 (
sp)
8 cm
4 (i
m)
1 p
m
10 p
m
5-50
nm
(PA
S)
w
maj
or
all b
ut H
. He
not
Yes
no
t
not
Yes
no
t
Yes
n.a.
not
Yes
Yes
not
n.a
not
n.a
phot
ons
IR
phot
ons
wav
elen
gth
0.7
cm4 (
IR)
2 cm
4 (p
~~
)
5-10
pm
10 p
m
n.a.
1 P
m (
PW
PP
m
n.a.
not
Yes
Yes
not
n.a.
not
n.a.
Yes
Yes
not
52
0 ke
V io
ns
20-3
0 ke
V io
ns
+ / - i
ons
400-
104
2-25
0 p
m
0.5
nm
0.5
pm
'PPm
m/z
250-500
22
0 nm
1 nm
20 n
m
10-1
00 p
pm
H-U
Yes
n.a
UV
pho
tons
(few
eV
)
+ / - i
ons
rn/z
diff
icul
t no
t
Yes
very
diff
icul
t I
a En
tire
anal
yzed
are
a is
bom
bard
ed w
ith p
rim
ary
ions
and
the
seco
ndar
y io
ns fo
llow
dif
fere
nt t
raje
ctor
ies
thro
ugh
the
mas
s sp
ectr
omet
er d
epen
ding
on
thei
r in
itial
loca
lizat
ion
in t
hat
anal
yzed
are
a.
Prim
ary
ion
beam
is s
cann
ed a
long
the
sur
face
and
the
sec
onda
ry i
ons
are
gene
rate
d su
cces
sive
ly f
rom
the
poi
nts
alon
g. e
.g..
a lin
e. T
he i
mag
e is
reco
nstr
ucte
d w
ith t
he a
id o
f th
e be
am p
ositi
on
ED
S ra
nge
to l
ower
ele
men
ts w
ith w
indo
wle
ss d
etec
tor.
La
yer-
to-l
ayer
ana
lysi
s w
ith i
nter
med
iate
spu
tteri
ng.
s in
form
atio
n.
m
rn 2 0
Abb
revi
atio
ns
h m
m
'D
A
Cra
ter
dept
h (>
l-5
pm
) ex
ceed
s th
ickn
ess
of t
he l
ayer
. fr
om w
hich
the
det
ecte
d io
ns a
re g
ener
ated
(<
0.1
pm
).
PAS:
pho
toac
oust
ic s
ingl
e de
tect
ion;
XPS
: X
-ray
pho
toel
ectr
on s
pect
rosc
opy;
UPS
: U
V-p
hoto
elec
tron
spe
ctro
scop
y; W
DS:
wav
elen
gth
disp
ersi
ve s
pect
rom
etry
; ED
S: e
nerg
y di
sper
sive
spe
ctro
met
ry;
rn SE
M:
scan
ning
ele
ctro
n m
icro
scop
y; S
TE
M:
scan
ning
tra
nsm
issi
on m
icro
scop
y; s
p: s
pect
rum
. im
: im
agin
g m
ode;
pIR
: m
icro
scop
e FI
-1R
: pE
SCA
: m
icro
ESC
A:
n.a.
: no
t ap
plic
able
. 3 - rn
VAN VAECK ET AL.
crater depth and information depth in LMMS. The latter term refers to the thickness of the layer from which the detected ions actually originate. There is substantial evidence that the surface components are ionized preferentially and that the underlying layers are only vaporized but do not contribute significantly to the detected signals. It was shown that the detected ions from organic compounds in transmission TOF LMMS issued from the upper 10-50nm when a 1-,um section was perforated (163). The situation is less clear for elemental and inorganic cluster ions in TOF LMMS. Indeed, the analysis of physically separated carbon foils in the transmission geometry showed that recombination of isotopes from the upper and lower layer occurs (164), and analysis of a trilayer system in transmission revealed a decreased yield of the elemen- tal ions with increasing depth (88). Comparative ex- periments of co-precipitated and adsorbed lead-on- calcite particles also pointed to the selectivity of TOF LMMS for surface components under low power den- sity conditions (165). It has been shown that, under favorable conditions, information is recorded from only a sub-nanometer upper layer (166).
As a result, the determination of the crater depth is especially relevant for the possible depth-profiling capabilities of LMMS. Crater depths in the reflection geometry were studied, but exact figures depend on the applied power density and the material involved (161, 167). It is claimed that consecutive laser interactions on the same spot in the reflection geometry permit depth-profiling with a resolution of 0.1-0.2 p m per shot and an almost linear increase of the erosion depth up to 2 ,urn (24, 161-162). However, most experiments use this approach for “laser drilling,” when the volume of interest for local analysis is caught under a covering layer. Applications are described later and involve, for instance, the analysis of a contamination under a paint coating or the top layers of an integrated circuit (66, 70). The use of erosion in LMMS certainly does not reach the level of applicability as in, e.g., dynamic SIMS.
The strength of the LMMS technology lies un- doubtedly in the easy analysis of insulators, the virtual absence of specific requirements for the analyte, and the specificity of the obtained information for quali- tative characterization of inorganic and organic materi- als. It will be shown later that LMMS provides excel- lent speciation capabilities. The signals refer to the main structural entities in the analyte, whereas, in other techniques, identification has to be performed on the basis of relative element abundances (61). LMMS yields detailed structural information on organic com- pounds, including molecular weight and functionalities.
As a result, LMMS excels in the relatively fast identifi- cation of organic and inorganic compounds at the surface of the most various samples with a lateral resolution in the 1-5 ,urn range.
ACKNOWLEDGMENTS
Wim Van Roy and Luc Van Vaeck are indebted to the National Science Foundation of Belgium (NFWO) as research assistant and research director. Herbert Struyf acknowledges the “Impulse Programme in Marine Sciences,” supported by the Belgian State-Prime Minister’s Services-Science Policy Office (contract MS/06/050). This work is sponsored by DPWB in the Interuniversitary Attraction Pole programme.
REFERENCES
1.
2.
3.
4.
5.
6.
7. 8.
9.
10.
11.
12.
13.
Lubman, D. M., Ed. Lasers and Muss Spectrometry, Oxford University Press: New York, Oxford, 1990. Van Vaeck, L.; Van Roy, W.; Gijbels, R.; Adams, F. In Laser Ionization Mass Analysis, Vertes, A.; Gijbels, R.; Adams, F., Eds.; Chemical Analysis Series, Vol. 124; John Wiley & Sons, Inc.: New York, 1993, pp. 7-126. Kovalev, I. D.; Maksimov, G. A.; Suchkov, A. 1.; Larin N. V. Int. J . Mass Spectrom. Ion Proc. 1978, 27,
Conzemius, R. J . ; Capellen, J . M. Znt. J . Mass Spec- trom. Ion Proc. 1980, 34, 197-271. Conzemius, R. J.; Simons, D. S.; Shankai, 2.; Byrd, G. D. In Microbeam Analysis-1983, Gooley, R., Ed.; San Francisco Press, Inc.: San Francisco, 1983. Hillenkamp, F. In Proceedings of the Second Workshop on Ion Formation from Organic Solids, Miinster, Ger- many, Benninghoven, A., Ed.; Springer-Verlag: Ber- lin, 1983. Cotter, R. J. Anal. Chim. Acta 1987, 195, 45-59. Honig, R. E.; Woolston, J. R. Appl. Phys. Lett. 1963,
Berkowitz, J . ; Chupka, W. A. J . Chem. Phys. 1964, 40,
Vastola, F. J.; Pirone, A. J. In Advanced Mass Spec- trometry, Voi. 4, The Institute of Petroleum, London 1968. Posthumus, M. A.; Kistemaker, P. G.; Meuzelaar, H. L. C.; Ten Noever de Brauw, M. C. Anal. Chem. 1978,
Hillenkamp, F.; Kaufmann, R., Eds. In Fresenius’ 2. Anal. Chem. 1981, 308, Springer-Verlag: Berlin/J. F. Bergmann: Munchen, 1981, pp. 193-320. Seydel, U.; Lindner, B., Eds. Proceedings of the
101 -1 37.
2, 138-139.
2735-2736.
50, 985-991.
204
14.
15.
16.
17.
18. 19.
20.
21.
22.
23.
24.
25.
26.
27,
LAMMA-Workshop, 1-2 September, 1983, Borstel, Germany, 1983. Adams, F.; Van Vaeck, L., Eds. Proceedings of the Third International Laser Microprobe Mass Spec- trometry Workshop, 26-27 August, 1986, Antwerp, Belgium, University of Antwerp 1986. Russell, P. E., Ed., Microbeam Analysis-1989; San Francisco Press, Inc: San Francisco, 1989. Karas, M.; Hillenkamp, F. AnaZ. Chem. 1988, 60, 2299-2301. Karas, M.; Bahr, U.; GieRmann, U. Mass Spectrom. Rev. 1992, 10, 335-357. Simons, D. S. Appl . Surface Sci. 1988, 31, 103-117. Housden, J.; Hutt, K. W.; Leake, J. A.; Wallach, E. R. In Microbeam Analysis-1988, Newbury, D. E., Ed.; San Francisco Press, Inc.: San Francisco, 1988. Vogt, H.; Heinen, H. J.; Meier, S . ; Wechsung, R. Fres. Z . Anal. Chem. 1981, 308, 195-200. Heinen, H. J.; Meier, S.; Vogt, H.; Wechsung, R. Znt. J . Mass Spectrom. Ion Proc. 1983, 47, 19-22. Dingle, T.; Griffiths, B. W.; Ruckman, J. C. Vacuum
Ruckman, J . C.; Davey, A. R.; Clarke, N. S. Vacuum
Southon, M. J.; Witt, M. C.; Harris, A.; Wallach, E. R.; Myatt, J. Vacuum 1984, 34, 903-909. Odom, R. W.; Niemeyer, I . C. In Proceedings of the Third International Laser Microprobe Mass Spec- trometry Workshop, 26-27 August, 1986, Antwerp, Belgium, Adams, F.; Van Vaeck, L., Eds.; 1986. Dingle, T.; Griffiths, B. W.; Ruckman, J. C.; Evans, C. A., Jr. In Microbeam Analysis-1982, Heinrich, K. F. J., Ed.; San Francisco Press, Inc.: San Francisco, 1982. Hillenkamp, F.; Feigl, P.; Schueler, B. In Microbeam Analysis-1982, Heinrich, K. F. J. Ed.; San Francisco Press, Inc.: San Francisco, 1982.
1981, 31, 571-577.
1984, 34, 911-924.
28. Holm, R.; Holtkamp, D. In Microbeam Analysis- 1989, Russell, P. E., Ed.; San Francisco Press, Inc.: San Francisco, 1989.
29. Wechsung, R.; Hillenkamp, F.; Kaufmann, R.; Nitsche, R.; Vogt, H. Scann. Electron Microsc. 1978, 1, 611-620.
30. Guest, W. H. Int. J . Mass Spectrom. Ion Proc. 1984, 60,
31. Kaufmann, R.; Hillenkamp, F.; Wechsung, R.; Heinen, H. J.; Schiirmann, M. Scann. Electron Microsc. 1979, 2, 279-290.
32. Verbueken, A. H.; Bruynseels, F. J.; Van Grieken, R.; Adams, F. In Inorganic Mass Spectrometry, Adams, F.; Gijbels, R.; Van Grieken, R., Eds.; John Wiley & Sons: New York, 1988.
33. Feigl, P. K. D.; Krueger, F. R.; Schueler, B. Mikroch- im. Acta 1984, 2, 85-96.
34. Van Vaeck, L.;. Claereboudt, J.; Van Espen, P.; Adams, F.; Gijbels, R.; Cautreels, W. In Advances in Muss
189-1 99.
LASER MICROPROBE MASS SPECTROMETRY I
Spectrometry-l98S, Todd, J. F. J., Ed.; John Wiley & Sons: Chichester, 1985.
35. Van Vaeck, L.; Claereboudt, J.; Veldeman, E.; Ver- meulen, M.; Gijbels, R. Bull. SOC. Chim. Belg. 1986,
36. Kaufmann, R.; Spengler, B. In Proceedings of the 50th Annual Meeting of the Electron Microscopy Society of America, Bailey, G. W.; Bentley, J.; Small, J. A., Eds.; San Francisco Press, Inc.: San Francisco, 1992.
37. Kaufmann, R.; Spengler B. In Proceedings of the 50th Annual Meeting of the Electron Microscopy Society of America, Bailey, G. W.; Bentley, J.; Small, J . A., Eds.; San Francisco Press, Inc.: San Francisco, 1992.
38. Bahr, U.; Hillenkamp, F. In Advances in Mass Spectrometry-1985 Part B , Todd, J. F. J., Ed.; John Wiley & Sons: Chichester, 1985.
39. Krier, G.; Verdun, F.; Muller, J. F. Fresenius’ Z . Anal. Chem. 1985, 322, 379-382.
40. Verdun, F. R.; Krier, G.; Muller, J. F. Anal. Chem.
41. Muller, J. F.; Krier, G.; Verdun, F.; Muller, D. In Advances in Mass Spectrometry-1985, Todd, J. F. J., Ed.; John Wiley & Sons: Chichester, 1985.
42. Muller, J. F.; Krier, G.; Verdun, F.; Lamboule, M.; Muller, D. Znt. J . Mass Spectrom. Zon Proc. 1985, 64, 127-138.
43. Karas, M.; Bachmann, D.; Hillenkamp, F. Anal. Chem. 1985, 57, 2935-2939.
44. Hillenkamp, F.; Karas, M.; Holtkamp, D.; Klusener, P. Int. J . Mass Spectrom. Ion Phys. 1986, 69, 265-276.
45. Spengler, B . ; Karas, M.; Bahr, U.; Hillenkamp, F. J . Phys. Chem. 1987, 91, 6501-6506.
46. Schueler, B.; Odom, R. W. J . Appl . Phys. 1987, 61,
47. Odom, R. W.; Schueler, B. In Lasers and Mass Spec- trometry, Lubman, D. M., Ed.; Oxford University Press: New York, 1990.
48. Wilk, Z . B.; Hercules, D. M. Anal. Chem. 1987, 59, 1819-1825.
49. Hercules, D. M.; Novak, F. P.; Viswanadham, S. K.; Wilk, Z . B. Anal. Chim. Acta 1987, 195, 61-71.
50. Morelli, J. J . In Lasers and Mass Spectrometry, Lub- man, D. M., Ed.; Oxford University Press: New York, 1990.
51. Novak, F. P.; Wilk, Z . A.; Hercules, D. M. J . Trace Microprobe Tech. 1985, 3, 149-163.
52. Brenna, J. T.; Creasy, W. R.; McBrain, W.; Soria, C. Rev. Sci. Instrum. 1988, 59, 873-879.
53. Ghaderi, S. In Proceedings of the 36th A S M S Confer- ence on Mass Spectrometry and Allied Topics, June 5-10, 1988, San Francisco, C A ; 1988.
54. Pelletier, M.; Krier, G.; Muller, J. F.; Weil, D.; Johnston M. Rapid Commun. Mass Spectrom. 1988, 2,
55. Van Vaeck, L.; Van Roy, W.; Struyf, H.; Adams, F.;
95, 351-372.
1987, 59, 1383-1387.
4652-4661.
146-150.
205
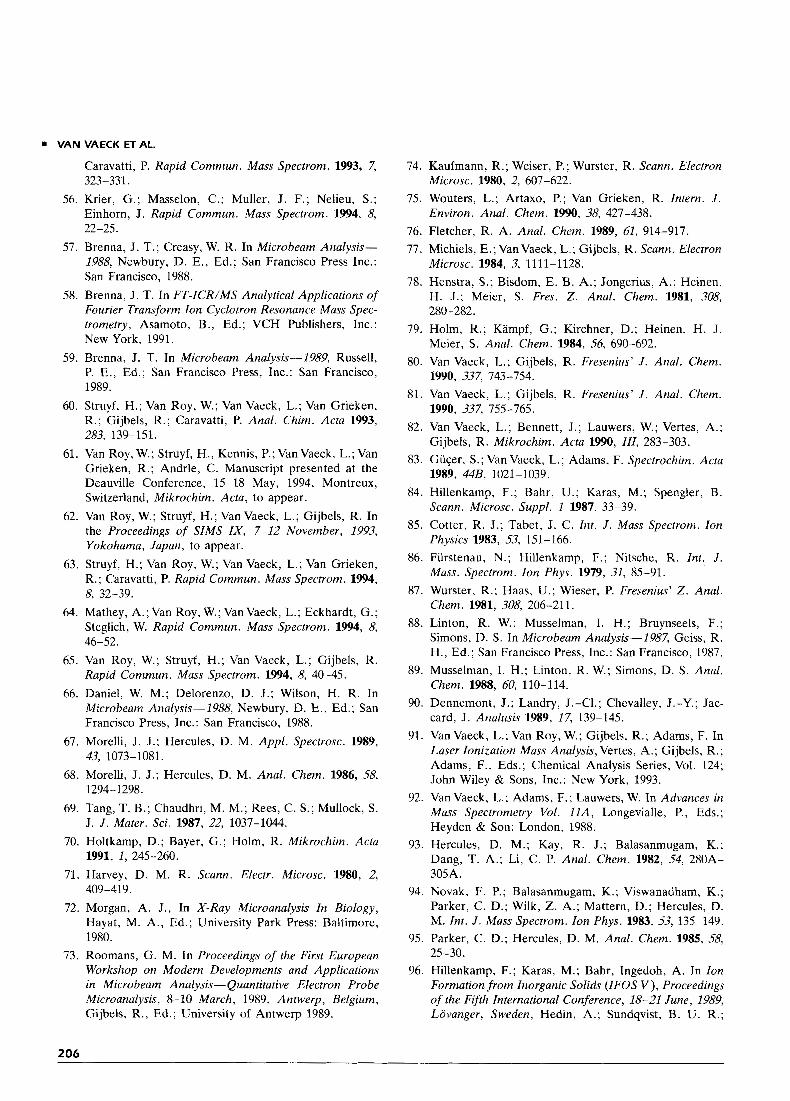
VAN
56.
57.
58.
59.
60.
61.
62.
63.
64.
65.
66.
VAECK ET AL.
Caravatti, P. Rapid Commun. Mass Spectrom. 1993, 7, 323-331. Krier, G.; Masselon, C.; Muller, J . F.; Nelieu, S.; Einhorn, J. Rapid Commun. Mass Spectrom. 1994, 8, 22-2s. Brenna, J. T.; Creasy, W. R. In Microbeam Analysis- 1988, Newbury, D. E., Ed.; San Francisco Press Inc.: San Francisco, 1988. Brenna, J. T. In FT-ICR/MS Analytical Applications of Fourier Transform Ion Cyclotron Resonance Mass Spec- trometry, Asamoto, B., Ed.; VCH Publishers, Inc.: New York, 1991. Brenna, J. T. In Microbeam Analysis- 1989, Russell, P. E., Ed.; San Francisco Press, Inc.: San Francisco, 1989. Struyf, H.; Van Roy, W.; Van Vaeck, L.; Van Grieken, R.; Gijbels, R.; Caravatti, P. Anal. Chim. Acta 1993, 283, 139-151. Van Roy, W.; Struyf, H., Kennis, P.; Van Vaeck, L.; Van Grieken, R.; Andrle, C. Manuscript presented at the Deauville Conference, 15-28 May, 1994, Montreux, Switzerland, Mikrochim. Acta, to appear. Van Roy, W.; Struyf, H.; Van Vaeck, L.; Gijbels, R. In the Proceedings of SIMS I X , 7-12 November, 1993, Yokohama, Japan, to appear. Struyf, H.; Van Roy, W.; Van Vaeck, L.; Van Grieken, R.; Caravatti, P. Rapid Commun. Mass Spectrom. 1994,
Mathey, A.; Van Roy, W.; VanVaeck, L.; Eckhardt, G.; Steglich, W. Rapid Commun. Mass Spectrom. 1994, 8,
8, 32-39.
A / ; C9 -tu-.JL..
Van Roy, W.; Struyf, H.; Van Vaeck, L.; Gijbels, R. Rapid Commun. Mass Spectrom. 1994, 8, 40-45. Daniel, W. M.; Delorenzo, D. J.; Wilson, H. R. In Microbeam Analysis-1988, Newbury. D. E., Ed.; San Francisco Press, Inc.: San Francisco, 1988.
67. Morelli, J. J.; Hercules, D. M. Appl. Spectrosc. 1989, 43, 1073-1081.
68. Morelli, J . J.; Hercules, D. M. Anal. Chem. 1986, 58,
69. Tang, T. B.; Chaudhri, M. M.; Rees, C. S.; Mullock, S.
70. Holtkamp, D.; Bayer, G.; Holm, R. Mikrochim. Acta
71. Harvey, D. M. R. Scann. Electr. Microsc. 1980, 2, 409-419.
72. Morgan, A. J., In X-Ray Microanalysis In Biology, Hayat, M. A., Ed.; University Park Press: Baltimore, 1980.
73. Roomans, G. M. In Proceedings of the First European Workshop on Modern Developments and Applications in Microbeam Analysis-Quantitative Electron Probe Microanalysis, 8-10 March, 1989, Antwerp, Belgium, Gijbels, R., Ed.; University of Antwerp 1989.
1294-1298.
J. J . Muter. Sci. 1987, 22, 1037-1044.
1991, 1, 245-260.
74. Kaufmann, R.; Weiser, P.; Wurster, R. Scann. Electron
75. Wouters, L.; Artaxo, P.; Van Grieken, R. Intern. J .
76. Fletcher, R. A. Anal. Chem. 1989, 61, 914-917. 77. Michiels, E.; VanVaeck, L.; Gijbels, R. Scann. Electron
Microsc. 1984, 3, 1111-1128. 78. Henstra, S.; Bisdom, E. 9. A.; Jongerius, A.; Heinen,
H. J.; Meier, S. Fres. Z. Anal. Chem. 1981, 308,
79. Holm, R.; Kampf, G.; Kirchner, D.; Heinen, H. J.
80. Van Vaeck, L.; Gijbels, R. Fresenius’ J. Anal. Chem.
81. Van Vaeck, L.; Gijbels, R. Fresenius’ J . Anal. Chem.
82. Van Vaeck, L.; Bennett, J.; Lauwers, W.; Vertes, A.; Gijbels, R. Mikrochim. Acta 1990, III, 283-303.
83. GiiCer, S.; Van Vaeck, L.; Adams, F. Spectrochim. Acta 1989, 44B, 1021-1039.
84. Hillenkamp, F.; Bahr, U.; Karas, M.; Spengler, 9. Scann. Microsc. Suppl. 1 1987, 33-39.
85. Cotter, R. J.; Tabet, J. C. Int. J . Mass Spectrom. Ion Physics 1983, 53, 151-166.
86. Furstenau, N.; Hillenkamp, F.; Nitsche, R. Int. J. Mass. Spectrom. Ion Phys. 1979, 31, 85-91.
87. Wurster, R.; Haas, U.; Wieser, P. Fresenius’ Z. Anal. Chem. 1981, 308, 206-21 1.
88. Linton, R. W.; Musselman, I. H.; Bruynseels, F.; Simons, D. S. In Microbeam Analysis-1987, Geiss, R. H., Ed.; San Francisco Press, Inc.: San Francisco, 1987.
89. Musselman, I. H.; Linton, R. W.; Simons, D. S. Anal. Chem. 1988, 60, 110-114.
90. Dennemont, J.; Landry, J.-Cl.; Chevalley, J.-Y.; Jac- card, J. Analusis 1989, 17, 139-145.
91. Van Vaeck, L.; Van Roy, W.; Gijbels, R.; Adams, F. In Laser Ionization Mass Analysis, Vertes, A.; Gijbels, R.; Adams, F., Eds.; Chemical Analysis Series, Vol. 124; John Wiley & Sons, Inc.: New York, 1993.
92. Van Vaeck, L.; Adams, F.; Lauwers, W. In Advances in Mass Spectrometry Vol. 11A, Longevialle, P., Eds.; Heyden & Son: London, 1988.
93. Hercules, D. M.; Kay, R. J.; Balasanmugam, K.; Dang, T. A.; Li, C . P. Anal. Chem. 1982, 54, 280A- 305A.
94. Novak, F. P.; Balasanmugam, K.; Viswanadham, K.; Parker, C. D.; Wilk, Z . A.; Mattern, D.; Hercules, D. M. Int. J . Mass Spectrom. Ion Phys. 1983, 53, 135-149.
95. Parker, C. D.; Hercules, D. M. Anal. Chem. 1985, 58, 25-30.
96. Hillenkamp, F.; Karas, M.; Bahr, Ingedoh, A. In Ion Formation from Inorganic Solids (IFOS V ) , Proceedings of the Fifth International Conference, 18-21 June, 1989, Lovanger, Sweden, Hedin, A.; Sundqvist, B. U. R.;
Microsc. 1980, 2, 607-622.
Environ. Anal. Chem. 1990, 38, 427-438.
280-282.
Meier, S. Anal. Chem. 1984, 56, 690-692.
1990, 337, 743-754.
1990, 337, 75.5-765.
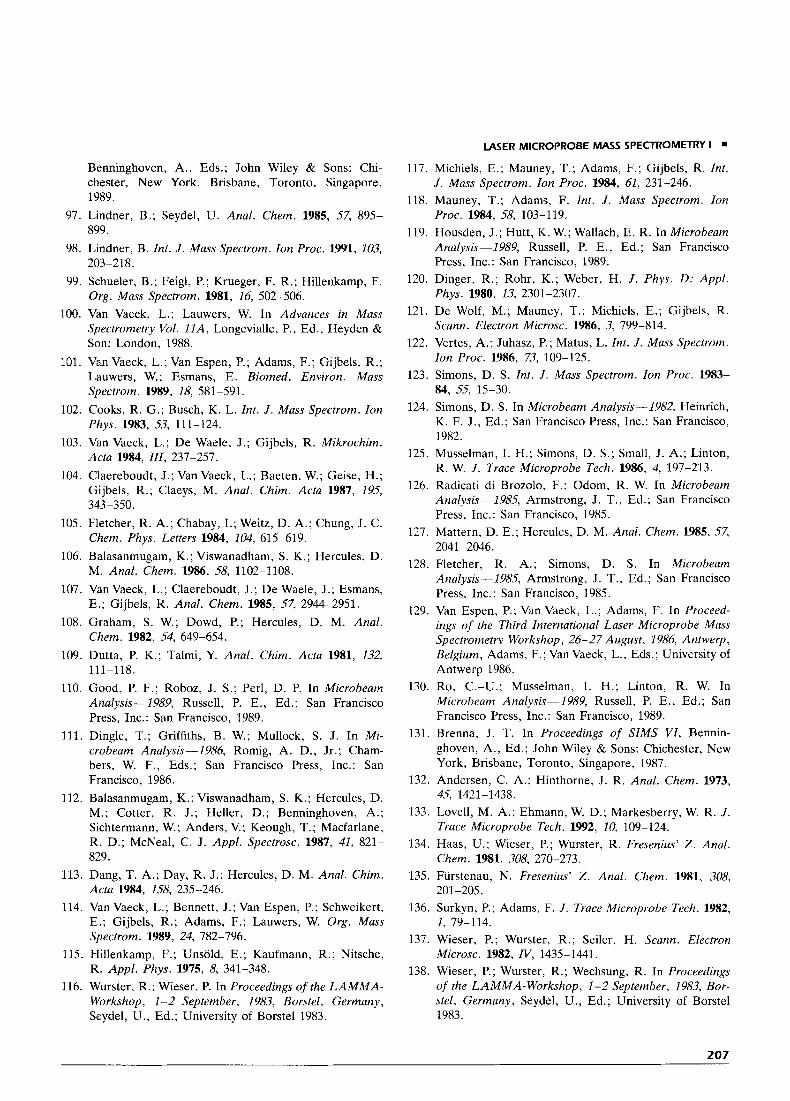
97.
98.
99.
100.
101.
102.
103.
104.
105.
106.
107.
108.
109.
110.
Benninghoven, A., Eds.; John Wiley & Sons: Chi- Chester, New York, Brisbane, Toronto, Singapore, 1989. Lindner, B.; Seydel, U. Anal. Chem. 1985, 57, 895- 899. Lindner, B. lnt. J. Mass Spectrom. Ion Proc. 1991, 103,
Schueler, B.; Feigl, P.; Krueger, F. R.; Hillenkamp, F. Org. Mass Spectrom. 1981, 16, 502-506. Van Vaeck, L.; Lauwers, W. In Advances in Mass Spectrometry Vol. 11A, Longevialle, P., Ed., Heyden & Son: London, 1988. Van Vaeck, L.; Van Espen, P.; Adams, F.; Gijbels, R.; Lauwers, W.; Esmans, E. Biomed. Environ. Mass Spectrom. 1989, 18, 581-591. Cooks, R. G.; Busch, K. L. Int. J. Mass Spectrom. Ion
Van Vaeck, L.; De Waele, J.; Gijbels, R. Mikrochim. Acta 1984, 111, 237-257. Claereboudt, J.; Van Vaeck, L.; Baeten, W.; Geise, H.; Gijbels, R.; Claeys, M. Anal. Chim. Acta 1987, 195, 343 -350. Fletcher, R. A.; Chabay, I.; Weitz, D. A.; Chung, J. C. Chem. Phys. Letters 1984, 104, 615-619. Balasanmugam, K . ; Viswanadham, S. K. ; Hercules, D. M. Anal. Chem. 1986, 58, 1102-1108. Van Vaeck, L.; Claereboudt, J . ; De Waele, J.; Esmans, E.; Gijbels, R. Anal. Chem. 1985, 57, 2944-2951. Graham, S. W.; Dowd, P.; Hercules, D. M. Anal. Chem. 1982, 54, 649-654. Dutta, P. K.; Talmi, Y. Anal. Chim. Acta 1981, 132,
Good, P. F.; Roboz, J. S.; Perl, D. P. In Microbeam Analysis--1989, Russell, P. E., Ed.; San Francisco Press, Inc.: San Francisco, 1989.
203-218.
Phys. 1983, 53, 111-124.
111-118.
111. Dingle, T.; Griffiths, B. W.; Mullock, S. J. In Mi- crobeam Analysis-1986, Romig, A. D., Jr.; Cham- bers, W. F., Eds.; San Francisco Press, Inc.: San Francisco, 1986.
112. Balasanmugam, K.; Viswanadham, S. K.; Hercules, D. M.; Cotter, R. J.; Heller, D.; Benninghoven, A.; Sichtermann, W.; Anders, V.; Keough, T.; Macfarlane, R. D.; McNeal, C. J. Appl. Spectrosc. 1987, 41, 821- 829.
113. Dang, T. A.; Day, R. J.; Hercules, D. M. Anal. Chim.
114. Van Vaeck, L.; Bennett, J.; Van Espen, P.; Schweikert, E.; Gijbels, R.; Adams, F.; Lauwers, W. Org. Mass Spectrom. 1989, 24, 782-796.
115. Hillenkamp, F.; Unsold, E.; Kaufmann, R.; Nitsche,
116. Wurster, R.; Wieser, P. In Proceedings of the LAMMA- Workshop, 1-2 September, 1983, Borstel, Germany, Seydel, U., Ed.; University of Borstel 1983.
AC~U 1984, 158, 235-246.
R. Appl. Phys. 1975, 8, 341-348.
LASER MICROPROBE MASS SPECTROMETRY I . 117. Michiels, E.; Mauney, T.; Adams, F.; Gijbels, R. Int.
J. Mass Spectrom. Ion Proc. 1984, 61, 231-246. 118. Mauney, T.; Adams, F. Int. J. Mass Spectrom. Ion
Proc. 1984, 58, 103-119. 119. Housden, J . ; Hutt, K. W.; Wallach, E . R. In Microbeam
Analysis-1989, Russell, P. E., Ed.; San Francisco Press, Inc.: San Francisco, 1989.
120. Dinger, R.; Rohr, K.; Weber, H. J. Phys. D: Appl.
121. De Wolf, M.; Mauney, T.; Michiels, E.; Gijbels, R. Scann. Electron Microsc. 1986, 3, 799-814.
122. Vertes, A,; Juhasz, P.; Matus, L. Int. J. Mass Spectrom. Ion Proc. 1986, 73, 109-125.
123. Simons, D. S. Int. J. Mass Spectrom. Ion Proc. 1983- 84, 55, 15-30.
124. Simons, D. S. In Microbeam Analysis-1982, Heinrich, K. F. J., Ed.; San Francisco Press, Inc.: San Francisco, 1982.
125. Musselman, I. H.; Simons, D. S.; Small, J. A.; Linton, R. W. J. Trace Microprobe Tech. 1986, 4, 197-213.
126. Radicati di Brozolo, F.; Odom, R. W. In Microbeam Analysis-1985, Armstrong, J. T., Ed.; San Francisco Press, Inc.: San Francisco, 1985.
127. Mattern, D. E.; Hercules, D. M. Anal. Chem. 1985, 57, 2041 -2046.
128. Fletcher, R. A.; Simons, D. S. In Microbeam Analysis-1985, Armstrong, J. T., Ed.; San Francisco Press, Inc.: San Francisco, 1985.
129. Van Espen, P.; Van Vaeck, L.; Adams, F. In Proceed- ings of the Third International Laser Microprobe Mass Spectrometry Workshop, 26-27 August, 1986, Antwerp, Belgium, Adams, F.; Van Vaeck, L., Eds.; University of Antwerp 1986.
130. Ro, C.-U.; Musselman, I. H.; Linton, R. W. In Microbeam Analysis-1989, Russell, P. E., Ed.; San Francisco Press, Inc.: San Francisco, 1989.
Phys. 1980, 13, 2301-2307.
131. Brenna, J . T. In Proceedings of SIMS VI , Bennin- ghoven, A., Ed.; John Wiley & Sons: Chichester, New York, Brisbane, Toronto, Singapore, 1987.
132. Andersen, C. A.; Hinthorne, J . R. Anal. Chem. 1973, 45, 1421-1438.
133. Lovell, M. A.; Ehmann, W. D.; Markesberry, W. R. J. Trace Microprobe Tech. 1992, 10, 109-124.
134. Haas, U.; Wieser, P.; Wurster, R. Fresenius' 2. Anal. Chem. 1981, 308, 270-273.
135. Fiirstenau, N. Fresenius' Z . Anal. Chem. 1981, 308, 201 -205.
136. Surkyn, P.; Adams, F. J. Trace Microprobe Tech. 1982, 1, 79-114.
137. Wieser, P.; Wurster, R.; Seiler, H. Scann. Electron Microsc. 1982, W, 1435-1441.
138. Wieser, P.; Wurster, R.; Wechsung, R. In Proceedings of the LAMMA-Workshop, 1-2 September, 1983, Bor- stel, Germany, Seydel, U., Ed.; University of Borstel 1983.
207
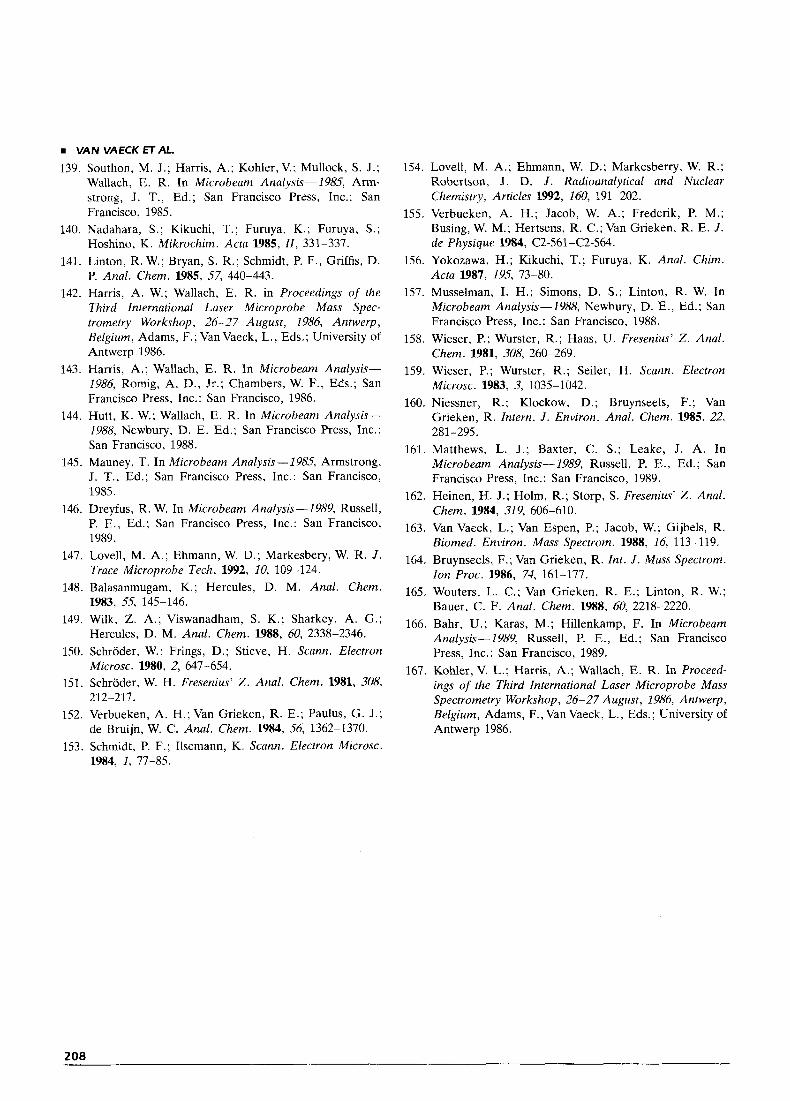
VAN VAECK ETAL.
139. Southon, M. J.; Harris, A.; Kohler, V.; Mullock, S. J.; Wallach, E. R. In Microbeam Analysis-1985, Arm- strong, J. T., Ed.; San Francisco Press, Inc.: San Francisco, 1985.
140. Nadahara, S.; Kikuchi, T.; Furuya, K.; Furuya, S.; Hoshino, K. Mikrochim. Acta 1985, 11, 331-337.
141. Linton, R. W.; Bryan, S. R.; Schmidt, P. F., Griffis, D. P. Anal. Chem. 1985, 57, 440-443.
142. Harris, A. W.; Wallach, E. R. in Proceedings of the Third International Laser Microprobe Mass Spec- trometry Workshop, 26-27 August, 1986, Antwerp, Belgium, Adams, F.; VanVaeck, L., Eds.; University of Antwerp 1986.
143. Harris, A.; Wallach, E. R. In Microbeam Analysis- 1986, Romig, A. D., Jr.; Chambers, W. F., Eds.; San Francisco Press, Inc.: San Francisco, 1986.
144. Hutt, K. W.; Wallach, E. R. In Microbeam Analysis- 1988, Newbury, D. E. Ed.; San Francisco Press, Inc.: San Francisco, 1988.
145. Mauney, T. In Microbeam Analysis-1 985, Armstrong, J. T., Ed.; San Francisco Press, Inc.: San Francisco, 1985.
146. Dreyfus, R. W. In Microbeam Analysis -1989, Russell, P. E., Ed.; San Francisco Press, Inc.: San Francisco, 1989.
147. Lovell, M. A.; Ehmann, W. D.; Markesbery, W. R. J . Trace Microprobe Tech. 1992, 10, 109-124.
148. Balasanmugam, K.; Hercules, D. M. Anal. Chem.
149. Wilk, 2. A.; Viswanadham, S. K.; Sharkey, A. G.;
150. Schroder, W.; Frings, D.; Stieve, H. Scann. Electron
151. Schroder, W. H. Fresenius’ 2. Anal. Chem. 1981, 308,
152. Verbueken, A. H.; Van Grieken, R. E.; Paulus, G. J.;
153. Schmidt, P. F.; Ilsemann, K. Scann. Electron Microsc.
1983, 55, 145-146.
Hercules, D. M. Anal. Chem. 1988, 60, 2338-2346.
Microsc. 1980, 2, 647-654.
21 2-21 7.
de Bruijn, W. C. Anal. Chem. 1984, 56, 1362-1370.
1984, 1, 77-85.
154. Lovell, M. A.; Ehmann, W. D.; Markesberry, W. R.; Robertson, J . D. J . Radioanalytical and Nuclear Chemistry, Articles 1992, 160, 191-202.
155. Verbueken, A. H.; Jacob, W. A.; Frederik, P. M.; Busing, W. M.; Hertsens, R. C.; Van Grieken, R. E. J . de Physique 1984, C2-561-C2-564.
156. Yokozawa, H.; Kikuchi, T.; Furuya, K. Anal. Chim. Acta 1987, 195, 73-80.
157. Musselman, I . H.; Simons, D. S.; Linton, R. W. In Microbeam Analysis--2988, Newbury, D. E., Ed.; San Francisco Press, Inc.: San Francisco, 1988.
158. Wieser, P.; Wurster, R.; Haas, U. Fresenius’ 2. Anal. Chem. 1981, 308, 260-269.
159. Wieser, P.; Wurster, R.; Seiler, H. Scann. Electron Microsc. 1983, 3, 1035-1042.
160. Niessner, R.; Klockow, D.; Bruynseels, F.; Van Grieken, R. Intern. J . Environ. Anal. Chem. 1985, 22,
161. Matthews, L. J.; Baxter, C. S.; Leake, J. A. In Microbeam Analysis-1989, Russell, P. E., Ed.; San Francisco Press, Inc.: San Francisco, 1989.
162. Heinen, H. J.; Holm, R.; Storp, S. Fresenius’ 2. Anal. Chem. 1984, 319, 606-610.
163. Van Vaeck, L.; Van Espen, P.; Jacob, W.; Gijbels, R. Biomed. Environ. Mass Spectrom. 1988, 16, 113-119.
164. Bruynseels, F.; Van Grieken, R. Int. J . Mass Spectrom. Ion Proc. 1986, 74, 161-177.
165. Wouters, L. C.; Van Grieken, R. E.; Linton, R. W.; Bauer, C. F. Anal. Chem. 1988, 60, 2218-2220.
166. Bahr, U.; Karas, M.; Hillenkamp, F. In Microbeam Analysis-1989, Russell, P. E., Ed.; San Francisco Press, Inc.: San Francisco, 1989.
167. Kohler, V. L.; Harris, A.; Wallach, E . R. In Proceed- ings of the Third International Laser Microprobe Mass Spectrometry Workshop, 26-27 August, 1986, Antwerp, Belgium, Adams, F., Van Vaeck, L., Eds.; University of Antwerp 1986.
281-295.
208
Related Documents