Welcome message from author
This document is posted to help you gain knowledge. Please leave a comment to let me know what you think about it! Share it to your friends and learn new things together.
Transcript


Downtown Cruise Report 08/05/09
C:\Documents and Settings\sreinwald\My Documents\TIMBER SALES\FY10\Downtown\Downtown Cruise
OREGON DEPARTMENT OF FORESTRY CRUISE REPORT
Downtown
1. Type of Sale Modified Clear-cut harvest, Recovery
2. Legal Description Section 33, T1S, R7W and Sections 3, 4, and 10, T2S, R7W, W.M. Tillamook County, Oregon
3. Sale Acreage Sale acreage was determined by GPS and orthophotographs along with GIS.
ACRES Gross Net
Area 1 (Modified Clear Cut) Area 2 (Modified Clear Cut)
89 4
85 4
Area 2 (Modified Clear Cut) Area 4 (Modified Clear Cut)
131 36
112 31
Gross Acres Area within the Timber Sale Boundary signs
Net acres Used for calculating the advertised volume. Gross acres, less green tree retention, roads, Non-required thinning areas, and riparian areas classified as Special Stewardship in LMCS inside the sale boundary.
4. Cruising Procedures
A. Cruise Method Areas 1, 2, 3, and 4 were cruised with plots spaced every 350’ on lines 700’ apart on a S250W bearing. Trees were measured to the nearest foot in height and inch in diameter. Top cruise diameter was 5” for Douglas-fir and other conifers and 6” for hardwoods or 25% of the diameter breast height whichever was larger. Based on net board feet the combined CV and SE for Areas 1, 2, 3 and 4 is 120.8% and 12.3% respectively.
B. Plot size A BAF of 33.61 was used on all of the areas. 4 1/2 feet was the point of tree observation.
C. Grading System Trees were graded using Columbia River Log Scaling and Grading rules, favoring 40’ logs.
Reports\Downtown_Cruise_report.doc
- 1 -

Downtown Cruise Report 08/05/09
5. Computation Procedure Plot data was entered into SuperAce for computation of stand information and volume. Net take volume was determined by removing the leave tree volume in Areas 3 and 4.
6. Hidden Defect and Breakage A 2% defect and breakage was applied to conifers and a 5% reduction to hardwood volumes for hidden defect. This was in addition to visual defect deducted during the cruise.
7. Timber Description The stand contains 40 to 45 year old timber. Areas 1 and 2 were planted in 1967-68 and thinned in 1992. Area 3 and 4 were seeded in 1961-62 and received no other forest management. Douglas-fir shows a moderate level of Swiss needle cast infection. The entire sale area was burned in 1933 and 1939, and about 60% of the area was additionally burned in 1951.
8. Cruiser Names/Dates Contract cruise, November 2007
9. Revenue Distribution FDF 100% Tax Code: 9-1 99% 9-2 1% Deed Numbers: 161, 169
10. Attachments Volume Summaries Logging Plan Map Stand Table Log Stock Tables
11. Stand and Log Stock Tables Species Key
DL – Douglas-fir leave DF – Douglas-fir take RA – Red alder take SS – Sitka spruce
C:\Documents and Settings\sreinwald\My Documents\TIMBER SALES\FY10\Downtown\Downtown Cruise Reports\Downtown_Cruise_report.doc
- 2 -

Acres
Project
232.00
DOWNTOWN Time: 11:20:11AM
Date: 7/30/2009
Page 1Stand Table SummaryPSTNDSUM
T02S R07W S04 TySALE
THRU
T02S R07W S04 TySALE
TC
Downtown
Grown Year:
T o t a l s
Sample
Trees Tons
S
T AcreSpc MBFCunits
Net
Bd.Ft.
Acre
Net
Cu.Ft.Tons/
Acre
Average Log
Net
Bd.Ft.
Net
Cu.Ft.
Logs
Acre
BA/
Acre
Trees/
Acre
Av
Tot
Ht16'DBH
FF BA/
8 90 14.734 5.14 14.73 5.6 28.4 2.33 419 541 190 97 10 79 82DF
9 87 13.189 5.83 12.79 6.8 29.8 2.47 382 573 201 89 14 79 87DF
10 87 12.316 6.72 16.00 8.9 37.6 4.05 601 939 329 139 25 80 142DF
11 88 19.200 12.75 33.74 10.2 42.9 9.76 1,448 2,265 795 336 46 87 343DF
12 88 9.023 7.09 16.31 12.4 51.2 5.76 835 1,336 469 194 36 90 202DF
13 87 12.060 11.12 22.49 15.0 57.2 9.64 1,288 2,237 785 299 48 95 338DF
14 87 11.568 12.20 23.14 17.0 65.0 11.23 1,505 2,606 914 349 37 96 394DF
15 87 4.279 5.26 6.79 22.5 85.4 4.35 579 1,009 354 134 25 98 153DF
16 85 5.343 7.44 11.52 20.3 73.9 6.65 851 1,542 541 197 32 95 233DF
17 87 4.236 6.68 7.00 23.8 90.1 4.75 631 1,103 387 146 22 90 167DF
18 87 2.542 4.49 4.32 27.6 106.0 3.40 459 788 276 106 15 94 119DF
19 86 2.819 5.48 5.64 32.5 112.9 5.22 637 1,210 425 148 12 102 183DF
20 87 1.314 2.87 2.63 39.4 144.3 2.95 379 684 240 88 11 109 103DF
22 86 .129 .34 .26 46.1 166.6 .34 43 79 28 10 2 105 12DF
26 83 .093 .34 .19 66.4 225.4 .35 42 81 29 10 2 105 12DF
34 88 .054 .34 .05 164.5 823.2 .25 45 59 21 10 2 96 9DF
DF 339 88 88 112.899 177.59 14.5 57.1 73.50 2,579 10,142 17,052 5,983 2,353Totals
94.09
8 88 1.944 .68 1.94 8.5 38.0 .45 74 105 38 17 4 64 16RA
9 83 5.052 2.23 5.05 8.2 31.4 1.14 159 264 96 37 7 54 41RA
10 83 3.043 1.66 2.42 11.8 42.4 .78 103 182 66 24 7 56 29RA
11 82 2.868 1.89 3.38 14.1 46.9 1.31 159 303 110 37 5 82 48RA
12 80 2.592 2.04 3.46 11.4 35.6 1.09 123 252 92 29 12 52 39RA
13 80 3.641 3.36 4.38 19.3 51.3 2.33 225 540 196 52 17 68 85RA
14 81 5.629 6.02 7.40 17.3 47.7 3.52 353 817 297 82 17 56 128RA
15 83 3.085 3.79 5.89 18.9 61.5 3.07 363 711 259 84 10 74 111RA
16 80 4.936 6.89 6.78 24.5 70.8 4.56 480 1,059 385 111 16 65 166RA
17 83 2.186 3.45 3.39 24.2 65.9 2.25 223 522 190 52 8 65 82RA
18 80 2.718 4.80 3.98 30.6 82.8 3.35 329 778 283 76 16 65 122RA
19 83 3.918 7.71 5.12 30.2 85.5 4.26 438 989 360 102 27 53 155RA
20 83 1.023 2.23 .93 30.1 98.2 .77 92 179 65 21 7 44 28RA
21 75 .787 1.89 .79 43.4 108.4 .94 85 218 79 20 5 64 34RA
23 83 .656 1.89 1.19 31.5 106.5 1.03 127 240 87 30 5 60 38RA
24 68 .108 .34 .22 32.6 90.3 .19 19 45 16 5 2 65 7RA
25 82 .100 .34 .20 49.8 161.5 .27 32 63 23 7 2 68 10RA
27 84 .161 .64 .16 62.0 304.0 .37 49 86 23 11 1 76 10RA
28 92 .150 .64 1 75RA
RA 169 82 62 44.598 56.69 20.3 60.5 31.70 1,149 3,432 7,354 2,666 796Totals
52.49
21 82 .964 2.32 1.93 38.3 120.0 2.03 231 471 171 54 2 107 74DL
22 85 .698 1.80 1.85 36.6 140.3 1.87 260 433 157 60 2 122 68DL
24 88 .408 1.28 .82 52.3 202.5 1.18 165 273 99 38 2 102 43DL
DL 6 84 111 2.071 4.60 40.1 142.9 5.07 184 657 1,176 428 152Totals
5.40
13 66 .368 .34 .37 10.6 19.6 .10 7 23 9 2 2 44 4SS
SS 2 66 44 .368 .37 10.6 19.6 .10 4 7 23 9 2Totals
.34
Totals 516 86 81 152.33 239.24 16.4 59.5 110.37 3,916 14,238 25,605 9,086 3,303 159.935

0.53 14,829 14,321 3.4 237.760 31 61 15 176161642 263,322 Totals
0.2962 3.629382674 2.0 25 2 0.29 .639 2.0 60.2846 101.43012199 2.1 7080.651 68.19711
14 8254523 2.2 1,525
1.46 391 6,575 3,051
25 106
1.6243100 2.3 91 400 6,721 3,117
25 108
3 65 30
DO 2M DO 3M DO 4M DO UT PU UT
DF DF DF DF DF
BdFt
CF/Lf /AcreNet MBFNet Spp T
S So Gr rt ad
LogsPerLog Scale Dia.
Percent of Net Board Foot Volume
36-31-35 99 100
88 28
100
Log Length 21-3012-2012+10-118-96-7
Ln Ft
39 38 28 40 22
Average LogTotalBd. Ft. per Acre
Gross Def% Net %
BdFt
TimeDate
1 of 55/11/2009 9:06:47AM
Page
232.00Acres
DOWNTOWN Volume Summary –Areas 1, 2, 3, and 4 (All)
0.53 .420 20 1002 7 7 2.0 0 SS Totals 0.53 20 .4201002 7 7 2.0PU UT SS
1.19 4.614012 34 83 806149 644 671 4.1 4 DL Totals 4113
0.63 .259 100 2.0 30.75100 .239 2.0 21.085 3.511918 2751015 3.1 971.94 40
33 26 40
204 417
8 14
.7313 100 75
100 6.2 47 218 431
8 15
31 65
1 3
DO 2M DO 3M DO 4M PU UT
DL DL DL DL
0.70 57.561 29 35 26 13231821817 3,524 3,779 6.8 25 RA Totals 2638
0.8167 6.274932262418 8.1 1070.69 29
27 20 3,062
461 51.360 36
24 30 1422172041 6.6 710 3,278
502 86 14
DO CR PU UT
RA RA
0.46 175.35811 32 69 916292,354 10,147 10,371 2.2 71 DF Totals 15446

TimeDate 5/11/2009
9:00:14AM
Page 2 of 5DOWNTOWN Volume Summary – Area 1
0.52 20,246 20,906 3.2 Type Totals 327.062 32 63 18 145122126411,721
0.48 13 246.763 33 74 11392128421,319 15,523 15,869 0.29 1.639 50.29 140.232399 1993800.66 103.9103 13
13 1030 4119907
1.86 317 10,673
4,468 64
1.0323 38 38 29 40
87 39
3.0 2.1 2.2 2.0
27 327 10,906
4,570 65
2 68 29
1
DF DF DF DF
CF/Lf
Log Scale Dia.10-118-9 12+6-7rt ad
G d2M 3M 4M UT
DO DO DO DO
So Gr Net MBFNet Spp T
S Per/Acre
LogsAverage LogPercent Net Board Foot Volume
Log Length 31-35 36-99 21-3012-20
Ln BdFt Ft
TotalBd. Ft. per Acre Gross Def%
Net %
BdFt
Sample Trees BdFtW
CuFt S 85.00 38 221
Tract AREA 1
Type SALE
Acres PlotsT02S R07W S04 TSALE
Twp 02S
Rge 07W
Sec 04
T02S R07W S04 TSALE
0.53 1.020 20 2 19 19 2.0 0 SS Totals 0.53 19 1.020 20 2.0 2 19 100 UT PU SS
0.67 36 79.359 28 30 241123221639400 4,704 5,017 6.2 23 RA Totals 0.58 1.7473070703070.67 4,626
79 77.760 28
21 31 36 23102421 1739 6.3
5.0 393 4,934
83 98
2 CR UT
DO PU
RA RA
2.2 77 DF Totals

TimeDate 5/11/2009
9:02:24AM
Page 3 of 5DOWNTOWN Volume Summary – Area 2
0.52 20,246 20,906 3.2 Type Totals 327.062 32 63 18 1451221264181
0.48 13 246.763 33 74 113921284262 15,523 15,869 0.29 1.639 00.29 140.232399 199180.66 103.9103 13
13 1030 411943
1.86 317 10,673
4,468 64
1.0323 38 38 29 40
87 39
3.0 2.1 2.2 2.0
1 327 10,906
4,570 65
2 68 29
1
DF DF DF DF
CF/Lf
Log Scale Dia.10-118-9 12+6-7rt ad
G d2M 3M 4M UT
DO DO DO DO
So Gr Net MBFNet Spp T
S Per/Acre
LogsAverage LogPercent Net Board Foot Volume
Log Length 31-35 36-99 21-3012-20
Ln BdFt Ft
TotalBd. Ft. per Acre Gross Def%
Net %
BdFt
Sample Trees BdFtW
CuFt S 4.00 38 221
Tract AREA 2
Type SALE
Acres PlotsT02S R07W S04 TSALE
Twp 02S
Rge 07W
Sec 04
T02S R07W S04 TSALE
0.53 1.020 20 0 19 19 2.0 0 SS Totals 0.53 19 1.020 20 2.0 0 19 100 UT PU SS
0.67 36 79.359 28 30 24112322163919 4,704 5,017 6.2 23 RA Totals 0.58 1.7473070703000.67 4,626
79 77.760 28
21 31 36 23102421 1739 6.3
5.0 19 4,934
83 98
2 CR UT
DO PU
RA RA
2.2 77 DF Totals
TimeDate 5/11/2009
9:03:52AM
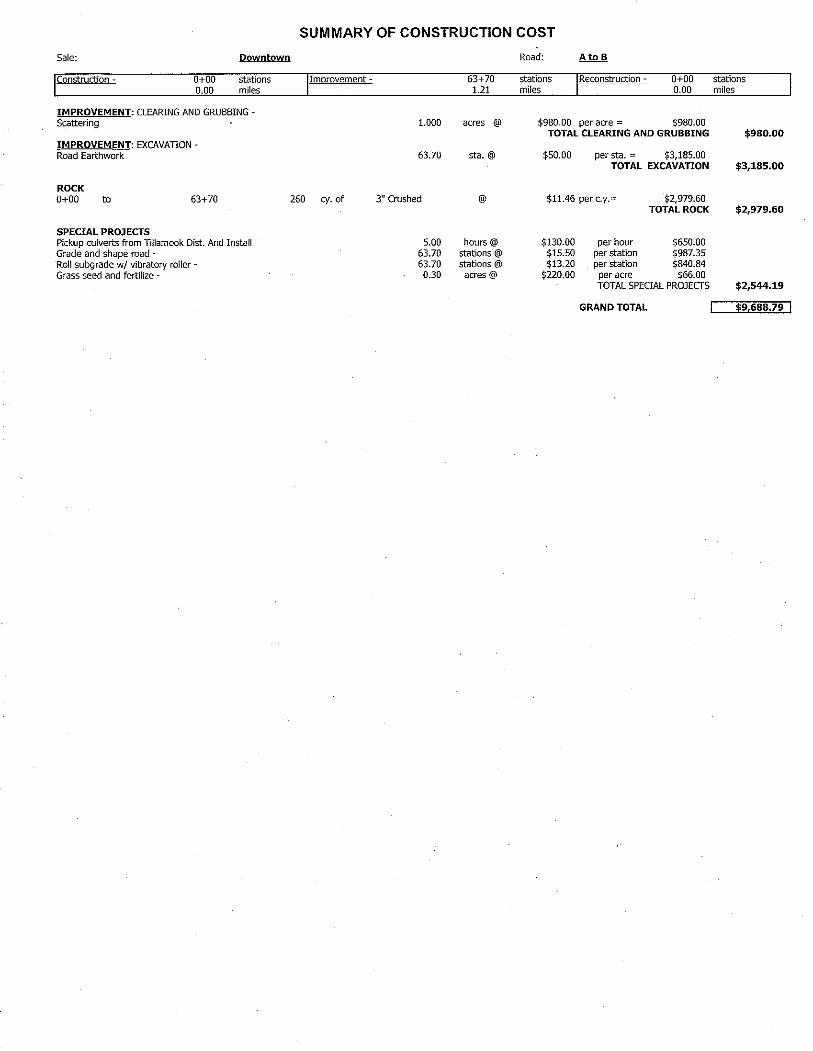
Page 4 of 5DOWNTOWN Volume Summary – Area 3
0.56 10,189 10,571 3.6 Type Totals 179.857 30 54 15 2210191126441,141
0.45 13 121.251 30 60 2078112754686 6,125 6,250 0.27 80.02757192460.66 40.192 11
18 718 4531411
1.45 259 3,671 2,195
1.1235 40 39 25
89 7
2.0 2.0 2.0
29 264 3,746 2,240
4 60 36
DF DF DF
CF/Lf
Log Scale Dia.10-118-9 12+6-7rt ad
G d2M 3M 4M
DO DO DO
So Gr Net MBFNet Spp T
S Per/Acre
LogsAverage LogPercent Net Board Foot Volume
Log Length 31-35 36-99 21-3012-20
Ln BdFt Ft
TotalBd. Ft. per Acre Gross Def%
Net %
BdFt
Sample Trees BdFtW
CuFt S 112.00 14 54
Tract AREA 3
Type SALE
Acres PlotsT02S R07W S04 TSALE
Twp 02S
Rge 07W
Sec 04
T02S R07W S04 TSALE
1.10 16 6.8123 33 77 5277101394 839 866 3.1 8 DL Totals 1.10 839 6.8123 33 77 16 5277 1013 3.1 94 866 100 3M DO DL
0.76 17 51.862 29 36 281823152834361 3,224 3,454 6.7 32 RA Totals 0.79 11.2716652626 3019890.75 2,433
792 40.660 29
28 39 30
23 16222212 2839 7.2 5.0
272 2,621 833
75 25
CR UT
DO PU
RA RA
2.0 60 DF Totals

TimeDate 5/11/2009
10:41:45AM
Page 5 of 5DOWNTOWN Volume Summary – Area 4
0.50 12,242 12,766 4.1
0.29 26.92962382674250.24 67.531 4 4810640.56 66.280129 66251641.26 1,078
5,301 2,072
792
5.2206
88 38
38 36 29 22
2.0 2.8 2.0 2.0
33 1,100 5,454 2,114
808
11 58 22
9
DF DF DF DF
CF/Lf
Log Scale Dia.10-118-9 12+6-7rt ad
G d2M 3M 4M UT
DO DO DO PU
So Gr Net MBFNet Spp T
S Per/Acre
LogsAverage LogPercent Net Board Foot Volume
Log Length 31-35 36-99 21-3012-20
Ln BdFt Ft
TotalBd. Ft. per Acre Gross Def%
Net %
BdFt
Sample Trees BdFtW
CuFt S 31.00 7 23
Tract AREA 4
Type SALE
Acres PlotsT02S R07W S04 TSALE
Twp 02S
Rge 07W
Sec 04
T02S R07W S04 TSALE
Type Totals 190.764 32 74 1 2142642941379
1.37 5 9.8183 37 92 3861455 1,784 1,890 5.6 15 DL Totals 0.63 1.859 30.75 1.53920.75 1.559 31.94 1,527
90 60
107
4.9313 40 34 26 40
6.2 2.0 2.0 2.0
47 1,628 92 61
109
85 5 4 6
2M 3M 4M UT
DO DO DO PU
DL DL DL DL
0.55 15.280 39 70 30307038 1,215 1,400 13.2 10 RA Totals 2.21 1.2304100110.45 848
367 14.061 40
28 100 5.0
27.6 26 893
507 69 31
CR UT
DO PU
RA RA
0.44 1 165.756 31 71 2361453843287 9,243 9,476 2.5 76 DF Totals

3.1
58404.2
9.4
321.4
4261.3
251.0
15.6
261.1
331.4
9.4
16.7
311.3
301.3
13.6
863.6
9281.5
431.8
311.3
410.6
231.0
413.7
3321.5
4.2
16.7
212.6
13.6
5.2 5 13 14 16
4 35 16 23 14 31 43 36 86 13 30 31 16
9 33 26 15 25 30 32
9 98
3
2.0 2.0 2.0 2.0 2.0 2.0 2.0 2.0 2.0 5.1 2.0 2.0 2.0 2.0 2.0 2.0 2.0 2.0 2.0 2.0 2.0 2.0 2.0 2.0 2.0 2.0 2.0
5 13 14 17
4 36 16 23 14 32 44 37 88 13 31 31 17
9 33 26 16 25 31 33
9 100
3
15 16 17 18 19 20 21 22 23 24 25 26 27 28 29 30 31 32 33 34 35 36 37 38 39 40 41
4M 4M 4M 4M 4M 4M 4M 4M 4M 4M 4M 4M 4M 4M 4M 4M 4M 4M 4M 4M 4M 4M 4M 4M 4M 4M 4M
DO DO DO DO DO DO DO DO DO DO DO DO DO DO DO DO DO DO DO DO DO DO DO DO DO DO DO
DF DF DF DF DF DF DF DF DF DF DF DF DF DF DF DF DF DF DF DF DF DF DF DF DF DF DF
1.0 1 2.0 1 13 4M DO DF
110 8 34563419655.0
1.1
1018141.8
2.1
7.3
21301096.8 160 7 2
42 1
1,294
2.3 2.0 2.0 2.0 2.0 2.2
164 7 2
43 1
1,322
32 34 35 36 39 40
3M 3M 3M 3M 3M 3M
DO DO DO DO DO DO
DF DF DF DF DF DF
20.8 20 2.0 20 26 3M DO DF
44 8 102.7
281.2 28 63
2.0 2.5
28 65
36 40
2M 2M
DO DO
DF DF
40+30-3924-2920-234-52-3 Net Volume by Scaling Diameter in Inches
16-19 14-15 12-1310-118-96-7rt de So Gr %
Spc MBF Net Def
% Gross MBFMBF Len
Log Spp T
S
T02S R07W S04 TySALE THRU T02S R07W S04 TySALE
AcresTimeDate
1 of 35/12/2009 3:25:27PM
PageDOWNTOWN
232.00
Log Stock Table - MBF

Log Stock Table - MBF2 of 35/12/2009 3:25:27PM
PageT02S R07W S04 TySALE THRU T02S R07W S04 TySALE
Project: DOWNTOWN 232.00
DateAcres
Time
T S
rt de So Gr
Len Log Def
% Net Volume by Scaling Diameter in Inches
16-19 14-15 12-1310-118-96-7Gross MBFMBF MBF
Net %Spp Spc 2-3 4-5 20-23 24-29 30-39 40+
DF DO UT 40 6 2.0 6 .2 6
DF PU UT 12 7 2.0 6 6.3
DF DF DF DF
PU PU PU PU
UT UT UT UT
19 23 24 26
3 5 8 3
2.0 2.0 2.0 2.0
3 4 8 3
.1 3
.2 4
.3 8
.1 3
Totals DF RA RA RA RA RA RA RA RA RA RA RA RA RA RA RA RA RA RA RA RA RA RA RA RA RA RA
2,406 6 6 8 5
34 5
46 6
11 26 30 34 14
8 13
4 3
17 172
17 11
9 64
9 7
195
2.2 5.0 5.0 5.0 5.0
13.2 5.0 8.7 5.0 5.0 5.0 5.0 5.0 5.0 5.0 5.0 5.0
28.7 5.0 5.5
20.4 5.0 5.0 7.6 5.0
16.4 5.3
2,354 6 5 8 5
29 5
42 6
11 25 28 32 13
8 12
4 2
16 162
14 11
8 59
8 6
185
8 8 70.9 648 428 686 376 189 10
DO DO DO DO DO DO DO DO DO DO DO DO DO DO DO DO DO DO DO DO DO DO DO DO DO DO
CR CR CR CR CR CR CR CR CR CR CR CR CR CR CR CR CR CR CR CR CR CR CR CR CR CR
14 15 16 17 18 19 20 21 22 23 24 25 26 27 28 29 30 31 32 33 34 35 36 37 38 40
.7 6
.7 2 3
3 .9 1 3
.6 5
3 19 3.6 7
.6 5
6 5.2 2 15 19
.7 5 1
1.3 3 3 5
3.1 25
3.5 7 21
4.0 32
1.6 7 6
.9 8
1.5 12
.5 4
.3 2
2.0 13 3
7 19.9 9 60 41 47
1.7 14
1.3 11
1.0 8
7.2 10 29 20
1.0 8
.7 6
22.6 82 50 38 14
RA PU UT 18 5 5.0 4 4.5
RA RA
PU PU
UT UT
20 21
5 2
5.0 5.0
5 2
.6 5
.3 2

Log Stock Table - MBF3 of 35/12/2009 3:25:27PM
PageT02S R07W S04 TySALE THRU T02S R07W S04 TySALE
Project: DOWNTOWN 232.00
DateAcres
Time
T S
rt de So Gr
Len Log Def
% Net Volume by Scaling Diameter in Inches
16-19 14-15 12-1310-118-96-7Gross MBFMBF MBF
Net %Spp Spc 2-3 4-5 20-23 24-29 30-39 40+
RA RA RA RA RA
PU PU PU PU PU
UT UT UT UT UT
24 25 28 30 40
5 3
45 24 28
5.0 5.0
12.9 5.0 5.0
5 3
39 23 26
.6 5
.3 3
11 4.8 5 23
2.8 23
3.2 26
Totals RA DL
877 50
6.8 6.2
817 47
13 47
37 24.6 311 170 145 141
DO 2M 40 31.7
DL DO 3M 15 2 2.0 2 21.4
DL DL DL DL
DO DO DO DO
3M 3M 3M 3M
29 32 34 40
4 15
3 75
2.0 2.0 2.0 3.5
4 15
3 73
2.9 4
9.9 5 9
1.9 3
30 48.7 43
DL DO 4M 26 2 2.0 2 21.2
DL PU UT 40 3 2.0 3 32.2
Totals DL SS
156 2
4.1 2.0
149 2
77 4.5 20 9 43
PU UT 20 2
Totals SS 2 2.0 2 .1 2
Total All Species 3,440 3.4 3,322 98 46 373650 759 866 521 10

PLOGSTVB
Log Stock Table - MBFTC
Downtown
Project: DOWNTOWN
Page 1
Date 7/30/2009
Time 11:25:51AM
Acres 232.00
T02S R07W S04 TySALE
THRU
T02S R07W S04 TySALE
T
S
Spp Len
Log Gross
MBF
Def
% MBF Spc
%
rt de
So Gr Net Volume by Scaling Diameter in Inches
2-3 4-5 6-7 8-9 10-11 12-13 14-15 16-19 20-23 24-29 30-39 40+MBF
Net
DF DO 2M 36 28 2.0 28 1.2 28
DF DO 2M 40 177 2.2 173 7.4 8 108146
DF DO 3M 12 7 2.0 6 .3 6
DF DO 3M 26 20 2.0 20 .8 20
DF DO 3M 32 164 2.3 160 6.8 109 30 21
DF DO 3M 34 7 2.0 7 .3 7
DF DO 3M 35 2 2.0 2 .1 2
DF DO 3M 36 43 2.0 42 1.8 14 18 10
DF DO 3M 39 1 2.0 1 .1 1
DF DO 3M 40 1,213 2.2 1,186 50.4 199 634 345 9
DF DO 4M 13 1 2.0 1 .0
1
DF DO 4M 15 5 2.0 5 .2 5
DF DO 4M 16 13 2.0 13 .6 13
DF DO 4M 17 14 2.0 14 .6 12 2
DF DO 4M 18 17 2.0 16 .7 16
DF DO 4M 19 7 2.0 7 .3 7
DF DO 4M 20 36 2.0 35 1.5 32 3
DF DO 4M 21 15 2.0 15 .6 15
DF DO 4M 22 23 2.0 23 1.0 23
DF DO 4M 23 19 2.0 18 .8 14 4
DF DO 4M 24 40 4.4 39 1.6 39
DF DO 4M 25 44 2.0 43 1.8 43
DF DO 4M 26 40 2.0 39 1.7 31 9
DF DO 4M 27 88 2.0 86 3.6 86
DF DO 4M 28 13 2.0 13 .6 13
DF DO 4M 29 31 2.0 30 1.3 30
DF DO 4M 30 31 2.0 31 1.3 31
DF DO 4M 31 17 2.0 16 .7 16
DF DO 4M 32 9 2.0 9 .4 9
DF DO 4M 33 33 2.0 33 1.4 33
DF DO 4M 34 26 2.0 26 1.1 26
DF DO 4M 35 16 2.0 15 .6 15
DF DO 4M 36 25 2.0 25 1.0 25
DF DO 4M 37 31 2.0 30 1.3 26 4
DF DO 4M 38 33 2.0 32 1.4 32
DF DO 4M 39 9 2.0 9 .4 9
DF DO 4M 40 103 2.0 101 4.3 45 56

PLOGSTVB
Log Stock Table - MBFTC
Downtown
Project: DOWNTOWN
Page 2
Date 7/30/2009
Time 11:25:51AM
Acres 232.00
T02S R07W S04 TySALE
THRU
T02S R07W S04 TySALE
T
S
Spp Len
Log Gross
MBF
Def
% MBF Spc
%
rt de
So Gr Net Volume by Scaling Diameter in Inches
2-3 4-5 6-7 8-9 10-11 12-13 14-15 16-19 20-23 24-29 30-39 40+MBF
Net
DF DO 4M 41 3 2.0 3 .1 3
DF 2,405 2.2 2,353 71.2 651 425 686 376 189 8Totals
108
RA DO 3M 16 7 5.0 7 .8 33
RA DO 3M 18 27 15.3 23 2.9 193
RA DO 3M 20 44 8.9 40 5.0 15 619
RA DO 3M 22 5 5.0 5 .7 5
RA DO 3M 26 6 5.0 6 .8 6
RA DO 3M 28 40 13.9 34 4.3 23 11
RA DO 3M 30 24 5.0 23 2.9 23
RA DO 3M 31 4 5.0 3 .4 3
RA DO 3M 32 99 5.4 94 11.8 41 747
RA DO 3M 36 22 7.5 20 2.5 20
RA DO 3M 40 73 5.0 70 8.8 17 38 14
RA DO 4M 14 6 5.0 6 .7 6
RA DO 4M 15 6 5.0 5 .7 2 3
RA DO 4M 16 1 5.0 1 .1 1
RA DO 4M 17 5 5.0 5 .6 5
RA DO 4M 18 12 5.0 11 1.4 11
RA DO 4M 19 5 5.0 5 .6 5
RA DO 4M 20 2 5.0 2 .3 2
RA DO 4M 21 6 5.0 6 .7 5 1
RA DO 4M 22 6 5.0 5 .7 3 3
RA DO 4M 23 26 5.0 25 3.2 25
RA DO 4M 24 15 5.0 14 1.8 14
RA DO 4M 25 37 5.0 35 4.4 35
RA DO 4M 26 8 5.0 7 .9 7
RA DO 4M 27 8 5.0 8 .9 8
RA DO 4M 28 18 5.0 17 2.1 17
RA DO 4M 30 7 15.9 6 .8 6
RA DO 4M 31 13 5.0 13 1.6 13
RA DO 4M 32 70 5.0 67 8.4 7 60
RA DO 4M 33 19 21.3 15 1.9 1 14
RA DO 4M 34 11 5.0 11 1.3 11
RA DO 4M 35 9 5.0 8 1.1 8
RA DO 4M 36 42 7.7 39 4.9 10 29
RA DO 4M 37 9 5.0 8 1.0 8
RA DO 4M 38 7 16.4 6 .7 6

PLOGSTVB
Log Stock Table - MBFTC
Downtown
Project: DOWNTOWN
Page 3
Date 7/30/2009
Time 11:25:51AM
Acres 232.00
T02S R07W S04 TySALE
THRU
T02S R07W S04 TySALE
T
S
Spp Len
Log Gross
MBF
Def
% MBF Spc
%
rt de
So Gr Net Volume by Scaling Diameter in Inches
2-3 4-5 6-7 8-9 10-11 12-13 14-15 16-19 20-23 24-29 30-39 40+MBF
Net
RA DO 4M 40 154 5.4 146 18.3 87 59
RA 854 6.8 796 24.1 1 314 170 140 121 37Totals
13
DL DO 2M 40 126 2.6 123 80.4 7944
DL DO 3M 15 2 2 1.4 2
DL DO 3M 29 4 4 2.9 4
DL DO 3M 32 15 15 9.9 6 10
DL DO 3M 34 3 3 1.9 3
DL DO 3M 40 3 3 2.2 3
DL DO 4M 26 2 2 1.2 2
DL 156 2.1 152 4.6 20 10 44Totals
79
SS DO 4M 20 2 2.0 2 100.0 2
SS 2 2.0 2 .1 2Totals
Total 3,417 3.3 3,303 654 759 866 516 46 10353
100.0All Species100

Related Documents