Last updated on July 18, 2008 Oregon Department of Education 2008–2009 Technical Report Oregon’s Statewide Assessment System Standard Setting Volume 3

Welcome message from author
This document is posted to help you gain knowledge. Please leave a comment to let me know what you think about it! Share it to your friends and learn new things together.
Transcript

Last updated on July 18, 2008
Oregon Department of Education
2008–2009 Technical Report Oregon’s Statewide Assessment System
Standard Setting Volume 3


Oregon’s Statewide Assessment System Technical Report: Volume 3, Standard Setting
Last updated on July 18, 2008.
It is the policy of the State Board of Education and a priority of the Oregon Department of Education that there will be no discrimination or harassment on the grounds of race, color, sex, marital status, religion, national origin, age, or handicap in any educational programs, activities, or employment. Persons having questions about equal opportunity and nondiscrimination should contact the state superintendent of public instruction at the Oregon Department of Education.
Oregon Department of Education Office of Assessment and Information Services 255 Capitol Street NE Salem, OR 97310 503-378-3600 http://www.ode.state.or.us/ Susan Castillo State Superintendent of Public Instruction Doug Kosty Assistant Superintendent Tony Alpert Director, Assessment and Evaluation Kathleen Vanderwall Manager, Test Development Stephen Slater Manager, Psychometrics and Validity Jessica Barr Manager, Analysis and Reporting
Ken Hermens Language Arts Assessment Specialist Leslie Phillips Science and Social Sciences Assessment Specialist Jim Leigh Mathematics Assessment Specialist Kim A. Miller ELPA Program Specialist Tom Tinkler Psychometrics Specialist Saleem Ahmad Research Analyst

This technical report is one of a series that describes the development of Oregon’s Statewide Assessment System. The complete set of volumes provides comprehensive documentation of the development, procedures, technical adequacy, and results of the system:
Volume 1: 2007–2008 Annual Report Volume 2: Test Development Volume 3: Standard Setting Volume 4: Reliability and Validity Volume 5: Test Administration Volume 6: Score Interpretation Guide Volume 7: Alternate Assessment, Program Description Volume 8: Alternate Assessment, 2005-06 Statistical Summary All volumes can be found at http://www.ode.state.or.us/search/page/?id=787.

The Oregon Statewide Assessment System Technical Report Volume 3: Standard Setting
i
CONTENTS
1. OVERVIEW ...........................................................................................................................................................1
2. OVERVIEW OF OREGON’S ASSESSMENT OF KNOWLEDGE & SKILLS (OAKS)...............................2 2.1 STATEWIDE ASSESSMENT SYSTEM ..................................................................................................................2 2.2 ACADEMIC CONTENT STANDARDS ...................................................................................................................3 2.3 ACADEMIC ACHIEVEMENT STANDARDS ...........................................................................................................4
3. STANDARD SETTING .........................................................................................................................................4 3.1 GOALS ..............................................................................................................................................................5 3.2 PANEL RECRUITMENT AND COMPOSITION ........................................................................................................5 3.3 PANEL TRAINING ..............................................................................................................................................6 3.4 METHOD: BOOKMARKING ................................................................................................................................7
3.4.1 Step 1: Setting the Bookmarks...............................................................................................................8 3.4.2 Step 2: Impact Data and Regional Meetings with the Public..............................................................13 3.4.3 Step 3: Research Review .....................................................................................................................14
4. FORMAL ADOPTION OF CHALLENGING ACADEMIC CONTENT STANDARDS .............................14
5. FINAL CUT SCORES .........................................................................................................................................15

The Oregon Statewide Assessment System Technical Report Volume 3: Standard Setting
ii

The Oregon Statewide Assessment System Technical Report Volume 3: Standard Setting
iii
LIST OF TABLES
TABLE 1. SUMMARY OF TESTS AND TESTING OPTIONS..................................................................................................3 TABLE 2. DATES OF ADOPTION FOR ACADEMIC CONTENT STANDARDS........................................................................4 TABLE 3. SUMMARY OF STANDARD SETTING PANEL MEETINGS, DECEMBER 2006.......................................................5 TABLE 4. SUMMARY OF STANDARD SETTING PANEL MEETINGS AFTER ROUND 3, DECEMBER 2006...........................10 TABLE 5. SUMMARY OF STANDARD SETTING PANEL MEETINGS AFTER CROSS GRADE ARTICULATION, DECEMBER
2006....................................................................................................................................................................12 TABLE 6: FEEDBACK FROM STANDARDS SETTING CONFERENCE ATTENDEES. ...............................................................13 TABLE 7. FINAL CUT SCORES ......................................................................................................................................15

The Oregon Statewide Assessment System Technical Report Volume 3: Standard Setting
iv

The Oregon Statewide Assessment System Technical Report Volume 3: Standard Setting
v
LIST OF APPENDICES
APPENDIX A PERFORMANCE-LEVEL DESCRIPTORS.....................................................................................................A1 APPENDIX B STANDARD-SETTING PANEL COMPOSITION BY SUBJECT AREA AND GRADE .......................................... B1 APPENDIX C STANDARD-SETTING PANEL TRAINING MATERIALS ............................................................................... C1 APPENDIX D ORDERED ITEM BOOKLETS SUPPLIED TOPANELISTS...............................................................................D1 APPENDIX E INITIAL BOOKMARKS SET BY INDIVIDUAL PANELISTS ............................................................................ E1 APPENDIX F CONSENSUS BOOKMARKS SET ACROSS GRADE SPANS ............................................................................F1 APPENDIX G RESEARCH AND IMPACT DATA ..............................................................................................................G3 APPENDIX H PANELIST EVALUATIONS ........................................................................................................................H1

The Oregon Statewide Assessment System Technical Report Volume 3: Standard Setting
vi

The Oregon Statewide Assessment System Technical Report Volume 3: Standard Setting
1
1. OVERVIEW
Oregon’s Statewide Assessment System provides instructionally useful information to educators about student mastery of the knowledge and skills described by the content standards. The content standards are benchmarked against national standards and were, designed with stakeholder involvement, to be rigorous, coherent, and demanding. In 1996 a panel of national experts reviewed Oregon’s content and performance standards; they concluded that the standards were rigorous and powerful tools for holding students accountable for their learning. Since 1997, Education Week has consistently awarded Oregon high marks for its standards and assessment system.
A major effort by the Oregon Department of Education resulted in the establishment of content standards that serve as the goal structure for the state assessments. The sections below provide a detailed description of the content standards development process.
The OAKS is designed to measure the grade-specific content described in the standards and is intended to serve the following goals:
• Provide instructionally useful evaluation of individual student progress toward mastery of the academic content standards;
• Guide instructional program improvement;
• Ensure that the state is progressing toward the state and federal goals for high standards for all; and
• Inform the public.
All tests are developed to be representative and valid measures of the knowledge required by Oregon’s Academic Content Standards; to facilitate accessibility for all students, the tests are designed according to the principles of universal design.
Expectations for teaching and learning are organized into the following Curriculum Goals, Grade-level Standards, and Foundations:
1. Common Curriculum Goals (CCG) that describe the knowledge and skills expected of all students as a result of their educational experience (OAR 581-022-0102)
2. Grade-level Standards that describe what students should know and be able to do at grades 3 through High School
3. K–2 Grade-level Foundations that describe one way curriculum might be organized to help students prepare to meet the third grade standards

The Oregon Statewide Assessment System Technical Report Volume 3: Standard Setting
2
2. OVERVIEW OF OREGON’S ASSESSMENT OF KNOWLEDGE AND
SKILLS (OAKS)
Items on the Knowledge and Skills Tests and Performance Assessments are written to represent the state’s content standards, and tests are composed of items such that the emphasis of the tests matches the emphasis of the content standards. Performance standards define what students must do to meet or exceed Oregon’s Academic Content Standards.
2.1 Statewide Assessment System
The Oregon Statewide Assessment System consists of the Knowledge and Skills Assessments (KSAs), which measure student performance in Math, Reading/Literature, Science, and Social Science via multiple-choice tests aligned to grade-level content standards, and the Writing Performance Assessment which measures student performance in writing via open-ended essay questions.
The KSAs are administered via OAKS Online, a progressive, computer-based system. Students unable to take standard administrations of OAKS Online have other options—side-by-side tests in Spanish and Russian for English Language Learners, Extended Assessments for students with IEP plans, and Braille or Large Print paper-pencil Assessments for students with visual impairments. The tests are used for NCLB accountability and measure student progress. Students are provided the opportunity to demonstrate mastery of the state’s content standards.
Students in grades 3–8 and 10 take the state Reading/Literature and Math KSAs, and students in grades 5, 8, and 10 take the state Science and Social Sciences KSAs. Students in grades 4, 7, and 10 are tested in Writing, using the Performance Assessment. All are state-developed, criterion-referenced tests designed to align to the content standards and measure what students should know and be able to do in each subject and at each grade level.

The Oregon Statewide Assessment System Technical Report Volume 3: Standard Setting
3
Table 1 summarizes the available state tests.
Table 1. Summary of Tests and Testing Options
Testing format Subject Tests TESA Paper and
pencil Language(s) tested Grade levels tested
Reading/Literature KSA English 3–8, 10 Spanish Reading/Literature KSA (Aprenda)
Spanish 3
Mathematics KSA
English Spanish/English Russian/English
3–8, 10
Science KSA
English Spanish/English Russian/English
5, 8, 10
Social Sciences KSA English
Spanish/English 5, 8, 10
Writing PA
English Spanish/English
4, 7, 10
English Language Proficiency Web-based, not OAKS Online
English K–12
Extended Assessment, Reading English 3–8, 10 Extended Assessment, Math English 3–8, 10 Extended Assessment, Writing English 4, 7, 10 Extended Assessment, Science English 5, 8, 10
KSA = Knowledge and Skills Assessment, PA = Performance Assessment. All of the tests and testing options are described below. Additional information describing test development and administration can be found in Volume 2: Test Development and Volume 5: Test Administration. Information about the English Language Proficiency Exam is provided in a separate technical report. All of the technical reports can be downloaded from the Oregon Department of Education website at http://www.ode.state.or.us/search/page/?id=787.
2.2 Academic Content Standards
All of the state tests are designed to measure the grade-level expectations for what students should know and be able to do as described in Oregon’s Academic Content Standards.
In 1996, a panel of national experts reviewed Oregon’s content and performance standards. The panel reported that the standards were rigorous and highlighted the state’s assessment system as a powerful tool to hold students accountable for their learning. Since 1997, Education Week, a national

The Oregon Statewide Assessment System Technical Report Volume 3: Standard Setting
4
education newspaper, has conducted an annual comprehensive review of public education in all 50 states and awarded Oregon high marks for its standards and assessment system each year.
Table 2 provides the dates of most recent adoption and anticipated revision by the State Board of Education for the content standards in each content area.
Table 2. Dates of Adoption for Academic Content Standards
Content area Most recent adoption date Anticipated revision date
English language arts K–3, June 2002
4–8 and High School, January 2003 2012
Mathematics 3-8, March 2007
High School, April 2002 High School, 2009 Science April 2001 2009 Social sciences April 2001 2010 English language proficiency June 2004 2013 Oregon’s Academic Content Standards are available on the Web site via the state’s Searchable Standards Tool that allows you to locate, view, and export standards by subject, grade level (benchmark), and/or strand (subtopic or Score Reporting Category, [SRC]) at http://www.ode.state.or.us/teachlearn/real/standards/
2.3 Academic Achievement Standards
Performance standards were originally set on September 19, 1996. The Oregon State Board of Education adopted the performance standards for grades 3, 5, 8, and 10 in Reading/Literature and Mathematics. Science performance standards for grades 5, 8, and 10 were adopted on October 20, 1999.
Oregon reviewed its performance levels for all grades in the content areas of Math, Reading/Literature, and Science in 2006–07. The State Board of Education reviewed the recommended achievement standards at its meeting January 18 and 19, 2007, and received regular reports on the feedback from the field review and public input prior to adopting the standards in March 2007. Following adoption by the Board, these performance levels were applied to all tests administered during the 2006–2007 school year.
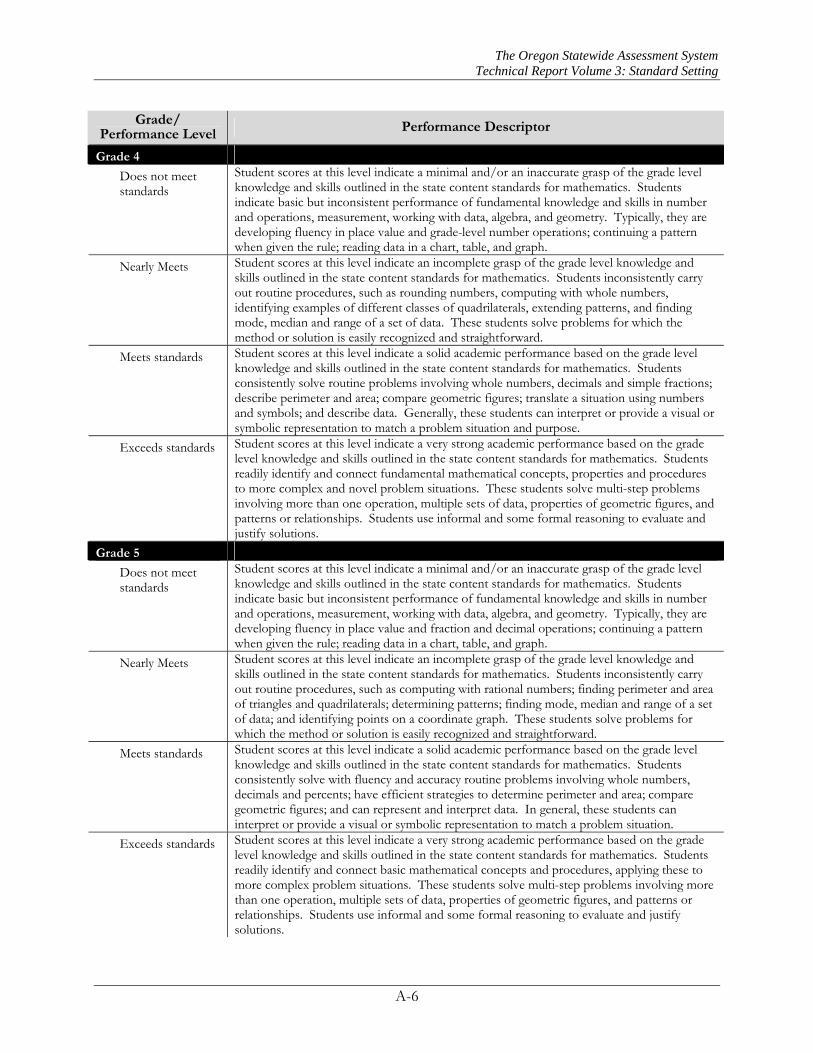
The assessments use four levels of achievement – “Exceeds,” “Meets,” “Nearly Meets,” and “Does Not Yet Meet.” The grade and content specific descriptors for each level are provided in Appendix A.
3. STANDARD SETTING
Standard setting was done separately for Math, Reading/Literature, and Science; the same process was followed across all subjects at grades 3, 5, 8, and high school for Reading/Literature and Mathematics; grades 5, 8, and high school for Science.

The Oregon Statewide Assessment System Technical Report Volume 3: Standard Setting
5
Achievement standards were reestablished in 2006–07 for all subjects following the schedule below.
Table 3. Summary of Standard Setting Panel Meetings, December 2006
Grade (spans) Number of panelists Dates
Reading/Literature 3, 5, 8,and 10 78 December 11-13, 2006 Math 3, 5, 8,and 10 76 December 11-13, 2006 Science 5, 8,and 10 56 December 11-13, 2006 3.1 Goals
The goals of the standard-setting procedure were as follows:
• Establish what students should know and be able to do in terms of the Oregon Academic Content Standards and as measured by the state assessments at each grade, in each subject, and at the “Does Not Yet Meet,” “Nearly Meets,” “Meets,” and “Exceeds” levels.
• Consider impact data describing the implications of proposed cut scores in making judgments about item difficulty and the placement of the bookmarks.
• Consider and assimilate public opinion regarding the appropriateness and feasibility of the standards.
• Provide recommendations to the Oregon State Board of Education on the appropriate placement of the performance levels for each test.
To meet these goals, Oregon stakeholders and educators reviewed each of the tests and recommended cut scores for each of the performance standards. The panel used student impact data, research, and stakeholder input in determining the placement of each cut score.
3.2 Panel Recruitment and Composition
The Department solicited involvement from all levels of the education system and from the community. Over 550 individuals expressed interest in participating. From these, the Department selected 278 to represent the needs and demographics of Oregon students, including geographic region, district size, gender, race/ethnicity, and role in education or the community.
Each panel consisted of 16-20 members organized in 3 groups (tables), including teachers, curriculum specialists, administrators, students, community members, and higher education faculty. Educators set standards in the grade/subject in which they had expertise and the most experience in identifying and determining proficiency. Parents and community/business representatives participated fully with educators on the panels. Participants received reimbursement for travel expenses, and districts received a stipend to cover substitute teacher costs for panelists.
Appendix B describes panel composition for each subject and grade span.

The Oregon Statewide Assessment System Technical Report Volume 3: Standard Setting
6
3.3 Panel Training
Panelists received training to help them understand the content standards and statewide assessment system. Content standards and the test design were explained to and reviewed by each of the panel members so that they were thoroughly familiar with the testing experience of students.
Training Following the presentation by the ODE, Ricardo Mercado, a member of the CTB Standard Setting Team provided an overview of the purpose of standard setting and described the implementation of the BSSP. Participants were introduced to key concepts and key materials of the BSSP, including the Ordered Item Booklet (OIB) and the item map. During this training, it was explained that table leaders would facilitate discussion at their tables and help participants complete tasks in a timely manner. Participants were given a synopsis of each day’s activities. Participants engaged in a brief, mock standard setting using released Grade 4 Mathematics items from the National Assessment of Educational Progress (NAEP). During this mock standard setting, participants reviewed and used the tools of the BSSP, including a sample OIB and item map. Following the mock standard setting, participants were directed to their preassigned, breakout rooms and tables. Each grade and content area was in a separate breakout area.
Target Student Descriptors Prior to the standard setting, the ODE developed achievement-level descriptors for the average student within each of the following achievement levels: Does Not Yet Meet, Nearly Meets, Meets, and Exceeds. Once participants were in their preassigned, breakout rooms, the group leader within each grade and content area facilitated the target student discussion to help participants articulate the achievement levels, with one exception: the Grade 5 Mathematics group leader had participants review the OIB prior to facilitating the discussion of target student descriptors.
A target student is defined as a student whose performance minimally meets the criteria for entry into a particular achievement level, for example, the “just” Meets student. For each grade and content area there were three target student descriptors, one for each cut score (Nearly Meets, Meets, and Exceeds). Participants created descriptors of the target students using the appropriate Oregon standards, the previously developed achievement-level descriptors, and the expectations the participants have of students in the achievement levels. These definitions served as a basis for establishing a common understanding of the type of student that should be considered when setting each cut score on the test. Participants were encouraged to take notes during the target student discussion and were referred to the target student descriptors throughout the standard setting.
Examine the Test Participants examined an operational paper-pencil test for their grade and content area to experience the test from the student’s perspective.
Study Items in the Ordered Item Booklet Participants at each table studied each of the 70 items in the OIB in terms of what each item measures and why it is more difficult than the items preceding it. At each table, one participant,

The Oregon Statewide Assessment System Technical Report Volume 3: Standard Setting
7
denoted as the scribe, recorded the group’s comments about what each item measured. The locations for each item were not included on the item maps during Round 1.
Bookmark Training Prior to setting their Round 1 bookmarks, participants received supplemental training on bookmark placement for the minimally competent student in each achievement level. This training was presented by Christina Schneider, a member of the CTB Standard Setting Team. Participants were instructed to use four tools when placing their bookmarks: the Oregon content standards, the target student descriptors, the achievement-level descriptors, and the content as represented by the items on the test.
Participants were given training materials and three explanations of bookmark placement. The training materials titled “Bookmark Placement” and “Frequently Asked Questions about Bookmark Placement” were read aloud. The first explanation of bookmark placement demonstrated the mechanics: participants were instructed that all items preceding the bookmark define the knowledge, skills, and abilities that a “just” Meets student, for example, is expected to know. The second explanation of bookmark placement was more conceptual in that participants were instructed to examine each item in terms of its content and to make a judgment about the type of content that a student would need to know in order to be considered “just” Meets. The final explanation discussed the relationship between the bookmarks and the scale scores. The participants were tested on their understanding of bookmark placement with a short check set. A listing of the training materials provided to panelists can be found in Bookmark Standard Setting Technical Report 2006 for Reading/Literature and Mathematics Grades 3, 5, 8, and CIM and Science Grades 5, 8, and CIM.
3.4 Method: Bookmarking
To meet the goals listed above, the panel followed the methods of the bookmarking standard-setting procedure (Mitzel, Lewis, Patz, & Green, 2001). The process selected for reestablishing the achievement standards on the statewide assessments in Reading/Literature, Mathematics, Science, and the ELPA consisted of three key phases.
Step 1: The Department establishes and trains a broadly representative panel for each grade and subject area to review test materials and recommend cut scores. To recommend cut scores for each of the performance standards, panels use the following: (1) ordered item booklets (OIBs), (2) impact data, and (3) predictable growth information. Step 2: Explore impact data and seek public input Phase 3: Field review and public input Step 4: Research review
In each subject area, standard-setting panels met for two four-day sessions. Although standard setting was conducted for each content and grade level separately, all panels followed the same procedure. Below, we describe the standard-setting procedures for each step in detail. Outcomes are provided for each of the content areas and grades in Appendices F, G, and H for

The Oregon Statewide Assessment System Technical Report Volume 3: Standard Setting
8
Reading/Literature, Math and Science. ELPA results are provided in a separate ELPA Program Technical Report.
3.4.1 Step 1: Setting the Bookmarks
Details regarding the standard setting process can be found in The Oregon 2006 Academic Standard Setting Documentation http://www.ode.state.or.us/search/page/?id=920. The following is a brief overview:
To familiarize panelists with the assessment system and reiterate the goals of the process, the meetings began with a review of the content standards, assessments, and current performance standards. The review included the critical knowledge for all students in each subject and at each grade as determined by the content standards and examples of how that knowledge might be described and measured on tests.
These descriptions are the Performance-Level Descriptors (PLDs) provided in Appendix A.
Round 1 Bookmark Placement Once participants demonstrated that they understood how to place their bookmarks through the check set, they placed bookmarks in the following order: Meets, Exceeds, and Nearly Meets. Participants were instructed that bookmark placement is always an individual activity.
Prior to placement of the Round 1 bookmarks, the group leaders displayed an overhead transparency of the bookmarks that represented the existing cut scores for the Oregon Statewide Assessments. Participants were asked whether the existing cut scores reasonably represented the break in skills among the achievement levels that participants determined in their review of the items. If the existing cut scores reasonably represented the break of skills, participants were instructed that they could keep the existing bookmarks. If the current bookmarks did not reasonably represent the change in skills, participants were instructed to place their bookmarks on new pages in their OIBs.
Participants placed their Round 1 bookmarks for Nearly Meets, Meets, and Exceeds, while keeping in mind the Oregon content standards, the target student descriptors, the achievement-level descriptors, and the content as represented by the items on the test.
Round 2 Bookmark Placement In each grade and content area, the table leader at each table facilitated a discussion of all the bookmark placements for the table. Participants were encouraged to focus on the differences among their bookmarks by discussing the items between the lowest and highest bookmarks at their table.
Participants were then directed back to their OIBs and item maps to continue content-based discussions. At this point, table leaders were each given a copy of the item map that included the location of each item in the OIB. After discussion, participants were reminded to place their bookmarks independently.
Round 3 Bookmark Placement Participants received feedback based on their Round 2 bookmark placements from a member of the CTB Standard Setting Team in collaboration with an ODE representative. On an overhead

The Oregon Statewide Assessment System Technical Report Volume 3: Standard Setting
9
transparency, participants were shown the median bookmark placement for each achievement level for each table as well as the medians for their grade and content area. In addition, participants were shown impact data based on the median Round 2 bookmarks. Impact data was defined for participants as the percentages of students who would be classified in each achievement level based on the median bookmarks. CTB staff answered process-related questions, and the ODE staff answered all policy-related questions concerning the impact data. It was emphasized to the participants that the impact data were being presented as a “reality check.”
During this portion of the standard setting, a fire alarm went off in the hotel in which the workshop was located. After a brief evacuation, the workshop resumed.
After the presentation of Round 2 results, participants discussed the rationale of their bookmark placement across tables within their grade and content area. The group leader facilitated the discussion among all participants. After the discussion, participants were instructed to place their bookmarks independently for the final time.
Round 3 Results Participants received feedback based on their final bookmark placements from a member of the CTB Standard Setting Team in collaboration with an ODE representative. On an overhead transparency, participants were shown the median bookmarks for each table as well as the medians for their grade and content area and the impact data based on the median Round 3 (final) bookmarks. In addition, participants were shown the impact data for all grades within their content areas as an introduction to the cross-grade discussion. If necessary, the panels would have been allowed a fourth round of voting had they expressed a pervasive dissatisfaction with their recommended cut-scores. Table 4 displays the median recommendations from the panels based on their 3rd round of votes.

The Oregon Statewide Assessment System Technical Report Volume 3: Standard Setting
10
Table 4. Summary of Standard Setting Panel Meetings after Round 3, December 2006
Math Reading/Literature Science
Grade 3 N/A Does not yet meet 200 and lower 198 and lower N/A Nearly Meets 201-203 199-202 N/A Meets 204-214 203-215 N/A Exceeds 215 and higher 216 and higher N/A
Grade 5 Does not yet meet 213 and lower 208 and lower 215 and lower Nearly Meets 214-217 209-217 216-224 Meets 218-229 218-229 225-237 Exceeds 230 and higher 230 and higher 238 and higher
Grade 8 Does not yet meet 224 and lower 223 and lower 228 and lower Nearly Meets 225-229 224-229 229-233 Meets 230-240 230-240 234-245 Exceeds 241 and higher 241 and higher 246 and higher
Grade 10 Does not yet meet 230 and lower 230 and lower 234 and lower Nearly Meets 231-235 231-235 235-239 Meets 236-245 236-247 240-249 Exceeds 246 and higher 248 and higher 249 and higher
Once all grade panels for each content area in Mathematics and Reading/Literature completed Round 3, CTB interpolated the cut scores for the off-grades (Grades 4, 6, and 7) using the quadratic curve of best fit as the interpolation method. This policy model was specified a priori by the ODE. Historically, the percentage of students classified as Meets or above on the Oregon Statewide Assessments has followed a declining quadratic trend when tracked across grades.
Table leaders from each panel were brought together to examine the cut scores and associated impact data determined for the off-grades by interpolation. The purpose of this smoothing discussion was to establish a system of cut scores that was well articulated and, at the same time, considerate of the participants’ original recommendations. A representative from the ODE was present during these discussions to answer policy-related questions.
Table leaders made various adjustments to the cut scores to promote cross-grade articulation. These changes were all small (two scale score points or less). In Grade 3 Reading, table leaders recommended increasing the Exceeds cut score by two scale score points to bring the percentage of students classified as Exceeds in that grade more consistent with the percentages in Grades 4 and 5. Table leaders in Grades 5 and 8 Reading recommended decreasing the Exceeds cut score by two scale score points in Grade 7, using similar reasoning. Table leaders in Grade 3 recommended a one-point increase in the Meets cut score, after informal consultation with their participants, to bring the percentage of students classified as Meets in that grade more in line with the percentages of the other grades, and to increase the number of students classified as Nearly Meets in that grade. Grade

The Oregon Statewide Assessment System Technical Report Volume 3: Standard Setting
11
8 table leaders recommended a one-point increase in the Meets cut score at that grade for similar reasons. Table leaders in Reading did not recommend any changes to the Nearly Meets cut scores.
In Mathematics, table leaders in Grade 3 recommended a two-point increase in the Exceeds cut score in that grade, as well as a one-point increase in the Exceeds cut score for Grade 4, in order to make the percentage of students classified as Exceeds more consistent with the percentages in other grades. Table leaders in Grade 5 concurred and recommended a one point reduction in the Exceeds cut score of that grade, and they recommended, in collaboration with Grade 8, a one-point decrease in the Exceeds cut scores of Grades 6 and 7.
Grade 3 table leaders also recommended a one-point increase in the Meets cut score for that grade to promote better articulation with Grades 4 and 5. Table leaders in Grade 5 recommended a one-point increase in the Meets cut score for Grade 6 to promote better articulation with surrounding grades. Grade 5 table leaders also recommended a one-point increase in the Nearly Meets cut score for Grade 6 for the same reason.
At the time of the cross-grade articulation discussion, Science table leaders reported that they and their participants were satisfied with their recommended cut scores, and that the impact data associated with their cut scores were reasonable. Science table leaders recommended no changes to their cut scores.
At the conclusion of the cross-grade articulation discussion, all table leaders were asked to review their recommended cut scores in their ordered item booklets and item maps. Specifically, table leaders were asked to verify that the changes that they recommended during the cross-grade articulation discussion were reasonable when compared to the content of the assessments. All table leaders reported that their recommended cut scores were reasonable when compared to the content of the assessments.
The Oregon Statewide Assessment System Technical Report Volume 3: Standard Setting
12
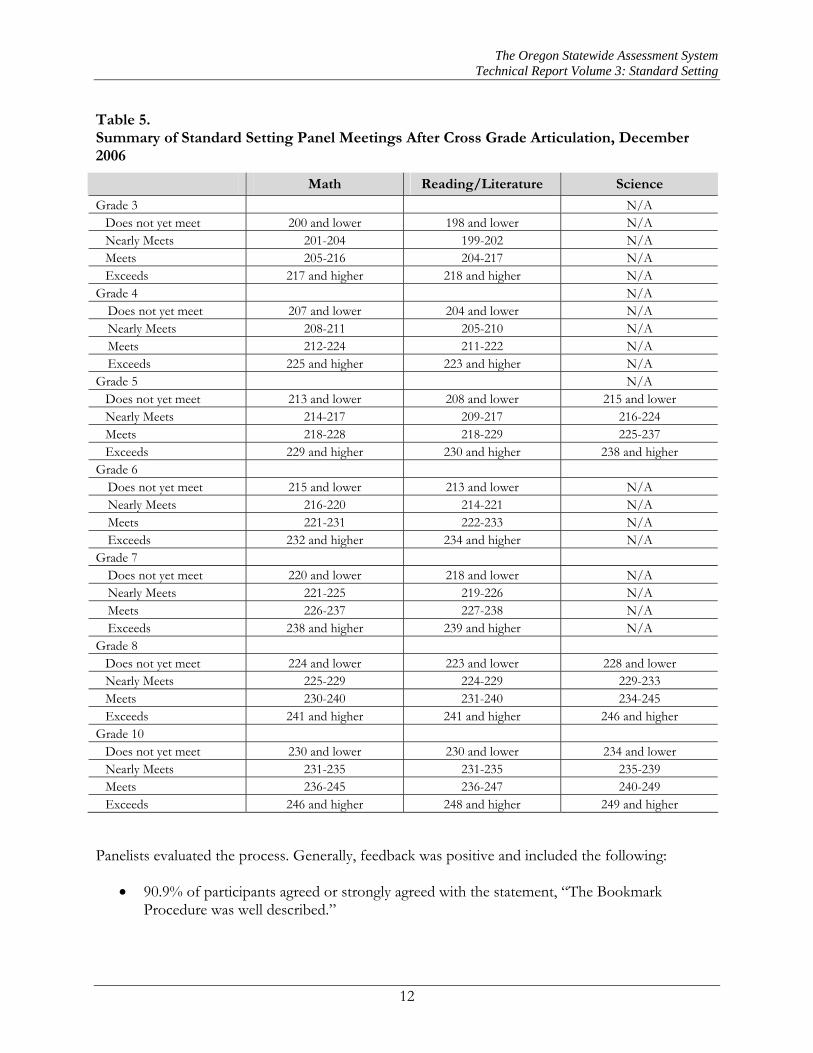
Table 5. Summary of Standard Setting Panel Meetings After Cross Grade Articulation, December 2006
Math Reading/Literature Science
Grade 3 N/A Does not yet meet 200 and lower 198 and lower N/A Nearly Meets 201-204 199-202 N/A Meets 205-216 204-217 N/A Exceeds 217 and higher 218 and higher N/A
Grade 4 N/A Does not yet meet 207 and lower 204 and lower N/A Nearly Meets 208-211 205-210 N/A Meets 212-224 211-222 N/A Exceeds 225 and higher 223 and higher N/A
Grade 5 N/A Does not yet meet 213 and lower 208 and lower 215 and lower Nearly Meets 214-217 209-217 216-224 Meets 218-228 218-229 225-237 Exceeds 229 and higher 230 and higher 238 and higher
Grade 6 Does not yet meet 215 and lower 213 and lower N/A Nearly Meets 216-220 214-221 N/A Meets 221-231 222-233 N/A Exceeds 232 and higher 234 and higher N/A
Grade 7 Does not yet meet 220 and lower 218 and lower N/A Nearly Meets 221-225 219-226 N/A Meets 226-237 227-238 N/A Exceeds 238 and higher 239 and higher N/A
Grade 8 Does not yet meet 224 and lower 223 and lower 228 and lower Nearly Meets 225-229 224-229 229-233 Meets 230-240 231-240 234-245 Exceeds 241 and higher 241 and higher 246 and higher
Grade 10 Does not yet meet 230 and lower 230 and lower 234 and lower Nearly Meets 231-235 231-235 235-239 Meets 236-245 236-247 240-249 Exceeds 246 and higher 248 and higher 249 and higher
Panelists evaluated the process. Generally, feedback was positive and included the following:
• 90.9% of participants agreed or strongly agreed with the statement, “The Bookmark Procedure was well described.”

The Oregon Statewide Assessment System Technical Report Volume 3: Standard Setting
13
• 87.6% of participants agreed or strongly agreed with the statement, “The training materials were helpful.”
• 83.1% of participants agreed or strongly agreed with the statement, “Overall, I am satisfied with my group's final bookmarks.”
• 94.7% of participants agreed or strongly agreed with the statement, “Overall, I valued the conference as a professional development experience.”
Details regarding the participants’ evaluation of the standard setting process can be found in The Oregon 2006 Academic Standard Setting Documentation.
3.4.2 Step 2: Impact Data and Regional Meetings with the Public
After the panels proposed the initial drafts of the performance standards, a two-stage field review was conducted. Regional meetings with educators and members of the community were held in January and February, 2007. There were two sessions held each day. The late afternoon session was targeted to educators and the early evening session was target to the members of the community. Attendees of the regional meetings provided feedback about the appropriateness and feasibility of the standards. Additionally, the Department of Education posted a video on the web that gave an overview of the process and outcome of the standard setting session. The web page contained a brief survey to collect comments that people might have after viewing the video.
Participants in the standards setting conference on cut score placement in Portland, December 11-13, 2006 involved 276 participants representing 29 counties and 74 school districts. From these participants we received the following input.
Table 6: Feedback from standards setting conference attendees.
Content Area % Strongly Agree or Agree with the results of the session and the value of the experience
Reading teams 83% Math teams 88% Science teams 83% Overall average 85%
Additionally, public hearings were held at 15 sites statewide— at Multnomah ESD, Portland Public Schools, Willamette ESD, Salem Public Library, Douglas ESD, Umatilla-Morrow ESD, Hermiston Public Schools, Redmond School District, High Desert ESD, the COSA Conference at Salishan, Southern Oregon ESD, Lane Co ESD, Wy’East Admin, the Oregon Reading Conference, and Malheur ESD. Across all hearings, 246 individuals participated. 91% were very confident or fairly confident that the process appropriately placed the cut scores. Among on-line respondents 62% were confident or better, the absence of any discussion opportunities, that the process was appropriately undertaken.
Among those expressing concerns across the state, there was a high level of confidence in the process for identifying cut scores. Elementary school representatives were concerned about how these new standards might affect schools currently in failing category on AYP and schools with high

The Oregon Statewide Assessment System Technical Report Volume 3: Standard Setting
14
achieving levels that may drop from their current successes. Those from secondary schools suggested that even though they supported change in cut scores at high school, there was a concern that the public would perceive that high school is lowering performance standards. In addition, there was an increasing interest at the high school level, in line with the ending of CIM, to test students in 10th-12th grades, after they have completed the requisite content.
There was a ubiquitous assertion that ODE must have a strong communication process for the public regarding change in cut scores and the impact of those changes on AYP. Similarly, many expressed the opinion that ODE should provide a comparison with past achievement levels to demonstrate that students are continuing to make academic progress.
3.4.3 Step 3: Research Review
With data from students who had been tested using Oregon’s statewide assessments, the impact of the cut scores was reviewed. Students who were at the “meets” level in grade 8 were compared to how they had scored in grades 3 and 5 and 10. Previously, this work resulted in increasing the spread for grade 3 Reading/Literature and Mathematics standards, while all other benchmark standards remained the same for the two content areas.
Appendix G summarizes data used in the Impact and Review Step.
4. FORMAL ADOPTION OF CHALLENGING ACADEMIC CONTENT
STANDARDS
Finally, the State Board of Education held a formal hearing to address the reestablishment of the performance standards; during this hearing, Board members reviewed the draft performance standards and received the report of a panel of national experts.

The Oregon Statewide Assessment System Technical Report Volume 3: Standard Setting
15
5. FINAL CUT SCORES
The final Board-approved cut scores are available on the Department’s Web site at http://www.ode.state.or.us/search/results/?id=223 and are described below.
Table 7. Final Cut Scores
Math Reading/Literature Science Grade 3
Very Low below 190 below 189 N/A Low 190-200 189-198 N/A Nearly Meets 201 – 204 199 – 203 N/A Meets 205 – 216 204 – 217 N/A Exceeds 217 & above 218 & above N/A
Grade 4 Very Low below 198 below 198 N/A Low 198-207 198-204 N/A Nearly Meets 208 – 211 205 – 210 N/A Meets 212 – 224 211 – 222 N/A Exceeds 225 & above 223 & above N/A
Grade 5 Very Low below 203 below 202 below 209 Low 203-213 202-208 209-215 Nearly Meets 214 – 217 209 – 217 216 – 224 Meets 218 – 228 218 – 229 225 – 237 Exceeds 229 & above 230 & above 238 & above
Grade 6 Very Low below 207 below 207 N/A Low 207-215 207-213 N/A Nearly Meets 216 – 220 214 – 221 N/A Meets 221 – 231 222 – 233 N/A Exceeds 232 & above 234 & above N/A
Grade 7 Very Low below 211 below 211 N/A Low 211-220 211-218 N/A Nearly Meets 221 – 225 219 – 226 N/A Meets 226 – 237 227 – 238 N/A Exceeds 238 & above 239 & above N/A
Grade 8 Very Low below 213 below 213 below 217 Low 213-224 213-223 217-228 Nearly Meets 225 – 229 224 – 230 229 – 233 Meets 230 – 240 231 – 240 234 – 245 Exceeds 241 & above 241 & above 246 & above
Grade 10 Very Low below 214 below 217 below 220 Low 214-230 217-230 220-234 Nearly Meets 231 – 235 231 – 235 235 – 239 Meets 236 – 245 236 – 247 240 – 248 Exceeds 246 & above 248 & above 249 & above

The Oregon Statewide Assessment System Technical Report Volume 3: Standard Setting
A-1
APPENDIX A PERFORMANCE-LEVEL DESCRIPTORS

The Oregon Statewide Assessment System Technical Report Volume 3: Standard Setting
A-2
Table A.1. Performance-Level Descriptors for Reading/Literature
Grade Performance Descriptor
Grade 3 Does not meet standards
Student scores at this level indicate a minimal and/or inaccurate grasp of the grade level knowledge and skills outlined in the content standards for Reading/Literature. Students have a limited comprehension of the literal meaning of text and grade-level vocabulary, which prevents them from making meaningful interpretations or recognizing implied ideas. They are unable to recognize cause and effect relationships and the presence of opinions in text.
Nearly Meets Student scores at this level indicate an incomplete grasp of the grade level knowledge and skills outlined in the state content standards for Reading/Literature. Students may comprehend the literal meaning of text and grade-level vocabulary, but inconsistently interpret the meaning of implied or unstated ideas and concepts. They struggle to recognize cause and effect relationships and the presence of opinions.
Meets standards Student scores at this level indicate a solid academic performance based on the grade level knowledge and skills outlined in the state content standards for Reading/Literature. Students who score at this level demonstrate an accurate [accurate denotes “on target, right” feel word choice isn’t in line with other descriptors. Possible adequate, functional or delete it.] comprehension of grade-level text and use context to make meaning of unfamiliar vocabulary. They recognize directly-stated problems and solutions and interpret text to determine themes and messages. They make accurate predictions based on textual evidence, and can identify directly-stated cause and effect relationships and opinions. They can draw conclusions about character traits and actions.
Exceeds standards
Student scores at this level indicate a very strong academic performance based on the grade level knowledge and skills outlined in the state content standards for Reading/Literature. Students have a strong comprehension of complex texts. They effectively use context clues to interpret challenging vocabulary and analyze text to determine problems, solutions, themes and messages. They make predictions based on textual evidence, identify implicit cause and effect relationships and can differentiate between facts and opinions.
Grade 4 Does not meet standards
Student scores at this level indicate a minimal and/or inaccurate grasp of the grade level knowledge and skills outlined in the content standards for Reading/Literature. Students may be able to answer literal comprehension questions based on the text, but are unable to infer or recognize implied ideas. A limited comprehension of text prevents any sort of analysis of its purpose.
Nearly Meets Student scores at this level indicate an incomplete grasp of the grade level knowledge and skills outlined in the state content standards for Reading/Literature. Students may comprehend the literal meaning of text and grade-level vocabulary, but inconsistently interpret the meaning of implied or unstated ideas and concepts. They can sometimes identify an author’s main purpose, but lack the skills to recognize instances of persuasion in informational text.
Meets standards Student scores at this level indicate a solid academic performance based on the grade level knowledge and skills outlined in the state content standards for Reading/Literature. These students have an accurate comprehension of grade-level text and use context to make meaning of unfamiliar vocabulary. They interpret text to determine themes and messages, analyze characters, and make accurate predictions based on textual evidence. They can identify the author’s purpose and the presence of persuasion in informational text.
Exceeds standards
Student scores at this level indicate a very strong academic performance based on the grade level knowledge and skills outlined in the state content standards for Reading/Literature. Students have a strong comprehension of complex text. They effectively use context clues to interpret challenging vocabulary and analyze text to determine themes and messages. They make predictions based on textual evidence, trace the development of ideas and plot in nonlinear text, and analyze characters’ actions and motivations. They can identify elements of persuasion and cause and effect relationships in informational text and analyze its features to support comprehension.

The Oregon Statewide Assessment System Technical Report Volume 3: Standard Setting
A-3
Grade Performance Descriptor
Grade 5 Does not meet standards
Student scores at this level indicate a minimal and/or inaccurate grasp of the grade level knowledge and skills outlined in the content standards for Reading/Literature. Students have a limited comprehension of the literal meaning of text and grade-level vocabulary which prevents them from making meaningful interpretations or recognizing implied ideas. A limited recognition of text elements and devices prevents them from meaningfully analyzing text.
Nearly Meets Student scores at this level indicate an incomplete grasp of the grade level knowledge and skills outlined in the state content standards for Reading/Literature. Students may comprehend the literal meaning of text and grade-level vocabulary, but inconsistently interpret the meaning of implied or unstated ideas and concepts. They can sometimes identify an author’s main purpose, but lack the skills to recognize instances of persuasion in informational text, or how the author uses devices to enhance literary text.
Meets standards Student scores at this level indicate a solid academic performance based on the grade level knowledge and skills outlined in the state content standards for Reading/Literature. Students have an accurate comprehension of grade-level text and use context to make meaning of unfamiliar vocabulary. They interpret text to determine themes and messages, analyze characterization, and make accurate predictions. They can identify the author’s purpose and the effect of elements and devices commonly used in literary text.
Exceeds standards
Student scores at this level indicate a very strong academic performance based on the grade level knowledge and skills outlined in the state content standards for Reading/Literature. Students comprehend text at or above their grade level of enrollment. They effectively use context clues to interpret challenging vocabulary and analyze text for complex themes and messages. They make insightful predictions based on foreshadowing clues, analyze characterization, and thoughtfully evaluate the author’s use of devices in literary text and elements of persuasion in informative text.
Grade 6 Does not meet standards
Student scores at this level indicate a minimal and/or inaccurate grasp of the grade level knowledge and skills outlined in the content standards for Reading/Literature. Students have a limited comprehension of the literal meaning of text and grade-level vocabulary which prevents them from making meaningful interpretations or recognizing implied ideas. A limited recognition of text elements and devices prevents them from meaningfully analyzing text.
Nearly Meets Student scores at this level indicate an incomplete grasp of the grade level knowledge and skills outlined in the state content standards for Reading/Literature. Students may comprehend the literal meaning of text and grade-level vocabulary, but inconsistently interpret the meaning of implied or unstated ideas and concepts. They can sometimes identify an author’s main purpose, but are unable to recognize how the author uses devices to enhance literary text.
Meets standards Student scores at this level indicate a solid academic performance based on the grade level knowledge and skills outlined in the state content standards for Reading/Literature. Students have an accurate comprehension of grade-level text and use context to make meaning of unfamiliar vocabulary. They interpret text to determine themes and messages, analyze characterization, and make accurate predictions. They can identify the author’s purpose and the effect of elements and devices commonly used in literary text.
Exceeds standards
Student scores at this level indicate a very strong academic performance based on the grade level knowledge and skills outlined in the state content standards for Reading/Literature. Students accurately comprehend text at or above their grade level of enrollment. They effectively use context clues to interpret challenging vocabulary and analyze text for complex themes and messages. They make insightful predictions, analyze characterization, and thoughtfully evaluate the author’s use of devices and structural elements.

The Oregon Statewide Assessment System Technical Report Volume 3: Standard Setting
A-4
Grade Performance Descriptor
Grade 7 Does not meet standards
Student scores at this level indicate a minimal and/or inaccurate grasp of the grade level knowledge and skills outlined in the content standards for Reading/Literature. Students have a limited comprehension of the literal meaning of text and grade-level vocabulary which prevents them from making meaningful interpretations or recognizing implied ideas. A limited knowledge of text structures, elements, and devices prevents them from meaningfully analyzing text.
Nearly Meets Student scores at this level indicate an incomplete grasp of the grade level knowledge and skills outlined in the state content standards for Reading/Literature. Students may comprehend the literal meaning of text and grade-level vocabulary, but inconsistently recognize implied or unstated ideas and concepts. They can sometimes identify an author’s main purpose, but lack the skills to recognize or analyze structural elements and how the author uses devices to enhance literary text.
Meets standards Student scores at this level indicate a solid academic performance based on the grade level knowledge and skills outlined in the state content standards for Reading/Literature. Students have an accurate comprehension of grade-level text, including unfamiliar vocabulary, and can analyze information to form conclusions. They interpret text to determine themes and messages, make accurate predictions, and can identify the effect of an author’s use of structural elements and common literary elements and devices.
Exceeds standards
Student scores at this level indicate a strong academic performance based on the grade level knowledge and skills outlined in the state content standards for Reading/Literature. Students comprehend text at or beyond their grade level of enrollment. They have the ability to use multiple strategies to decipher unfamiliar vocabulary and analyze text for complex themes and messages. They make insightful predictions, analyze characterization, and thoughtfully evaluate the author’s use of devices and structural elements.
Grade 8 Does not meet standards
Student scores at this level indicate a minimal and/or inaccurate grasp of the grade level knowledge and skills outlined in the content standards for Reading/Literature. Students have a limited comprehension of the literal meaning of text and grade-level vocabulary which prevents them from making meaningful interpretations or recognizing implied ideas. A limited knowledge of text structures, elements and devices prevents them from meaningfully analyzing text.
Nearly Meets Student scores at this level indicate an incomplete grasp of the grade level knowledge and skills outlined in the state content standards for Reading/Literature. Students may comprehend the literal meaning of text and grade-level vocabulary, but inconsistently recognize implied or unstated ideas and concepts. They can sometimes identify an author’s main purpose, but lack the skills to analyze how text is supported, its structural elements, and how the author uses devices to develop literary text.
Meets standards Student scores at this level indicate a solid academic performance based on the grade level knowledge and skills outlined in the state content standards for Reading/Literature. Students have an accurate comprehension of grade-level text, including unfamiliar vocabulary, and can synthesize information to form conclusions. They interpret text to determine themes and messages, make accurate predictions, and can identify an author’s reasons for structural decisions and the use of common literary elements and devices.
Exceeds standards
Student scores at this level indicate a strong academic performance based on the grade level knowledge and skills outlined in the state content standards for Reading/Literature. Students have a strong comprehension of different types of text. They can interpret idioms and figurative expressions, and can synthesize information found in various parts of text. They analyze text for complex themes and messages, make insightful predictions, and thoughtfully evaluate the author’s craft and textual support.

The Oregon Statewide Assessment System Technical Report Volume 3: Standard Setting
A-5
Grade Performance Descriptor
Grade 10 Does not meet standards
Student scores at this level indicate a minimal and/or inaccurate grasp of the grade level knowledge and skills outlined in the content standards for Reading/Literature. Students have limited comprehension of the literal meaning of text and grade-level vocabulary which prevents them from making meaningful interpretations or recognizing implicit ideas. Limited knowledge of text structures, elements and devices prevents them from meaningfully analyzing text.
Nearly Meets Student scores at this level indicate an incomplete grasp of the grade level knowledge and skills outlined in the state content standards for Reading/Literature. Students may comprehend the literal meaning of text and grade-level vocabulary, but inconsistently recognize implicit or subtle meanings or themes. They can sometimes identify an author’s main purpose but lack the skills to analyze textual support, structural elements, and the author’s use of devices to enrich text.
Meets standards Student scores at this level indicate a solid academic performance based on the grade level knowledge and skills outlined in the state content standards for Reading/Literature. Students have an accurate comprehension of grade-level text, including unfamiliar vocabulary. They interpret text to determine themes and messages; make accurate predictions; and can identify the author’s purpose, reasons for structural choices; and the effects of common literary elements and devices.
Exceeds standards
Student scores at this level indicate a very strong academic performance based on the grade level knowledge and skills outlined in the state content standards for Reading/Literature. Students have a thorough comprehension of text, including complex vocabulary, beyond High School level expectations. They analyze text for subtle themes and messages, make insightful predictions, and effectively evaluate the author’s purpose, structural choices, and craft.
Table A.2. Performance-Level Descriptors for Mathematics
Grade/ Performance Level Performance Descriptor
Grade 3
Does not meet standards
Student scores at this level indicate a minimal and/or an inaccurate grasp of the grade level knowledge and skills outlined in the state content standards for mathematics. Students indicate basic but inconsistent performance of skills in number and operations, measurement, working with data, algebra and geometry. Typically, these students are developing fluency in place value and basic number operations; fitting an unknown into a pattern when given the rule; reading data in a chart, table, and graph.
Nearly Meets Student scores at this level indicate an incomplete grasp of the grade level knowledge and skills outlined in the state content standards for mathematics. Students occasionally carry out routine procedures, such as computing with whole numbers, identifying examples of different 2 and 3-dimensional shapes, extending patterns, and reading sets of data. These students solve problems for which the method or solution is straightforward.
Meets standards Student scores at this level indicate a solid academic performance based on the grade level knowledge and skills outlined in the state content standards for mathematics. Students consistently solve routine problems involving whole numbers and simple fractions, compare geometric figures, and describe data. In general, these students can interpret or provide a visual representation to match a problem situation.
Exceeds standards Student scores at this level indicate a very strong academic performance based on the grade level knowledge and skills outlined in the state content standards for mathematics. Students readily identify and connect basic mathematical concepts and procedures to more complex and novel problem situations. These students solve problems involving one operation, sets of data, properties of geometric figures, and patterns or relationships. Students use logical reasoning to draw conclusions.
The Oregon Statewide Assessment System Technical Report Volume 3: Standard Setting
A-6
Grade/ Performance Level Performance Descriptor
Grade 4
Does not meet standards
Student scores at this level indicate a minimal and/or an inaccurate grasp of the grade level knowledge and skills outlined in the state content standards for mathematics. Students indicate basic but inconsistent performance of fundamental knowledge and skills in number and operations, measurement, working with data, algebra, and geometry. Typically, they are developing fluency in place value and grade-level number operations; continuing a pattern when given the rule; reading data in a chart, table, and graph.
Nearly Meets Student scores at this level indicate an incomplete grasp of the grade level knowledge and skills outlined in the state content standards for mathematics. Students inconsistently carry out routine procedures, such as rounding numbers, computing with whole numbers, identifying examples of different classes of quadrilaterals, extending patterns, and finding mode, median and range of a set of data. These students solve problems for which the method or solution is easily recognized and straightforward.
Meets standards Student scores at this level indicate a solid academic performance based on the grade level knowledge and skills outlined in the state content standards for mathematics. Students consistently solve routine problems involving whole numbers, decimals and simple fractions; describe perimeter and area; compare geometric figures; translate a situation using numbers and symbols; and describe data. Generally, these students can interpret or provide a visual or symbolic representation to match a problem situation and purpose.
Exceeds standards Student scores at this level indicate a very strong academic performance based on the grade level knowledge and skills outlined in the state content standards for mathematics. Students readily identify and connect fundamental mathematical concepts, properties and procedures to more complex and novel problem situations. These students solve multi-step problems involving more than one operation, multiple sets of data, properties of geometric figures, and patterns or relationships. Students use informal and some formal reasoning to evaluate and justify solutions.
Grade 5
Does not meet standards
Student scores at this level indicate a minimal and/or an inaccurate grasp of the grade level knowledge and skills outlined in the state content standards for mathematics. Students indicate basic but inconsistent performance of fundamental knowledge and skills in number and operations, measurement, working with data, algebra, and geometry. Typically, they are developing fluency in place value and fraction and decimal operations; continuing a pattern when given the rule; reading data in a chart, table, and graph.
Nearly Meets Student scores at this level indicate an incomplete grasp of the grade level knowledge and skills outlined in the state content standards for mathematics. Students inconsistently carry out routine procedures, such as computing with rational numbers; finding perimeter and area of triangles and quadrilaterals; determining patterns; finding mode, median and range of a set of data; and identifying points on a coordinate graph. These students solve problems for which the method or solution is easily recognized and straightforward.
Meets standards Student scores at this level indicate a solid academic performance based on the grade level knowledge and skills outlined in the state content standards for mathematics. Students consistently solve with fluency and accuracy routine problems involving whole numbers, decimals and percents; have efficient strategies to determine perimeter and area; compare geometric figures; and can represent and interpret data. In general, these students can interpret or provide a visual or symbolic representation to match a problem situation.
Exceeds standards Student scores at this level indicate a very strong academic performance based on the grade level knowledge and skills outlined in the state content standards for mathematics. Students readily identify and connect basic mathematical concepts and procedures, applying these to more complex problem situations. These students solve multi-step problems involving more than one operation, multiple sets of data, properties of geometric figures, and patterns or relationships. Students use informal and some formal reasoning to evaluate and justify solutions.

The Oregon Statewide Assessment System Technical Report Volume 3: Standard Setting
A-7
Grade/ Performance Level Performance Descriptor
Grade 6
Does not meet standards
Student scores at this level indicate a minimal and/or an inaccurate grasp of the grade level knowledge and skills outlined in the state content standards for mathematics. Students indicate basic but inconsistent performance of fundamental knowledge and skills in number and operations, measurement, working with data, algebra and geometry. Typically, they are developing fluency in place value and grade-level number operations; continuing a pattern when given the rule; and reading data in a chart, table, and graph.
Nearly Meets Student scores at this level indicate an incomplete grasp of the grade level knowledge and skills outlined in the state content standards for mathematics. Students inconsistently carry out routine procedures, such as computing with fractions, finding perimeter and area of polygons, extending patterns and predicting probabilities. These students solve problems for which the method or solution is easily recognized and straightforward.
Meets standards Student scores at this level indicate a solid academic performance based on the grade level knowledge and skills outlined in the state content standards for mathematics. Students consistently solve routine problems involving whole numbers, decimals, and simple fractions with fluency and accuracy. They find perimeter and area of polygons, write an equation to describe a situation, compare geometric figures, and describe and use data. In general, these students can interpret or provide a visual or symbolic representation to match a problem situation.
Exceeds standards Student scores at this level indicate a very strong academic performance based on the grade level knowledge and skills outlined in the state content standards for mathematics. Students readily identify and connect fundamental mathematical concepts, properties and procedures to more complex and novel problem situations. These students use rational numbers to solve multi-step problems, predict theoretical probabilities, define algebraic relationships, and apply side and angle properties of geometric figures. Students use informal and some formal reasoning to evaluate and justify solutions.
Grade 7
Does not meet standards
Student scores at this level indicate a minimal and/or an inaccurate grasp of the grade level knowledge and skills outlined in the state content standards for mathematics. Students indicate basic but inconsistent performance of fundamental knowledge and skills in number and operations, measurement, working with data, algebra and geometry. Typically, they are developing fluency in place value and grade-level number operations; continuing a pattern when given the rule; reading data in a chart, table, graph, and tree diagrams.
Nearly Meets Student scores at this level indicate an incomplete grasp of the grade level knowledge and skills outlined in the state content standards for mathematics. Students inconsistently carry out routine procedures, sometimes requiring guidance for tasks such as prime factorization, evaluating how data added to a set of data affect measures of central tendency, and identifying properties of figures on a coordinate graph. These students can solve problems for which the method or solution is easily recognized and straightforward.
Meets standards Student scores at this level indicate a solid academic performance based on the grade level knowledge and skills outlined in the state content standards for mathematics. Students consistently solve routine problems applying mathematical properties of rational numbers; interpret algebraic equations; and interpret data using frequency distribution tables, box-and-whisker plots, stem-and-leaf plots, and line graphs. In general, these students can interpret or provide a visual or symbolic representation to match a problem situation and purpose.
Exceeds standards Student scores at this level indicate a very strong academic performance based on the grade level knowledge and skills outlined in the state content standards for mathematics. Students readily identify and connect fundamental mathematical concepts, properties, and procedures, to more complex and novel problem situations. These students use known objects to estimate surface area and volume, compute experimental and theoretical probabilities for single and compound events, and determine the image of a point on a graph under translations and reflections. Students use informal and some formal reasoning to evaluate and justify solutions.

The Oregon Statewide Assessment System Technical Report Volume 3: Standard Setting
A-8
Grade/ Performance Level Performance Descriptor
Grade 8
Does not meet standards
Student scores at this level indicate a minimal and/or an inaccurate grasp of the grade level knowledge and skills outlined in the state content standards for mathematics. Students indicate basic but inconsistent performance of fundamental knowledge and skills in number and operations, measurement, working with data, algebra and geometry. Typically, these students are developing fluency in application of powers, coordinate geometry, calculating missing geometric measurements, and predicting and reporting outcomes of probabilities.
Nearly Meets Student scores at this level indicate an incomplete grasp of the grade level knowledge and skills outlined in the state content standards for mathematics. Students recall and recognize mathematical concepts, terms and properties, yet are inconsistent in application. They inconsistently carry out routine procedures, such as writing numbers in scientific notation, solving equations, reading graphs, and using formulas to find areas and volumes. Students solve problems for which the method or solution is easily recognized and straightforward.
Meets standards Student scores at this level indicate a solid academic performance based on the grade level knowledge and skills outlined in the state content standards for mathematics. Students at this level consistently apply mathematical concepts, terms and properties to problem situations. Students readily solve problems involving rational numbers, proportions and percents, similar figures, algebraic representations, and interpreting probability and data. In general these students can interpret or provide a visual or symbolic representation to match a problem situation and purpose.
Exceeds standards Student scores at this level indicate a very strong academic performance based on the grade level knowledge and skills outlined in the state content standards for mathematics. Students readily identify and connect fundamental mathematical concepts, properties and procedures. For example, they apply proportional reasoning across the standards (i.e., percents, measurement conversions, similar figures, slope, and probability), to more complex problem situations. They indicate flexibility in representing mathematical relationships by using diagrams, graphs, and symbolic algebra.
Grade 10 Does not meet standards
Student scores at this level indicate a minimal and/or an inaccurate grasp of the grade level knowledge and skills outlined in the state content standards for mathematics. Students indicate basic but inconsistent performance of fundamental skills. Typically, they are developing fluency in problem solving using algebra, geometry and probability.
Nearly Meets Student scores at this level indicate an incomplete grasp of the grade level knowledge and skills outlined in the state content standards for mathematics. Students inconsistently carry out routine procedures, such as reading graphs, performing specified computations and solving simple equations. These students solve problems for which the method or solution is easily recognized and straightforward.
Meets standards Student scores at this level indicate a solid academic performance based on the grade level knowledge and skills outlined in the state content standards for mathematics. Students consistently solve problems using various strategies. These students can reason mathematically, and generally have a firm understanding of algebraic and geometric concepts.
Exceeds standards Student scores at this level indicate a very strong academic performance based on the grade level knowledge and skills outlined in the state content standards for mathematics. Students readily bring together skills and knowledge from multiple concepts and areas of mathematics to solve complex problems using sophisticated strategies.

The Oregon Statewide Assessment System Technical Report Volume 3: Standard Setting
A-9
Table A.3. Performance-Level Descriptors for Science
Grade Performance Descriptor
Grade 5 Does not meet standards
Student scores at this level indicate a minimal and/or inaccurate grasp of the benchmark level knowledge and skills outlined in the state content standards for Science. These students inconsistently explain and/or minimally describe the fundamental properties of matter, force and energy and the basic structures, functions and interactions of living organisms in the environment. They can minimally identify Earth’s properties and Earth’s relationship in space.
Nearly Meets Student scores at this level indicate an incomplete grasp of the benchmark level knowledge and skills outlined in the state content standards for Science. These students can partially explain and describe the fundamental properties of matter, force and energy and the basic structures, functions and interactions of living organisms in the environment. They can partially identify Earth’s properties and can recognize some of Earth’s relationship in space.
Meets standards Student scores at this level indicate a solid academic performance based on the benchmark level knowledge and skills outlined in the state content standards for Science. These students can explain and describe most fundamental properties of matter, force and energy and the basic structures, functions and interactions of living organisms in the environment. They can describe most of Earth’s properties and can explain Earth’s relationship in space.
Exceeds standards Student scores at this level indicate a very strong academic performance based on the benchmark level knowledge and skills outlined in the state content standards for Science. These students can consistently explain and describe the fundamental properties of matter, force and energy and the basic structures, functions and interactions of living organisms in the environment. They can consistently describe Earth’s properties and correctly explain Earth’s relationship in space.
Grade 8 Does not meet standards
Student scores at this level indicate a minimal and/or inaccurate grasp of the benchmark level knowledge and skills outlined in the state content standards for Science. These students can inconsistently explain and/or minimally describe the properties of matter, force and energy and have limited knowledge about the structures, functions and interactions of living organisms in the environment. They have a minimal and/or inaccurate understanding of Earth’s properties, Earth’s motion and its relationship in space.
Nearly Meets Student scores at this level indicate an incomplete grasp of the benchmark level knowledge and skills outlined in the state content standards for Science. These students can partially explain and describe the properties of matter, force and energy and the structures, functions and interactions of living organisms in the environment. They can partially identify Earth’s properties and how these properties change over time. Students can explain some of Earth’s motion and its relationship in space.
Meets standards Student scores at this level indicate a solid academic performance based on the benchmark level knowledge and skills outlined in the state content standards for Science. These students can explain and describe properties of matter, force and energy and the structures, functions and interactions of living organisms in the environment. They can describe Earth’s properties and how some of these properties change over time. Students can explain Earth’s motion and its relationship in space.
Exceeds standards Student scores at this level indicate a very strong academic performance based on the benchmark level knowledge and skills outlined in the state content standards for Science. These students can consistently explain and describe the properties of matter, force and energy and structures, functions and interactions of living organisms in the environment. They can consistently explain and describe Earth’s properties and how these properties change over time. Students can effectively explain Earth’s motion and its relationship in space.

The Oregon Statewide Assessment System Technical Report Volume 3: Standard Setting
A-10
Grade Performance Descriptor
Grade 10 Does not meet standards
Student scores at this level indicate a minimal and/or inaccurate grasp of the benchmark level knowledge and skills outlined in the state content standards for Science. These students inconsistently explain, describe and analyze the properties of matter, force and energy and the complex structures, functions and interactions of living organisms in the environment. They have a minimum and/or inaccurate understanding of Earth’s properties and explain only the simplistic principles of Earth’s relationship in space and interaction with other objects in space.
Nearly Meets Student scores at this level indicate an incomplete grasp of the benchmark level knowledge and skills outlined in the state content standards for Science. These students can incompletely explain, describe and analyze the properties of matter, force and energy and the complex structures, functions and interactions of living organisms in the environment. They can partially describe and analyze Earth’s properties and can explain some of Earth’s relationship in space and interaction with other objects in space.
Meets standards Student scores at this level indicate a solid academic performance based on the benchmark level knowledge and skills outlined in the state content standards for Science. These students can mostly explain, describe and analyze the properties of matter, force and energy and the complex structures, functions and interactions of living organisms in the environment. They can describe and analyze Earth’s properties and can accurately explain Earth’s relationship in space and interaction with other objects in space.
Exceeds standards Student scores at this level indicate a very strong academic performance based on the benchmark level knowledge and skills outlined in the state content standards for Science. These students can consistently explain, describe and analyze the properties of matter, force and energy and the complex structures, functions and interactions of living organisms in the environment. They can consistently describe and analyze Earth’s properties and effectively explain Earth’s relationship in space and interaction with other objects in space.

The Oregon Statewide Assessment System Technical Report Volume 3: Standard Setting
B-1
APPENDIX B STANDARD-SETTING PANEL COMPOSITION BY SUBJECT AREA AND GRADE
Table B.1. Reading/Literature Standard-Setting Panel Composition, Grade 3
Panelist ID Panelist name Expertise City
1 Bonnie Harper READING Helix 2 Cheri Shea READING Portland 3 Connie Owens READING/MATHEMATICS Gladstone 4 Cynthia Hodgdon ELEMENTARY MATHEMATICS/READING Irrigon 5 Diann Gillaspie READING - 3RD GRADE Coquille 6 Jeremiah Patterson READING Gladstone 7 John O’Neill Jr. ADMINISTRATION Forest Grove 8 Kathy Saterdahl READING-ELEMENTARY Bend 9 Kayla Reents READING - 3RD GRADE Coquille
10 Kristie Buckley READING/MATHEMATICS Glide 11 Lisa Becker READING Fairview 12 Michelle Zundel ANY Ashland 13 Mike Campbell GRADE 1 Molalla 14 Norma Barber READING Ukiah 15 Patty Ball READING Corvallis 16 Peg Cowens READING/LITERATURE Grants Pass 17 Tammy Doty ELEMENTARY Lapine 18 Tanya Grape-Frisendahl READING Salem 19 Teresa Furukawa 3RD GRADE Salem
Table B.2. Reading/Literature Standard-Setting Panel Composition, Grade 5
Panelist ID Panelist name Expertise City
20 Charlotte Fisher ELEMENTARY (READING/LANGUAGE ARTS/MATHEMATICS
Dallas
21 Cheryl Lemke READING Medford 22 Cindi Schmitz READING Silverton 23 Dave VanLoo READING-ELEMENTARY Bend 24 Dawn Kennison-Kerrigan LANGUAGE ARTS Hermiston 25 Dayle Spitzer Eder MATHEMATICS/SCIENCE/LANGUAGE ARTS Hillsboro 26 Dean Richards MATHEMATICS/LITERATURE Clackamas 27 Derek Edens ASSESSMENT Portland 28 Fran MacKenzie Roseburg 29 Gary Thompson READING Portland 30 Jannie Heller READING/LITERATURE Cave Junction 31 Jerry Archer READING/MATHEMATICS Pendleton 32 John Blanck LANGUAGE ARTS Portland 33 Kevin Milner READING Newberg 34 Laurie Glazener ASSESSMENT, READING Springfield

The Oregon Statewide Assessment System Technical Report Volume 3: Standard Setting
B-2
Panelist ID Panelist name Expertise City
35 Louise Johnston READING Portland 36 Marietta Donohue Welches 37 Michelle Coleman READING-ELEMENTARY Bend 38 Pam Edens LITERACY Beaverton 39 Patricia Bieze MATHEMATICS Portland 40 Shelley Liscom ADMINISTRATION Pendleton 41 Wade Smith CURRICULUM/INSTRUCTION Lexington
Table B.3. Reading/Literature Standard-Setting Panel Composition, Grade 8
Panelist ID Panelist name Expertise City
42 Alex Bick SPECIAL ED Bend 43 Annette Jacobsen READING/LITERATURE, ASSESSMENT Mcminnville 44 Cari Price LANGUAGE ARTS/READING Salem 45 Doug Geygan LANGUAGE ARTS/SOCIAL STUDIES Bend 46 Heather Johnstone PARENT Newberg 47 Jana Avison READING/LITERATURE Salem 48 Jennifer Clair READING OSAT Roseburg 49 Josh Marks SPED MATHEMATICS Bend 50 Julie Barnes READING Cave Junction 51 Kristin Sacks SECONDARY LITERACY Tigard 52 Molly Matthews Grand Ronde 53 Monica Schalock 54 Patti Virden SPED Salem 55 Renee Stickles READING/LITERATURE Salem 56 Shelley Wilcoxen READING Portland 57 Susan Equinoa ENGLISH Albany 58 Teri Rowell Lagrande 59 Terry McElligott LANGUAGE ARTS/SOCIAL STUDIES Newberg
Table B.4. Reading/Literature Standard-Setting Panel Composition, Grade 10
Panelist ID Panelist name Expertise City
60 Arthur L. Dingle READING/LANGUAGE ARTS Brookings 61 Carlos Montgomery 62 Christine Richardson WRITING Newberg 63 Dave Mues LANGUAGE ARTS Hines 64 Gabriel Shannon Portland 65 Georgiana Yee READING GRADES 8 OR 10 Sherwood 66 Jim Raible READING/LITERATURE Ione

The Oregon Statewide Assessment System Technical Report Volume 3: Standard Setting
B-3
Panelist ID Panelist name Expertise City
67 Joe LaFountaine PARENT/PRINCIPAL Salem 68 Kathy Haynie ELA Oregon City 69 Katie Gisler ENGLISH Albany 70 Marilyn LaHue READING Newberg 71 Mark Recker LANGUAGE ARTS Silverton 72 Mary Holmes ENGLISH 9-12 Gladstone 73 Michelle Shigemasa 9-12 LANGUAGE ARTS Hillsboro 74 Rick Dills READING Hood River 75 Steve Harloff READING Forest Grove 76 Teri Houghton ELA Grants Pass 77 Tim Drilling MATHEMATICS/SCIENCE Gresham
Table B.5. Mathematics Standard-Setting Panel Composition, Grade 3
Panelist ID Panelist name Expertise City
1 Alicia Glasscock SPED READING Beaverton 2 Andrea Lane MATHEMATICS John Day 3 Craig Martin MATHEMATICS Ashland 4 Diane Delvers SPED Gladstone 5 Dick Bertelsen MATHEMATICS Gresham 6 Gary Hendricks ALL - GRADE 4 Milton-Freewater 7 Ginger Colwell MATHEMATICS/READING Albany 8 Jackie Cooke MATHEMATICS Vancouver 9 Jan Kittelson SITE COUNCIL Tigard
10 Jane Osborne MATHEMATICS Hood River 11 Janelle Rebick TEACHER Bend 12 Jill Conant READING Nyssa 13 Kathy Bowers MATHEMATICS, ELEMENTARY Salem 14 Larry Bentz MATHEMATICS Gresham 15 Lesley Johnson SCIENCE Salem 16 Robert Bonner GRADE 3 Newberg 17 Stephen Buckley MATHEMATICS AND SCIENCE Glide 18 Tami Hansey ELEMENTARY Myrtle Creek 19 Theresa Kalstad MATHEMATICS, LANGUAGE ARTS Portland 20 Tiffanie Hansey ELEMENTARY Myrtle Creek

The Oregon Statewide Assessment System Technical Report Volume 3: Standard Setting
B-4
Table B.6. Mathematics Standard-Setting Panel Composition, Grade 5
Panelist ID Panelist name Expertise City
21 Cheryl Ogburn MATHEMATICS Portland 22 Craig Koontz MATHEMATICS Albany 23 Deb Gaffney READING/LITERATURE/WRITING
(ELEMENTARY/MIDDLE SCHOOL) Newport
24 Don Grossarth MATHEMATICS, S STUDIES Salem 25 Francie Bostwick MATHEMATICS Medford 26 Gary Montgomery ELEMENTARY READING & MATHEMATICS Medford 27 Julie Fox MATHEMATICS – 5TH Gladstone 28 Karen Lokting Beaverton 29 Katie Legace PRINCIPAL, MS Bend 30 Kayda Mitchell MATHEMATICS Newberg 31 Laura Lethe MATHEMATICS Keizer 32 Linda Errick ANY Sutherlin 33 Lyn Philiben MATHEMATICS Bend 34 Marla Baber MATHEMATICS Portland 35 Nancy Fowler MATHEMATICS Beaverton 36 Olivia Variel ALL Bend 37 Ross Eells MATHEMATICS GRADES 3-8 Mcminnville 38 Scot Anderson MATHEMATICS Albany 39 Stephanie Legard MATHEMATICS Mcminnville
Table B.7. Mathematics Standard-Setting Panel Composition, Grade 8
Panelist ID Panelist name Expertise City
40 Anna Som MATHEMATICS Albany 41 Betsy Shane JUNIOR HIGH MATHEMATICS Boardman 42 Brent Freeman MATHEMATICS Ashland 43 Cathy Windsheimer MATHEMATICS Portland 44 Drew Braun Eugene 45 Evelyn Mears MATHEMATICS Albany 46 Jeff Lee MATHEMATICS Salem 47 Jill Hayden MATHEMATICS The Dalles 48 Jill Plattner MATHEMATICS/TITLE I MATHEMATICS Bend 49 Jill Sumerlin MATHEMATICS Tillamook 50 Jon R. Bennett MATHEMATICS - MIDDLE SCHOOL Myrtle Creek 51 Julia Murphy MATHEMATICS Sutherlin 52 Karen Stiner MATHEMATICS - 8TH GRADE Bend 53 Ken Gilbert MATHEMATICS Albany 54 La Dona May MATHEMATICS Terrebonne 55 MaryAnn Heglie-King MATHEMATICS Eugene

The Oregon Statewide Assessment System Technical Report Volume 3: Standard Setting
B-5
56 Nicholas Gilbertson MATHEMATICS Molalla 57 Sally Wood MATHEMATICS Estacada 58 Sandra Harris MATHEMATICS Hillsboro
Table B.8. Mathematics Standard-Setting Panel Composition, Grade 10
Panelist ID Panelist name Expertise City
59 Brenda Paustian MATHEMATICS Ashland 60 Brian Goldman MATHEMATICS Portland 61 Cheryl Klampe-VanHess MATHEMATICS Stayton 62 David Dopperman MATHEMATICS Aloha 63 Eda Davis-Butts UMSAAT Corvallis 64 Ellen Irish MATHEMATICS 9-12 65 Jennifer Jones MATHEMATICS, SITE COUNCIL Phoenix 66 Jerry Renfro MATHEMATICS 9-12 Gladstone 67 LaDona Barton-Copeland MATHEMATICS Hines 68 Larry Susuki Ontario 69 Les Willett MATHEMATICS North Bend 70 Marie Cramer MATHEMATICS Keizer 71 Nancy Sanders MATHEMATICS Scio 72 Patty Sandoz MATHEMATICS La Grande 73 Randy Shockey MATHEMATICS Forest Grove 74 Shawna Blanchette MATHEMATICS Phoenix 75 Sheila Otto MATHEMATICS Eugene 76 Tom Owen MATHEMATICS AND SCIENCE Portland
Table B.9 Science Standard-Setting Panel Composition, Grade 5
Panelist ID Panelist name Expertise City
1 Angela Pak GRADES 4/5 Mulino 2 Annie Morton TEACHER/PRINCIPAL Salem 3 Beckianne Kilkenny SCIENCE Beaverton 4 Brian Skaar READING/LIT Philomath 5 Cheryl Eggers SCIENCE Milwaukie 6 Debbie Freeman SCIENCE Hermiston 7 Della Emerick 8 Don Brown LA K-5 Beaverton 9 Kimberly Harrington GRADE 4 Hillsboro
10 Kris Alman MATHEMATICS Portland 11 Kristin Takano MATHEMATICS/SCIENCE ESL Newport 12 Laurie Dougherty READING Gearhart 13 Leslie Graham MATHEMATICS OR SCIENCE Lagrande 14 Linda Dougherty K-5, READING, MATHEMATICS AND Salem
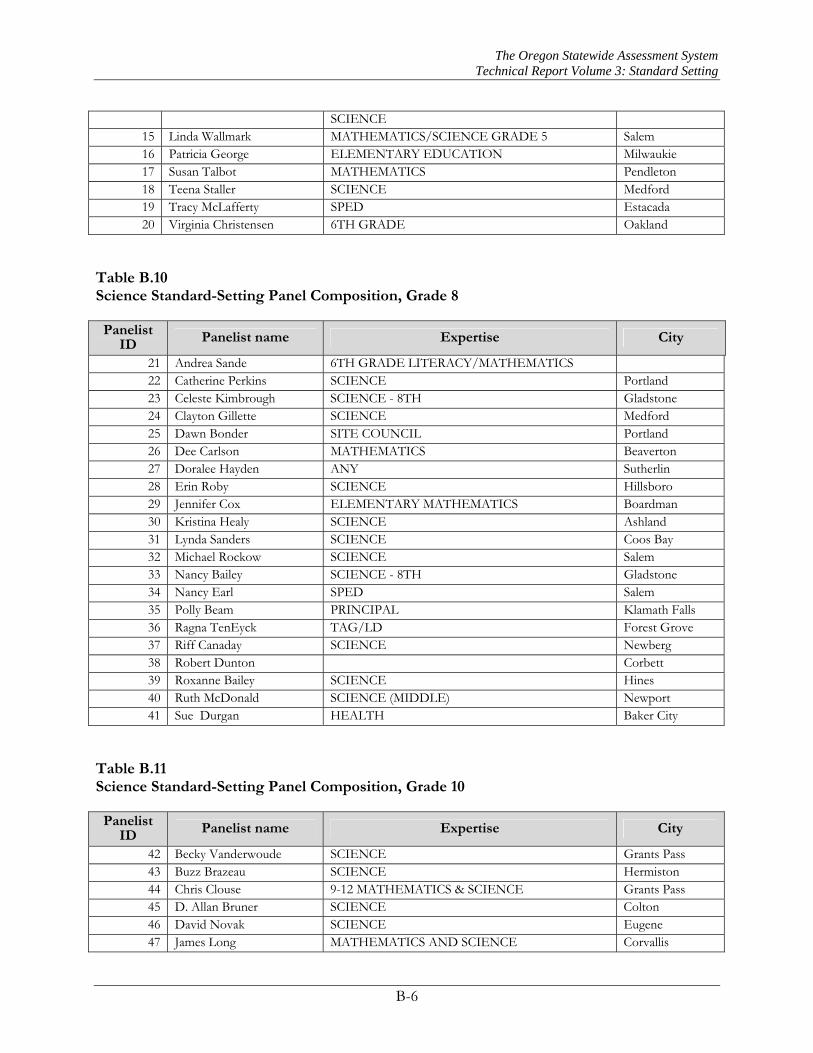
The Oregon Statewide Assessment System Technical Report Volume 3: Standard Setting
B-6
SCIENCE 15 Linda Wallmark MATHEMATICS/SCIENCE GRADE 5 Salem 16 Patricia George ELEMENTARY EDUCATION Milwaukie 17 Susan Talbot MATHEMATICS Pendleton 18 Teena Staller SCIENCE Medford 19 Tracy McLafferty SPED Estacada 20 Virginia Christensen 6TH GRADE Oakland
Table B.10 Science Standard-Setting Panel Composition, Grade 8
Panelist ID Panelist name Expertise City
21 Andrea Sande 6TH GRADE LITERACY/MATHEMATICS 22 Catherine Perkins SCIENCE Portland 23 Celeste Kimbrough SCIENCE - 8TH Gladstone 24 Clayton Gillette SCIENCE Medford 25 Dawn Bonder SITE COUNCIL Portland 26 Dee Carlson MATHEMATICS Beaverton 27 Doralee Hayden ANY Sutherlin 28 Erin Roby SCIENCE Hillsboro 29 Jennifer Cox ELEMENTARY MATHEMATICS Boardman 30 Kristina Healy SCIENCE Ashland 31 Lynda Sanders SCIENCE Coos Bay 32 Michael Rockow SCIENCE Salem 33 Nancy Bailey SCIENCE - 8TH Gladstone 34 Nancy Earl SPED Salem 35 Polly Beam PRINCIPAL Klamath Falls 36 Ragna TenEyck TAG/LD Forest Grove 37 Riff Canaday SCIENCE Newberg 38 Robert Dunton Corbett 39 Roxanne Bailey SCIENCE Hines 40 Ruth McDonald SCIENCE (MIDDLE) Newport 41 Sue Durgan HEALTH Baker City
Table B.11 Science Standard-Setting Panel Composition, Grade 10
Panelist ID Panelist name Expertise City
42 Becky Vanderwoude SCIENCE Grants Pass 43 Buzz Brazeau SCIENCE Hermiston 44 Chris Clouse 9-12 MATHEMATICS & SCIENCE Grants Pass 45 D. Allan Bruner SCIENCE Colton 46 David Novak SCIENCE Eugene 47 James Long MATHEMATICS AND SCIENCE Corvallis

The Oregon Statewide Assessment System Technical Report Volume 3: Standard Setting
B-7
48 Jill Merolla SCIENCE 9-12 Gladstone 49 Karen Peterson SCIENCE Mcminnville 50 Laura Oldenkamp Canby 51 Malvina Holloway SCIENCE 52 Maxine Thompson COMMUNICATING DATA TO PUBLIC Portland 53 Rachel Marble SCIENCE Tigard 54 Rick Foster SCIENCE Phoenix 55 Robert Espenel EDUCATIONAL ADMINISTRATION Molalla 56 Sean McElhaney SCIENCE Molalla 57 Todd Thomas GRADUATION REQUIREMENTS Newberg 58 Trish Beckius SCIENCE Newberg

The Oregon Statewide Assessment System Technical Report Volume 3: Standard Setting
C-1
APPENDIX C STANDARD-SETTING PANEL TRAINING MATERIALS
from Bookmark Standard Setting Technical Report 2006 for Reading/Literature and Mathematics Grades 3, 5, 8, and CIM and Science Grades 5, 8, and CIM by CTB/McGraw-Hill LLC, 20 Ryan Ranch Road, Monterey, California 93940-5703

The Oregon Statewide Assessment System Technical Report Volume 3: Standard Setting
C-2

The Oregon Statewide Assessment System Technical Report Volume 3: Standard Setting
C-3

The Oregon Statewide Assessment System Technical Report Volume 3: Standard Setting
C-4

The Oregon Statewide Assessment System Technical Report Volume 3: Standard Setting
C-5
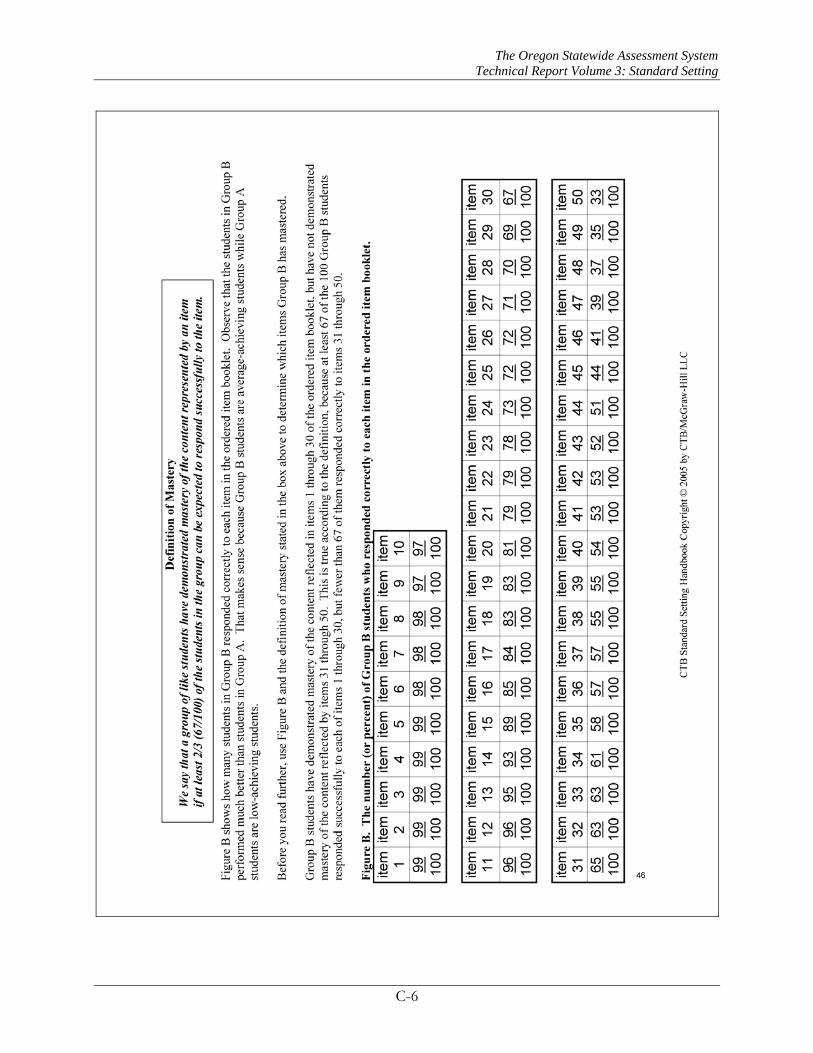
The Oregon Statewide Assessment System Technical Report Volume 3: Standard Setting
C-6

The Oregon Statewide Assessment System Technical Report Volume 3: Standard Setting
C-7

The Oregon Statewide Assessment System Technical Report Volume 3: Standard Setting
C-8

The Oregon Statewide Assessment System Technical Report Volume 3: Standard Setting
C-9

The Oregon Statewide Assessment System Technical Report Volume 3: Standard Setting
C-10

The Oregon Statewide Assessment System Technical Report Volume 3: Standard Setting
C-11

The Oregon Statewide Assessment System Technical Report Volume 3: Standard Setting
C-12

The Oregon Statewide Assessment System Technical Report Volume 3: Standard Setting
C-13

The Oregon Statewide Assessment System Technical Report Volume 3: Standard Setting
C-14

The Oregon Statewide Assessment System Technical Report Volume 3: Standard Setting
C-15

The Oregon Statewide Assessment System Technical Report Volume 3: Standard Setting
C-16

The Oregon Statewide Assessment System Technical Report Volume 3: Standard Setting
C-17

The Oregon Statewide Assessment System Technical Report Volume 3: Standard Setting
C-18

The Oregon Statewide Assessment System Technical Report Volume 3: Standard Setting
C-19

The Oregon Statewide Assessment System Technical Report Volume 3: Standard Setting
C-20
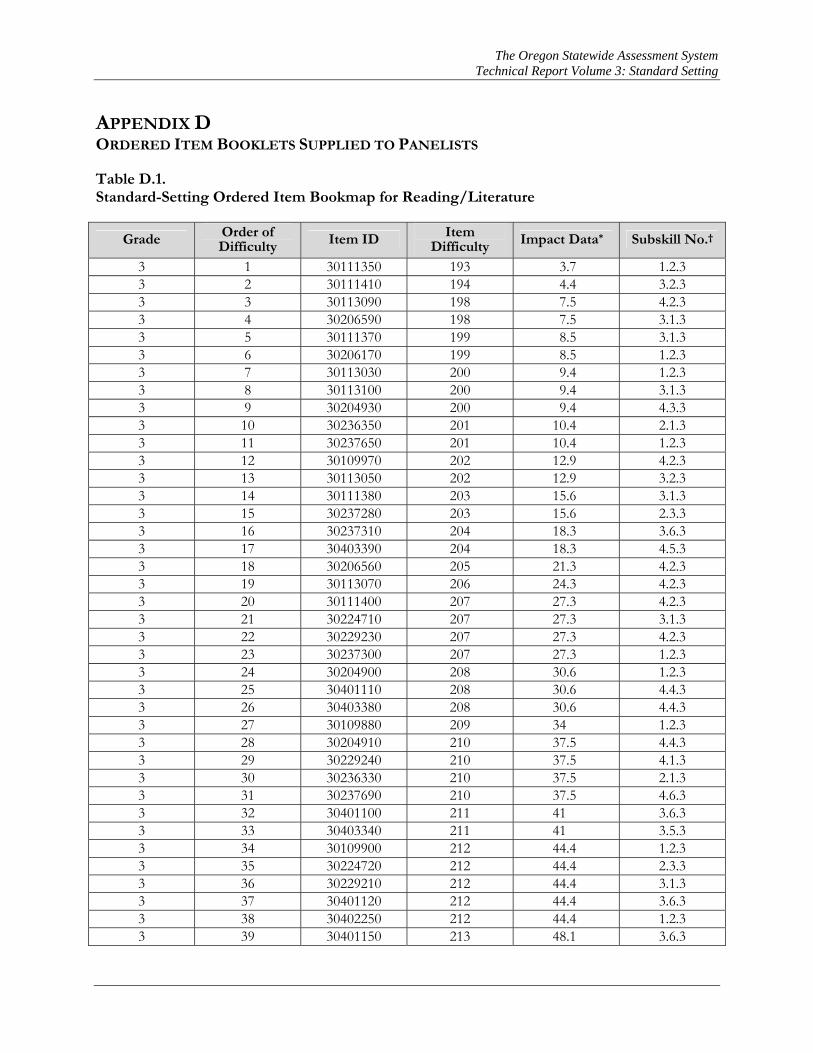
The Oregon Statewide Assessment System Technical Report Volume 3: Standard Setting
APPENDIX D ORDERED ITEM BOOKLETS SUPPLIED TO PANELISTS
Table D.1. Standard-Setting Ordered Item Bookmap for Reading/Literature
Grade Order of Difficulty Item ID Item
Difficulty Impact Data* Subskill No.†
3 1 30111350 193 3.7 1.2.3 3 2 30111410 194 4.4 3.2.3 3 3 30113090 198 7.5 4.2.3 3 4 30206590 198 7.5 3.1.3 3 5 30111370 199 8.5 3.1.3 3 6 30206170 199 8.5 1.2.3 3 7 30113030 200 9.4 1.2.3 3 8 30113100 200 9.4 3.1.3 3 9 30204930 200 9.4 4.3.3 3 10 30236350 201 10.4 2.1.3 3 11 30237650 201 10.4 1.2.3 3 12 30109970 202 12.9 4.2.3 3 13 30113050 202 12.9 3.2.3 3 14 30111380 203 15.6 3.1.3 3 15 30237280 203 15.6 2.3.3 3 16 30237310 204 18.3 3.6.3 3 17 30403390 204 18.3 4.5.3 3 18 30206560 205 21.3 4.2.3 3 19 30113070 206 24.3 4.2.3 3 20 30111400 207 27.3 4.2.3 3 21 30224710 207 27.3 3.1.3 3 22 30229230 207 27.3 4.2.3 3 23 30237300 207 27.3 1.2.3 3 24 30204900 208 30.6 1.2.3 3 25 30401110 208 30.6 4.4.3 3 26 30403380 208 30.6 4.4.3 3 27 30109880 209 34 1.2.3 3 28 30204910 210 37.5 4.4.3 3 29 30229240 210 37.5 4.1.3 3 30 30236330 210 37.5 2.1.3 3 31 30237690 210 37.5 4.6.3 3 32 30401100 211 41 3.6.3 3 33 30403340 211 41 3.5.3 3 34 30109900 212 44.4 1.2.3 3 35 30224720 212 44.4 2.3.3 3 36 30229210 212 44.4 3.1.3 3 37 30401120 212 44.4 3.6.3 3 38 30402250 212 44.4 1.2.3 3 39 30401150 213 48.1 3.6.3

The Oregon Statewide Assessment System Technical Report Volume 3: Standard Setting
Grade Order of Difficulty Item ID Item
Difficulty Impact Data* Subskill No.†
3 40 30109950 214 51.6 4.1.3 3 41 30109960 214 51.6 4.2.3 3 42 30402180 214 51.6 1.2.3 3 43 30206610 215 54.7 2.2.3 3 44 30401060 215 54.7 1.2.3 3 45 30402020 215 54.7 2.3.3 3 46 30208480 216 58 4.2.3 3 47 30235320 216 58 1.2.3 3 48 30238910 216 58 3.1.3 3 49 30402270 216 58 3.6.3 3 50 30208430 217 62.2 1.2.3 3 51 30229220 217 62.2 3.3.3 3 52 30403310 218 65.8 1.1.3 3 53 30208500 219 68.1 1.2.3 3 54 30259700 219 68.1 3.2.3 3 55 30402220 219 68.1 4.3.3 3 56 30259730 220 71.6 4.2.3 3 57 30270290 220 71.6 4.6.3 3 58 30206530 221 74.6 3.1.3 3 59 30206550 221 74.6 2.2.3 3 60 30208450 221 74.6 3.3.3 3 61 30224400 221 74.6 1.2.3 3 62 30235950 221 74.6 1.2.3 3 63 30259660 221 74.6 1.2.3 3 64 30270270 221 74.6 4.3.3 3 65 30235000 224 81 1.2.3 3 66 30235380 224 81 4.2.3 3 67 30235120 225 83.6 1.2.3 3 68 30208440 226 85 3.2.3 3 69 30259710 226 85 4.1.3 3 70 30236020 227 87.1 4.3.3 4 1 40235720 199 3.1 4.7.4 4 2 40464950 199 3.1 3.1.4 4 3 40415370 201 4.4 3.1.4 4 4 40465190 203 5.9 2.1.4 4 5 40464930 204 6.7 3.1.4 4 6 40472810 204 6.7 1.1.4 4 7 40464940 205 7.7 3.1.4 4 8 40473440 205 7.7 4.7.4 4 9 40438420 206 8.7 1.2.4 4 10 40473240 206 8.7 4.4.4 4 11 40401380 208 11.4 5.1.4 4 12 40401330 209 14.1 3.1.4 4 13 40235690 210 17.2 4.7.4 4 14 40415390 210 17.2 4.2.4

The Oregon Statewide Assessment System Technical Report Volume 3: Standard Setting
Grade Order of Difficulty Item ID Item
Difficulty Impact Data* Subskill No.†
4 15 40464910 211 20.4 1.1.4 4 16 40473210 211 20.4 1.1.4 4 17 40464900 212 24.1 1.1.4 4 18 40465170 212 24.1 2.1.4 4 19 40401290 213 27.9 2.3.4 4 20 40415410 214 31.7 4.2.4 4 21 40457330 214 31.7 5.3.4 4 22 40235780 215 35.8 4.7.4 4 23 40418120 215 35.8 3.2.4 4 24 40207530 216 39.9 1.1.4 4 25 40207550 216 39.9 4.7.4 4 26 40235730 216 39.9 3.3.4 4 27 40268780 217 44.1 4.7.4 4 28 40305840 217 44.1 2.2.4 4 29 40439340 217 44.1 1.2.4 4 30 40268820 218 47.9 4.7.4 4 31 40418090 218 47.9 1.1.4 4 32 40207540 219 51.6 1.1.4 4 33 40439810 219 51.6 4.3.4 4 34 40401540 220 55.6 1.1.4 4 35 40411800 220 55.6 2.1.4 4 36 40415380 220 55.6 3.1.4 4 37 40439380 220 55.6 4.3.4 4 38 40401470 221 59.2 3.2.4 4 39 40418110 221 59.2 4.7.4 4 40 40439400 221 59.2 1.1.4 4 41 40201000 222 62.5 4.5.4 4 42 40401590 222 62.5 4.1.4 4 43 40418170 222 62.5 4.4.4 4 44 40418270 222 62.5 5.1.4 4 45 40401410 223 66 1.3.4 4 46 40405560 223 66 5.3.4 4 47 40418140 223 66 3.3.4 4 48 40305820 224 69.8 1.3.4 4 49 40418300 224 69.8 4.2.4 4 50 40268770 225 72.9 3.2.4 4 51 40305830 225 72.9 2.2.4 4 52 40401340 225 72.9 3.1.4 4 53 40418240 225 72.9 1.1.4 4 54 40401570 226 75.7 1.3.4 4 55 40439330 226 75.7 1.1.4 4 56 40405540 227 78.7 5.1.4 4 57 40418080 227 78.7 1.1.4 4 58 40200950 228 81.1 4.7.4 4 59 40256700 228 81.1 1.3.4

The Oregon Statewide Assessment System Technical Report Volume 3: Standard Setting
Grade Order of Difficulty Item ID Item
Difficulty Impact Data* Subskill No.†
4 60 40401550 228 81.1 3.1.4 4 61 40411760 228 81.1 2.1.4 4 62 40200970 229 83.5 4.5.4 4 63 40411770 231 87.2 2.1.4 4 64 40401520 232 89.1 1.1.4 4 65 40418340 232 89.1 3.1.4 4 66 40401460 233 90.7 4.7.4 4 67 40457340 233 90.7 5.2.4 4 68 40268740 236 94.2 1.1.4 4 69 40401490 236 94.2 4.6.4 4 70 40401440 240 97.1 4.7.4 5 1 50273310 202 2.8 4.7.5 5 2 50269650 204 3.8 1.1.5 5 3 50269700 204 3.8 4.1.5 5 4 50254390 205 4.4 5.1.5 5 5 50271270 205 4.4 4.4.5 5 6 50273350 205 4.4 3.2.5 5 7 50306220 205 4.4 2.2.5 5 8 50479440 205 4.4 3.3.5 5 9 50273360 206 5.1 3.2.5 5 10 50479450 207 5.8 3.2.5 5 11 50232180 208 6.7 1.1.5 5 12 50269740 208 6.7 5.1.5 5 13 50254410 209 7.7 4.3.5 5 14 50477950 209 7.7 6.1.5 5 15 50479460 209 7.7 1.1.5 5 16 50271470 210 8.8 5.1.5 5 17 50254380 211 10 4.1.5 5 18 50272350 211 10 5.1.5 5 19 50273330 211 10 6.3.5 5 20 50306210 211 10 2.2.5 5 21 50271360 212 11.2 1.1.5 5 22 50306200 212 11.2 2.2.5 5 23 50210860 213 12.7 1.1.5 5 24 50210870 214 14.3 3.2.5 5 25 50271390 214 14.3 5.2.5 5 26 50269680 215 16.2 3.1.5 5 27 50210850 216 20.1 1.1.5 5 28 50210880 216 20.1 3.2.5 5 29 50269640 216 20.1 1.1.5 5 30 50271440 217 24.3 3.1.5 5 31 50416570 217 24.3 6.3.5 5 32 50271430 218 28.6 4.3.5 5 33 50210930 220 37.6 6.2.5 5 34 50272360 220 37.6 3.1.5

The Oregon Statewide Assessment System Technical Report Volume 3: Standard Setting
Grade Order of Difficulty Item ID Item
Difficulty Impact Data* Subskill No.†
5 35 50414210 222 46.1 2.2.5 5 36 50418600 222 46.1 3.1.5 5 37 50418760 222 46.1 5.2.5 5 38 50111870 223 49.9 2.1.5 5 39 50245400 223 49.9 3.2.5 5 40 50417480 223 49.9 1.3.5 5 41 50418740 223 49.9 3.1.5 5 42 50229690 224 53.9 1.1.5 5 43 50417520 224 53.9 3.1.5 5 44 50418580 224 53.9 1.3.5 5 45 50417590 225 57.9 2.2.5 5 46 50242880 226 61.6 6.3.5 5 47 50417570 226 61.6 2.2.5 5 48 50111860 227 64.8 2.1.5 5 49 50212300 227 64.8 4.7.5 5 50 50213730 227 64.8 4.4.5 5 51 50212290 228 68.1 3.2.5 5 52 50418730 228 68.1 5.1.5 5 53 50210920 229 71.4 6.3.5 5 54 50244040 229 71.4 1.1.5 5 55 50417460 229 71.4 5.1.5 5 56 50212320 231 76.8 6.2.5 5 57 50244090 231 76.8 3.1.5 5 58 50245390 231 76.8 4.7.5 5 59 50245410 231 76.8 4.5.5 5 60 50417500 231 76.8 1.1.5 5 61 50245420 232 80 4.5.5 5 62 50212310 234 84.8 4.7.5 5 63 50242900 234 84.8 6.1.5 5 64 50236080 235 87 1.1.5 5 65 50244110 235 87 4.2.5 5 66 50245440 237 90.4 1.1.5 5 67 50245460 237 90.4 6.2.5 5 68 50244070 239 93.3 1.2.5 5 69 50111940 240 94.5 2.1.5 5 70 50417470 241 95.4 5.3.5 6 1 60468270 210 5.5 1.1.6 6 2 60468290 211 6.5 3.2.6 6 3 60225460 212 7.8 3.1.6 6 4 60458160 212 7.8 3.1.6 6 5 60459120 212 7.8 6.2.6 6 6 60468130 213 9 1.1.6 6 7 60458110 214 10.4 1.1.6 6 8 60468190 214 10.4 4.9.6 6 9 60225480 215 11.8 2.1.6

The Oregon Statewide Assessment System Technical Report Volume 3: Standard Setting
Grade Order of Difficulty Item ID Item
Difficulty Impact Data* Subskill No.†
6 10 60458130 215 11.8 3.1.6 6 11 60225450 216 13.4 2.1.6 6 12 60269120 216 13.4 4.9.6 6 13 60468360 216 13.4 6.1.6 6 14 60450570 217 15.1 1.1.6 6 15 60468300 217 15.1 3.2.6 6 16 60468240 218 17 6.1.6 6 17 60450620 219 19.1 5.1.6 6 18 60450630 219 19.1 4.3.6 6 19 60458140 219 19.1 5.3.6 6 20 60458190 219 19.1 1.2.6 6 21 60269090 220 22.2 3.2.6 6 22 60442420 220 22.2 2.1.6 6 23 60468170 220 22.2 3.3.6 6 24 60468260 220 22.2 1.1.6 6 25 60269070 221 25.7 1.1.6 6 26 60450610 221 25.7 5.1.6 6 27 60269150 222 29.6 6.1.6 6 28 60468280 222 29.6 1.1.6 6 29 60450560 223 33.5 1.1.6 6 30 60458250 223 33.5 5.1.6 6 31 60225430 224 37.5 2.1.6 6 32 60438850 224 37.5 5.3.6 6 33 60459060 224 37.5 4.9.6 6 34 60500870 224 37.5 1.1.6 6 35 60269170 226 45.7 6.1.6 6 36 60458150 227 49.7 3.1.6 6 37 60468150 227 49.7 3.2.6 6 38 60458950 228 53.5 2.1.6 6 39 60459020 228 53.5 6.1.6 6 40 60450640 229 57.4 1.1.6 6 41 60459000 229 57.4 2.1.6 6 42 60501450 229 57.4 6.1.6 6 43 60458960 230 60.9 2.1.6 6 44 60501380 230 60.9 1.2.6 6 45 60438920 231 64.2 5.2.6 6 46 60450670 231 64.2 4.2.6 6 47 60501740 231 64.2 1.1.6 6 48 60269160 232 67.8 6.1.6 6 49 60500950 232 67.8 4.3.6 6 50 60455490 233 71.4 4.6.6 6 51 60501390 233 71.4 3.2.6 6 52 60501400 233 71.4 3.2.6 6 53 60458430 234 74.7 2.2.6 6 54 60500880 234 74.7 1.1.6

The Oregon Statewide Assessment System Technical Report Volume 3: Standard Setting
Grade Order of Difficulty Item ID Item
Difficulty Impact Data* Subskill No.†
6 55 60455450 235 77.5 6.1.6 6 56 60455470 235 77.5 6.1.6 6 57 60501830 235 77.5 5.1.6 6 58 60501820 236 80.4 4.3.6 6 59 60501360 237 83.1 1.2.6 6 60 60501770 237 83.1 3.1.6 6 61 60501420 238 85.2 4.9.6 6 62 60500940 239 87.3 4.2.6 6 63 60500960 239 87.3 5.3.6 6 64 60500980 239 87.3 5.2.6 6 65 60455510 240 88.9 6.1.6 6 66 60458990 240 88.9 2.1.6 6 67 60501460 240 88.9 6.1.6 6 68 60458980 242 92.3 2.2.6 6 69 60501780 245 95.9 3.1.6 6 70 60501810 245 95.9 4.3.6 7 1 70502600 213 4.5 3.1.7 7 2 70502450 214 5.3 1.1.7 7 3 70447940 216 7.3 2.2.7 7 4 70502690 216 7.3 5.3.7 7 5 70503260 216 7.3 3.2.7 7 6 70466410 217 8.4 2.1.7 7 7 70502550 218 9.9 5.2.7 7 8 70503150 218 9.9 4.1.7 7 9 70502680 220 13 5.2.7 7 10 70223410 221 14.9 1.3.7 7 11 70446450 221 14.9 3.2.7 7 12 70513610 221 14.9 4.2.7 7 13 70446480 222 17 3.2.7 7 14 70502520 222 17 4.2.7 7 15 70513580 222 17 3.1.7 7 16 70215620 223 19.4 3.1.7 7 17 70446520 223 19.4 6.2.7 7 18 70513600 223 19.4 4.1.7 7 19 70446490 224 21.7 4.10.7 7 20 70503240 224 21.7 1.3.7 7 21 70215630 225 24.4 4.4.7 7 22 70447930 225 24.4 2.2.7 7 23 70503200 226 27 5.2.7 7 24 70503270 227 30.7 3.2.7 7 25 70447530 228 34.5 3.1.7 7 26 70247770 229 38.3 3.1.7 7 27 70449320 229 38.3 4.10.7 7 28 70513560 229 38.3 1.1.7 7 29 70215660 230 42 1.1.7

The Oregon Statewide Assessment System Technical Report Volume 3: Standard Setting
Grade Order of Difficulty Item ID Item
Difficulty Impact Data* Subskill No.†
7 30 70446500 230 42 6.1.7 7 31 70513620 230 42 5.2.7 7 32 70215650 231 45.8 4.2.7 7 33 70223930 231 45.8 2.1.7 7 34 70248120 231 45.8 1.1.7 7 35 70449350 231 45.8 3.2.7 7 36 70457400 231 45.8 3.2.7 7 37 70503230 231 45.8 1.2.7 7 38 70501890 232 49.9 3.2.7 7 39 70501960 232 49.9 6.1.7 7 40 70502640 232 49.9 4.2.7 7 41 70501950 233 53.4 6.3.7 7 42 70447470 234 57 4.3.7 7 43 70509690 234 57 5.1.7 7 44 70449340 235 61.1 3.2.7 7 45 70502000 235 61.1 1.1.7 7 46 70223940 236 64.7 2.1.7 7 47 70247440 236 64.7 6.1.7 7 48 70447510 236 64.7 3.1.7 7 49 70457390 236 64.7 4.5.7 7 50 70509590 236 64.7 1.1.7 7 51 70221340 238 71.4 1.1.7 7 52 70258080 238 71.4 2.1.7 7 53 70449370 238 71.4 3.2.7 7 54 70449400 238 71.4 6.2.7 7 55 70221370 239 74.8 2.1.7 7 56 70502080 239 74.8 5.2.7 7 57 70447490 240 77.9 4.1.7 7 58 70447560 240 77.9 1.1.7 7 59 70502050 240 77.9 4.2.7 7 60 70220160 241 80.4 4.5.7 7 61 70247390 241 80.4 4.9.7 7 62 70449330 241 80.4 6.2.7 7 63 70502020 241 80.4 3.1.7 7 64 70509650 241 80.4 4.1.7 7 65 70447450 242 83.2 5.3.7 7 66 70509640 242 83.2 3.1.7 7 67 70501970 243 85.2 6.1.7 7 68 70509700 245 89 5.1.7 7 69 70457380 247 92.1 4.7.7 7 70 70447460 249 94.5 5.1.7 8 1 80101100 212 2.8 1.1.8 8 2 80248090 213 3.4 4.3.8 8 3 80101090 215 4.8 1.1.8 8 4 80213580 216 5.6 3.2.8

The Oregon Statewide Assessment System Technical Report Volume 3: Standard Setting
Grade Order of Difficulty Item ID Item
Difficulty Impact Data* Subskill No.†
8 5 80213840 217 6.4 4.4.8 8 6 80247360 217 6.4 3.1.8 8 7 80242090 218 7.4 3.2.8 8 8 80247250 218 7.4 4.3.8 8 9 80101150 220 9.7 5.1.8 8 10 80247220 220 9.7 1.1.8 8 11 80220570 221 11.1 1.1.8 8 12 80213010 222 12.5 1.2.8 8 13 80265240 222 12.5 1.2.8 8 14 80248000 223 14.1 1.1.8 8 15 80213030 224 15.9 4.7.8 8 16 80248060 224 15.9 4.3.8 8 17 80242120 225 17.9 4.8.8 8 18 80303980 225 17.9 5.1.8 8 19 80214540 226 20.1 2.1.8 8 20 80247210 226 20.1 1.1.8 8 21 80261160 226 20.1 4.7.8 8 22 80265250 227 22.6 3.2.8 8 23 80265280 227 22.6 4.7.8 8 24 80133720 228 25.3 5.2.8 8 25 80265320 228 25.3 6.1.8 8 26 80101130 229 28.1 4.1.8 8 27 80213600 230 31.1 6.2.8 8 28 80451460 230 31.1 5.1.8 8 29 80100770 231 34.5 4.7.8 8 30 80240180 231 34.5 3.1.8 8 31 80224130 232 39.7 6.2.8 8 32 80303940 232 39.7 3.1.8 8 33 80448250 233 44.8 1.1.8 8 34 80451440 233 44.8 3.1.8 8 35 80214460 234 49.8 2.1.8 8 36 80234800 234 49.8 4.8.8 8 37 80100760 235 54.6 3.2.8 8 38 80214520 235 54.6 2.1.8 8 39 80100820 236 59.2 6.1.8 8 40 80203000 236 59.2 3.2.8 8 41 80234780 237 63.6 3.2.8 8 42 80240210 237 63.6 4.3.8 8 43 80304000 237 63.6 5.1.8 8 44 80100730 238 67.4 1.1.8 8 45 80451510 238 67.4 1.1.8 8 46 80100790 239 71.1 3.2.8 8 47 80100840 239 71.1 4.7.8 8 48 80448360 239 71.1 4.6.8 8 49 80451410 240 74.9 4.2.8

The Oregon Statewide Assessment System Technical Report Volume 3: Standard Setting
Grade Order of Difficulty Item ID Item
Difficulty Impact Data* Subskill No.†
8 50 80203040 241 78.4 4.8.8 8 51 80214430 241 78.4 2.1.8 8 52 80240150 241 78.4 5.1.8 8 53 80240220 241 78.4 1.3.8 8 54 80240240 241 78.4 3.1.8 8 55 80303930 242 81.2 3.1.8 8 56 80448260 242 81.2 1.2.8 8 57 80451490 242 81.2 1.1.8 8 58 80221500 243 84.1 6.2.8 8 59 80240170 243 84.1 4.2.8 8 60 80303900 243 84.1 5.1.8 8 61 80265720 244 86.4 2.1.8 8 62 80303910 244 86.4 1.1.8 8 63 80204280 245 88.5 6.1.8 8 64 80221480 246 90.3 6.1.8 8 65 80234810 246 90.3 4.4.8 8 66 80303960 246 90.3 4.2.8 8 67 80203030 247 91.9 4.7.8 8 68 80265710 248 93.4 2.1.8 8 69 80265740 250 95.6 2.1.8 8 70 80448280 252 97.3 1.2.8 10 1 10248900 221 6.3 1.1.C 10 2 10253890 222 7.3 6.2.C 10 3 10006960 223 8.4 2.1.C 10 4 10249320 223 8.4 5.1.C 10 5 10469970 224 9.5 5.1.C 10 6 10470170 224 9.5 4.4.C 10 7 10469700 225 10.8 1.1.C 10 8 10249230 226 12.2 3.1.C 10 9 10249310 226 12.2 5.1.C 10 10 10253860 227 13.8 4.10.C 10 11 10253870 227 13.8 6.1.C 10 12 10421620 227 13.8 1.3.C 10 13 10006990 229 17.2 2.1.C 10 14 10469740 229 17.2 5.1.C 10 15 10458550 230 19.3 4.9.C 10 16 10458530 231 21.3 3.2.C 10 17 10006950 232 23.7 2.1.C 10 18 10458500 232 23.7 4.6.C 10 19 10469730 233 26.4 1.1.C 10 20 10253850 234 29.1 4.9.C 10 21 10307200 235 32.1 2.1.C 10 22 10422220 235 32.1 5.1.C 10 23 10458560 236 35.4 3.2.C 10 24 10470180 236 35.4 1.1.C

The Oregon Statewide Assessment System Technical Report Volume 3: Standard Setting
Grade Order of Difficulty Item ID Item
Difficulty Impact Data* Subskill No.†
10 25 10470190 236 35.4 4.2.C 10 26 10253910 237 38.8 3.2.C 10 27 10438240 237 38.8 6.1.C 10 28 10278900 239 45.3 6.3.C 10 29 10421630 239 45.3 1.1.C 10 30 10421660 239 45.3 3.1.C 10 31 10307220 240 50.3 2.1.C 10 32 10422230 240 50.3 5.4.C 10 33 10437610 240 50.3 1.1.C 10 34 10458480 240 50.3 1.2.C 10 35 10135410 241 55.4 5.1.C 10 36 10415840 241 55.4 5.4.C 10 37 10438220 241 55.4 3.2.C 10 38 10307510 242 60 3.1.C 10 39 10424230 242 60 6.2.C 10 40 10307170 243 64.3 2.1.C 10 41 10424220 243 64.3 6.1.C 10 42 10307530 244 68.9 4.4.C 10 43 10438230 244 68.9 4.8.C 10 44 10217280 245 72.9 1.1.C 10 45 10307550 245 72.9 4.3.C 10 46 10437820 245 72.9 3.2.C 10 47 10135390 246 76.6 5.3.C 10 48 10218880 246 76.6 3.1.C 10 49 10278800 246 76.6 1.3.C 10 50 10307500 247 80 3.1.C 10 51 10424240 247 80 3.2.C 10 52 10218850 248 83.1 2.1.C 10 53 10424160 248 83.1 4.10.C 10 54 10424190 248 83.1 4.6.C 10 55 10278820 249 85.6 3.2.C 10 56 10307480 249 85.6 1.1.C 10 57 10307560 249 85.6 5.3.C 10 58 10135370 250 88 3.1.C 10 59 10424200 250 88 6.1.C 10 60 10424210 250 88 6.5.C 10 61 10135440 251 90.1 4.3.C 10 62 10218860 252 92 1.1.C 10 63 10278920 252 92 6.1.C 10 64 10218830 254 94.8 2.1.C 10 65 10135330 255 95.7 1.1.C 10 66 10217310 255 95.7 3.1.C 10 67 10278810 255 95.7 3.2.C 10 68 10278860 255 95.7 4.9.C 10 69 10135360 258 97.9 4.2.C

The Oregon Statewide Assessment System Technical Report Volume 3: Standard Setting
Grade Order of Difficulty Item ID Item
Difficulty Impact Data* Subskill No.†
10 70 10217350 262 99.2 5.2.C
* Impact data indicates the percentage of students answering this item incorrectly on the 2005-2006 administration.
† Subskill information denotes the “eligible content” included in the item. This describes the specific area within the discipline tested by the item and can be resolved online at http://www.ode.state.or.us/search/results/?id=53.

The Oregon Statewide Assessment System Technical Report Volume 3: Standard Setting
Table D.2. Standard-Setting Ordered Item Bookmap for Mathematics
Grade Order of Difficulty Item ID Item
Difficulty Impact Data* Subskill No.†
3 1 30401010 190 2.2 1.1.31 3 2 30438230 190 2.2 4.1.33 3 3 30438590 190 2.2 3.3.35 3 4 30112110 191 2.6 2.1.31 3 5 30400190 191 2.6 5.1.32 3 6 30418560 191 2.6 1.1.39 3 7 30212440 192 3 4.1.34 3 8 30293010 192 3 3.4.31 3 9 30411380 192 3 1.2.34 3 10 30216700 193 3.5 2.2.31 3 11 30403250 196 5.8 1.1.39 3 12 30520060 196 5.8 5.1.34 3 13 39700160 197 6.7 2.1.31 3 14 30221230 198 7.7 4.1.33 3 15 30406530 198 7.7 1.1.33 3 16 30415010 199 8.9 3.3.35 3 17 30293610 200 10.2 4.1.31 3 18 30406420 200 10.2 1.1.33 3 19 30432830 200 10.2 2.1.31 3 20 30416990 201 11.4 3.4.31 3 21 30401450 202 12.9 5.1.34 3 22 30404010 202 12.9 4.2.32 3 23 30418860 202 12.9 1.3.33 3 24 30415070 203 16.1 5.1.31 3 25 30438530 203 16.1 2.2.31 3 26 30408840 204 19.6 4.1.31 3 27 30416600 204 19.6 1.1.31 3 28 30237420 205 23.3 3.3.35 3 29 30400070 205 23.3 1.1.33 3 30 30400050 206 27.4 3.4.31 3 31 30500160 206 27.4 5.1.31 3 32 30419370 207 31.5 4.1.31 3 33 30424970 207 31.5 2.2.311 3 34 30418540 208 35.7 1.1.31 3 35 30433160 209 39.8 5.1.34 3 36 30417250 210 44.3 1.2.37 3 37 30401430 211 48.4 1.2.34 3 38 30415180 211 48.4 2.2.38 3 39 30417080 211 48.4 3.4.31 3 40 30418900 211 48.4 4.1.33 3 41 30520560 211 48.4 5.1.31 3 42 30400040 212 52.5 3.4.31 3 43 30235470 213 56.6 1.2.316

The Oregon Statewide Assessment System Technical Report Volume 3: Standard Setting
Grade Order of Difficulty Item ID Item
Difficulty Impact Data* Subskill No.†
3 44 30237710 213 56.6 5.1.32 3 45 30411720 213 56.6 4.1.31 3 46 30414980 213 56.6 2.2.31 3 47 30236170 214 60.8 3.3.35 3 48 30237540 214 60.8 5.4.33 3 49 30404430 215 64.8 1.1.35 3 50 30447540 215 64.8 4.1.33 3 51 30408400 216 69.1 2.2.31 3 52 30400420 217 72.9 1.1.33 3 53 30401240 218 76.4 2.2.38 3 54 30411780 218 76.4 4.2.31 3 55 30430440 218 76.4 5.1.34 3 56 30404410 219 80 1.1.33 3 57 30430780 219 80 3.4.31 3 58 30433150 221 85.8 5.1.31 3 59 30234360 222 87.7 1.2.34 3 60 30237291 222 87.7 1.2.315 3 61 30419350 223 89.8 5.1.32 3 62 30240270 225 92.7 1.2.34 3 63 30400410 225 92.7 4.2.32 3 64 30401270 225 92.7 2.1.31 3 65 30409010 226 94.1 2.2.34 3 66 30448730 226 94.1 5.1.34 3 67 30435280 228 95.9 5.1.31 3 68 30419680 229 96.9 4.1.34 3 69 30419270 230 97.3 4.2.32 3 70 30103270 231 98 1.2.316 3 71 30420500 233 98.5 3.3.35 4 1 40428140 194 0.9 2.1.41 4 2 40438260 197 1.8 3.4.41 4 3 40448710 197 1.8 4.2.41 4 4 40274200 198 2.2 5.1.42 4 5 40438430 198 2.2 2.2.44 4 6 40239410 200 3.2 1.2.416 4 7 40442070 200 3.2 3.4.42 4 8 40404050 201 3.8 4.1.41 4 9 40404420 202 4.5 1.1.43 4 10 40432110 203 5.2 4.2.42 4 11 40290520 204 6 2.2.41 4 12 40292610 204 6 1.1.41 4 13 40415200 204 6 5.3.42 4 14 40440820 205 7 2.2.41 4 15 40273850 206 8.1 5.1.42 4 16 40422030 206 8.1 1.1.43 4 17 40002450 209 13.7 4.1.43
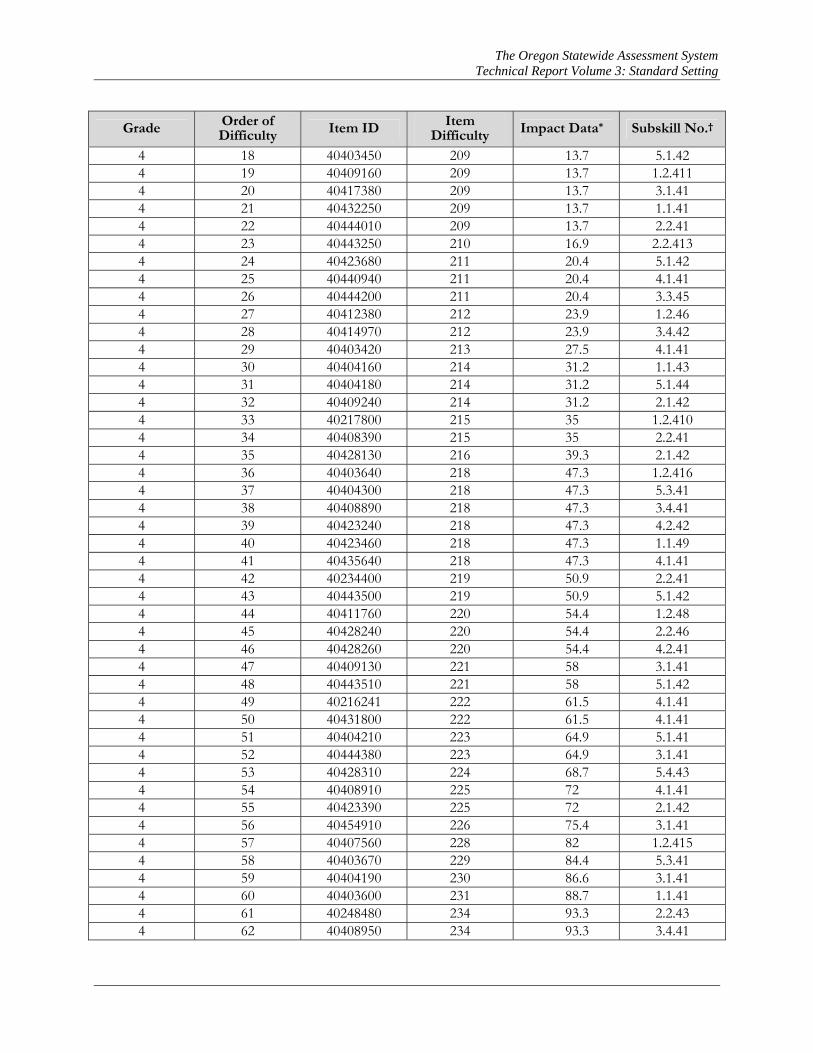
The Oregon Statewide Assessment System Technical Report Volume 3: Standard Setting
Grade Order of Difficulty Item ID Item
Difficulty Impact Data* Subskill No.†
4 18 40403450 209 13.7 5.1.42 4 19 40409160 209 13.7 1.2.411 4 20 40417380 209 13.7 3.1.41 4 21 40432250 209 13.7 1.1.41 4 22 40444010 209 13.7 2.2.41 4 23 40443250 210 16.9 2.2.413 4 24 40423680 211 20.4 5.1.42 4 25 40440940 211 20.4 4.1.41 4 26 40444200 211 20.4 3.3.45 4 27 40412380 212 23.9 1.2.46 4 28 40414970 212 23.9 3.4.42 4 29 40403420 213 27.5 4.1.41 4 30 40404160 214 31.2 1.1.43 4 31 40404180 214 31.2 5.1.44 4 32 40409240 214 31.2 2.1.42 4 33 40217800 215 35 1.2.410 4 34 40408390 215 35 2.2.41 4 35 40428130 216 39.3 2.1.42 4 36 40403640 218 47.3 1.2.416 4 37 40404300 218 47.3 5.3.41 4 38 40408890 218 47.3 3.4.41 4 39 40423240 218 47.3 4.2.42 4 40 40423460 218 47.3 1.1.49 4 41 40435640 218 47.3 4.1.41 4 42 40234400 219 50.9 2.2.41 4 43 40443500 219 50.9 5.1.42 4 44 40411760 220 54.4 1.2.48 4 45 40428240 220 54.4 2.2.46 4 46 40428260 220 54.4 4.2.41 4 47 40409130 221 58 3.1.41 4 48 40443510 221 58 5.1.42 4 49 40216241 222 61.5 4.1.41 4 50 40431800 222 61.5 4.1.41 4 51 40404210 223 64.9 5.1.41 4 52 40444380 223 64.9 3.1.41 4 53 40428310 224 68.7 5.4.43 4 54 40408910 225 72 4.1.41 4 55 40423390 225 72 2.1.42 4 56 40454910 226 75.4 3.1.41 4 57 40407560 228 82 1.2.415 4 58 40403670 229 84.4 5.3.41 4 59 40404190 230 86.6 3.1.41 4 60 40403600 231 88.7 1.1.41 4 61 40248480 234 93.3 2.2.43 4 62 40408950 234 93.3 3.4.41

The Oregon Statewide Assessment System Technical Report Volume 3: Standard Setting
Grade Order of Difficulty Item ID Item
Difficulty Impact Data* Subskill No.†
4 63 40448590 234 93.3 3.1.41 4 64 40274380 235 94.4 4.1.41 4 65 40276630 235 94.4 3.3.45 4 66 40407480 235 94.4 2.2.41 4 67 40432480 235 94.4 5.1.45 4 68 40444120 237 96.1 5.1.45 4 69 40404070 240 97.9 3.1.41 5 1 50407580 202 2 3.3.55 5 2 50426610 204 2.8 1.2.511 5 3 50436020 205 3.3 2.2.510 5 4 50437750 205 3.3 4.1.51 5 5 50276770 206 3.9 1.1.513 5 6 50440340 207 4.6 4.2.57 5 7 50244670 208 5.4 2.1.52 5 8 50220360 209 6.4 1.2.511 5 9 50437640 209 6.4 3.1.51 5 10 50241760 210 7.3 5.4.51 5 11 50429610 210 7.3 5.1.54 5 12 50438900 210 7.3 4.2.51 5 13 50438000 211 8.6 1.1.513 5 14 50438860 211 8.6 2.2.510 5 15 50210610 212 9.8 4.1.53 5 16 50436080 212 9.8 5.1.54 5 17 50211771 214 13.1 1.2.516 5 18 50212690 214 13.1 3.1.51 5 19 50244560 215 14.9 4.2.56 5 20 50245850 215 14.9 2.2.511 5 21 50435260 216 18.9 5.1.54 5 22 50440440 216 18.9 5.3.52 5 23 50408090 217 22.9 5.2.53 5 24 50429850 217 22.9 1.1.510 5 25 50406170 218 27.4 3.1.51 5 26 50429910 218 27.4 5.1.51 5 27 50435230 218 27.4 2.2.511 5 28 50446610 218 27.4 4.2.52 5 29 50426800 219 32.1 1.1.514 5 30 50520980 220 36.4 3.1.51 5 31 50211910 221 41 3.3.55 5 32 50438690 222 45.7 4.2.56 5 33 50426600 223 50.1 1.1.513 5 34 50440320 223 50.1 5.4.54 5 35 50446700 223 50.1 4.2.57 5 36 50407290 224 54.6 3.4.51 5 37 50407300 224 54.6 4.1.53 5 38 50436190 224 54.6 1.2.515

The Oregon Statewide Assessment System Technical Report Volume 3: Standard Setting
Grade Order of Difficulty Item ID Item
Difficulty Impact Data* Subskill No.†
5 39 59700680 224 54.6 2.2.520 5 40 50210900 225 58.8 2.2.511 5 41 50245870 225 58.8 5.4.54 5 42 50441060 225 58.8 5.4.51 5 43 50429660 226 63.1 5.1.51 5 44 50429810 227 66.8 1.1.51 5 45 50431410 227 66.8 5.3.51 5 46 50437710 227 66.8 4.1.51 5 47 50405160 228 70.3 5.1.55 5 48 50412670 228 70.3 3.4.51 5 49 50426550 228 70.3 2.1.52 5 50 50407220 229 73.6 1.1.51 5 51 50426490 229 73.6 2.1.52 5 52 50437680 230 76.3 3.1.51 5 53 50440160 230 76.3 4.1.53 5 54 50441290 230 76.3 2.2.54 5 55 50431460 231 79 3.4.51 5 56 50446910 231 79 4.3.53 5 57 50429760 232 81.8 2.1.52 5 58 50436220 232 81.8 5.1.55 5 59 50431450 234 86.8 3.4.51 5 60 50104140 235 88.7 1.1.51 5 61 50274160 235 88.7 2.2.511 5 62 50437610 235 88.7 3.1.51 5 63 50447080 235 88.7 4.2.52 5 64 50277210 237 91.8 3.3.55 5 65 50426660 237 91.8 2.2.511 5 66 50211830 239 94 1.2.516 5 67 50419860 239 94 4.2.56 5 68 50403170 240 94.9 3.3.55 5 69 50435410 240 94.9 2.2.54 5 70 50209110 243 97 1.2.510 6 1 60502840 209 4.8 4.2.67 6 2 60414000 212 8.4 1.1.65 6 3 60439610 212 8.4 4.2.67 6 4 60274500 213 9.8 3.4.62 6 5 60241440 214 11.3 5.1.62 6 6 60406930 214 11.3 2.2.621 6 7 60502130 215 13.2 4.2.67 6 8 60220170 217 17.3 3.4.62 6 9 60502090 217 17.3 4.2.66 6 10 60293350 218 19.7 1.3.63 6 11 60403000 219 22.3 5.1.62 6 12 60411240 219 22.3 2.2.621 6 13 60444900 219 22.3 3.1.61

The Oregon Statewide Assessment System Technical Report Volume 3: Standard Setting
Grade Order of Difficulty Item ID Item
Difficulty Impact Data* Subskill No.†
6 14 60407150 221 29.7 1.1.611 6 15 60502790 221 29.7 4.2.66 6 16 60417300 222 33.7 2.2.618 6 17 60416700 223 37.9 5.1.61 6 18 60424050 223 37.9 3.1.61 6 19 60404840 224 42.2 1.3.62 6 20 60420750 224 42.2 5.1.65 6 21 60400870 225 46.1 5.1.64 6 22 60420560 225 46.1 4.2.66 6 23 60420790 225 46.1 2.2.621 6 24 60444890 226 50.3 3.1.61 6 25 60406910 227 54.3 1.1.61 6 26 60502120 227 54.3 4.1.61 6 27 60503870 227 54.3 3.4.61 6 28 60503890 227 54.3 3.3.65 6 29 60422870 228 58.2 5.1.64 6 30 60414260 229 61.8 4.2.66 6 31 60106871 230 65.3 5.1.61 6 32 60400750 230 65.3 5.1.62 6 33 60404820 230 65.3 1.1.65 6 34 60501880 230 65.3 3.4.62 6 35 60225870 231 68.7 2.2.64 6 36 60404910 231 68.7 4.2.66 6 37 60409140 231 68.7 3.4.62 6 38 60292660 232 71.9 2.2.611 6 39 60415810 232 71.9 1.2.610 6 40 60416690 232 71.9 1.3.63 6 41 60420570 233 74.9 4.2.66 6 42 60423890 233 74.9 5.1.64 6 43 60426220 233 74.9 3.4.61 6 44 60400730 234 77.9 5.1.61 6 45 60427630 234 77.9 3.1.61 6 46 60403760 236 82.8 2.2.615 6 47 60416930 236 82.8 2.2.611 6 48 60502770 236 82.8 4.2.66 6 49 60207530 237 85 1.1.69 6 50 60407120 237 85 2.2.620 6 51 60419800 237 85 5.1.65 6 52 60420800 237 85 4.2.66 6 53 60503980 237 85 3.4.61 6 54 60406140 238 87 4.2.67 6 55 60411920 239 88.8 1.2.613 6 56 60422220 239 88.8 5.1.65 6 57 60423710 240 90.2 3.4.61 6 58 60428770 240 90.2 3.4.62

The Oregon Statewide Assessment System Technical Report Volume 3: Standard Setting
Grade Order of Difficulty Item ID Item
Difficulty Impact Data* Subskill No.†
6 59 60245530 241 91.4 1.1.610 6 60 60400990 241 91.4 4.2.67 6 61 60400820 244 94.5 5.1.63 6 62 60400930 244 94.5 4.1.61 6 63 60407960 244 94.5 2.2.615 6 64 60404920 245 95.6 2.2.615 6 65 60419720 245 95.6 4.2.67 6 66 60422830 246 96.3 2.2.610 6 67 60423860 246 96.3 5.1.64 6 68 60424600 246 96.3 4.2.66 6 69 60407070 247 96.8 2.2.615 6 70 60422810 247 96.8 2.1.61 7 1 70435810 216 8.2 2.1.71 7 2 70404560 218 11.3 1.3.72 7 3 70251690 220 14.9 4.2.72 7 4 70292540 220 14.9 1.1.71 7 5 70442820 221 17 1.2.71 7 6 70403110 222 19.2 2.2.715 7 7 70413480 223 21.6 5.3.71 7 8 70500850 223 21.6 4.2.76 7 9 70408790 224 24.2 1.3.72 7 10 70415950 225 26.7 4.3.71 7 11 70408630 226 29.2 1.1.79 7 12 70446630 227 32.9 4.2.77 7 13 70292270 228 36.6 3.2.74 7 14 70413440 228 36.6 1.1.79 7 15 70501060 228 36.6 4.2.72 7 16 70207360 229 40.3 1.1.714 7 17 70404780 229 40.3 3.3.73 7 18 70003380 230 44.1 3.2.74 7 19 70275330 230 44.1 4.2.72 7 20 70430330 230 44.1 5.3.71 7 21 70291760 231 47.8 5.1.71 7 22 70209370 232 51.3 1.2.711 7 23 70407910 232 51.3 5.3.71 7 24 70415800 232 51.3 5.4.74 7 25 70208650 233 54.8 5.2.73 7 26 70246920 233 54.8 2.2.711 7 27 70430240 233 54.8 3.3.73 7 28 70406160 234 58.3 2.2.720 7 29 70411900 234 58.3 1.2.71 7 30 70415790 234 58.3 3.2.74 7 31 70504400 234 58.3 4.2.76 7 32 70402100 235 61.6 1.2.716 7 33 70249180 236 65 3.2.72

The Oregon Statewide Assessment System Technical Report Volume 3: Standard Setting
Grade Order of Difficulty Item ID Item
Difficulty Impact Data* Subskill No.†
7 34 70275160 236 65 2.2.711 7 35 70427130 236 65 3.3.72 7 36 70430370 236 65 4.1.71 7 37 70502640 236 65 4.3.73 7 38 70504700 236 65 4.4.71 7 39 70250410 237 68.4 5.3.71 7 40 70404790 237 68.4 3.3.72 7 41 70430320 237 68.4 3.3.76 7 42 70434500 237 68.4 4.3.71 7 43 70414960 238 71.7 3.4.72 7 44 70454760 238 71.7 4.1.71 7 45 70501430 238 71.7 5.3.71 7 46 70505540 238 71.7 4.3.71 7 47 70277810 239 74.7 3.3.75 7 48 70402370 239 74.7 5.3.71 7 49 70408720 239 74.7 4.2.77 7 50 70413460 239 74.7 1.1.711 7 51 70407770 242 81.8 4.2.76 7 52 70219970 243 83.7 3.2.71 7 53 70504770 243 83.7 4.2.72 7 54 70404750 244 85.3 5.1.77 7 55 70402860 245 86.8 5.1.73 7 56 70501030 245 86.8 2.2.711 7 57 70503340 245 86.8 4.2.72 7 58 70278700 246 88.3 3.4.72 7 59 70501070 246 88.3 4.4.71 7 60 70430920 247 89.7 4.3.71 7 61 70431040 247 89.7 2.2.715 7 62 70431310 247 89.7 4.1.71 7 63 70432610 248 91 2.1.74 7 64 70433430 248 91 2.1.71 7 65 70530390 249 92.1 4.4.71 7 66 70416770 250 93.4 5.4.74 7 67 70501600 250 93.4 5.3.71 7 68 70435710 253 96 2.2.711 7 69 70504100 253 96 2.2.720 7 70 70402230 254 96.6 3.2.72 8 1 80442440 217 6.4 3.1.82 8 2 80402360 219 8.9 5.3.81 8 3 80407920 221 11.5 5.1.89 8 4 80440530 221 11.5 3.1.82 8 5 80443060 221 11.5 2.2.821 8 6 80411190 222 13.3 5.4.87 8 7 80249820 223 15 1.2.81 8 8 80444920 223 15 4.2.812

The Oregon Statewide Assessment System Technical Report Volume 3: Standard Setting
Grade Order of Difficulty Item ID Item
Difficulty Impact Data* Subskill No.†
8 9 80111320 224 16.9 5.1.87 8 10 80400980 224 16.9 4.2.82 8 11 80441590 224 16.9 4.3.81 8 12 80249810 225 19.2 4.1.81 8 13 80424000 225 19.2 1.1.810 8 14 80410240 226 21.7 3.2.81 8 15 80443040 226 21.7 2.2.822 8 16 80443120 226 21.7 1.2.816 8 17 80444560 227 24.4 3.3.86 8 18 80252410 228 27.1 4.2.86 8 19 80414280 228 27.1 4.2.82 8 20 80443990 228 27.1 4.2.812 8 21 80270410 229 29.9 5.1.89 8 22 80441340 230 32.3 3.1.82 8 23 80442420 232 38.9 2.1.81 8 24 80507160 233 43 3.4.81 8 25 80411160 234 47.3 5.2.83 8 26 80414230 234 47.3 4.2.87 8 27 80416720 234 47.3 2.2.822 8 28 80440760 234 47.3 4.1.85 8 29 80250680 235 51.5 5.4.84 8 30 80413790 235 51.5 3.4.81 8 31 80414070 235 51.5 1.1.81 8 32 80414380 235 51.5 4.3.82 8 33 80441400 235 51.5 3.1.81 8 34 80441540 235 51.5 1.3.83 8 35 80221580 236 55.4 1.1.87 8 36 80400920 237 59.6 4.1.83 8 37 80404000 237 59.6 5.2.83 8 38 80411140 237 59.6 1.1.810 8 39 80413320 237 59.6 4.3.81 8 40 80502350 237 59.6 3.4.81 8 41 80402320 238 63.2 3.3.85 8 42 80412550 238 63.2 2.1.82 8 43 80269850 239 66.4 3.1.81 8 44 80441530 240 69.6 4.2.82 8 45 80432660 241 72.6 1.1.89 8 46 80440750 241 72.6 4.2.88 8 47 80442480 241 72.6 3.3.86 8 48 80500300 241 72.6 3.3.85 8 49 80220320 242 75.3 1.2.815 8 50 80443820 242 75.3 2.1.81 8 51 80444660 242 75.3 4.1.83 8 52 80403940 243 77.6 4.3.83 8 53 80251300 246 83.4 5.1.81

The Oregon Statewide Assessment System Technical Report Volume 3: Standard Setting
Grade Order of Difficulty Item ID Item
Difficulty Impact Data* Subskill No.†
8 54 80401000 246 83.4 4.2.87 8 55 80411110 246 83.4 5.3.82 8 56 80444970 246 83.4 2.1.82 8 57 80224160 247 85.2 2.2.821 8 58 80251770 247 85.2 4.2.82 8 59 80252210 247 85.2 5.1.89 8 60 80411050 247 85.2 2.1.82 8 61 80412760 247 85.2 3.3.86 8 62 80444550 248 86.9 2.2.811 8 63 80275150 249 88.7 5.1.87 8 64 80275750 249 88.7 5.4.87 8 65 80403710 249 88.7 1.1.81 8 66 80411020 249 88.7 4.3.83 8 67 80253910 251 91.4 4.2.86 8 68 80205700 252 92.7 4.2.87 8 69 80442630 255 95.4 2.2.818 8 70 80441390 256 96 1.3.85 10 1 10225300 227 19.9 5.2.C4 10 2 10215340 229 24.6 5.4.C4 10 3 10418200 229 24.6 3.4.C2 10 4 10214490 230 27.1 2.1.C2 10 5 10229440 230 27.1 5.1.C8 10 6 10416430 230 27.1 1.2.C17 10 7 10225800 231 29.8 5.1.C12 10 8 10421560 231 29.8 4.1.C5 10 9 10213800 232 32.5 4.2.C4 10 10 19601330 232 32.5 2.2.C12 10 11 10438340 233 35.5 4.2.C4 10 12 10401790 234 38.9 3.2.C2 10 13 10206420 235 42.2 4.2.C8 10 14 10227340 235 42.2 5.1.C5 10 15 10213570 236 45.6 1.1.C9 10 16 10214160 236 45.6 2.2.C12 10 17 10438930 236 45.6 4.2.C7 10 18 10441910 236 45.6 4.3.C1 10 19 10214440 237 49.2 5.1.C7 10 20 10429140 237 49.2 5.4.C7 10 21 10445270 237 49.2 4.2.C7 10 22 10445500 237 49.2 4.1.C1 10 23 10427320 239 55.8 1.3.C2 10 24 10434810 239 55.8 3.4.C2 10 25 10436810 239 55.8 4.2.C7 10 26 10427760 240 61.5 2.2.C10 10 27 10427860 240 61.5 1.1.C3 10 28 10437340 240 61.5 4.1.C3

The Oregon Statewide Assessment System Technical Report Volume 3: Standard Setting
Grade Order of Difficulty Item ID Item
Difficulty Impact Data* Subskill No.†
10 29 10445250 240 61.5 4.2.C5 10 30 10227270 241 66.4 5.3.C2 10 31 10439030 241 66.4 4.3.C3 10 32 10224740 242 70.8 3.4.C1 10 33 10402620 242 70.8 4.2.C2 10 34 10412970 242 70.8 3.3.C5 10 35 10429030 242 70.8 5.2.C4 10 36 10427400 243 74.8 2.2.C12 10 37 10439810 243 74.8 4.2.C7 10 38 10117180 244 78 5.1.C3 10 39 10229690 244 78 3.1.C1 10 40 10410120 244 78 1.2.C11 10 41 10424310 244 78 1.3.C3 10 42 10438920 244 78 5.3.C1 10 43 10433790 245 80.7 3.4.C2 10 44 10225000 246 83.3 3.3.C7 10 45 10225020 247 85.4 4.4.C2 10 46 10425750 247 85.4 2.2.C13 10 47 10426930 247 85.4 4.2.C5 10 48 10412960 248 87.3 3.2.C2 10 49 10421280 248 87.3 1.1.C1 10 50 10425920 249 88.8 5.1.C9 10 51 10433710 249 88.8 5.4.C5 10 52 10215440 250 90.2 3.2.C1 10 53 10434210 250 90.2 5.1.C5 10 54 10439110 250 90.2 4.2.C6 10 55 10442970 250 90.2 4.2.C3 10 56 10442810 251 91.6 4.2.C12 10 57 10225160 252 92.8 5.1.C7 10 58 10401510 252 92.8 4.3.C1 10 59 10422490 252 92.8 2.2.C15 10 60 10427920 252 92.8 5.3.C1 10 61 10434140 252 92.8 3.3.C1 10 62 10438350 253 93.9 4.2.C4 10 63 10219240 254 94.7 3.2.C3 10 64 10214660 255 95.4 1.1.C9 10 65 10229850 257 96.7 4.4.C3 10 66 10402490 258 97.2 3.2.C1 10 67 10427520 258 97.2 5.1.C5 10 68 10442910 258 97.2 4.2.C7 10 69 10414470 259 97.7 3.2.C4 10 70 10439370 259 97.7 4.1.C5
* Impact data indicates the percentage of students answering this item incorrectly on the 2005-2006 administration.

The Oregon Statewide Assessment System Technical Report Volume 3: Standard Setting
† Subskill information denotes the “eligible content” included in the item. This describes the specific area within the discipline tested by the item and can be resolved online at http://www.ode.state.or.us/search/results/?id=53.

The Oregon Statewide Assessment System Technical Report Volume 3: Standard Setting
Table D.3. Standard-Setting Ordered Item Bookmap for Science
Grade Order of Difficulty Item ID Item Difficulty Impact Data* Subskill No.†
5 1 50516240 208 1.5 2.3.51.1 5 2 50205420 211 3.2 4.2.51.2 5 3 50613170 211 3.2 2.4.52.3 5 4 50401620 212 4 4.3.51.2 5 5 50414590 212 4 3.1.53.1 5 6 50511400 212 4 2.3.52.1 5 7 50412290 213 4.9 2.4.52.1 5 8 50401230 214 5.8 3.2.51.2 5 9 50000590 215 6.9 2.2.51.1 5 10 50400450 215 6.9 4.2.52.2 5 11 50219710 216 8 2.1.51.2 5 12 50000960 217 9.3 3.4.51.2 5 13 50404380 217 9.3 4.1.51.3 5 14 50510510 218 10.8 3.3.51.4 5 15 50103700 221 16.1 4.2.51.1 5 16 50413830 221 16.1 2.2.51.1 5 17 50207020 222 18.2 4.3.51.1 5 18 50404220 222 18.2 4.1.51.3 5 19 50510780 222 18.2 3.3.51.1 5 20 50205560 224 23.8 4.2.52.1 5 21 50505780 224 23.8 2.3.52.2 5 22 50507280 224 23.8 4.3.51.1 5 23 50505940 225 27.1 3.2.51.1 5 24 50210280 226 31 2.1.51.2 5 25 50219780 227 34.9 3.4.51.2 5 26 50000160 228 39.1 2.2.51.1 5 27 50505730 228 39.1 4.1.51.1 5 28 50503450 229 43.3 3.4.51.1 5 29 50505770 229 43.3 3.3.51.5 5 30 50507500 230 47.8 4.1.51.4 5 31 50110840 231 52 4.2.52.1 5 32 50403210 231 52 2.3.52.1 5 33 50505860 232 56.5 3.3.51.4 5 34 50508120 232 56.5 3.1.52.1 5 35 50413230 233 60.5 2.2.51.1 5 36 50504820 233 60.5 4.1.51.1 5 37 50516610 234 64.4 3.3.51.3 5 38 50100480 235 68.1 2.4.51.1 5 39 50400010 235 68.1 3.1.51.1 5 40 50413960 237 74.5 4.1.51.1 5 41 50404930 238 77.6 3.1.51.1 5 42 50204360 239 80.5 2.2.51.1 5 43 50414690 239 80.5 4.3.51.2
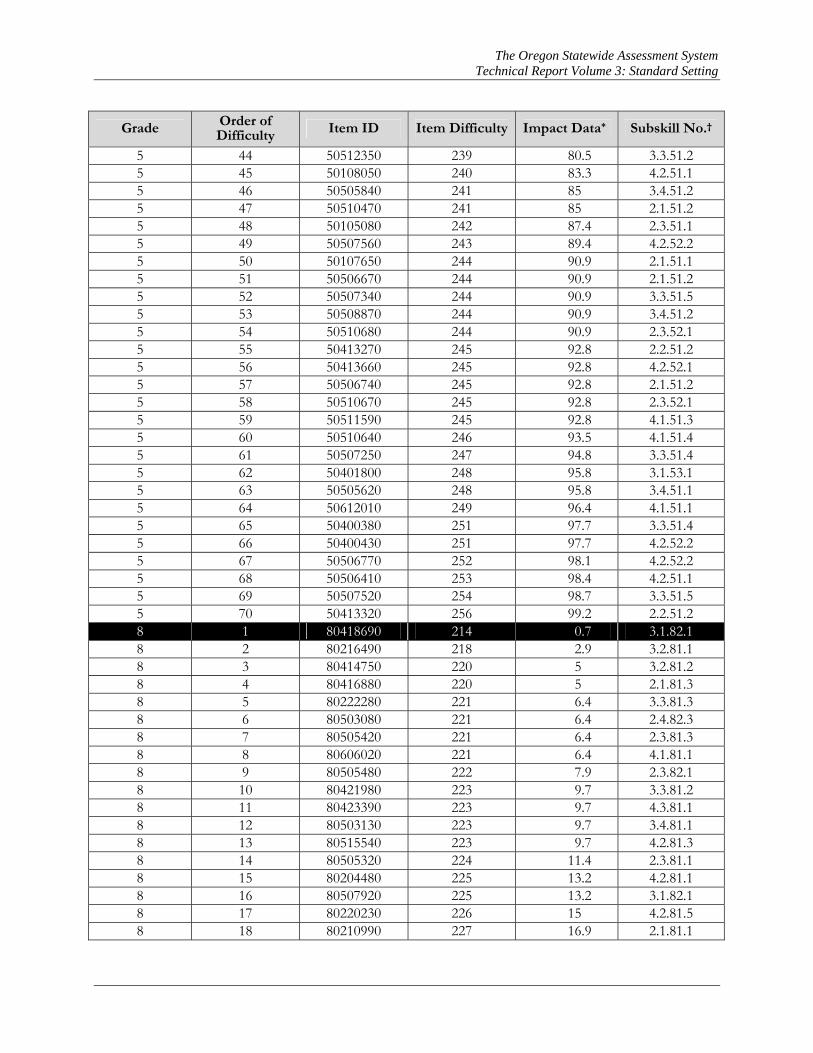
The Oregon Statewide Assessment System Technical Report Volume 3: Standard Setting
Grade Order of Difficulty Item ID Item Difficulty Impact Data* Subskill No.†
5 44 50512350 239 80.5 3.3.51.2 5 45 50108050 240 83.3 4.2.51.1 5 46 50505840 241 85 3.4.51.2 5 47 50510470 241 85 2.1.51.2 5 48 50105080 242 87.4 2.3.51.1 5 49 50507560 243 89.4 4.2.52.2 5 50 50107650 244 90.9 2.1.51.1 5 51 50506670 244 90.9 2.1.51.2 5 52 50507340 244 90.9 3.3.51.5 5 53 50508870 244 90.9 3.4.51.2 5 54 50510680 244 90.9 2.3.52.1 5 55 50413270 245 92.8 2.2.51.2 5 56 50413660 245 92.8 4.2.52.1 5 57 50506740 245 92.8 2.1.51.2 5 58 50510670 245 92.8 2.3.52.1 5 59 50511590 245 92.8 4.1.51.3 5 60 50510640 246 93.5 4.1.51.4 5 61 50507250 247 94.8 3.3.51.4 5 62 50401800 248 95.8 3.1.53.1 5 63 50505620 248 95.8 3.4.51.1 5 64 50612010 249 96.4 4.1.51.1 5 65 50400380 251 97.7 3.3.51.4 5 66 50400430 251 97.7 4.2.52.2 5 67 50506770 252 98.1 4.2.52.2 5 68 50506410 253 98.4 4.2.51.1 5 69 50507520 254 98.7 3.3.51.5 5 70 50413320 256 99.2 2.2.51.2 8 1 80418690 214 0.7 3.1.82.1 8 2 80216490 218 2.9 3.2.81.1 8 3 80414750 220 5 3.2.81.2 8 4 80416880 220 5 2.1.81.3 8 5 80222280 221 6.4 3.3.81.3 8 6 80503080 221 6.4 2.4.82.3 8 7 80505420 221 6.4 2.3.81.3 8 8 80606020 221 6.4 4.1.81.1 8 9 80505480 222 7.9 2.3.82.1 8 10 80421980 223 9.7 3.3.81.2 8 11 80423390 223 9.7 4.3.81.1 8 12 80503130 223 9.7 3.4.81.1 8 13 80515540 223 9.7 4.2.81.3 8 14 80505320 224 11.4 2.3.81.1 8 15 80204480 225 13.2 4.2.81.1 8 16 80507920 225 13.2 3.1.82.1 8 17 80220230 226 15 4.2.81.5 8 18 80210990 227 16.9 2.1.81.1

The Oregon Statewide Assessment System Technical Report Volume 3: Standard Setting
Grade Order of Difficulty Item ID Item Difficulty Impact Data* Subskill No.†
8 19 80416240 227 16.9 4.2.82.1 8 20 80506240 227 16.9 4.1.81.1 8 21 80417060 228 19.1 3.3.81.2 8 22 80105521 229 21.3 3.4.81.2 8 23 80424260 230 23.6 2.3.82.1 8 24 80217880 231 26.1 4.2.82.5 8 25 80502940 232 28.9 4.1.81.1 8 26 80503940 232 28.9 2.3.81.3 8 27 80216510 233 31.8 3.1.82.1 8 28 80503160 233 31.8 3.1.83.4 8 29 80419250 235 39.2 2.1.81.1 8 30 80506990 235 39.2 4.2.82.5 8 31 80501220 236 43.2 3.1.83.2 8 32 80425630 237 47.3 3.3.81.2 8 33 80507750 237 47.3 4.3.81.1 8 34 80003690 238 51.4 2.2.81.3 8 35 80205830 238 51.4 4.2.81.1 8 36 80606910 238 51.4 3.2.81.4 8 37 80212670 239 55.4 4.2.81.1 8 38 80222730 239 55.4 3.3.81.4 8 39 80100011 240 59.4 4.2.81.4 8 40 80415610 240 59.4 2.3.82.1 8 41 80416250 241 63 4.2.82.1 8 42 80420880 242 66.9 3.1.83.1 8 43 80100910 243 70.4 2.2.81.3 8 44 80211410 243 70.4 4.2.81.3 8 45 80200630 244 73.8 3.3.81.1 8 46 80415360 244 73.8 2.3.82.1 8 47 80222160 245 77 4.2.81.4 8 48 80424300 245 77 2.4.82.3 8 49 80415720 246 79.8 2.4.82.1 8 50 80500410 246 79.8 4.2.82.5 8 51 80606800 246 79.8 3.2.81.4 8 52 80213560 247 82.3 2.1.81.1 8 53 80506920 247 82.3 4.2.82.2 8 54 80424840 248 84.8 3.2.81.3 8 55 80416090 249 86.7 2.1.81.1 8 56 80606390 250 88.6 4.2.82.4 8 57 80416260 251 90.4 4.2.82.1 8 58 80418900 251 90.4 3.1.82.1 8 59 80503920 251 90.4 2.4.81.1 8 60 80607940 251 90.4 3.2.81.1 8 61 80415570 252 91.8 2.3.81.3 8 62 80204440 253 93 2.1.81.2 8 63 80224310 253 93 4.2.81.5

The Oregon Statewide Assessment System Technical Report Volume 3: Standard Setting
Grade Order of Difficulty Item ID Item Difficulty Impact Data* Subskill No.†
8 64 80412760 254 94 3.1.83.3 8 65 80424930 254 94 2.4.82.2 8 66 80220580 255 94.9 4.2.82.6 8 67 80415740 255 94.9 2.2.81.1 8 68 80210720 257 96.4 2.2.81.1 8 69 80417070 258 97 3.3.81.4 8 70 80507120 258 97 4.2.82.1 10 1 10206890 221 3 3.3.C1.2 10 2 10435440 222 3.4 4.2.C1.3 10 3 10500240 222 3.4 2.1.C1.3 10 4 10210130 223 4.6 4.1.C1.1 10 5 10218060 224 5.9 3.1.C3.7 10 6 10206510 225 6.7 3.3.C1.1 10 7 10217930 225 6.7 2.2.C1.1 10 8 10511740 225 6.7 4.3.C1.2 10 9 10440460 227 9.3 3.4.C1.1 10 10 10510840 227 9.3 4.2.C1.3 10 11 10213350 228 11.5 2.4.C1.2 10 12 10218260 228 11.5 4.2.C2.2 10 13 10511010 228 11.5 3.1.C3.5 10 14 10511700 228 11.5 4.3.C1.1 10 15 10510070 229 13.6 2.1.C1.1 10 16 10214690 231 17.1 4.2.C1.1 10 17 10218070 231 17.1 2.4.C2.2 10 18 10221040 231 17.1 3.4.C1.2 10 19 10510870 232 19.6 3.1.C3.4 10 20 10221470 233 22.3 2.1.C1.2 10 21 10434100 233 22.3 4.2.C1.3 10 22 10221310 234 23.7 3.2.C1.5 10 23 10200581 235 26.6 2.4.C2.3 10 24 10434280 235 26.6 4.2.C2.4 10 25 10218250 236 29.8 3.1.C3.1 10 26 10508450 237 33.3 3.4.C1.5 10 27 10220660 238 36.6 2.1.C1.1 10 28 10211910 240 44 2.2.C1.1 10 29 10005800 241 49.1 3.2.C1.2 10 30 10221201 241 49.1 3.4.C1.4 10 31 10211950 242 52 4.1.C1.1 10 32 10436760 242 52 2.4.C2.4 10 33 10006220 243 56.6 2.1.C1.2 10 34 10200320 243 56.6 4.2.C1.3 10 35 10439270 243 56.6 3.2.C1.4 10 36 10436830 244 61.4 3.1.C3.6 10 37 10511750 244 61.4 4.2.C2.5 10 38 10200561 245 64.4 2.4.C2.3

The Oregon Statewide Assessment System Technical Report Volume 3: Standard Setting
Grade Order of Difficulty Item ID Item Difficulty Impact Data* Subskill No.†
10 39 10500850 245 64.4 4.2.C2.3 10 40 10442410 246 68.9 4.3.C1.2 10 41 10511820 246 68.9 2.4.C1.1 10 42 10005890 247 73.2 3.1.C3.2 10 43 10108700 247 73.2 2.4.C2.2 10 44 10440350 247 73.2 4.2.C1.1 10 45 10509520 248 75.5 2.3.C1.1 10 46 10213000 249 79.3 4.3.C1.1 10 47 10435260 250 81.2 3.1.C3.6 10 48 10437320 250 81.2 2.4.C2.1 10 49 10210480 251 84.6 2.1.C1.1 10 50 10500860 251 84.6 3.1.C3.5 10 51 10200541 252 87.5 2.4.C2.3 10 52 10433690 252 87.5 4.2.C2.5 10 53 10006660 253 88.8 4.2.C1.1 10 54 10434210 253 88.8 3.3.C1.2 10 55 10101850 254 91.4 4.2.C1.2 10 56 10509270 254 91.4 2.4.C1.2 10 57 10510810 254 91.4 4.2.C1.3 10 58 10220860 255 92.4 2.1.C1.1 10 59 10436000 255 92.4 3.1.C3.2 10 60 10212210 256 93 3.2.C1.2 10 61 10440750 256 93 2.2.C1.1 10 62 10227100 257 94.9 4.1.C1.1 10 63 10440530 257 94.9 4.2.C2.3 10 64 10212140 258 95.6 4.3.C1.2 10 65 10434310 258 95.6 3.1.C3.7 10 66 10509400 259 96 2.4.C2.4 10 67 10201190 260 97.3 3.1.C3.3 10 68 10221540 261 97.5 3.1.C3.1 10 69 10440580 262 97.8 2.2.C1.2 10 70 10218390 263 98.5 4.3.C1.1
* Impact data indicates the percentage of students answering this item incorrectly on the 2005-2006 administration.
† Subskill information denotes the “eligible content” included in the item. This describes the specific area within the discipline tested by the item and can be resolved online at http://www.ode.state.or.us/search/results/?id=53.

The Oregon Statewide Assessment System Technical Report Volume 3: Standard Setting
APPENDIX E INITIAL BOOKMARKS SET BY INDIVIDUAL PANELISTS
Table E.1. Median Initial Individual Bookmarks Set for Reading/Literature
Grade Nearly Meets Meets standards Exceeds standards
3 199 203 215 5 210 217 228 8 224 230 239 10 231 237 248
Table E.2. Median Initial Individual Bookmarks Set for Math
Grade Nearly Meets Meets standards Exceeds standards
3 200 205 215 5 214 217 228 8 225 230 241 10 232 239 247
Table E.1. Median Initial Individual Bookmarks Set for Science
Grade Nearly Meets Meets standards Exceeds standards
5 216 225 238 8 227 234 246 10 234 240 248

The Oregon Statewide Assessment System Technical Report Volume 3: Standard Setting
F-1
APPENDIX F CONSENSUS BOOKMARKS SET ACROSS GRADE SPANS
Table F.1. Consensus Bookmarks Set for Reading/Literature
Grade Nearly Meets Meets standards Exceeds standards
3 199 203 216 5 209 218 230 8 224 230 241 10 231 236 248
Table F.2. Consensus Bookmarks Set for Math
Grade Nearly Meets Meets standards Exceeds standards
3 201 204 215 5 214 218 230 8 225 230 241 10 231 236 246
Table F.3. Consensus Bookmarks Set for Science
Grade Nearly Meets Meets standards Exceeds standards
5 216 225 238 8 229 234 246 10 235 240 249

The Oregon Statewide Assessment System Technical Report Volume 3: Standard Setting
G-1
APPENDIX G RESEARCH AND IMPACT DATA
Table G.1. Cut Scores for Reading/Literature, Meets and Exceeds Standards
Meets standards Exceeds standards Meets and Exceeds
Grade RIT score
Estimated overall percent of students at or above cut (excludes exceeds)
RIT score
Estimated overall percent of students
at or above cut
Estimated percent of
students rated as proficient
3 204 47.5% 218 34.2% 81.7% 4* 211 45.6% 223 34.0% 79.6% 5 218 45.8% 230 25.6% 71.4%
6* 222 45.1% 234 25.3% 70.4% 7* 227 44.1% 239 25.2% 69.3% 8 231 43.9% 241 21.6% 65.5% 10 236 47.6% 248 16.9% 64.6%
* interpolated score based on scores set by participants
Table G.2. Cut Scores for Math, Meets and Exceeds Standards
Meets standards Exceeds standards Meets and Exceeds
Grade RIT score
Estimated overall percent of students at or above cut (excludes exceeds)
RIT score
Estimated overall percent of students
at or above cut
Estimated percent of
students rated as proficient
3 205 49.7% 217 27.1% 76.7% 4* 212 48.1% 225 28.0% 76.1% 5 218 46.1% 229 26.4% 72.6%
6* 221 42.2% 232 28.1% 70.3% 7* 226 42.5% 238 28.3% 70.8% 8 230 40.3% 241 27.4% 67.7% 10 236 37.7% 246 16.7% 54.4%
* interpolated score based on scores set by participants
Table G.3. Cut Scores for Science, Meets and Exceeds Standards
Meets standards Exceeds standards Meets and Exceeds
Grade RIT score
Estimated overall percent of students at or above cut (excludes exceeds)
RIT score
Estimated overall percent of students
at or above cut
Estimated percent of
students rated as proficient
5 225 50.5% 238 22.4% 72.9% 8 234 44.2% 246 20.2% 64.4% 10 240 35.3% 249 20.7% 56.0%

The Oregon Statewide Assessment System Technical Report Volume 3: Standard Setting
G-2
Table G.4. Standard Setting, Step 1RIT Score of Recommended Bookmark Question by Each Participant for Reading, Grade 3
Participant Nearly Meets Meets Exceeds 2 200 203 215 3 199 203 215 4 198 201 212 5 194 201 216 6 200 201 216 7 199 203 214 8 198 201 216 9 199 204 219 10 198 203 215 11 198 202 215 12 199 203 216 13 198 204 212 14 199 204 213 15 199 203 213 16 193 199 215 17 200 208 215 18 198 203 212 19 201 214 224 20 199 203 215
Median 199 203 215 Maximum 201 214 224 Minimum 193 199 212 SD 1.92 3.16 2.75

The Oregon Statewide Assessment System Technical Report Volume 3: Standard Setting
G-3
Table G.5. Standard Setting, Step 1RIT Score of Recommended Bookmark Question by Each Participant for Reading, Grade 5
Participant Nearly Meets Meets Exceeds 2 208 216 228 3 211 218 231 4 218 221 234 5 213 221 228 6 211 221 229 7 211 220 229 8 209 216 228 9 211 216 226 10 209 216 226 11 209 216 228 12 211 217 227 13 211 217 228 14 209 211 228 15 209 214 226 16 211 220 229 17 209 217 229 18 208 214 227 19 211 219 235 20 210 220 231 22 209 218 230 23 211 216 222 24 209 219 234
Median 210 217 228 Maximum 218 221 235 Minimum 208 211 222 SD 2.13 2.59 2.96

The Oregon Statewide Assessment System Technical Report Volume 3: Standard Setting
G-4
Table G.6. Standard Setting, Step 1RIT Score of Recommended Bookmark Question by Each Participant for Reading, Grade 8
Participant Nearly Meets Meets Exceeds 2 220 228 237 3 223 234 241 4 224 230 239 5 220 230 236 6 222 230 238 7 221 230 239 8 224 232 239 9 224 230 241 10 223 232 239 11 225 234 242 12 226 234 242 13 226 233 240 14 224 233 239 15 223 229 238 16 224 231 237 17 224 231 239 18 225 230 239 19 220 228 237 20 224 230 238 22 225 230 237
Median 224 230 239 Maximum 226 234 242 Minimum 220 228 236 SD 1.87 1.88 1.69

The Oregon Statewide Assessment System Technical Report Volume 3: Standard Setting
G-5
Table G.7. Standard Setting, Step 1RIT Score of Recommended Bookmark Question by Each Participant for Reading, Grade 10
Participant Nearly Meets Meets Exceeds 2 234 240 249 3 229 237 249 4 234 237 243 5 232 235 248 6 229 237 248 7 227 237 248 8 233 240 249 9 230 239 249 10 232 239 248 11 229 240 245 12 232 240 250 13 227 237 250 14 230 237 249 15 232 239 245 16 231 237 248 17 227 237 248 18 231 237 249
Median 231 237 248 Maximum 234 240 250 Minimum 227 235 243 SD 2.29 1.52 1.89

The Oregon Statewide Assessment System Technical Report Volume 3: Standard Setting
G-6
Table G.8. Standard Setting, Step 1RIT Score of Recommended Bookmark Question by Each Participant for Math, Grade 3
Participant Nearly Meets Meets Exceeds 2 200 203 211 3 202 209 224 4 200 203 215 5 200 203 218 6 193 205 213 7 200 205 214 8 202 207 213 9 198 203 215 10 201 204 215 11 200 205 218 12 202 206 218 13 203 206 217 14 200 204 215 15 202 205 218 16 201 204 215 17 200 205 218 18 201 205 215 19 202 205 214 20 196 202 214
Median 200 205 215 Maximum 203 209 224 Minimum 193 202 211 SD 2.36 1.63 2.84

The Oregon Statewide Assessment System Technical Report Volume 3: Standard Setting
G-7
Table G.9. Standard Setting, Step 1RIT Score of Recommended Bookmark Question by Each Participant for Math, Grade 5
Participant Nearly Meets Meets Exceeds 1 210 215 225 2 215 219 230 3 209 216 230 4 214 217 227 5 214 217 223 8 214 216 227 9 214 217 227 10 212 218 239 11 211 218 227 12 214 218 235 13 215 218 225 14 214 217 229 15 214 216 229 16 214 216 229 17 212 219 231 18 214 216 229 19 210 218 227 20 214 216 227
Median 214 217 228 Maximum 215 219 239 Minimum 209 215 223 SD 1.85 1.16 3.69

The Oregon Statewide Assessment System Technical Report Volume 3: Standard Setting
G-8
Table G.10. Standard Setting, Step 1RIT Score of Recommended Bookmark Question by Each Participant for Math, Grade 8
Participant Nearly Meets Meets Exceeds 2 225 228 237 3 226 232 238 4 226 230 241 5 224 228 239 6 225 228 239 7 224 228 237 8 228 230 241 9 223 233 241 10 224 228 241 11 224 228 237 12 225 233 241 13 224 228 241 14 224 234 239 15 225 230 241 16 225 234 241 17 226 234 241 18 225 233 241 19 228 234 241 20 226 233 246 22 225 233 241
Median 225 230 241 Maximum 228 234 246 Minimum 223 228 237 SD 1.29 2.54 2.07

The Oregon Statewide Assessment System Technical Report Volume 3: Standard Setting
G-9
Table G.11. Standard Setting, Step 1RIT Score of Recommended Bookmark Question by Each Participant for Math, Grade 10
Participant Nearly Meets Meets Exceeds 2 231 236 245 3 236 238 247 4 236 239 247 5 234 239 248 6 237 242 250 7 231 239 249 8 235 237 247 9 232 239 244 10 229 244 252 11 231 240 250 12 230 237 247 13 230 236 242 14 230 240 250 15 230 239 247 16 232 238 247 17 230 237 244 18 234 239 249 19 232 237 244 20 237 242 247
Median 232 239 247 Maximum 237 244 252 Minimum 229 236 242 SD 2.65 2.12 2.54

The Oregon Statewide Assessment System Technical Report Volume 3: Standard Setting
G-10
Table G.12. Standard Setting, Step 1RIT Score of Recommended Bookmark Question by Each Participant for Science, Grade 5
Participant Nearly Meets Meets Exceeds 1 218 224 236 2 212 225 241 3 211 224 229 4 216 228 242 5 215 224 235 6 216 225 240 7 216 227 238 8 216 228 239 9 213 228 243 10 216 226 237 11 219 225 237 12 217 228 236 13 216 225 233 14 215 228 236 15 212 225 238 16 216 225 238 17 226 230 238 18 218 225 238 19 208 225 238 20 213 225 238
Median 216 225 238 Maximum 226 230 243 Minimum 208 224 229 SD 3.65 1.75 3.07

The Oregon Statewide Assessment System Technical Report Volume 3: Standard Setting
G-11
Table G.13. Standard Setting, Step 1RIT Score of Recommended Bookmark Question by Each Participant for Science, Grade 8
Participant Nearly Meets Meets Exceeds 1 227 234 246 2 227 236 245 3 231 236 246 4 230 237 246 5 227 231 242 6 233 237 248 7 225 233 246 8 228 234 246 9 230 233 245 10 231 234 249 11 229 233 245 12 223 234 246 13 226 231 246 14 225 234 244 15 230 232 245 16 225 234 247 17 227 231 247 18 231 236 245 19 226 231 245 22 229 235 246
Median 227 234 246 Maximum 233 237 249 Minimum 223 231 242 SD 2.62 1.96 1.45

The Oregon Statewide Assessment System Technical Report Volume 3: Standard Setting
G-12
Table G.14. Standard Setting, Step 1RIT Score of Recommended Bookmark Question by Each Participant for Science, Grade 10
Participant Nearly Meets Meets Exceeds 2 233 240 251 3 233 240 249 4 237 241 247 5 234 240 249 6 237 241 247 7 238 244 247 8 235 241 248 9 234 241 249 10 233 236 248 11 233 240 252 12 235 241 249 13 232 241 250 14 233 238 245 15 232 240 252 16 234 237 243 17 234 238 243
Median 234 240 248 Maximum 238 244 252 Minimum 232 236 243 SD 1.8 1.91 2.72

The Oregon Statewide Assessment System Technical Report Volume 3: Standard Setting
G-13

The Oregon Statewide Assessment System Technical Report Volume 3: Standard Setting
H-1
APPENDIX H PANELIST EVALUATIONS
Question #1. The Bookmark Procedure was well described.
Content Area Grade N Strongly Disagree Disagree Neutral Agree Strongly
Agree
Agree + Strongly Agree
Overall 209 0.0% 1.9% 7.2% 61.7% 29.2% 90.9% 3 19 0.0% 0.0% 10.5% 57.9% 31.6% 89.5% 5 18 0.0% 11.1% 16.7% 44.4% 27.8% 72.2% 8 20 0.0% 5.0% 0.0% 65.0% 30.0% 95.0%
Mathematics
10 19 0.0% 0.0% 0.0% 68.4% 31.6% 100.0% 3 19 0.0% 0.0% 0.0% 57.9% 42.1% 100.0% 5 22 0.0% 0.0% 4.5% 68.2% 27.3% 95.5% 8 20 0.0% 5.0% 15.0% 55.0% 25.0% 80.0%
Reading/ Literature
10 16 0.0% 0.0% 18.8% 50.0% 31.3% 81.3% 5 20 0.0% 0.0% 10.0% 50.0% 40.0% 90.0% 8 20 0.0% 0.0% 5.0% 80.0% 15.0% 95.0% Science
10 16 0.0% 0.0% 0.0% 81.3% 18.8% 100.0%
Question #2. The training on bookmark placement made the task clear to me.
Content Area Grade N Strongly Disagree Disagree Neutral Agree Strongly
Agree
Agree + Strongly Agree
Overall 209 0.0% 3.3% 9.6% 61.7% 25.4% 87.1% 3 19 0.0% 0.0% 10.5% 63.2% 26.3% 89.5% 5 18 0.0% 11.1% 16.7% 55.6% 16.7% 72.3% 8 20 0.0% 0.0% 5.0% 75.0% 20.0% 95.0%
Mathematics
10 19 0.0% 0.0% 10.5% 57.9% 31.6% 89.5% 3 19 0.0% 0.0% 5.3% 52.6% 42.1% 94.7% 5 22 0.0% 4.5% 9.1% 50.0% 36.4% 86.4% 8 20 0.0% 10.0% 15.0% 50.0% 25.0% 75.0%
Reading/ Literature
10 16 0.0% 0.0% 6.3% 68.8% 25.0% 93.8% 5 20 0.0% 10.0% 5.0% 50.0% 35.0% 85.0% 8 20 0.0% 0.0% 15.0% 80.0% 5.0% 85.0% Science
10 16 0.0% 0.0% 6.3% 81.3% 12.5% 93.8%

The Oregon Statewide Assessment System Technical Report Volume 3: Standard Setting
H-2
Question #3. The training materials were helpful.
Content Area Grade N Strongly Disagree Disagree Neutral Agree Strongly
Agree
Agree + Strongly Agree
Overall 209 0.0% 1.0% 11.5% 66.5% 21.1% 87.6% 3 19 0.0% 0.0% 5.3% 68.4% 26.3% 94.7% 5 18 0.0% 0.0% 16.7% 72.2% 11.1% 83.3% 8 20 0.0% 0.0% 10.0% 70.0% 20.0% 90.0%
Mathematics
10 19 0.0% 5.3% 5.3% 57.9% 31.6% 89.5% 3 19 0.0% 0.0% 5.3% 78.9% 15.8% 94.7% 5 22 0.0% 0.0% 9.1% 63.6% 27.3% 90.9% 8 20 0.0% 5.0% 25.0% 60.0% 10.0% 70.0%
Reading/ Literature
10 16 0.0% 0.0% 18.8% 56.3% 25.0% 81.3% 5 20 0.0% 0.0% 5.0% 60.0% 35.0% 95.0% 8 20 0.0% 0.0% 20.0% 75.0% 5.0% 80.0% Science
10 16 0.0% 0.0% 6.3% 68.8% 25.0% 93.8%
Question #4. The goals for the Bookmark Procedure were clear.
Content Area Grade N Strongly Disagree Disagree Neutral Agree Strongly
Agree
Agree + Strongly Agree
Overall 208 0.0% 7.2% 9.1% 57.7% 26.0% 83.7% 3 19 0.0% 5.3% 10.5% 63.2% 21.1% 84.3% 5 18 0.0% 11.1% 16.7% 55.6% 16.7% 72.3% 8 20 0.0% 0.0% 10.0% 60.0% 30.0% 90.0%
Mathematics
10 19 0.0% 0.0% 15.8% 63.2% 21.1% 84.3% 3 19 0.0% 5.3% 0.0% 52.6% 42.1% 94.7% 5 21 0.0% 4.8% 0.0% 61.9% 33.3% 95.2% 8 20 0.0% 20.0% 5.0% 65.0% 10.0% 75.0%
Reading/ Literature
10 16 0.0% 12.5% 6.3% 43.8% 37.5% 81.3% 5 20 0.0% 5.0% 0.0% 55.0% 40.0% 95.0% 8 20 0.0% 15.0% 25.0% 40.0% 20.0% 60.0% Science
10 16 0.0% 0.0% 12.5% 75.0% 12.5% 87.5%

The Oregon Statewide Assessment System Technical Report Volume 3: Standard Setting
H-3
Question #5. Reviewing the test items helped me place my bookmarks.
Content Area Grade N Strongly Disagree Disagree Neutral Agree Strongly
Agree
Agree + Strongly Agree
Overall 208 1.9% 2.4% 4.8% 38.0% 52.9% 90.9% 3 19 0.0% 0.0% 5.3% 36.8% 57.9% 94.7% 5 18 11.1% 0.0% 5.6% 27.8% 55.6% 83.4% 8 20 0.0% 0.0% 5.0% 40.0% 55.0% 95.0%
Mathematics
10 19 0.0% 0.0% 10.5% 26.3% 63.2% 89.5% 3 19 0.0% 0.0% 0.0% 21.1% 78.9% 100.0% 5 21 0.0% 0.0% 4.8% 52.4% 42.9% 95.3% 8 20 0.0% 5.0% 0.0% 65.0% 30.0% 95.0%
Reading/ Literature
10 16 0.0% 0.0% 6.3% 50.0% 43.8% 93.8% 5 20 5.0% 0.0% 0.0% 30.0% 65.0% 95.0% 8 20 5.0% 20.0% 15.0% 40.0% 20.0% 60.0% Science
10 16 0.0% 0.0% 0.0% 25.0% 75.0% 100.0%
Question #6. The ordering of the items in the ordered item booklet agreed with my perception of the relative difficulty of the items.
Content Area Grade N Strongly Disagree Disagree Neutral Agree Strongly
Agree
Agree + Strongly Agree
Overall 209 6.2% 28.2% 19.1% 42.6% 3.8% 46.4% 3 19 5.3% 36.8% 15.8% 42.1% 0.0% 42.1% 5 18 0.0% 22.2% 33.3% 44.4% 0.0% 44.4% 8 20 0.0% 25.0% 35.0% 35.0% 5.0% 40.0%
Mathematics
10 19 15.8% 52.6% 10.5% 21.1% 0.0% 21.1% 3 19 0.0% 21.1% 15.8% 63.2% 0.0% 63.2% 5 22 0.0% 0.0% 13.6% 68.2% 18.2% 86.4% 8 20 0.0% 15.0% 20.0% 65.0% 0.0% 65.0%
Reading/ Literature
10 16 6.3% 12.5% 25.0% 50.0% 6.3% 56.3% 5 20 5.0% 25.0% 25.0% 40.0% 5.0% 45.0% 8 20 25.0% 45.0% 10.0% 20.0% 0.0% 20.0% Science
10 16 12.5% 62.5% 6.3% 12.5% 6.3% 18.8%

The Oregon Statewide Assessment System Technical Report Volume 3: Standard Setting
H-4
Question #7. Reviewing the Target Student helped me place my bookmarks.
Content Area Grade N Strongly Disagree Disagree Neutral Agree Strongly
Agree
Agree + Strongly Agree
Overall 209 1.0% 11.0% 22.0% 52.6% 13.4% 66.0% 3 19 0.0% 0.0% 36.8% 63.2% 0.0% 63.2% 5 18 0.0% 11.1% 33.3% 38.9% 16.7% 55.6% 8 20 0.0% 15.0% 30.0% 50.0% 5.0% 55.0%
Mathematics
10 19 0.0% 15.8% 31.6% 52.6% 0.0% 52.6% 3 19 0.0% 5.3% 10.5% 73.7% 10.5% 84.2% 5 22 0.0% 9.1% 9.1% 54.5% 27.3% 81.8% 8 20 5.0% 30.0% 10.0% 40.0% 15.0% 55.0%
Reading/ Literature
10 16 0.0% 12.5% 18.8% 37.5% 31.3% 68.8% 5 20 0.0% 15.0% 5.0% 55.0% 25.0% 80.0% 8 20 5.0% 5.0% 30.0% 50.0% 10.0% 60.0% Science
10 16 0.0% 0.0% 31.3% 62.5% 6.3% 68.8%
Question #8. I considered the content standards when I placed my bookmarks.
Content Area Grade N Strongly Disagree Disagree Neutral Agree Strongly
Agree
Agree + Strongly Agree
Overall 207 0.0% 2.4% 3.9% 40.6% 53.1% 93.7% 3 18 0.0% 0.0% 5.6% 16.7% 77.8% 94.5% 5 18 0.0% 0.0% 0.0% 55.6% 44.4% 100.0% 8 20 0.0% 0.0% 5.0% 55.0% 40.0% 95.0%
Mathematics
10 19 0.0% 0.0% 10.5% 31.6% 57.9% 89.5% 3 19 0.0% 0.0% 0.0% 26.3% 73.7% 100.0% 5 22 0.0% 4.5% 0.0% 40.9% 54.5% 95.4% 8 20 0.0% 0.0% 5.0% 45.0% 50.0% 95.0%
Reading/ Literature
10 16 0.0% 6.3% 6.3% 43.8% 43.8% 87.6% 5 19 0.0% 10.5% 0.0% 31.6% 57.9% 89.5% 8 20 0.0% 5.0% 5.0% 60.0% 30.0% 90.0% Science
10 16 0.0% 0.0% 6.3% 37.5% 56.3% 93.8%

The Oregon Statewide Assessment System Technical Report Volume 3: Standard Setting
H-5
Question #9. During Round 1, I placed my bookmarks without consulting other participants.
Content Area Grade N Strongly Disagree Disagree Neutral Agree Strongly
Agree
Agree + Strongly Agree
Overall 209 1.4% 2.4% 2.9% 31.1% 62.2% 93.3% 3 19 0.0% 0.0% 0.0% 26.3% 73.7% 100.0% 5 18 0.0% 5.6% 16.7% 38.9% 38.9% 77.8% 8 20 0.0% 5.0% 0.0% 35.0% 60.0% 95.0%
Mathematics
10 19 0.0% 0.0% 0.0% 42.1% 57.9% 100.0% 3 19 0.0% 0.0% 0.0% 5.3% 94.7% 100.0% 5 22 4.5% 13.6% 4.5% 45.5% 31.8% 77.3% 8 20 0.0% 0.0% 0.0% 30.0% 70.0% 100.0%
Reading/ Literature
10 16 0.0% 0.0% 0.0% 25.0% 75.0% 100.0% 5 20 5.0% 0.0% 0.0% 5.0% 90.0% 95.0% 8 20 5.0% 0.0% 0.0% 55.0% 40.0% 95.0% Science
10 16 0.0% 0.0% 12.5% 31.3% 56.3% 87.6%
Question #10. I had enough time to consider my Round 1 bookmarks.
Content Area Grade N Strongly Disagree Disagree Neutral Agree Strongly
Agree
Agree + Strongly Agree
Overall 209 1.4% 6.7% 5.3% 33.5% 53.1% 86.6% 3 19 0.0% 0.0% 5.3% 21.1% 73.7% 94.8% 5 18 0.0% 0.0% 5.6% 44.4% 50.0% 94.4% 8 20 0.0% 5.0% 0.0% 45.0% 50.0% 95.0%
Mathematics
10 19 0.0% 10.5% 10.5% 36.8% 42.1% 78.9% 3 19 0.0% 0.0% 0.0% 26.3% 73.7% 100.0% 5 22 0.0% 18.2% 13.6% 40.9% 27.3% 68.2% 8 20 0.0% 5.0% 0.0% 35.0% 60.0% 95.0%
Reading/ Literature
10 16 18.8% 0.0% 12.5% 43.8% 25.0% 68.8% 5 20 0.0% 10.0% 0.0% 0.0% 90.0% 90.0% 8 20 0.0% 15.0% 10.0% 40.0% 35.0% 75.0% Science
10 16 0.0% 6.3% 0.0% 37.5% 56.3% 93.8%

The Oregon Statewide Assessment System Technical Report Volume 3: Standard Setting
H-6
Question #11. Overall, my table's discussions were open and honest.
Content Area Grade N Strongly Disagree Disagree Neutral Agree Strongly
Agree
Agree + Strongly Agree
Overall 209 0.0% 0.0% 0.5% 16.7% 82.8% 99.5% 3 19 0.0% 0.0% 0.0% 10.5% 89.5% 100.0% 5 18 0.0% 0.0% 0.0% 22.2% 77.8% 100.0% 8 20 0.0% 0.0% 0.0% 15.0% 85.0% 100.0%
Mathematics
10 19 0.0% 0.0% 0.0% 21.1% 78.9% 100.0% 3 19 0.0% 0.0% 0.0% 5.3% 94.7% 100.0% 5 22 0.0% 0.0% 0.0% 9.1% 90.9% 100.0% 8 20 0.0% 0.0% 0.0% 20.0% 80.0% 100.0%
Reading/ Literature
10 16 0.0% 0.0% 0.0% 12.5% 87.5% 100.0% 5 20 0.0% 0.0% 5.0% 20.0% 75.0% 95.0% 8 20 0.0% 0.0% 0.0% 25.0% 75.0% 100.0% Science
10 16 0.0% 0.0% 0.0% 25.0% 75.0% 100.0%
Question #12. Overall, I believe that my opinions were considered and valued by my group.
Content Area Grade N Strongly Disagree Disagree Neutral Agree Strongly
Agree
Agree + Strongly Agree
Overall 209 0.5% 1.9% 4.3% 27.8% 65.6% 93.4% 3 19 0.0% 0.0% 0.0% 36.8% 63.2% 100.0% 5 18 0.0% 5.6% 11.1% 27.8% 55.6% 83.4% 8 20 0.0% 0.0% 0.0% 40.0% 60.0% 100.0%
Mathematics
10 19 0.0% 0.0% 5.3% 15.8% 78.9% 94.7% 3 19 0.0% 0.0% 0.0% 10.5% 89.5% 100.0% 5 22 4.5% 0.0% 4.5% 22.7% 68.2% 90.9% 8 20 0.0% 10.0% 5.0% 30.0% 55.0% 85.0%
Reading/ Literature
10 16 0.0% 0.0% 0.0% 18.8% 81.3% 100.0% 5 20 0.0% 0.0% 5.0% 25.0% 70.0% 95.0% 8 20 0.0% 5.0% 10.0% 45.0% 40.0% 85.0% Science
10 16 0.0% 0.0% 6.3% 31.3% 62.5% 93.8%

The Oregon Statewide Assessment System Technical Report Volume 3: Standard Setting
H-7
Question #13. The presentation of different types of impact data was helpful to me.
Content Area Grade N Strongly Disagree Disagree Neutral Agree Strongly
Agree
Agree + Strongly Agree
Overall 209 2.4% 9.1% 13.4% 47.8% 27.3% 75.1% 3 19 0.0% 15.8% 5.3% 42.1% 36.8% 78.9% 5 18 0.0% 0.0% 11.1% 66.7% 22.2% 88.9% 8 20 0.0% 0.0% 5.0% 40.0% 55.0% 95.0%
Mathematics
10 19 0.0% 10.5% 10.5% 42.1% 36.8% 78.9% 3 19 0.0% 10.5% 5.3% 63.2% 21.1% 84.3% 5 22 0.0% 0.0% 4.5% 50.0% 45.5% 95.5% 8 20 5.0% 35.0% 25.0% 30.0% 5.0% 35.0%
Reading/ Literature
10 16 12.5% 18.8% 31.3% 31.3% 6.3% 37.6% 5 20 0.0% 0.0% 15.0% 40.0% 45.0% 85.0% 8 20 10.0% 0.0% 20.0% 65.0% 5.0% 70.0% Science
10 16 0.0% 12.5% 18.8% 56.3% 12.5% 68.8%
Question #14. I learned how to do the bookmark placement as I went along, so my later ones may not be comparable to my earlier ones.
Content Area Grade N Strongly Disagree Disagree Neutral Agree Strongly
Agree
Agree + Strongly Agree
Overall 209 21.1% 42.1% 12.0% 19.6% 5.3% 24.9% 3 19 21.1% 57.9% 15.8% 5.3% 0.0% 5.3% 5 18 0.0% 50.0% 16.7% 22.2% 11.1% 33.3% 8 20 20.0% 55.0% 0.0% 25.0% 0.0% 25.0%
Mathematics
10 19 21.1% 26.3% 15.8% 31.6% 5.3% 36.9% 3 19 26.3% 21.1% 26.3% 15.8% 10.5% 26.3% 5 22 31.8% 31.8% 4.5% 31.8% 0.0% 31.8% 8 20 30.0% 45.0% 10.0% 15.0% 0.0% 15.0%
Reading/ Literature
10 16 12.5% 50.0% 12.5% 18.8% 6.3% 25.1% 5 20 35.0% 30.0% 5.0% 20.0% 10.0% 30.0% 8 20 15.0% 60.0% 10.0% 15.0% 0.0% 15.0% Science
10 16 12.5% 37.5% 18.8% 12.5% 18.8% 31.3%

The Oregon Statewide Assessment System Technical Report Volume 3: Standard Setting
H-8
Question #15. I understood how to place my bookmarks.
Content Area Grade N Strongly Disagree Disagree Neutral Agree Strongly
Agree
Agree + Strongly Agree
Overall 209 0.0% 1.9% 1.4% 52.2% 44.5% 96.7% 3 19 0.0% 5.3% 0.0% 57.9% 36.8% 94.7% 5 18 0.0% 0.0% 0.0% 72.2% 27.8% 100.0% 8 20 0.0% 0.0% 0.0% 50.0% 50.0% 100.0%
Mathematics
10 19 0.0% 0.0% 0.0% 57.9% 42.1% 100.0% 3 19 0.0% 0.0% 0.0% 42.1% 57.9% 100.0% 5 22 0.0% 4.5% 4.5% 45.5% 45.5% 91.0% 8 20 0.0% 5.0% 0.0% 40.0% 55.0% 95.0%
Reading/ Literature
10 16 0.0% 0.0% 6.3% 56.3% 37.5% 93.8% 5 20 0.0% 0.0% 0.0% 35.0% 65.0% 100.0% 8 20 0.0% 0.0% 5.0% 65.0% 30.0% 95.0% Science
10 16 0.0% 6.3% 0.0% 56.3% 37.5% 93.8%
Question #16. Overall, I am satisfied with my group's final bookmarks.
Content Area Grade N Strongly Disagree Disagree Neutral Agree Strongly
Agree
Agree + Strongly Agree
Overall 207 1.4% 8.7% 6.8% 57.5% 25.6% 83.1% 3 19 0.0% 10.5% 10.5% 73.7% 5.3% 79.0% 5 18 0.0% 11.1% 0.0% 66.7% 22.2% 88.9% 8 20 0.0% 0.0% 5.0% 55.0% 40.0% 95.0%
Mathematics
10 18 0.0% 5.6% 0.0% 61.1% 33.3% 94.4% 3 19 0.0% 0.0% 10.5% 52.6% 36.8% 89.4% 5 21 4.8% 4.8% 19.0% 52.4% 19.0% 71.4% 8 20 0.0% 20.0% 10.0% 55.0% 15.0% 70.0%
Reading/ Literature
10 16 0.0% 6.3% 0.0% 68.8% 25.0% 93.8% 5 20 0.0% 0.0% 10.0% 35.0% 55.0% 90.0% 8 20 10.0% 25.0% 5.0% 50.0% 10.0% 60.0% Science
10 16 0.0% 12.5% 0.0% 68.8% 18.8% 87.6%

The Oregon Statewide Assessment System Technical Report Volume 3: Standard Setting
H-9
Question #17. I feel this procedure was fair.
Content Area Grade N Strongly Disagree Disagree Neutral Agree Strongly
Agree
Agree + Strongly Agree
Overall 208 2.4% 5.3% 15.4% 50.0% 26.9% 76.9% 3 19 0.0% 10.5% 10.5% 52.6% 26.3% 78.9% 5 18 0.0% 16.7% 22.2% 44.4% 16.7% 61.1% 8 20 0.0% 0.0% 10.0% 55.0% 35.0% 90.0%
Mathematics
10 19 0.0% 0.0% 15.8% 63.2% 21.1% 84.3% 3 19 0.0% 5.3% 0.0% 52.6% 42.1% 94.7% 5 22 0.0% 0.0% 22.7% 50.0% 27.3% 77.3% 8 19 0.0% 5.3% 26.3% 57.9% 10.5% 68.4%
Reading/ Literature
10 16 0.0% 6.3% 18.8% 56.3% 18.8% 75.1% 5 20 0.0% 0.0% 10.0% 25.0% 65.0% 90.0% 8 20 25.0% 5.0% 25.0% 35.0% 10.0% 45.0% Science
10 16 0.0% 12.5% 6.3% 62.5% 18.8% 81.3%
Question #18. I am confident that the Bookmark Procedure produced valid standards.
Content Area Grade N Strongly Disagree Disagree Neutral Agree Strongly
Agree
Agree + Strongly Agree
Overall 207 2.4% 11.6% 22.2% 49.3% 14.5% 63.8% 3 18 0.0% 0.0% 22.2% 61.1% 16.7% 77.8% 5 18 0.0% 11.1% 33.3% 50.0% 5.6% 55.6% 8 20 0.0% 0.0% 0.0% 85.0% 15.0% 100.0%
Mathematics
10 19 0.0% 26.3% 5.3% 52.6% 15.8% 68.4% 3 19 0.0% 5.3% 5.3% 68.4% 21.1% 89.5% 5 21 0.0% 14.3% 38.1% 42.9% 4.8% 47.7% 8 20 0.0% 25.0% 40.0% 30.0% 5.0% 35.0%
Reading/ Literature
10 16 6.3% 6.3% 12.5% 50.0% 25.0% 75.0% 5 20 5.0% 0.0% 20.0% 35.0% 40.0% 75.0% 8 20 15.0% 30.0% 30.0% 20.0% 5.0% 25.0% Science
10 16 0.0% 6.3% 37.5% 50.0% 6.3% 56.3%

The Oregon Statewide Assessment System Technical Report Volume 3: Standard Setting
H-10
Question #19. I would defend the Nearly Meets cut score against criticism that it is too high.
Content Area Grade N Strongly Disagree Disagree Neutral Agree Strongly
Agree
Agree + Strongly Agree
Overall 207 4.3% 8.7% 15.0% 47.3% 24.6% 71.9% 3 19 0.0% 0.0% 15.8% 57.9% 26.3% 84.2% 5 18 5.6% 0.0% 11.1% 66.7% 16.7% 83.4% 8 20 0.0% 30.0% 10.0% 45.0% 15.0% 60.0%
Mathematics
10 19 0.0% 5.3% 15.8% 47.4% 31.6% 79.0% 3 19 0.0% 0.0% 10.5% 47.4% 42.1% 89.5% 5 22 13.6% 0.0% 22.7% 36.4% 27.3% 63.7% 8 20 0.0% 20.0% 10.0% 40.0% 30.0% 70.0%
Reading/ Literature
10 16 6.3% 12.5% 12.5% 50.0% 18.8% 68.8% 5 20 10.0% 10.0% 0.0% 55.0% 25.0% 80.0% 8 18 11.1% 5.6% 50.0% 33.3% 0.0% 33.3% Science
10 16 0.0% 12.5% 6.3% 43.8% 37.5% 81.3%
Question #20. I would defend the Nearly Meets cut score against criticism that it is too low.
Content Area Grade N Strongly Disagree Disagree Neutral Agree Strongly
Agree
Agree + Strongly Agree
Overall 206 3.4% 6.8% 17.5% 53.9% 18.4% 72.3% 3 19 0.0% 10.5% 15.8% 52.6% 21.1% 73.7% 5 18 5.6% 0.0% 5.6% 72.2% 16.7% 88.9% 8 20 0.0% 5.0% 10.0% 70.0% 15.0% 85.0%
Mathematics
10 18 5.6% 0.0% 22.2% 55.6% 16.7% 72.3% 3 19 0.0% 0.0% 15.8% 47.4% 36.8% 84.2% 5 22 0.0% 13.6% 18.2% 36.4% 31.8% 68.2% 8 20 10.0% 15.0% 10.0% 50.0% 15.0% 65.0%
Reading/ Literature
10 16 0.0% 6.3% 18.8% 56.3% 18.8% 75.1% 5 20 10.0% 10.0% 5.0% 65.0% 10.0% 75.0% 8 18 5.6% 0.0% 55.6% 38.9% 0.0% 38.9% Science
10 16 0.0% 12.5% 18.8% 50.0% 18.8% 68.8%

The Oregon Statewide Assessment System Technical Report Volume 3: Standard Setting
H-11
Question #21. I would defend the Meets cut score against criticism that it is too high.
Content Area Grade N Strongly Disagree Disagree Neutral Agree Strongly
Agree
Agree + Strongly Agree
Overall 207 4.3% 12.6% 11.6% 46.9% 24.6% 71.5% 3 19 0.0% 10.5% 5.3% 52.6% 31.6% 84.2% 5 18 0.0% 5.6% 11.1% 77.8% 5.6% 83.4% 8 20 0.0% 15.0% 10.0% 65.0% 10.0% 75.0%
Mathematics
10 19 0.0% 10.5% 10.5% 36.8% 42.1% 78.9% 3 19 0.0% 5.3% 15.8% 47.4% 31.6% 79.0% 5 22 13.6% 31.8% 9.1% 22.7% 22.7% 45.4% 8 20 5.0% 25.0% 5.0% 40.0% 25.0% 65.0%
Reading/ Literature
10 16 0.0% 12.5% 18.8% 43.8% 25.0% 68.8% 5 20 5.0% 10.0% 0.0% 45.0% 40.0% 85.0% 8 18 16.7% 5.6% 38.9% 38.9% 0.0% 38.9% Science
10 16 6.3% 0.0% 6.3% 50.0% 37.5% 87.5%
Question #22. I would defend the Meets cut score against criticism that it is too low.
Content Area Grade N Strongly Disagree Disagree Neutral Agree Strongly
Agree
Agree + Strongly Agree
Overall 207 4.3% 10.1% 11.6% 51.7% 22.2% 73.9% 3 19 0.0% 5.3% 10.5% 57.9% 26.3% 84.2% 5 18 0.0% 0.0% 0.0% 77.8% 22.2% 100.0% 8 20 0.0% 15.0% 10.0% 65.0% 10.0% 75.0%
Mathematics
10 19 10.5% 26.3% 10.5% 26.3% 26.3% 52.6% 3 19 0.0% 0.0% 10.5% 52.6% 36.8% 89.4% 5 22 0.0% 0.0% 4.5% 54.5% 40.9% 95.4% 8 20 15.0% 30.0% 15.0% 30.0% 10.0% 40.0%
Reading/ Literature
10 16 0.0% 25.0% 6.3% 43.8% 25.0% 68.8% 5 20 5.0% 5.0% 15.0% 50.0% 25.0% 75.0% 8 18 11.1% 0.0% 33.3% 55.6% 0.0% 55.6% Science
10 16 6.3% 6.3% 12.5% 56.3% 18.8% 75.1%

The Oregon Statewide Assessment System Technical Report Volume 3: Standard Setting
H-12
Question #23. I would defend the Exceeds cut score against criticism that it is too high.
Content Area Grade N Strongly Disagree Disagree Neutral Agree Strongly
Agree
Agree + Strongly Agree
Overall 207 3.4% 6.3% 18.8% 50.2% 21.3% 71.5% 3 19 0.0% 0.0% 15.8% 63.2% 21.1% 84.3% 5 18 0.0% 11.1% 5.6% 66.7% 16.7% 83.4% 8 20 0.0% 15.0% 15.0% 55.0% 15.0% 70.0%
Mathematics
10 19 0.0% 5.3% 21.1% 52.6% 21.1% 73.7% 3 19 5.3% 5.3% 10.5% 52.6% 26.3% 78.9% 5 22 13.6% 13.6% 13.6% 36.4% 22.7% 59.1% 8 20 0.0% 10.0% 15.0% 50.0% 25.0% 75.0%
Reading/ Literature
10 16 0.0% 0.0% 43.8% 31.3% 25.0% 56.3% 5 20 5.0% 5.0% 15.0% 40.0% 35.0% 75.0% 8 18 5.6% 0.0% 38.9% 55.6% 0.0% 55.6% Science
10 16 6.3% 0.0% 18.8% 50.0% 25.0% 75.0%
Question #24. I would defend the Exceeds cut score against criticism that it is too low.
Content Area Grade N Strongly Disagree Disagree Neutral Agree Strongly
Agree
Agree + Strongly Agree
Overall 207 4.8% 5.8% 17.9% 53.1% 18.4% 71.5% 3 19 0.0% 0.0% 15.8% 78.9% 5.3% 84.2% 5 18 11.1% 5.6% 5.6% 72.2% 5.6% 77.8% 8 20 0.0% 15.0% 20.0% 50.0% 15.0% 65.0%
Mathematics
10 19 10.5% 5.3% 10.5% 52.6% 21.1% 73.7% 3 19 0.0% 0.0% 21.1% 52.6% 26.3% 78.9% 5 22 4.5% 9.1% 13.6% 45.5% 27.3% 72.8% 8 20 5.0% 15.0% 25.0% 40.0% 15.0% 55.0%
Reading/ Literature
10 16 6.3% 0.0% 31.3% 31.3% 31.3% 62.6% 5 20 10.0% 5.0% 5.0% 40.0% 40.0% 80.0% 8 18 5.6% 0.0% 38.9% 55.6% 0.0% 55.6% Science
10 16 0.0% 6.3% 12.5% 68.8% 12.5% 81.3%

The Oregon Statewide Assessment System Technical Report Volume 3: Standard Setting
H-13
Question #25. Participating in the Bookmark Procedure increased my understanding of the test.
Content Area Grade N Strongly Disagree Disagree Neutral Agree Strongly
Agree
Agree + Strongly Agree
Overall 209 0.0% 1.4% 7.7% 42.1% 48.8% 90.9% 3 19 0.0% 0.0% 0.0% 73.7% 26.3% 100.0% 5 18 0.0% 11.1% 16.7% 33.3% 38.9% 72.2% 8 20 0.0% 0.0% 5.0% 35.0% 60.0% 95.0%
Mathematics
10 19 0.0% 0.0% 15.8% 36.8% 47.4% 84.2% 3 19 0.0% 0.0% 5.3% 36.8% 57.9% 94.7% 5 22 0.0% 4.5% 9.1% 27.3% 59.1% 86.4% 8 20 0.0% 0.0% 0.0% 65.0% 35.0% 100.0%
Reading/ Literature
10 16 0.0% 0.0% 12.5% 37.5% 50.0% 87.5% 5 20 0.0% 0.0% 0.0% 35.0% 65.0% 100.0% 8 20 0.0% 0.0% 20.0% 45.0% 35.0% 80.0% Science
10 16 0.0% 0.0% 0.0% 37.5% 62.5% 100.0%
Question #26. This experience will help me target instruction for the students in my classroom.
Content Area Grade N Strongly Disagree Disagree Neutral Agree Strongly
Agree
Agree + Strongly Agree
Overall 202 1.0% 2.5% 19.3% 40.1% 37.1% 77.2% 3 18 0.0% 0.0% 33.3% 38.9% 27.8% 66.7% 5 18 0.0% 5.6% 27.8% 33.3% 33.3% 66.6% 8 20 0.0% 0.0% 5.0% 40.0% 55.0% 95.0%
Mathematics
10 19 0.0% 5.3% 5.3% 63.2% 26.3% 89.5% 3 19 0.0% 5.3% 21.1% 42.1% 31.6% 73.7% 5 22 0.0% 4.5% 22.7% 31.8% 40.9% 72.7% 8 19 5.3% 0.0% 5.3% 57.9% 31.6% 89.5%
Reading/ Literature
10 12 0.0% 0.0% 25.0% 58.3% 16.7% 75.0% 5 20 0.0% 5.0% 15.0% 15.0% 65.0% 80.0% 8 19 5.3% 0.0% 36.8% 26.3% 31.6% 57.9% Science
10 16 0.0% 0.0% 18.8% 43.8% 37.5% 81.3%

The Oregon Statewide Assessment System Technical Report Volume 3: Standard Setting
H-14
Question #27. This experience will help me target instruction for the students in my classroom.
Content Area Grade N Strongly Disagree Disagree Neutral Agree Strongly
Agree
Agree + Strongly Agree
Overall 208 0.5% 1.4% 3.4% 40.9% 53.8% 94.7% 3 19 0.0% 5.3% 10.5% 36.8% 47.4% 84.2% 5 18 0.0% 5.6% 5.6% 44.4% 44.4% 88.8% 8 20 0.0% 0.0% 0.0% 30.0% 70.0% 100.0%
Mathematics
10 19 0.0% 0.0% 0.0% 47.4% 52.6% 100.0% 3 19 0.0% 0.0% 0.0% 31.6% 68.4% 100.0% 5 22 0.0% 0.0% 0.0% 40.9% 59.1% 100.0% 8 20 0.0% 5.0% 5.0% 45.0% 45.0% 90.0%
Reading/ Literature
10 15 0.0% 0.0% 0.0% 66.7% 33.3% 100.0% 5 20 0.0% 0.0% 5.0% 10.0% 85.0% 95.0% 8 20 5.0% 0.0% 10.0% 55.0% 30.0% 85.0% Science
10 16 0.0% 0.0% 0.0% 50.0% 50.0% 100.0%
Question #28. The standard setting was well organized.
Content Area Grade N Strongly Disagree Disagree Neutral Agree Strongly
Agree
Agree + Strongly Agree
Overall 208 1.4% 7.7% 12.0% 44.2% 34.6% 78.8% 3 19 0.0% 10.5% 21.1% 47.4% 21.1% 68.5% 5 18 0.0% 16.7% 22.2% 38.9% 22.2% 61.1% 8 20 0.0% 5.0% 15.0% 45.0% 35.0% 80.0%
Mathematics
10 19 0.0% 0.0% 15.8% 31.6% 52.6% 84.2% 3 19 0.0% 0.0% 0.0% 63.2% 36.8% 100.0% 5 21 4.8% 4.8% 9.5% 52.4% 28.6% 81.0% 8 20 5.0% 10.0% 25.0% 45.0% 15.0% 60.0%
Reading/ Literature
10 16 0.0% 6.3% 12.5% 68.8% 12.5% 81.3% 5 20 0.0% 0.0% 0.0% 20.0% 80.0% 100.0% 8 20 5.0% 25.0% 10.0% 30.0% 30.0% 60.0% Science
10 16 0.0% 6.3% 0.0% 50.0% 43.8% 93.8%

The Oregon Statewide Assessment System Technical Report Volume 3: Standard Setting
H-15
Question #29. What is your occupation?
Content Area Grade N Teacher Administrator Other
Overall 207 74.4% 14.0% 11.6% 3 18 94.4% 5.6% 0.0% 5 18 83.3% 0.0% 16.7% 8 20 90.0% 5.0% 5.0%
Mathematics
10 19 78.9% 10.5% 10.5% 3 19 68.4% 21.1% 10.5% 5 22 45.5% 36.4% 18.2% 8 20 75.0% 20.0% 5.0%
Reading/ Literature
10 16 56.3% 18.8% 25.0% 5 20 80.0% 10.0% 10.0% 8 19 73.7% 10.5% 15.8% Science
10 16 75.0% 12.5% 12.5%
Question #30. How many years in your current profession?
Content Area Grade N 1-5 6-10 11-15 16-20 21+
Overall 209 8.1% 19.1% 15.8% 21.5% 35.4% 3 19 5.3% 26.3% 5.3% 21.1% 42.1% 5 18 5.6% 16.7% 16.7% 22.2% 38.9% 8 20 10.0% 25.0% 10.0% 35.0% 20.0%
Mathematics
10 19 5.3% 21.1% 5.3% 15.8% 52.6% 3 19 0.0% 15.8% 21.1% 21.1% 42.1% 5 22 4.5% 22.7% 13.6% 22.7% 36.4% 8 20 20.0% 20.0% 30.0% 5.0% 25.0%
Reading/ Literature
10 16 18.8% 0.0% 12.5% 31.3% 37.5% 5 20 5.0% 20.0% 20.0% 25.0% 30.0% 8 20 15.0% 30.0% 5.0% 10.0% 40.0% Science
10 16 0.0% 6.3% 37.5% 31.3% 25.0%

The Oregon Statewide Assessment System Technical Report Volume 3: Standard Setting
H-16
Question #31. What is your primary role at this standard setting?
Content Area Grade N Educator Parent Community Member
Business Member
Overall 209 93.8% 3.3% 2.4% 0.5% 3 19 94.7% 0.0% 5.3% 0.0% 5 18 94.4% 5.6% 0.0% 0.0% 8 20 100.0% 0.0% 0.0% 0.0%
Mathematics
10 19 94.7% 0.0% 5.3% 0.0% 3 19 94.7% 0.0% 5.3% 0.0% 5 22 95.5% 0.0% 0.0% 4.5% 8 20 95.0% 5.0% 0.0% 0.0%
Reading/ Literature
10 16 87.5% 0.0% 12.5% 0.0% 5 20 95.0% 5.0% 0.0% 0.0% 8 20 90.0% 10.0% 0.0% 0.0% Science
10 16 87.5% 12.5% 0.0% 0.0%
Question #32. What is your education level?
Content Area Grade N HSD or GED Bachelor's Master's Doctorate
Overall 209 1.0% 23.4% 69.4% 6.2% 3 19 0.0% 47.4% 47.4% 5.3% 5 18 0.0% 33.3% 66.7% 0.0% 8 20 0.0% 25.0% 75.0% 0.0%
Mathematics
10 19 0.0% 21.1% 73.7% 5.3% 3 19 0.0% 26.3% 68.4% 5.3% 5 22 0.0% 13.6% 72.7% 13.6% 8 20 5.0% 20.0% 75.0% 0.0%
Reading/ Literature
10 16 6.3% 25.0% 62.5% 6.3% 5 20 0.0% 20.0% 70.0% 10.0% 8 20 0.0% 0.0% 85.0% 15.0% Science
10 16 0.0% 31.3% 62.5% 6.3%

The Oregon Statewide Assessment System Technical Report Volume 3: Standard Setting
H-17
Question #33. What is your gender?
Content Area Grade N Male Female
Overall 208 28.8% 71.2% 3 19 26.3% 73.7% 5 18 27.8% 72.2% 8 20 25.0% 75.0%
Mathematics
10 19 42.1% 57.9% 3 19 10.5% 89.5% 5 21 38.1% 61.9% 8 20 15.0% 85.0%
Reading/ Literature
10 16 56.3% 43.8% 5 20 10.0% 90.0% 8 20 25.0% 75.0% Science
10 16 50.0% 50.0%
Question #34. What is your race?
Content Area Grade N Asian/ Pacific Islander
Black/ African-American
American Indian White Other
Overall 205 1.5% 1.5% 0.5% 94.1% 2.4% 3 17 0.0% 0.0% 0.0% 100.0% 0.0% 5 18 0.0% 0.0% 0.0% 94.4% 5.6% 8 19 5.3% 0.0% 0.0% 94.7% 0.0%
Mathematics
10 19 5.3% 5.3% 0.0% 89.5% 0.0% 3 19 0.0% 0.0% 0.0% 94.7% 5.3% 5 21 0.0% 0.0% 4.8% 95.2% 0.0% 8 20 0.0% 0.0% 0.0% 95.0% 5.0%
Reading/ Literature
10 16 6.3% 0.0% 0.0% 93.8% 0.0% 5 20 0.0% 5.0% 0.0% 85.0% 10.0% 8 20 0.0% 0.0% 0.0% 100.0% 0.0% Science
10 16 0.0% 6.3% 0.0% 93.8% 0.0%

The Oregon Statewide Assessment System Technical Report Volume 3: Standard Setting
H-18
Question #35. Are you of Hispanic origin?
Content Area Grade N Yes No
Overall 208 1.4% 98.6% 3 18 5.6% 94.4% 5 18 0.0% 100.0% 8 20 0.0% 100.0%
Mathematics
10 19 0.0% 100.0% 3 19 0.0% 100.0% 5 22 0.0% 100.0% 8 20 0.0% 100.0%
Reading/ Literature
10 16 6.3% 93.8% 5 20 5.0% 95.0% 8 20 0.0% 100.0% Science
10 16 0.0% 100.0%
Question #36. Have you taught Special Education?
Content Area Grade N Yes No
Overall 208 17.8% 82.2% 3 19 21.1% 78.9% 5 17 5.9% 94.1% 8 20 10.0% 90.0%
Mathematics
10 19 10.5% 89.5% 3 19 21.1% 78.9% 5 22 22.7% 77.3% 8 20 20.0% 80.0%
Reading/ Literature
10 16 12.5% 87.5% 5 20 20.0% 80.0% 8 20 30.0% 70.0% Science
10 16 18.8% 81.3%

The Oregon Statewide Assessment System Technical Report Volume 3: Standard Setting
H-19
Question #37. Have you taught ESL/ELD?
Content Area Grade N Yes No
Overall 208 16.8% 83.2% 3 19 26.3% 73.7% 5 18 11.1% 88.9% 8 20 20.0% 80.0%
Mathematics
10 19 5.3% 94.7% 3 19 10.5% 89.5% 5 22 27.3% 72.7% 8 20 25.0% 75.0%
Reading/ Literature
10 16 12.5% 87.5% 5 19 15.8% 84.2% 8 20 10.0% 90.0% Science
10 16 18.8% 81.3%
Question #38. Have you taught Vocational Education?
Content Area Grade N Yes No
Overall 209 3.8% 96.2% 3 19 0.0% 100.0% 5 18 5.6% 94.4% 8 20 0.0% 100.0%
Mathematics
10 19 15.8% 84.2% 3 19 0.0% 100.0% 5 22 4.5% 95.5% 8 20 10.0% 90.0%
Reading/ Literature
10 16 0.0% 100.0% 5 20 0.0% 100.0% 8 20 5.0% 95.0% Science
10 16 0.0% 100.0%

The Oregon Statewide Assessment System Technical Report Volume 3: Standard Setting
H-20
Question #39. Have you taught Alternative Education?
Content Area Grade N Yes No
Overall 209 15.3% 84.7% 3 19 5.3% 94.7% 5 18 11.1% 88.9% 8 20 20.0% 80.0%
Mathematics
10 19 26.3% 73.7% 3 19 5.3% 94.7% 5 22 18.2% 81.8% 8 20 25.0% 75.0%
Reading/ Literature
10 16 25.0% 75.0% 5 20 0.0% 100.0% 8 20 10.0% 90.0% Science
10 16 25.0% 75.0%
Question #40. Have you taught Adult Education?
Content Area Grade N Yes No
Overall 209 27.3% 72.7% 3 19 10.5% 89.5% 5 18 38.9% 61.1% 8 20 20.0% 80.0%
Mathematics
10 19 42.1% 57.9% 3 19 21.1% 78.9% 5 22 31.8% 68.2% 8 20 30.0% 70.0%
Reading/ Literature
10 16 18.8% 81.3% 5 20 30.0% 70.0% 8 20 35.0% 65.0% Science
10 16 18.8% 81.3%

The Oregon Statewide Assessment System Technical Report Volume 3: Standard Setting
H-21
Question #41. Which content area did you work on during this standard setting?
Content Area Grade N Mathematics Reading/ Literature Science
Overall 209 36.4% 36.8% 26.8% 3 19 100.0% 0.0% 0.0% 5 18 100.0% 0.0% 0.0% 8 20 100.0% 0.0% 0.0%
Mathematics
10 19 100.0% 0.0% 0.0% 3 19 0.0% 100.0% 0.0% 5 22 0.0% 100.0% 0.0% 8 20 0.0% 100.0% 0.0%
Reading/ Literature
10 16 0.0% 100.0% 0.0% 5 20 0.0% 0.0% 100.0% 8 20 0.0% 0.0% 100.0% Science
10 16 0.0% 0.0% 100.0%
Question #42. Which grade did you work on during this standard setting?
Content Area Grade N Grade 3 Grade 5 Grade 8 Grade 10
Overall 209 18.2% 28.7% 28.7% 24.4% 3 19 100.0% 0.0% 0.0% 0.0% 5 18 0.0% 100.0% 0.0% 0.0% 8 20 0.0% 0.0% 100.0% 0.0%
Mathematics
10 19 0.0% 0.0% 0.0% 100.0% 3 19 100.0% 0.0% 0.0% 0.0% 5 22 0.0% 100.0% 0.0% 0.0% 8 20 0.0% 0.0% 100.0% 0.0%
Reading/ Literature
10 16 0.0% 0.0% 0.0% 100.0% 5 20 0.0% 100.0% 0.0% 0.0% 8 20 0.0% 0.0% 100.0% 0.0% Science
10 16 0.0% 0.0% 0.0% 100.0%
Related Documents