Order parameter and scaling behavior in BaZr x Ti1 x O3 (0.3 0.6) relaxor ferroelectrics Muhammad Usman, Arif Mumtaz, Sobia Raoof, and S. K. Hasanain Citation: Applied Physics Letters 103, 262905 (2013); doi: 10.1063/1.4860967 View online: http://dx.doi.org/10.1063/1.4860967 View Table of Contents: http://scitation.aip.org/content/aip/journal/apl/103/26?ver=pdfcov Published by the AIP Publishing This article is copyrighted as indicated in the article. Reuse of AIP content is subject to the terms at: http://scitation.aip.org/termsconditions. Downloaded to IP: 39.32.22.125 On: Tue, 31 Dec 2013 15:27:52

Welcome message from author
This document is posted to help you gain knowledge. Please leave a comment to let me know what you think about it! Share it to your friends and learn new things together.
Transcript
Order parameter and scaling behavior in BaZr x Ti1 x O3 (0.3 0.6) relaxor ferroelectricsMuhammad Usman, Arif Mumtaz, Sobia Raoof, and S. K. Hasanain Citation: Applied Physics Letters 103, 262905 (2013); doi: 10.1063/1.4860967 View online: http://dx.doi.org/10.1063/1.4860967 View Table of Contents: http://scitation.aip.org/content/aip/journal/apl/103/26?ver=pdfcov Published by the AIP Publishing
This article is copyrighted as indicated in the article. Reuse of AIP content is subject to the terms at: http://scitation.aip.org/termsconditions. Downloaded to IP: 39.32.22.125
On: Tue, 31 Dec 2013 15:27:52
Muhammad Usman
Placed Image
Order parameter and scaling behavior in BaZrxTi12xO3 (0.3 < x < 0.6) relaxorferroelectrics
Muhammad Usman, Arif Mumtaz,a) Sobia Raoof, and S. K. HasanainDepartment of Physics, Quaid-i-Azam University, Islamabad 45320, Pakistan
(Received 8 November 2013; accepted 15 December 2013; published online 31 December 2013)
We report the relaxor behavior of the zirconium doped barium titanate BaZrxTi1�xO3 solid solutions
and discuss the temperature, frequency, and concentration dependence in terms of correlations
among the polar nanoregions. The relaxor behavior is analyzed within the mean field theory by
estimating the Edward-Anderson order parameter qEA. Additionally, we find that qEA calculated for
the different concentrations obeys a scaling behavior qEA ¼ 1� T=Tmð Þn, where Tm are the
respective dielectric maxima temperatures and n¼ 2.0 6 0.1. The frequency dependence of the qEA
also shows results consistent with the above mentioned picture. VC 2013 AIP Publishing LLC.
[http://dx.doi.org/10.1063/1.4860967]
Ferroelectric relaxor systems and the understanding of
their complex behavior have recently attracted a lot of inter-
est. In part, this is due to their tunable dielectric properties
and potential applications in microwave devices, ferroelec-
tric random access memories (FERAMs), and multi layered
capacitors, to name a few.1 Apart from technological appli-
cations there is also a strong interest in these materials as
typifying a complex form of polar order in a system with
manifest randomness.2,3 Relaxor ferroelectrics are character-
ized, in particular, by a diffuse and frequency dependent
dielectric peak temperature. Perovskites, represented as
ABO3, are common ferroelectric materials and have been
extensively studied. In these perovskite structures relaxor
behavior sets in for certain substitutions at either A or B or
both A and B sites. Typical examples are PbMg1/3Nb2/3O3
(PMN),4,5 PbZn1/3Nb2/3O3 (PZN),5 and the lead (Pb) free
systems BaZrxTi1�xO3 (BZTx) and BaTi1�xSnxO3 (BSnT).6
Generally speaking relaxor ferroelectrics may be divided
into two broad categories, pertaining to heterovalent or
homovalent substitutions. The systems with heterovalent
compositions such as PMN and their solid solutions, e.g.,
PbMg1/3Nb2/3O3-PbTiO3 (PMN-PT)7 show a well-defined
dielectric peak that exhibits relaxor features. The relaxor
behavior in these heterovalent systems is understood as
occurring mainly due to two reasons: the charge imbalance
arising due to the differing dopant valence and second from
the presence of ordered polar regions of nanosize.8,9 Both
these effects produce random quenched fields, an essential
ingredient in canonical relaxor materials. A lot of work has
been done in such systems, and they are relatively well
understood. On the other hand, the homovalent substitution
of Tiþ4, for example, in BaTiO3, with Zrþ4 does not produce
a significant charge imbalance and therefore is not expected
to produce quenched random fields.2 In contrast to the heter-
ovalent relaxors the relaxor behavior in these latter materials
appears only after a significantly higher level substitution.
For example, in the case of BaZrxTi1�xO3 the relaxor behav-
ior starts for x> 0.27.10 The origin of relaxor behavior in
such homovalent titanate material has recently attracted
attention for both experimental and theoretical studies.
It has been argued in the past and also in recent works
that ferroelectric relaxors have many features that resemble
those of magnetic spin glass systems and are describable gen-
erally by the models developed for those systems.8
Akbarzadeh et al. in their numerical studies have described
the behavior of the dielectric susceptibility for the
BaZr0.5Ti0.5O3,11 using the Edward-Anderson order parame-
ter.12 Their work also illustrates the presence of polarization
clusters that grow in size and number with decreasing temper-
atures and begin to interact below a certain characteristic
temperature. These polarization clusters are identical to the
polar nanoregions (PNRs) that are understood to be central to
the relaxor behavior, with the addition that they are now con-
sidered to be dynamic entities, i.e., the center of the cluster
may shift from one Ti ion to another with time. The predic-
tions of this model were found to be in good agreement with
the experiments of Bhalla et al.10 for the temperature and fre-
quency dependence of the dielectric constant of BZT materi-
als. This is consistent with the generally accepted picture of
the development of polar nanoregions, their growth, and the
development of interactions between them. However, it
remains to be seen how (and if) these features manifest them-
selves experimentally in the order parameter, both with
increasing levels of substitution and increasing frequency. In
the current work we have studied the BaZrxTi1�xO3 relaxor
ferroelectrics (0.3� x� 0.6) and present our results for the
dielectric susceptibility as a function of concentration, tem-
perature, and frequency (x, T, f) and analyze the variations of
the obtained Edward-Anderson (EA) order parameter for
these variables (x, T, f). We further explore the important
question whether the order parameter for different concentra-
tions can be described by a universal behavior, qEAðT=TmÞ, as
is typically seen in classical spin glasses. In a similar vein the
variation of qEA(T, f) is studied to determine how the dynami-
cal response at different temperatures manifests itself in the
order parameter.
The BaZrxTi1�xO3 bulk ceramic samples with different
Zr concentration (0.3� x� 0.6) were prepared by conven-
tional solid state reaction with a two-step sintering process,
a)Author to whom correspondence should be addressed. Electronic mail:
0003-6951/2013/103(26)/262905/5/$30.00 VC 2013 AIP Publishing LLC103, 262905-1
APPLIED PHYSICS LETTERS 103, 262905 (2013)
This article is copyrighted as indicated in the article. Reuse of AIP content is subject to the terms at: http://scitation.aip.org/termsconditions. Downloaded to IP: 39.32.22.125
On: Tue, 31 Dec 2013 15:27:52
and the preparation and characterization of the obtained sin-
gle phase structures have been detailed elsewhere.13
Dielectric measurements were carried out over a frequency
range 0.2–500 kHz using Wayne Kerr LCR meter
(WK-4275) in the temperature range of 10–300 K using a he-
lium closed cycle system (Janis CCS-350 Cryostat).
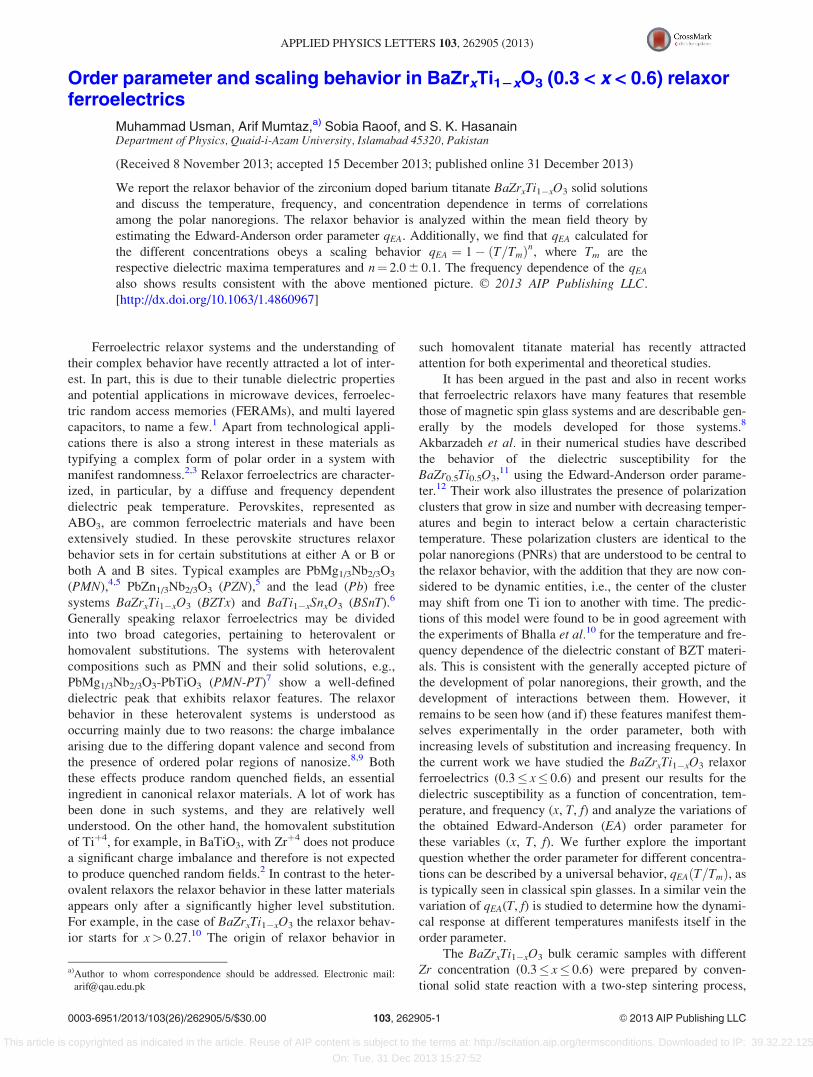
In Fig. 1, both real and imaginary parts of the dielectric
susceptibility measured at various frequencies as a function
of temperature are shown for different Zr concentrations. For
all concentrations studied, clear frequency dispersion can be
seen. It is also evident from the figure that the dielectric peak
shifts to low temperature as the Zr concentration increases.
Furthermore peak broadening with increasing Zr concentra-
tion is also evident. These observations are consistent with
many reported studies and are usually associated with com-
positional heterogeneity of the PNRs. The random distribu-
tion of B-site cations creates compositional variations of
local polar nanoregions which in turn lead to locally varying
ferroelectric transition temperatures.14 Note also that the fre-
quency dependence of the temperature of the dielectric per-
mittivity maximum, Tm, follows the Vogel-Fulcher law (not
shown here) as reported by us previously.3
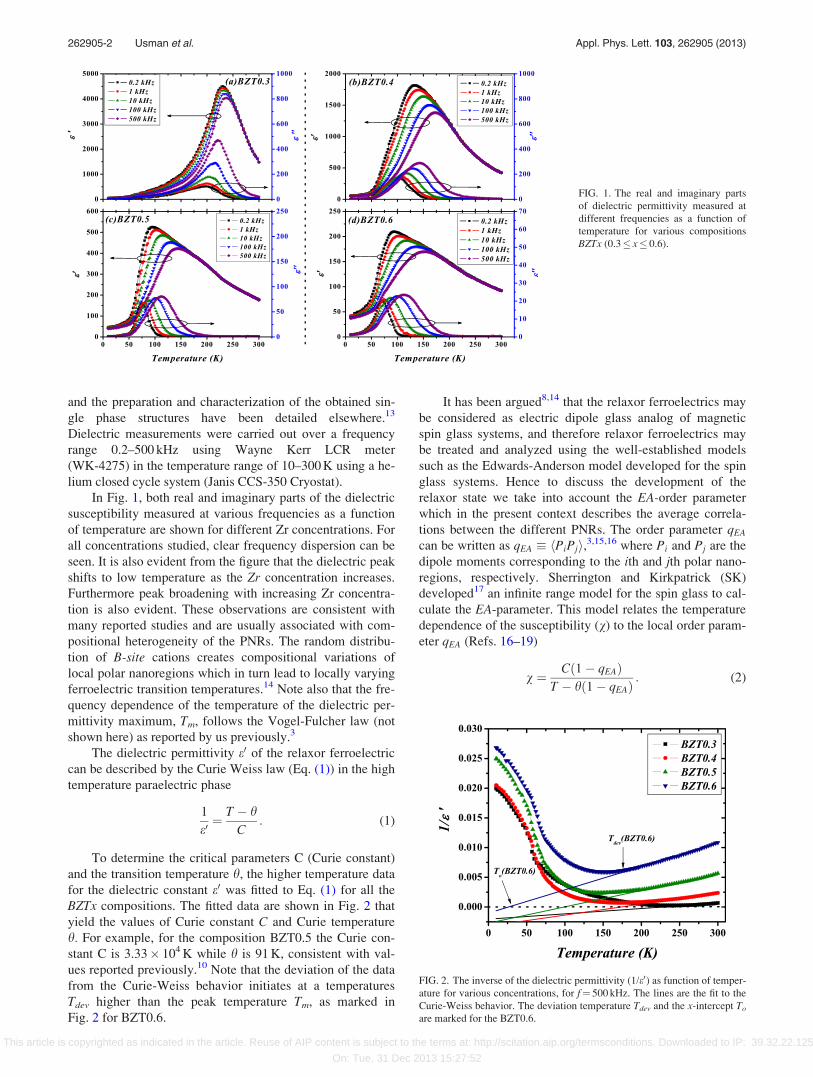
The dielectric permittivity e0 of the relaxor ferroelectric
can be described by the Curie Weiss law (Eq. (1)) in the high
temperature paraelectric phase
1
e0¼ T � h
C: (1)
To determine the critical parameters C (Curie constant)
and the transition temperature h, the higher temperature data
for the dielectric constant e0 was fitted to Eq. (1) for all the
BZTx compositions. The fitted data are shown in Fig. 2 that
yield the values of Curie constant C and Curie temperature
h. For example, for the composition BZT0.5 the Curie con-
stant C is 3.33� 104 K while h is 91 K, consistent with val-
ues reported previously.10 Note that the deviation of the data
from the Curie-Weiss behavior initiates at a temperatures
Tdev higher than the peak temperature Tm, as marked in
Fig. 2 for BZT0.6.
It has been argued8,14 that the relaxor ferroelectrics may
be considered as electric dipole glass analog of magnetic
spin glass systems, and therefore relaxor ferroelectrics may
be treated and analyzed using the well-established models
such as the Edwards-Anderson model developed for the spin
glass systems. Hence to discuss the development of the
relaxor state we take into account the EA-order parameter
which in the present context describes the average correla-
tions between the different PNRs. The order parameter qEA
can be written as qEA � hPiPji,3,15,16 where Pi and Pj are the
dipole moments corresponding to the ith and jth polar nano-
regions, respectively. Sherrington and Kirkpatrick (SK)
developed17 an infinite range model for the spin glass to cal-
culate the EA-parameter. This model relates the temperature
dependence of the susceptibility (v) to the local order param-
eter qEA (Refs. 16–19)
v ¼ C 1� qEAð ÞT � h 1� qEAð Þ : (2)
FIG. 1. The real and imaginary parts
of dielectric permittivity measured at
different frequencies as a function of
temperature for various compositions
BZTx (0.3� x� 0.6).
FIG. 2. The inverse of the dielectric permittivity (1/e0) as function of temper-
ature for various concentrations, for f¼ 500 kHz. The lines are the fit to the
Curie-Weiss behavior. The deviation temperature Tdev and the x-intercept To
are marked for the BZT0.6.
262905-2 Usman et al. Appl. Phys. Lett. 103, 262905 (2013)
This article is copyrighted as indicated in the article. Reuse of AIP content is subject to the terms at: http://scitation.aip.org/termsconditions. Downloaded to IP: 39.32.22.125
On: Tue, 31 Dec 2013 15:27:52
This relation has been used extensively16,19 to extract
the EA-order parameter from the experimental data for relax-
ors. For this purpose the values of C and h as determined
from the Curie Weiss fit of the data and the value of dielec-
tric susceptibility (at a particular frequency) for varying tem-
perature are inserted in Eq. (2).
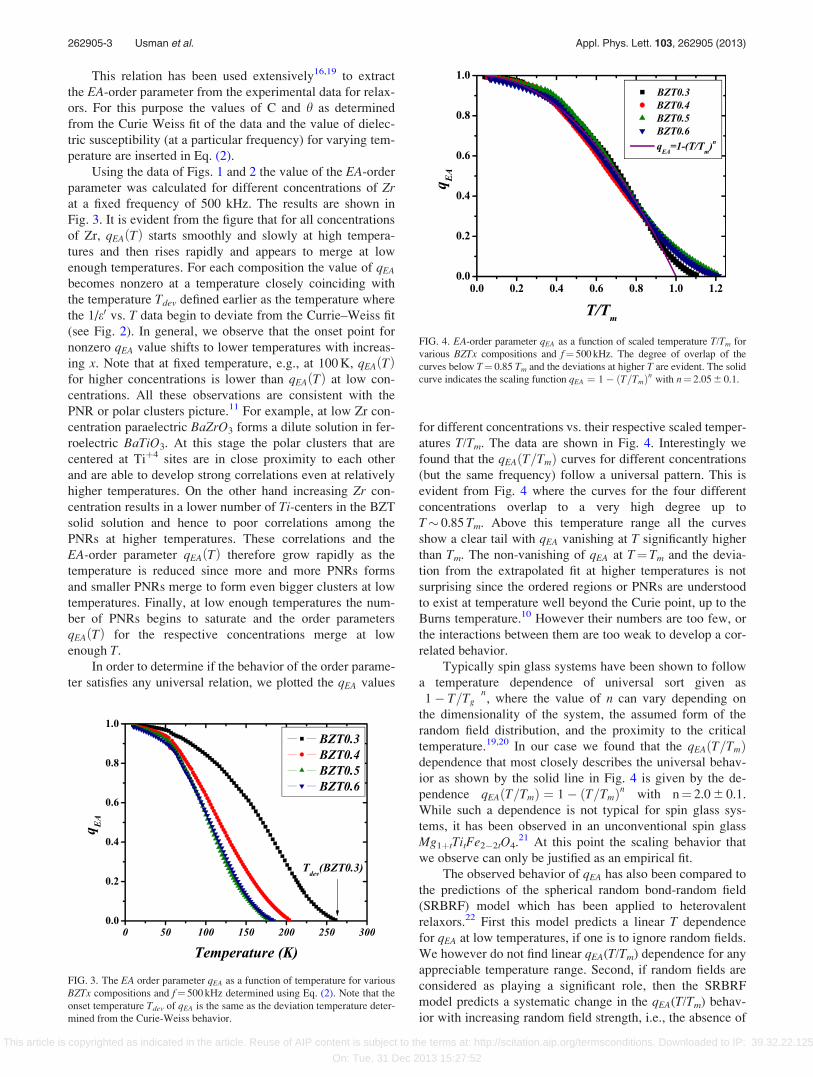
Using the data of Figs. 1 and 2 the value of the EA-order
parameter was calculated for different concentrations of Zrat a fixed frequency of 500 kHz. The results are shown in
Fig. 3. It is evident from the figure that for all concentrations
of Zr, qEA Tð Þ starts smoothly and slowly at high tempera-
tures and then rises rapidly and appears to merge at low
enough temperatures. For each composition the value of qEA
becomes nonzero at a temperature closely coinciding with
the temperature Tdev defined earlier as the temperature where
the 1/e0 vs. T data begin to deviate from the Currie–Weiss fit
(see Fig. 2). In general, we observe that the onset point for
nonzero qEA value shifts to lower temperatures with increas-
ing x. Note that at fixed temperature, e.g., at 100 K, qEA Tð Þfor higher concentrations is lower than qEA Tð Þ at low con-
centrations. All these observations are consistent with the
PNR or polar clusters picture.11 For example, at low Zr con-
centration paraelectric BaZrO3 forms a dilute solution in fer-
roelectric BaTiO3. At this stage the polar clusters that are
centered at Tiþ4 sites are in close proximity to each other
and are able to develop strong correlations even at relatively
higher temperatures. On the other hand increasing Zr con-
centration results in a lower number of Ti-centers in the BZT
solid solution and hence to poor correlations among the
PNRs at higher temperatures. These correlations and the
EA-order parameter qEA Tð Þ therefore grow rapidly as the
temperature is reduced since more and more PNRs forms
and smaller PNRs merge to form even bigger clusters at low
temperatures. Finally, at low enough temperatures the num-
ber of PNRs begins to saturate and the order parameters
qEA Tð Þ for the respective concentrations merge at low
enough T.
In order to determine if the behavior of the order parame-
ter satisfies any universal relation, we plotted the qEA values
for different concentrations vs. their respective scaled temper-
atures T/Tm. The data are shown in Fig. 4. Interestingly we
found that the qEA T=Tmð Þ curves for different concentrations
(but the same frequency) follow a universal pattern. This is
evident from Fig. 4 where the curves for the four different
concentrations overlap to a very high degree up to
T� 0.85 Tm. Above this temperature range all the curves
show a clear tail with qEA vanishing at T significantly higher
than Tm. The non-vanishing of qEA at T¼Tm and the devia-
tion from the extrapolated fit at higher temperatures is not
surprising since the ordered regions or PNRs are understood
to exist at temperature well beyond the Curie point, up to the
Burns temperature.10 However their numbers are too few, or
the interactions between them are too weak to develop a cor-
related behavior.
Typically spin glass systems have been shown to follow
a temperature dependence of universal sort given as
1� T=Tg
� �n, where the value of n can vary depending on
the dimensionality of the system, the assumed form of the
random field distribution, and the proximity to the critical
temperature.19,20 In our case we found that the qEA T=Tmð Þdependence that most closely describes the universal behav-
ior as shown by the solid line in Fig. 4 is given by the de-
pendence qEA T=Tmð Þ ¼ 1� T=Tmð Þn with n¼ 2.0 6 0.1.
While such a dependence is not typical for spin glass sys-
tems, it has been observed in an unconventional spin glass
Mg1þtTitFe2�2tO4.21 At this point the scaling behavior that
we observe can only be justified as an empirical fit.
The observed behavior of qEA has also been compared to
the predictions of the spherical random bond-random field
(SRBRF) model which has been applied to heterovalent
relaxors.22 First this model predicts a linear T dependence
for qEA at low temperatures, if one is to ignore random fields.
We however do not find linear qEA(T/Tm) dependence for any
appreciable temperature range. Second, if random fields are
considered as playing a significant role, then the SRBRF
model predicts a systematic change in the qEA(T/Tm) behav-
ior with increasing random field strength, i.e., the absence of
FIG. 3. The EA order parameter qEA as a function of temperature for various
BZTx compositions and f¼ 500 kHz determined using Eq. (2). Note that the
onset temperature Tdev of qEA is the same as the deviation temperature deter-
mined from the Curie-Weiss behavior.
FIG. 4. EA-order parameter qEA as a function of scaled temperature T/Tm for
various BZTx compositions and f¼ 500 kHz. The degree of overlap of the
curves below T¼ 0.85 Tm and the deviations at higher T are evident. The solid
curve indicates the scaling function qEA ¼ 1� T=Tmð Þn with n¼ 2.05 6 0.1.
262905-3 Usman et al. Appl. Phys. Lett. 103, 262905 (2013)
This article is copyrighted as indicated in the article. Reuse of AIP content is subject to the terms at: http://scitation.aip.org/termsconditions. Downloaded to IP: 39.32.22.125
On: Tue, 31 Dec 2013 15:27:52
a universal scaled behavior. We, on the other hand, find an
overlapping or universal qEA(T/Tm) behavior for the various
compositions. We understand the higher x compositions as
corresponding to higher level of random field strengths D.22
Thus if random fields were to be playing a significant role in
determining the order in these relaxors than the qEA(T/Tm)
curves for different x should not overlap. Therefore we
emphasize that our data show that in case of homovalent sub-
stituted relaxors, the role of random fields is not substantial.
This is also in agreement with the results of Refs. 11, where
they found that the relaxor behavior continues in BZT0.5
even if they completely switched off the random fields in
their simulations. They have argued that small antiferroelec-
tric contributions present in this system may initiate the
observed relaxor behavior.
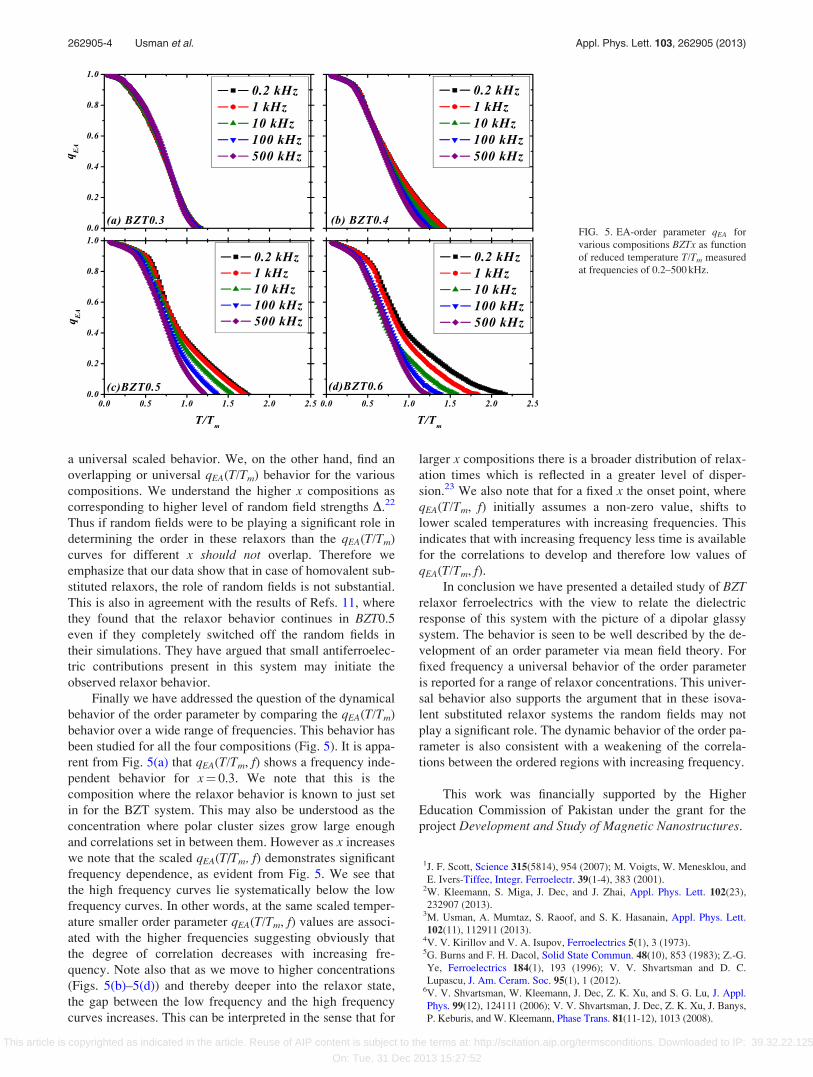
Finally we have addressed the question of the dynamical
behavior of the order parameter by comparing the qEA(T/Tm)
behavior over a wide range of frequencies. This behavior has
been studied for all the four compositions (Fig. 5). It is appa-
rent from Fig. 5(a) that qEA(T/Tm, f) shows a frequency inde-
pendent behavior for x¼ 0.3. We note that this is the
composition where the relaxor behavior is known to just set
in for the BZT system. This may also be understood as the
concentration where polar cluster sizes grow large enough
and correlations set in between them. However as x increases
we note that the scaled qEA(T/Tm, f) demonstrates significant
frequency dependence, as evident from Fig. 5. We see that
the high frequency curves lie systematically below the low
frequency curves. In other words, at the same scaled temper-
ature smaller order parameter qEA(T/Tm, f) values are associ-
ated with the higher frequencies suggesting obviously that
the degree of correlation decreases with increasing fre-
quency. Note also that as we move to higher concentrations
(Figs. 5(b)–5(d)) and thereby deeper into the relaxor state,
the gap between the low frequency and the high frequency
curves increases. This can be interpreted in the sense that for
larger x compositions there is a broader distribution of relax-
ation times which is reflected in a greater level of disper-
sion.23 We also note that for a fixed x the onset point, where
qEA(T/Tm, f) initially assumes a non-zero value, shifts to
lower scaled temperatures with increasing frequencies. This
indicates that with increasing frequency less time is available
for the correlations to develop and therefore low values of
qEA(T/Tm, f).In conclusion we have presented a detailed study of BZT
relaxor ferroelectrics with the view to relate the dielectric
response of this system with the picture of a dipolar glassy
system. The behavior is seen to be well described by the de-
velopment of an order parameter via mean field theory. For
fixed frequency a universal behavior of the order parameter
is reported for a range of relaxor concentrations. This univer-
sal behavior also supports the argument that in these isova-
lent substituted relaxor systems the random fields may not
play a significant role. The dynamic behavior of the order pa-
rameter is also consistent with a weakening of the correla-
tions between the ordered regions with increasing frequency.
This work was financially supported by the Higher
Education Commission of Pakistan under the grant for the
project Development and Study of Magnetic Nanostructures.
1J. F. Scott, Science 315(5814), 954 (2007); M. Voigts, W. Menesklou, and
E. Ivers-Tiffee, Integr. Ferroelectr. 39(1-4), 383 (2001).2W. Kleemann, S. Miga, J. Dec, and J. Zhai, Appl. Phys. Lett. 102(23),
232907 (2013).3M. Usman, A. Mumtaz, S. Raoof, and S. K. Hasanain, Appl. Phys. Lett.
102(11), 112911 (2013).4V. V. Kirillov and V. A. Isupov, Ferroelectrics 5(1), 3 (1973).5G. Burns and F. H. Dacol, Solid State Commun. 48(10), 853 (1983); Z.-G.
Ye, Ferroelectrics 184(1), 193 (1996); V. V. Shvartsman and D. C.
Lupascu, J. Am. Ceram. Soc. 95(1), 1 (2012).6V. V. Shvartsman, W. Kleemann, J. Dec, Z. K. Xu, and S. G. Lu, J. Appl.
Phys. 99(12), 124111 (2006); V. V. Shvartsman, J. Dec, Z. K. Xu, J. Banys,
P. Keburis, and W. Kleemann, Phase Trans. 81(11-12), 1013 (2008).
FIG. 5. EA-order parameter qEA for
various compositions BZTx as function
of reduced temperature T/Tm measured
at frequencies of 0.2–500 kHz.
262905-4 Usman et al. Appl. Phys. Lett. 103, 262905 (2013)
This article is copyrighted as indicated in the article. Reuse of AIP content is subject to the terms at: http://scitation.aip.org/termsconditions. Downloaded to IP: 39.32.22.125
On: Tue, 31 Dec 2013 15:27:52
7A. A. Bokov and Z. G. Ye, Phys. Rev. B 65(14), 144112 (2002).8L. E. Cross, Ferroelectrics 76(1), 241 (1987).9L. E. Cross, Ferroelectrics 151(1), 305 (1994).
10T. Maiti, R. Guo, and A. S. Bhalla, J. Am. Ceram. Soc. 91(6), 1769 (2008).11A. R. Akbarzadeh, S. Prosandeev, E. J. Walter, A. Al-Barakaty, and L.
Bellaiche, Phys. Rev. Lett. 108(25), 257601 (2012).12S. F. Edwards and P. W. Anderson, J. Phys. F: Met. Phys. 5(5), 965 (1975).13I. Kagomiya, Y. Hayashi, K.-i. Kakimoto, and K. Kobayashi, J. Magn.
Magn. Mater. 324(15), 2368 (2012).14A. E. Glazounov, A. J. Bell, and A. K. Tagantsev, J. Phys.: Condens.
Matter 7(21), 4145 (1995).
15H.-J. Sommers, J. Phys. Lett. 43(21), 719 (1982).16D. Viehland, S. J. Jang, L. E. Cross, and M. Wuttig, Phys. Rev. B 46(13),
8003 (1992).17D. Sherrington and S. Kirkpatrick, Phys. Rev. Lett. 35(26), 1792 (1975).18B. E. Vugmeister and H. Rabitz, J. Phys. Chem. Solids 61(2), 261 (2000).19S. Nagata, P. H. Keesom, and H. R. Harrison, Phys. Rev. B 19(3), 1633
(1979).20K. Binder and A. P. Young, Rev. Mod. Phys. 58(4), 801 (1986).21G. M. Irwin, Phys. Rev. B 51(21), 15581 (1995).22R. Pirc and R. Blinc, Phys. Rev. B 60(19), 13470 (1999).23A. J. Bell, J. Phys.: Condens. Matter 5(46), 8773 (1993).
262905-5 Usman et al. Appl. Phys. Lett. 103, 262905 (2013)
This article is copyrighted as indicated in the article. Reuse of AIP content is subject to the terms at: http://scitation.aip.org/termsconditions. Downloaded to IP: 39.32.22.125
On: Tue, 31 Dec 2013 15:27:52
Related Documents