Antti Vuorinen Order Delivery Management Case: Xerox Oy Helsinki Metropolia University of Applied Sciences BBA International Business & Logistics Thesis 16 April 2013

Welcome message from author
This document is posted to help you gain knowledge. Please leave a comment to let me know what you think about it! Share it to your friends and learn new things together.
Transcript

Antti Vuorinen
Order Delivery Management
Case: Xerox Oy
Helsinki Metropolia University of Applied Sciences
BBA
International Business & Logistics
Thesis
16 April 2013

Abstract
Author(s) Title Number of Pages Date
Antti Vuorinen Order Delivery Management, Case: Xerox Oy 32 pages and two appendices 16 April 2013
Degree BBA
Degree Programme International Business & Logistics
Specialisation option Logistics
Instructor(s)
Kaija Haapasalo, Senior Lecturer
This thesis discusses the importance of inventory management, specifically focusing on order delivery management. The thesis is written for a case company, Xerox Oy, the Finn-ish subsidiary of printing industry corporation Xerox Corporation. The thesis discusses how to optimize order sizes and the size of the customer inventory from the service provider’s point of view. While it is at times important for the customer to maintain high inventory levels in order to maintain steady production, the service provider at often times wants to decrease their financial liability in terms of customer stock. In the case of Xerox Oy this is especially true, as the customer inventory is not billed per the agreement and is thus considered capital cost for the service provider. The main focus of the literary review is on how inventory management relates to Michael Porter’s value chain and how theory can be utilised in the Xerox Oy case. The case is ana-lysed by creating metrics to compare customer delivery data in the month of September 2012. The metrics are then compared to figures provided by Xerox Oy and their logistics service provider DSV Solutions Oy. Finally, an adapted balanced scorecard approach is used to reference the presented data. The conclusion of the analysis is that Xerox’s current customer inventory philosophy caus-es their total cost of ownership to be extremely high due to a high number of individual transportation transactions. Customer orders are not grouped efficiently due to a lack of resources in order optimization, and therefore the processing of orders is not optimal, par-ticularly for the largest individual Xerox customers.
Keywords inventory management, customer service, order delivery, supply chain management, optimization

Table of Contents
1 Introduction 1
1.1 Objectives and scope 2
1.2 Study methodology and limitations 3
1.3 Company introduction - Xerox 4
2 Principles of inventory management in the supply chain 6
2.1 The supply chain and the value chain 6
2.2 Inventory management 8
2.3 Carrying cost of inventory 9
2.4 Inventory replenishment 10
2.5 Customer service 12
3 Order delivery management at Xerox Oy 15
3.1 Order delivery process 15
3.2 Order escalation 16
3.3 Exception list 17
3.4 Results of the qualitative research 18
4 Supply chain cost analysis 19
4.1 Xerox customer type introduction 20
4.2 Order delivery cost analysis 22
4.3 Performance analysis of Xerox order management 25
5 Conclusion 29
6 References 31
Appendices
Appendix 1. Xerox Order Management Flow Chart
Appendix 2. Performance indicators at Xerox Oy, September 2012

List of Figures and Tables
Figure 1: Michael Porter’s Value Chain (adapted from Porter in Magretta 2012) 7
Figure 2: ROP calculation example 11
Figure 3: Delivery efficiency ratio calculation 20
Figure 4: Relative delivery efficiency ratio calculation 21
Figure 5: Xerox supplies delivered per delivery 23
Figure 6: The adapted balanced scorecard (adapted from Kaplan & Norton,
1992 in Johnston & Clark, 2008) 26
Table 1. Xerox Oy customer example delivery efficiency ratios, September 2012 23
Table 2. Xerox Oy carrying cost of inventory, September 2012 24

1
1 Introduction
The importance of cost-effective process and flow management in modern supply
chain management cannot be understated. The profitability and competitiveness of
companies in all industries are being judged by how well they succeed in providing
their customers with their products. In traditional industries such as the automotive in-
dustry, there is by default a very limited way in how to purchase and deliver a product,
i.e. a vehicle, because of the physical nature of said product. However, the world
around us has changed and, more importantly, customers have changed. Because of
the wide variety of service options available for the modern customer, it is easy to, for
the lack of a better phrase, cherry-pick the exact solution that fits the business model of
the customer – be it logistics, marketing, consulting or equity management. This ap-
plies to both corporate and private customers, as the tailor-made solutions industry has
become a highly profitable way of conducting business. Peter Drucker, famed man-
agement guru, argued that a company only has one purpose: that of producing cus-
tomers (Drucker, 1999 in Grant, 2012: 16).
With that said, this thesis will focus on portraying the delivery of goods by a service
provider to their customers in a traditional industry. As with most companies, the chal-
lenge of the case company is to provide products at a sustainable price while also fol-
lowing up with a competitive service organization. The referred case company is Xerox
Oy, the Finnish subsidiary of Xerox Corporation, a multinational corporation in the print-
ing industry, for whom the writer worked for during 2011-2012. Coming from a logistics
undergraduate background, working for a company with set processes in service and
logistics was a challenge and an opportunity to analyse the business model.
The single largest challenge that Xerox Corporation as an entity faces is similar to that
of the bulk of the industry: a decrease in demand. While advertising and media spend-
ing rose by an average of 5 per cent in 2012, focus in print media continues to decline
for the second year in a row (European Publishers Council, 2013). As laptop comput-
ers, smartphones and tablet devices among others are becoming increasingly com-
mon, the demand for printed news and books is decreasing.

2
It will remain interesting to see how and when the printing industry in general will im-
prove its services to accommodate mobile devices into the service models of the re-
spective companies in the industry. In order to stay profitable, Xerox Oy must therefore
improve its internal processes, be it through cost cutting or innovation.
1.1 Objectives and scope
The main objective of this thesis is to illustrate the importance of inventory manage-
ment by demonstrating with the help of a case company how the different operations of
a supply chain affect one another. The secondary objective is to improve business op-
erations at Xerox Oy, introduced further in Chapter 1.3. The thesis has been written
upon their request as a business process analysis.
The goals of this thesis are as follows:
Presenting the present supply chain of the case company based on qualitative
interviews, empirical observations and statistical analysis
Improving business solutions and presenting methods to improve the supply
chain of the case company
Provide and develop implementable processes for Xerox Oy
This thesis consists of two main parts, the first being a literature review and theoretical
study and the second being a presentation and analysis of the Xerox Oy order delivery
supply chain of printing supplies. The specific scope of this thesis is to improve the
supply chain activities of delivering Xerox printing supplies to Xerox Oy customers. For
the purpose of clarity it is important to note that while the company also has other logis-
tics activities relating to Xerox printing machinery and the organization of field mainte-
nance spares processes, they will be excluded from this thesis in order to reduce the
scope.

3
1.2 Study methodology and limitations
The study for this thesis was conducted in three parts. First, an investigation of theoret-
ical framework was conducted to create a foundation for suggesting solutions for the
business needs of the case company. The theoretical study information consists of
secondary data from different publications.
The second part of the study was to conduct qualitative interviews with case company
employees to define the needs of the working environment. The sample size for these
interviews consists of two employees working directly with consumer supplies logistics
as coordinators and of one person in a managerial position of service activities in the
company. Empirical research was also conducted through making observations in the
day-to-day operation of the company, therefore collecting material for the purpose of
the empirical study. The information was compiled during 2011, while the writer was
working within the Xerox Oy organization as a back office coordinator and later finan-
cial trainee for a total duration of eight months.
Thirdly, a statistical analysis was created to support the qualitative interviews in finding
the optimized solution for the company. The sample size of the analysis was the con-
sumer supplies cost figures for the month of September 2012 as well as the related
logistics cost figures for the month of September 2012. These figures were then cross-
referenced to illustrate the pre-existing supply chain processes of the company. As a
result of the qualitative and statistical analyses causes and solutions for the business
case are then presented.
The limitations of this thesis are comprised of the sample sizes of the analyses. Due to
the lack of relevant interviewees in the case company, all employees directly related to
the subject matter on an in-country basis were interviewed in person. Furthermore, the
sample size of the statistical analysis was chosen to be the month of September 2012,
as it is represents recent figures that suffice for the ends of the study. However, it only
represents one period of twelve in one specific financial year, and therefore may be
considered insufficient in size, as there is no opportunity to discuss trends in volume or
profitability. This may be attributed to the stagnant nature of the printing industry, where
a certain amount of advertisements, magazines and related products will be produced
indifferent to the macroeconomic environment.

4
Furthermore, the specificity of this thesis is directed sharply towards a single facet of
the entire Xerox supply chain regarding service. As mentioned earlier in Chapter 1.1,
activities relating to the logistic organization of machinery and maintenance processes
have been left out of this study for clarity. For future research it might be possible to
delve deeper into the supply chain at hand in order to combine elements of equipment,
maintenance and spares logistics to create a holistic analysis of the Xerox service ap-
proach.
1.3 Company introduction - Xerox
Xerox Corporation is a multinational corporation operating in 160 countries and em-
ploying approximately 140 000 employees. The company was founded in 1906 in Con-
necticut as the Haloid Company and was eventually renamed as Xerox Corporation in
1961. Xerox Corporation is focused in printing, information technology and document
outsourcing with a selected array of services ranging from production printing machin-
ery to small and medium sized businesses for less required printing capacity. The
company had a $22.6 billion turnover in 2011. (Xerox Corporation, 2013).
Xerox released its first commercial xerographic device, the Xerox 914, in 1959 and
entered the New York Stock Exchange on July 11th 1961 as Xerox Corporation (XRX).
Xerox also launched a joint venture into Japan as Fuji Xerox in 1962. In addition to
printing, the company also was highly innovative in information technology and hard-
ware, commercially launching Alto, the world’s first personal computer in 1973, com-
plete with a graphical user interface and mouse. This keen eye for developments in
technology led to registering the seventh all-time .com- domain internet-address in
1986, Xerox.com. Xerox also invented the prototype of tablet computers in 1988, the
PARCTab, a palm-sized wireless document reader (Xerox Corporation, 2013).
With the widespread of the internet and wireless communication in the 1990’s, the
printing industry has suffered a decrease in turnover during the last 10 years. Xerox still
operates as the worldwide leader in printing and document management and continu-
ously increases its service offering. In 2010 Xerox purchased Affiliated Computer Ser-
vices, Inc., to strengthen its business process outsourcing services (Xerox Corporation
2013).

5
Xerox Oy is the Finnish subsidiary of Xerox Corporation, employing roughly 80 people.
The company operates in Finland with a group of 12 concessionaires dividing the coun-
try regionally in sales and equipment maintenance. In addition to acting through con-
cessionaires, Xerox Oy has direct deals with its largest customer accounts, mostly pro-
duction printing customers in Southern Finland.
As many other multinational corporations before it, the Xerox Corporation has taken to
divide its operation into larger entities based on geographical position and market size.
Xerox Oy in Finland is part of Xerox Central and Northern Europe (CNE), which in part
is a subsidiary of Xerox Europe (XE). In addition to Finland, the CNE area consists of
Sweden, Norway, Denmark, The Netherlands, Belgium, Luxembourg and Switzerland,
with Denmark and the Netherlands being the largest markets for Xerox in terms of rev-
enue.
Xerox’s most common service contract is called the Full Service and Maintenance
Agreement (FSMA). The contract often charges a monthly or quarterly fixed cost, which
in charge covers for the rent of the equipment and all equipment maintenance when
required. In addition, the contract covers for Xerox’s consumable products, i.e. printing
supplies, which are printer toners, colour drums, xerographic units and other mainte-
nance parts. Depending on the size of the equipment the customer may replace the
parts when prompted without the assistance of a Xerox service engineer. The contract
also charges a fixed sum, often ranging from 0,0005 € to 0,07 €, per printed impression
on the machine, taking into consideration copies, prints and scans in colour or in black-
and-white. This collection of impressions is called the meter reading of a machine.

6
2 Principles of inventory management in the supply chain
2.1 The supply chain and the value chain
The supply chain could be generally described as a collective of well-coordinated or-
ganizational functions that strive to achieve a common goal more efficiently than the
competition (Christopher 2005: 5). The function of the supply chain is to support the
organization in achieving its business goals. For instance, in most businesses logistics
costs represent a considerable part of the company’s total costs and therefore oppor-
tunities to increase operational margins through optimizing and decreasing total logis-
tics costs are created (Christopher 2005: 11). This is also the case with Xerox Oy,
whose logistics costs will be presented further in Chapter 4.2.
The supply chain and its related functions cannot be presented without discussing the
value chain, which lends its functions to creating a margin of efficiency in the supply
chain. The value chain, originally presented by Michael Porter, describes the activities
of a company that are directly related to designing, producing, selling, distributing and
supporting its products (Magretta 2012: 76-78). The primary activities of the supply
chain are inbound and outbound logistics, operations, marketing and sales as well as
post-sales service. As previously described, these functions are most responsible and
also most visible to the customer in how a company creates value. These activities are
supported by secondary support activities, which are infrastructure and organizational
structure, human resources, research and development (R&D) and procurement or
purchasing. These functions combine to create a margin value, as depicted in Figure 1,
which contributes to operational excellence and therefore achieving competitive ad-
vantage.

7
Figure 1. Michael Porter’s Value Chain (adapted from Porter in Magretta 2012: 76-78)
Consequentially, the supply chain focuses on the linkages between the value chain
functions and enhances the functionality of the upstream and downstream value adding
activities (Christopher 2005: 17). These linkages are also called flows (Skjøtt-Larsen et
al 2007: 20). A supply chain manager takes the activities of the value chain and finds
the optimal suppliers for each activity based on the enterprise’s strategy needs. For
instance, well-executed operations reduce the amount of inventory required as a result
of improved information and flow coordination (Johnston & Clark, 2008: 152).
Supply chain management is sometimes seen as a synonym to modern logistics. How-
ever, it is important to make a distinction between the two; while logistics deals with key
functions such as transportation, warehousing, sourcing et cetera, supply chain man-
agement (SCM) deals with logistics management issues and adds the function of coor-
dinating and collaborating with external and internal service providers (Grant 2012: 3).

8
2.2 Inventory management
One of the modern keys to operational efficiency in logistics is proper inventory man-
agement. The role of inventory is important not only for customers and suppliers, but
also for departments throughout the enterprise. For instance, marketing wants high
levels of inventory so that they can communicate it to the customer, while manufactur-
ing requires a continuous volume of raw materials in order to keep running. On a con-
tradicting perspective, the finance department wants to keep inventory levels as low as
it is sustainable, since inventories are effectively considered as a fixed asset on the
balance sheets (Coyle et al, 2003: 188).
As companies strive to savings primarily by reducing on fixed assets, inventory may be
considered one of the foremost targets of cost cutting. Since logistics has only recently
been thought of as its own business entity, several companies still have not responded
with holistic financial plans to evaluate larger concepts effectively. Savings in this field
has led to a boom of outsourcing warehousing activities, which in turn has created a
need for optimizing logistics from a service provider point of view, competing on under-
lying aspects such as third party service provider strategy, resources for global uni-
formity in service as well as information technology capabilities (Lynch 2002: 635).
Inventory may be considered as having a dual role in general operations management.
On one hand, work-in-progress (WIP) inventory is required in order to keep processes
upheld, while simultaneously inventory is required due to the different imperfections of
the supply chain. For instance, when forecasting demand it is necessary to always
keep a buffer inventory at hand in order to compensate for the potential inaccuracy of
the forecast (Johnston & Clark, 2008:152). In Xerox’s case this means that a certain
amount of WIP inventory must be available for the supplies deliveries may keep run-
ning at all times and that the size of said inventory has to be significant enough to ac-
count for unforeseeable orders.
Companies have different needs in regards to their inventory strategy based on the
nature of the industry, supply chain and financial stability of the respective company.
Companies that carry consumer products must carefully consider their inventory levels,
as they cannot afford a situation where the demand of a product is higher than invento-
ry supply, whereas the motivation for manufacturing-related service providers to keep

9
high inventory levels is to ensure the continuous flow of production (Coyle et al, 2003:
192-193). Xerox Oy could be considered as a consumer product company, as it faces
similar difficulties in regards to its service based business model. The service perspec-
tive requires a high amount of goods continuously available in case of customer order
peaks. Simultaneously it is imperative to keep costs low by reducing value tied up to
inventory costs. This duality of inventory costs creates a situation where companies
need to conduct a trade-off analysis, where various metrics and factors dictate the rela-
tionship between desired customer service levels and desired inventory investment,
resulting in an optimization which gives guidance to the inventory management policies
of the company (Coyle et al, 2003: 194).
However, it is important to notice the occasional inaccuracies of these estimations, as it
is difficult to effectively value customer service levels, as the actions towards maintain-
ing the desired level of service may result in highly different outcomes. Different com-
panies and/or customers may consider themselves content with certain levels of ser-
vice based on size and relationship with the service provider. Furthermore, it is im-
portant to take stock-out costs into consideration – i.e. the cost of not having products
available in inventory at a certain point in time. Stock-outs create direct costs in form of
loss of sales when the customer decides to purchase from a competitor instead of wait-
ing for the completion of a back order (Coyle et al, 2003: 204). Depending on the rela-
tionship of the parties, stock-out costs may vary from a minor loss of trust to even los-
ing the customer over continued delivery woes. From a planning and preventive stand-
point, the loss caused by stock-out costs is difficult to determine as it fluctuates based
on the size of the customer.
2.3 Carrying cost of inventory
Carrying cost of inventory is a financial concept used in weighing the different parts of
inventory and warehousing costs in order to improve certain aspects. The carrying cost
of inventory of four basic structures: capital cost, holding cost, inventory service cost
and inventory risk cost (Coyle et al, 2003: 198-199). Capital cost is the largest and
most focused one of the four, as it consists of investment capital tied up to inventory
that could be used in other parts of the business, such as acquisitions, infrastructure or
marketing. In this sense, capital cost of inventory could be considered as opportunity

10
cost to the business, which in turn makes the determining of the optimal amount of cap-
ital tied up to inventory crucial. Some companies use an internally specified hurdle rate,
which is defined as the minimum rate of return expected in a new investment (Coyle et
al, 2003: 198). There is no industry standard hurdle rate, so companies need to careful-
ly adjust their approach to inventory value with the intent of reducing it to sustainable
levels.
In addition to capital cost, inventories are maintained by so called holding costs, which
are variable costs consisting of practical factors such as labour, handling, warehouse
rent, heating and lighting.
Additionally, the goods in inventory need to be insured and/or taxed; this is covered by
inventory service costs and may vary based on the nature of the goods in stock. Final-
ly, inventory risk cost takes into consideration depreciation – i.e. technological advanc-
es or seasonal fluctuations – as well as damages to goods, thievery or other loss of
products (Coyle et al, 2003: 199). The average holding cost of American companies in
2006 was roughly 30 per cent of their total inventory value (Russell & Taylor III
2006:529). As a technologically based company, Xerox Oy is interested in the effects
of technological change and the change of its product base when it comes to inventory
level specification, as excess amounts of technologically expired goods are not desired
capital costs.
2.4 Inventory replenishment
There are two basic ways to replenish inventories: either through a fixed order quantity
or a fixed time period system (Russell & Taylor III 2006:533-534). The fixed order
quantity controlling type continuously monitors inventory levels on a per item basis, and
is mostly supported by supply chain management software. The fixed order quantity
often operates with the help of a set reorder point (ROP), which Xerox uses to uphold
its inventory replenishment strategy.
The reorder point (ROP) is defined as an inventory level which directly affects the gen-
eration of new orders. Whenever the stock keeping amount of an item registers at less
than the predefined reorder point, an automatically generated order is placed to ensure

11
that availability of goods at a desired level (Russell & Taylor III 2006:533). The reason
for maintaining fixed replenishment is to optimize and alleviate the difference between
carrying cost and order size, resulting in a more efficient supply chain strategy (Russell
& Taylor III 2006:538).
When the reorder point is reached, a standard order is generated based on the eco-
nomic order quantity. The time between the placing of the order and its arrival is called
lead time, a general expression dictating the amount of time which is spent waiting for
the supply chain to run its course. During lead time it is essential that inventory levels
should not reach zero; rather, the focus is to have inventory levels as low as possible
before the replenishment order arrives (Russell & Taylor III 2006:537). This duality of
inventory levels peaks and valleys, creating a mean for inventory levels. This is then
applied for the purpose of financial metrics to define the capital cost of inventory.
The reorder point is calculated by dividing the demand rate of a product per period and
multiplying the division by the expected lead time in the supply chain (Russell & Taylor
III 2006:547). For instance, if a company expects to sell 10 000 units of a product per
month, with the expected lead time the reorder point of that product being 12 days, the
reorder point would be:
Figure 2: ROP calculation example
This means that when stock levels decrease to fewer than 4 000 stock keeping units,
an order would be generated. A stock keeping unit or SKU may most simply be defined
as one unique production unit with uniform features, design and function (Grant 2012:
80).
The fixed time interval based order management option is based on periodically
achieving target inventory levels. An often used approach is to incorporate fixed order
quantity methods to define the number of orders required per year, and then take into
consideration factors such as lead time, reorder periods and buffer stock (Shridhara
ROP = 10 000 units
30 days× 12 days = 4 000 units

12
2009: 158). The focus is on preserving a certain level of inventory at all times, which
lends itself well for industries with high service levels and material availability require-
ments. The weakness of the fixed time delivery option in Xerox’s case is that it delivers
products on a periodical basis despite the levels of inventory at that specific time. Due
to Xerox’s focus on suppressing inventory levels to a minimum, the philosophy of con-
stant replenishment despite demand does not match with the case inventory manage-
ment concept.
2.5 Customer service
From an order delivery point of view, customer service may be considered inherently
linked with outbound logistics, as it directly portrays the average customer perception
of level of service, which has been established earlier as the timeliness and speed of
the delivery. However, it could be further argued that customer service dictates the
needs for the entire supply chain, serving as the focal point for modern logistics (Coyle
et al, 2003: 92-93). In marketing terms, supply chain activities produce the outcome of
delivering the correct product, at the promised time and amount, to the customer as
well as retaining the expected quality without causing damages or additional delivery
related costs. It could be argued that the essence of logistics related service value is to
provide a higher perceived value to the product than its perceived cost (Grant 2012:
17). Structurally, service needs to meet the nature of demand in order for it to be on the
required level and successful (Leenders et al 2006: 455).
To this end, the function of logistics is to ensure the marketing department’s promised
delivery dates and service levels are met. Failure to do so leads directly to lost sales
and weakened margins throughout several departments, as customer service is not
only supported by marketing and logistics. For instance, agreeing to certain billing
terms, financing a project or investing, installing as well as maintaining equipment are
also privy to the discussion of customer service (Coyle et al, 2003: 96). Therefore, if
transportation of the goods fails to deliver the expected level of service, the effort put
forth by the other departments towards customer service is erased in the eyes of the
customer.

13
It is also worth noticing that service levels are monitored from both sides of the service
provision contract, and if certain contractually guaranteed metrics are not reached,
sanctions or even the loss of customers may be an end result of less-than optimal ser-
vice performance (Leenders et al, 2006: 141).
Demand has a progressively growing effect on the entirety of the supply chain. It could
be considered that the key to efficient supply chain management is accurately meeting
forecasting demand. According to Russell and Taylor III (2006:532) the ability to meet
demand is the key to establishing a desired level of service. Regardless of customer
expectations, service levels and inventory costs increase in parallel manner; this is a
direct result of the increase of capital investment in stock.
In order to illustrate the levels of importance of service in an organization, it is important
to take into consideration the service as a level of product and then apply a level of
involvement from an organizational standpoint. According to Coyle et al (2006: 95-96)
there are essentially three levels of product that contribute towards customer service as
an enhancement of the product. Firstly, customer service can be seen as an arbitrary
task which needs to be completed due to expectation thereof. This level of service pro-
vision cannot be considered proactive or especially desirable, but it frees up resources
to other parts of the organization.
Secondly, customer service can be seen as a performance indicator, measuring specif-
ic facets of service by determining a monetary value to the providing of the service, e.g.
how many orders were delivered on time or how frequently goods were faulty upon
arrival to the customer. This level of service takes an analytical approach to the benefit
service activities. However, it is due noting that service indicators are not necessarily
measurable at a distinguishable level (Coyle et al 2006: 96).
The third and most service-oriented level of organizational involvement is customer
service as a philosophy, where the focus is on differentiating with service and therefore
adding value to the product through service activities such as quality management,
delivery time and reliability (Coyle et al 2006: 96). The added value to the product also
makes the philosophy viable as a business alternative for the supplier.

14
In order to illustrate the level of commitment an organization has towards its customer
service activities it is imperative to establish the most relevant metrics for service.
Equally to the levels of service dedication, metrics for logistics customer service may
be divided into three classes: pre-sales, order service and post-sales (Grant 2012: 18).
Pre-sales metrics may measure e.g. the availability of products – both physically in
stock or the consistency of the supply chain process in order to improve flows – and
order cycle times, measuring the different phases of the order process to improve upon
lead time issues. Availability may be measured by e.g. categorical amount of SKU’s in
stock, amount of total inventory SKU’s and monetary value thereof. Furthermore, order
cycle times are more straightforward to analyse, as each phase of the order cycle is
tracked for duration and assigned a percentage of time for the total delivery. These
percentages are then compared and restructured for efficiency (Grant 2012: 20).
Service metrics during the order delivery process include accurate delivery, quality of
delivery and product, amount of deliveries and other relative metrics in conjunction to
these ends (Grant 2012: 20). These rudimentary metrics may be further analysed and
cross-compared to match and improve business needs, as discussed further in Chap-
ter 4 of this thesis. Furthermore, post-sales metrics may include technical support and
availability thereof as well as customisable services. The purpose of providing services
beyond the initial customer transaction is to retain the customer and to create lasting
relationships.

15
3 Order delivery management at Xerox Oy
3.1 Order delivery process
The Xerox supplies order delivery process, as illustrated in Appendix 1, is in itself rela-
tively efficient. When the respective supplies product, e.g. cyan-coloured toner, in the
equipment is starting to run low, the machine starts to inform the user when the colour
cartridge is at 15% capacity – that being the factory default setting that has been set to
all Xerox printers in order to decrease machine downtime due to a lack of supplies. In
most cases, the display of the printer prompts the user to order a new consumable unit
but not to replace it in the equipment yet.
When prompted by the Xerox machine the customer is expected to telephone the Xer-
ox Europe Welcome Centre, which is based either in Greenock, Scotland, Dublin, Ire-
land or Lutz, Poland based on the type of contract the customer has. In each case, all
of Xerox’s Finnish customers receive service in their native language by Finnish ser-
vice agents who work in call centres operated by Affiliated Computer Services Inc.
(ACS) and IBM in the aforementioned locations. These call centres are centralized in
order to decrease labour costs.
When calling the Welcome Centre, the customer is first asked to enter the ten-digit
serial number of their equipment in order for the SAP-based enterprise resource plan-
ning system, Voyager, to recognize it. SAP is arguable one of the most used enterprise
resource planning software packages in the world, and it is configured to fit Xerox’s
business needs throughout the company.
Upon entering the serial number, either by entering the digits on the keyboard of the
phone or through a voice recognition system provided by Xerox, the service agent an-
swers the phone call and discusses the consumables needs of the customer. In most
cases, the customer is only in need of a single package of toner and/or a colour drum.
When receiving the order, the service agent asks the customer for the latest meter
readings of the equipment and enters them into the system. This is done to validate the
size of the customer’s order, as there are parameters in the SAP-system which calcu-
late the optimal order size based on the meter readings.

16
When a supplies order is placed by the Welcome Centre service agent, the SAP-based
system immediately sends an order ticket to the central Xerox warehouse in Finland.
The warehouse is located in Vantaa and is operated by DSV Solutions Oy. When the
order is registered into the system, the DSV logistics workers manually pick the orders
and then place them onto delivery vehicles. The company uses three regional distribu-
tion centres (RDC) as delivery hubs – one each in Tampere, Turku and Oulu – which
are utilised to decrease the amount of individual transport transactions to more remote
locations around Finland. Xerox promises its customers to deliver supplies within three
working days, leaving little to no room for lead time related incidents.
All Xerox consumables are shipped to Finland from the Xerox central logistics hub
which is located in Venray in The Netherlands. The Vantaa-based Finnish warehouse
stores all supplies of Xerox office machines. It bases its operations on a local buffer
inventory, which is replenished using a predetermined ROP for each product. The re-
plenishment cycle is twice per week, on Mondays and Thursdays. The goods arrive to
Finland from The Netherlands by road transport. Trucks are used as they are cost-
effective and have a reliable schedule; one week from generating the order the goods
will arrive in Finland. However, if supplies in Finland are depleted and an order is ur-
gent, the Finnish Xerox in-country consumables team called the customer solutions
organization (Finland CSO) may manually create an emergency order which will ship
immediately and arrive two days later to Finland by airplane. Naturally, this is more
expensive for Xerox but the procedure is used on occasion to satisfy the needs of cru-
cial customers.
3.2 Order escalation
If the size of the supplies order is significantly larger than the system suggests it to be,
the service agent is instructed to negotiate the order with the customer. The FSMA
agreement allows the customer to order 30 days’ worth of supplies in one service
transaction, and this rule is enforced rigidly as it is the Xerox Europe standard. If the
customer is still not satisfied with the size of the order after the initial negotiation, the
service agent then enters it into the system as the customer ordered. The system then
recognizes the transaction and escalates it to the Finnish CSO. The team consists of
one person in Finland, who in addition to their other duties is responsible for clearing
up the backlog of these exceptionally large supply orders.

17
The backlog is cleared by making decisions based on the order size, historical data
and/or contacting the customer again via email or telephone. This is called the order
escalation process. The in-country escalation process often lengthens the order deliv-
ery process by a couple of days, as roughly 30-40 orders are manually released
through the escalation process daily.
There are no exact guidelines as to how much each order can be reduced from the
Finnish side and making the decisions on a case by case basis requires an exceptional
amount of time. In addition to this, escalation reduction percentages are monitored
from the consumables team leader on a Xerox Europe level. As Xerox supplies have a
quite variable price range, both the percentage of reduced items and the value thereof
are closely monitored. Although the escalation process might not be considered opti-
mal in terms of customer service level, it has been moderately successful in upholding
Xerox’s customer inventory management strategy.
3.3 Exception list
In terms of size and printing volume, Xerox’s largest customers often exceed the pa-
rameters of the ordering system when creating their weekly supplies orders. For those
customers, e.g. professional printing houses whose volume exceeds tens of thousands
of pages per week, there is an exception list which is manually operated and updated
by the Xerox Finland CSO staff. In order to achieve exception list status, the customer
must specifically request it via email, and the procedure must also be approved by the
Finnish CSO director. Managerial involvement is necessary for the process to continue
according to company protocol.
The exception list also applies when taking into consideration customers with more
than one piece of equipment in their location. The Xerox service agent in the Welcome
Centre has a tool called the multi-machine order (MMO), which takes into consideration
the amount of similar machines in accordance to their location and need of supplies.
However, the function of the ordering tool has by management been deemed too slow
to be used, as the registry of MMO’s is very large. This means that the customer phone
call would take up to five times as long when ordering for multiple machines, and most
of the time would be spent on waiting for the tool to load customer data. The resolution
in the past has been simply not to use the MMO-tool and rather enter a larger order

18
into the system, which then according to protocol has to be checked by Finland CSO.
This causes a time-consuming ripple effect which heavily employs the in-country staff.
3.4 Results of the qualitative research
The qualitative research for this thesis was carried out to supplement day-to-day opera-
tions by observing the employees and conducting empirical research. However, noting
the subjective nature of the study and the limited sample size, a statistical study was
added to support the results of the qualitative research.
The qualitative research answered some questions regarding the lack of uniformity in
order management. As Xerox has opted to use an exception list as its primary form of
accepting MMO orders, the company has inadvertently created an unsystematic ap-
proach to order management. As referred to in previous chapter, the exception list is
updated through a string of emails and subjective decisions by the customer service
agent and management. Often at times these decisions are researched by broaching
order history for the previous couple of periods, usually months or 45-day periods.
However, the exception list itself is not systematically updated or followed-up to ex-
clude customers that have for a reason or another decreased their performance over a
longer period of time, since there are no extra personnel resources to specifically moni-
tor performance on a regular basis. This need has been communicated to local man-
agement, but has not been followed through by the XE management.
Remote locations are a part of the problem in regards to keeping deliveries cost effi-
cient. As per Xerox’s current service focus, even the smallest deliveries are made di-
rectly to the customer site regardless of location. As Xerox has customer throughout
Finland, this becomes a concern particularly in Eastern and Northern Finland, where
distances between customers and logistics hubs are relatively long. As some of the
company’s largest individual clients are located in remote locations, they have been
included on the exception list, giving them the permission to order exceptionally large
quantities at once. However, this procedure is uncommon and requires more manual
effort to complete.

19
4 Supply chain cost analysis
The statistical analysis for this thesis was conducted by acquiring supplies delivery
data from Xerox and deducing the optimal manner to proceed based on the given in-
formation. In order to accurately describe the efficiency of deliveries, several different
metrics and calculations were considered before arriving to the correct conclusion. The
data consists of delivery-specific data from the reference documents in Xerox’s SAP-
system. The key information for the purposes of analysis is amount of goods delivered,
amount of deliveries, total value of deliveries as well as number of individual custom-
ers. The monetary values of the deliveries have been changed to retain anonymity, but
the relevant ratios and order sizes remain unaltered.
The total costs of supplies as well as the delivery costs are decent indicators, but they
may often not accurately describe the efficiency and viability of the business model.
Instead, in this situation it might be more beneficial to view the difference the amount of
deliveries made and the number of supplies delivered. Due to Xerox’s high focus in
service and individual deliveries, the average order consists of e.g. one cartridge of
toner per delivery address per week.
The formula to find the most efficient customers for deliveries consists of two parts. To
first indicate the relationship between deliveries made and products delivered, the fol-
lowing calculation should be made:
Figure 3: Delivery efficiency ratio calculation
In order to be optimally efficient, the outcome of the initial calculation should be as
large a number as possible. After forming this basic equation, it is beneficial to further
tweak the efficiency ratio to highlight success in optimizing delivery sizes. Therefore, it
was necessary to create a relative percentage index for products delivered by dividing
the delivery efficiency ratio by the total number of deliveries. The created relative deliv-
ery efficiency ratio indicates how many per cent of total deliveries were delivered per
individual delivery.
Delivery efficiency ratio = products delivered
number of deliveries

20
Figure 4: Relative delivery efficiency ratio calculation
The relative delivery efficiency ratio negates the tendency of the standard delivery effi-
ciency ratio to skew towards delivery size. The prior ratio may undeservingly indicate
delivery success for certain customers simply due to high volumes, leaving room for
error. However, when observed with the assistance of a further developed formula the
actual efficiency of the deliveries may be discovered independent of volume.
4.1 Xerox customer type introduction
In order to describe Xerox’s customer base and its service needs, it is best to divide
customer into certain categories based on their business needs and other relevant fac-
tors. For the purpose of illustration three basic types of Xerox customers will be dis-
cussed. Most of Xerox’s customers that received supplies during the study period fall
under one of these three categories:
Customer A: Corporate Office Customer
Customer B: Governmental Agency
Customer C: Printing Industry Customer
Customer A, an average corporate office customer, is located in one of the main cen-
tres of inhabitation in Finland – Helsinki metropolitan region, Tampere, Turku or Oulu –,
thus having a suitable location for deliveries as Xerox’s logistics partners have regional
distribution centres on a short radius from the customer site. This suits Xerox’s service
philosophy well, as replenishment orders may be delivered on a consistent basis due to
the proximity of the distribution centre. Most corporate customers have several Xerox
equipment units in their facilities, often of the same model so that similar supplies may
be used for all of the machines.
Relative delivery efficiency ratio = delivery efficiency ratio
number of deliveries

21
The average governmental customer is more difficult to define than the average corpo-
rate customer. Most of Xerox’s governmental customers are public service providers
such as schools, different agencies, libraries or hospitals. The locations of these cus-
tomers are fairly evenly spread throughout Finland, so the delivery needs of these cus-
tomers are quite varied. As mentioned earlier, some customers may be located in very
remote locations in e.g. Northern Lapland or in Eastern Finland, leading to longer indi-
vidual deliveries irrespective of the value of the delivery.
Customer B is a considerably large hospital located in a middle-sized city in Finland.
The customer’s demand for supplies could be characterized as stable, as the nature of
the printing needs is very routine-like. However, this does not reflect in the ordering
cycles as one would expect.
The average printing industry customer is located in a middle-to-large sized city in Fin-
land in relative proximity to a Xerox regional distribution centre. Volumes tend to be
larger than average and the demand is sometimes erratic. Urgent, large supply orders
may sometimes come up on a short notice, putting a strain on Xerox’s delivery chain to
serve these customers. Simultaneously, printing industry customers also bring in the
largest percentage of revenue to Xerox of the three presented customer categories.
Printing industry customers are often the most educated about Xerox’s internal order-
ing processes, and are therefore able to demand a higher level of service. Therefore,
several printing houses make orders which are larger than the escalation quota pre-
sented in Chapter 3.2, causing more manual work for the Finnish in-country Xerox
team. This promotes relationships between the two parties as service is more personal,
but also creates a slower ordering process.
Customer C is a middle-sized printing industry customer in a large Finnish city. The
customer has a relatively small amount of individual machines, but print volumes per
machine are extremely high. Therefore, a steady stream of supplies must be available
at all times. To insure this, Customer C has negotiated an agreement to be featured in
Xerox’s exception list, as presented in Chapter 3.3. This enables the customer to cre-
ate larger individual orders to ensure production isn’t compromised due to ordering
processes and the unavailability of supplies.

22
710
381
215
155
82663826171817 9 8 9 4 7 6 2 3 6 7 3 1 2 1 1 1 2 2 3 2 1 1 1 1 1 2 1
0
100
200
300
400
500
600
700
800
1 2 3 4 5 6 7 8 9
10
11
12
13
14
15
16
17
18
19
20
21
23
24
25
26
28
30
31
34
35
36
37
38
41
43
44
47
64
Nu
mb
er
of
Deli
ve
rie
s
Supplies Delivered per Delivery
4.2 Order delivery cost analysis
In reference to Table 2 and the figures provided by Xerox Oy as detailed in Chapter
1.1, the sample size of the statistical analysis was 1 813 customers making 5 494 or-
ders, thus delivering a total of 6 476 supplies. The average customer’s monthly de-
mand was 3,57 units, which were delivered in an average 3,03 deliveries. Therefore,
the average delivery efficiency ratio was 1,18 and the average relative delivery efficien-
cy ratio 33,00%.
The average delivery efficiency ratio is very high, because roughly 60 per cent (1 141)
of Xerox’s customers ordered only one or two supply units within the study period, as
visible in Figure 5. This is caused by the nature of the average Xerox customer, as
most customers have low-to-medium printing needs and do not have an outlying need
to constantly order new printer supplies.
Figure 5: Xerox supplies delivered per delivery

23
Table 1: Xerox Oy customer example delivery efficiency ratios, September 2012
Within the study period, Customer A has ordered 15 supply units for the total value of
518,34€. Due to the order automated order cycles, the 15 units were delivered in 10
deliveries. Using the formulas in the beginning of Chapter 4, the delivery efficiency ratio
of Customer A is 1,5 and the relative delivery efficiency ratio is 10.00%.
As a result of Xerox’s service focus and simultaneous minimization of customer inven-
tory, Customer A has a very low relative delivery efficiency ratio. As discussed earlier,
this focus on customer inventory further causes an inordinate amount of individual de-
liveries, which are invoiced per delivery.
Customer B has diligently followed Xerox’s service policy by placing an order each time
a Xerox machine requests one. Although the customer has operations in several build-
ings at their service area, 34 deliveries in 22 monthly working days is a high amount.
The relevant ratios also indicate this, recording values significantly beneath Xerox cus-
tomer averages.
Taking into consideration the nature of the demand, Customer B’s inefficiency issues
might be solved by restructuring their order delivery schedule. Instead of delivering
twice a day, it might be possible to combine deliveries to reduce the amount of traffic
into the service location. However, due to the limitations of the Xerox order manage-
ment software, it is currently not possible to automatically combine orders. Xerox’s lo-
gistics partner DSV might be able to reduce the amount of deliveries by combining or-
Customer Total Value # of
Deliveries
Products
Delivered
Delivery
Efficiency
Ratio
Relative
Delivery
Ratio
Value per
relative
delivery
Customer A 518,34 € 10 15 1,50 10,00 % 51,83 €
Customer B 598,83 € 34 41 1,21 2,94 % 17,61 €
Customer C 738,71 € 8 34 4,25 12,50 % 92,34 €
Xerox Average 66,57 € 3,03 3,57 1,18 33,00 % 21,97 €
Xerox Total (1813) 120 684,46 € 5494 6476

24
ders. However, as they invoice for each individual delivery, it is less profitable for them
to do so under the current terms of the agreement between Xerox and DSV.
Customer C has found a balance between a feasible operative inventory for Xerox and
the business needs of the printing customer. As a result of the exception list status,
Customer C has a higher than average order size and efficiency ratio. While the deliv-
ery efficiency ratio is very high, it is due to be noted that this result requires additional
effort from the Xerox staff to ensure efficiency, making these delivery levels unobtaina-
ble for most of the customers.
However, the three mentioned customer profiles are quite varied and are chosen not to
depict the majority of Xerox customers, whose order size deviation is represented in
Figure 5. As shown in Table 1, the average Xerox customer accumulates a much lower
amount of orders and deliveries per month, while maintaining high delivery ratios. This
result further reinforces the hypothesis that while the Xerox service and SAP-based
order management system as replicated in Appendix 1 is effective, it lacks the ability to
account for large customer accounts such as customers A, B and C.
While order related costs and statistics are the key to optimizing order sizes, it is also
important to mention the logistics related costs created by DSV Solutions Oy. Carrying
cost of inventory, as discussed in Chapter 2.3, is a valuable metric to distinguish the
warehouse activity efficiency of Xerox. The data for the warehouse cost analysis was
extracted from DSV’s invoicing to Xerox during the month of September 2012. The
invoices were analysed, compiled and summarised into Table 2. In reference to the
scope of the thesis, all invoicing related to Xerox activities outside of office equipment
supplies was left unconsidered.
Table 2: Xerox Oy Carrying Cost of inventory, September 2012
Capital Cost Fixed costs Handling Transportation Holding Cost%
120 684,46 € 697,13 € 9 991,88 € 31 757,93 € 8,86%

25
As mentioned in Chapter 2.3, the average holding cost of American companies is
around 30 per cent of the capital cost. In the case of Xerox the holding cost, which in
this case is caused by handling plus fixed costs, is considerably lower as the capital
cost of inventory is very high. However, partially due to the low relative delivery ratios
of Xerox customers, the transportation costs of supplies are as high as 26,2% (trans-
portation cost divided by capital cost) of capital cost. Especially considering the amount
of deliveries with a less than optimal amount of supplies, particularly in the case of
Customer B, the total invoiced amount of transportation costs may be reduced by opti-
mization.
4.3 Performance analysis of Xerox order management
The balanced scorecard is an effective tool for compiling data of different aspects of an
organization and analysing it from several viewpoints. The balanced scorecard in its
original form was introduced by Robert Kaplan and David Norton of the Harvard Busi-
ness Review in 1992, the purpose being to measure the objectives and targets of a
company and creates a holistic business analysis, mostly from an organizational
standpoint (Johnston & Clark 2008: 362). The tool is useful in measuring and illustrat-
ing operational performance, and its ideals will be adapted to further demonstrate the
case of Xerox order management.
The adapted balanced scorecard for measuring performance, as referred to in Figure
6, has four primary measure indicators: financial, external, operational and develop-
ment. Financial performance measures may include traditional indicators such as total
cost, relative costs per customer, revenue or relevant operational costs. External
measures are mostly intangible values that may be measured qualitatively, such as
customer retention and satisfaction, service levels, customer feedback or corporate
image. On the other hand, operational measures indicate performance in physical ac-
tivities such as lead time, personnel availability, on-time deliveries and other similar
service-related metrics as discussed in Chapter 2.5. Finally, development metrics
measure the involvement of personnel and management to improve and implement
internal processes, measuring factors such as improvement suggestions, implemented
plans and process innovation (Johnston & Clark 2008: 360-363).

26
The most relevant financial measures to note for Xerox’s order delivery performance
measurement are cost per customer and cost per delivery. These metrics are available
through adding together all elements of the carrying cost of inventory from Table 2 and
dividing them respectively with the amount of customers and deliveries, as referred to
in Table 1. However, these indicative costs only depict the value added by external
partners such as DSV, and do not account for the activities of the Xerox CSO team.
Regardless, it is relevant to see the data from a decision-making standpoint.
Figure 6: The adapted balanced scorecard (adapted from Kaplan & Norton, 1992 in Johnston &
Clark, 2008: 361)

27
Applicable external measures for Xerox’s ordering process are customer satisfaction,
feedback and service levels. For their largest accounts, Xerox has been tracking cus-
tomer satisfaction statistics through relationship surveys conducted on a biannual ba-
sis. In addition to the surveys, the company also has a web service available for feed-
back regarding the Xerox Welcome Centre service agents. These ratings are tallied on
a quarterly basis to monitor service performance and customer satisfaction (Xerox
Global Citizenship 2011). These externally provided service metrics are supplemented
with operationally measurable statistics such as lead time and delivery timeliness. The
statistics are tracked in the Xerox SAP-system, where each delivery is assigned a quo-
ta to reach. Furthermore, internal development measurements are tracked with annual
staff satisfaction surveys. The collected data is then analysed by the Xerox Oy human
resources team before presenting the results to management.
In order to fully embrace the performance-driven measures model, certain targets must
be set against which to measure the performance. Similar to ROP’s and all other oper-
ative standards, these targets are handed to Xerox by the European corporate man-
agement team. The analysis results required for the balanced scorecard may be found
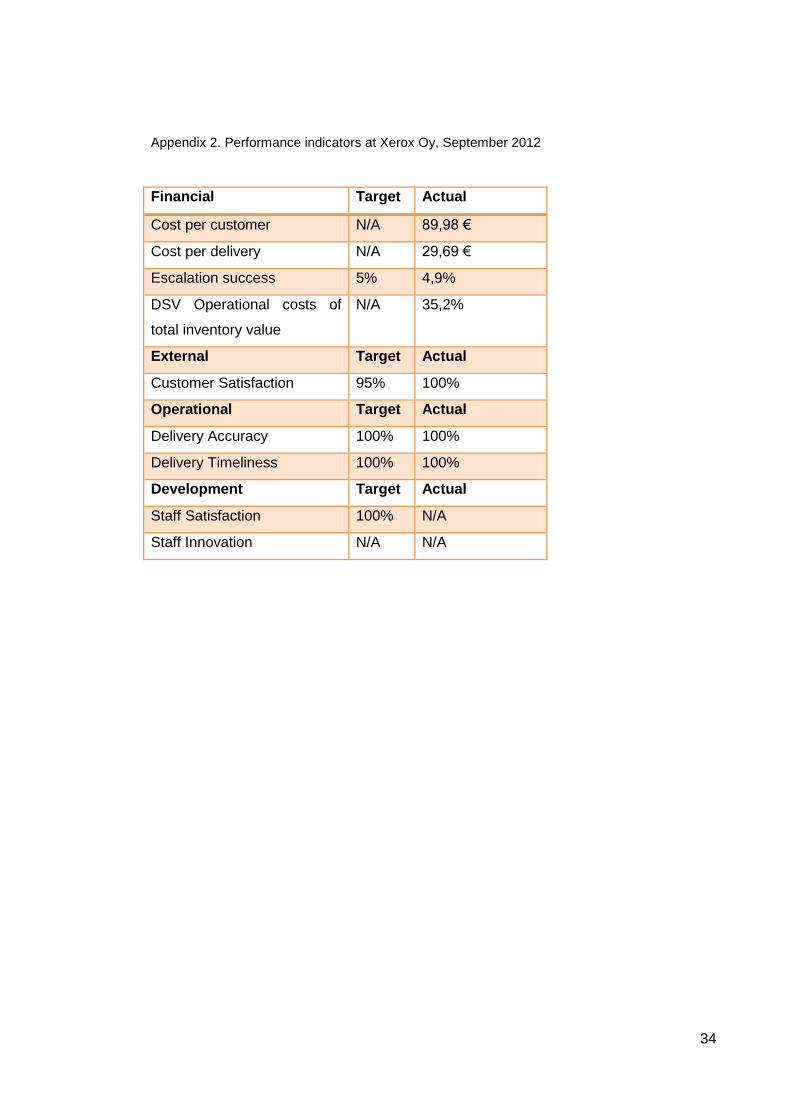
in Appendix 2, where the targets were provided by Xerox when available.
As evidenced by the balanced scorecard in Appendix 2, the company isn’t currently
tracking all the metrics presented in the study, particularly the financial measures. This
could be developed by assigning lower target values to service costs and estimate
when the actual values reached would gradually match the newly provided targets.
However, this would require a different approach to the timing of order deliveries, po-
tentially affecting activities measured by operational metrics which have been particu-
larly efficient within the study period.
Furthermore, as demonstrated with the value chain in Chapter 2.1, the linkages be-
tween the different parts of the operation are instrumental to surveying the entire pro-
cess. The same goes for performance management, in which demonstrating linkages
between measures supports making quality decisions and strengthening the strategy
(Johnston & Clark 2008: 366). For instance, the high figures in customer satisfaction
may be interpreted as a direct result of high quality performance in operational
measures as well as the high relative financial values.

28
Conversely, high figures in escalation success may have a negative effect on staff sat-
isfaction, as an extra amount of effort is required to keep supplies costs low – which in
turn would affect the financial measures.
Operational measures such as lead time and on-time delivery have had a positive ef-
fect on customer satisfaction. Simultaneously the operational costs such as handling,
distribution and warehousing are relatively high proportionate to the total inventory val-
ue. This could also be linked to the availability of staff or processes to coordinate the
orders. The aforementioned linkages have definitely had an effect on the performance
and financial viability of the current Xerox order delivery chain, but as previously indi-
cated it has not been properly researched up to this point. While Xerox has several
viable performance indicators prepared, as demonstrated in Appendix 2, the company
has yet to effectively insert the intangible measures into the fold. In addition, Xerox
could attempt to survey its employees more frequently on innovation in service deliv-
ery, as this might further add to the practical application of the order delivery process.

29
5 Conclusion
Inventory management is an art of allocating resources within the supply chain to cre-
ate value for the other facets of the chain. The application of inventory management is
very industry and business specific, as it is not possible to simply possess an inventory
without a specific plan how to manage it and for what purposes. The cost of an invento-
ry is an obvious performance indicator, but it is of utmost importance to recognize the
nature of business in order to fully define what inventory is for the company.
One of the most important parts of quality customer service operations is to achieve a
sustainable level of consistency (Johnston & Clark 2008: 218). For this very reason, the
current operating model of upholding separate, subjectively upheld order management
methods is unsustainable. Xerox Oy faces decisions that require a more holistic valua-
tion of the service business and its strategy. At this time it is not plausible to fix individ-
ual facets of the company’s operations, because the effects will ripple into other parts
of the organization, and it is up to management to make executive decisions on the
importance of each task.
Upon further review of the case study at hand, much of Xerox’s inefficiency issues in
regards to order delivery management have to do with the company’s internal ordering
processes regarding high-volume customers. Due to the order volumes that the com-
pany faces on a periodical basis, it is not feasible to provide optimized service for each
customer to the degree that the amount of individual deliveries might be drastically re-
duced. Furthermore, as 60 per cent of customers only ordered two units or fewer within
the period, it is not feasible to artificially increase efficiency by grouping orders together
from a longer time period for those customers.
However, for customers that are experiencing the inefficiency of the current order de-
livery system the compounded benefit of improving the process is considerable. In the
case of Customer B and its several likenesses, the singular amount of orders made via
telephone to the Xerox Welcome Centre is far from desirable. When approaching the
system from the customer’s point of view, it is most definitively revealed that some level
of optimization is required.

30
As argued in Chapter 2.2, it is clear that companies have different requirements when it
comes to inventory management. In these customer cases presented in chapter 4.2,
Customer C has the most need for keeping constant stock available as their business
is dependent on keeping a work-in-progress buffer inventory available. In all cases,
most of the issues with profitability stemmed from poor delivery efficiency ratios, as far
too few products were delivered per delivery in order for the transportation to remain
viable.
One main problem that Xerox needs to solve in its customer inventory management
process is its relationship with logistics service provider DSV and their involvement in
the value chain process. Due to Xerox’s commitment to customer service levels, the
company promises its customers a maximum three-day lead time for supplies deliver-
ies. This causes an increase to the total cost of ownership of the value chain, as it is
not the responsibility of DSV to make decisions on deliveries on behalf of Xerox and
their service requirements.
However, if DSV were in some cases to be given one-to-two additional days to organ-
ize an individually larger delivery, the relative price per product delivered would de-
crease. Consequently, this would require sacrifices in service, which is one of Xerox’s
differentiation points. The service loss would amount to a longer lead time for the cus-
tomer upon making the supplies order, but their benefit would then be receiving more
supplies per each individual delivery. From the viewpoint of the Xerox service philoso-
phy, it is a decision that warrants consideration.

31
6 References
Coyle, J.J., Bardi, E.J., Langley Jr, C.J. 2003: The Management of Business Logistics
– A Supply Chain Perspective.. 7th Edition. Mason, Ohio, South-Western.
Christopher, Martin. 2005. Logistics And Supply Chain Management: Creating Value-
Adding Networks. 3rd Edition. Harlow, United Kingdom. Pearson Education.
Grant, D.B., 2012. Logistics Management. London, United Kingdom. Pearson Educa-
tion.
Johnston, R., Clark, G., 2008. Service Operations Management . Improving Service
Delivery. 3rd Edition. Harlow, United Kingdom. FT Prentice Hall.
Leenders, M.R., Johnson, P.F., Flynn, A.E., Fearon, H.E., 2006. Purchasing and Sup-
ply Management – With 50 Supply Chain Cases. 13th International Edition. Singapore.
McGraw-Hill.
Lynch, C.F. 2002. Strategic alliances and partnerships in logistics. Bradford, United
Kingdom. Emerald Group Publishing Ltd
Magretta, J..2012. Understanding Michael Porter: The Essential Guide to Competition
and Strategy. Boston, MA. Harvard Business Review Press.
Russell, R.S., Taylor III, B.W., 2006. Operations Management – Quality and Competi-
tiveness in a Global Environment. 5th Edition. Hoboken, NJ. John Wiley & Sons.
Shridhara, B.K. 2009. Materials Management. Mumbai, India. Himalaya Publishing
House.
Skjøtt-Larsen, T., Schary, P.B., Mikkola, J. H. 2007. Managing the Global Supply
Chain. Copenhagen, Denmark. Copenhagen Business School Press.

32
European Publishers Council. 2013. Global Media Trends. http://www.ip-
watch.org/weblog/wp-content/uploads/2012/09/EPC_ExecSum_press.pdf Available
online, last accessed 3.4.2013.
Xerox Corporation, 2012. Xerox Fact Sheet: Who We Are Today.
http://www.xerox.com/downloads/usa/en/x/Xerox_Fact_Sheet_Who_We_Are_Today.p
df Online, last accessed 30.11.2012
Xerox Corporation, 2011. Xerox 2011 Report on Global Citizenship.
http://www.xerox.com/corporate-citizenship/2011/customer-experience/customer-
satisfaction.html Online, last accessed 8.4.2013.
Xerox Corporation, 2013. Xerox History Timeline. http://www.xerox.com/about-
xerox/company-history/fifi.html Online, last accessed 30.3.2013

33
Appendix 1. Xerox Order Management Flow Chart
34
Appendix 2. Performance indicators at Xerox Oy, September 2012
Financial Target Actual
Cost per customer N/A 89,98 €
Cost per delivery N/A 29,69 €
Escalation success 5% 4,9%
DSV Operational costs of
total inventory value
N/A 35,2%
External Target Actual
Customer Satisfaction 95% 100%
Operational Target Actual
Delivery Accuracy 100% 100%
Delivery Timeliness 100% 100%
Development Target Actual
Staff Satisfaction 100% N/A
Staff Innovation N/A N/A
Related Documents


