Order Cancelations across Investor Groups: Evidence from an Emerging Order-Driven Market Chaoshin Chiao Department of Finance National Dong Hwa University Hualien, Taiwan Zi-Mei Wang† Department of Finance Ming Chuan University Taipei, Taiwan Shiau-Yuan Tong Department of Finance Ming Chuan University Taipei, Taiwan This Draft: January 22, 2014 † Corresponding author. Tel.: 886-228824564. Ext. 2834; Email: [email protected]

Welcome message from author
This document is posted to help you gain knowledge. Please leave a comment to let me know what you think about it! Share it to your friends and learn new things together.
Transcript

Order Cancelations across Investor Groups:
Evidence from an Emerging Order-Driven Market
Chaoshin Chiao
Department of Finance
National Dong Hwa University
Hualien, Taiwan
Zi-Mei Wang†
Department of Finance
Ming Chuan University
Taipei, Taiwan
Shiau-Yuan Tong
Department of Finance
Ming Chuan University
Taipei, Taiwan
This Draft: January 22, 2014
† Corresponding author. Tel.: 886-228824564. Ext. 2834; Email: [email protected]
ii
Order Cancelations across Investor Groups:
Evidence from an Emerging Order-Driven Market
Abstract
Employing comprehensive limit-order data that unambiguously identify investor
groups, this paper examines the order-cancelation behavior across investor groups in
the Taiwan Stock Exchange. Evidence shows that, first, facing trade-offs between the
monitoring cost and limit-order risks, such as non-execution and free-trade-option
risks, differences exist across investor groups. Foreign investors closely monitoring
the market cancel their limit orders most actively, while individual investors with the
highest monitoring cost do so least actively. Second, during the worst year of the
global financial tsunami, 2008, the levels of order cancelations and their sensitivities
to the limit-order risks, particularly by institutional investors, significantly rose.
Keywords: non-execution risk, free-trade-option risk, monitoring cost, order
cancelations

1
1. Introduction
The purpose of this paper is twofold. First, it studies the activity of order cancelations
and their determinants in the Taiwan Stock Exchange (TSE), a pure order-driven market.
Employing order-level data, this paper, different from prior studies, distinguishes itself by
emphasizing behavior differences across investor groups, including foreign investors,
domestic institutions, and individual investors. Second, this paper analyzes the
order-cancelation dynamics during a sample period from 2007 to 2008, known as the years of
the global financial tsunami.1
In a pure order-driven market without interference from market makers, traders who
submit, revise, and cancel limit orders act directly as liquidity providers. Even in a hybrid
market like the NYSE, limit orders accounting for more than half of trading activities still
serve as an essential source of liquidity (Chakrabarty et al., 2006). Chung et al. (1999)
observe that in the NYSE about 75% of all quotes have at least one side of the quotes posted
by limit orders. Given the crucial role of limit orders, numerous studies have investigated the
relevant issues on intraday liquidity, but most of them (e.g., Lee et al., 2004; Ranaldo, 2004;
Menkhoff et al., 2010) focus on order submission behavior. It was not until recently that
researchers began to pay attention to the role of order cancelations and revisions in liquidity
provision. For example, Ellul et al. (2007) and Yeo (2005) observe that in the NYSE more
than one-third of limit orders are canceled. Hasbrouck and Saar (2009) state that 93% of limit
orders submitted through NASDAQ INET are canceled, and 36.69% of those are fleeting
orders canceled within two seconds after submission in their exploration of latent liquidity.
Foster and Liu (2008) and Coppejans and Domowitz (2002) find that traders frequently
cancel limit orders in derivative markets as well.
The placement of a (non-marketable) limit buy (sell) order, offering other traders an
opportunity to sell (buy) shares at a pre-specified price, is equivalent to writing a free put
(call) option to the market (Copeland and Galai, 1983).2 The exercise price of the put (call) is
equal to the limit buy (sell) price. Adverse price changes may stale the limit order and make
the associated free-trade option (FTO) in-the-money. The uncertainty that the stale order is
picked off by informed traders is called the FTO risk. On the other hand, when the prevailing
1 For more descriptions about the global financial tsunami and its impacts on investor behavior, please see
Shefrin and Statman (2011) and Barberis (2011).
2 For the definitions of marketable and non-marketable limit orders, please see Sections 5.1.1 and 5.1.2.
2
bid-ask midpoint moves away from the limit price, executions become less possible. The
opportunity cost of an unfilled limit order is recognized as the non-execution (NE) risk.
Responding to possible variations in the FTO and the NE risks, traders can either
price-protect themselves by submitting limit orders at prices far from the best quotes, or
closely monitor the market and cancel/revise their stale limit orders, if necessary (Liu, 2009;
Hollifield et al. 2004; Goldstein and Kavajecz, 2000; Foucault, 1999).3 For example,
NASDAQ dealers do the latter, when facing professional day traders who closely monitor the
market and pick off stale quotes posted by dealers who are slow to adjust (Foucault et al.,
2003). Although it is beneficial to actively monitor the market and cancel/revise stale limit
orders, since information randomly arrives, the behavior inevitably incurs a nontrivial cost:
the monitoring cost. Traders have to exert efforts to find news sources, to interpret
information, and to justify its accurateness. Therefore, the smaller the monitoring cost for
traders, other things being equal, the more likely they are to monitor the market and actively
cancel or revise their limit orders (Fong and Liu, 2010).4
Thanks to technological advancements (e.g., on-line trading systems and the Internet)
that effectively enhance information transmission and reduce the monitoring cost (Stoll, 2006;
Jain, 2005), order cancelations/revisions have substantially increased (Hasbrouck and Saar,
2009; Liu, 2009). Even given the advancements, however, the monitoring cost still exists and
varies across investor groups. For example, individual investors cannot constantly monitor
the market (Aitken et al., 2007). Especially for those who have dedicated daytime jobs in
non-securities-related industries, closely monitoring the market during trading hours is costly
and even jeopardizes their professional career.
Compared to individual investors, institutional investors tend to be full-time traders and
are considered informed (Chakravarty, 2001; Anand et al., 2005; Kaniel and Liu, 2006).
Institutional investors can effectively gather and interpret information by closely monitoring
the market. As news arrives, given their lower monitoring cost, their behavior is expected to
3 Hollifield et al. (2004) build a structural model of an order-driven market that captures the trade-offs among
the order price, the order execution probability, and the winner’s curse.
4 Aside for being an activity for traders managing their limit-order risks, order cancelations can possibly be
regarded as strategic behavior of traders engaging in price manipulation (Kuk et al., 2010; Eom, Lee and Park,
2013). Yeo (2005) posits that order cancelations may result from an undercutting strategy in which limit order
traders can undercut one another by improving the quotes. If successful, trades take place; if not, the traders may
cancel their orders and either engage in further undercutting by resubmitting these orders or leave the market.

3
be more responsive to market changes than individual investors’ (Lee et al., 1991; Menkhoff
et al., 2010).5 In this paper we study order submission across investor groups.
This paper contributes to the literature in the three ways. Firstly, our data
unambiguously classify each limit order into different investor groups. Taking advantage of
the data’s richness, we distinguish order cancelations across investor groups, including
foreign investors, domestic institutions, and individual investors along the following
dimensions. (1) How are their monitoring costs different? (2) How do the limit-order risks
separately affect their order cancelations? To our knowledge, this is the first study applying
such comprehensive order-level data to examine these issues across investor groups.
Secondly, over our sample period 2007-2008, the years of the global financial tsunami, this
paper illustrating the dynamics of order cancelations helps economists understand the impacts
of a financial crisis on the behavior across investor groups. Thirdly, we point out deficiencies
of the FTO and the NE risk measures initially developed by Liu and Sawyer (2003); then, we
propose a revision and show its empirical improvement by using our data.
Our conclusions on order cancelations across investor groups previously unexplored are
as follows. First, significant differences exist in response to the FTO and NE risks across
investor groups. The intraday pattern of order cancelations, along with the proportion of limit
orders submitted before the open, supports that individual investors have the highest
monitoring cost. Second, not only do foreign investors cancel their limit orders most
frequently, but their order cancelations are also the most sensitive to the FTO and the NE
risks, while individual investors cancel their limit orders least frequently. Third, the
sensitivities of order cancelations by foreign investors and domestic institutions to those risks
more than doubled from 2007 to 2008, as the financial crisis got worse.
The remainder of this paper proceeds as follows. Section 2 briefly describes the
institutional background of the TSE. Section 3 introduces the employed data and some
preliminary evidence. Section 4 develops several hypotheses capturing the detailed purposes
of this paper. We introduce the research design covering the employed variables and
methodology in Section 5. Section 6 reports the empirical results, verifies our hypotheses,
and discusses the implications. Finally, we conclude this paper in Section 7.
5 Aitken et al. (2007) suggest that active traders, such as institutional investors, expend resources in monitoring
the market and the status of their limit orders whereas passive traders do not. Hence, the FTO risk is relevant to
some institutional investors and to all individual investors.

4
2. Institutional background
All listed securities on the TSE are traded by auto-matching via a Fully Automated
Securities Trading (FAST) system. It is centralized and order-driven, and its trading
mechanism is similar to the electronic limit-order system in Hong Kong (e.g., Ahn, Bae and
Chan, 2001), except that the FAST is purely a call market system. Trading operates from 9:00
am to 1:30 pm, Monday through Friday. There are no designated market makers and liquidity
is provided by limit order traders. Orders can be keyed in 30 minutes prior to the open during
which neither submitted orders are executed nor information regarding the limit order book is
disseminated. After the open, information (including the best five bid and ask prices, and the
number of shares demanded or offered at each of these five prices) is disseminated to the
public on a real-time basis.
All orders must be priced at submission. Neither market nor hidden orders are allowed.
Trades periodically take place for each stock about every 15 seconds. Limit orders are
prioritized first by price and then by submission time. The execution price, determined by a
single-price auction, is the one maximizing trading volume. Unfilled orders automatically
expire at the end of each trading day.
Note that the FAST, unlike most systems worldwide, does not directly execute order
revisions. Instead, it responds to an order revision by sequentially executing, first, an order
cancelation and, then, an order resubmission at the revised price and quantity. Afterwards, the
FAST generates two separate records. Since the data do not contain valid cross-reference
numbers between order cancelations and resubmissions for us to exactly identify order
revisions, we study only order cancelations in this paper.
3. Data and preliminary evidence
3.1 The data and sample
This paper employs the Order and Quote Files, compiled by the TSE, from 1/2007 to
12/2008, for a total of 496 trading days. The data contain the intraday information on all
submitted limit orders and quotes. The quote data, illustrating the dynamics of the limit order
book for each stock, contain the time stamp as well as bid (ask) information at 15-second
intervals, including the number of shares waiting to execute at the best bid (ask) and at each

5
of the four consecutive lower (higher) ticks. For each order, the order data include the time
stamp (to the nearest one hundredth of a second), stock code, a buy-sell indicator, order size,
limit price, and investor type.
The investor type classifies each limit order into one of five groups: foreign investors,
mutual funds, securities dealers, individual investors, and corporate institutions. Mutual funds
are solely composed of domestic mutual fund firms, while foreign investors cover a wide
variety of foreign institutions, including foreign (investment) banks, insurance companies,
mutual funds, pension funds, and so on. Corporate institutions consist of all domestic
institutions other than mutual funds and securities dealers. For brevity, we aggregate mutual
funds, securities dealers, and corporate institutions into one group of domestic institutions.
In most of the following discussions, we use data over 15-minute intervals for each
stock over each trading day from 9:00 am to 1:30 pm, totaling eighteen successive 15-minute
intervals. The selected sample consists of the largest 50% of common stocks, for a total of
375 firms, based on the daily average market capitalization over the sample period. The
concern over firm sizes is that some small-cap stocks are not even traded by institutional
investors, making it difficult to study their order cancelation behavior.
3.2 Preliminary evidence
Table 1 presents the summary statistics for the sample stocks. The quoted spread is the
difference between the best ask and bid at the market close, while the relative spread is the
quoted spread relative to the bid-ask midpoint. As indicated, the characteristics of the
selected stocks are widely spread. For example, the covered market capitalization ranges
from NT$3.74 billion to NT$1.586 trillion. Applying the bid-ask spread to measure liquidity,
the most liquid and illiquid stocks have relative spreads of 0.042% and 0.297%, respectively.
Stock prices and trading volumes demonstrate large swings as well.
Figure 1 chronologically plots the cancelation ratios, in volume and in the number of
canceled orders, over the sample period. Note that, no matter which measure we apply, both
the mean and the volatility of the cancelation ratio increase, starting from the second half of
2007, which is about when the financial tsunami erupted. According to the annual reports
published by the TSE (http://www.twse.com.tw/en/statistics/statistics.php?tm=07), in 2008
the Taiwan composite stock index fell by 46%, while the average daily turnover fell by 15%,
suggesting that a contagion of fear discouraged trading activities. If a trader still insisted on

6
trading during the financial tsunami period, he was likely to be extra cautious about the risks
and tended to monitor the market closely and frequently canceled his orders.
Market capitalization and investment preferences could jointly matter for the monitoring
cost and limit-order risks. Large-cap firms with high levels of transparency are often
frequently traded, lowering the monitoring cost for traders (Liu, 2009). Moreover, Hasbrouck
and Saar (2001) argue that the execution rates for limit orders increase with market
capitalization, so limit orders for large-cap firms have smaller NE risks. Since institutions
prefer large-cap stocks (Falenstein, 1996; Gompers and Metrick, 2001; Frieder and
Subrahmanyam, 2005),6 in the following we shall partition the full sample into two
sub-samples, large- and small-cap firms, based on the average daily market capitalization
over the sample period, to examine the order cancelations across investor groups.
Table 2 summarizing order submissions and cancelations across investor groups reports
the average daily numbers of submitted (canceled) orders by each investor group to the
numbers of all submitted (canceled) orders and their order sizes. In terms of submitted orders,
individual investors are clearly the dominating traders. For large-cap stocks, the daily
submitted orders by individual investors make up about 80% of orders, while for small-cap
stocks, their share even soars to more than 90%. Among institutional investors, foreign
investors overwhelm domestic institutions.
With regard to order cancelations across investor groups, the patterns are similar to those
of order submissions. First, individual investors still play a dominant role. For example, the
canceled buy orders for large-cap stocks by individual investors make up 74. 6% of total
canceled buy orders, while those by foreign investors (domestic institutions) make up 22.6%
(2.8%). For small-cap stocks, the ratio for individual investors is even higher and reaches up
to 89.6%. Despite the dominant roles of individual investors shown above, foreign investors
proportionally cancel their own orders more than others do. For example, for large-cap stocks,
the proportion of buy order cancelations by foreign investors (0.226) is larger than that of
their buy order submissions (0.161). This inequality does not hold for other investor groups.
After realizing a preliminary picture of the relative tendency of order cancelations
among the three investor groups over the entire sample period, Figure 2 separately draws
their order cancelation ratios. The ratio for a given investor group over a trading day is
6 In fact, our results in Table 2 support this traditional wisdom. For example, the buy order volumes in 1000
shares for large- and small-cap stocks by foreign investors (domestics institutions) are respectively 13.524 and
7.504 (27.465 and 19.143), while those by individual investors are respectively 6.441 and 6.940.

7
defined as the number of canceled orders divided by the number of submitted orders by the
same group. Again, it is apparent that, regardless of market capitalization, the cancelation
ratios by foreign investors and domestic institutions are higher than those by individual
investors. Moreover, institutional investors canceled their limit orders more frequently in
2008 than in 2007, but the inequality for individual investors is not as evident.
Additional notable evidence drawn in Figure 3 is the intraday U-shaped patterns of order
cancelations are, regardless of investor groups, consistent with Liu (2009) and Fong and Liu
(2010). Since overnight information uncertainty is plausibly high at the open (Madhavan and
Panchapagesan, 2000; Madhavan, 1992),7 both FTO and NE risks immediately after the open
are expected to be high. Traders are prone to closely monitor the market and cancel their
orders, if necessary, to prevent their orders from being unfilled or picked off by informed
traders. Afterwards, information uncertainty is gradually resolved and order cancelations fall.
When the market is about to close, some traders who have unfilled limit orders may be
under pressure to trade immediately. For example, day traders usually do not hold open
positions overnight. If worried that previously submitted orders cannot close positions before
the close, they tend to revise their orders to raise the price priorities and the likelihood of
execution even at originally unfavorable prices.
4. Hypotheses
The preliminary evidence above shows that the overall tendencies to cancel limit orders
among the three investor groups over the sample period of 2007 and 2008. From now on, we
shall examine the effects of the monitoring costs and the limit-order risks on their order
cancelations, and, more importantly, the behavior differences. Furthermore, we pay attention
to the impacts of the global financial tsunami on order cancelations across them. Next, we
propose several hypotheses to stepwise highlight the purposes of this paper.
4.1 Monitoring costs
Confronting potential changes in the FTO and the NE risks, limit-order traders typically
have two choices. They can either (1) price-protect themselves by submitting limit orders at
7 According to Brockman and Chung (1999), trading activities are more intense right after the open and before
the close, leading to a U-shaped intraday pattern in price volatility.

8
prices far from the best quotes at the cost of a higher NE risk, or (2) closely monitor the
market and swiftly cancel/revise their limit orders, if necessary. The first choice is often
adopted by patient limit order traders who concern more about the FTO risk than about the
NE risk, while the second one is adopted when traders have a low monitoring cost; otherwise,
the first choice is relatively feasible (Hollifield et al. 2004; Fong and Liu, 2010). The traders
with a high monitoring cost usually place unaggressive limit orders to represent their interests
when they are unable or unwilling to continuously monitor the market (Harris, 1998). How
far the non-marketable limit price is from the prevailing midquote at submission, measured as
order aggressiveness, expectedly depends on the magnitude of the monitoring cost for the
traders, implying that order aggressiveness closely relates to the traders’ monitoring costs.
Fong and Liu (2010) observe a negative relation between order revisions/cancelations
and order aggressiveness at submission. If traders’ monitoring cost is low, they reasonably
cancel their unfilled limit orders more often than aggressive orders after submission. It is
because the less aggressive the limit order, the longer it takes to execute, the higher
uncertainty it encounters.
Different from Fong and Liu (2010), in this paper we additionally consider a scenario in
which traders’ monitoring cost is quite high and closely monitoring the market is not possible.
They then are likely to submit unaggressive limit orders rather far from the best quotes, and
part of them are not even able to cancel their orders. This scenario, if valid, implies that
cancelations of limit orders with rather low order aggressiveness do not happen often. Thus,
if sufficiently distinguishing limit orders with different order aggressiveness, the relation
between order cancelations and order aggressiveness may not be monotonically decreasing,
but inverted U-shaped.8 The following hypothesis explicitly tests this scenario’s implication.
Hypothesis 1: Order cancelations demonstrate an inverted U-shaped relation with respect to
order aggressiveness at submission.
After showing the importance of the monitoring cost, it is next of interest to compare the
costs among the three investor groups that possibly differ a lot. For instance, most individual
investors are neither full-time workers in securities-related industries nor available to
8 Fong and Liu (2010) separate non-marketable limit orders into “price improve”, “at quote”, and “outside
quote”, based on order aggressiveness, which may not be detailed enough to observe an inverted U-shaped
pattern.

9
constantly monitor the market. They plausibly have a higher monitoring cost. Putting together
the argument above, a testable hypothesis goes as follows:
Hypothesis 2a: Individual investors submit more non-marketable limit orders at prices
farther from the best quotes than institutional investors.
Other than order aggressiveness, another two kinds of behavior could reflect a high
monitoring cost for individual investors having daytime jobs. First, they tend to submit orders
before the open when not yet at work, because trading stocks is costly during working hours.
By contrast, institutional investors are unlikely to submit orders before the open as often as
individual traders do. This is because, as mentioned earlier, information about the limit order
book helping resolve high overnight information uncertainty is not dissimilated before the
open. Submitting pre-open orders is unnecessarily risky for traders who can closely monitor
the market afterwards. Second, a good time for individual investors to manage their unfilled
limit orders is after 12 pm, lunchtime, when they are temporarily free from work. Usually,
they go back to work by 1:30 pm, which is the time the market closes.
Hypothesis 2b: Individual investors submit more limit orders before the open than
institutional investors. After 12 pm, order cancelations by individual investors rise.
To explore more intraday behavior differences possibly related to the monitoring costs
across investor groups, let us consider their behavior of order submission or liquidity
provision during a trading day. Bloomfield et al. (2005) suggest that it depends on the value
of their private information. Informed traders take (provide) liquidity when the value of their
information is high (low). When trading begins, informed traders, with a low monitoring cost,
are more likely to demand liquidity than other traders, picking off stale orders to profit from
their private information. As prices move toward true values, the informed traders shift to
submitting limit orders and providing liquidity. Anand et al. (2005), Duong et al. (2009), and
Menkhoff et al. (2010) posit that, given high information uncertainty around the open,
informed (institutional) traders tend to demand liquidity earlier in a trading day while acting
as liquidity suppliers later in the day, while individual investors behave oppositely.
When demanding liquidity, traders submit marketable limit orders and expect immediate
executions of these orders; later on, they may not be able to change their mind and

10
cancel/revise the orders. Conversely, traders supplying liquidity submit non-marketable limit
orders at the cost of a smaller likelihood of execution and longer expected waiting time. The
less aggressive the limit orders, the longer they take to execute, the more likely the traders are
to monitor the market and cancel/revise their orders, if doing so is not too costly. A testable
hypothesis capturing the differences above is given as follow.
Hypothesis 3: Institutional investors cancel limit orders less frequently right after the open
and more frequently before the close.
4.2 Limit-order risks
As argued in the previous section, traders having different monitoring costs submit limit
orders with different levels of order aggressiveness to control their exposure to the FTO risk
in the first place. However, subsequent price dynamics could also alter the FTO risk,
inducing the traders to take further actions to manage the time-varying risk. Fong and Liu
(2010) state that, when closely monitoring the market, once adverse news hits, traders
possibly cancel their limit orders or revise them to reduce the likelihood of execution. The
limit prices of these orders are often closer to the prevailing best quotes or have higher price
priorities, implying that these orders bear a higher FTO risk before cancelation.
Regarding the strategies dealing with the NE risk, some traders may tend to cancel or
revise their limit orders with low price priorities and a high NE risk. For instance, Harris
(1998) suggests that traders under pressure could become impatient, particularly toward the
close of trading. When the prevailing best quotes trend away from the limit prices, they revise
their orders to raise the likelihood of execution. Taken together, the relation between order
cancelations and price priority at cancelation is expected to be U-shaped.
Hypothesis 4a: Order cancelations demonstrate a U-shaped relation with respect to order
price priority at cancelation.
Earlier evidence has shown that traders in different groups are likely to have different
monitoring costs, resulting in different order submission behavior and, thus, different
distributions of the FTO and NE risks. For instance, institutional (individual) investors,
having a lower (higher) monitoring cost, may submit more non-marketable limit orders

11
around (far from) the midquotes. Thus, they confront a higher FTO (NE) risk and cancel
more limit orders in the highest (lowest) price priority group.
Furthermore, the market capitalization of a stock, also changing the distributions of the
FTO and the NE risks that traders face, indirectly affect their order cancelation behavior for
the stock. For example, Aitken et al.(2007) and Duong et al. (2009) state that aggressive
institutional investors (e.g., hedge funds) actively monitor the trading activities of large-cap
stocks, which raises the possibility for limit orders to be picked off around the best quotes.
Conversely, the NE risk for small-cap stocks is more pronounced, because those stocks are
generally less liquid, indicating that their demand curves are steeper (Campbell, Grossman
and Wang, 1993). Once demand shocks hit and prices change substantially, the rising NE risk
encourages traders to revise their limit orders with low price priorities for those stocks.
Finally, the traditional wisdom (e.g., Kang and Stulz (1994), Gompers and Metrick (2001),
and Frieder and Subrahmanyam (2005)) suggests that institutional investors, particularly
foreign investors, prefer large-cap stocks. Taking into account the arguments above, we
expect that different investor groups with different investment preferences and monitoring
costs face different time-varying limit-order risks and, hence, exhibit different
order-cancelation behavior with respect to price priority at cancelation.
Hypothesis 4b: Foreign investors cancel more limit orders in the highest price priority group,
while individual investors do so in the lowest price priority group.
4.3 The sensitivities of order cancelations to the limit-order risks
Up to now, we have developed hypotheses that describe the behavior of order
cancelations across investor groups and emphasize their differences. In the following, we
sharpen the picture by applying multivariate regressions (to be introduced in the next section)
to jointly test the sensitivities of order cancelations across investor groups to the limit-order
risks in a more rigid manner. If the preceding hypotheses hold, we should expect that the
order cancelations by institutional investors are more sensitive to the limit-order risks than
those by individual investors. We propose a hypothesis as follows.
Hypothesis 5a: The sensitivities of order cancelations by institutional investors to the FTO
and the NE risks are higher than those by individual investors.
12
4.4 Impacts of the global financial tsunami on order cancelations
The year 2008, when the global financial tsunami peaked and turned the global economy
upside down (Shefrin and Statman, 2011),9 is plausibly an information-rich period. Recall
that Figure 2 shows that the cancelation ratio is higher during 2008. Rising uncertainty
reasonably made investors extra conservative during this crisis, as collapsing financial
institutions quickly spread out and economies worldwide suffered. Traders having unfilled
limit orders were faced with possibly increasing FTO and NE costs, relative to their
monitoring costs, encouraging them to monitor the market and cancel their orders, if
necessary.
Foreign investors, more familiar with changes in the global business environment, can
effectively incorporate such marketwide information into prices of related large and leading
listed firms with adequate liquidity (Chiao et al., 2010). We expect that order cancelations by
institutional investors will be even more sensitive to the limit-order risks than those by
individual investors during market turmoil. The development of the global financial tsunami
years, 2007 and 2008, provides an ideal opportunity to examine whether traders became extra
sensitive to the limit-order risks and accordingly changed their behavior on order cancelations.
The following hypothesis is proposed to test the difference.
Hypothesis 5b: The increments in the sensitivities of order cancelations by institutional
investors to the FTO and the NE risks from 2007 to 2008 are higher than those by individual
investors.
5 Measurement of variables and model specifications
5.1 Order aggressiveness at submission
Traders could submit orders at very different prices, trading off the probabilities of
execution with transaction costs. Measuring the distance between the limit price and a
benchmark price at submission (e.g., the best quotes), order aggressiveness captures traders’
eagerness for executions (Biais et al., 1995; Ranaldo, 2004; Griffiths et al., 2000). A
9 The S&P 500’s returns for the years 2006-2009 are respectively 15.8%, 5.5%, -37.0%, and 26.9%.

13
marketable limit order in a pure limit order book is equivalent to a market order in floor or
dealer markets (Hasbrouck and Saar, 2001).
5.1.1 Limit orders submitted after the open
The order aggressiveness of a limit buy and a limit sell after the open is defined as:
the order aggressiveness of buy order j for stock i = (Pi,j Pi,j,ask,s)/Pi,j,ask,s, (1) the order aggressiveness of sell order j for stock i = -(Pi,j Pi,j,bid,s)/Pi,j,bid,s,
where Pi,j is the limit price of order j for stock i and Pi,j,ask,s (Pi,j,bid,s), the benchmark price, is
the best ask (bid) price in the limit order book at submission. All orders are sorted into the
following five order aggressiveness groups: 0 ≤ order aggressiveness (group 5, the most
aggressive group), -0.5% ≤ order aggressiveness < 0%, -1% ≤ order aggressiveness < -0.5%,
-2% ≤ order aggressiveness < -1%, order aggressiveness < -2% (group 1, the least aggressive
group). Group 5 consists of marketable limit orders expectedly demanding liquidity, while
groups 1 to 4 include all non-marketable limit orders providing liquidity. The higher the order
aggressiveness is for a limit order, the more eager the trader is to trade.
5.1.2 Limit orders submitted before the open
As mentioned earlier, since no real-time order information regarding the limit order
book is disseminated before the open, it may be inappropriate to follow most of prior papers
to apply the definition of order aggressiveness of limit orders submitted after the open to that
before the open. Instead, we follow Chiao et al. (2009) to define it before the open as:
the order aggressiveness of buy order j for stock i = (Pi,j Pi,C)/Pi,C, (2)
the order aggressiveness of sell order j for stock i = (Pi,j Pi,C)/Pi,C,
where Pi,C, the benchmark price, is the closing price of stock i in the preceding trading day.
Namely, the applied order aggressiveness measures the deviation of the limit price from the
preceding day’s closing price. All pre-opening orders are sorted into the following five
groups: 0 ≤ order aggressiveness (group 5, the most aggressive), -0.5% ≤ order
aggressiveness < 0%, -1% ≤ order aggressiveness < -0.5%, -2% ≤ order aggressiveness < -1%,
and order aggressiveness < -2% (group 1, the least aggressive).
14
5.2 Order price priority at cancelation
The price priority measures the distance from the limit price of a buy (sell) order to the
best bid (ask) in the limit order book at cancelation. The specific definition is as follows:
the price priority of canceled buy order j for stock i = (Pi,j Pi,j,ask,c)/Pi,j,ask,c, (3)
the price priority of canceled sell order j for stock i = -(Pi,j Pi,j,bid,c)/Pi,j,bid,c,
where Pi,j,ask,c (Pi,j,bid,c) is the best (ask) bid in the limit order book for stock i at cancelation,
and Pi,j is the original limit price. All canceled buy and sell orders are separately grouped into
the following six groups, based on price priority: group k, if (-0.2% (6 k) price priority
> -0.2% (7 k)), k = 6 to 2, and group 1, if price priority -1%.
5.3 Regression models
Mainly following Hasbrouck and Saar (2009) and Fong and Liu (2010) to test the
determinants of cancelation ratios, we propose a Tobit regression for each stock across
investor groups on the selected firm characteristics and market conditions as follows:
,,1,11,,,,10,
1,9,1,8,17,
16,1,5,1,4,
1,3,,2,,1,
17
1
,0,,
titiimdtii
tiitiiti
titiitii
tiitiitii
n
nniiti
ORDERSIZEAVOLU
ASKDEPTHBIDDEPTHMARKETVOL
MARKETRETVOLRSPREAD
RETURNCALLPUTINTERCANCEL
(4)
where:
CANCELi,t is the cancelation ratio defined as the number of canceled orders for stock i
by a given investor group over 15-minute interval t relative to the number of submitted
orders by the same investor group over the same trading day. It ranges between 0 and 1.
PUTi,t and CALLi,t, the intrinsic FTO values of limit buy and sell orders or the NE costs
of limit sell and buy orders, are respectively defined as:
PUTi,t = max(ai,t min(pi,t+1), 0), CALLi,t = max(max(pi,t+1) bi,t, 0), (5)
where ai,t (bi,t) is the best ask (bid) for stock i at the end of interval t. CALLi,t and PUTi,t
capture the post-cancelation price movement. max(pi,t+1) and min(pi,t+1) are respectively

15
the maximum and the minimum of pi,t+1 over 15-minute interval t+1. Due to the dual
nature of the FTO and the NE risks, the NE costs for a limit buy and limit sell are given
by CALLi,t and PUTi,t, respectively (Fong and Liu, 2010). Namely, an effective FTO risk
(PUTi,t) facing a limit buy trader implies an ineffective NE risk (CALLi,t), and vice versa.
Quite differently, Liu and Sawyer (2003) respectively define PUTi,t and CALLi,t as:
PUTi,t = max(ai,t p’i,t+1, 0), CALLi,t = max(p’i,t+1 bi,t, 0), (6)
where p’i,t+1 is the end-of-period bid-ask midpoint. It follows that the FTO values of the
buy (sell) orders become effective only when the bid-ask midpoint falls (rises) by more
than half of the spread from the end of the previous interval. However, we regard that the
end-of-period midquote (p’i,t+1) is not as sufficient as the maximum and the minimum
over the interval in capturing the true development of the put and the call values. As a
special case, the put values in Equations (5) and (6) are equivalent, only if the
end-of-period midquote is the lowest over interval t+1.
To show a potential deficiency in the measures proposed by Liu and Sawyer (2003),
let us consider a possible scenario. Suppose that the midquote during interval t+1 falls
below the end-of-period best ask in interval t, and the option associated with a limit buy
becomes in-the-money and opposite-side traders have a chance to exercise the option.
However, the midquote at the end of interval t+1 rebounds above the end-of-period ask,
which resets PUTi,t to zero, according to Equation (6). It implies that the FTO would not
be exercised during the interval, although having been in-the-money.
The implication above is clearly counter-intuitive, and the FTO derived under
Equation (6) is apparently undervalued, because the end-of-period midquote employed in
Equation (6) fails to capture the true value of the put option value over the interval. On
the contrary, under Equation (5), the revised put value remains positive and well captures
the turning point of the FTO risk more precisely than that under Equation (6) does. The
measures under Equation (5) are expected to better reflect the trade-off limit-order
traders truly face over the 15-minute interval.
BIDDEPTHi,t-1 and ASKDEPTHi,t-1, the rates of changes in quoted depths on the bid
and ask sides, respectively, are given by:
,1 ,12,
1,
1,
2,
1,
1,
2,1,2,1,
a
ti
Aa
a
ti
tib
ti
Bb
b
ti
tiQ
QASKDEPTH
Q
QBIDDEPTH titititi

16
where Bi,t-2 (Ai,t-2) denotes the best bid (ask) price at the end of interval t-2, and b
tiQ 1,
( a
tiQ 1, ) is the depth in 1000 shares at a bid (ask) price of b (a) at the end of interval t-1.
Depths in the limit order book impact not only traders’ order submission, but also
order cancelation behavior. Cao et al. (2008) suggest that incremental information is
embedded in limit orders behind the best bid and offer quotes. Changes in depth are
likely to induce variations in the FTO and the NE risks (Duong et al., 2009). For
example, when the buy- (sell-) side depths become thin (thick), the stock price faces
downward pressure and pending buy orders are more likely to be filled (Parlour, 1998).
At this moment, unfilled buy (sell) orders then face a rising FTO (NE) risk. Responding
to these changes, order cancelation behavior could change accordingly.
To assess the effect associated with changes in quoted depths, following Fong and
Liu (2010), we calculate BIDDEPTHi,t-1 and ASKDEPTHi,t-1 by using the best quotes
at the end of the previous interval, Bi,t-2 and Ai,t-2, as the benchmarks, respectively. When
the best bid (ask) rises (falls), all the orders with limit prices equal to or greater than the
benchmark are counted, and BIDDEPTHi,t-1 (ASKDEPTHi,t-1) increases. A fall (rise) in
the best bid (ask) implies that trades exhaust the depth at the benchmark, and
BIDDEPTHi,t-1 (ASKDEPTHi,t-1) is set to -1.
ORDERSIZEi,t-1 is the average order size in 1000 shares for stock i over interval t-1. As
suggested by the literature (e.g., Fong and Liu, 2010; Yeo, 2005), order cancelations
increase with order size. The larger the limit order, the longer the order takes to execute,
the higher risk the order is exposed to, and the more likely the order is to be canceled.
RSPREADi,t-1 is the average 15 minute-by-minute snapshots of the relative spread for
stock i over interval t-1. Bid-ask spreads could impact the limit-order risks. A widening
spread reflects an increase in the possibility to be picked off or, equivalently, the FTO
risk. On the other hand, a larger spread may not necessarily imply higher information
asymmetry, but could be driven by liquidity shortage, encouraging some limit order
traders to provide liquidity and revise their limit orders inside the spread so as to raise
the likelihood of execution (Fong and Liu, 2010).
VOLi,t-1 is the standard deviation of the minute-by-minute snapshots of the midquote for
stock i over interval t-1. High price volatility increases the likelihood of order-execution,
thus leading to a higher FTO risk (Copeland and Galai, 1983; Foucault, 1999; Fong and
Liu, 2010). However, the impact of high volatility on the NE risk is uncertain and

17
depends on whether the high volatility is associated with high adverse selection costs
(Wald and Horrigan, 2005).
RETURNi,t-1 is the log change in quote midpoint for stock i over interval t-1, i.e. lnpi,t-1
lnpi,t-2. Stoll (2003) argues that, when bad (good) news for a stock hits, the stock price is
likely to trend downwards (upwards). When the FTO (NE) risk of the associated sell
(buy) orders rises, the dynamics are likely to impact order cancelation behavior.
MARKETVOLt-1 is the standard deviation of 15 minute-by-minute snapshots of the
market index over interval t-1. MARKETRETt-1 is the log index change of the market,
i.e., ln(INDEXt-1) ln(INDEXt-2). MARKETRETt-1 and MARKETVOLt-1, measuring the
impacts of market-wide information (Hollifield et al., 2004), are expected to change
traders’ order cancelation behavior, similar to the influences of RETURNi,t-1 and VOLi,t-1.
AVOLUi,t,d,m, the abnormal trading volume, is defined as:
,,
,,
,,
,,,
,,,
mt
mti
mdt
mdti
mdtiMEMARKETVOLU
VOLUME
MEMARKETVOLU
VOLUMEAVOLU
where VOLUMEi,t,d,m and MARKETVOLUMEt,d,m are respectively the trading volumes of
stock i and the market over interval t on day d of month m. mt
mti
MEMARKETVOLU
VOLUME
,
,, is the
average relative trading volume over the tth intervals in all trading days of month m.
AVOLUi,t,d,m measures the ratio of the trading volume of stock i to the market volume. A
positive AVOLUi,t,d,m, implying abnormally thick volume and rich information on the
stock, encourages traders to closely monitor the market, and vice versa.10
INTERn, n = 1, …, 17, is a dummy variable and takes a value of one, if the cancelations
take place in the nth 15-minute interval within any trading day.
The year 2008, when the global financial tsunami peaked and turned the world economy
upside down (Shefrin and Statman, 2011), is plausibly an information-rich period. We
present Figures 1 and 2 as preliminary evidence showing that the average cancelation ratios
separately by all investors and each investor group in 2008 are all higher than those in 2007.
Without loss of generality, we further conjecture that order cancelations may have different
10
Fong and Liu (2010) and Liu and Sawyer (2003) posit that monitoring the market usually relies on the level
of trading activities. For example, the thicker the trading volume, then not only the richer the information, but
also the lower the monitoring cost. Moreover, high trading volume is likely to attract not only noise traders but
also informed traders, raising the FTO values of limit orders and encouraging traders to monitor the market.

18
sensitivities to the included variables in Equation (4) between 2007 and 2008. To verify our
conjecture, we add an interaction term for each independent variable in Equation (4) to
highlight the increment from 2007 to 2008. The revised specification is as follows:
, )()(
)()()(
)()()(
)()()(
)(
,1,11,10,
1,9,1,8,17,
16,1,5,1,4,
1,3,,2,,1,0,
1,11,,,,10,
1,9,1,8,
17,16,
1,5,1,4,1,3,,2,,1,
17
1
,
17
1
,0,,
titiiti
tiitiiti
titiitii
tiitiitiii
tiimdtii
tiitii
titi
tiitiitiitiitii
n
nni
n
nniiti
ORDERSIZEDAVOLUD
ASKDEPTHDBIDDEPTHDMARKETVOLD
MARKETRETDVOLDRSPREADD
RETURNDCALLDPUTDD
ORDERSIZEAVOLU
ASKDEPTHBIDDEPTH
MARKETVOLMARKETRET
VOLRSPREADRETURNCALLPUT
INTERDINTERCANCEL
(7)
where D is a dummy variable set to one for order cancelations in 2008, and zero otherwise.
Similarly, a significantly positive (negative) δi,n implies that the sensitivity of order
cancelations to the nth independent variable for stock i rises (falls) from 2007 to 2008.
6. Empirical results
In this section, we shall conduct empirical analyses to test the hypotheses developed in
Section 4, by employing variables and models introduced in Section 5. Specifically, in
Sections 6.1, 6.2, and 6.3, we apply conditional analyses to, first, uncover the differences in
the monitoring costs across investor groups. Then, taking these differences as given, we
explore how investors cancel their limit orders, reacting to the trade-offs between the
limit-order risks. Section 6.4 employs Tobit regressions to further study the sensitivities of
order cancelations across investor groups. We, then, examine the changes in the sensitivities
to the limit-order risks from 2007 to 2008, the worst year of the global financial tsunami.
6.1 Monitoring costs
Table 3 reports the distributions of buy and sell order cancelations based on order
aggressiveness during regular trading hours, as defined in Equation (1). Basically, all
submitted limit orders are grouped into five groups. Group 5, the most aggressive one,
contains all marketable limit orders expected to be filled immediately, if the order size is not

19
too large; otherwise, after walking up the limit order book, the part of limit orders unfilled
will enter the limit order book and possibly be canceled. Groups 4 to 1 include all
non-marketable limit orders, with group 1 as the least aggressive group.11
The order
cancelation ratio is defined as the number of canceled limit orders to the number of submitted
limit orders in a given aggressiveness group.
Evidence from Table 3 shows that canceled orders by any investor group demonstrate an
inverted U-shaped pattern, regardless of buy or sell orders for large- or small-cap stocks.
Most of the cancelation ratios reach their peaks in group 3, lending support to Hypothesis 1.
The first (upward-sloping) half of the pattern is plausible and consistent with the literature
that order aggressiveness is negatively related to order cancelations. Intuitively, the more
aggressive the order, the less time it takes to be filled, the less frequently traders cancel it.
The second (downward-sloping) half of the pattern may reflect the behavior of traders who
have rather high monitoring costs and are possibly unable to cancel their limit orders.
As argued in Section 4, traders with a high monitoring cost tend to submit limit orders
either before the open or at prices far from the best quotes to protect themselves from the
FTO risk. To explore the monitoring costs across investor groups, as a first step, we compare
their order submission behavior after and before the open, as respectively reported in Tables
3 and 4. Four useful ratios, WEIGHT, RG5, RG4, and RG1, are additionally calculated.
WEIGHT, defined as the weight of limit orders submitted by a given investor group to all
submitted limit orders, captures the share of limit orders submitted by the investor group.
RG5, RG4, and RG1 are respectively the ratios of the numbers of group-5, group-4, and
group-1 limit orders to the number of all non-marketable limit orders from groups 4 to 1.
Intuitively, RG5 captures traders’ preferences toward marketable limit orders, while RG4 and
RG1 describe the nearness of the limit prices for traders’ non-marketable orders to the best
quotes. The higher the RG1 and the lower the RG4, the farther the limit prices are to the best
quotes. The higher the RG5, the higher tendency is for the traders to consume liquidity.
As reported in the left half of Table 3, it is clear that the limit orders after the open
submitted by individual investors have the lowest RG4 and the highest RG1 (e.g., 0.383 and
0.283 in Panel A, respectively). Moreover, individual investors have the lowest RG5s (e.g.,
0.819 in Panel A), implying that they not only prefer non-marketable to marketable limit
orders, but also submit non-marketable limit orders at less aggressive prices than other
11
For robustness, we use different price ranges to define the levels of order aggressiveness. The results are
qualitatively equivalent to what we report in the context.

20
investor groups do. On the contrary, institutional investors having higher RG5 overall
consume liquidity. Moreover, when placing non-marketable limit orders, their limit prices are
likely to be closer to the best quotes, supporting Hypothesis 2a.
To test Hypothesis 2b, let us shift our focus to the comparisons between Tables 3 and 4
across investor groups. WEIGHT reveals that individual investors playing an overwhelming
role submit more than 96% of total limit orders, even higher than that in Table 3. Taking buy
orders for large-cap stocks as an example, the WEIGHT reported in Panel A of Table 4
(Table 3) for foreign investors and domestic institutions is respectively 0.014 and 0.019
(0.145 and 0.035), whereas that for individual investors is 0.967 (0.820). The evidence
confirms that individual investors submit more limit orders before the open than institutional
investors.
Most individual investors cannot closely monitor the market, because of their daytime
jobs. However, lunchtime may be an exceptional period during which they can be
temporarily free from work and engaged in trading activities. To verify this statement, let us
take a look at Figure 3 that plots the 15-minute intraday pattern of canceled orders for each
investor group. Most noteworthy is the rising pattern of order cancelations, starting around 12
pm, by individual investors. Explicitly, their lowest buy and sell order cancelations take place
all in the interval between 12:00 pm and 12:15 pm, regardless of market capitalization, which
is likely to relate to the working schedule of most daytime workers. Namely, they have a
time-varying monitoring cost that is particularly high during the morning hours and decreases
afterwards until the market closes at 1:30 pm. All the evidence confirms Hypothesis 2b.
Regarding the behavior of institutional investors, Figure 3 shows that they cancel limit
orders less frequently rightly after the open and more frequently before the close, whereas
individual investors conversely behave. It is possible that, because of the unavailability of
real-time information before the open regarding the limit order book that helps resolve
overnight information uncertainty, institutional investors with low monitoring costs hesitate
to submit orders before the open to avoid unnecessary risk exposures.
After the open, overnight information is incorporated into stock prices, albeit possibly
imprecisely. According to Anand et al. (2005) and Menkhoff et al. (2010), informed traders
tend to demand liquidity earlier in a trading day. Hence, it is highly possible that, after the
open, institutional investors enthusiastically act as liquidity takers and quickly pick off stale
limit orders. In fact, our unreported results demonstrate that institutional investors submit
proportionally more marketable limit orders in the 15-minute interval right after the open
21
than in subsequent 15-minute intervals. Since submitting less non-marketable limit orders,
they cancel less limit orders. Before the close, institutional investors supplying liquidity tend
to submit non-marketable limit orders. Then, they actively monitor the market and react fast
to news by canceling/revising their orders. The evidence supports Hypothesis 3
In this subsection, we have learned how order aggressiveness affects limit order
cancelations. However, it is determined at submission, so its relation with order cancelations
cannot link to the dynamics of the limit-order risks. Next, applying another measure (the
price priority defined in Equation (3)) to assess the distance from the limit price to the
prevailing best quotes at cancelation, we shall pay attention to the relation, in a more dynamic
sense, between order cancelations and the limit-order risks.
6.2 Limit-order risks
Table 5 reports the distributions of buy and sell canceled orders conditional on price
priority. The order cancelation ratio in each priority group is defined as the number of
canceled limit orders to the number of submitted limit orders by a given investor group.
Firstly, as expected, the canceled orders by all or any investor group exhibit a U-shaped
pattern, confirming Hypothesis 4a. There is a monotonically decreasing pattern from group 6
(with the highest price priority) to group 2; however, a sudden jump occurs for group-1
stocks (with the lowest price priority), reflecting the dynamics of the FTO and the NE risks
and the trade-off between them facing investors. Plausibly, the higher the price priority, the
higher the FTO value, and the more likely investors are to cancel their limit orders, other
things being equal. For example, from groups 6 to 2, the buy order cancelation ratios for
small-cap stocks by all investors are decreasing and respectively 0.276, 0.132, 0.101, 0.071,
and 0.061. Differently, the cancelation ratio in group 1 is 0.360 and even higher than that in
group 6. For limit orders in group 6, the FTO risk is reasonably not as effective as for that in
other groups. By contrast, the increasingly effective NE risk may exert pressure on traders
who have unfilled limit orders so as to revise (part of) them at more aggressive prices to raise
the likelihood of execution. The inducement is even stronger, when traders expect stock
prices to trend away from their orders’ prices.
Secondly, across investor groups, foreign investors proportionally cancel the most limit
orders in the highest price priority group, while individual investors do so in the lowest price
priority group, supporting Hypothesis 4b. For example, for small-cap stocks, the cancelation

22
ratios of buy orders in the highest and the lowest price priority groups are respectively 0.486
and 0.122, while the ratios by domestic institutions (individual investors) are 0.266 and 0.358
(0.259 and 0.382), respectively. The sharp differences reflect the groups’ monitoring costs
and order submission behavior, consistent with earlier observations. Namely, foreign
investors, having the lowest monitoring cost and submitting more non-marketable limit
orders near the best quotes, closely monitor the market to reduce their exposure to the FTO
risk, which explains why they cancel proportionally more limit orders near the best quotes.12
Thirdly, market capitalization matters for order cancelations as well. In Table 5, taking
the sell orders as an example, the difference in the order cancelation ratios by all investors
between large- and small-cap stocks in group 6 is 0.052 (=0.290 0.238), while that in group
6 is -0.070 (=0.360 0.430). Obviously, order cancelations for large-cap stocks are likely to
take place at prices closer to the best quotes than those for small-cap stocks, which is
consistent with Duong et al. (2009) and Aitken et al.(2007).
As reported in Table 3, the RG4 for small-cap stocks is smaller than those for large-cap
stocks, implying not only that limit orders for small-cap stocks are less aggressive, but also
that the associated FTO risk for small-cap stocks is not as serious as that for large-cap stocks.
On the contrary, the NE risk for small-cap stocks is more visible than that for large-cap
stocks. As suggested by the traditional wisdom (e.g., Gompers and Metrick (2001) and
Frieder and Subrahmanyam (2005)) and Table 2 in this paper, foreign investors prefer
large-cap stocks, which partly explains the observations consistent with Hypothesis 4b.
6.3 The sensitivities of order cancelations to the limit-order risks
In this sub-section we apply Tobit regressions, as described in Equations (4) and (7), to
test the relation between order cancelations and the monitoring cost as well as the limit-order
risks across investor groups. Recall that we revise the definition of PUTi,t (CALLi,t) proposed
by Liu and Sawyer (2003) by replacing the end-of-the-period bid-ask midpoint with the
minimum (maximum) midpoint over interval t+1, as explained in Equations (5) and (6). For
conciseness, we do not report the full regression results applying the original PUTi,t and
12
As a robustness test, we divide the sample into price-priority groups based on different ranges from those in
the context, and the qualitative changes do not essentially alter our conclusions.

23
CALLi,t, but do mention the differences between the two sets of coefficients in the context.
Table 6 reports the regression results applying the revised PUTi,t and CALLi,t.13
The coefficients on PUTi,t and CALLi,t are, as expected, mostly significantly positive and
consistent with Fong and Liu (2010). It follows that the FTO and the NE risks unambiguously
play a positive role in order cancelations. When stock prices move closer to (away from) the
best quotes, the rising FTO (NE) risk raises the possibility of order cancelations. Among
investor groups, regardless of buy or sell orders, the impacts of the FTO and the NE risks on
order cancelations are highest for foreign investors, whereas those for individual investors are
the least. In Panel B, three out of four coefficients of the order cancelation ratio for individual
investors are even negative. Since individual investors have a higher monitoring cost, it is
reasonable that they can neither closely monitor the market nor be as keen as institutional
investors to respond to changes in the FTO and the NE risks, as unexpected information
arrives. The evidence supports Hypothesis 5a that the sensitivities of individual investors’
order cancelations to PUTi,t and CALLi,t are the lowest among the investor groups.14
However, if applying Equation (6) to measure PUTi,t and CALLi,t , as originally proposed
by Liu and Sawyer (2003), the (unreported) coefficients are very different from those
reported in Table 6. For instance, in Panel A of Table 6 the coefficients on PUTi,t/100 for buy
(sell) orders by foreign investors, domestic institutions, and individual investors are
respectively 0.289, 0.148, and 0.036 (0.254, 0.214, and 0.168), while the unreported
coefficients on the Liu and Sawyer’s PUTi,t/100 are 0.335, 0.116, and 0.029 (0.118, 0.246,
and 0.173). Only half of them are significant at the 10% level, while those reported in Panel
A are all significant at the 1% level. Furthermore, the unreported coefficient on the Liu and
Sawyer’s PUTi,t/100 for sell orders by individual investors (0.173) is counter-intuitively
greater than that by foreign investors (0.118). Instead, those reported in Table 6 are more
credible, suggesting an improvement by the measures proposed by this paper.
As for the coefficients on other (control) variables, those on VOLi,t-1 are all significantly
positive, regardless of investor groups, implying that owing to the option-like feature, the
higher the price volatility, the more costly the limit orders. This is because rising volatility
makes the FTO associated with the orders more valuable and likely to become in-the-money
(Foucault, 1999). To deal with it, limit-order traders require larger compensation for the
13
For brevity, the coefficients on the interval dummies are unreported, but available upon request.
14 The unreported results for the pairwise comparisons of the coefficients on PUTi,t and CALLi,t between
investor groups confirm that their order-cancelation sensitivities to the limit-order risks are different.

24
rising FTO risk, by revising currently unfilled limit orders and resubmitting new orders with
lower price priorities. Proxying for the arrival of public information, the market index
volatility (MARKETVOLt-1) similarly impacts order cancelations, indicating that high market
index volatility implies high uncertainty. As for the impacts of RETURNi,t-1 and
MARKETRETt-1 on order cancelations, they are not as strong as those of VOLi,t-1 and
MARKETVOLt-1, although most of them are significantly positive. This is actually not
surprising, because part of the impacts of price movement on order cancelations have been
absorbed by the FTO and the NE costs, denoted by PUTi,t and CALLi,t in (5).
Variations in the FTO and the NE risks could be induced by changes in depths as well
(Ranaldo, 2004; Duong et al., 2009). Recall that BIDDEPTHi,t-1 (ASKDEPTHi,t-1) employed
in Equation (4) measures the cumulated depth in period t-1 above the best bid (ask) at the end
of period t-2, relative to the depth at the best bid (ask) at the end of period t-2. If period t-1’s
bid (ask) falls below (rises above) period t-2’s best bid (ask), the measure is equal to -1. If
certain news hits the stock, then its price could be impacted by positive (negative) demand
shocks, driving its BIDDEPTHi,t-1 (ASKDEPTHi,t-1) upwards.
The coefficients of buys (sells) on BIDDEPTHi,t-1 are mostly positive (negative), while
those on ASKDEPTHi,t-1 are mostly negative (positive), particularly for institutional
investors. Fong and Liu (2010) argue that limit-order traders would be given more
opportunities to revise their orders when the market moves away from them than when the
market moves against them. The above finding might imply that, when the depth increases,
traders who have unfilled limit orders on the same side may feel pressure from the rising NE
risk. Since the waiting orders are expected to take longer to execute, the traders can easily
revise the original orders to raise their price priorities. However, the stale limit orders on the
opposite side may be quickly picked off.
Compared to the coefficients for institutional investors, interestingly, those for
individual investors are not as clear, and some of them even demonstrate an opposite sign.
Suppose that individual investors have a higher monitoring cost and tend to submit limit
orders at less aggressive prices. It is not surprising that they are less sensitive to changes in
depth, especially when the concurrent best quotes are still far from the limit prices.
The coefficients on the relative spread (RSPREADi,t-1) are mostly significantly positive,
consistent with the literature. A larger relative spread is possibly associated with greater
uncertainty. Traders can either require larger compensation by resubmitting orders at prices
farther from the best quotes or closely monitor the market and cancel orders, if necessary (Liu,

25
2009). Regarding trading volume, the coefficients are all significantly positive for each
investor group. Recall that AVOLUi,t,d,m measures the abnormal trading volume of stock i and
proxies for the level of trading activities. When the relative stock volume is abnormally high,
traders pay attention to the stock as the opportunity cost of not monitoring it is high.
Overall, individual stock returns and price volatility, market returns and volatility, the
relative bid-ask spread, and the abnormal trading volume have positive impacts on order
cancelations. The buy- (sell-) side depth has a positive effect on buy (sell) order cancelations
and a negative effect on sell (buy) order cancelations. Regarding the behavior differences in
order cancelations across investor groups, it is unsurprising and consistent with prior
observations that individual investors, who have a higher monitoring cost than institutional
investors do, do not respond as sensitively as institutional investors, according to the
magnitudes of the coefficients.
6.4 Impacts of the global financial tsunami on order cancelations
As mentioned earlier, different monitoring costs and order submission behavior among
investor groups lead to different limit-order risks they face after submission and, hence,
different order cancelation behavior. The global financial tsunami even widens the
differences, as drawn in Figure 2. Equation (7) estimates the increments in the sensitivities
(δi,n, n = 1, …, 11) from 2007 to 2008 for a given investor group. Table 7 records the results.
First, the reported coefficients on the interaction terms are mostly significantly positive,
except those on the bid and the ask depths (D×BIDDEPTHi,t-1 and D×ASKDEPTHi,t-1). In
addition, the coefficients for foreign investors are mostly the highest, while those for
individual investors are the lowest. It follows that investors are increasingly sensitive to most
of the selected variables. Second, comparing the coefficients on PUTi,t and CALLi,t in Tables
7 and 8, the sensitivities of foreign investors and domestic institutions to the FTO and the NE
risks in 2008 are strikingly more than double those in 2007. As for individual investors, their
sensitivities do increase, but are not as robust. The results shed light on Hypothesis 5b.
Before concluding this paper, note that, for conciseness, all results are derived primarily
using the number of canceled orders. To ensure the robustness of our results, we also apply
the volume of canceled orders to study the issues of this paper. The results are not reported
and essentially resemble the results reported above.

26
7. Concluding remarks
Employing intraday data, this paper studies the order cancelation behavior of investors
and particularly places emphasis on behavior differences across investor groups. To clearly
differentiate this paper from prior studies, the derived conclusions are separated into two
major categories: those consistent with the literature and the others regarding the behavior
across investor groups previously unexplored.
In the former category, firstly, the FTO and the NE risks are crucial determinants of
order cancelations. Secondly, order cancelations exhibit a U-shaped intraday pattern that is,
investors cancel their orders more frequently after the market open and before the close.
Thirdly, the relation between order cancelations and concurrent price priority is U-shaped.
Namely, when the concurrent quotes move closer to (farther from) the limit prices, traders
confront a rising FTO (NE) risk and are more likely to cancel these orders. Finally, firm size
matters for order cancelations. Traders who submit limit orders for large-cap (small-cap)
stocks face a higher FTO (NE) risk, so they are more likely to cancel the limit orders when
the prevailing quotes move closer to (farther from) the limit prices.
The latter category includes the following. Firstly, institutional investors, especially
foreign investors, closely monitor the market and actively cancel their orders. Individual
investors with a higher monitoring cost do not frequently cancel their orders until noon,
reflecting the fact that they are unable to do so during regular working hours. Secondly,
foreign investors, having a lower monitoring cost and submitting limit orders around the best
quotes, are more aware of the FTO risk and tend to cancel limit orders with higher price
priorities. Thirdly, applying a regression analysis, we show that the sensitivities of order
cancelations by foreign investors to the FTO and the NE risks are the highest, while those by
individual investors are the lowest. Fourthly, order cancelations proportionally increased
from 2007 to 2008, as the result of rising uncertainty. Moreover, the sensitivities of order
cancelations by foreign investors and domestic institutions to the FTO and the NE risks more
than doubled from 2007 to 2008.
Finally, it is worthwhile to mention that, to precisely capture the limit-order risks, this
paper proposes a revision of the FTO and the NE risks initially developed by Liu and Sawyer
(2003). The improvement has been empirically confirmed in this paper as a contribution to
the literature.

27
References
Aitken, M., Almeida, N., Harris, F.H.deB., Mcinish, T.H., 2007. Liquidity supply in
electronic markets. Journal of Financial Markets 10, 144-168.
Anand, A., Chakravarty, C., Martell, T., 2005. Empirical evidence on the evolution of
liquidity: Choice of market versus limit orders by informed uninformed traders. Journal of
Financial Markets 8, 288-308.
Bertsimas, D., Lo, A.W., 1998. Optimal control of execution costs. Journal of Financial
Markets 1, 1-50.
Biais, B., Hillion, P., Spatt, C., 1995. An empirical analysis of the limit order book and the
order flow in the Paris Bourse. Journal of Finance 50, 1655-1689.
Biais, B., Martimort, D., Rochet, J., 2000. Competing mechanisms in a common value
environment. Econometrica 68, 799-837.
Bloomfield, R., O’Hara, M., Saar, G., 2005. The make-or-take decision in an electronic
market: Evidence on the evolution of liquidity. Journal of Financial Economics 75, 165-199.
Brockman, P., Chung, D.Y., 1999. An analysis of depth behavior in an electronic,
order-driven environment. Journal of Banking Finance 23, 1861-1886.
Campbell, J.Y., Grossman, S.J., Wang, J., 1993. Trading volume and serial correlation in
stock returns. Quarterly Journal of Economics 108, 905-939.
Cao, C., Hansch, O., Wang, X., 2008. The informational content of an open limit order book.
Journal of Futures Markets 29, 16-41.
Chan, L., Lakonishok, J., 1995. The behavior of stock prices around institutional trades.
Journal of Finance 50, 1147-1174.
Chakrabarty, B., Tyurin, K., Han, Z., Zheng, X., 2006. A competing risk analysis of
executions and cancelations in a limit order market. CAEPR Working Paper No. 2006-015.
Chakravarty, S., 2001. Stealth trading: Which traders’ trades move stock prices? Journal of
Financial Economics 61, 289-307.
Chiao, C., Chen, S., Hu, J., 2010. Informational differences among institutional investors in
an increasingly institutionalized market. Japan and the World Economy 22, 118-129.
Chiao, C., Wang, Z., Lai, H., 2009. Order Submission Behaviors and Opening Price
Behaviors: Evidence from an Emerging Market. Review of Quantitative Finance and
Accounting 33, 253-278.
Chung, K., Van Ness, B., Van Ness, R., 1999. Limit orders and the bid-ask spread. Journal of
Financial Economics 53, 255-287.

28
Copeland, T.E., Galai, T.E.C., 1983. Information effects on the bid-ask spread. Journal of
Finance 38, 1457-1469.
Coppejans, M.T., Domowitz, I., 2002. Screen information trader activity and bid-ask spreads
in a limit order market. Working paper, Pennsylvania State University.
Duong, H.N., Petko, P.S., Krishnamurti, C., 2009. Order aggressiveness of institutional and
individual investors. Pacific-Basin Finance Journal 17, 533-546.
Ellul, A., Holden, C.W., Jain, P., Jennings, R., 2007. Order dynamics: Recent evidence from
the NYSE. Journal of Empirical Finance 14, 636-661.
Eom, K.S., Lee, E.J., Park, K.S., 2013. Microstructure-based manipulation: Strategic
behavior and performance of spoofing traders. Journal of Financial Markets 16, 227-252.
Frieder, L., Subrahmanyam A., 2005. Brand perceptions and the market for common stock.
Journal of Financial and Quantitative Analysis 40, 57-85.
Fong, K.Y.L., Liu, W.M., 2010. Limit order revisions. Journal of Banking and Finance 34,
1873-1885.
Foster, F.D., Liu, W.M., 2008. Linking limit order book: Managing free options on options.
Working paper, University of New South Wales.
Foucault, T., 1999. Order flow composition and trading costs in dynamic limit order markets.
Journal of Financial Markets 2, 99-134.
Foucault, T., Roell, A., Sandas, P., 2003. Market making with costly monitoring: An analysis
of the SOES controversy. Review of Financial Studies 16, 345-384.
Goldstein, M., Kavajecz, K., 2000. Eighths, sixteenths, and market depth: Changes in tick
size and liquidity provision on the NYSE. Journal of Financial Economics 56, 125-149.
Gompers, P.A., Metrick, A., 2001. Institutional investors and equity prices. Quarterly Journal
of Economics 116, 229-259.
Griffiths, M.D., Smith, B., Turnbull, D.A.S., White, R.W., 2000. The costs and determinants
of order aggressiveness. Journal of Financial Economics 56, 68-88.
Harris, L., 1998. Optimal dynamic order submission strategies in some stylized trading
problems. Financial Markets, Institutions, and Instruments 7, 1-75.
Hasbrouck, J., Saar, G., 2009. Technology liquidity provision: The blurring of traditional
definitions. Journal of Financial Markets 12, 143-172.
Hasbrouck, J., Saar, G., 2001. Limit orders and volatility in a hybrid market: The island ECN.
Working Paper.
Hollifield, B., Miller, R.A., Sandas, P., 2004. Empirical analysis of limit order markets.
Review of Economic Studies 71, 1027-1063.

29
Jain, P., 2005, Financial market design equity premium: Electronic versus floor trading.
Journal of Finance 60, 2955-2985.
Kang, J., Stulz, R., 1997. Why is there a home bias? An analysis of foreign portfolio equity
ownership in Japan. Journal of Financial Economics 46, 3 – 28.
Kaniel, R., Liu, H., 2006. So what orders do informed traders use? Journal of Business 79,
1867-1914.
Kuk, J., Liu, W.M., Pham, P.K., 2010. Strategic order submission and cancelation in
pre-opening periods: the case of IPO firms. Working paper, Australian National University.
Lee, C.M.C., Shleifer, A., Thaler, R.H., 1991. Investor sentiment and the closed-end fund
puzzle. Journal of Finance 46, 75-109.
Lee, Y., Liu, Y., Roll, R., Subrahmanyam, A., 2004. Order imbalances and market efficiency:
Evidence from the Taiwan Stock Exchange. Journal of Financial and Quantitative Analysis
39, 327-341.
Liu, W.M., Sawyer, K.R., 2003. How free are free trading options? Pacific-Basin Finance
Journal 11, 573-591.
Liu, W.M., 2009. Monitoring limit order submission risks. Journal of Financial Markets 12,
107-141.
Madhavan, A, 1992. Trading mechanisms in securities markets. Journal of Finance 47,
607-642.
Madhavan, A., Panchapagesan, V., 2000. Price discovery in auction markets: A look inside
the black box. Review of Financial Studies, 13, 627-658.
Menkhoff, L., Osler, C.L., Schmeling, M., 2010. Limit-order submission strategies under
asymmetric information. Journal of Banking and Finance 34, 2665-2677.
Parlour, C., 1998. Price dynamics in limit order markets. Review of Financial Studies 11,
789-816.
Ranaldo, A., 2004. Order aggressiveness in limit order book markets. Journal of Financial
Markets 7, 53-74.
Rock, K., 1996. The specialist’s order book price anomalies. Working Paper.
Shefrin, H., Statman, M., 2011. Behavioral finance in the financial crisis: Market efficiency,
Minsky, and Keynes. Working Paper, Santa Clara University.
Stoll, H., 2003. Market microstructure. In: Constantinides, G.M., Harris, M., Stulz, R.M.
(Eds.), Handbook of the Economics of Finance. Elsevier, Amsterdam.

30
Stoll, H., 2006. Electronic trading in stock markets. Journal of Economic Perspectives 20,
153-174.
Wald, J.K., Horrigan, H.T., 2005. Optimal limit order choice. Journal of Business 78,
597-619.
Yeo, W., 2005. Cancelations of limit orders. Working Paper, National University of
Singapore.

31
Figure 1. The daily proportions of canceled orders to all submitted orders
This figure plots the average daily proportions of canceled orders separately in dollar volume
and in number of canceled orders to total submitted limit orders over 2007 and 2008. In terms
of dollar volume, the averages are respectively 15.84% and 19.43% for 2007 and 2008,
whereas in terms of number of canceled orders they are 19.52% and 21.75%.
0
0.05
0.1
0.15
0.2
0.25
0.3
01
/02
/07
01
/22
/07
02
/09
/07
03
/12
/07
03
/30
/07
04
/20
/07
05
/11
/07
05
/31
/07
06
/22
/07
07
/11
/07
07
/31
/07
08
/20
/07
09
/07
/07
10
/01
/07
10
/22
/07
11
/09
/07
11
/29
/07
12
/19
/07
01
/09
/08
01
/29
/08
02
/26
/08
03
/18
/08
04
/08
/08
04
/28
/08
05
/19
/08
06
/05
/08
06
/25
/08
07
/15
/08
08
/05
/08
08
/25
/08
09
/12
/08
10
/03
/08
10
/24
/08
11
/13
/08
12
/03
/08
12
/23
/08
In dollar volume
In number of orders

32
Panel A. For large-cap stocks
Panel B. For small-cap stocks
Figure 2. The proportions of canceled orders by investor groups
This figure chronologically plots the average order cancelation ratios among investor groups
for large-cap (small-cap) stocks in Panel A (B). The order cancelation ratio for a given
investor group over a trading day is defined as the number of canceled orders relative to the
number of all submitted orders by the same investor group. The three investor groups are FIs,
DIs, and IIs, standing for foreign investors, domestic institutions, and individual investors,
respectively. Their averages for large-cap (small-cap) stocks are 0.290, 0.165, and 0.143
(0.326, 0.174, and 0.150), respectively.
0
0.1
0.2
0.3
0.4
0.5
0.6 0
1/0
2/0
7
01
/17
/07
02
/01
/07
02
/27
/07
03
/14
/07
03
/29
/07
04
/16
/07
05
/02
/07
05
/17
/07
06
/01
/07
06
/20
/07
07
/04
/07
07
/19
/07
08
/03
/07
08
/20
/07
09
/04
/07
09
/20
/07
10
/08
/07
10
/24
/07
11
/08
/07
11
/23
/07
12
/10
/07
12
/25
/07
01
/10
/08
01
/25
/08
02
/19
/08
03
/06
/08
03
/21
/08
04
/08
/08
04
/23
/08
05
/09
/08
05
/26
/08
06
/10
/08
06
/25
/08
07
/10
/08
07
/25
/08
08
/12
/08
08
/27
/08
09
/11
/08
09
/26
/08
10
/15
/08
10
/30
/08
11
/14
/08
12
/01
/08
12
/16
/08
12
/31
/08
FIs DIs IIs
0
0.1
0.2
0.3
0.4
0.5
0.6
0.7
01/0
2/0
7
01/1
7/0
7
02/0
1/0
7
02/2
7/0
7
03/1
4/0
7
03/2
9/0
7
04/1
6/0
7
05/0
2/0
7
05/1
7/0
7
06/0
1/0
7
06/2
0/0
7
07/0
4/0
7
07/1
9/0
7
08/0
3/0
7
08/2
0/0
7
09/0
4/0
7
09/2
0/0
7
10/0
8/0
7
10/2
4/0
7
11/0
8/0
7
11/2
3/0
7
12/1
0/0
7
12/2
5/0
7
01/1
0/0
8
01/2
5/0
8
02/1
9/0
8
03/0
6/0
8
03/2
1/0
8
04/0
8/0
8
04/2
3/0
8
05/0
9/0
8
05/2
6/0
8
06/1
0/0
8
06/2
5/0
8
07/1
0/0
8
07/2
5/0
8
08/1
2/0
8
08/2
7/0
8
09/1
1/0
8
09/2
6/0
8
10/1
5/0
8
10/3
0/0
8
11/1
4/0
8
12/0
1/0
8
12/1
6/0
8
12/3
1/0
8
FIs DIs IIs

33
Panel A. Buy orders for large-cap stocks Panel B. Sell orders for large-cap stocks
Panel C. Buy orders for small-cap stocks
Panel D. Sell orders for small-cap stocks
Figure 3. The proportions of canceled orders by each investor group over 15-minute intervals
This figure plots the 15-minute order cancelation ratios by each investors group over a
trading day. The ratio is defined as the number of canceled buy or sell orders over a given
15-minute interval to that by the investor group over the entire trading day, separately for
large- and small-cap stocks. The three investor groups are FIs, DIs, and IIs, standing for
foreign investors, domestic institutions, and individual investors, respectively.
0
0.04
0.08
0.12
0.16
0.2
0.24 9
:00
-9:1
5
9:1
5-9
:30
9:3
0-9
:45
9:4
5-1
0:0
0
10
:00
-10
:15
10
:15
-10
:30
10
:30
-10
:45
10
:45
-11
:00
11
:00
-11
:15
11
:15
-11
:30
11
:30
-11
:45
11
:45
-12
:00
12
:00
-12
:15
12
:15
-12
:30
12
:30
-12
:45
12
:45
-13
:00
13
:00
-13
:15
13
:15
-13
:30
FIs DIs
IIs All
0
0.04
0.08
0.12
0.16
0.2
0.24
9:0
0-9
:15
9:1
5-9
:30
9:3
0-9
:45
9:4
5-1
0:0
0
10
:00
-10
:15
10
:15
-10
:30
10
:30
-10
:45
10
:45
-11
:00
11
:00
-11
:15
11
:15
-11
:30
11
:30
-11
:45
11
:45
-12
:00
12
:00
-12
:15
12
:15
-12
:30
12
:30
-12
:45
12
:45
-13
:00
13
:00
-13
:15
13
:15
-13
:30
FIs DIs
IIs All
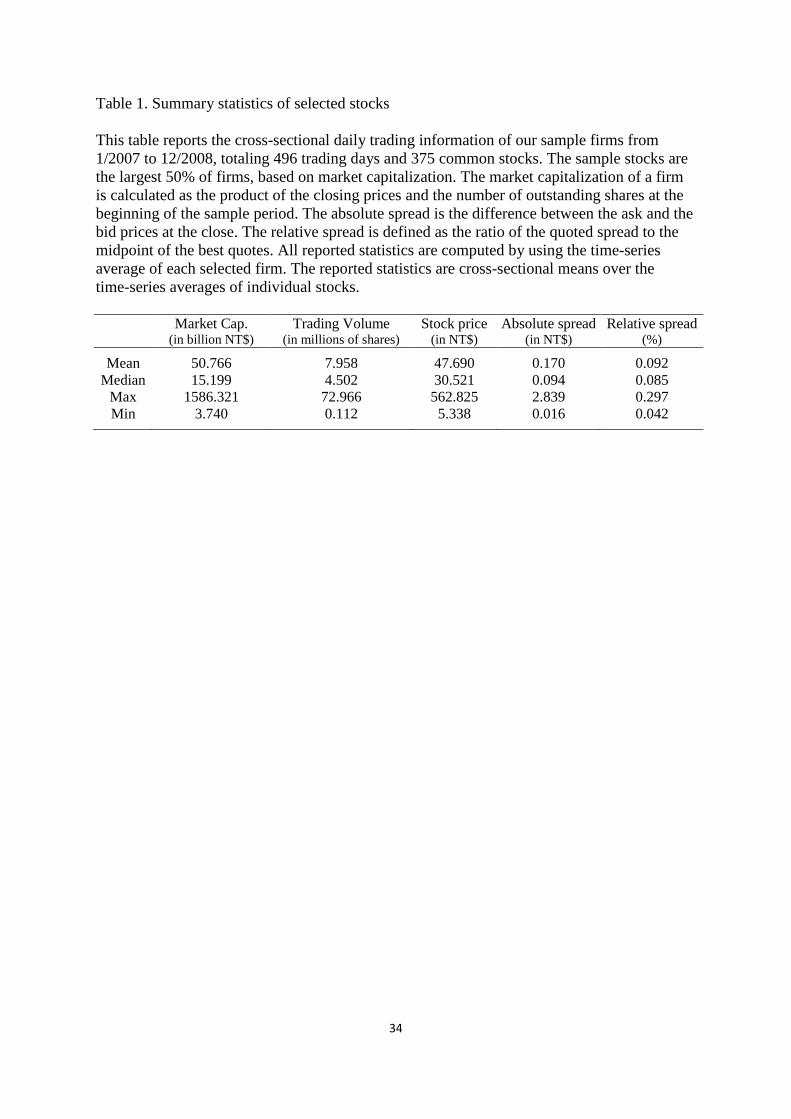
34
Table 1. Summary statistics of selected stocks
This table reports the cross-sectional daily trading information of our sample firms from
1/2007 to 12/2008, totaling 496 trading days and 375 common stocks. The sample stocks are
the largest 50% of firms, based on market capitalization. The market capitalization of a firm
is calculated as the product of the closing prices and the number of outstanding shares at the
beginning of the sample period. The absolute spread is the difference between the ask and the
bid prices at the close. The relative spread is defined as the ratio of the quoted spread to the
midpoint of the best quotes. All reported statistics are computed by using the time-series
average of each selected firm. The reported statistics are cross-sectional means over the
time-series averages of individual stocks.
Market Cap.
(in billion NT$)
Trading Volume (in millions of shares)
Stock price (in NT$)
Absolute spread (in NT$)
Relative spread (%)
Mean 50.766 7.958 47.690 0.170 0.092 Median 15.199 4.502 30.521 0.094 0.085
Max 1586.321 72.966 562.825 2.839 0.297 Min 3.740 0.112 5.338 0.016 0.042

35
Table 2. Submitted orders and canceled orders by the three investor groups
This table reports the average daily numbers of submitted (canceled) orders by each investor
group relative to the numbers of all submitted (canceled) orders and their order sizes. The
three investor groups are FIs, DIs, and IIs, standing for foreign investors, domestic
institutions, and individual investors, respectively.
Order characteristics Buys Sells
FIs DIs IIs FIs DIs IIs
Panel A. For large-cap stocks
Proportion of submitted orders 0.161 0.039 0.800 0.177 0.038 0.785
Order size in
1000 shares 13.524 27.465 6.441 14.326 27.314 6.343
million NT$ 0.613 1.251 0.252 0.636 1.244 0.249
Proportion of canceled orders 0.226 0.028 0.746 0.240 0.028 0.733
Order size in
1000 shares 11.971 28.645 9.692 13.068 28.289 7.522
million NT$ 0.562 1.372 0.381 0.609 1.374 0.317
Panel B. For small-cap stocks
Proportion of submitted orders 0.053 0.030 0.917 0.068 0.031 0.901
Order size in
1000 shares 7.504 19.143 6.940 7.144 18.206 6.500
million NT$ 0.232 0.633 0.180 0.212 0.599 0.167
Proportion of canceled orders 0.082 0.023 0.896 0.108 0.024 0.869
Order size in
1000 shares 6.269 19.855 10.983 5.777 17.590 7.635
million NT$ 0.204 0.691 0.286 0.178 0.620 0.207

36
Table 3. Order cancelations and the aggressiveness of limit orders submitted after the open
This table reports the average daily numbers of submitted orders and the order cancelation
ratios based on order aggressiveness. The order cancelation ratio is defined as the number of
canceled limit orders to the number of submitted limit orders by a given investor group in a
given aggressiveness group. Order aggressiveness measures the relative distance from the
limit prices to the best quotes when the orders are submitted during regular trading hours and
is defined as follows:
the order aggressiveness of buy order j for stock i = (Pi,jPi,j,ask)/Pi,j,ask,
the order aggressiveness of sell order j for stock i = (Pi,jPi,j,bid)/Pi,j,bid,
where Pi,j,ask (Pi,j,bid) is the best (ask) ask price of buy (sell) order j for stock i, and Pi,j is the
limit price of order j for stock i. All orders are sorted into the following five groups:
0 ≤ order aggressiveness (the most aggressive),
-0.5% ≤ order aggressiveness < 0%,
-1% ≤ order aggressiveness < -0.5%,
-2% ≤ order aggressiveness < -1%,
order aggressiveness < -2% (the least aggressive).
The most aggressive or the first-group orders are marketable limit orders, while those in the
other groups are all non-marketable limit orders. FIs, DIs, and IIs stand for foreign investors,
domestic institutions, and individual investors, respectively. WEIGHT is defined as the
weight of limit orders by a given investor group to all limit orders. RG5 [RG4] (RG1) is the
ratio of the number of (group-5) [group-4] (group-1) limit orders to that of all non-marketable
limit orders from groups 4 to 1.

37
Order
aggressiveness
Number of submitted orders Order cancelation ratio
ALL FIs DIs IIs ALL FIs DIs IIs
Panel A. Buy orders for large-cap stocks
Marketable
5 (Most agg.) 207667 32791 9089 165787 0.060 0.080 0.044 0.057
Non-marketable
4 107191 25531 4092 77568 0.282 0.448 0.253 0.227
3 39902 3974 1227 34701 0.341 0.663 0.309 0.301
2 35197 1601 736 32860 0.308 0.588 0.287 0.291
1 (Least agg.) 59212 1012 786 57414 0.216 0.402 0.235 0.211
WEIGHT 0.145 0.035 0.820
RG5 1.021 1.329 0.819
RG4 0.795 0.598 0.383
RG1 0.032 0.115 0.283
Panel B. Sell orders for large-cap stocks
Marketable
5 (Most agg.) 199023 33661 8690 156672 0.051 0.082 0.046 0.044
Non-marketable
4 88822 24959 3438 60425 0.318 0.465 0.280 0.255
3 33373 4005 1051 28317 0.370 0.679 0.331 0.321
2 35087 1710 721 32656 0.325 0.610 0.288 0.304
1 (Least agg.) 83160 1132 1106 80922 0.215 0.423 0.194 0.211
WEIGHT 0.149 0.034 0.817
RG5 1.058 1.376 0.774
RG4 0.785 0.544 0.299
RG1 0.036 0.175 0.400
Panel C. Buy orders for small-cap stocks
Marketable
5 (Most agg.) 73367 3489 2239 67639 0.066 0.099 0.069 0.065
Non-marketable
4 33583 2661 1015 29907 0.238 0.435 0.235 0.219
3 17190 719 472 15999 0.307 0.596 0.258 0.293
2 15056 337 309 14410 0.322 0.613 0.244 0.314
1 (Least agg.) 22066 152 224 21690 0.236 0.508 0.260 0.233
WEIGHT 0.046 0.026 0.928
RG5 0.902 1.108 0.825
RG4 0.073 0.091 0.121
RG1 0.039 0.111 0.264
Panel D. Sell orders for small-cap stocks
Marketable
5 (Most agg.) 72511 3951 2444 66116 0.051 0.103 0.058 0.048
Non-marketable
4 27576 2801 937 23838 0.283 0.476 0.277 0.254
3 13783 833 401 12549 0.340 0.627 0.295 0.314
2 14673 517 299 13857 0.334 0.621 0.254 0.315
1 (Least agg.) 35488 238 342 34908 0.236 0.475 0.206 0.232
WEIGHT 0.051 0.027 0.922
RG5 0.900 1.235 0.776
RG4 0.075 0.085 0.095
RG1 0.054 0.173 0.410
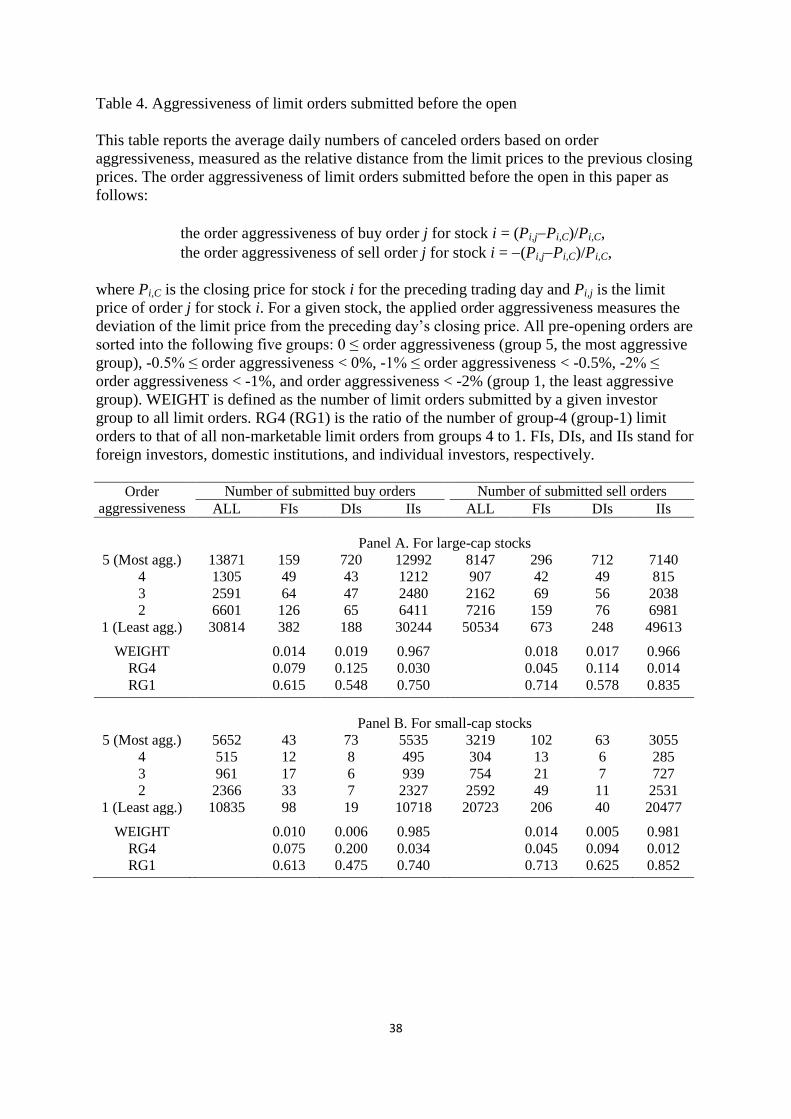
38
Table 4. Aggressiveness of limit orders submitted before the open
This table reports the average daily numbers of canceled orders based on order
aggressiveness, measured as the relative distance from the limit prices to the previous closing
prices. The order aggressiveness of limit orders submitted before the open in this paper as
follows:
the order aggressiveness of buy order j for stock i = (Pi,jPi,C)/Pi,C,
the order aggressiveness of sell order j for stock i = (Pi,jPi,C)/Pi,C,
where Pi,C is the closing price for stock i for the preceding trading day and Pi,j is the limit
price of order j for stock i. For a given stock, the applied order aggressiveness measures the
deviation of the limit price from the preceding day’s closing price. All pre-opening orders are
sorted into the following five groups: 0 ≤ order aggressiveness (group 5, the most aggressive
group), -0.5% ≤ order aggressiveness < 0%, -1% ≤ order aggressiveness < -0.5%, -2% ≤
order aggressiveness < -1%, and order aggressiveness < -2% (group 1, the least aggressive
group). WEIGHT is defined as the number of limit orders submitted by a given investor
group to all limit orders. RG4 (RG1) is the ratio of the number of group-4 (group-1) limit
orders to that of all non-marketable limit orders from groups 4 to 1. FIs, DIs, and IIs stand for
foreign investors, domestic institutions, and individual investors, respectively.
Order
aggressiveness
Number of submitted buy orders Number of submitted sell orders
ALL FIs DIs IIs ALL FIs DIs IIs
Panel A. For large-cap stocks
5 (Most agg.) 13871 159 720 12992 8147 296 712 7140
4 1305 49 43 1212 907 42 49 815
3 2591 64 47 2480 2162 69 56 2038
2 6601 126 65 6411 7216 159 76 6981
1 (Least agg.) 30814 382 188 30244 50534 673 248 49613
WEIGHT 0.014 0.019 0.967 0.018 0.017 0.966
RG4 0.079 0.125 0.030 0.045 0.114 0.014 RG1 0.615 0.548 0.750 0.714 0.578 0.835
Panel B. For small-cap stocks
5 (Most agg.) 5652 43 73 5535 3219 102 63 3055
4 515 12 8 495 304 13 6 285
3 961 17 6 939 754 21 7 727
2 2366 33 7 2327 2592 49 11 2531
1 (Least agg.) 10835 98 19 10718 20723 206 40 20477
WEIGHT 0.010 0.006 0.985 0.014 0.005 0.981
RG4 0.075 0.200 0.034 0.045 0.094 0.012 RG1 0.613 0.475 0.740 0.713 0.625 0.852

39
Table 5. Canceled orders with different price priorities at cancelation
This table reports the ratios of canceled orders with different price priorities by the three
groups of investors. The order cancelation ratio is defined as the number of canceled limit
orders by a given investor group in each priority group to the number of submitted limit
orders by the same investor group. The price priority measures the relative distance from the
concurrent stock price associated with a given buy (sell) order to the concurrent best bid (ask).
The specific definitions are as follows:
the price priority of canceled buy order j for stock i = (Pi,jPi,j,bid,c)/Pi,j,bid,c,
the price priority of canceled sell order j for stock i = (Pi,j,ask,cPi,j)/Pi,j,ask,c,
where Pi,j,ask,c (Pi,j,bid,c) is the concurrent best (ask) ask price of canceled buy (sell) order j for
stock i, and Pi,j is the limit price of canceled order j for stock i. All canceled buy and sell
orders are separately grouped into six groups, from high to low, based on price priority:
0 price priority > -0.2% (group 6),
-0.2% price priority > -0.4%,
-0.4% price priority > -0.6%,
-0.6% price priority > -0.8%,
-0.8% price priority > -1%,
-1% price priority (group 1).
The average cancelation ratios are calculated separately for buy and sell orders for all limit
orders in each priority group by each group of investors over all stocks. FIs, DIs, and IIs
stand for foreign investors, domestic institutions, and individual investors, respectively.
Price priority Buy order cancelation ratio Sell order cancelation ratio
ALL FIs DIs IIs ALL FIs DIs IIs
Panel A. Large-cap stocks
High 0.318 0.513 0.298 0.263 0.290 0.508 0.277 0.225
5 0.150 0.194 0.148 0.137 0.137 0.188 0.140 0.120
4 0.102 0.110 0.105 0.098 0.095 0.108 0.102 0.089
3 0.068 0.054 0.078 0.070 0.065 0.056 0.077 0.066
2 0.054 0.035 0.063 0.059 0.053 0.037 0.064 0.057
Low 0.308 0.094 0.309 0.372 0.360 0.103 0.340 0.443
Panel B. Small-cap stocks
High 0.276 0.486 0.266 0.259 0.238 0.476 0.243 0.214
5 0.132 0.179 0.132 0.128 0.116 0.174 0.126 0.110
4 0.101 0.112 0.101 0.099 0.091 0.109 0.099 0.087
3 0.071 0.061 0.077 0.071 0.067 0.062 0.076 0.065
2 0.061 0.040 0.066 0.062 0.059 0.045 0.069 0.059
Low 0.360 0.122 0.358 0.382 0.430 0.136 0.387 0.465

40
Table 6. Tobit regressions
This table presents the cross-sectional regression results of the Tobit model for each of the three
investor groups as follows:
, ,
17
1
,1,11,,,,10,1,9,
1,8,17,16,
1,5,1,4,1,3,,2,,1,0,,
ti
n
nnitiimdtiitii
tiititi
tiitiitiitiitiiiti
INTERORDERSIZEAVOLUASKDEPTH
BIDDEPTHMARKETVOLMARKETRET
VOLRSPREADRETURNCALLPUTCANCEL
where CANCELi,t is the cancelation ratio defined as the number of canceled orders for stock i by the
given investor group over 15-minute interval t to the number of submitted limit orders by the same
investor group over that trading day. PUT i,t (CALL i,t), the free option value of the buy (sell) limit
orders or the cost of non-execution of the sell (buy) limit orders, is defined as:
PUTi,t = max(ai,t min(pi,t+1), 0), CALLi,t = max(max(pi,t+1) bi,t, 0),
where ai,t (bi,t) are the best ask (bid) for stock i at the end of interval t, and pi,t+1 is the quote midpoint
at the end of interval t+1. RSPREADi,t-1 is the average 15 minute-by-minute snapshots of the relative
spread for stock i over interval t-1. VOLi,t-1 is the standard deviation of the minute-by-minute
snapshots of the midquote over interval t-1, and MARKETVOLt-1 is the standard deviation of 15
minute-by-minute snapshots of the market index over interval t-1. RETURNi,t-1 and MARKETRETt-1
are the log changes in stock i’s midquote and market index over interval t-1, respectively. The rates of
changes in depths on the bid and ask sides are defined as follows:
,1 ,12,
1,
1,
2,
1,
1,
2,1,2,1,
a
ti
Aa
a
ti
tib
ti
Bb
b
ti
tiQ
QASKDEPTH
Q
QBIDDEPTH titititi
where Bi,t-2 (Ai,t-2) denotes the best bid (ask) price at the end of interval t. b
tiQ 1, ( a
tiQ 1, ) denotes the
depths in thousands of shares at price b (a) in the bid (ask) side at the end of interval t-1. The
abnormal trading volume (AVOLUi,t,d,m) is calculated as:
mt
mti
mdt
mdti
mdtiMEMARKETVOLU
VOLUME
MEMARKETVOLU
VOLUMEAVOLU
,
,,
,,
,,,
,,,
where VOLUMEi,t,d,m and MARKETVOLUMEt,d,m are respectively the trading volumes of stock i and
the market over interval t on day d of month m.
mt
mti
MEMARKETVOLU
VOLUME
,
,, is the average trading volume
over intervals t in all trading days of month m. ORDERSIZEi,t-1 is the order size in thousand shares.
INTERn, n = 1, ..., 17, is a dummy variable and takes a value of one, if the cancelation requests are
submitted in the nth interval of a given trading day. For brevity, the coefficients on the interval
dummies are not reported. *,
**, and
*** indicate significance at the 10%, 5%, and 1% levels,
respectively. FIs, DIs, and IIs stand for foreign investors, domestic institutions, and individual
investors, respectively.

41
Independent variable Buys Sells
FIs DIs IIs FIs DIs IIs
Panel A. Large-cap stocks
Constant 0.014***
0.028***
0.013***
0.014***
0.023***
0.019***
PUTi,t/100 0.289***
0.148 0.036 0.254***
0.214***
0.168***
CALLi,t/100
0.276***
0.121* 0.083
*** 0.427
*** 0.335
*** -0.158
***
RETRUNi,t-1 0.073***
0.189***
0.067***
0.021 -0.072***
0.051***
RSPREADi,t-1 0.827***
0.242***
0.250***
0.845***
0.230***
0.317***
VOLi,t-1 0.006***
0.011***
0.013***
0.008***
0.012***
0.013***
MARKETRETt-1 0.221***
0.039***
-0.066***
-0.057***
0.139***
-0.001
MARKETVOLt-1/100
0.163***
0.048***
0.063***
0.206***
0.068***
0.089***
BIDDEPTHi,Δt-1/10000
0.188***
0.157***
0.044 -0.130***
-0.081***
0.041***
ASKDEPTHi,Δt-1/10000
-0.115***
-0.099***
0.012 0.120 0.069 0.039
AVOLUi,t,d,m 2.441***
2.217***
2.188***
2.072***
2.600***
2.335***
ORDERSIZEi,t-1/10000 0.020 **
0.008***
0.009***
0.025***
0.011***
-0.002*
Panel B. Small-cap stocks
Constant 0.012***
0.015***
0.012***
0.010***
0.012***
0.018***
PUTi,t/100 0.341***
0.269***
-0.008 0.510***
0.287***
0.175***
CALLi,t/100
0.445***
0.300***
-0.002 0.461***
0.449***
-0.159***
RETRUNi,t-1 0.045***
0.121***
0.066***
0.079***
-0.042***
0.032***
RSPREADi,t-1 0.413***
0.107* 0.279
*** 0.570
*** 0.058 0.249
***
VOLi,t-1 0.021***
0.011***
0.012***
0.022***
0.014***
0.015***
MARKETRETt-1 0.370***
0.055***
-0.072***
-0.090***
0.122***
-0.016***
MARKETVOLt-1/100
0.168***
0.054***
0.073***
0.188***
0.055***
0.088***
BIDDEPTHi,Δt-1/10000
0.168***
0.114***
0.203***
-0.045 -0.067**
0.075***
ASKDEPTHi,Δt-1/10000
-0.132**
-0.084***
-0.009 0.233***
0.242***
0.147***
AVOLUi,t,d,m 2.749***
3.587***
2.905***
2.895***
3.664***
3.218***
ORDERSIZEi,t-1/10000 0.149***
0.031***
0.007***
0.202***
0.032***
0.000

42
Table 7. Tobit regressions with an additional dummy for the year 2008
This table presents the cross-sectional regression results of the Tobit model for each of the three
investor groups as follows:
, )()()(
)()()(
)()()(
)()()(
,
17
1
,1,11,10,
1,9,1,8,17,
16,1,5,1,4,
1,3,,2,,1,
17
1
,1,11,,,,10,
1,9,1,8,17,16,
1,5,1,4,1,3,,2,,1,0,,
ti
n
nnitiiti
tiitiiti
titiitii
tiitiitiii
n
nnitiimdtii
tiitiititi
tiitiitiitiitiiiti
INTERDORDERSIZEDAVOLUD
ASKDEPTHDBIDDEPTHDMARKETVOLD
MARKETRETDVOLDRSPREADD
RETURNDCALLDPUTDD
INTERORDERSIZEAVOLU
ASKDEPTHBIDDEPTHMARKETVOLMARKETRET
VOLRSPREADRETURNCALLPUTCANCEL
where D is a dummy variable and takes a value of one, if interval t is in 2008, and zero otherwise.
Other variables’ definitions are identical to those described in Table 7. For brevity, only the
coefficients on the interaction terms (δi,n , n = 1, …, 11) are reported. *,
**, and
*** indicate significance
at the 10%, 5%, and 1% levels, respectively. FIs, DIs, and IIs stand for foreign investors, domestic
institutions, and individual investors, respectively.
Independent variable Buys Sells
FIs DIs IIs FIs DIs IIs
Panel A. Large-cap stocks
DPUTi,t/100 0.441***
0.596***
0.087***
0.361***
0.477***
0.026
DCALL i,t/100 0.532
*** 0.479
*** 0.158
*** 0.354
*** 0.800
*** 0.021
DRETRUN i,t-1 0.053***
0.066***
0.000 0.145***
0.151***
0.049***
DRSPREAD i,t-1 0.705***
0.775***
0.224***
0.905***
0.839***
0.096
DVOL i,t-1 0.018***
0.017***
0.007***
0.021***
0.021***
0.007***
DMARKETRETt-1 0.178***
0.173***
0.077***
0.228***
0.274***
0.094***
DMARKETVOLt-1/100 0.058
*** 0.097
*** -0.007 0.021
* 0.095
*** -0.026
***
DBIDDEPTH i,Δ t-1/10000 -0.055 0.030 -0.027 0.070 -0.023 0.011
DASKDEPTH i,Δt-1/10000 0.007 -0.006 -0.117 0.279 0.308
* -0.019
DAVOLUi,t,d,m 0.829* 1.246
*** 0.478
* 0.583 1.194
*** 0.735
***
DORDERSIZE i,t-1/10000 0.066* 0.004
** -0.006
*** 0.035 0.005
*** -0.019
***
Panel B. Small-cap stocks
DPUTi,t/100 0.771***
0.523***
0.064**
0.785***
0.478***
0.120***
DCALL i,t/100 0.724
*** 0.617
*** 0.089
*** 0.571
*** 0.508
*** 0.081
**
DRETRUN i,t-1 0.245***
0.049***
0.006 0.072***
0.151***
0.050***
DRSPREAD i,t-1 0.327***
0.340***
0.117***
0.824***
0.466***
0.107***
DVOL i,t-1 0.018***
0.018***
0.006***
0.010***
0.018***
0.006***
DMARKETRETt-1 0.148***
0.196***
0.077***
0.265***
0.162***
0.095***
DMARKETVOLt-1/100 0.098
*** 0.059
*** -0.001 0.027
* 0.078
*** -0.015
***
DBIDDEPTH i,Δt-1/10000 0.151
* 0.138
** 0.030 -0.151 -0.054 0.003
DASKDEPTH i,Δt-1/10000 0.042 0.044 -0.007 0.094 0.033 0.083
**
D AVOLUi,t,d,m 2.892***
1.929***
1.676***
4.488***
3.399***
2.631***
DORDERSIZE i,t-1/10000 0.361***
0.019***
-0.013***
0.171***
0.024***
-0.020***
Related Documents