INTRODUCTION The vertebrate central nervous system is the product of inductive interactions between the ectoderm and mesoderm. The patterning of the neurectoderm is thought to be a pro- gressive process. At the end of gastrulation, anteroposterior and dorsoventral axes of the neurectoderm are organized in broad domains that can be defined morphologically and mole- cularly. These are further refined as neurulation proceeds, as evident, for example, in the formation of rhombomeres (Keynes and Lumsden, 1990), and the acquisition of dorsal and ventral neural tube fates (Ruiz i Altaba and Jessel, 1993). Any detailed investigation of the regional patterning of the neural plate requires knowledge of the positions of various primordia of the CNS before, during and after the process. Such infor- mation is contained in fate maps. These depict, at a specific developmental stage, what the different regions of an embryo will become during normal development (Slack, 1991). Fate maps of different vertebrates have been invaluable in aiding the design of grafting and explant experiments, as well as the interpretation of molecular markers (for example, chick: Couly and Le Douarin, 1988; mouse: Lawson et al., 1991; Xenopus: Eagleson and Harris, 1990; fish: Oppenheimer, 1947; Ballard, 1973; Kimmel et al., 1990). A series of fate maps for different stages may also provide information about the cell and tissue rearrangements of gastrulation and neurulation (Keller, 1975; Keller, 1976; Lawson et al., 1991; Selleck and Stern, 1991). The zebrafish (Danio rerio; formerly known as Brachydanio rerio) provides several unique characteristics suitable for the study of vertebrate neural-induction and -patterning mecha- nisms. Its optical transparency permits direct observations of tissue movements, cell behaviors, and cell interactions during neurogenesis (Warga and Kimmel, 1990; Kimmel et al., 1994). Its amenability to genetic analysis has already resulted in the isolation of a variety of mutants (Mullins et al., 1994; Driever et al., 1994) that will be powerful tools for examining devel- opmental mechanisms. At present, the results of experimental studies and developmental mutants must be interpreted with reference to Xenopus, in which most modern studies of neural induction and axis formation have been performed (reviewed in Kessel and Melton, 1994; Donaich, 1993; Ruiz-i-Altaba, 1993; Slack and Tannahill, 1992). While the expression patterns of a variety of gene homologues suggest similarities in the components of the neural-patterning machinery of Xenopus, zebrafish, and other vertebrates, it is unclear if the analogy can be extended to the workings of this machinery. For example, there are clear differences in the early cellular dynamics between species: in Xenopus, blastomeres change neighbors slowly during cleavage and blastula stages (Wetts and Fraser, 1989); in zebrafish, cell mixing has an earlier onset and is more dramatic (Kimmel and Law, 1985; Warga and Kimmel, 1990; Helde et al., 1994). Such differences might require the operation of distinct signaling mechanisms to pattern the embryo. Furthermore, significant differences exist 2595 Development 121, 2595-2609 (1995) Printed in Great Britain © The Company of Biologists Limited 1995 The zebrafish is an excellent vertebrate model for the study of the cellular interactions underlying the patterning and the morphogenesis of the nervous system. Here, we report regional fate maps of the zebrafish anterior nervous system at two key stages of neural development: the beginning (6 hours) and the end (10 hours) of gastrulation. Early in gas- trulation, we find that the presumptive neurectoderm displays a predictable organization that reflects the future anteroposterior and dorsoventral order of the central nervous system. The precursors of the major brain subdi- visions (forebrain, midbrain, hindbrain, neural retina) occupy discernible, though overlapping, domains within the dorsal blastoderm at 6 hours. As gastrulation proceeds, these domains are rearranged such that the basic order of the neural tube is evident at 10 hours. Furthermore, the anteroposterior and dorsoventral order of the progenitors is refined and becomes aligned with the primary axes of the embryo. Time-lapse video microscopy shows that the rearrangement of blastoderm cells during gastrulation is highly ordered. Cells near the dorsal midline at 6 hours, primarily forebrain progenitors, display anterior-directed migration. Cells more laterally positioned, corresponding to midbrain and hindbrain progenitors, converge at the midline prior to anteriorward migration. These results demonstrate a predictable order in the presumptive neurectoderm, suggesting that patterning interactions may be well underway by early gastrulation. The fate maps provide the basis for further analyses of the specification, induction and patterning of the anterior nervous system, as well as for the interpretation of mutant phenotypes and gene-expression patterns. Key words: Danio rerio, fate map, neural patterning, morphogenetic movements, retina, dye microinjection, gastrulation SUMMARY Order and coherence in the fate map of the zebrafish nervous system Katherine Woo and Scott E. Fraser Division of Biology, Beckman Institute (139-74), California Institute of Technology, Pasadena, Ca. 91125, USA

Welcome message from author
This document is posted to help you gain knowledge. Please leave a comment to let me know what you think about it! Share it to your friends and learn new things together.
Transcript
INTRODUCTION
The vertebrate central nervous system is the product ofinductive interactions between the ectoderm and mesoderm.The patterning of the neurectoderm is thought to be a pro-gressive process. At the end of gastrulation, anteroposteriorand dorsoventral axes of the neurectoderm are organized inbroad domains that can be defined morphologically and mole-cularly. These are further refined as neurulation proceeds, asevident, for example, in the formation of rhombomeres(Keynes and Lumsden, 1990), and the acquisition of dorsal andventral neural tube fates (Ruiz i Altaba and Jessel, 1993). Anydetailed investigation of the regional patterning of the neuralplate requires knowledge of the positions of various primordiaof the CNS before, during and after the process. Such infor-mation is contained in fate maps. These depict, at a specificdevelopmental stage, what the different regions of an embryowill become during normal development (Slack, 1991). Fatemaps of different vertebrates have been invaluable in aidingthe design of grafting and explant experiments, as well as theinterpretation of molecular markers (for example, chick: Coulyand Le Douarin, 1988; mouse: Lawson et al., 1991; Xenopus:Eagleson and Harris, 1990; fish: Oppenheimer, 1947; Ballard,1973; Kimmel et al., 1990). A series of fate maps for differentstages may also provide information about the cell and tissuerearrangements of gastrulation and neurulation (Keller, 1975;Keller, 1976; Lawson et al., 1991; Selleck and Stern, 1991).
The zebrafish (Danio rerio; formerly known as Brachydaniorerio) provides several unique characteristics suitable for thestudy of vertebrate neural-induction and -patterning mecha-nisms. Its optical transparency permits direct observations oftissue movements, cell behaviors, and cell interactions duringneurogenesis (Warga and Kimmel, 1990; Kimmel et al., 1994).Its amenability to genetic analysis has already resulted in theisolation of a variety of mutants (Mullins et al., 1994; Drieveret al., 1994) that will be powerful tools for examining devel-opmental mechanisms. At present, the results of experimentalstudies and developmental mutants must be interpreted withreference to Xenopus, in which most modern studies of neuralinduction and axis formation have been performed (reviewedin Kessel and Melton, 1994; Donaich, 1993; Ruiz-i-Altaba,1993; Slack and Tannahill, 1992). While the expressionpatterns of a variety of gene homologues suggest similaritiesin the components of the neural-patterning machinery ofXenopus, zebrafish, and other vertebrates, it is unclear if theanalogy can be extended to the workings of this machinery.For example, there are clear differences in the early cellulardynamics between species: in Xenopus, blastomeres changeneighbors slowly during cleavage and blastula stages (Wettsand Fraser, 1989); in zebrafish, cell mixing has an earlier onsetand is more dramatic (Kimmel and Law, 1985; Warga andKimmel, 1990; Helde et al., 1994). Such differences mightrequire the operation of distinct signaling mechanisms topattern the embryo. Furthermore, significant differences exist
2595Development 121, 2595-2609 (1995)Printed in Great Britain © The Company of Biologists Limited 1995
The zebrafish is an excellent vertebrate model for the studyof the cellular interactions underlying the patterning andthe morphogenesis of the nervous system. Here, we reportregional fate maps of the zebrafish anterior nervous systemat two key stages of neural development: the beginning (6hours) and the end (10 hours) of gastrulation. Early in gas-trulation, we find that the presumptive neurectodermdisplays a predictable organization that reflects the futureanteroposterior and dorsoventral order of the centralnervous system. The precursors of the major brain subdi-visions (forebrain, midbrain, hindbrain, neural retina)occupy discernible, though overlapping, domains withinthe dorsal blastoderm at 6 hours. As gastrulation proceeds,these domains are rearranged such that the basic order ofthe neural tube is evident at 10 hours. Furthermore, theanteroposterior and dorsoventral order of the progenitorsis refined and becomes aligned with the primary axes of the
embryo. Time-lapse video microscopy shows that therearrangement of blastoderm cells during gastrulation ishighly ordered. Cells near the dorsal midline at 6 hours,primarily forebrain progenitors, display anterior-directedmigration. Cells more laterally positioned, correspondingto midbrain and hindbrain progenitors, converge at themidline prior to anteriorward migration. These resultsdemonstrate a predictable order in the presumptiveneurectoderm, suggesting that patterning interactions maybe well underway by early gastrulation. The fate mapsprovide the basis for further analyses of the specification,induction and patterning of the anterior nervous system, aswell as for the interpretation of mutant phenotypes andgene-expression patterns.
Key words: Danio rerio, fate map, neural patterning, morphogeneticmovements, retina, dye microinjection, gastrulation
SUMMARY
Order and coherence in the fate map of the zebrafish nervous system
Katherine Woo and Scott E. Fraser
Division of Biology, Beckman Institute (139-74), California Institute of Technology, Pasadena, Ca. 91125, USA

2596
in tissue distribution within their respective organizer regions.For example, in Xenopus, the organizer (dorsal lip) containsprecursors of only mesodermal (notochord, somite) and endo-dermal tissues (Keller, 1975, 1976); in zebrafish, recentevidence suggests that the organizer (shield) encompasses anintermixed group of mesodermal, endodermal and neural pre-cursors (Shih and Fraser, 1995). Thus, the results of experi-mental studies and the phenotypes of mutants cannot be inter-preted solely by analogy with data from Xenopus; instead, adetailed description of the zebrafish neural fate map isrequired.
In this study, we present detailed regional neural fate mapsof the zebrafish at the beginning and end of gastrulation (6hours and 10 hours of development, respectively, both keystages in zebrafish neurogenesis), and use video time-lapsemicroscopy to observe directly the cell rearrangements thattransform one fate map to the other. Gastrulation begins at 50%epiboly (about 5.2 hours); by 6 hours, the embryonic shield hasbecome morphologically pronounced, enabling unambiguousidentification of ‘dorsal’ (staging table in Westerfield, 1994).At 10 hours, the epiblast of the zebrafish embryo completelycovers the yolk, marking the end of gastrulation (Westerfield,1994). In the period between 6 and 10 hours of development,several genes implicated in embryonic patterning andsignaling, such as goosecoid (Stachel et al., 1993; Schulte-Merker et al., 1994), axial (Strahle et al., 1993), hedgehog(Krauss et al., 1993) and the rtk genes (Xu et al., 1994), initiatetheir expression in the dorsal side of the embryo. Although thepresumptive neurectoderm appears outwardly homogeneous atthese stages, genes believed to play roles in anteroposteriorpatterning including pax6 (Krauss et al., 1991; Puschel et al.,1992), engrailed (Hatta et al., 1991a), and Krox20 (Oxtoby andJowett, 1993) display regionally restricted expression patterns.As such findings suggest that events critical to the patterningof the neurectoderm take place between 6 and 10 hours, aknowledge of the neural fate maps and relevant cellmovements at these times is a critical first step towards under-standing the formation of the zebrafish nervous system.
MATERIALS AND METHODS
Embryos and stagingZebrafish (Danio rerio) were maintained and handled essentiallyaccording to procedures described in the Zebrafish Book (Westerfield,1994). Embryos were obtained by natural spawning. Staging wasperformed by morphology (Westerfield, 1994). Stages were expressedas hours postfertilization at 28.5°C (h). In general, cell labeling wasperformed at either 6 or 10 hours (h), and scoring of regional fatebetween 19-36 hours.
Cell labelingFor the 6h fate map, we labeled cells between the ‘early-shield stage,’defined as the earliest time at which the shield is visible, about 5.5h(Shih and Fraser, 1995), and the ‘shield stage’ (at 6h). The positionsof the labeled cells were assessed at 6h. Between 5.5h and 6h, cellmovement is minimal in the outer layer of the ectoderm (Shih andFraser, 1995). Embryos were dechorionated with watchmaker forcepsat the germ-ring stage, approximately 5.2h. Using a hair loop, embryoswere oriented (typically animal pole up) on a thin layer of 3% methyl-cellulose in 30% Danieau solution (full-strength Danieau solution is amodified Niu-Twitty solution with double the normal CaCl2 concen-tration; Shih and Fraser, 1995).
Single cells were injected iontophoretically with either 3×10³ Mrfluorescein dextran or 3×10³ Mr rhodamine dextran (Molecular ProbesD-3306 and D-3308). To reduce toxicity, these dyes were cleaned ofimpurities with a 3×10³ Mr size-exclusion HPLC column. Ion-tophoretic injections were performed essentially as described previ-ously (Wetts and Fraser, 1988). Micropipettes, pulled from AlSi thin-walled capillaries (A-M systems), were filled at their tips with afluorescent dextran solution (about 100 mg/ml) and then back-filledwith 1.2 M LiCl. Injection was accomplished by passing a positivecurrent of 4-5 nA for 3-10 seconds. Each injection was immediatelyverified by viewing the embryo under epi-fluorescence optics.
The dye injections were made into the cells that the pipette firstencountered in the blastoderm, as judged by the membrane potentialrecorded through the pipette. Thus, even though the deep cell layer ofthe 6h embryo is between 3-4 cells thick at the animal pole (5-6 cellsthick close to the germ ring), most injections were within its outermost1-2 cells. The injections were intended to label single cells; however,occasionally 2 or 3 closely placed cells were labeled after a singleinjection, presumably due to cytoplasmic bridges among cells. At thetime of initial scoring, animals containing florescent debris or labeledperiderm were discarded. Those containing 1-3 distinctly labeled cellswere kept for later analysis.
The 10h fate map data were collected using two differentapproaches: in the first, we targeted our injections into particularregions at 6h, scored the positions of labeled cells immediately, andthen re-scored the same embryo at 10h. This enabled us to comparethe relative positions of a labeled cell at 6h and its progeny at 10h. Inthe second, we labeled cells at 10h and scored cell position immedi-ately. These two approaches gave essentially identical fate maps, sothey were combined in the final map presented here.
Since injections were performed on either the left or right sides ofthe embryos, we examined the assumption of left-right symmetry inthe 6h embryo. We calculated the percentage of each tissue-fateobtained from injections to either the left or the right side. The twosides displayed nearly identical tissue-fate distributions. (Data notshown.) This assures us that the assumption of left-right symmetry isvalid for this study; therefore, all fate maps are presented by reflect-ing each point across the midline.
Video imagingObservation and documentation were performed with a ZeissAxioplan epifluorescence microscope equipped with a light-intensi-fying camera (Hamamatsu SIT C2400), and an image processor(Imaging Technology 151) controlled by the VidIm software package(Belford, Stollberg and Fraser, unpublished data). Light exposure tothe labeled cells was minimized by using computer-controlled elec-tronic shutters and neutral-density filters in the epi-illuminationpathway (OD = 1.0 to 2.5). Each recorded image was collected byaveraging 8-32 frames. All data were recorded onto optical disc(Panasonic optical disc recorder, OMDR 3038). Adobe Photoshopwas used to enhance contrast of and apply labels to images presentedin this paper.
Documentation of cell positionImmediately after each injection session, the positions of the injectedcells were recorded. Because the accuracy of the fate maps is criti-cally dependent on the precision with which we can identify thelocation of each injected cell, we took particular care to ensure thatthe embryos were properly oriented before being documented byvideo microscopy. For the 6h scoring, we first recorded an animal-pole view. The embryo was oriented so that the germ ring appearedto have the same ‘thickness’ around its circumference; this ensuredthat the animal pole was uppermost (see Fig. 1A). We then docu-mented the positions of the cells in profile by rotating the embryo 90°about its dorsal-ventral axis until half of the shield was visible on oneside. An acceptable profile view was attained when the edge of theblastoderm was oriented perpendicular to the microscope slide; this
K. Woo and S. E. Fraser
2597Zebrafish neural fate maps
can be assessed by focusing at the upper and lower surfaces of theembryo. An example of a typical profile view is shown in Fig. 1B.
For the 10h scoring, we again recorded the animal-pole view first.Since no significant structure existed in the epiblast at this stage, weutilized features in the underlying hypoblast for orientation. Wecentered the dorsal midline by locating the crescent shape formed bythe advancing hypoblast (white arc in Fig. 1C) and the thickening ofthe forming notochord (arrowheads in Fig. 1C). Thereafter, for theprofile-view documentation, we rotated the embryo about its d-v axisuntil the base of the embryo appeared straight, and half of the neuralaxis was visible on one side (for example, see Fig. 1D).
After initial documentation, embryos were raised individually inmulti-well culture plates until 19-36h of development, when eachembryo was examined in several views (side, ventral, top and head-on, using objectives up to 40×) to ensure correct identification of thepositions of all labeled progeny. Occasionally, when a cell was in aparticularly interesting region or was located at or between a boundaryof tissues, a second screening was performed at a later time to betterdefine the labeled cell’s location.
Map construction and data representationThe positions of injected cells are represented according to thefollowing conventions.
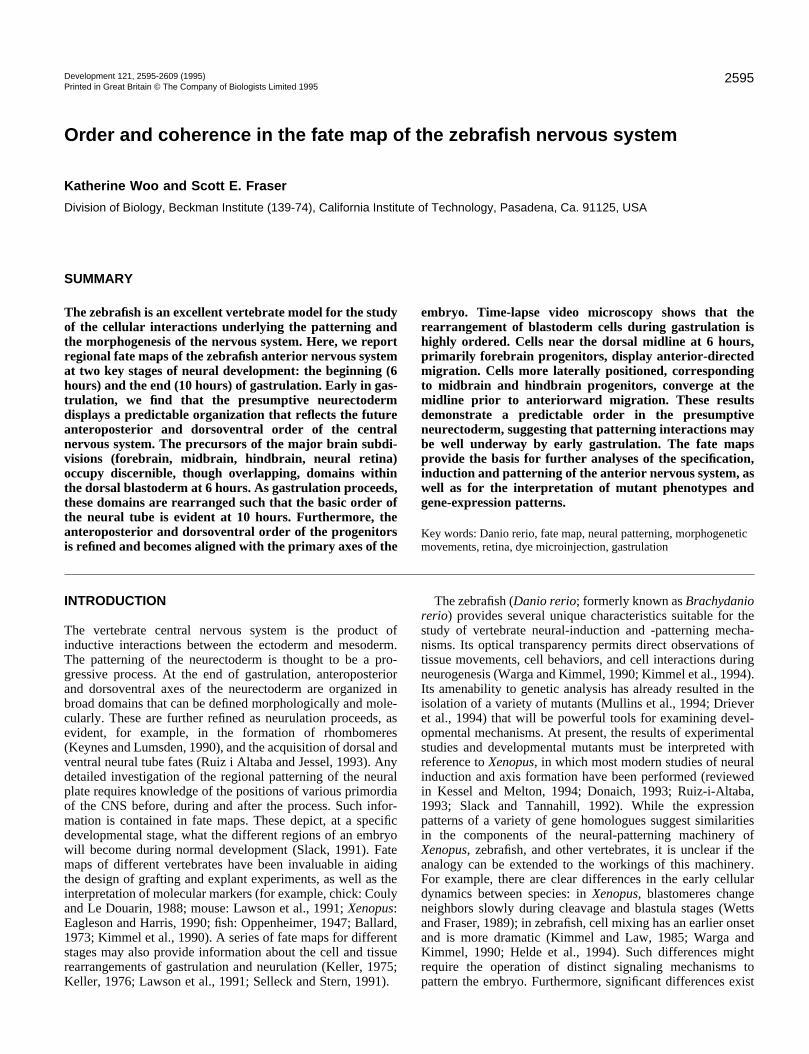
6h animal-pole viewAs illustrated in Fig. 1A, maps were drawn onto apolar coordinate grid, with each concentric circlemarking 10° in latitude and each straight line 10° inlongitude. The center of the embryonic shield wasdefined as 0° longitude, the animal pole defined as90° latitude. In Fig. 1A, the cells were locatedbetween 60°-70° longitude, and 30°-35o latitude.(Due to embryo curvature, 0o-10o latitude is not dis-tinguishable from the top; therefore the outermostline = 0°-10° latitude.)
6h profile viewIn the profile maps (Fig. 1B), each horizontal linerepresented 10° of latitude, and each curved line 10°of longitude. 0° longitude was at the right of eachmap (the location of the shield), and 0° latitude wasthe edge of the blastoderm. The cell in Fig. 1B wasat 10°-20° longitude and 30° latitude. (Again, due toembryo curvature, 0°-10° and 170°-180° longitudeare represented by the same line.)
10h top viewWe defined our coordinate axes by drawing (1) astraight-line tangent to the crescent shape made bythe advancing hypoblast (highlighted by the whitearc), and (2) a line centered on the thickening of theforming notochord (marked by arrows) (Fig. 1C).The intersection of these two lines defined the origin(O) of the coordinate system used to catalog eachcell’s position. As raw data, we measured θ, theangle from the dorsal midline (0°); and r, thedistance from the origin, which was subsequentlyscaled to the average diameter derived from 40randomly selected embryos. Scaling the data in thisway does not affect the spatial relationships amongthe data points, but permits the data for all cases tobe presented on a single diagram. The distancebetween the origin and the edge of the embryo wasdivided into 10 equal units; these are represented bythe arcs in Fig. 1C. (It is important to note that theselines do not represent latitude measurements, and arenot equivalent to those in the 6h map.)
10h profile viewThe coordinate of each labeled cell is defined by h (distance from thebase of the embryo), and w (distance from the dorsal midline) (Fig.1D). To standardize the data from embryos of various profile shapes,we defined a ‘model embryo profile,’ computed using a random setof 40 embryos, and plotted the scaled data from each case on thisstandard profile.
Error estimationBoth top and profile views of the fate maps are presented, sincetogether these two-dimensional views give a more complete repre-sentation of the three-dimensional embryo. The 6h top view providesgood resolution in a large portion of the blastula cap, where most ofthe data points are located. It allows for a better appreciation ofmedial-lateral differences; however, its resolution below 30° latitudeis limited, due mainly to the curvature of the embryo. The profile view(Fig. 1B) complements the top view by providing better resolutionaround the equator region (0°-30° latitude) and accentuating animal-vegetal differences. Its resolution at the pole and its accuracy near theaxis are limited.
We present the top view of the 10h fate map with the origin offcenter (Fig. 1C), since this view permits a larger fraction of the neuralaxis to be represented with good resolution than is possible from apolar view. Beyond seven units from the center, the curvature of theembryo made positions that were in different focal planes appear to
Fig. 1. Zebrafish embryos at the stages of initial documentation. Coordinate gridsused in fate maps are superimposed onto the images of the embryos, in the sameorientation as the fate maps. (A) Animal pole view and (B) profile view of the 6hembryos. In these, longitude is marked every 30°, with the shield (arrow) defined as0°. Latitude is marked every 20°. (C) Top and (D) profile view of the 10h embryos.‘O’ marks the origin of the coordinate system in C and D, which is not the animalpole, but instead the tip of the advancing hypoblast. In C, r is the distance of thelabeled cell from the origin, ‘O’; θ is the angle from the dorsal midline, with degreereading marked at 30° intervals. In D, w is the distance of the labeled cell from thedorsal midline; h is the distance of the labeled cell from the base of the embryo. Thecoordinate (w,h) is used to define the location of the injection in the composite map.

2598
be at the same point on the map, thus affecting the resolution in thisarea. The 10h profile view (Fig. 1D), while giving restricted resolu-tion at the pole, emphasizes animal-vegetal separations between cells,and allows visualization of cells located below mid-embryo that areotherwise unseen from the top.
In the final data set, we tolerated deviations from ‘ideal’ alignmentof up to 5° in profile views, and 5° in top views . During the courseof data analysis, we rejected more than 50 embryos due to badalignment in the initial documentation. With these constraints in mind,we estimated the maximum error in all the position measurements tobe less than 10% of the embryo’s radius. For example, in Fig. 1B, ifthe embryo were to be rotated +5° around its animal-vegetal axis fromits ideal profile position, then the longitude of the labeled cell wouldbe misjudged by about 5o; this translates to about 7% of the embryo’sradius.
Time-lapse video analysisTime-lapse video recordings were made using a SIT camera, asdescribed above, at 26-28°C. All films began at shield stage. Epiblastcells were labeled by 1-4 injections as above, at either 30% epiboly
or shield stage. Embryos injected at 30% epiboly contained 1-4 smallgroups of labeled cells; those labeled at shield stage had several indi-vidual marked cells. A single embryo was placed in a pyramid-shapedwell precut to a thin layer of Sylgard (Corning) at the bottom of aPetri dish filled with 30% Danieau solution. This arrangement keptthe embryo stable, yet permitted it to move freely during morpho-genesis while we recorded the relative movement of labeled cells.Bright-field and fluorescent images were captured simultaneously,usually once every four minutes. Neutral-density filters and the shortlight exposure were used to minimize possible photodamage tolabeled cells. We re-focused periodically, and reoriented the embryoonly when absolutely necessary, since we wanted to observe contin-uous cell movements.
RESULTS
The goal of this study was to investigate in detail the organiz-ation of the zebrafish blastoderm at 6h and 10h of develop-ment. To construct the fate maps, we divided the descendants
K. Woo and S. E. Fraser
Fig. 2. Schematic diagram of the zebrafish CNS at the time of fate-scoring, and examples of labeled cells. (A) The boundary criteria used tocategorize the regional fates are illustrated. (B-I) Examples of labeled cells with relative positions within the tissue indicated in brackets. Thelabeled cells are located in the (B) telencephalon (‘ventral’); (C) diencephalon (‘ventral’); (D) neural retina (‘dorsal temporal’); (E) midbrain(‘posterior, ventral’); (F) hindbrain (‘posterior, ventral’); (G) somite; (H) epidermis and (I) spinal cord (motor) neurons. Scale bar, 100 µm.Abbreviations: T, telencephalon; D, diencephalon; R, retina; M, midbrain; H, hindbrain; SC, spinal cord.

2599Zebrafish neural fate maps
of cells labeled at these times into six categories (Fig. 2): telen-cephalon (T), including the olfactory placode; diencephalon(D), excluding the neural retina; retina (R); midbrain (M);hindbrain (H); and other (O), including spinal cord neurons andsuch non-neural-tube derivatives as somite, neural crest, andepidermal (including placodal) derivatives. We identifiedputative neural crest cells by their distinctive morphology ofmigrating cells, and by their locations, such as within abranchial arch. We included the olfactory placode in the telen-cephalon category because it is too closely associated with thebrain proper at the time of scoring to be distinguished reliably.
Table 1 shows the composition of our data. A total of 224individual embryos were used to construct the 6h fate map; anoverlapping set of 137 embryos was included for the 10h map.As discussed in Materials and Methods, although we aimed toinject only one cell per embryo, in some instances two or moreneighboring cells were labeled. Since the goal of this study wasa fate map rather than a clonal analysis, we included embryosbearing two or more closely placed labeled cells. It does notappear that the inclusion of these cases blurs the fate mapborders. In support of this, Table 2 lists the percentage ofembryos with labeled descendants in a single brain region,analyzed with respect to the number of cells initially labeled.The majority of the embryos have labeled cells in only oneregion, even when 3 or more cells were injected. At 10h, thenumber of injections yielding a single regional fate appears tobe slightly increased. The data in Table 2 suggest that there areregions of fate homogeneity (i.e., single-fate domains) withinthe dorsal blastoderm as early as 6h, because neighboring cellstend to give rise to the same regional fate; and that theseregions undergo some refinement in organization during gas-trulation. The fate maps presented below explore the topo-graphic nature of this blastoderm organization.
The 6h neural fate map At 6h of development, the dorsal side becomes morphologi-cally distinct with the appearance of the embryonic shield. Figs3 and 4 show the neural fate map at 6h, in animal-pole andprofile views, respectively. The progenitors of the differentbrain regions, represented by different colors, appearsomewhat intermixed, especially in profile view. For example,progenitors of telencephalon (red), diencephalon (black), retina(green), and midbrain (orange) can all be found within the areaat 55°-65° latitude and 30°-70° longitude (Figs 3 and 4, top).
On closer examination, a significant order becomes apparentin the form of domains that give rise to only one brain region.For example, in the top view (Fig. 3), the domain between ±20°longitude and 65°-80° latitude is almost entirely occupied byretinal precursors (green); whereas, in the region further fromthe pole, at 40°-50° latitude, only diencephalic precursors(black) are seen. In the profile map (Fig 4), between 70°-90°longitude, a pure hindbrain domain is located at 20°-40°latitude. At the dorsal midline, the map shows orderly overlapsbetween telencephalic and retinal precursors, diencephalic andretinal precursors, and diencephalic and midbrain precursorsnear 80°, 60°, and 30° latitude, respectively (Fig. 3, top).Overlaps of more than two sub-regions (more than two colors)appear to be confined to the region of 40°-70° longitude.
Plotting the progenitors of each brain region separately (Figs3 and 4, bottom panels) permits a more detailed evaluation ofthe fate map. From the profile views (Fig. 4), one can see thatforebrain precursors are located closer to the animal pole, whilemidbrain and hindbrain precursors are found progressivelycloser to the margin, as reported previously (Kimmel et al.,1990). However, the coherence of each brain sub-region hasnot been appreciated previously (Figs 3 and 4, bottom panel).For example, in the top view, 90% of telencephalic progeni-tors are found within 20° latitude from the animal pole. Theretinal precursors are gathered into a single coherent domainat 50°-90° latitude and ±90° longitude. The hindbrain precur-sors appear split into two domains, at 30°-110° longitude and10°-50° latitude on either side of the midline; however,because we did not map the ±30° longitude region below 15°latitude, we cannot rule out a midline connection between thesetwo domains. Interestingly, the midbrain domain appears tobracket the diencephalic domain at its lateral boundary (50°-70° longitude above 60° latitude), and its posterior boundary(±40° longitude at 40° latitude). In short, a considerableamount of predictable organization is seen in the presumptiveneurectoderm at 6h.
The presumptive ectoderm shows some predictable order aswell. Cells that give rise to ectodermal derivatives (yellow) arelocated throughout the ventral half of the blastoderm at 6h. Inthe region 70°-110° from the midline (that is, the more dorsalportion of the ectodermal domain), we mainly find cranialneural crest, head epidermis, and placodal derivatives. Furtherlateral (beyond 110° longitude), we find trunk neural crest,trunk epidermis and tail epidermis. An animal-vegetal order isseen, such that cranial neural crest and epidermis are foundcloser to the animal pole (data not shown). Since we have
Table 1. Contribution of the labeled cells to different brainregions
6h Data 10h Data
No. No. No. Area embryos injected at 6h injected at 10h Total
FB 55 12 22 34Retina 70 31 13 44MB 32 7 14 21HB 24 8 11 19Other 43 12 7 19Total 224 70 67 137
Entries reflect the number of embryos with descendants that were found inthe listed brain area(s). Embryos in which labeled progenitors were found intwo different brain areas are listed twice. Definitions: FB, forebrain(excluding neural retina); MB, midbrain; HB, hindbrain; Other, spinal cord,somite, and ectodermal derivatives.
Table 2. Progeny of injected cells contribute primarily tosingle brain regions
% of clones or polyclones contributing to a single brain area
FB Retina MB HB
6h 10h 6h 10h 6h 10h 6h 10h
1 89 100 98 100 67 100 78 1002 74 100 83 100 60 75 85 663+ 50 90 100 100 63 75 100 75
Entries reflect the percentage of the embryos in which labeled descendantswere found in only a single brain area when scored at 19-36h. Casesinvolving an initial injection of dye into single cells, two neighboring cells,and three or more neighboring cells are listed separately. Abbreviations: FB,forebrain; MB, midbrain; HB, hindbrain.

2600
focused on the more anterior brain regions, only a few spinalcord precursors (light blue) were labeled. From these few caseswe can deduce that the spinal cord domain islikely to reside below 30° latitude at 6h. Wecannot determine the degree of overlapbetween spinal cord cells (light blue) andsomite progenitors (purple), although thelimited data suggests that they may besomewhat intermixed.
The 10h neural fate map Our second fate map was made at 10h, thetransition point between gastrulation andneurulation. Gastrulation and epiboly endwith the complete coverage of the yolk cellby the epiblast cells (Warga and Kimmel,1990). A dorsal thickening (the future neuralaxis) can be seen in profile (Fig. 1D), withthe tail bud forming at the posterior tip. Inthe top view (Fig. 1C), two features of thehypoblast can be used as landmarks: theforming notochord, and a crescent shapecomposed of advancing axial hypoblastcells. This same shape is marked by, forexample, goosecoid (Stachel et al., 1993) andrtk3 (Xu et al., 1994) in 10h embryos. Figs5 and 6 show the 10h fate map in top andprofile views.
Comparison of 6h and 10h fate mapsshows a refinement in the ordering of theprogenitor groups. At 10h, the entire neurec-toderm has narrowed from 6h, placing theneural/epidermal border 40°-70° from themidline, consistent with previous observa-tions in the anterior spinal region at the two-somite stage (Schmitz et al., 1993). Theamount of convergence from 6h to 10h varieswith axial level. The lateral limit of theretinal domain narrows 30° during this timeinterval, while the hindbrain domain narrowsby 60°. These movements have brought theCNS regions into roughly the same order asthat found later in the neural tube. Beginningat the front of the axis and moving caudally,one sees the telencephalic progenitors at 0-4units, retina at 1-5 units, diencephalon at 3-7 units, midbrain at 5-8 units, and hindbrainat 7-10 units from the origin (Fig. 5). In theprofile view (Fig. 6), the resolution of themidbrain/hindbrain region is improved.Here, these two domains appear even moredistinct. Regions of overlap exist at theborder of each domain, particularly at thelateral edges. For example, retina, dien-cephalon and midbrain progenitors overlapin the region 40° from the midline at 5-6units; however, domains of single fate aremore readily seen, such as between 5-6 unitsand 7.5-9.0 units, where only diencephalonand midbrain progenitors are located, respec-tively.
The shapes of three domains have changed significantlybetween 6h and 10h. The telencephalic domain, mainly rec-
K. Woo and S. E. Fraser
Fig. 3. The 6h top-view fate maps show coherent regional patterning in the presumptiveneurectoderm. Top: composite map viewed from the pole. Bottom: fate maps ofindividual brain subdivisions. Maps are oriented with the position of the shield (0°longitude) at the bottom (arrow). Each concentric circle represents a 10° division inlatitude; the animal pole is defined as 90°. Each dot marks the position at which a cell waslabeled, with the color representing the regional fate of the cell’s progeny. To betterillustrate the domains occupied by each brain region, all injected positions are reflectedacross the midline, assuming left-right symmetry. (See Methods.) The color code for theregional fates in all figures is as follows: red = telencephalon (including the olfactoryplacode); black = diencephalon (excluding the retina); green = retina; orange = midbrain;dark blue = hindbrain; light blue = spinal cord; purple = somite; yellow = neural crest, earplacodes and epidermis. Abbreviations: T: telencephalon; D: diencephalon; R: retina; M:midbrain; H: hindbrain; O: other (spinal cord + somite + epidermis).

2601Zebrafish neural fate maps
tangular in shape at 6h, has developed a bend in the center by10h (compare Figs 3T and 5T). Initially somewhat split acrossthe midline at 6h, both the hindbrain and the midbrain domainshave coalesced into single, coherent masses directly posteriorto the forebrain. (Compare Figs 3M and 3H with Figs 5M and5H, and see below.) These changes in the progenitors’ topog-raphy suggest a predictable pattern of morphogeneticmovements, which we shall explore further below.
Anteroposterior (AP) and dorsoventral (DV) orderwithin brain domainsTo explore any further subdivision within each domain, weanalyzed the location of the precursors contributing to anteriorvs. posterior portions of each brain region. The criteria foranterior (red) and posterior (green) division is schematized inFig. 7 (top). A clear AP polarityis seen in the forebrain (Fig. 7A):the precursors of the telen-cephalon are clustered closer tothe animal pole, thus moreanterior in the future neural axis,than those of the diencephalon atboth 6 and 10h. Within themidbrain (Fig. 7B), anteriorprogenitors are found both closerto the animal pole (at 30°-90°longitudinal region) and closer tothe midline (between ±20°longitude) than posterior ones; by10h the anterior progenitors inthe midbrain are uniformlyanterior to the posterior progeni-tors. This predicts that the 6hanterior progenitors at themidline advance rapidly towardthe animal pole, permitting moreprogenitors to join behind. In thehindbrain at 6h, anterior progen-itors are, in general, closer to theanimal pole (Fig. 7C), and theorder is refined significantly by10h. The organization of anteriorand posterior progenitors in theforebrain appears to be moreadvanced, as the AP order islargely the same at 6 and 10h.However, as with the midbrain,there is some indication that cellsnearer the dorsal midline advancemore rapidly.
The fate maps show significantsegregation between dorsal (darkblue) and ventral (orange) neuraltube precursors (Fig. 8). Withinthe forebrain (Fig. 8A), midbrainand hindbrain (Fig. 8B), theventral progenitors are posi-tioned closer to the midline thanare the dorsal progenitors (Fig.8). This arrangement of progeni-tors in the dorsal blastoderm
agrees with observations in a variety of species, ranging fromthose of the neural area of Salmo gairdneri (Ballard, 1973), tothe more recent results in zebrafish anterior spinal cord (Papanand Campos-Ortega, 1994). Interestingly, those ventralforebrain progenitors (Fig. 8A) close to the margin and at themidline at 6h (especially below 60° latitude) appear to haveadvanced significantly towards the pole when compared totheir laterally placed neighbors (dorsal progenitors at 20°-40°longitude). A similar but less-pronounced change is also seenin the midbrain and hindbrain regions (Fig. 8B, 6h). Thisrearrangement is consistent with that seen in the AP analysis(Fig. 7), and suggests regional differences in cell movementsthat will be explored below.
Patterning in the retinal domain was analyzed separately.Nasal and temporal retina halves were defined by the axis
Fig. 4. The 6h profile fate maps. Top: composite map viewed in profile. Bottom: fate maps ofindividual brain subdivisions. Shield position (defined as 0°-10° longitude) is on the right (arrow).Each horizontal line represents 10° in latitude; the equator is defined as 0°. Color code andabbreviations are identical to those in Fig. 3.
2602
demarcated by the choroidal fissure and posterior groove(Schmitt and Dowling, 1994); dorsal and ventral divisionswere defined at 90° to this (Fig. 9 schematic). In most embryos,single progenitors gave rise to cells that remained clustered inthe retina. The few cases in which labeled cells were found inboth anterior and posterior, or both dorsal and ventral, halvesof the retina were excluded from thisanalysis (less than 10 cases each). At both6h and 10h, the nasal (anterior) andtemporal (posterior) progenitors of theretina are distinct (Fig. 9A), and alignedwith the AP axis of the forebrain (Fig. 7A).However, the arrangement of DV progeni-tors is quite different (Fig. 9B). Dorsalprogenitors (dark blue) are not exclusivelylateral to ventral progenitors (orange). At10h, the clustering of the dark blue cellswithin the field of orange cells may suggestthat these progenitors are arranged in a V-D-V pattern, aligned with the AP axis of theneural axis (Fig. 9B). In contrast to the restof the neural axis, there is no difference inthe predicted motions of cells close to themidline versus those more lateral to it.
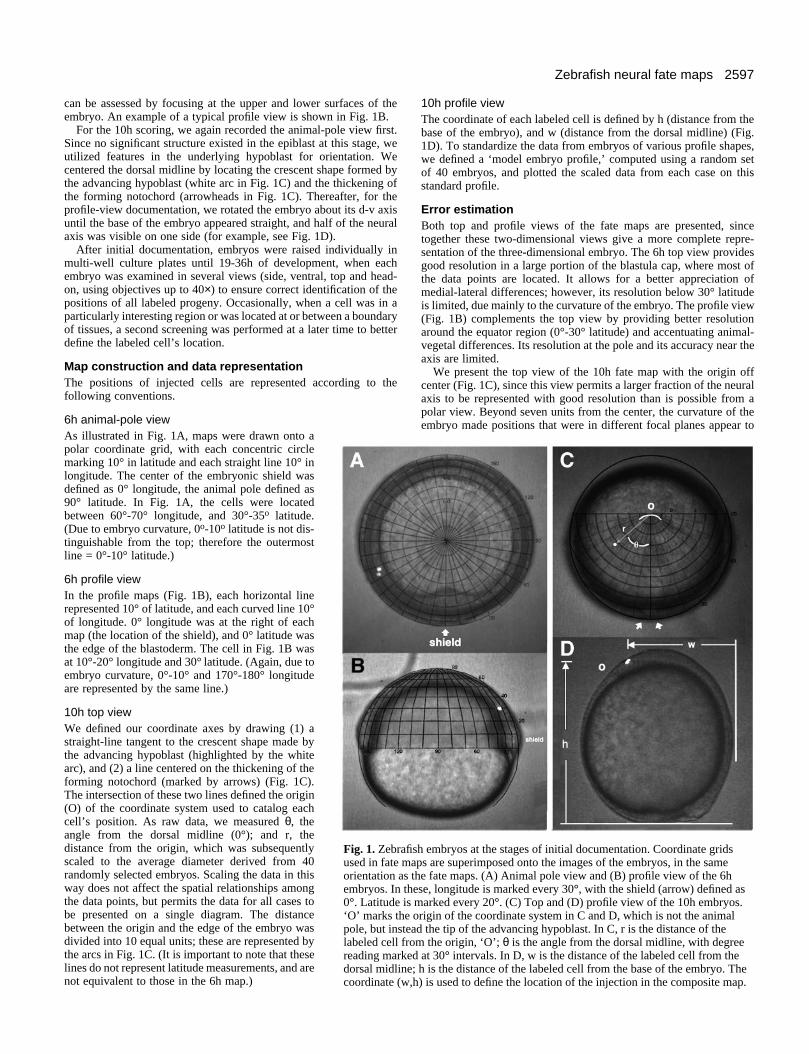
Cell movements linking the 6h and10h fate mapsThe surprising degree of organizationrevealed by the above analyses suggests thatneural precursors undergo slow mixingand/or orderly cell movements throughoutgastrulation. In our attempt to visualize therearrangement that transforms one map tothe other, we estimated the movements oflabeled cells between 6h and 10h. This wasenabled by the fact that for a portion of thesampled embryos, we had scored theposition of labeled cells at both time points.A representative set of these trajectories isshown in Fig. 10A. Each arrow representsthe movement of a cell: the blunt end ofeach arrow marks the position of the cell at6h; the arrowhead points to its position at10h. The entire arrow ‘field’ thus representsthe predicted flow of movement of theepiblast during gastrulation. Note that cellscloser to the midline tend to advance morerapidly in the anterior direction; cellslocated further from the midline tend to firstmove posteriorly, and then undergo aflanking movement to join in the medialanterior flow (Fig. 10A). Although localorder is observed, as expected in the refine-ment of the brain-region fate map withdevelopmental time (discussed above) thecells appear to move as individuals. This ismost readily seen near the midline (topview), where neighboring trajectories bothconverge and diverge.
To investigate the dynamics of individualcells predicted by Fig. 10A, we performed
time-lapse recording of embryos (n > 20); in these, several cellsin each embryos were marked, and their relative positions werefollowed directly using low-light-level video microscopy.Because the entire blastoderm is in motion during these stagesof morphogenesis, there are no fixed reference points withinthe embryo. The presence of two or more labeled cells
K. Woo and S. E. Fraser
Fig. 5. The 10h neural fate maps suggest orderly rearrangement in dorsal blastodermduring gastrulation. Top: composite map viewed from the top. Bottom: fate maps ofindividual brain subdivisions. The horizontal line marks the advancing edge of thehypoblast; the vertical line, the midline of the embryo; the intersection of these two linesis the origin of the coordinate system. Each straight gray line represents 10° from themidline, with numbering at 30° intervals. Each concentric arc represents a one-unitlength (approx. 65 µm) from the origin. As in Fig. 3, all injected positions are reflectedacross the midline, assuming left-right symmetry. Color codes and abbreviations areidentical to Fig. 3.
2603Zebrafish neural fate maps
therefore permits us to follow their relative changes in cellposition over time.
The time-lapse sequences confirm the general pattern of cellmovement deduced both from the static trajectory analysis andfrom the arrangement of the progenitors examined above. InFig. 10B, of the two cells at the same latitude, the more medialcell (m) advanced to the animal pole sooner and maintained amore-anterior position within the neural axis than the lateralcell (l). From a profile perspective (Fig. 10C), this samerelative motion of axially and laterally located cell groups canbe followed. As epiboly proceeds, the axial group (three cells)advances towards the animal pole, while the lateral group as awhole (four cells, initially closer to the yolk cell) slide to amore posterior position relative to the medial group. By 10h,these two groups are aligned in a straight line, with the axialgroup at the anterior portion of the line, as predicted by the AParrangements of hindbrain progenitors (Fig. 7).
Time-lapse sequences offer a feel for thedynamics of cell movement not revealed by staticanalyses. For example, it is possible to observe thatlaterally located cells, which move in a broad,sweeping movement caudally towards the midline,initiate active convergence movements only afterthey are above or near the rapidly advancinghypoblast. (Note relation between labeled cells andhypoblast lateral boundary in Fig. 10B3 and B4.)Furthermore, in films in which we recorded smallgroups of cells, AP order was generally maintained.For example, note that the four cells in the lateralgroup (Fig. 10C) maintained their relative AP orderthroughout morphogenesis. The cells near themidline, perhaps under the influence of the underly-ing hypoblast, underwent different morphogeneticmovement than cells more laterally located. Fromthe 6h fate map (Fig. 3), this midline population cor-responds predominantly to forebrain progenitors. Asmooth transition between the 6h and 10h fate mapscan thus be envisioned: during gastrulation, theforebrain progenitors advance first to maintain theiranterior positions, whereas the midbrain/hindbrain/spinal cord progenitors sweep posteriorly and thenmedially to fill in the more posterior positions. Boththe DV organization of the neural axis and the APorder of the forebrain are maintained as the midbrainand hindbrain domains ‘zipper’ up at the midlineand refine their AP organization (Fig. 11).
Judging from the relative distance betweenlabeled axial cells and the limit of the hypoblastcrescent underneath, it appears that the axial epiblastcells do not advance much beyond the axialhypoblast. (Data not shown.) Instead, as extensioncontinues, the anterior tip of the neural regionthickens, resulting in a structure that resembles thecephalic neural fold of other vertebrates at thebeginning of neurulation.
DISCUSSION
In this paper, we present a detailed fate map of theanterior nervous system of zebrafish at two stages:
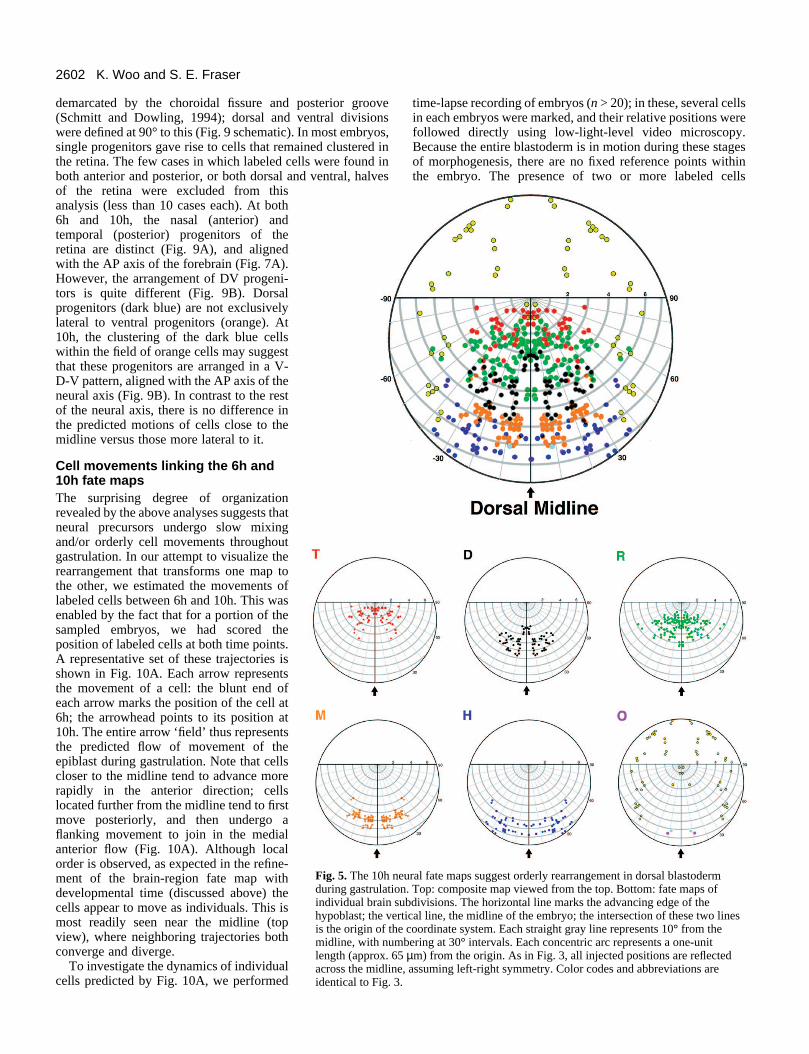
the beginning (6h) and end (10h) of gastrulation (summarizedin Fig. 11). The 6h fate map (Fig. 11A) demonstrates that atearly gastrulation, discernible domains in the dorsal blastodermcan be assigned to major subdivisions of the brain. Thesedomains become progressively distinct as gastrulationconcludes at 10h (Fig. 11B). Using time-lapse videomicroscopy, we observe an orderly transition between the twofate maps that is mediated by a predictable rearrangement ofthe dorsal blastoderm cells (Fig. 10). This rearrangementconsists of two broad components: a continuous anterior flowof the forebrain progenitor population (especially those nearerthe dorsal midline, overlying the advancing hypoblast), and aconcurrent translocation/rotation of the midbrain-hindbrain-spinal cord domains from their lateral positions to a locationposterior to the forebrain domain (Fig. 10).
By sampling several-fold more cells than a previous study(Kimmel et al., 1990), we found a significant degree of order
Fig. 6. The 10h profile fate maps. Top: composite map viewed in profile.Bottom: fate maps of individual brain subdivisions. The dimensions of theoutline represent a typical embryo, with average width and height calculatedfrom a subset of the total data. Dorsal midline is on the right.

2604
and predictability in the neuronal fate map. Our ability tooutline the approximate extent of each brain subdivision at 6hby no means indicates that these subdivisions are completelydistinct and separate. (Note shaded regions of overlap in Fig.11.) As an indicator of the order, those progenitor cells in the6h blastoderm that contributed to more than one brain subdi-vision were only found in adjacent subdivisions; a cell havingdescendants in both telencephalon and hindbrain, for instance,was never observed. Furthermore, dual-fate progenitors wereinvariably located at the border of adjacent domains on the fatemap. Another indicator of order in the fate map was that themajority of the embryos had labeled cells in only one braindomain, regardless of whether the embryo had initially had oneor more closely spaced cells labeled (Table 2). It is thereforevery likely that our 6h fate map overestimates the extent ofoverlap between different brain regions, as embryo variability
and measurement error would blur the distinctions. Closerexamination at the bordering regions and grafting betweenregions will be needed before any definitive conclusions canbe drawn about the relative roles of limited cell mixing andclonal restrictions at region boundaries in generating such anordered fate map.
Comparison with other speciesThe organization of the zebrafish gastrula map appears to differfrom that of another teleost, Salmo gairdneri (Ballard, 1973).In Salmo, the brain regions are extensively overlapped at theonset of gastrulation, such that forebrain, midbrain, andhindbrain, as well as mesodermal tissues, appear to be arrangedin layers (Ballard, 1973). In the zebrafish early gastrula, thebrain regions and other mesodermal derivatives are reasonablywell separated laterally across the blastoderm (Fig. 11A;
K. Woo and S. E. Fraser
Fig. 7. Anteroposterior order within each CNS subdivision at 6h and 10h. Top row: schematics depicting the criteria for anterior (red) andposterior (green) divisions. For this analysis, the telencephalon is defined as anterior forebrain; the diencephalon as posterior. The midbrain isdivided into anterior and posterior halves; the hindbrain is divided into pre-otic (including the region spanning the ear; anterior) and post-otic(posterior) regions. Red dots in the fate map represent the positions of anterior progenitors in a tissue; green dots, the positions of posteriorprogenitors. Middle row: 6h fate maps. Bottom row: 10h fate maps. (A) AP polarity in the forebrain domain (animal-pole view). (B) APpolarity in the midbrain (animal-pole view; inset: side view). (C) AP polarity in the hindbrain (animal pole view; inset: side view). Weexcluded three embryos from the 6h midbrain data set, since we were unable to group their cells definitively into either anterior or posteriorgroup.

2605Zebrafish neural fate maps
Fig
. 8.D
orsa
l and
ven
tral
ord
er in
the
prog
enito
rs w
ithin
eac
h br
ain
dom
ain.
Top
row
:sc
hem
atic
s sh
owin
g th
e do
rsal
(da
rk b
lue)
and
ven
tral
(or
ange
) di
visi
ons
defin
ed b
yex
tern
al m
orph
olog
y of
the
brai
n. M
iddl
e ro
w: l
ocat
ions
of
DV
pro
geni
tors
at 6
h. B
otto
mro
w: D
V p
atte
rnin
g at
10h
. Dat
a of
tele
ncep
halo
n an
d di
ence
phal
on a
re s
how
n in
col
umn
A; t
hose
of
mid
brai
n an
d hi
ndbr
ain
in c
olum
n B
. Fiv
e em
bryo
s be
arin
g ce
lls th
at c
ould
not b
e de
finiti
vely
gro
uped
hav
e be
en e
xclu
ded.
Fig
. 9. T
he r
etin
al d
omai
n sh
ows
an a
xial
ord
er d
istin
ct f
rom
the
neur
al a
xis
prop
er. T
opro
w: s
chem
atic
s de
pict
ing
the
crite
ria
for
ante
rior
(re
d) v
s. p
oste
rior
(gr
een)
, and
dor
sal
(dar
k bl
ue)
vs. v
entr
al (
oran
ge)
divi
sion
s. M
iddl
e ro
w: A
P an
d D
V o
rgan
izat
ion
of th
ere
tinal
dom
ain
at 6
h. B
otto
m r
ow: o
rgan
izat
ion
at 1
0h. N
ote
that
alth
ough
the
arra
ngem
ent
of A
P pr
ogen
itors
is s
imila
r to
that
of
the
neur
al a
xis,
that
of
the
DV
pro
geni
tors
issi
gnifi
cant
ly d
iffe
rent
(se
e Fi
g. 8
).

2606 K. Woo and S. E. Fraser
Fig. 10. Zebrafish dorsal blastoderm undergo orderly morphogeneticmovements during gastrulation. (A) Transformation of the 6h fatemap into the 10h fate map, viewed from the top and in profile.Deduced trajectories, from a group of embryos in which the positionsof labeled cells were recorded at both time points, are drawn here onthe outline of a 10h embryo. The tail of each arrow marks the cell’sposition at 6h; the arrowhead points to its position at 10h. (B) A
typical time-lapse film illustrating the orderly movement of thedorsal blastoderm. Scale bar in B1 is 100 µm. B1-4 are top views; B5is a profile view. Two cells were labeled with fluorescent dextrans at6h: cell m near the dorsal midline; cell l at the same latitude, butremoved from the midline. Little convergence was seen prior to thecompletion of epiboly (B1-B3). By 10h, cell l had divided.Meanwhile, cell m began its anterior movement, and continued to

2607Zebrafish neural fate maps
Kimmel et al., 1990). As we have only mapped the outer 2-3cells of the blastoderm, we may have missed any layeredorganization in the deeper layers. However, morphological dif-ferences between the two species may be a bigger factor. Inzebrafish, the entire blastula cap contributes to the embryoproper; in Salmo, the dorsal half of the cap contains the entireembryo. Furthermore, the zebrafish gastrulates at 50% epiboly,when the epiblast has thinned to about 2-3 cells thick at thepole and 5-6 cells at the margin; Salmo, much like Fundulus(Trinkaus, 1984), begins to gastrulate around 30% epiboly,when the epiblast is several layers thick. Thus, it is not sur-prising that the different primordia of the zebrafish brain aremore spread out than those of Salmo when gastrulation begins.Perhaps fate mapping the zebrafish at 30% epiboly, if theembryo can be properly oriented, would reveal any layeredorganization that might be present.
There are both similarities and differences between the
zebrafish 6h fate map and the Xenopus gastrula fate map. Thisfrog fate map was derived by backtracing individual cells intime-lapse recording from the mid-neurula map (Keller et al.,1992a). In both maps, the forebrain region occupies about two-thirds the area of the presumptive neural plate. Furthermore,the axial brain regions are compressed animal-vegetally suchthat the forebrain is relatively close to the dorsal lip region inXenopus, and almost next to the shield in zebrafish. In contrastto Xenopus, in which the spinal cord progenitors stretchlaterally from the midline, those in zebrafish are positionedalmost exclusively laterally (with the exception of those fewlocated within the shield; Shih and Fraser, 1995). The 10hzebrafish neural fate map resembles the neurula fate map ofXenopus (Eagleson and Harris, 1990) and chick (Couly and LeDouarin, 1988), in that the brain regions are aligned in theexpected anteroposterior order of the eventual neural tube. Anotable difference is the shape of the zebrafish telencephalicdomain, which is not a pair of split ‘lateral’ structures, as inchick and Xenopus. In fish, the diencephalon does not lie mostanterior. It is important to note that, strictly speaking, a 10hzebrafish is not a neurula, since ‘neural plate’ is not seen until1 hr later (Schmitz et al., 1993). It may be that, given theforward-flow movement observed in the axial epiblast cells(forebrain progenitors), the telencephalic anlage is pushedaside by diencephalic progenitors that adopt an anteriormidline position (Fig. 10B; and unpublished observations).
Order within the subdivisions In analyzing possible patterning within each brain subdivision,we find that AP ordering is pronounced in the forebrain regionat 6h, while it is gradually refined in the midbrain andhindbrain region, in agreement with the observed morpho-genetic movements. AP-neighbor relationships would beexpected to be maintained among the forebrain progenitors,because they move uniformly forward, beginning at 6h.Among the midbrain-hindbrain progenitors, however, greaterneighbor exchanges are expected, since they must firstconverge towards the midline before aligning with the orien-
Fig. 10 (cont.)
move forward relative to the underlying hypoblast (note theshortening distance between cell m and the outline of the hypoblastfrom B3 to B4), but did not move past the hypoblast limit. Aftermoving into the vicinity of the hypoblast (B4), progeny of cell lswept behind those of cell m. Eventually, progeny of cell m gave riseto diencephalic cells, and those of cell l to the midbrain, inagreement with predictions based on their initial positions on the 6hfate map. (C) A profile-view time-lapse film illustrating the differentbehavior of midline cell group (m) and lateral cell group (l). Scalebar in C1 is 100 µm. C1-3, and C5 are profile views; C4 is a topview. Groups m and l were obtained from labeling two blastomeresat 30% epiboly. Both groups shifted toward the vegetal pole withepiboly. Sometime between 8-10h, group m as a whole began toadvance towards the animal pole, whereas group l swept behindgroup m (C3). AP order within each group was maintained. From10h onwards, the two groups became aligned (C4) and maintainedtheir relative AP positions. Group-m cells contributed todiencephalic-to-midbrain region; group l cells to posterior-midbrain-to-hindbrain region, again in accord with their initial positions at 6h.
Fig. 11. Organization of thezebrafish central nervoussystem. (A,B) Summary fatemap at 6h and 10h,respectively. Domainsoccupied by progenitors ofeach brain subdivisions arecoded with their representativecolors, as shown in the key.Areas of overlap between anytwo domains are shaded with amixture of the their respectivecolors.

2608
tation of the axis (Fig. 10). In contrast, DV patterning is evidentthroughout the axis from the start of gastrulation: dorsal prog-enitors of each region are always located lateral to ventralprogenitors. Although this patterning is temptingly suggestiveof a primary neurulation mechanism (Schmitz et al., 1993), wecannot at present determine the neurulation process of thezebrafish head region based on this pattern alone. The headregion of the neural keel could be formed by an orderlyinfolding of cells, with the lateral cells giving rise to the dorsalbrain structures. Another possibility is that lateral cells, movingas individuals, are limited to taking dorsal positions simplybecause the more-ventral ones are already occupied. Clearly,in vivo time-lapse analysis, as well as ultrastructural studies,are needed to resolve this issue.
Retinal precursorsAn interesting aspect of the fate map is that both neural retinasmap to a single coherent region at the anteromedial portion ofthe forebrain (Figs 3R, 5R). In other teleosts, such as Salmo,a single retinal domain is also seen in the gastrula (Ballard,1973). In our study, a single cell can give rise to progeny inboth the ipsilateral and contralateral retinas (data not shown),indicating that both retinas originate from this singulardomain. Similar crossing has been observed in Xenopus(Jacobson and Hirose, 1978), implicating some coherence ofthe retinal domains at an early developmental stage, despitethe split domains seen in the neurula fate map (Eagleson andHarris, 1990). Our data also shows that both the AP and theDV axes of the retinal domains are oriented parallel to theneural axis. In the Xenopus neurula, the DV axis of the retinais arranged in the expected lateral-to-medial fashion (Eaglesonand Harris, 1990). The difference in axis arrangement mayreflect dissimilarities in the morphogenetic mechanisms thatdrive the optic cup formation in amphibians and teleosts(Schmitt and Dowling, 1994; Reyer, 1977). At a later stage,the retinas have been shown to undergo rotations with respectto the neural axis (Schmitt and Dowling, 1994). It will be ofinterest to investigate if, and to what extent, the cellular inter-actions that pattern the AP and DV axis of the neural tubeoccur within the retina.
The fate maps reveal interesting tissue juxtapositions andmovements that may have implications in the interpretation ofmutant phenotypes. For example, cyclopia, a notable defect inthe cyclops mutant, is believed to result from a massivedeletion of the ventral forebrain (Hatta et al., 1994), perhapsfrom impaired cell proliferation (Hatta et al., 1991b; Strahle etal., 1993). Because both retinas originate from a single con-tiguous domain in our 6h fate map, the anlage must be splitduring morphogenesis to make two retinas. It appears that theventral diencephalic progenitors physically split the retinaldomain in two. Thus, it seems possible that some mutationsleading to cyclopia might act to impair motility of the ventraldiencephalic progenitors during gastrulation, resulting in afailure of the retinal anlage to be bifurcated. This scenario doesnot preclude a change in the cell-state specification of dien-cephalic progenitors in some mutants (Hatta et al., 1994), butsuggests an alternative hypothesis, focused on cell motility,that can now be tested.
Patterning of the zebrafish neural axis The fate maps presented here provide details of the progeni-
tor topology, thus permitting dissection of possible neural pat-terning mechanisms in the zebrafish. In vertebrates, it isgenerally believed that the organizer plays a pivotal role inneural induction and patterning (Spemann, 1938; Kessler andMelton, 1994, and references therein). Based on theexpression patterns of such markers as goosecoid (Stachel etal., 1993; Schulte-Merker et al., 1994), the embryonic shieldis believed to be the organizer of the zebrafish, although itsability to organize a complete axis remains to be demonstrated(Oppenheimer, 1936; J. Shih, personal communications);nonetheless, it may be instructive to speculate about possiblepatterning scenarios using the ‘constraints’ imposed by thefate maps reported here. At present, our fate map is compati-ble with both planar and vertical patterning mechanisms(Donaich, 1993; Ruiz-i-Altaba, 1993). For instance, given theclose proximity of the forebrain, midbrain, and hindbrain tothe shield, one can envision the involvement of one or moreshort-range planar signals from the organizer (Fig. 11A).Similar schemes, based mainly on fate-mapping and cell-movement data, have been proposed as part of the neural-induction mechanism in Xenopus (Keller et al., 1992a,b).However, vertical inductive interactions between axialhypoblast and epiblast could also be a significant patterninginfluence. It is interesting to note that the timing of initialforward motility exhibited by laterally located cells seems tocoincide with their becoming close to the axial hypoblast(Panel 10B). Whether or not this change in the behavior of theepiblast cells is a result of some inductive interactions withthe hypoblast remains to be investigated.
The organization displayed in the 6h fate map could also betaken as support for the existence of regional identities in theblastoderm prior to gastrulation. The slow, orderly cell mixingin the zebrafish epiblast layer (Fig. 10; see Wetts and Fraser,1989) could, in effect, establish a default ‘pattern’, with cellscloser to the animal pole generally becoming forebrain cells,and cells closer to the germ ring generally becoming hindbraincells, by virtue of their locations, independent of the time ofthe actual inductive events (Wilson et al., 1993). Alternatively,this ‘prepattern’ might have a specific molecular basis. Forexample, zebrafish homologs of maternal wnt gene may beexpressed in parts of the epiblast, and act as competencemodifiers of mesoderm and neural inductions, as has beenproposed for Xenopus (Moon and Christian, 1992). The pre-gastrula appearance of goosecoid (Stachel et al., 1993; Schulte-Merker et al., 1994) and axial (Strahle et al., 1993) mayindicate such early organization and inductive events. Atpresent, little is known about the regional specification or com-mitment states of zebrafish epiblast cells at any time duringgastrulation. By exploiting the fate maps presented here, futureexperiments will permit more direct tests of the nature andtiming of these early events that establish and pattern thenervous system of the zebrafish.
We would like to thank Drs D. Anderson, B. Condron, A. Collarzo,J. Shih, P. Sternberg, B. Trevarrow, B. Wold, and K. Zinn for criticalreading of the manuscript, as well as two anonymous reviewers forhelpful comments. We thank Dr J. Shih in particular for stimulatingdiscussions and suggestions for data presentation. We are grateful toMs Dian De Sha for her editorial expertise. This work is supportedby the Evelyn Sharp Graduate Fellowship (to K. W.) and grants fromNIH and NIMH (to S. E. F.).
K. Woo and S. E. Fraser

2609Zebrafish neural fate maps
REFERENCES
Ballard, W. (1973). A new fate map for Salmo gairdneri. J. Exp. Zool. 184, 49-73.
Cho, K. W. Y., Blumberg, B., Steinbeisser, H. and De Robertis, E. M.(1991a). Molecular nature of Spemman’s organizer: the role of Xenopushomeobox gene goosecoid. Cell 67, 1111-1120.
Couly, G. and Le Douarin, N. M. (1988). The fate map of the cephalic neuralconvergence and extension of the neural plate by the organizer of Xenopus.Dev. Dyn. 193, 218-234.
Donaich, T. (1993). Planar and vertical induction of anteroposterior patternduring the development of the amphibian central nervous system. J.Neurobiol. 24, 1256-1275.
Driever, W., Stemple, D., Schier, A. and Solnica-Krezel, L. (1994).Zebrafish: genetic tools for studying vertebrate development. Trends Genet.10, 152-159.
Eagleson, G. W. and Harris, W. A. (1990). Mapping of the presumptive brainregions in the neural plate of Xenopus laevis. J. Neurobiol. 21, 427-440.
Hatta, K., Bremiller, R., Westerfield, M. and Kimmel, C. B. (1991a).Diversity of expression of engrailed-like antigens in zebrafish. Development112, 821-832.
Hatta, D., Kimmel, C. B., Ho, R. K. and Walker, C. (1991b). The cyclopsmutation blocks specification of the floor plate of the zebrafish centralnervous system. Nature 350, 339-341.
Hatta, K., Puschel, A. W. and Kimmel, C. B. (1994). Midline signaling in theprimordium of the zebrafish anterior central nervous system. Proc. Natl.Acad. Sci. USA 91, 2061-2065.
Helde, K. A., Wilson, E. T., Cretekos, C. J. and Grunwald, D. J. (1994).Contribution of early cells to the fate map of the zebrafish gastrula. Science265, 517-520.
Jacobson, M. and Hirose, G. (1978). Origin of the retina from both sides of theembryonic brain: A contribution to the problem of crossing at the opticchiasma. Science 202, 637-639.
Keller, R. E. (1975). Vital dye mapping of the gastrula and neurula of Xenopuslaevis. I. Prospective areas and morphogenetic movements of the superficiallayer. Dev. Biol. 42, 222-241.
Keller, R. E. (1976). Vital dye mapping of the gastrula and neurula of Xenopuslaevis. II. Prospective areas and morphogenetic movements of the deep layer.Dev. Biol. 51, 118-137.
Keller, R. E., Shih, J. and Sater, A. (1992a). The cellular basis of theconvergence and extension of the Xenopus neural plate. Dev. Dyn. 193, 199-217.
Keller, R. E., Shih, J., Sater, A. K. and Moreno, C. (1992b). Planar inductionof convergence and extension of the neural plate by the organizer of Xenopus.Dev. Dyn. 193, 218-234.
Kessler, D. S. and Melton, D. A. (1994). Vertebrate embryonic induction:mesodermal and neural patterning. Science 266, 596-604.
Keynes, R. and Lumsden, A. (1990). Segmentation and origin of regionaldiversity in the vertebrate central nervous system. Neuron 2, 1-9.
Kimmel, C. B. and Law, R. D. (1985). Cell lineage of zebrafish blastomeres.III. Clonal analysis of the blastula and gastrula stages. Dev. Biol. 108, 94-101.
Kimmel, C. B., Warga, R. M. and Kane, D. A. (1994). Cell cycles and clonalstrings during formation of the zebrafish central nervous system.Development 120, 265-276.
Kimmel, C. B., Warga, R. M. and Schilling, T. F. (1990). Origin andorganization of the zebrafish fate map. Development 108, 581-594.
Krauss, S., Concordet, J. -P. and Ingham, P. W. (1993). A functionallyconserved homolog of the Drosophila segment polarity gene hh is expressedin tissues with polarizing activity in zebrafish embryos. Cell 75, 1431-1444.
Krauss, S., Johansen, T., Korzh, V. and Fjose, A. (1991). Expression of thezebrafish paired box gene pax [zf-b] during early neurogenesis. Development113, 1193-1206.
Lawson, K. A., Meneses, J. J. and Pedersen, R. A. (1991). Clonal analysis ofepiblast fate during germ layer formation in the mouse embryo. Development113, 891-911.
Moon, R. T. and Christian, J. L. (1992). Competence modifiers synergizewith growth factors during mesoderm induction and patterning in Xenopus.Cell 71, 709-712.
Mullins, M. C., Hammerschmidt, M., Haffter, P. and Nusslein-Volhard, C.
(1994). Large-scale mutagenesis in the zebrafish: in search of genescontrolling development in a vertebrate. Current Biol. 4, 189-202.
Oppenheimer, J. M. (1936). Transplantation experiments on developingteleosts (Fundulus and Perca). J. Exp. Zool. 72, 409-437.
Oppenheimer, J. M. (1947). Organization of the teleost blastoderm. TheQuart. Rev. Biol. 22, 105-118.
Oxtoby, E. and Jowett, T. (1993). Cloning of the zebrafish krox-20 gene (krx-20) and its expression during hindbrain development. Nucl. Acids Res. 21,1087-1095.
Papan, C. and Campos-Ortega, J. A. (1994). On the formation of the neuralkeel and neural tube in the zebrafish Danio (Brachydanio) rerio. Roux’sArch. Dev. Biol. 203, 178-186.
Puschel, A. W., Gruss, P. and Westerfield, M. (1992). Sequnce andexpression pattern of pax-6 are highly conserved between zebrafish andmice. Development 114, 643-651.
Reyer, R. W. (1977). The amphibian eye: Development and regeneration. InThe Visual Systems of Vertebrates vol. 7/5 (ed. F. Crescitelli), pp. Berlin,Heidelberg, New York: Springer-Verlag.
Ruiz i Altaba, A. and Jessel, T. M. (1993). Midline cells and the organizationof the vertebrate neuraxis. Curr. Op. Genet. Dev. 3, 633-640.
Ruiz i Altaba, A. (1993). Induction and axial patterning of the neural plate:planar and vertical signals. J. Neurobiol. 24, 1276-1304.
Schmitt, E. A. and Dowling, J. E. (1994). Early eye morphogenesis in thezebrafish, Brachydanio rerio. J. Comp. Neurol. 344, 532-542.
Schmitz, B., Papan, C. and Campos-Ortega, J. A. (1993). Neurulation in theanterior trunk region of the zebrafish Brachydanio rerio. Roux’s Archiv. Dev.Biol. 202, 250-259.
Schulte-Merker, S., Hammerschmidt, M., Beuchle, D., Cho, K. W., DeRobertis, E. M. and Nusslein-Volhard, C. (1994). Expression of zebrafishgoosecoid and no tail gene products in wild-type and mutant no tail embryos.Development 120, 843-852.
Selleck, M. A. and Stern, C. D. (1991). Fate mapping and cell lineage analysisof Hensen’s node in the chick embryo. Development 112, 615-626.
Shih, J. and Fraser, S. E. (1995). The distribution of tissue progenitors withinthe shield region of the zebrafish gastrula. Development 121(9) (in press).
Slack, J. M. W. (1991). Chapter 2. In From Egg to Embryo: RegionalSpecification in Early Development. 2nd ed. (ed. P. Barlow, D. Bray, P.Green and J. Slack), Cambridge: Cambridge University Press.
Slack, J. M. W. and Tannahill, D. (1992). Mechanism of anteroposterior axisspecification in vertebrates. Lessons from the amphibians. Development 114,285-30.
Spemann, H. (1938). Embryonic Development and Induction. New Haven,Connecticut: Yale University Press.
Stachel, S. E., Grunwald, D. J. and Myers, P. Z. (1993). Lithium perturbationand goosecoid expression identify a dorsal specification pathway in thepregastrula zebrafish. Development 117, 1261-1274.
Strahle, U., Blader, P., Henrique, D. and Ingham, P. W. (1993). Axial, azebrafish gene expressed along the developing body axis, shows alteredexpression in cyclops mutant embryos. Gene Dev. 7, 1436-1446.
Trinkaus, J. P. (1984). Cells into Organs: The Forces that Shape the Embryo.Second ed. Englewood Cliffs, NJ: Prentice-Hall, Inc.
Warga, R. M. and Kimmel, C. B. (1990). Cell movements during epiboly andgastrulation in zebrafish. Development 108, 569-590.
Westerfield, M. F. (1994). The Zebrafish Book: A Guide for the LaboratoryUse of Zebrafish (Brachydanio rerio). 2nd ed. Eugene: University of OregonPress.
Wetts, R. and Fraser, S. E. (1988). Multipotent precursors can give rise to allmajor cell types of the frog retina. Science 39, 1142-1145.
Wetts, R. and Fraser, S. E. (1989). Slow intermixing of cells during Xenopusembryogenesis contributes to the consistency of the blastomere fate map.Development 108, 9-15.
Wilson, E. T., Helde, K. A. and Grunwald, D. J. (1993). Something’s fishyhere - rethinking cell movements and cell fate in the zebrafish embryo.Trends. Neurosci. 9, 348-352.
Xu, Q., Holder, N., Patient, R. and Wilson, S. W. (1994). Spatially regulatedexpression of three receptor tyrosine kinase genes during gastrulation in thezebrafish. Development 120, 2287-299.
(Accepted 24 April 1995)
Related Documents


