Brigham Young University Brigham Young University BYU ScholarsArchive BYU ScholarsArchive Theses and Dissertations 2015-06-01 Orchestrating Mathematical Discussions: A Novice Teacher's Orchestrating Mathematical Discussions: A Novice Teacher's Implementation of Five Practices to Develop Discourse Implementation of Five Practices to Develop Discourse Orchestration in a Sixth-Grade Classroom Orchestration in a Sixth-Grade Classroom Jeffrey Stephen Young Brigham Young University - Provo Follow this and additional works at: https://scholarsarchive.byu.edu/etd Part of the Teacher Education and Professional Development Commons BYU ScholarsArchive Citation BYU ScholarsArchive Citation Young, Jeffrey Stephen, "Orchestrating Mathematical Discussions: A Novice Teacher's Implementation of Five Practices to Develop Discourse Orchestration in a Sixth-Grade Classroom" (2015). Theses and Dissertations. 5607. https://scholarsarchive.byu.edu/etd/5607 This Thesis is brought to you for free and open access by BYU ScholarsArchive. It has been accepted for inclusion in Theses and Dissertations by an authorized administrator of BYU ScholarsArchive. For more information, please contact [email protected], [email protected].

Welcome message from author
This document is posted to help you gain knowledge. Please leave a comment to let me know what you think about it! Share it to your friends and learn new things together.
Transcript

Brigham Young University Brigham Young University
BYU ScholarsArchive BYU ScholarsArchive
Theses and Dissertations
2015-06-01
Orchestrating Mathematical Discussions: A Novice Teacher's Orchestrating Mathematical Discussions: A Novice Teacher's
Implementation of Five Practices to Develop Discourse Implementation of Five Practices to Develop Discourse
Orchestration in a Sixth-Grade Classroom Orchestration in a Sixth-Grade Classroom
Jeffrey Stephen Young Brigham Young University - Provo
Follow this and additional works at: https://scholarsarchive.byu.edu/etd
Part of the Teacher Education and Professional Development Commons
BYU ScholarsArchive Citation BYU ScholarsArchive Citation Young, Jeffrey Stephen, "Orchestrating Mathematical Discussions: A Novice Teacher's Implementation of Five Practices to Develop Discourse Orchestration in a Sixth-Grade Classroom" (2015). Theses and Dissertations. 5607. https://scholarsarchive.byu.edu/etd/5607
This Thesis is brought to you for free and open access by BYU ScholarsArchive. It has been accepted for inclusion in Theses and Dissertations by an authorized administrator of BYU ScholarsArchive. For more information, please contact [email protected], [email protected].

Orchestrating Mathematical Discussions: A Novice Teacher’s Implementation of
Five Practices to Develop Discourse Orchestration
in a Sixth-Grade Classroom
Jeffrey Stephen Young
A thesis submitted to the faculty of Brigham Young University
in partial fulfillment of the requirements for the degree of
Master of Arts
Damon L. Bahr, Chair Byran B. Korth
Melissa Newberry
Department of Teacher Education
Brigham Young University
June 2015
Copyright © 2015 Jeffrey Stephen Young
All Rights Reserved

ABSTRACT
Orchestrating Mathematical Discussions: A Novice Teacher’s Implementation of Five Practices to Develop Discourse Orchestration
in a Sixth-Grade Classroom
Jeffrey Stephen Young Department of Teacher Education, BYU
Master of Arts
This action research study examined my attempts during a six-lesson unit of instruction to implement five practices developed by Stein, Engle, Smith, and Hughes (2008) to assist novice teachers in orchestrating meaningful mathematical discussions, a component of inquiry-based teaching and learning. These practices are anticipating student responses to a mathematical task, monitoring student responses while they engage with the task, planning which of those responses will be shared, planning the sequence of that sharing, and helping students make connections among student responses. Although my initial anticipations of student responses were broad and resulted in unclear expectations during lesson planning, I observed an improvement in my ability to anticipate student responses during the unit. Additionally, I observed a high-level of interaction between my students and me while monitoring their responses but these interactions were generally characterized by low-levels of mathematical thinking. The actual sharing of student responses that I orchestrated during discussions, and the sequencing of that sharing, generally matched my plans although unanticipated responses were also shared. There was a significant amount of student interaction during the discussions characterized by high-levels of thinking, including making connections among student responses. I hypothesize that task quality was a key factor in my ability to implement the five practices and therefore recommend implementing the five practices be accompanied by training in task selection and creation.
Keywords: mathematical discussion orchestration, mathematical discourse

ACKNOWLEDGEMENTS
This project would not have been possible without the unwavering support and
encouragement of my committee chair, Damon Bahr. I am grateful to Byran Korth, Melissa
Newberry, and Janet Young for their challenging questions and invaluable feedback. I would
also like to thank the following people for their support throughout this study: Stephen and
Jolene Young, Reid and Marilyn Everett, and Lauren Johnson for the many hours she spent
reading multiple drafts of this study. I would also like to acknowledge my children Iris, Lily, and
Oliver Young for inspiring me to press forward through this challenging process. Finally, I
would like to express my love and gratitude to my wife, Brooke, who offered support and
encouragement when it was needed most.
iv
TABLE OF CONTENTS
Chapter 1: Introduction ................................................................................................................... 1
Chapter 2: Review of the Literature ................................................................................................ 7
Discourse..................................................................................................................................... 8
Challenges of Orchestrating Whole-Class Discussion ............................................................. 11
Five Practices for Facilitating Mathematical Discussion.......................................................... 13
Research Questions ................................................................................................................... 16
Chapter 3: Methods ....................................................................................................................... 19
Research Design........................................................................................................................ 19
Context ...................................................................................................................................... 20
Participants ................................................................................................................................ 22
Data Sources ............................................................................................................................. 22
Data Analysis ............................................................................................................................ 23
Anticipating likely student responses ............................................................................... 24
Monitoring students’ responses ........................................................................................ 25
Selecting and sequencing students’ responses .................................................................. 26
Helping students make mathematical connections ........................................................... 27
Analysis Reliability ................................................................................................................... 29
Limitations ................................................................................................................................ 29
Chapter 4: Findings ....................................................................................................................... 30
Anticipating likely student responses ....................................................................................... 30
Monitoring students’ responses ................................................................................................ 32

v
Selecting and sequencing students’ responses ......................................................................... 34
Helping students make mathematical connections ................................................................... 35
Summary ................................................................................................................................... 39
Chapter 5: Discussion ................................................................................................................... 40
Anticipating Likely Student Responses ................................................................................... 40
Monitoring Students’ Responses .............................................................................................. 41
Selecting and Sequencing Students’ Responses ....................................................................... 45
Helping Students Make Mathematical Connections ................................................................ 47
Conclusion ............................................................................................................................... 50
Contributions and Recommendations for Future Research ..................................................... 52
References ..................................................................................................................................... 54
Appendices ........................................................................................................................……… 59
CMI Develop Lesson Plan 1 ..................................................................................................... 59
CMI Develop Lesson Plan 2 .................................................................................................... 60
CMI Develop Lesson Plan 3 .................................................................................................... 61
CMI Develop Lesson Plan 4 .................................................................................................... 62
CMI Develop Lesson Plan 5 .................................................................................................... 63
CMI Develop Lesson Plan 6 .................................................................................................... 64

vi
LIST OF TABLES
Table 1: Hybrid List of Thinking Levels and Definitions ............................................................26
Table 2: Comparisons of Anticipated to Observed Student Thinking ..........................................31
Table 3: Number of Initial Explore Interactions per Lesson ........................................................32
Table 4: Number of Teacher-Student Interactions During Explore Phase ...................................33
Table 5: Occurrences of Cognitive Level of Teacher Interactions During Explore Phase ...........34
Table 6: Intended and Observed Sharing and Sequencing ...........................................................35
Table 7: Pursuits of Questions During Connection Practice ........................................................37
Table 8: Cognitive Levels of Discussion Pursuits ........................................................................38
Table 9: Relationships Among Pursuit Decisions and Cognitive Level of Each Pursuit .............39

1
Chapter 1
Introduction
The purpose of this study was to investigate my efforts to improve the orchestration of
mathematical discussions. I will contextualize this study by first describing a brief history of the
current mathematics education reform movement in this chapter. In Chapter 2, I will outline the
definitions and characteristics of discourse as it pertains to discussion orchestration by a review
of the relevant literature, laying a conceptual foundation for this study.
Mathematics contributes to multiple aspects of our modern life; the ability to understand
mathematics, statistics, and computation enables citizens to make informed decisions and nations
to become both technologically relevant and economically competitive in a global market. The
National Research Council (NRC, 2013) recently published a report entitled The Mathematical
Sciences in 2025. The central focus of the report was to examine the primary role of the
mathematical sciences in modern society. The report states that “mathematical sciences work is
becoming an increasingly integral and essential component of a growing array of areas of
investigation in biology, medicine, social science, business, advanced design, climate, finance,
advanced materials, and many more” (p. 110).
Thus, teachers of mathematics play a vital role in preparing their students to meet the
demands of living in a modern society. As stated in the National Council of Teachers of
Mathematics’ (NCTM, 2000) Principles and Standards for School Mathematics, “Decisions
made by teachers, school administrators, and other education professionals about the content and
character of school mathematics have important consequences both for students and for society”
(p. 11). Mathematics educators of K–12 are expected to provide all students with a quality and

2
equitable mathematics education and to continually seek to improve instruction so that students
today will be prepared to be productive citizens of tomorrow.
For more than three decades the charge to provide all students with a quality and
equitable education in mathematics has been the focus of the reform efforts of such mathematics
education organizations as the NCTM and the NRC. The roots of this reform movement began in
the late 1970s and early 1980s. At that time there was widespread concern that something was
seriously wrong with public education in the United States because students were falling behind
the rest of the world, especially in the fields of science, technology, and mathematics. In
response to the growing concern over America’s future as an industrial leader, Secretary of
Education, T.H. Bell, created the National Commission on Excellence in Education to investigate
the quality of public education in the United States. In 1983 the commission released its report
entitled A Nation at Risk. The report compiled summaries of many public research papers and
public hearings on the subject of education in the United States.
The commission’s assessment of the state of mathematics education revealed that
mathematics “curricula [had] been homogenized, diluted, and diffused to the point that they no
longer [had] a central purpose” (The National Commission on Excellence in Education, 1983, pp.
61-62). Because general expectations of student performance in mathematics had deteriorated,
the report observed that despite general grade improvement, student achievement in mathematics
had actually declined. This was a result of school time being used “ineffectively” because
educators were not “doing enough to help students develop either the study skills required to use
time well or the willingness to spend more time on school work” (pp. 64-65). They observed a
lack of teachers who possessed an understanding of the subject of mathematics, and a need for
substantial improvement in teacher preparation programs.

3
The type of pedagogy espoused by this report was markedly different from the common
pedagogies practiced at the time of the report—teacher-centered pedagogies that had not changed
much since the early twentieth century. Teacher-centered pedagogies were based upon the
assumption that only a handful of people had an innate command of mathematics. Thus,
mathematics education during the early twentieth century emphasized learning through direct
instruction, rote memorization, and recitation. The instructional goal for this approach was not
necessarily to cultivate deep content knowledge, but to teach easily applied processes and
algorithms for use by the general population. The subject of mathematics was not presented in
coherent, integrated, or conceptual wholes, but as a collection of fragments that did not develop a
sense of relationship to broader mathematical ideas and concepts (Bybee, 1997; DeBoer, 1997).
This teacher-centered approach called for an active teacher role and a passive student role.
These criticisms led mathematics educators and organizations to reevaluate how
mathematics was being taught in public schools, which resulted in the recommendations of the
NRC and NCTM documents previously listed, as well as other NCTM and NRC documents—
Curriculum and Evaluation Standards for Mathematics (NCTM, 1989), Professional Standards
for School Mathematics (NCTM, 1991), Assessment Standards for School Mathematics (NCTM,
1995, and Adding It Up: Helping Children Learn Mathematics (Kilpatrick, Swafford, Findell
2001). These documents sought to explain the nature of mathematics, how students’ inherent
understanding and curiosity are connected to mathematics, and how teachers can develop their
students’ understanding. These organizations uniformly called for teachers to decrease the
development of procedural fluency, through repeated practice of computational algorithms, and
increase emphasis on developing students’ conceptual understanding of mathematical ideas.

4
Such documents redefine what it means to be mathematically proficient in similar ways.
They suggest that teachers of mathematics should develop students’ abilities in reasoning,
problem solving, connecting mathematical ideas and concepts, and expanding their ability to
communicate their mathematical understanding. Kilpatrick, Swafford, and Findell (2001)
outlined five distinct but interdependent strands that encompass students’ mathematical
proficiency:
1. Conceptual understanding of mathematical operations and relations
2. Procedural fluency, or the skills to carry out mathematical procedures accurately,
efficiently, and appropriately
3. Strategic competence in formulating, representing, and solving mathematical problems
4. Adaptive reasoning that enables students to logically explain and justify their
mathematical thinking
5. A productive disposition about the usefulness and sensibility of math when habitually
and diligently practiced
The NCTM (2000) gives further credence to this definition of mathematical proficiency in public
schools, suggesting that when students are mathematically proficient, their conceptual
knowledge is flexible, allowing them to apply their understanding of concepts from one
mathematical setting to another. Students’ metacognitive awareness instills confidence in their
own mathematical knowledge and allows them to establish goals for themselves.
The fulfillment of these recommendations requires the establishment of a highly
interactive, inquiry-based classroom community, which also profoundly affects how children
learn mathematics. Schifter and Fosnot (1993) commented on the disconnect that occurs in
teacher-centered mathematics classrooms: “No matter how lucidly and patiently teachers explain

5
to their students, they cannot understand for their students” (p. 9). Reform documents suggest
that in order for teachers of mathematics to be more effective at helping students understand
mathematics, they need to establish classroom environments that center around student thinking.
Other inquiry-based recommendations urge teachers to establish practices that develop habits
and processes that inspire students to become progressively autonomous in mathematics (Van de
Walle, 2007).
To create an environment that supports students’ mathematical autonomy, teachers are
encouraged to put less emphasis on being the central figure during the lesson and focus more on
engaging students in mathematical tasks, facilitating mathematical discussions, and carefully
observing and assessing student understanding as they listen intently to students’ responses and
solutions (Ball, 1993; Lampert, 2001; NCTM, 2000). The Professional Standards for Teaching
Mathematics (NCTM, 1991) outlines key instructional practices that can help teachers establish
inquiry-based classrooms. According to these standards, teachers should employ the following
six practices:
1. Pose “worthwhile mathematical tasks” (p. 25)
2. “Orchestrate discourse” (p. 35)
3. Promote “classroom discourse” (p. 45) with high levels of student engagement
4. “Enhance discourse” (p. 52) through a variety of tools
5. “Create a learning environment that fosters . . . mathematical power” (p. 57)
6. Consistently analyze “teaching and learning” (p. 63)
Instructional models that follow such guidelines have been called by many names: student-
centered learning, discovery learning (Anthony, 1973; Bruner, 1961), problem-based learning
(Barrow & Tamblyn, 1980; Schmidt, 1983), and, most commonly, inquiry-based learning (Papert,

6
1980). These models generally follow the launch-explore-summarize-discuss (Schroyer &
Fitzgerald, 1986) design framework. For clarity I have chosen to refer to this big-picture type of
teaching as inquiry-based learning.
As a teacher of elementary mathematics, I have found that the implementation of inquiry-
based lessons in mathematics is very challenging and often results in confusion of a lesson’s
mathematical objectives. It is difficult to understand how to orchestrate a discussion around an
authentic task so that it addresses the concept I am teaching. I often question how much control I
should have during the lesson, how much guidance I should give, or whether I should give any at
all. How do I help students make connections from what is being discussed to the concept I am
trying to teach? Do my actions help students move forward in their mathematical reasoning, or
am I confusing them?
As I work with other teachers, I find that those teachers who attempt to engage in an
inquiry-based process have similar frustrations and often abandon such strategies for the more
comfortable and traditional role of teacher-centered teaching. Yet mathematical education
research groups like NCTM and the NRC persist in emphasizing the importance of developing
and orchestrating inquiry-based instruction.

7
Chapter 2
Review of the Literature
The central focus of this study is developing a novice teacher’s ability to orchestrate
mathematical discussions. In this chapter I will outline the characteristics of mathematical
discourse as it pertains to a classroom. I will address the many challenges that arise when
teachers—especially novice teachers—attempt to orchestrate mathematical discussions. Finally,
in response to the challenges that occur when attempting to orchestrate such discussion, I will
describe five practices established by Stein, Engle, Smith, and Hughes (2008) that claim to help
teachers facilitate mathematical orchestration.
The inquiry-based approach to teaching mathematics provides valuable learning and
teaching opportunities by encouraging students to take risks, make conjectures, and justify
claims. In this environment, correctness is determined by the logic and the structure of the
solution as well as the solution itself (NCTM, 2000; NRC, 2002; Wood, 1999). Such inquiry-
based learning communities are based on socio-cognitive and socio-culturalist theories of
learning developed and promoted by developmentalists such as Piaget and Vygotsky. These
theoretical rationales explain how individual mental functioning is related to social interaction.
For example, Piaget (1928) highlighted the importance of social interaction as a means of
promoting students’ individual reasoning. Similarly, Vygotsky (1978) conceived that social
interaction mediates children’s learning. Therefore, social interaction is fundamental to the
process of cognitive development. Vygotsky’s Social Development Theory directly addresses the
important nature of social exchange in learning:
Every function in the child's cultural development appears twice: first, on the social level,
and later, on the individual level; first, between people (inter-psychological) and then

8
inside the child (intra-psychological). This applies equally to voluntary attention, to
logical memory, and to the formation of concepts. All the higher functions originate as
actual relationships between individuals. (p. 57)
Vygotsky conceived of the learning of higher functions as a culturally embedded and
socially mediated process. Within this process of developing knowledge, first on the social level
and then on the individual level, is the internalization process involved in the transformation of
social phenomena into psychological phenomena (Cobb, Wood, & Yackel, 1990). Similarly,
Moschkovich (2007) defines mathematical discourse as both a cognitive and a social endeavor:
“Discourse is cognitive because mathematical communication involves the showing of thought
by using signs, tools, and meanings. However, discursive practices are social because students
exist within a mathematical community” (p. 25). Social interaction plays a key role in the
construction of cultural and individual meaning and in the acquisition of knowledge (Murphy,
Wilkinson, Soter, Hennessey, & Alexander, 2009).
Discourse
As sociocultural theories suggest, groups are distinguished by differing interaction patterns,
or discourses. Discourse theory focuses on the tools used within social contexts, why those tools
are used, how they communicate, and what they accomplish. Gee’s (1996) widely accepted
definition for discourse as it pertains to a sociocultural context states the following:
A discourse is a socially accepted association among ways of using language, other
symbolic expressions, and ‘artifacts’, of thinking, feeling, believing, valuing and acting that
can be used to identify oneself as a member of a socially meaningful group or ‘social
network’, or to signal (that one is playing) a socially meaningful role. (p. 131)
9
For Gee (1996), discourse includes the way of “behaving, interacting, valuing, thinking,
believing, speaking, and reading and writing” (p. viii). In essence then, discourse is how social
groups’ communications characterize and define their community.
Discursive patterns in mathematics distinguish traditional instruction from inquiry-based
instruction (Wood, 1999) and refer to the way in which students represent their thinking through
varied means of communication. The Professional Standards for Teaching Mathematics (NCTM,
1991) provides a clear definition of discourse in a mathematics classroom:
The discourse of a classroom—the ways of representing, thinking, talking, agreeing and
disagreeing (are) central to what students learn about mathematics as a domain of human
inquiry. . . .When students make public conjectures and reason with one another about
mathematics, ideas and knowledge are developed collaboratively, revealing mathematics
as constructed by human beings within an intellectual community. . . .Students learn to use
meaningful context, the tools of mathematical discourse—special terms, diagrams, graphs,
sketches, analogies, and physical models, as well as symbols. (p. 34)
Interaction aids knowledge construction; therefore, instructional strategies are more effective
when they are interactive in nature. This perspective involves the development of complex forms
of interaction and discourse that place students at the center of math instruction (Wood &
Turner-Vorbeck, 2001).
In an inquiry-based classroom, all participants bring valuable and diverse perspectives to
mathematical situations. The unique and diverse perspectives of the individuals help to generate
possible solutions to conjectures being made in service to solving the task. Students engage in
discourse through representation, justification, and generalization. Students represent what they
know through explanations, predictions, and the consideration of how to apply a solution.

10
Students are accountable to their peers and must justify their conjectures by using models and
proofs. The wise use of questioning develops the mathematics classroom into a forum where
generalizations of mathematical knowledge are constructed by means of student and teacher
responses, questions, and justifications (Brophy, 2000).
As mentioned in the Professional Standards for Teaching Mathematics (NCTM, 1991), the
teacher’s role in orchestrating discourse is a thoughtful and active exercise. It requires a deep
content knowledge of mathematics coupled with necessary skills for establishing an environment
that acknowledges students as active constructors of knowledge. Meaningful discourse is created
when the teacher engages in listening, guiding, questioning, shaping, and telling (Lobato, Clark,
& Ellis, 2005). The resultant conversational exchanges reveal students’ thinking. As students
share ideas and conjecture, the teacher’s role becomes that of a facilitator, clarifying students’
ideas and questions to enrich mathematical understanding rather than simply presenting
mathematical approaches and demonstrating procedures to solve predictable and contrived tasks
(Fennema et al., 1996; NCTM, 1991; Wood, 2001).
The students’ roles as active participants require them to express their thinking in order to
create opportunities for learning. The students generate conjectures and seek solutions to
mathematical problems using a variety of methods and tools founded upon their own connections
to prior mathematical experience. As teachers orchestrate discourse, the cooperative effort of the
students establishes an environment ripe for fostering mathematical thinking that will advance
understanding and proficiency.
The term discourse relates to all aspects of inquiry-based lessons. For example, discourse
occurs in the presentation, or launch, of a task. It also occurs during the exploration phase, when
students and teacher interact informally. Although the term discourse encompasses the idea of
11
social interaction throughout a lesson, much of discursive orchestration actually occurs in the
discussion itself.
Challenges of Orchestrating Whole-Class Discussion
Teachers face many challenges when attempting to orchestrate whole-class discussion
and purposefully use students’ responses to advance whole-class understanding (Ball, 1993;
Lampert, 2001; Stein et al., 2008). For novice teachers, using student-centered discussion as a
method of instruction may seem as though the teacher does not provide any guidance to the
students, but rather allows the students to control the pace and direction of the lesson (Chazen,
2000; Chazen & Ball, 1999). Unpracticed teachers may also worry that an open forum format
welcomes a wide array of responses which, if not prepared for, may misdirect the purpose of
student-centered discussion and, ultimately, lead to misinterpretations. The lack of control
teachers may feel when attempting to orchestrate student-centered discourse is likely to result in
a diminished sense of teacher self-efficacy.
On the other hand, Smith (1996) stated that using a teacher-centered method “allows
teachers to build a sense of efficacy by defining a manageable mathematical content that they
have studied extensively and then providing clear prescriptions for what they must do with that
content to affect student learning” (p. 388). The current inquiry-based methods remove both of
these supports. Smith (1996) also noted that in a student-centered, inquiry-based classroom, “the
mathematics that teachers know best is reduced in value, substantial emphasis is given to
unfamiliar content, and only the most general instructional principles are provided for teaching
that content” (p. 388).
Smith’s observation echoes the way many teachers misinterpret the practice of utilizing
mathematical discussion. This misinterpretation may account for why teachers often struggle to
12
utilize such strategies appropriately. Teaching that centers around student responses may seem
like an open forum where all responses are presented with little filtering by the teacher and
without any attempt to highlight specific strategies that lead to solutions. However, this idea of
orchestrating a mathematical discussion with broad, non-specific goals, which has been referred
to as “show and tell” (Ball, 2001), distorts both the meaning and purpose of engaging students in
a mathematical discussion. Overlooking the importance of goals and outcomes in the course of
orchestrating a discussion will cause teacher frustration because such discussions lack structure
and effectiveness.
In addition, teachers who are new to orchestrating discussions will undoubtedly look to
teacher-educators and experienced practitioners to model and make sense of discussion
orchestration. Novice teachers who observe highly skilled facilitators and practitioners of
discourse may become perplexed by the seemingly improvisational and effortless approach to
conducting math-based discourse (Borko & Livingston, 1989; Sherin, 2002). The ability to
improvise requires extensive knowledge of content, pedagogy, and developmental theory. This
knowledge is often limited for teachers, particularly elementary school teachers, whose training
and mathematical content knowledge is limited. This lack of training and content knowledge
leads many teachers to feel that implementing a discussion is ineffective and often frustrates and
confuses students rather than moving their understanding forward (Chazen & Ball, 2001; Lobato
et al., 2005). For example, after studying inquiry-based instruction methods in my graduate
classes, I attempted to use them in my mathematics instruction. I planned to present a task and let
students develop their own strategies for a solution. Without anticipating what thinking might
surface and what thinking I would use to help direct the lesson, the discussion quickly went from
an exploration of a mathematical idea to an open-ended discussion that ultimately became a
13
fruitless and time-consuming endeavor—fruitless because students were voicing every reasoned
strategy to solve the task, many of which were misconceived and incorrect. The many open-
ended responses left most of my students confused and frustrated. I also felt their frustration as I
lost a day of mathematical instruction and now had to address not only the concept, but also the
many different misconceptions that had arisen during the lesson. This type of frustration can
cause teachers to feel a decrease in efficacy, which discourages them from orchestrating
discussions and using inquiry-based instruction.
Novice teachers need to prepare themselves to facilitate mathematical discussions in a
manner that allows them to feel a sense of control (Stigler & Hiebert, 1999). Novice teachers
often fail to understand how to direct a discussion while placing the responsibility for
constructing knowledge upon the students. This skill requires teachers to recognize when
important mathematical ideas are being developed or when to intervene and redirect
conversations. However, guidance that helps teachers acquire the skills to monitor and, when
necessary, intervene appropriately in discussion, seems to be limited (Ball, 1993; Lampert, 2001;
Wood & Turner-Vorbeck, 2001). Teachers need a framework that is straightforward in its
implementation and will aid them in understanding the mechanics of taking an inquiry-based
approach by facilitating mathematical discussions (Stein et al., 2008).
Five Practices for Facilitating Mathematical Discussion
In response to the struggles that teachers face when attempting mathematical discussions,
Stein et al. (2008) suggest five practices that will help mathematics teachers conduct discussions
in practical and intuitive ways. They believe that “novices need a set of practices they can do to
both prepare them to facilitate discussions and help them gradually and reliably learn how to
become better discussion facilitators over time” (p. 321). The five practices were created to make

14
discussion orchestration manageable for novice teachers by de-emphasizing the improvisational
aspect of orchestrating mathematical discussions and shifting the focus instead to preparing for a
well-planned discussion.
1. “Anticipating likely student responses to cognitively demanding mathematical tasks”
(p. 321). Rather than simply determining whether or not students will solve the task
correctly, this practice involves anticipating how students will tackle a particular task,
and how that thinking, be it well conceived or misconceived, relates to the
mathematical ideas, strategies, and/or representations the teacher wants the students to
learn.
2. “Monitoring students’ responses to the tasks during the explore phase” (p. 321). As
teachers interact with students during exploration, they pay close attention to the
thinking that is elicited. They should not simply attend to which students are
successful and which are struggling, but more importantly, they should attend to the
underlying mathematics associated with the thinking they observe and hear. The
anticipation of thinking associated with practice 1 enhances a teacher’s ability to
engage in monitoring.
3. “Selecting particular students to present their mathematical responses during the
discuss-and-summarize phase” (p. 321). Because the teacher has anticipated the
thinking that may arise from the task, also it is possible to anticipate which elements
of that thinking will be shared in the discussion. In other words, anticipating potential
thinking enables the teacher to plan the discussion in advance. Then while monitoring
student thinking during the exploration, the teacher can look for students who exhibit
the anticipated thinking—both well conceived and misconceived—and select those

15
students to share during the discussion. Of course, monitoring may reveal
unanticipated thinking that may also be shared.
4. “Purposefully sequencing the student responses that will be displayed” (p. 321).
Deliberate choices about the order in which student thinking is shared can move the
thinking of a whole class forward. By moving from concrete, less complex thinking to
more abstract and complex thinking in the course of the discussion, all learners can
access the shared thinking and develop more advanced ways of thinking as the
discussion progresses. The planning associated with the selecting of thinking to share
is accompanied by the sequencing of that sharing. Thus, when decisions are made
during the monitoring as to which students will actually do the sharing, accompanying
decisions about the order of that sharing are also made. As is the case with the
previous practice, the sequencing decisions made during monitoring may adjust the
planned sequencing.
5. “Helping the class make mathematical connections between different students’
responses and between students’ responses to key ideas” (p. 321). To assist students
with the advancing of their own thinking during the discussion, teachers should make
a number of explicit moves to encourage students to make connections among the
ideas, strategies, and representations that are shared. This avoids the “show and tell”
phenomenon; rather than having discussions that consist of separate presentations,
student presentations build on each other to promote deep thinking among all
discussion participants.
Stein, et al. (2008) proposed that the implementation of these five specific practices for
developing mathematical discussions will increase the likelihood that teachers will use inquiry-

16
based methods to advance students’ conceptual knowledge while extending the teachers’ own
abilities to orchestrate and support discourse. The purpose of the study was to investigate my
implementation of these five practices for facilitating mathematical discussions around
cognitively demanding tasks. In doing this, it was my intent as a novice teacher of inquiry-based
mathematics to develop a pedagogy that encourages student learning through the process of
inquiry.
Research Questions
Stein et al. (2008) demonstrated that richer mathematical discussions resulted from the
implementation of the five practices. When I have observed expert teachers orchestrating
mathematical discussions while employing inquiry-based teaching, it appeared effortless. When I
have tried to do likewise, little learning ensued in the midst of the chaos I created. In my study, I
applied the five practices suggested by Stein et al (2008) in order to improve my mathematical
instruction, particularly the orchestration of mathematical discussion. Thus, the purpose of this
study was to investigate my efforts to implement those practices. I wanted to find out what
would happen when I used the five practices as a guide for orchestrating discussions.
Additionally, I wanted to examine trends in my decision-making relative to those practices that
occurred over the course of an instructional unit. To that end, I investigated the following
specific features related to the five practices.
In order to determine how well I was “anticipating likely student responses to cognitively
demanding mathematical tasks” (Stein et al. 2008, p. 321), I investigated how the thinking I
thought would occur compared to the thinking I actually observed. I was concerned with
thinking that was well conceived along with thinking that was misconceived.

17
The “monitoring of students’ responses to the tasks during the explore phase” (p. 321)
requires a new type of teacher-student interaction while students work independently, either in
small groups or alone. Rather than checking to see if students were “doing the math right” while
working independently and providing little snippets of direct instruction if they were not, I
interacted with individual students in order to assess what mathematics they were thinking about
and the level of complexity of that thinking. I then compared that thinking to the thinking I had
anticipated. Additionally, I wanted to promote deeper levels of thinking through those
interactions. Therefore, I worked on asking questions rather than simply checking student work
or telling students how to think, and I tried to interact with as many students as possible. I
wanted to know how many students I interacted with, how often I interacted with them, and what
levels of thinking characterized those interactions in the explore phase.
As a result of anticipating the thinking that might occur as students engaged in the tasks I
presented, I planned what thinking would be shared during the discuss phase and in what order—
“selecting particular students to present their mathematical response during the discuss-and-
summarize phase” and “purposefully sequencing the student responses that will be displayed” (p.
321). Then during the explore phase, I looked for that thinking as well as other thinking I did not
anticipate that could be shared. I then decided which students would share and in what order. To
get a sense for how well I was able to plan my discussions in advance, I compared my plans for
sharing student thinking to the sharing decisions made in the course of the lesson.
During the lessons, I focused on “helping the class make mathematical connections
between different students’ responses and between students’ responses to key ideas” (p. 321),
which required a whole new set of skills. My goal was to get as many students involved in the
discussion as possible, to involve the whole class in the pursuit of mathematically-rich ideas any

18
time they occurred, and to promote deeper or higher levels of thinking in the process. To get a
sense of how well I was accomplishing my goal, I wanted to know how many students verbally
participated in the discussions, how often student comments were pursued, how involved the
students were in pursuing a comment, and the depth of thinking associated with all of this
interaction. The instructional goals were closely linked to the practices outlined by Stein et al.
(2008) and directed the structure of the lesson and also influenced the research questions I
wanted to answer. Therefore, this study was designed to address the following questions.
1. How did the thinking I thought would surface as a result of engaging in the task I
presented compare to the thinking I actually observed?
2. What was the nature of the interaction between the students and me while I monitored
student thinking during the explore phase?
3. How did my plans for sharing student thinking compare to the sharing decisions made
in the course of the lesson?
4. What was the nature of engagement in the discussions I orchestrated?
In summary, the research suggests that orchestrating discussion is a key teaching practice
that can aid in the development of mathematical proficiency. Although both teacher education
and professional development programs stress the importance of improving teachers’ discussion-
orchestration skills, teachers of mathematics still find it difficult to implement these strategies in
their teaching practice. To provide teachers with a structure for a seemingly amorphous practice,
Stein et al. (2008) developed a model consisting of five practices that teachers can use to
improve mathematics discussions and elicit student interactions that advance their mathematical
understanding. I used these five practices to improve my own discussion orchestration and
studied what happened when I did.

19
Chapter 3
Methods
Stein et al.’s (2008) framework, as described in Chapter 2, gives form and function to the
task of orchestrating mathematical discussion. The framework dispels the notion that discussion
orchestration is entirely improvisational and encourages the development of goal-oriented
discussions (Stein et al., 2008). My study examined the implementation of this framework by
investigating how its implementation affected my ability to orchestrate rich mathematical
discussions during a unit of instruction. Over the course of the study, I monitored my
development as a discussion facilitator as I implemented the framework for orchestrating
discussions. I prepared a two-week mathematical unit of study. Then, using the framework, I
attempted to answer the following questions.
1. How did the thinking I thought would surface as a result of engaging in the task I
presented compare to the thinking I actually observed?
2. What was the nature of the interaction between the students and me while I monitored
student thinking during the explore phase?
3. How did my plans for sharing student thinking compare to the sharing decisions made
in the course of the lesson?
4. What was the nature of engagement in the discussions I orchestrated?
Research Design
The focus of this research study was to examine personal practice; therefore, a practical
action research approach was best suited for this study. Practical action research is used when
teachers seek to examine existing problems in their own classrooms for the purpose of improving
their students’ learning and their own professional performance (Creswell, 2008). I used the
20
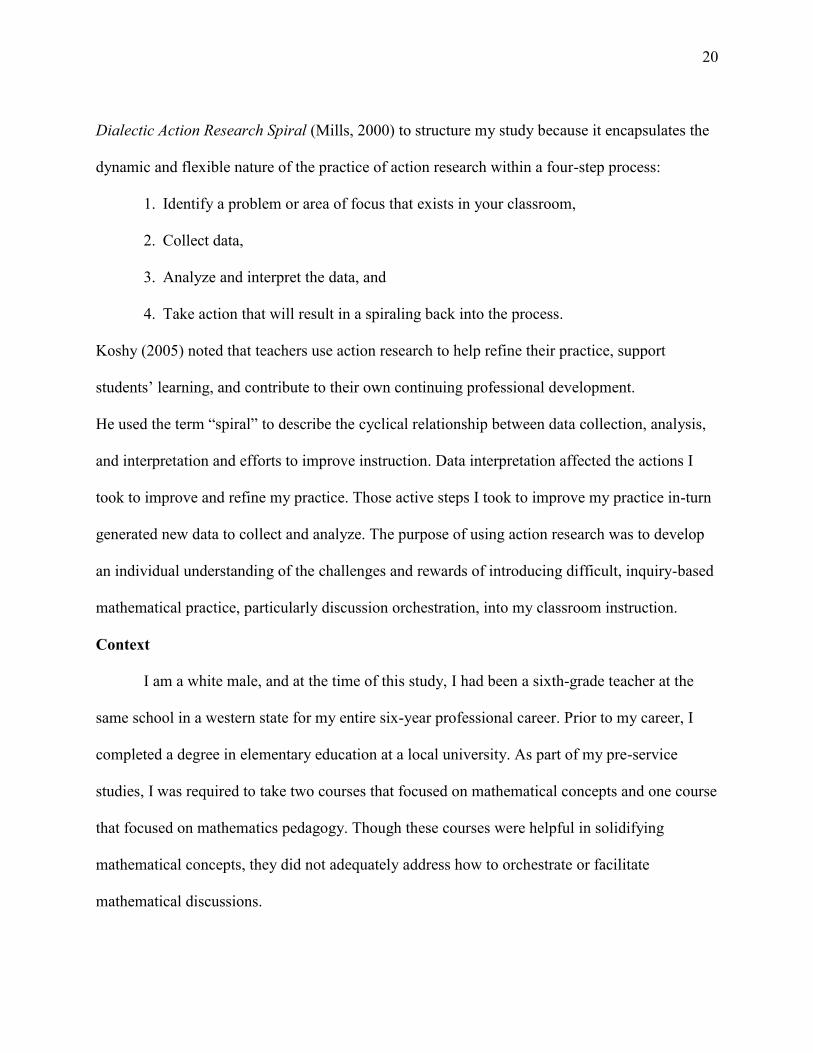
Dialectic Action Research Spiral (Mills, 2000) to structure my study because it encapsulates the
dynamic and flexible nature of the practice of action research within a four-step process:
1. Identify a problem or area of focus that exists in your classroom,
2. Collect data,
3. Analyze and interpret the data, and
4. Take action that will result in a spiraling back into the process.
Koshy (2005) noted that teachers use action research to help refine their practice, support
students’ learning, and contribute to their own continuing professional development.
He used the term “spiral” to describe the cyclical relationship between data collection, analysis,
and interpretation and efforts to improve instruction. Data interpretation affected the actions I
took to improve and refine my practice. Those active steps I took to improve my practice in-turn
generated new data to collect and analyze. The purpose of using action research was to develop
an individual understanding of the challenges and rewards of introducing difficult, inquiry-based
mathematical practice, particularly discussion orchestration, into my classroom instruction.
Context
I am a white male, and at the time of this study, I had been a sixth-grade teacher at the
same school in a western state for my entire six-year professional career. Prior to my career, I
completed a degree in elementary education at a local university. As part of my pre-service
studies, I was required to take two courses that focused on mathematical concepts and one course
that focused on mathematics pedagogy. Though these courses were helpful in solidifying
mathematical concepts, they did not adequately address how to orchestrate or facilitate
mathematical discussions.

21
At the time of this study the sixth-grade team of which I was a part of functioned as a
professional learning community (PLC). We worked collaboratively by sharing ideas and
teaching strategies, by collectively seeking solutions to problems that our students faced, and we
developed our mathematics units together. As a member of a sixth-grade team, I was required to
follow the pacing inherent within those units in order to meet the common assessment standards
we had created as a PLC. The design of the lessons developed from those unit plans had tended
to be quite traditional, based upon a perspective that defines teaching as primarily a telling
endeavor. Relying heavily on mathematical discussion as a vehicle for moving the understanding
of all students forward, I departed from the traditional teaching approach and attempted to
implement inquiry-based methods that I studied during my graduate course work.
The unit was designed from the Common Core State Standards-Mathematics (2010)
domain of Statistics and Probability, Standards 6.SP.1-6.SP.5.d. It focuses developing student
understanding of the concepts of mean, median, mode, range, and the use of data and graphs to
measure variability with emphasis on finding mean variability. Conducting my study in the
context of teaching this topic was both strategic and necessary. It was strategic because
teaching variability and mean deviation is fairly new to the sixth-grade core curriculum. At the
time of this study I had only taught these concepts once the previous year, which provided me
with an opportunity to use unfamiliar practices to teach a foreign concept. Thus, not only was I a
novice in using orchestrating discussions but I was also a novice in teaching this specific topic.
Teaching this topic was also necessary because it was the topic called for by my PLC’s
curriculum map, and I generally seek to remain aligned with the other teachers in my PLC when
it comes to the timing of mathematics instruction.

22
Participants
Because this study was used to analyze my teaching practice and how a specific
instructional framework was used to improve my ability to conduct and facilitate mathematical
discussions, the intended focus was my teaching practice. However, student participation was a
vital part of this study, so observations of that participation provided important data. Therefore,
the students in my sixth-grade classroom were considered participants. The 33 students in my
class—17 girls, 16 boys—came from middle-class and lower middle-class backgrounds. I was
not required to group my students by ability for mathematics instruction; therefore, my students’
mathematical abilities ranged from remedial to advanced, including two students who received
an Individual Education Plan in mathematics. Their identities were kept anonymous. Students’
test scores and performance assessments were not relevant to this study and therefore were not
used.
Data Sources
Two data sources were used to study the implementation of the practices and their effect
upon mathematical discourse in my class. The first data source was the individual lesson plans I
developed to guide my instruction. The written plans provided a portrait of how I anticipated
student thinking, the first practice of the framework, as well as the anticipated selecting and
sharing decisions associated with conducting the discussion, the third and fourth practices. As I
planned each lesson, I worked through the task or tasks in an effort to anticipate how my students
might think about them, writing my anticipations on the lesson plan itself, then used the
anticipated thinking to plan the sharing. Copies of the lesson plans can be found in the appendix.
Video recordings of the lessons served as the second data source. The video recordings
focused on the launch, explore, and discuss phases of the actual lesson. During the launch and

23
explore phases, the video focused on my interactions with students. These interactions occurred
as I presented the task and monitored the students exploring possible solutions, occasionally
asking about their thinking. In the final phase, named the discussion phase, the discussion
becomes the focal point of the lesson; the video recorded whoever was speaking, which could
have been the sharing students, listening students, or the teacher. These recordings were used to
compare the anticipations just described to actual implementation via live feed coding. I
compared the thinking I anticipated to the thinking that actually surfaced, the thinking I planned
to have shared with the thinking that was actually shared, and the planned sequence of that
sharing with the actual sequence of sharing—issues related to research questions 1 and 3.
Additionally, the video recordings provided a record of the interactions that characterized the
explore and discuss phases of my lessons—issues related to questions 2 and 4.
Data Analysis
The five practices not only guided my efforts to enhance my discussion orchestration, but
they also framed my study of those efforts as discussed in Chapter 2. Analysis was conducted on
two levels—an exploration of data (Cresswell, 2008) to produce descriptions of what occurred
during specific lessons, and then analyses of trends across all the lessons within the unit. Level 1
analysis consisted of coding via a priori codes that reflect the features that characterize each of
the five practices as explained in Chapter 2. Level 2 analysis examined the trends that arose as
my students and I engaged in mathematical discussions, examining the cross-lesson effects of
utilizing the framework upon my teaching practice and the students’ participation in the
discussions. Thus, the features associated with Stein et al.’s (2008) five practices served as an a
priori coding system for Level 1 analysis, upon further examination and interpretation of data,
additional codes were developed in order to describe present and possible emerging themes,

24
patterns, or trends that arose over time (Cresswell, 2008). Therefore, the Level 2 analysis
examined my practice across lessons within the unit and the trends associated with that practice,
trends that revealed consistent moves across lessons in some cases, or patterns of change or
improvement in other cases. Specific data analysis procedures relating to both analysis levels
will be discussed in the following paragraphs, organized by the five practices and the research
questions associated with them.
Anticipating likely student responses. The first step in orchestrating whole-class
mathematical discussions is to anticipate likely student responses to the mathematical tasks. I
recorded my lesson planning on a simple lesson plan template based on the Comprehensive
Mathematics Instruction Framework (Hendrickson, Hilton, & Bahr, 2008; see Appendices A–F).
As part of my lesson planning, I recorded the thinking I predicted would surface during lesson
implementation, i.e., my preconceived notions of what thinking would be present during both the
explore and discuss phases, including possible misconceptions that might occur. I also
investigated how the thinking I thought would occur compared to the thinking I actually
observed. I was concerned with thinking that was well conceived along with thinking that was
misconceived.
Level 1 analysis consisted of watching the video recordings and comparing the thinking I
observed to the thinking I anticipated. That is, I noted the thinking I anticipated that did occur,
the thinking I anticipated that did not occur, and the thinking that occurred that I did not
anticipate. While watching the video, I labeled any thinking that I had anticipated as “observed.”
The thinking on the lesson plan that I did not observe was not labeled. When I observed thinking
that I had not anticipated, I wrote it on the lesson plan. Then I labeled it with the words “proper
conception” or “misconception.” These labels were tallied. I engaged in Level 2 analysis by

25
examining the trends in those tallies across lessons within the unit. These analyses were based on
the first pass through the data.
Monitoring students’ responses. The practice of monitoring student responses occurred
during the explore phase of the math lessons. I wanted to know how many students I interacted
with, how often I interacted with them, and what levels of thinking characterized those
interactions in the explore phase. Using the video recordings, I noted which students I chose to
interact with. Then I coded those interactions based on the cognitive level of the questions I
asked the students according to the Hybrid List of Thinking Levels (Bahr, Bahr, & Monroe, 2011)
as shown below in Table 1. I then tallied the number of interactions per student and the number
of questions at each level of thinking I observed. The Hybrid List of Thinking Levels (Bahr, Bahr,
and Monroe, 2011) was developed as a framework for analyzing thinking levels students’ surface
during mathematical discussions. The authors used existing frameworks, and then augmented
them through the process of examining the practice of a veteran teacher. The least complex
levels are listed at the top of the table and the most complex levels are listed at the bottom. There
is a gradual increase in cognitive level from top to bottom. Therefore only thinking levels that
were present during the explore phase were recorded.
Level 2 analysis occurred in two parts. The first part consisted of tallying the number of
times I interacted with each student across all six lessons and tallying the total number of
interactions per lesson. I then computed an average and range of interactions per student across
all lessons. The second part consisted of comparing the number of questions per level per lesson
within each lesson as well as across all lessons. Because the Hybrid List of Thinking Levels and
Definitions was used in the analyses related to Practice 2, which occurs in the explore phase, and
Practice 5, which occurs in the discuss phase (Research Questions 2 and 4), the second part of

26
Level 2 analysis consisted of comparing the data across both practices. Specifically, I compared
which levels of thinking appeared, the number of times those levels appeared, and tendencies
toward lower or higher levels of thinking. These analyses were based on the second pass through
the data.
Table 1
Hybrid List of Thinking Levels and Definitions
Selecting and sequencing students’ responses. Because Practice 3 and Practice 4 occur
together in both planning and implementing, the analysis procedures relative to both practices
occurred at the same time and are therefore discussed together here. During the explore phase,
the practice of selecting students to share their responses to the whole class during the discuss
phase of the lesson, as well as the order in which that thinking is shared, is influenced by the first
practice of anticipating likely student responses to cognitively demanding mathematical tasks. In
Thinking levels Explanation
Short answer Very, very brief response; often an answer to a question
Brief statement A little more information than an answer but not very rich
Description A rich verbalization of thinking
Clarification Making a description or other verbalization more clear
Elaboration Adding more information to a verbalization
Representation Showing thinking in one or more ways
Translation Communicating in words or in other ways
Comparison Determining whether or not strategies, ideas, or representations are the same or not
Relation Determining how strategies, ideas, or representations are similar or different
Justification Explaining why thinking is mathematically sensible
Challenge/support Agreeing or disagreeing
Proof Arguing for consistency within a large domain
Generalization Looking for patterns, applying to different situations, predicting

27
order to get a sense for how well I was able to plan my discussions in advance, Level 1 analysis
consisted of a comparison of my plans for sharing student thinking to the sharing decisions made
in the course of the lesson. These decisions related to both what thinking would be shared and in
what order. While watching the videos I noted the thinking I selected during the explore phase. I
wrote “shared” next to each piece of thinking on the plan that was actually shared. If the
unanticipated thinking I recorded relative to Practice 2 (Research Question 2) was also shared, I
wrote the word “shared” next to it as well. These labels were tallied. Level 2 analysis consisted
of examining trends in these tallies across all lessons.
Although Stein et al. (2008) list purposeful sequencing as a separate practice, it actually
occurs right after, if not during the practice of selection. Therefore, Level 1 analysis related to
this practice is similar to the analysis associated with Practice 3 and occurred at the same time. I
wrote numbers next to the thinkings I planned to share on the lesson plans to indicate the order in
which I intended to have them shared. While watching the recordings, I wrote numbers next to
the thinkings again in order to record the order in which they were actually shared. I then tallied
the number of times the two sets of numbers matched each other. I only examined the
sequencing of thinking I planned to share, although there was unanticipated thinking that was
also shared. Level 2 analyses consisted of examining trends in these numbers across all lessons.
The analyses relative to both practices were based on the third pass through the data.
Helping students make mathematical connections.
During a discussion, the members of the class fulfill multiple roles. Some of the students
are invited to share their problem-solving thinking to the whole class, while others are invited to
respond to that thinking as a result of their listening role. My goal was to get as many students
involved in the discussion as possible, to involve the whole class in the pursuit of mathematically

28
rich ideas anytime they occurred, and to promote deeper or higher levels of thinking in the
process. To get a sense of how well I was accomplishing my goal, I wanted to know how many
students verbally participated in the discussions, how often student comments were pursued, how
involved the students were in pursuing a comment, and the depth of thinking associated with all
of this interaction.
I segmented each lesson’s discussion into parts according to when a new student or new
group of students initially shared their thinking about the task. Thus each segment consisted of
some initial sharing, then responses by the listening students, further responses by the students
who initially shared, and me. While analyzing the six lesson discussions, I noted the nature of the
decisions made whenever a sharing or listening student said something. The first decision
concerned whether or not to pursue, or follow up, on the student comment. If so, the next
decision concerned who should pursue the comment—the student who made the comment, one
of the listening students, or me. The third decision was concerned with the cognitive level at
which those pursuits were directed to occur, similar to the analysis related to Practice 2.
The Level 1 analysis relating to these decisions categorized student comments as to
whether or not they were pursued, who was assigned to pursue them, and the cognitive levels at
which those pursuits occurred. I used the Hybrid List of Thinking Levels and Definitions to
measure the level of thinking that students shared during both the explore and the discuss phases
of the lesson. As in Practice 2 (Research Question 2), Practice 5 (Research Question 4) analysis
counted the number of thinking levels and how often those levels were presented during each
lesson. Counts were made of the codes associated with these decisions for each lesson. As in
Practice 2, some thinking levels did not surface during the discussion. Level 2 analysis consisted
of examining trends in these counts across lessons. Level 2 analysis consisted of comparing the
29
data across both practices. Specifically, I compared which levels of thinking appeared, the
number of the levels, the number of times those levels appeared, and tendencies toward lower or
higher levels of thinking. These analyses were based on the fourth pass through the data.
Analysis Reliability
In order to ensure analysis reliability, my thesis chair and I jointly analyzed the data
associated with each practice. We jointly analyzed the data obtained from the first three lessons,
negotiating the assignment of codes and labels based upon our individual perspectives until we
reached consensus. By the third lesson, we observed more than 90% agreement among our
individual perspectives, so we independently analyzed the fourth lesson. There was also a more
than 90% agreement associated with that analysis, so I performed analyses associated with the
final two lessons myself.
Limitations
This study focuses primarily upon my own practice and experience as a sixth-grade
teacher. The results of this study are not fit for generalization in the strictest sense of the word.
However, the results of this study may prove to be useful for teachers and teacher educators who
are interested in developing discussion-orchestration abilities.

30
Chapter 4
Findings
The findings of this study are organized and reported according to the previously
discussed research questions and the corresponding features of the five practices developed by
Stein et al. (2008). For instance, the findings relating to “anticipating likely student responses to
cognitively demanding tasks” (Stein et al., 2008) will be presented first, followed by findings
related to “monitoring students’ responses to the tasks during the explore phase” (Stein et al.,
2008), and so on. As in Chapter 3, the research questions and associated practice features will be
discussed together. I will report the findings that have been analyzed directly from data
collection. The deeper meaning of these findings will be further discussed in Chapter 5.
Anticipating Likely Student Responses
To analyze my thinking regarding this practice, I examined how my anticipation of
student thinking compared with the actual student thinking that surfaced during the math
lesson—both proper conceptions and misconceptions. That is, I noted the thinking I anticipated
that did occur, the thinking I anticipated that did not occur, and the thinking that occurred that I
did not anticipate, both proper conceptions and misconceptions. These categorizations were
tallied and appear in Table 2.
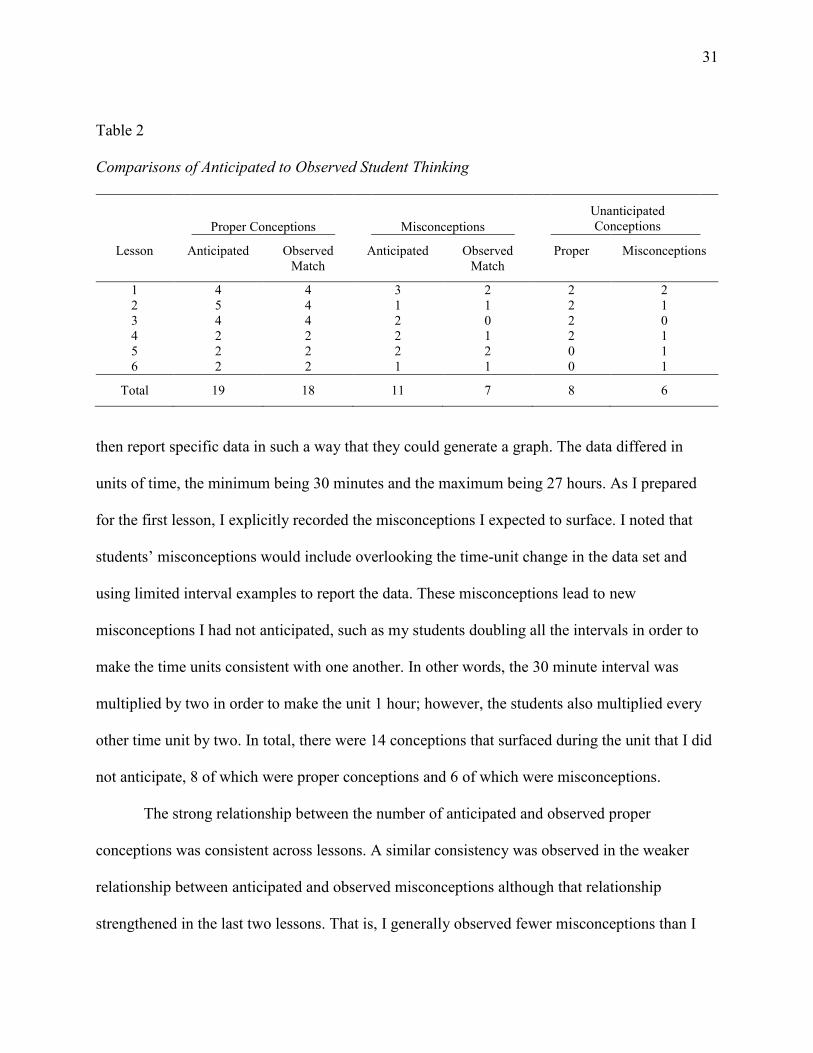
I anticipated that my students would construct 19 proper conceptions. Of those 19, only
one proper conception that I anticipated did not surface during the math lessons. This indicated a
high relationship between the proper conceptions I anticipated and those I observed. The
relationship between anticipated misconceptions and observed misconceptions was different.
Throughout the unit, I anticipated 11 misconceptions would surface during the math lessons. Of
those, only seven surfaced. For example, the task for Lesson 1 required students to organize and
31
Table 2
Comparisons of Anticipated to Observed Student Thinking
Proper Conceptions
Misconceptions
Unanticipated Conceptions
Lesson Anticipated Observed Match
Anticipated Observed Match
Proper Misconceptions
1 4 4 3 2 2 2 2 5 4 1 1 2 1 3 4 4 2 0 2 0 4 2 2 2 1 2 1 5 2 2 2 2 0 1 6 2 2 1 1 0 1
Total 19 18 11 7 8 6
then report specific data in such a way that they could generate a graph. The data differed in
units of time, the minimum being 30 minutes and the maximum being 27 hours. As I prepared
for the first lesson, I explicitly recorded the misconceptions I expected to surface. I noted that
students’ misconceptions would include overlooking the time-unit change in the data set and
using limited interval examples to report the data. These misconceptions lead to new
misconceptions I had not anticipated, such as my students doubling all the intervals in order to
make the time units consistent with one another. In other words, the 30 minute interval was
multiplied by two in order to make the unit 1 hour; however, the students also multiplied every
other time unit by two. In total, there were 14 conceptions that surfaced during the unit that I did
not anticipate, 8 of which were proper conceptions and 6 of which were misconceptions.
The strong relationship between the number of anticipated and observed proper
conceptions was consistent across lessons. A similar consistency was observed in the weaker
relationship between anticipated and observed misconceptions although that relationship
strengthened in the last two lessons. That is, I generally observed fewer misconceptions than I

32
anticipated. Every lesson was accompanied by thinking that I did not anticipate—sometimes
only proper conceptions, sometimes misconceptions, and sometimes both.
Monitoring Students’ Responses
Two different analyses were conducted regarding the practice of monitoring students’
work during the explore phase. Interactions were defined as mathematical dialogues between me
and an individual student or a small group of students. The first analysis consisted of tallying the
number of times that an individual student, small group of students, or I initiated a mathematical
interaction as shown in Tables three and four. Specifically, I tallied the number of times I
initially interacted with each individual or small group across all six lessons. I then totaled the
number of interactions per lesson.
Table 3
Number of Initial Explore Interactions per Lesson
Lesson Interactions
1 38 2 17 3 7 4 9 5 17 6 30
Total 118
The number of interactions per lesson ranged from seven to 38 with a mean of
approximately 19 overall interactions and three interactions per student per lesson. However the
number of interactions with individual students across all lessons ranged from zero to 11. These
data do not reveal any general or consistent pattern that would specify how I interacted with any
students or how those interactions were distributed across lessons. Some students were not
interacted with at all, some were only interacted with once or twice across all six lessons, and
33
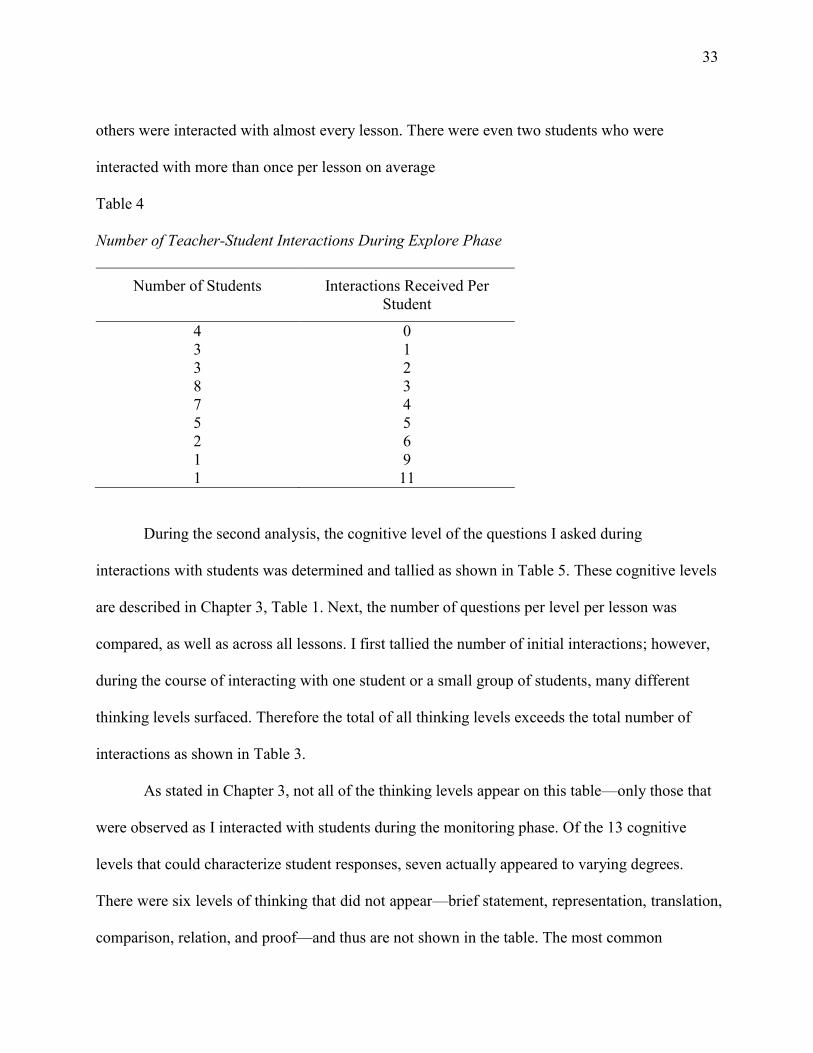
others were interacted with almost every lesson. There were even two students who were
interacted with more than once per lesson on average
Table 4
Number of Teacher-Student Interactions During Explore Phase
Number of Students Interactions Received Per Student
4 0 3 1 3 2 8 3 7 4 5 5 2 6 1 9 1 11
During the second analysis, the cognitive level of the questions I asked during
interactions with students was determined and tallied as shown in Table 5. These cognitive levels
are described in Chapter 3, Table 1. Next, the number of questions per level per lesson was
compared, as well as across all lessons. I first tallied the number of initial interactions; however,
during the course of interacting with one student or a small group of students, many different
thinking levels surfaced. Therefore the total of all thinking levels exceeds the total number of
interactions as shown in Table 3.
As stated in Chapter 3, not all of the thinking levels appear on this table—only those that
were observed as I interacted with students during the monitoring phase. Of the 13 cognitive
levels that could characterize student responses, seven actually appeared to varying degrees.
There were six levels of thinking that did not appear—brief statement, representation, translation,
comparison, relation, and proof—and thus are not shown in the table. The most common

34
cognitive levels were description (60), clarification (49), and justification (21).
Challenge/support, elaboration, short answer and generalization appeared less frequently. The
thinking levels absent from the discussion were brief statement, translation, comparison, and
proof.
Table 5
Occurrences of Cognitive Level of Teacher Interactions During Explore Phase
Lesson SA D CA E J C/S G
1 0 16 12 0 5 0 0 2 0 2 3 2 0 0 0 3 1 8 1 1 3 0 0 4 0 3 6 0 6 0 1 5 2 9 14 0 3 1 0 6 0 22 13 0 4 3 0
Total 3 60 49 3 21 4 1 Note. SA = short answer; D = description; CA = clarification; E = elaboration; J = justification;
C/S = challenge/support; G = generalization.
Selecting and Sequencing Students’ Responses
Because the process of selecting students to share during the discuss phase is linked to
the process of sequencing as discussed in Chapter 3, the results of analyses relating to these two
practices are shown together. As I planned each lesson I anticipated specific thoughts and
strategies that might surface during the explore phase and would then be shared during whole-
class discussion. I also planned the order in which those thinkings would be shared, assuming
they actually surfaced. However, I also knew there might be thinkings I did not anticipate.
During my examination of the recordings I compared the thinkings I anticipated sharing to the
thinkings I actually shared. Additionally, I compared the order in which the thinkings were
shared to the order in which I planned to share them.

35
Table 6 displays the number of ideas I intended to share as described by the lesson plans
for each day, the number of those ideas that were actually shared, and the number of unintended
shared ideas that occurred. The last column in the table summarizes the comparison between the
planned sequence of sharing and the sequence that actually occurred. Because the planned
sequence was based on the thinking that was anticipated to occur, the only relevant thinking to
this analysis was the observed thinking that matched the anticipated. In other words, anticipated
thinking that was not observed, as well as unanticipated thinking that was shared, were not
considered in the analysis related to sequencing and is not accounted for in the table below.
Table 6
Intended and Observed Sharing and Sequencing
Lesson Intended Sharings Intended Sharings Observed
Unintended Sharings Matches Between Intended and
Observed Sequencing
1 4 2 1 2 2 3 2 0 2 3 2 2 1 2 4 2 1 2 1 5 2 1 0 1 6 2 2 0 2
Total 15 10 4 10
Of the 15 overall thinkings I intended to share, 10 of them were actually shared. There
was only one lesson, Lesson 6, in which the intended sharing and sequencing matched the actual
sharing and sequencing that occurred during the lesson. In Lesson 2, Lesson 4, and Lesson 5, I
selected fewer strategies to share than I had previously anticipated. In Lesson 1 and Lesson 3, I
selected more strategies to share than I had previously anticipated. If only examining the

36
sequence of sharing I anticipated is considered, then the sequence that my students actually
shared always matched the actual sequencing.
Helping Students Make Mathematical Connections
During a discussion, the members of the class fulfill multiple roles. Some of the students
are invited to share their problem-solving thinking to the whole class, while others are invited to
respond to that thinking as a result of their listening role. The teacher orchestrates the discussion,
and on occasion, participates in a manner similar to the listening students. The expectation is for
students to interact with one another during the lesson in order to build the mathematical
understanding of all. All three roles were observed in every lesson.
While analyzing the six lesson discussions, I noted the nature of the decisions made in the
moments whenever a sharing or listening student said something. The first decision concerned
whether or not to pursue, or follow up, on the student comment. If yes, then the next decision
concerned who should pursue the comment—the student who made the comment, another
student, or myself. The third decision was concerned with the cognitive level at which those
pursuits were directed to occur, similar to the analysis related to Practice 2. The first analysis
relating to these decisions categorized them as to whether or not they were pursued and who was
assigned to pursue them. These categorizations were then tallied, as shown in Table 7. As
discussed in Chapter 3, the discussion was divided into segments according to when a new
student or group of students shared their thinking about the task. Thus each segment began with
some initial sharing, and then continued with responses, or “pursuits,” by the listening students,
the sharing student or students, and me. The number of sharing students is displayed along with

37
the number of times pursuits were conducted by those students, the listening students, and by me.
The number of student comments that were not pursued is also shown.
Table 7
Pursuits of Questions During Connection Practice
Lesson
Initial Sharing
Pursuits by Sharing Students
Pursuits by Listening Students
Total Students Pursuits
Pursuits by Teacher
Total Pursuits
Comments Not Pursued
1 3 13 10 23 6 29 0 2 3 5 15 20 5 25 1 3 2 6 19 25 2 27 4 4 3 12 10 22 6 28 0 5 1 15 25 40 4 44 1 6 2 1 4 5 3 8 1
Total 21 52 83 135 26 161 7
Overall, the listening students pursued more comments than the sharing students. However, there
were two lessons when the sharing students pursued more comments than the listening students:
Lessons 1 and 4. In every lesson, I pursued more than one comment made by the listening or
sharing students rather than directing other students to pursue them. However, the number of
times I did the pursuing was far less than the number of pursuits made by students. There were
seven instances when students made comments that I chose not to have pursued. In all six
lessons, the number of comments pursued far outnumbered the comments not pursued. There
was a mean of 27 pursuits per lesson.
The second analysis consisted of categorizing the cognitive levels of each pursuit and
then tallying the number of pursuits within each category along with percentages of the total
pursuits, as shown in Table 8.
Not all of the thinking levels appear on this table. Only the thinking levels that were
observed were coded and therefore reported. Of the 13 different levels of thinking that could
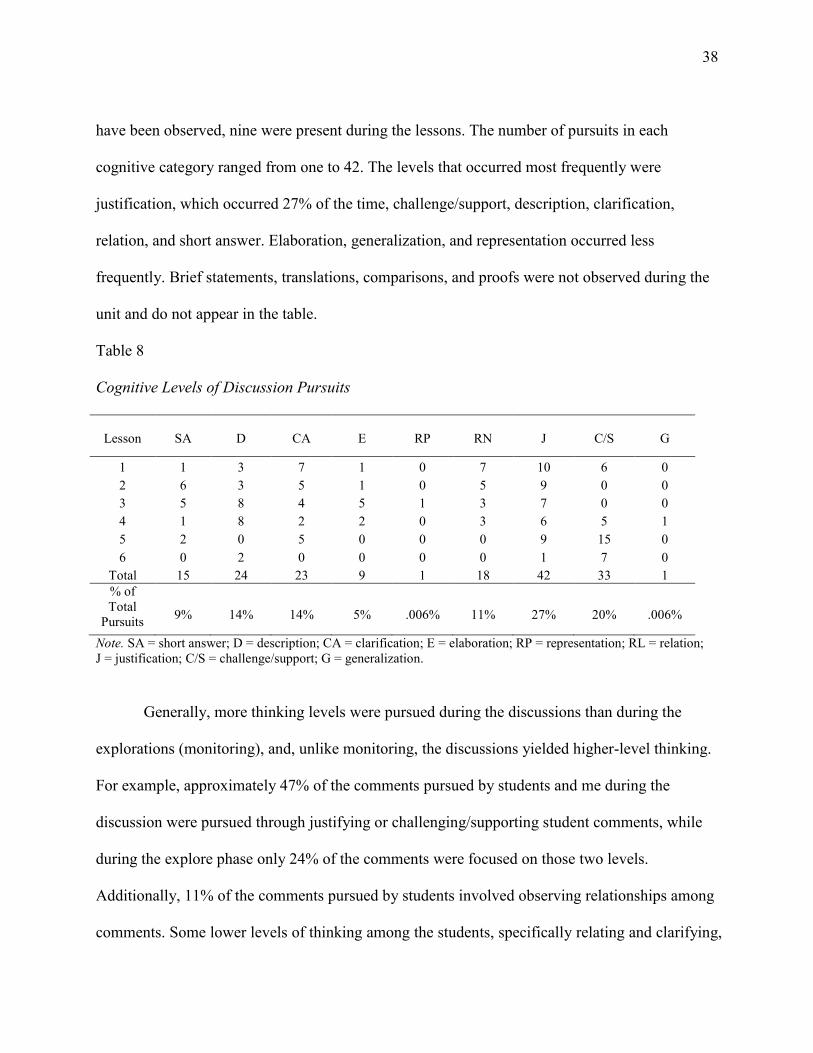
38
have been observed, nine were present during the lessons. The number of pursuits in each
cognitive category ranged from one to 42. The levels that occurred most frequently were
justification, which occurred 27% of the time, challenge/support, description, clarification,
relation, and short answer. Elaboration, generalization, and representation occurred less
frequently. Brief statements, translations, comparisons, and proofs were not observed during the
unit and do not appear in the table.
Table 8
Cognitive Levels of Discussion Pursuits
Lesson
SA
D
CA
E
RP
RN
J
C/S
G
1 1 3 7 1 0 7 10 6 0 2 6 3 5 1 0 5 9 0 0 3 5 8 4 5 1 3 7 0 0 4 1 8 2 2 0 3 6 5 1 5 2 0 5 0 0 0 9 15 0 6 0 2 0 0 0 0 1 7 0
Total 15 24 23 9 1 18 42 33 1 % of Total
Pursuits
9%
14%
14%
5%
.006%
11%
27%
20%
.006%
Note. SA = short answer; D = description; CA = clarification; E = elaboration; RP = representation; RL = relation; J = justification; C/S = challenge/support; G = generalization.
Generally, more thinking levels were pursued during the discussions than during the
explorations (monitoring), and, unlike monitoring, the discussions yielded higher-level thinking.
For example, approximately 47% of the comments pursued by students and me during the
discussion were pursued through justifying or challenging/supporting student comments, while
during the explore phase only 24% of the comments were focused on those two levels.
Additionally, 11% of the comments pursued by students involved observing relationships among
comments. Some lower levels of thinking among the students, specifically relating and clarifying,

39
trended downward towards the end of the unit, while description, another example of lower-level
thinking, trended upward, similar to the analysis related to Practice 2.
Data from the two analyses were combined in order to examine the relationships among
the decisions to pursue, (i.e., the decisions about who was selected to pursue and the cognitive
level of that pursuit) as shown in Table 9. The levels of thinking associated with my pursuits
were much different than the thinking levels pursued by the listening and sharing students. While
I tended to focus on lower levels of thinking, my students engaged in higher-level thinking when
pursuing students’ comments. For example, I focused a great deal on clarification of student
thinking in my pursuits, while my students tended to pursue the thinking levels that were
challenging and supporting or justifying claims. Indeed, justifying and challenging/supporting
student thinking accounted for 47% of the thinking levels present during the discussion, while I
only engaged in justifying and challenging/supporting.
Table 9
Relationships Among Pursuit Decisions and Cognitive Level of Each Pursuit
Pursuer SA D CA E RP RN J C/S G
Student 1 2 15 1 1 1 3 6 1 Teacher 9 21 4 5 0 15 41 28 1 Note. SA = short answer; D = description; CA = clarification; E = elaboration; RP = representation; RL = relation;
J = justification; C/S = challenge/support; G = generalization.
Summary
The analyses revealed important trends among the data. As to anticipating student
thinking, there was a greater correspondence between the anticipation and observation of proper
conceptions than between anticipated and observed misconceptions. Additionally, most lessons
were accompanied by thinking not anticipated in the lesson plans. Regarding monitoring during

40
the explore phase, there was a large number of teacher-student interactions. There was a wide
range as to the number of times individual students were interacted with across the lessons. Also,
a wide range of cognitive levels characterized the comments in these interactions, with a
tendency, however, toward lower levels. During the discussions, about half of the strategies
shared matched the lesson plans. In the case of that match, (i.e., when the strategies shared
matched the lesson plans), the sequence of that sharing also matched the planned sequences
within the lesson plans. A large number of students participated, and the number of listening
student participations exceeded the number of sharing student participations. Those sharings
evidenced a wide range of cognition with a tendency toward higher levels of thinking than was
elicited during the explore phase.

41
Chapter 5
Discussion
The purpose of this study was to investigate my efforts to implement the Stein et al.
(2008) practices. I wanted to find out what would happen when I used the five practices as a
guide for orchestrating discussions and to examine trends in my decision-making relative to
those practices that occurred over the course of an instructional unit. In this chapter I will explore
the findings through the discussion of the numerical data, and through examples of conversation
and classroom vignettes that exemplify the findings. I will also interpret the findings and share
conjectured explanations. As in the previous two chapters, the research questions and associated
practice features will be used to organize this chapter.
Anticipating Likely Student Responses
In order to determine how well I was “anticipating likely student responses to cognitively
demanding mathematical tasks” (Stein et al., 2008, p. 321), I investigated how the thinking I
predicted would occur compared to the thinking I actually observed. I was concerned with
thinking that was well conceived along with thinking that was misconceived. Interestingly,
nearly all of the thinking I anticipated that would occur that could be considered well conceived
was actually observed.
However, there was a greater discrepancy between anticipated and observed thinking in
the case of misconceptions and unanticipated thinking. Much fewer misconceptions were
observed than I anticipated. This observation suggests that I underestimated the ability of my
students to construct mathematically sound understanding in inquiry-based contexts, (i.e.,
contexts in which I do not tell them how or what to think). This conclusion is even more

42
surprising to me because of the abstract nature of this particular unit of instruction—statistics—
and my own lack of familiarity with statistics and how to teach it.
Additionally, there was a substantial amount of student thinking that I observed that I did
not anticipate, split almost evenly between well conceived and misconceived. I believe that my
inability to anticipate students’ thinking was because of my lack of content knowledge about
statistics and the associated student thinking. My unfamiliarity with the topic made it difficult to
teach because I did not have enough experience to anticipate what misconceptions students
would have. It is also important to note that I was still working out my own misconceptions of
how to present appropriate tasks and how to connect those tasks to the real world.
Overall, it appears I have much to learn about the nature of student thinking in the
context of statistics in order to engage in the critical component of discussion orchestration based
on the anticipation of student thinking about a given task. However, I was encouraged by trends
in this study that indicate that there was improvement in my ability to anticipate students’
misconceptions over a six-day unit. Engaging in this process in an introspective and thoughtful
way encouraged me to become acutely aware of my weaknesses and seek out advice on how to
improve my practice in developing tasks and to then anticipate students’ thinking. This
knowledge is important in improving the quality of my interactions with students during the
explore phase, planning and sequencing student sharing in order to more fully advance the
thinking of all students, and for dealing with the in-the-moment pursuit decisions that occur
during the discuss phase in a way that promotes deep mathematical understanding.
Monitoring Students’ Responses
I was learning to engage in a new type of teacher-student interaction while “monitoring
students’ responses to the tasks during the explore phase” (Stein et al., 2008, p.321).

43
Traditionally my purpose in interacting with students as I monitor them was to provide direction
and instruction when they are struggling with a new concept. In place of this practice, I
interacted with the individual students or small groups in order to assess what mathematics they
were thinking about and the level of complexity of that thinking. I then compare that thinking to
the thinking I anticipated, and to advance that thinking in order to encourage deeper levels of
understanding.
This effort required asking questions much more frequently than I was used to rather than
simply checking student work or telling students how to think, as well as making a conscious
effort to interact with as many students as possible. Therefore, I gathered data on the number of
students I interacted with, how often I interacted with them, and what levels of thinking
characterized those interactions in the explore phase. Those data revealed a very uneven,
inconsistent pattern to my interactions.
Some students were interacted with quite frequently over multiple lessons and others
received little or no interactions at all. There are four possible explanations for this observation.
First, the way I gathered data about monitoring did not allow for interactions that were
observation only. Thus, I could monitor student thinking from a small number of students
without engaging in a conversation with them at all. Second, one student was so far advanced
that I had to interact with him consistently just to keep him engaged. Third, at the other end of
the spectrum there were students who required more interaction then other students in order for
me to thoroughly monitor their thinking. Fourth, three students did not provide signed consent
forms.
My efforts to continue improving my discussion orchestration will focus in part upon
evening out these interaction patterns. Doing so will inform the final selection and sequencing

44
decisions I make before the discussion begins to ensure a more broad-based representation of
student thinking across all students.
The limited number of thinking levels I used to question my students may have been due
in part to the complex nature of those interactions. That is, the students’ thinking that
characterized those interactions was difficult to understand. For instance, in the first lesson,
students were given a task to organize data so they could find the mean, median, mode, range,
and then generate some sort of graph. The data consisted of hours that students spent online per
week and ranged from 0.5 hours per week to 30 hours per week. All of the values were whole
numbers except one. One student doubled all the values in the data set but it was difficult to
understand her reasoning. Only after a lengthy exchange was I able to determine that she was
trying to use only whole numbers, so she multiplied all of the values by two in order to make half
a value of one.
As part of a sixth-grade team, I participate in developing common lesson plans, pacing
guides, and assessments. I did not account for the fact that the pacing and objectives of a more
traditional classroom was not conducive to teaching using inquiry-based mathematics. I was
engaging in inquiry-based instruction while using traditional teacher-centered objectives and
pacing. Because of this, the first few tasks and objectives became bloated. This caused some
students to become anxious or confused because of the complexity of the tasks being required of
them. Therefore, in order to create an environment conducive to student inquiry and discussion, I
not only had to use Stein et al.’s (2008) five practices, but I also had to learn how to create
appropriately paced tasks and activities that would allow student to use their innate curiosity
combined with their background knowledge to build their understanding.
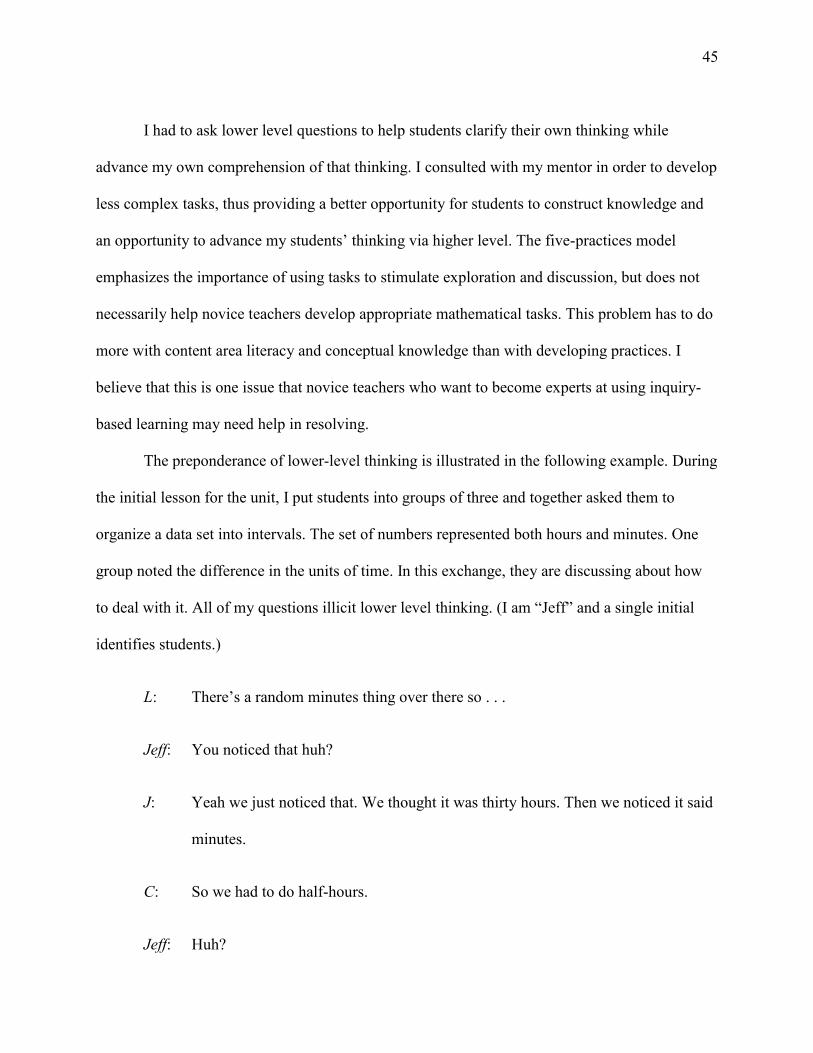
45
I had to ask lower level questions to help students clarify their own thinking while
advance my own comprehension of that thinking. I consulted with my mentor in order to develop
less complex tasks, thus providing a better opportunity for students to construct knowledge and
an opportunity to advance my students’ thinking via higher level. The five-practices model
emphasizes the importance of using tasks to stimulate exploration and discussion, but does not
necessarily help novice teachers develop appropriate mathematical tasks. This problem has to do
more with content area literacy and conceptual knowledge than with developing practices. I
believe that this is one issue that novice teachers who want to become experts at using inquiry-
based learning may need help in resolving.
The preponderance of lower-level thinking is illustrated in the following example. During
the initial lesson for the unit, I put students into groups of three and together asked them to
organize a data set into intervals. The set of numbers represented both hours and minutes. One
group noted the difference in the units of time. In this exchange, they are discussing about how
to deal with it. All of my questions illicit lower level thinking. (I am “Jeff” and a single initial
identifies students.)
L: There’s a random minutes thing over there so . . .
Jeff: You noticed that huh?
J: Yeah we just noticed that. We thought it was thirty hours. Then we noticed it said
minutes.
C: So we had to do half-hours.
Jeff: Huh?

46
C: We had to do half-hours.
Jeff: Okay, so is that how you’re going to fix that?
C: So, should we do that? Do you think that will work?
L: Yeah.
Jeff: All right, so what are you going to do? How are you going to put this stuff
together?
J: How we planned on doing it is putting it in one of these (points to an interval
table). Putting in the graph table, listing what all the times are, the hours, and then
we planned on making a pictograph. We plan on making that, and then we’re
going to do the mean, median, and mode and range, if the range needs to be
involved.
Another interesting set of observations that is also relevant to Practice 5 as well as
Practice 2 is that there were more thinking levels associated with the discussions than with the
explorations (monitoring), and with a greater amount of higher-level thinking. In addition to the
issues associated with task complexity discussed in the previous paragraph, I conjecture this
observation is due to focusing more on finding out what students were thinking in the explore
phase than on advancing that thinking, whereas during the discuss phase, advancing was more of
a focus.
Selecting and Sequencing Students’ Responses
My analysis concerning “selecting particular students to present their mathematical
response during the discuss-and-summarize phase” and “purposefully sequencing the student

47
responses that will be displayed” (Stein et al., 2008, p.321) occurred together. During lesson
planning, I decided what thinking would be shared during the discuss phase and in what order—
all based on the thinking I anticipated would occur. Then during the explore phase, I determined
how to implement that planning by looking for anticipated thinking, as well as other thinking I
did not anticipate, that could be shared. I then decided which students would share and in what
order. In order to get a sense for how well I was able to plan this aspect of my discussion
orchestration in advance, I compared the planning to the sharing decisions made in the course of
lesson implementation.
In one sense, my discussion planning was validated because all the thinking I planned to
have shared was shared. However, the planning was not as effective as that observation would
suggest for three reasons. First, not all the thinking I anticipated actually occurred, meaning there
was thinking I planned to share that I could not. Second, my ability to anticipate student thinking
was broad and unfocused, (e.g., much of my anticipations were so general as to provide little
guidance for planning the selections and sequencing decisions associated with the discussion).
Third, there was a great deal of unanticipated thinking that was also shared, providing additional
evidence of the importance of being able to anticipate student thinking in the first place. That is,
I had to make a large number of in-the-moment decisions about the selecting and sharing of
student thinking because of my inability to anticipate thinking that would appear during the
lesson that hampered the flow of the discussion. For instance, during the first lesson, students
brought up a misconception that interrupted the direction of the lesson. The comments were good,
and I knew it would help direct the lesson to our learning outcome, but at the same time it moved
the discussion away from what we were talking about. Had I been able to be more specific with
my anticipation of student thinking, I might have anticipated this misconception surfacing and

48
been prepared to position it in our discussion to enhance the overall understanding of my
students. As the quality of the tasks improved across the unit, my ability to anticipate student
thinking also improved, leading to improvement in my selecting and sequencing decisions. I
agree with Reys and Long (1995) when they said the single most important decision a teacher
makes is determining the task to present and when to present it.
Helping Students Make Mathematical Connections
Helping the class make mathematical connections required three in-the-moment decisions
in order to get as many students involved in the discussion as possible, to involve the whole class
in the pursuit of mathematically-rich ideas anytime they occurred, and to promote deeper or
higher levels of thinking in the process. The first decision concerned whether or not to pursue, or
follow up, on the student comment. During each discussion, my overall goal was to direct
student thinking to the ultimate unit objective, which was to develop an understanding of mean
deviation. Therefore the comments I pursued were comments that would connect back to the
learning objective. In addition, it is also important to note that there were a few instances where a
student comment prompted me to ask a question that I had not anticipated asking in order to
provoke student thinking. The challenge of orchestrating the pursuit of student comments is
illustrated in the following example.
During the fourth lesson, students were exploring the similarities and differences between
two data sets. I chose a pair of students, S and B, to share their ideas. During the discussion, S
noted, “I found it kind of odd that even though they had the same range and median they had
different first and third quartiles.” I chose to pursue this comment because it was an unprompted
remark that focused specifically on that day’s objective. I directed the question to the class “How

49
come you can have two different minimums and maximums and the same range?” This opened
up the conversation for students to explore this idea.
During the same conversation, S made another comment directed toward the previous
question. He stated, “Even if there are some differences in a data set, there can always be
similarities, and there can be infinite amount of possibilities in data distribution.” This comment
also provided another opportunity to explore this concept at an even deeper level; however, the
level of understanding that my students had illustrated during the lesson demonstrated that they
were not ready to explore that comment. More importantly, they were trying to attain a learning
outcome of noting that data sets can have similarities and differences in data distribution.
Therefore I chose not to pursue this response because found that pursuit of such thinking might
result in confusion and frustration.
If a comment was deemed pursuable, the next decision concerned who should pursue the
comment—the student who made the comment, another student, or me. In some instances, I
would appoint myself to be the “pursuer” if a comment needed to be pursued and it appeared that
other student pursuers were missing the mark relative to the mathematics inherent in the
comment (i.e., not really thinking in a way that pushed the other students’ understanding
forward). As the unit progressed, I did not feel the need to be the pursuer as frequently because
the students became more independent and confident with contributing pursuing responses.
The third decision was concerned with the cognitive level at which those pursuits were
directed to occur, similar to the analysis related to Practice 2. During the first two lessons I spent
a lot of time inviting students to restate and clarify or elaborate upon student thinking—relatively
low levels of thinking. As the unit progressed I found the amount of clarifying by me decreased,
while my challenging of students—a higher thinking level—increased. There may have been

50
three reasons for this observation. First, my ability to orchestrate discussions improved. Second,
it may have been that my students’ conceptual understanding was solidifying so they were
spending less time exploring strategies and more time determining which strategies worked and
why. Third, as discussed, the quality of the tasks presented in later lessons may have lead to
higher levels of questioning in the explore phases. It would make sense that changes in task
quality may have also made it easier to promote higher levels of thinking in the discuss phase.
There was some evidence that my efforts related to Practice 5 produced high levels of
engagement. First, there were a large number of student comments during the discussion,
particularly when compared to the number of comments I made. Of course I spoke frequently,
but more often to simply facilitate the discussion rather than to comment as a student would.
Second, a much larger number of comments were made by students listening in comparison to
the initial sharing than by the students who initially shared. Third, many more comments were
pursued.
Rochat (2001) and others document the strong relationship between levels of interaction
and engagement in mathematical discussions and the depth of thinking those discussions
promote. Not surprisingly, there was a greater degree of high-level thinking evidenced in the
discuss phases than in the explore phases because the interaction level was greater. Mean
deviation in and of itself is a very complex concept to understand. For sixth-grade students who
have not experienced statistical concepts, the idea is foreign. Asking students to develop their
own understanding of mean deviation using very little references to what they already know
becomes very difficult. During this unit I was concerned that this new approach to learning with
the addition of complexity and rigor might confuse and frustrate my students. However, during
each lesson I was pleased to find that the students were advancing their own thinking. For

51
instance, during the third lesson I expected my students would be able to compare the
distributions associated with the two sets of data. Students grappled with trying to discover
differences between two particular data sets that had the same median, mean, and range, yet
looked completely different. However, student S commented that there was a difference in “how
far the numbers are away from the mean.” He noted that the numbers were arranged differently
because of the spread of data. This moment was an enormous leap forward in the students’
conceptual understanding. Because of the comment made by S, students were able to explore and
discuss the distinct characteristics of data spread and its relationship with mean, median, mode,
and range. Because one student was able to recognize data spread, it created the opportunity for
all of my students to advance their thinking in an organic and natural way.
Conclusion
The findings of this study contribute generally to the body of literature devoted to
developing a teacher’s ability to orchestrate mathematical discussions. Though this study may be
limited in scope to one teacher’s experience in developing and implementing discussion
orchestration practices, it does provide the perspective of a novice teacher’s experience. The
work of Stein et al. (2008) is one of few research-based guides for explaining how a teacher can
develop mathematical discussion-based practice. It also provides examples of teachers engaging
in such practices but does not give a personal perspective on how teachers, particularly novice
teachers, implement these practices in their classrooms. The results of this study report both the
success of using these practices in my math practice and explain some of the difficulties I had in
implementing these new practices.
More importantly, the findings of this study have specifically impacted my own personal
teaching practice. Studying my own practice has encouraged me to think about mathematical

52
instruction in a way that I have never thought about before. It has resulted in recognizing many
weaknesses in my own understanding of mathematical concepts. These weaknesses hindered my
ability to develop and anticipate my students’ mathematical thinking, which put me at a
disadvantage when I engaged my students in mathematical discussions. This insight has spurred
me to further my mathematical understanding through professional development. Therefore,
even though this practice exposed many faults in my own teaching, it has had a positive impact
on my teaching.
This study of my own practices did not only uncover weaknesses, but it also revealed
strengths that I have in orchestrating discussions. I have taught sixth grade for six years, and
although I would not say I understand all the mathematics I teach at a deep level, I have become
familiar with most of the sixth-grade core. However, for this study I developed lessons around a
topic I was unfamiliar with, yet was still able to achieve some degree of discussion orchestration
quality and help my students succeed. Using the five practices helped me to frame my
discussions and yielded what I consider to be a successful outcome to the unit. As students were
able to construct their knowledge, I was pleased to find that during most of the lessons I was able
to interact with students in ways that kindled their curiosity and provoked their thinking, without
giving away “the right answer,” thus providing students with an opportunity to collectively build
proper mathematical conceptual understanding.
The utilization of these five practices also improved my teaching by helping me
understand that task appropriateness affects my ability to accurately anticipate proper
conceptions and misconceptions that might surface during the lesson. As my ability to anticipate
student thinking increased, my ability to promote deeper thinking and to help students make
connections also increased.

53
These improvements in my practice had a positive influence on student learning as well.
As my students engaged in task exploration and discussion, the class culture began to change.
Students’ thinking and strategies for possible solutions not only focused on their own
background knowledge, but also began to go beyond that background knowledge. Furthermore,
student disagreements became more conceptual and less procedural. There was also an
improvement in how students reported mathematical understanding through their examples,
writing, and oral presentations. Finally, at the end of the year my students performed slightly
better than the other sixth-grade classes on the mathematics portion of the end-of-level test. This
is the first time in my six years of teaching that my class as a whole outscored the other sixth-
grade classes in my school.
Contributions and Recommendations for Future Research
The five practices used in this study were based on an article written by Stein et al.
(2008). In this article, the authors share vignettes of teachers attempting to use mathematical
discussions and then compare their five practices to the actual teacher’s discussion orchestration.
This study contributes a personal perspective and narrative of how a novice teacher implements
these practices. Beyond my personal perspective, this study also shares successes and pitfalls that
I experienced as I implemented these practices into my pedagogy.
The six-lesson unit provided me with a deeper understanding of how to orchestrate
mathematical discussions and yielded successful lessons. However, there are still many aspects
of orchestrating mathematical discussions that need exploration and refinement. As I continue to
research the implementation of these practices in my classroom instruction, my personal
recommendations are to study both depth of teachers’ mathematical understanding and how it
affects this process as a whole, as well as looking at how depth of knowledge affects teacher-

54
prepared tasks. It is important to note that discussion is only a small part of inquiry-based
instruction and studies could be conducted about whole inquiry-based lesson preparation and
assessment.

55
References
Anthony, W. S. (1973). Learning to discover rules by discovery. Journal of Educational
Psychology, 64(3), 325-328. doi:10.1037/h0034585
Bahr, D. L., Bahr, K., & Monroe, E. E. (2011, April). Engaging all students in classroom
discourse. Paper presented at the NCTM 2011 Annual Meeting and Exposition in
Indianapolis, IN.
Ball, D. L. (1993). With an eye on the mathematical horizon: Dilemmas of teaching elementary
school mathematics. Elementary School Journal, 94(4), 373-397.
Ball, D. L. (2001). Teaching, with respect to mathematics and students. In T. Wood, B. S. Nelson,
& J. Warfield (Eds.), Beyond classical pedagogy: Teaching elementary school
mathematics (pp. 11-22). Mahwah, NJ: Erlbaum.
Barrow, H. S., & Tamblyn, R. M. (1980). Problem-based learning: An approach to medical
education. New York, NY: Springer Publishing.
Borko, H., & Livingston, C. (1989). Cognition and improvisation: Differences in mathematics
instruction by expert and novice teachers. American Educational Research Journal, 26(4),
473-498.
Brophy, J. (2000). Teaching. Brussels, Belgium: International Academy of Education.
Bruner, J. S. (1961). The art of discovery. Harvard Educational Review, 31, 21-32.
Bybee, R. W. (1997, October). The Sputnik era: Is this educational reform different from all
other reforms? Reflecting on Sputnik: Linking the Past, Present, and Future of
Educational Reform. Symposium conducted at the Center for Science, Mathematics, and
Engineering Education National Research Council, Washington, DC.
56
Chazen, D. (2000). Beyond formulas in mathematics and teaching: Dynamics of the high school
algebra classroom. New York, NY: Teachers College Press.
Chazen, D., & Ball, D. L. (1999). Beyond being told not to tell. For the Learning of Mathematics,
19(2), 2-10.
Cobb, P., Wood, T., & Yackel, E. (1990). Chapter 9: Classrooms as learning environments for
teachers and researchers [Monograph]. Journal for research in Mathematics Education.
125-210. doi: 10.2307/749917
Creswell, J. W. (2008). Educational research: Planning conducting, and evaluating quantitative
and qualitative research. Boston, MA: Pearson.
DeBoer, G. E. (1997, October). What we have learned and where we are headed: Lessons from
the sputnik era. Reflecting on Sputnik: Linking the Past, Present, and Future of
Educational Reform. Symposium conducted at the Center for Science, Mathematics, and
Engineering Education National Research Council, Washington, DC.
Fennema, E., Carpenter, T. P., Frankel, M. A., Levi, L., Jacob, V. B., & Empson, S. B. (1996). A
longitudinal study of learning to use children's thinking in mathematics instruction.
Journal for Research in Mathematics Education, 27(4), 403-434. doi:10.2307/749875
Gee, J. P. (1996). Social linguistics and literacies: Ideology in discourses (2nd ed.). Bristol, PA:
Taylor & Francis.
Hendrickson, S., Hilton, S. C., & Bahr, D. (2008). The comprehensive mathematics instruction
(CMI) framework: A lens for examining teaching and learning in the mathematics
classroom. Utah Mathematics Teacher, 1(1), 44-58.
Kilpatrick, J., Swafford, J., Findell, B., & National Research Council (U.S.). (2001). Adding it
up: Helping children learn mathematics. Washington, DC: National Academic Press.

57
Koshy, V. (2005). Action research for improving practice: A practical guide. London, England:
Paul Chapman Publishing.
Lampert, M. (2001). Teaching problems and the problems of teaching. New Haven, CN: Yale
University Press.
Lobato, J., Clarke, D., & Ellis, A. B. (2005). Initiating and eliciting in teaching: A reformulation
of telling. Journal for Research in Mathematics Education, 36(2), 101-136.
doi:10.2307/30034827
Mills, G. E. (2000). Action research: A guide for the teacher researcher. Upper Saddle River,
NJ: Merrill/Prentice Hall.
Moschkovich, J. N. (2007). Examining mathematical discourse practices. For the Learning of
Mathematics, 27(1), 24-30.
Murphy, K. P., Wilkinson, I. A. G., Soter, A. O., Hennessey, M. N., & Alexander, J. F. (2009).
Examining the effects of classroom discussion on students' comprehension of text: A
meta-analysis. Journal of Educational Psychology, 101(3), 740-764.
doi:10.1037/a0015576
National Commission on Excellence in Education. (1983). A nation at risk: The imperative for
educational reform: A report to the Nation and the Secretary of Education, United States
Department of Education. Washington, DC: U.S. Government Printing Office.
National Council of Teachers of Mathematics. (1991). Professional standards for teaching
mathematics. Reston, VA: Author.
National Council of Teachers of Mathematics. (2000). Principles and standards for school
mathematics: An overview. Reston, VA: Author.

58
National Research Council. (2013). The mathematical science in 2025. Washington, DC:
National Academies Press: Author.
Papert, S. (1980). Mindstorms: Children, computers, and powerful ideas. New York, NY: Basic
Books, Inc.
Piaget, J. (1928). Judgment and reasoning in the child. New York, NY: Harcourt, Brace &
World.
Reys, B. J., & Long, V. (1995). Implementing the professional standards for teaching
mathematics: Teacher as architect of mathematical tasks. Teaching
Children Mathematics 1(5), 296-299.
Rochat, P. (2001). The dialogical nature of cognition. Monograph of the Society for
Research in Child Development, 66(2), 133-144.
doi: 10.1111/1540-5834.00146
Schifter, D., & Fosnot, C. T. (1993). Reconstructing mathematics education: Stories of teachers
meeting the challenge of reform. New York, NY: Teachers College Press.
Schmidt, H. G. (1983). Problem-based learning: Rationale and description. Medical Education,
17(1), 11-16. doi: 10.1111/j.1365-2923.1983.tb01086.x
Schroyer, J., & Fitzgerald, W. M. (1986). Mouse and elephant: Measuring growth. Menlo Park,
CA: Addison-Wesley.
Sherin, M. G. (2002). When teaching becomes learning. Cognition and Instruction, 20(2), 119-
150. doi: 10.1207/S1532690XCI2002_1
Smith, J. P. (1996). Efficacy and teaching mathematics by telling: A challenge for reform.
Journal for Research in Mathematics Education, 27(4), 387-402. doi: 10.2307/749874

59
Stein, M. K., Engle, R. A., Smith, M. S., & Hughes, E. K. (2008). Orchestrating productive
mathematical discussions: Five practices for helping teachers move beyond show and tell.
Mathematical Thinking and Learning, 10(4), 313-340. doi:10.1080/10986060802229675
Stigler, J. W., & Hiebert, J. (1999). The teaching gap: Best ideas from the world's teachers for
improving education in the classroom. New York, NY: The Free Press.
Van de Walle, J. (2007). Elementary and middle school mathematics (6th ed.). Boston, MA:
Pearson Education.
Vygotsky, L. S. (1978). Mind in society: The development of higher psychological processes
Cambridge, MA: Harvard University Press.
Wood, T. (1999). Creating a context for argument in mathematics class. Journal for Research in
Mathematics Education, 30(2), 171-191. doi: 10.2307/749609
Wood, T., & Turner-Vorbeck, T. (2001). Extending the conception of mathematics teaching. In
T. Wood, B. S. Nelson, & J. Warfield (Eds.), Beyond classical pedagogy: Teaching
elementary school mathematics (pp. 185-208). Mahwah, NJ.: Erlbaum.

60
Appendix
CMI DEVELOP LESSON PLAN 1
In the context of a word problem involving Mean, Median, Mode, Range, Frequency Tables, and Histograms, students will perform the following:
Surface ideas such as what is the best strategy to organize and report data. Invent strategies to determine how data can be organized. Create representations that organize and present data clearly and accurately. Organize that information into intervals.
Relative to standard 6.SP.5a, summarize numerical data as by reporting the number of observations. Launch Explore Discuss
Task: During the PM small group time, a survey was taken as to how much time students spent on the internet per week. The following results were given: 27h, 10h, 14h, 12h, 5h, 13h, 0.5h, 10h, 8.5h, 12h, 13h, 3h, 25h, 8h
Organize and be prepared to report this information in such a way that we could generate a graph. Find the mean, median, mode, and the range of the data listed. Mean: 11.5 Median:11 Mode: 10, 12, 13 Range: 26.5
Check students’ understanding of the task itself—not how to solve it.
Materials •Math books (page 484) •Pencils •Paper •Butcher paper •Markers •Pre-organized groups
Grouping (Individual, group size, etc.) Working in pairs of two or a group size of three.
Vocabulary: frequency table, histogram, intervals
Anticipated Thinking Conceptions
Appropriate use of mean, median, mode, and range.
Students will organize their data within intervals.
Students will use histograms with intervals to show the data distribution.
Students will use non-interval reports of data distribution such as bar graphs, line (dot) plots, frequency tables.
Misconceptions Intervals overlooking the unit
change in the data set (minute vs. hours)
Appropriate handling of 30-minute unit change
Intervals sets to 5
Questions I will focus on asking questions that lead students to think about how they are graphing and organizing the data.
Intended Sharing Order Accountability for Listening Students (Random vs. volunteer, individual vs. group)
Students will use non-interval reports of data distribution by showing a (dot) plot
Frequency table with non-intervals Frequency table with intervals Histograms with intervals
Listening Student Responsibilities (think, talk, moves, etc.)
Compare: Students will compare what they have done to what their fellow students have done.
Relation: Students will relate what the sharing or volunteering students have done to their own work.
Challenge/Support: Listening students are expected to challenge or support the sharing student’s presentations.
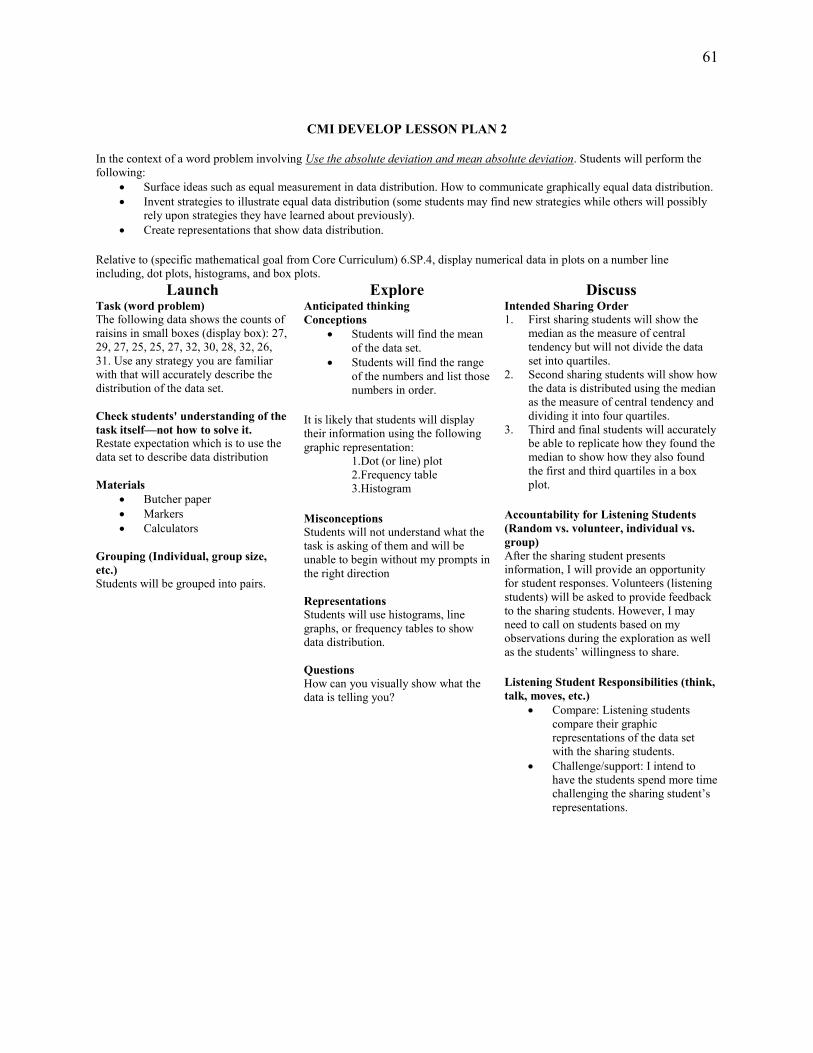
61
CMI DEVELOP LESSON PLAN 2
In the context of a word problem involving Use the absolute deviation and mean absolute deviation. Students will perform the following:
Surface ideas such as equal measurement in data distribution. How to communicate graphically equal data distribution. Invent strategies to illustrate equal data distribution (some students may find new strategies while others will possibly
rely upon strategies they have learned about previously). Create representations that show data distribution.
Relative to (specific mathematical goal from Core Curriculum) 6.SP.4, display numerical data in plots on a number line including, dot plots, histograms, and box plots.
Launch Explore Discuss Task (word problem) The following data shows the counts of raisins in small boxes (display box): 27, 29, 27, 25, 25, 27, 32, 30, 28, 32, 26, 31. Use any strategy you are familiar with that will accurately describe the distribution of the data set. Check students' understanding of the task itself—not how to solve it. Restate expectation which is to use the data set to describe data distribution Materials
Butcher paper Markers Calculators
Grouping (Individual, group size, etc.) Students will be grouped into pairs.
Anticipated thinking Conceptions
Students will find the mean of the data set.
Students will find the range of the numbers and list those numbers in order.
It is likely that students will display their information using the following graphic representation:
1.Dot (or line) plot 2.Frequency table 3.Histogram
Misconceptions Students will not understand what the task is asking of them and will be unable to begin without my prompts in the right direction Representations Students will use histograms, line graphs, or frequency tables to show data distribution. Questions How can you visually show what the data is telling you?
Intended Sharing Order 1. First sharing students will show the
median as the measure of central tendency but will not divide the data set into quartiles.
2. Second sharing students will show how the data is distributed using the median as the measure of central tendency and dividing it into four quartiles.
3. Third and final students will accurately be able to replicate how they found the median to show how they also found the first and third quartiles in a box plot.
Accountability for Listening Students (Random vs. volunteer, individual vs. group) After the sharing student presents information, I will provide an opportunity for student responses. Volunteers (listening students) will be asked to provide feedback to the sharing students. However, I may need to call on students based on my observations during the exploration as well as the students’ willingness to share.
Listening Student Responsibilities (think, talk, moves, etc.)
Compare: Listening students compare their graphic representations of the data set with the sharing students.
Challenge/support: I intend to have the students spend more time challenging the sharing student’s representations.

62
CMI DEVELOP LESSON PLAN 3
In the context of a word problem involving the absolute deviation and mean deviation of a data set students will perform the following:
Surface ideas such as how to summarize and describe data and how it is distributed. Invent strategies to find the standard deviation from the median data value. Create representations that of how to find those data values.
Relative to 6. SP. 5c, summarize numerical data sets in relation to their context, such as by giving quantitative measure of center (median and/or mean) and variability (interquartile range and/or mean absolute deviation), as well as describing any overall pattern and any striking deviations from the overall patterns with reference to the context in which the data were gathered.
Launch Explore Discuss Task (Word Problem) The following sets show students’ test scores over a period of time: Set A: 1, 5, 6, 4, 3, 7, 4, 9, 6, 4, 9 Set B: 1, 8, 6, 9, 8, 2, 4, 2, 8, 2, 5 Using this information what is the same between the two sets and what is different. Check students' understanding of the task itself—not how to solve it. Specific questions to ask students to clarify understanding:
What is this question asking you to do?
Where is a starting point to find this information?
Do you need to put the numbers in order?
Is it helpful to find the mean? Why?
Materials Dry erase boards or paper Dry erase markers or pencils
Grouping (Individual, group size, etc.) Students will work individually but will check their work with other students.
Anticipated Thinking Conceptions
Students will organize the data in order to find the median and the mean.
Students will use the median as a central measurement.
Using the organized data, students will recognize a change in distribution.
Misconceptions Students will see that both
sets have the same median and mean, but may not see the difference in the mean distribution.
Students may be unable to find the differences between the two sets because of their similar means and medians
Representations Students will use box plots, line graphs, or frequency tables to show data distribution Questions
How would you find the distance between each number?
Is there an operation that can show you the distance between each number?
It is helpful to find the median? Why?
How do you find the range of data set? How could you use that information to help you find the IQR?
Intended Sharing Order Students will organize the data in order
to find the median and the mean. Students will use the median as a
central measurement and the see the difference of data distribution.
Accountability for Listening Students (Random vs. volunteer, individual vs. group) Listening students will be called upon through a combination of volunteer and random questioning. Students will be selected individually to challenge or support the sharer’s examples and ideas.
Listening Student Responsibilities (think, talk, moves, etc.)
Compare: Listening students compare responses to the question with the presentation of the data set.
Challenge/support: Students who disagree with presented solutions are expected to challenge the sharing students’ comments. Students who support the solutions are expected to defend the listening students’ comments. Students may be called upon at random or volunteer by raising their hand during the discussion.
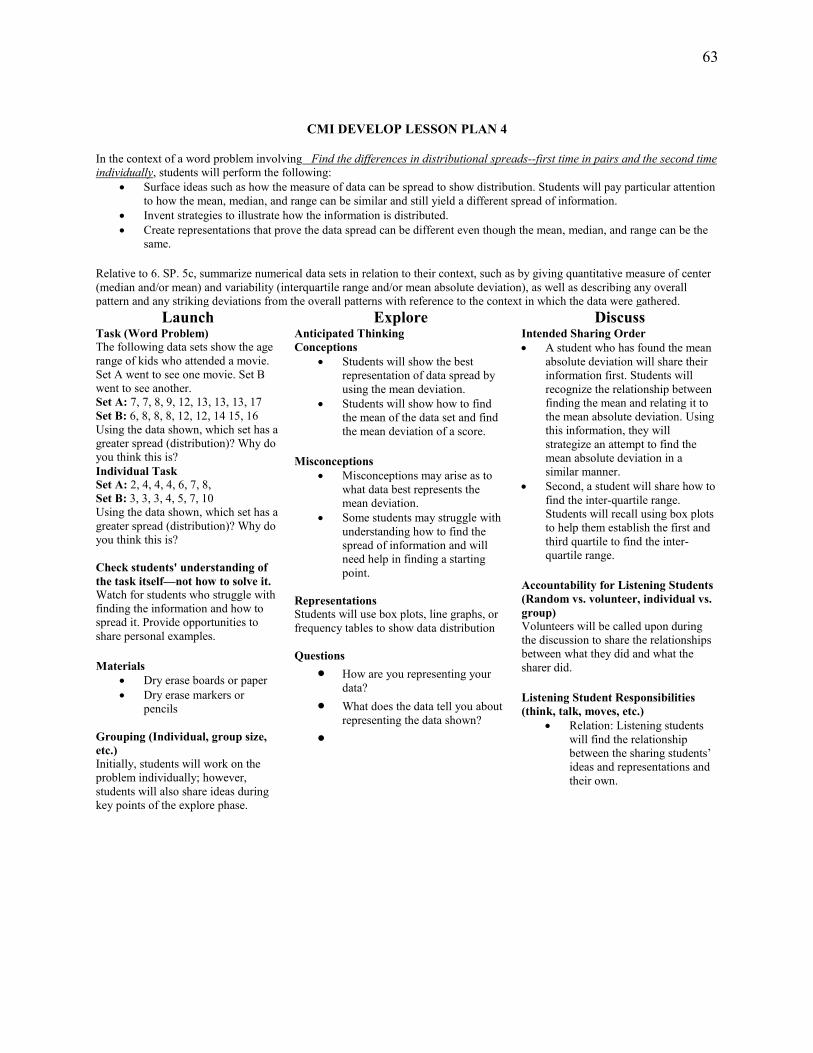
63
CMI DEVELOP LESSON PLAN 4
In the context of a word problem involving Find the differences in distributional spreads--first time in pairs and the second time individually, students will perform the following:
Surface ideas such as how the measure of data can be spread to show distribution. Students will pay particular attention to how the mean, median, and range can be similar and still yield a different spread of information.
Invent strategies to illustrate how the information is distributed. Create representations that prove the data spread can be different even though the mean, median, and range can be the
same.
Relative to 6. SP. 5c, summarize numerical data sets in relation to their context, such as by giving quantitative measure of center (median and/or mean) and variability (interquartile range and/or mean absolute deviation), as well as describing any overall pattern and any striking deviations from the overall patterns with reference to the context in which the data were gathered.
Launch Explore Discuss Task (Word Problem) The following data sets show the age range of kids who attended a movie. Set A went to see one movie. Set B went to see another. Set A: 7, 7, 8, 9, 12, 13, 13, 13, 17 Set B: 6, 8, 8, 8, 12, 12, 14 15, 16 Using the data shown, which set has a greater spread (distribution)? Why do you think this is? Individual Task Set A: 2, 4, 4, 4, 6, 7, 8, Set B: 3, 3, 3, 4, 5, 7, 10 Using the data shown, which set has a greater spread (distribution)? Why do you think this is? Check students' understanding of the task itself—not how to solve it. Watch for students who struggle with finding the information and how to spread it. Provide opportunities to share personal examples.
Materials Dry erase boards or paper Dry erase markers or
pencils Grouping (Individual, group size, etc.) Initially, students will work on the problem individually; however, students will also share ideas during key points of the explore phase.
Anticipated Thinking Conceptions
Students will show the best representation of data spread by using the mean deviation.
Students will show how to find the mean of the data set and find the mean deviation of a score.
Misconceptions Misconceptions may arise as to
what data best represents the mean deviation.
Some students may struggle with understanding how to find the spread of information and will need help in finding a starting point.
Representations Students will use box plots, line graphs, or frequency tables to show data distribution Questions
How are you representing your data?
What does the data tell you about representing the data shown?
Intended Sharing Order A student who has found the mean
absolute deviation will share their information first. Students will recognize the relationship between finding the mean and relating it to the mean absolute deviation. Using this information, they will strategize an attempt to find the mean absolute deviation in a similar manner.
Second, a student will share how to find the inter-quartile range. Students will recall using box plots to help them establish the first and third quartile to find the inter-quartile range.
Accountability for Listening Students (Random vs. volunteer, individual vs. group) Volunteers will be called upon during the discussion to share the relationships between what they did and what the sharer did.
Listening Student Responsibilities (think, talk, moves, etc.)
Relation: Listening students will find the relationship between the sharing students’ ideas and representations and their own.

64
CMI DEVELOP LESSON PLAN 5
In the context of a word problem involving finding the mean distribution of a data set, students will perform the following: Surface ideas such as how to represent the distance between the numbers in the data set and the mean by using one
number. Invent strategies to Invent strategies to express how the data is spread out. Create representations that show how the student was able to find an acceptable number (the mean deviation) to
represent the spread of each data value from the mean.
Relative to 6. SP. 5c, summarize numerical data sets in relation to their context, such as by giving quantitative measure of center (median and/or mean) and variability (interquartile range and/or mean absolute deviation), as well as describing any overall pattern and any striking deviations from the overall patterns with reference to the context in which the data were gathered.
Launch Explore Discuss Task (Word Problem) Group Task Complete the following information below: Mean, Median, Mode, and Range. Be prepared to justify your answers. Set A: 1, 3, 3, 5, 5, 5, 7, 7, 9 Set B: 1, 4, 4, 4, 5, 6, 6, 6, 9 Working together in a pair can you represent how the data is spread out using one number? Individual Task Set A: 4, 5, 6, 7, 8, 9, 10, 11, 12 Set B: 4, 6, 6, 6, 8, 10, 10, 10, 12 By yourself, represent how the data is spread out using one number. Check students' understanding of the task itself—not how to solve it. Ask for questions. Provide clarification as needed.
Materials Scratch paper Pencils
Grouping (Individual, group size, etc.) Students will work in pairs to brainstorm ideas on how to measure the distribution using one letter to represent mean deviation.
Anticipated Thinking Conceptions
Students will use the word “average” to help explain how to find the mean deviation from the median.
Students will show the distance between individual values using the mean deviation
Misconceptions Students will misconceive how
to best represent the spread of information because they may confuse finding the mean deviation with simply finding the mean.
Representations Students will use box plots, line graphs, or frequency tables to show data distribution Questions
How are you representing your data?
Which numbers could show how spread apart the numbers are?
Are there strategies that helped you find numbers that helped represent the data sets? How did you find those specific numbers?
Intended Sharing Order I intend to show information as it progresses: Misconception: Students will
mistake finding the mean deviation with simply finding the mean.
Conception: Students will show the distance between individual values using the mean deviation.
Accountability for Listening Students (Random vs. volunteer, individual vs. group) Students will be called upon at random to support or challenge the sharers’ comments. Some students will be selected to volunteer key information about the mean if there is a need for clarification.
Listening Student Responsibilities (think, talk, moves, etc.)
Relation: Listening students will find the relationship between the sharing students’ ideas and representations and their own.

65
CMI DEVELOP LESSON PLAN 6
In the context of a word problem involving finding the mean distribution of a data set, students will perform the following: Surface ideas such as how to represent the distance between the numbers in the data set and the mean by using one
number. Invent strategies to Invent strategies to express how the data is spread out. Create representations that show how the student was able to find an acceptable number (the mean deviation) to
represent the spread of each data value from the mean.
Relative to 6. SP. 5c, summarize numerical data sets in relation to their context, such as by giving quantitative measure of center (median and/or mean) and variability (interquartile range and/or mean absolute deviation), as well as describing any overall pattern and any striking deviations from the overall patterns with reference to the context in which the data were gathered.
Launch Explore Discuss Task (Word Problem) Individual Task Set: 2, 2, 5, 5, 6, 10, 10, 12, 14, 16, 18. Find the mean deviation to represent the separation from each number. Check students' understanding of the task itself—not how to solve it. Ask for questions. Provide clarification as needed.
Materials Scratch paper Pencils
Grouping (Individual, group size, etc.) Students will work individual to determine the distribution of data using one letter to represent the mean deviation.
Anticipated Thinking Conceptions
Students will apply previous understanding of how to find a mean of a data and apply it to finding the mean deviation of a score.
Students will find the mean deviation by determining the mean of a data set and will use the same strategy to find the mean deviation as they would to find the mean of a data set.
Misconceptions Measuring the data from the
center of the mean and not the median.
Representations Students will draw or write their responses. Questions
How are you representing your data?
Which numbers could show how spread apart the numbers are?
Are there strategies that helped you find numbers that helped represent the data sets? How did you find those specific numbers?
Intended Sharing Order I intend to show information as it progresses: Measuring the data from the center of
the mean and not the median, because this set has a different mean than median.
Conception: Students will find the mean deviation by determining the mean of a data set and will use the same strategy to find the mean deviation as they would to find the mean of a data set.
Accountability for Listening Students (Random vs. volunteer, individual vs. group) Students will be held accountable for their responses and may be called upon at random to support or challenge the sharers’ comments. I anticipate that I will call upon some students to volunteer key information about the mean if there is a need for clarification.
Listening Student Responsibilities (think, talk, moves, etc.)
Challenge/Support: Listeners need to agree or disagree with the sharer.
Justifications: Listening students would be prepared to justify their own thinking as well as require justification from the sharing students.
Related Documents