Oral Hygiene Interventions for the Prevention of Healthcare-Associated Infections and the Impact of Healthcare-Associated Infections on Patients Hospitalized With Oropharyngeal Cancers of Lip, Mouth, and Pharynx. Citation Poolakkad Sankaran, Satheesh Kumar. 2020. Oral Hygiene Interventions for the Prevention of Healthcare-Associated Infections and the Impact of Healthcare-Associated Infections on Patients Hospitalized With Oropharyngeal Cancers of Lip, Mouth, and Pharynx.. Master's thesis, Harvard Medical School. Permanent link https://nrs.harvard.edu/URN-3:HUL.INSTREPOS:37365238 Terms of Use This article was downloaded from Harvard University’s DASH repository, and is made available under the terms and conditions applicable to Other Posted Material, as set forth at http:// nrs.harvard.edu/urn-3:HUL.InstRepos:dash.current.terms-of-use#LAA Share Your Story The Harvard community has made this article openly available. Please share how this access benefits you. Submit a story . Accessibility

Welcome message from author
This document is posted to help you gain knowledge. Please leave a comment to let me know what you think about it! Share it to your friends and learn new things together.
Transcript
Oral Hygiene Interventions for the Prevention of Healthcare-Associated Infections and the Impact of Healthcare-Associated Infections on Patients Hospitalized With Oropharyngeal Cancers of Lip, Mouth, and Pharynx.
CitationPoolakkad Sankaran, Satheesh Kumar. 2020. Oral Hygiene Interventions for the Prevention of Healthcare-Associated Infections and the Impact of Healthcare-Associated Infections on Patients Hospitalized With Oropharyngeal Cancers of Lip, Mouth, and Pharynx.. Master's thesis, Harvard Medical School.
Permanent linkhttps://nrs.harvard.edu/URN-3:HUL.INSTREPOS:37365238
Terms of UseThis article was downloaded from Harvard University’s DASH repository, and is made available under the terms and conditions applicable to Other Posted Material, as set forth at http://nrs.harvard.edu/urn-3:HUL.InstRepos:dash.current.terms-of-use#LAA
Share Your StoryThe Harvard community has made this article openly available.Please share how this access benefits you. Submit a story .
Accessibility
ORAL HYGIENE INTERVENTIONS FOR THE PREVENTION OF HEALTHCARE-
ASSOCIATED INFECTIONS
AND
THE IMPACT OF HEALTHCARE-ASSOCIATED INFECTIONS ON PATIENTS
HOSPITALIZED WITH OROPHARYNGEAL CANCERS OF LIP, MOUTH, AND
PHARYNX.
by
Satheesh kumar Poolakkad Sankaran
A DISSERTATION SUBMITTED TO THE FACULTY OF HARVARD MEDICAL
SCHOOL IN PARTIAL FULFILLMENT OF THE REQUIREMENTS FOR THE
DEGREE OF MASTER OF MEDICAL SCIENCES IN CLINICAL INVESTIGATION
(MMSCI)
Harvard University
Boston, Massachusetts
April 2020
Project Advisor:
Stephen T Sonis, DMD, DMSc,
Harvard School of Dental Medicine.
Area of expertise: Oral-Systemic disease relationships
2
APPROVAL
Name: Satheesh kumar Poolakkad Sankaran
Degree: Master of Medical Sciences in Clinical Investigation (MMSCI)
Title of Thesis: Oral hygiene interventions for the prevention of healthcare-associated
infections and the impact of healthcare-associated infections on patients hospitalized
with oropharyngeal cancers of lip, mouth, and pharynx.
Thesis Committee
Chair:
_____________________________________
Ajay Singh, MD
Associate Professor, Harvard Medical School, Harvard University
_____________________________________
Finnian McCausland, MD
Assistant Professor, Harvard Medical School, Harvard University
_____________________________________
Stephen T Sonis, DMD, DMSc
Supervisor
Professor, Oral Medicine, Harvard School of Dental Medicine, Harvard University
_____________________________________
Agnus Lau, DMD
External Content Expert
Assistant Professor, Harvard School of Dental Medicine, Harvard University
____________________________________
Vidya Sankar, DMD
External Examiner
Associate Professor, Oral Medicine, Tufts University
Date Defended/Approved: April 23,2020
3
Gugoi, my daughter,
Minu, my wife,
Anita Balan, my teacher,
And Sudheer Babu, my friend
4
Acknowledgment
I want to express my sincere gratitude to my supervisor, Dr. Stephen T Sonis, for the
continuous support of my study and research for his patience, support, motivation, and
immense knowledge. His constructive guidance during the planning and development of
this research and his willingness to devote his time to giving suggestions is worth
mentioning.
I want to thank Dr. Alessandro Villa (Brigham Women's Hospital) and Dr. Stephania
Papatheodoru (T H Chan) for their encouragement and valuable support. Dr. Enid
Martinez for her all-time help and organizing the thesis committee sessions.
My sincere gratitude goes to Dr. Ajay, Dr. Finnian, and their team; and all my teachers
for providing advanced teaching at the Harvard Medical School and allowing me to
pursue my Master of Medical Sciences in Clinical Investigation.
Special mention goes to the encouragement and support from my colleague
Mohammed El-Dallal for helping in my hardest times.
Katie, Claire, and Barbara, for the support at any point in time.
This work has benefited from discussions, comments, and words of support from
colleagues and friends: Mohammed El-Dallal, El-Khansa, Christian, Surendra, Primary
Endpoint, and Biomodels lab folks.
Thanks to the blessings of God Almighty for the completion of this master's thesis. Last
but not least, I would like to thank my driving force: my beloved parents, wife, daughter,
and siblings for their constant support, love, and encouragement.
5
TABLE OF CONTENTS
Approval.........................................................................................................................2
Dedication .....................................................................................................................3
Acknowledgements ......................................................................................................4
Table of Contents..........................................................................................................5
Background....................................................................................................................9
References....................................................................................................................13
Research 1a. Enhanced oral hygiene interventions as a risk mitigation strategy
for the prevention of non-ventilator associated pneumonia (NVAP): A systematic
review and meta-analysis of randomized controlled trials and non-randomized
trials. ...................................................................................................................14
Title and abstract page.........................................................................................15
1. Introduction……................................................................................................17
2. Methods……......................................................................................................19
2.1 Search strategy and inclusion criteria…………...………………………….19
2.2 Data extraction ………………………………………….……………………….20
2.3. Quality of studies ………………………………………………………………21
2.4. Subgroup analyses……….……………………………………………………21
2.5 Statistical analysis………………………...………...………………………….22
3. Results ………………………………………………………………………………….23
6
3.1 Meta-analysis of enhanced oral care in preventing NVAP-
RCTs…………………………………………………………………………………...27
3.2 Effect of oral chlorhexidine (CHX) in the prevention of NVAP………….27
3.3 Dental professional involvement in enhanced oral care in prevention of
pneumonia…………………………………………………………………………….28
3.4 Effects of enhanced oral care in the prevention of mortality due to
pneumonia………………………………………………………………………….…29
3.5 Non-randomized clinical trials………………………………………….….….30
3.6 Other studies……………………………………………….…………….………30
3. Discussion……………………………………………………….…………….……….….31
4. Conclusion…………………………………………………………………….……….….36
References……………………………………………………………………….…….….….37
Figures and tables………………………………………………………….……….…........39
Supplementary Table………………………………………………………….……….…...44
Research 1b. Network meta-analysis (NMA) to assess the comparative
effectiveness of oral care interventions in preventing ventilator associated
pneumonia in critically ill
patients………………..........................................................................................48
Title and abstract page.........................................................................................49
1. Background……................................................................................................51
7
2. Concepts of Network Meta-analysis................................................................52
2. Methods…….......................................................................................................53
2.1 PMA selection and description……….…………...………………………….53
2.2 Inclusion and exclusion criteria.…………………………………….…….….54
2.3. Data collection………………………….……………………….………………56
2.4 Statistical analysis ……….……………………….…………….………………56
3. Results ………………………………………………………………………………….57
3.1 Description of studies….……………………………………………….………58
3.2 Evidence used in the NMA………………………………………….………….57
3.3 Results of heterogeneity and consistency………………………………….60
Total heterogeneity statistics of NMA network…………………………………61
The heterogeneity/inconsistencies between designs of the NMA network.61
3.4 Rank order of interventions………………….………………….…….………62
4. Discussion………………………………………………………………………………….66
5.Conclusions…………………………………………………………………………………66
Reference………………………………………………………………………………………69
Figures and tables………………………………………………………….……….…........70
Supplementary file…...………………………………………………………………………72
Research 2. The impact of healthcare-associated infections on patients
hospitalized with oropharyngeal cancers of lip, mouth, and
pharynx…………………….…...............................................................................75
Abstract…….................................................................................................76
8
1.Background…….................................................................................................78
2. Methods……......................................................................................................79
3. NIS database……...................................................................................79
3. Study population…................................................................................79
4. Study measurements ...........................................................................80
5. Statistical analysis….............................................................................81
3. Results……........................................................................................................82
4. Discussion…….…….........................................................................................84
5. Conclusion…….…….........................................................................................90
Limitations.………………………………………………………...………….….….….90
Reference…………………………………………………………...…………….….….94
Figures and tables………………………………………………………….……...…........101
Supplementary file
ICD 10 billable Codes for Malignant neoplasms of lip, oral cavity and
pharynx……………………………………………………………………………….105
Summary of the research………………………………………………………………….111
Limitations………………………………………………………………………………..….116
Conclusions……………………………………………………………..……………….….121
Reference…………………………………………………………..……………………...…122
Appendix I….……………………………………………………………………...…………126
Appendix II….………………………………………………...…………………………......134
9
Background
Healthcare-associated infections (HAI) are a significant concern in the
United States, about 1 in 25 patients acquire HAI in any health care facility, including
hospital, ambulatory surgical center, end-stage renal disease centers and in the long-
term care facilities. [1] The risk for developing the HAIs include catheters, surgery,
injections, unhygienic setting, communicable disease, and overuse of antibiotics. [1, 2]
The prevention strategy put forward by the Centers for Disease Control and Prevention
(CDC), including a set framework for the state HAI prevention plans and judicious use of
antibiotics. [3]
The oral cavity is a natural environment for an enormous quantity of
microbes and as such an ecological niche for opportunistic and pathogenic
microorganisms that can lead to risk for cross-contamination and infection. The risk of
these infections is increased in hospitalized patients when oral cavity bacteria are
aspirated. Data suggests that aggressive oral hygiene interventions that lessen oral
bacterial colonization reduce the risk of ventilation associated pneumonia (VAP). [1]
When ventilation is found to be one of the risk factors for aspiration pneumonia, the
mainstream record suggests, the focus has always been on VAP.
10
Enhanced oral care has always been a focus towards reducing the VAP
while reducing the risk of pneumonia through enhanced oral care in non-VAP (NVAP)
setting is a hypothetical prevention strategy to be tested for, as pneumonia-causing
microbes are always present in the oral cavity. Hence, we investigate the likelihood of
Oral care intervention in preventing the NVAP is true with an experimental hypothesis
that reflects that there will be an observed effect for our experiment.
There appear to be a gap in the literature concerning the comparative
effectiveness of oral care interventions (OCI) as a medium to reduce HAI, such as VAP
and non-ventilator associated pneumonia (NVAP). Furthermore, the characteristics of
these HAIs among those patients undergoing major oropharyngeal procedures are
poorly defined relative to their impact on health outcomes and costs. Henceforth, we
undertook three studies to estimate these gaps,
i) The effect of enhanced oral care interventions for the prevention of NVAP: A
systematic review and meta-analysis of randomized controlled trials and non-
randomized trials. (Published, April 24th, 2020 issue of the British Dental Journal),
ii) Network meta-analysis to assess the comparative effectiveness of oral care
interventions in preventing ventilator-associated pneumonia in critically ill patients.
(Submitted to the journal of BMC Oral Health),
and, iii) The impact of healthcare-associated infections on patients hospitalized with
oropharyngeal cancers of lip, mouth, and pharynx – A National inpatient sample 2017
database study. (In preparation).
11
We performed a pairwise meta-analysis by assembling
aggregate patient data (APD) from completed studies that have been published in the
medical literature. Limitations might arise, such as - addressing some queries which are
not focused in original publications; information about the adequacy of randomization;
adjustment for the same variables across studies; ability to address long-term
outcomes; exploration of heterogeneity at the patient level and subgroup analyses of
patient-level data. These are some of the limitations of the aggregate patient-level meta-
analysis, and to tackle these challenges individual patient data meta-analysis is most
suitable, we tried to get the individual patient data from the authors to make our study
findings robust, but this was time-consuming, and only a few responded. Other
limitations of PMA which might equally arise is the publication bias, which arises as a
result of lack of studies published with negative effects, primarily due to studies with
small sample size and lacking power; no difference between intervention and control
groups; and complications or adverse events in the study group. [5]
Some of the ways of dealing with these challenges
• We decided priori to perform a pairwise meta-analysis focusing on the
randomized, non-randomized trials and observational study
• We searched for different databases apart from the primary databases for grey
literature.
• To reduce the effect of small-study effects and heterogeneity, we have priori
decide to use the Hartung, Knapp, Sidik, and Jonkman (HKSJ) adjustment for the
random-effects model. Simulations have shown that the HKSJ method performs
12
better than DerSimonian Laid (DL), especially when there is the heterogeneity,
and when number of studies in the meta-analysis is small.
• To assess the publication biases - Funnel plot, trim and fill and Eggers plot are
effective in detecting these tasks. We have not performed a publication biases as
there were less than ten studies included in our study cohort.
Our second project focused on the Network Meta-analysis (NMA). The
possible challenges in performing the NMA are the extension of clinical and
methodological homogeneity to comparisons (or transitivity assumptions) across groups
of studies that compare treatments, and secondly consistency or the statistical
manifestation of transitivity. [6] Ways of dealing with these challenges, we performed an
NMA on a robust recently published pairwise meta-analysis. We believe that selecting
the previously published PMA [4] represents a current, comprehensive, and inclusive
review of the topic. The PMA was screened from most of the massive databases, most
of them were searched until 2015 and 2016. We believe that we followed strict
assumptions and standardization, as this is the first NMA. The transparency,
reproducibility, and detailed documentation of our findings can be appropriately
appraised when the readers can compare both the studies.
13
Reference
1) Office of the Disease Prevention and Health Promotion. Health Care-Associated
Infection. Retrieved from: https://health.gov/hcq/prevent-hai.asp.
2) Centers for Disease Control and Prevention (CDC). Types of Healthcare-
associated Infections. Retrieved from:
https://www.cdc.gov/hai/infectiontypes.html
3) Centers for Disease Control and Prevention (CDC). Prevention status report,
healthcare associated infections. Retrieved from:
https://wwwn.cdc.gov/psr/NationalSummary/NSHAI.aspx.
4) Hua F, Xie H, Worthington HV, Furness S, Zhang Q, Li C. Oral hygiene care for
critically ill patients to prevent ventilator-associated pneumonia. Cochrane
Database Syst Rev. 2016;10:CD008367.
5) Gary H Lyman 1, Nicole M Kuderer. The Strengths and Limitations of Meta-
Analyses Based on Aggregate Data. BMC Med Res Methodol. 2005; 5:14.
6) Andrea Cipriani , Julian P T Higgins, John R Geddes, Georgia Salanti Conceptual
and Technical Challenges in Network Meta-Analysis. Ann Intern Med
2013;159(2):130-7.
14
Research 1a.
Enhanced oral hygiene interventions as a risk mitigation strategy for the
prevention of non-ventilator associated pneumonia:
A systematic review and meta-analysis of randomized controlled trials and non-
randomized trials.
(Published - April 24th, 2020 issue of the British Dental Journal)
15
Enhanced oral hygiene interventions as a risk mitigation strategy for the prevention
of non-ventilator associated pneumonia: A systematic review and meta-analysis
of randomized controlled trials and non-randomized trials.
Satheeshkumar PS*1,2, Stefania Papatheodorou3, Stephen Sonis2,4
1 Harvard Medical School, Boston MA, USA, 2 Primary Endpoint Solutions, Watertown
MA, USA. 3 Harvard School of Public Health, Boston MA, USA. 4 Brigham and Women’s
Hospital, Boston, MA, USA
Word count (Abstract): 250 words.
Word count (Main text): 3543 words.
Key words:
Non-ventilation associated pneumonia, hospital acquired infections, oral care
interventions.
Abstract
Background. Healthcare-acquired pneumonias are a significant risk for nursing home
and hospital patients. While oral care interventions (OCI) have been found to be
effective in reducing the risk of ventilator-associated pneumonia (VAP), their utility in
mitigating non-ventilator-associated pneumonias (NVAP) remains unknown. We
16
performed a structured meta-analysis of randomized and non-randomized clinical trials
of enhanced oral hygiene procedures on NVAP.
Methods: We searched PubMed and Embase to include clinical trials (randomized and
non-randomized), and observational (retrospective and prospective), and quasi
experimental studies examining the effect of any method of OCI on incidence of NVAP.
Results. After quality assessment and consensus agreement between authors we
synthesized 6 randomized clinical trials (RCTs) (3891 patients), two non-randomized
trials (2993 patients); and separately assessed a retrospective trial (143 patients) and a
quasi-experimental study (83 patients). Most studies, performed in nursing homes, did
not show a significant association between OCI and NVAP prevention (RR random
0.89, 95% CI 0.64-1.25, p value 0.50). Likewise, the non-randomized trials failed to
show an association between NVAP risk and OCI (RR random 1.42, 95% CI, 0.70-2.88,
p value 0.32). However, in the subgroup analysis comparing dental professional
involvement in care vs usual care, reduced NVAP risk was demonstrated (RR random
0.65,95% CI 0.43-0.98, p value 0.03).
Conclusions. Study results suggest that professional dental care may have some
benefit among NVAP patients. The lack of consistent OCI protocols, data in hospitalized
patients, and robust RCTs do not allow definitive conclusions about the contribution of
OCI in mitigating NVAP risk.
17
1.0 Introduction
Pneumonias acquired in acute and chronic healthcare facilities are a significant risk for
patients. A 2015 survey reported that hospital-acquired infections affect approximately
3.2% of patients hospitalized in the United States (1) or 1,184,000 cases this year, at
costs exceeding $40,000,000,000. Among hospital-acquired infections, pneumonias are
the most common with an overall incidence of 21.8%. (2-4) Pneumonia is also clinically
the most significant infection among the approximately 1.7 million nursing home patients
in the United States with an incidence of 0.3 to 2.3 episodes per 1000 resident care
days. (5)
Pneumonias in these populations are typically categorized based on their association
with ventilator use. Ventilator-associated pneumonias (VAP) have been best studied
and protocols have been developed which have lowered their risk. In contrast, the
prevalence of non-ventilator-associated pneumonias (NVAP) has remained essentially
unchanged. (1) Classical hospital-acquired pneumonias are defined as those that
develop after 48 hours of hospital admission. (6) While the definition for NVAPs can
also be applied to nursing home patients, there are marked differences between the two
populations including length of stay [nursing home 13.7 months (7) vs. 6.1 days for
acute care hospitals (8)], demographics and co-morbidities. Nonetheless, given the
potential importance of the oral cavity as a bacterial source for NVAP generally we
included both populations in the analysis but analyzed them separately.
18
The physiologic and healthcare costs of NVAPs are significant and have been well-
described.(2, 4, 8) The microbial etiology of NVAP has been ascribed to pathogens
associated with the upper aerodigestive tract for which four potential routes of
contamination have been hypothesized: aspiration of oropharyngeal secretions, food or
gastric contents, inhalation of infectious aerosols, contiguous spread of infection or
hematogenous spread from non-pulmonary sources to the lung. (9) The primary source
of pathogens of pulmonary infections is suggested to be associated with aspiration of
colonized secretions from the oropharynx. However, given the bacterial spectrum
reported for NVAP, it is impossible to ignore the nose, nasopharynx or sinuses as also
being important. A relationship between NVAP risk and dentate state is unresolved.
(10)
Intensive oral care interventions (OCI) regimens that reduce the oral cavity bacterial
load has been suggested to be effective in mitigating NVAP risk. The individual
elements comprising these regimens have not been consistent and range dramatically
in their intensity. However, trends in outcomes potentially support their utility. If
professionally delivered oral care regimens are to be considered for universal standard
of care for NVAP prevention, several critical questions require answers: 1. Is the nursing
time, effort and instrumentation needed for an expanded oral hygiene program justified
by a cost/benefit analysis; i.e. how effective are expanded oral hygiene programs in
modifying risk of NVAP? 2. Are there specific risk factors which can prospectively
identify patients at NVAP risk and how do these patients specifically respond to oral
hygiene programs? 3.When is the optimum time to initiate oral care interventions , i.e.
19
are programs which commence at the time of admission effective, or should oral
hygiene programs begin earlier, and if so, how much earlier, and 4. Are the pathogens
observed in NVAP found in the oral biofilm, where are the primary depots of pathogens
and which OCI best target those depots? As a first step, we performed a structured
meta-analysis in which we assessed randomized and non-randomized clinical trials and
observational studies that investigated the relative efficacy of enhanced OCI Program
on NVAP.
2. Methods
2.1 Search strategy and inclusion criteria
Using the Preferred Reporting Items for Systematic Reviews and Meta-analyses
(PRISMA) statement, (11) a systematic literature appraisal was performed. The
literature search was done in PUBMED (inception until January 2019) and EMBASE
(1990 to January 2019) using inclusive search terms (See Supplementary Appendix 1).
The searches included all study designs: clinical trials (randomized and non-
randomized), observational studies (retrospective and prospective), and quasi
experimental studies. Title and abstracts were independently screened by two
investigators (KS, SS) and disagreements regarding eligibility were discussed. Cross-
referencing and supplementary literature searches were performed to examine
references in topic-related previous published reviews and by manually searching
bibliographies of the included articles and similar articles. Full-text screening of selected
publication was done by two examiners and discrepancies were resolved by discussion.
20
For each selected study, the study characteristics were extracted by two assessors
which were then corroborated by a third researcher.
Inclusion criteria:
Experimental and observational studies were included based on the following criteria:
1.) reporting NVAP as a primary outcome; 2.) conducted on hospitalized/chronic care
facility adults > 18 years of age and were not diagnosed having pneumonia at the time
of admission; 3.) intervention or exposure to enhanced oral care, whether matched with
placebo, usual care or comparable medication for preventing NVAP; 4.) provided data in
the form of point estimates and measure of 95% confidence intervals (CIs) or the data
were required to be available to calculate those measures. Studies were excluded if
they did not provide specific NVAP results as were those that used the term “hospital-
acquired pneumonia (HAP)” but did not differentiate NVAP from VAP. We also excluded
the studies which were not published in English Language, and results published as
abstracts or poster presentations. If data from the same patient cohort was published
more than once, we only included the study which most informed our outcome.
2.2 Data extraction
Data were extracted from eligible studies, independently, using pre-specified data
extraction forms. For each included record, study characteristics were recorded by two
independent members of the team and discrepancies were resolved by discussion.
Characteristics included methods, country, setting, duration of follow-up, sample size,
number of patients randomized, number of patients evaluated, inclusion and exclusion
21
criteria, diagnosis of NVAP, intervention (type, dose, and frequency of oral care), control
(type, dose, and frequency of oral care), outcome measures involving incidence of
NVAP secondary endpoints, and funding source.
2.3. Quality of studies
Reviewers independently extracted and assessed the risk of bias for randomized
controlled trials (RCTs), the random sequence generation (selection bias); allocation
concealment (selection bias); blinding of participants and personnel (performance bias);
blinding of outcome assessment (detection bias); incomplete outcome data (attrition
bias); selective reporting (reporting bias) and other bias (example, funding bias).
The quality of randomized controlled trials was assessed using the Risk of Bias tool
from the Cochrane Collaboration and the quality of observational studies was assessed
using the Newcastle-Ottawa Scale (NOS). (12, 13) Case definition met the
selection/outcome criteria if recorded in health-services/study databases as actual
diagnoses and did not meet the NOS criteria if self-reported and/ or gathered by
questionnaire. A similar approach was taken with ascertainment of enhanced oral care
to meet relevant NOS criteria if recorded as prescriptions in health-services/study
databases and did not meet NOS criteria if self-reported and/or gathered by an
unvalidated questionnaire. For loss-to follow up we considered any study with ≤10%
loss-to follow up adequate. The remaining NOS criteria were followed routinely.
2.4. Subgroup analyses
22
We performed three subgroup analyses. In the first, we evaluated the effectiveness of
chemical disinfection on NVAP risk, in the second, we compared the differences in
effectiveness between enhanced oral hygiene regimens in which a dental profession
(dentist/dental hygienist) vs. those which were administered solely by non-dentally
qualified individuals and in the third, we evaluated the effectiveness of the enhanced
oral hygiene regimens on the outcome of mortality due to NVAP.
2.5 Statistical analysis
Statistical analyses were based on comparing rates of total NVAP events between the
enhanced OCI group and the control group. If the studies did not report the number of
NVAP events and/or the total number of participants in the enhanced OCI group and the
control group, we used RR, OR, and a measure of variance 95% Confidence interval
(CIs) to produce summary relative risk estimates and measure of variance 95% CIs.
Due to the expected clinical heterogeneity between studies, we decided a priori to use
a DerSimonian and Laird (DL) random effects model for all analyses.(14) Testing for
heterogeneity between the studies was performed using Cochran’s Q test (15) and the
I2 test. (13) A p value < 0.05 or an I2 higher than 50% were considered significant
evidence for heterogeneity. Additionally, we used the Hartung-Knapp-Sidik-Jonkman
(HKSJ) (16) to retrieve more adequate error rates. Simulations have shown that the
HKSJ method performs better than DL, especially when there is heterogeneity and the
number of studies in the meta-analysis is small. (16-20) Subgroup analysis was
performed to assess whether there were differences between professional dental care
23
and usual care; use of antimicrobial chlorhexidine and usual care; and mortality due to
pneumonia in enhanced OCI versus usual care. All statistical analyses were performed
using R Studio, Version 1.1.456 (RStudio: Integrated Development for RStudio.
RStudio, Inc., Boston, MA URL).
Visual assessment using Funnel and Egger’s plots for publication bias wasn’t performed
as we had only less than 10 studies included in the meta-analysis.
3. Results
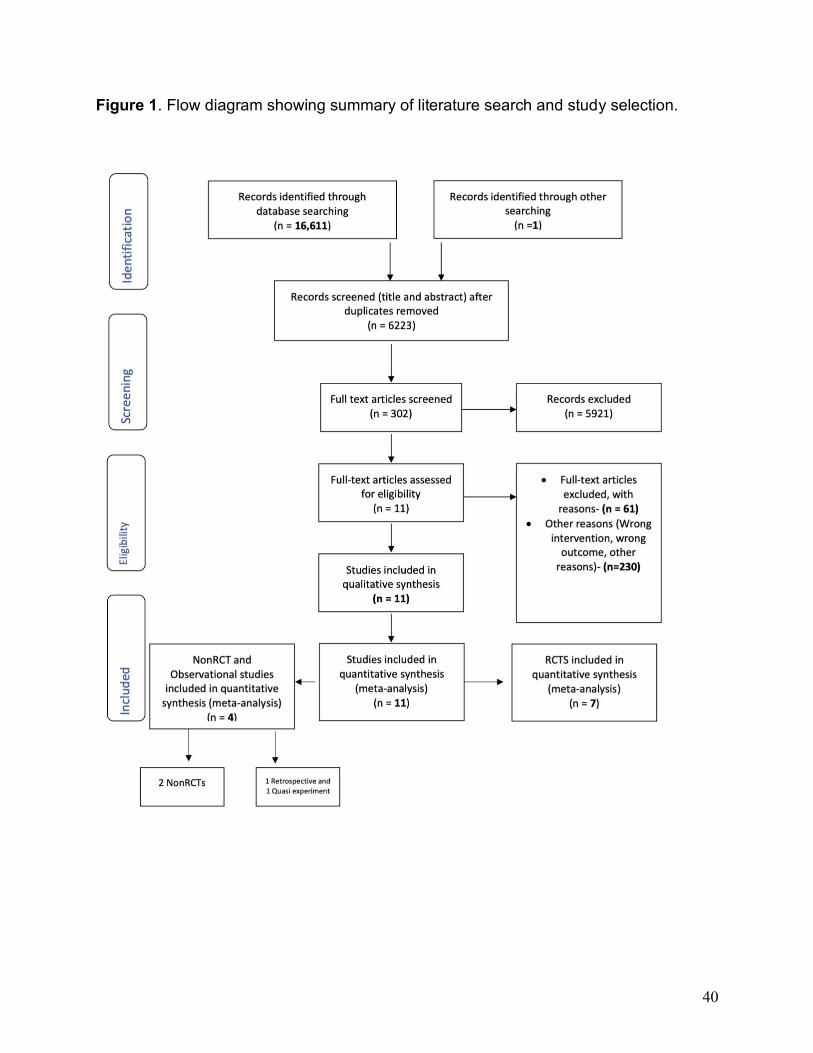
Our initial search provided 16,611 records; duplicates of 6223 were removed with the
Endnote software X9.1.1 version. After title and abstract screen, 5921 unrelated records
were excluded, culminating in 302 records that were assessed for eligibility using full
text screening. Eleven studies were identified as meeting our inclusion criteria. Our
search strategy led to identification of 7 clinical trials, 2 non-randomized clinical trials, 1
quasi-randomized and 1 retrospective cohort study. [Figure 1]
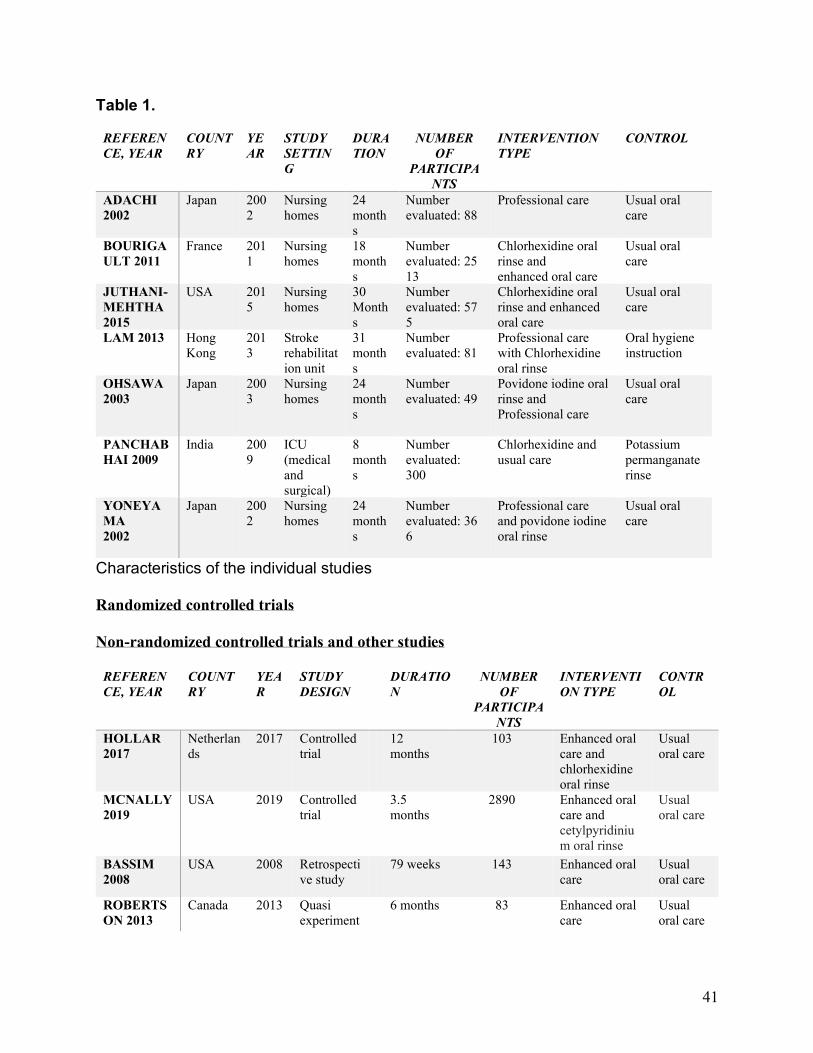
Characteristics of the included studies are listed in Table 1. Seven
RCTs (21-27) are included in our analysis of which five (21-23, 26, 27) were conducted
in nursing homes, one (24) in stroke rehabilitation unit, and one (25) in intensive care
unit (ICU). One study was not included in the qualitative assessment because of non-
estimable risks both in the intervention and the control group. (24) A total of 3891
patients were included in the overall analysis. Among the non-RCTs (28, 29), one
study (28) (number analyzed, 2890) was done in non-intensive acute care hospital
setting and the other (29) in nursing home residents. Among the other experiment
24
designs, one study was quasi experimental trial (30) (number analyzed, 83) in a
neurosurgical population outside the critical care environment and the other study was a
retrospective analysis (31) (number analyzed, 143), done in nursing home residents.
We employed a per-protocol analysis (PPA) to understand the superior effects of
treatment as PPA provides an estimate of the true efficacy of an intervention
recognizing that PPA interpretation to actual practice may be confounded by an
overstated treatment weight. [32]
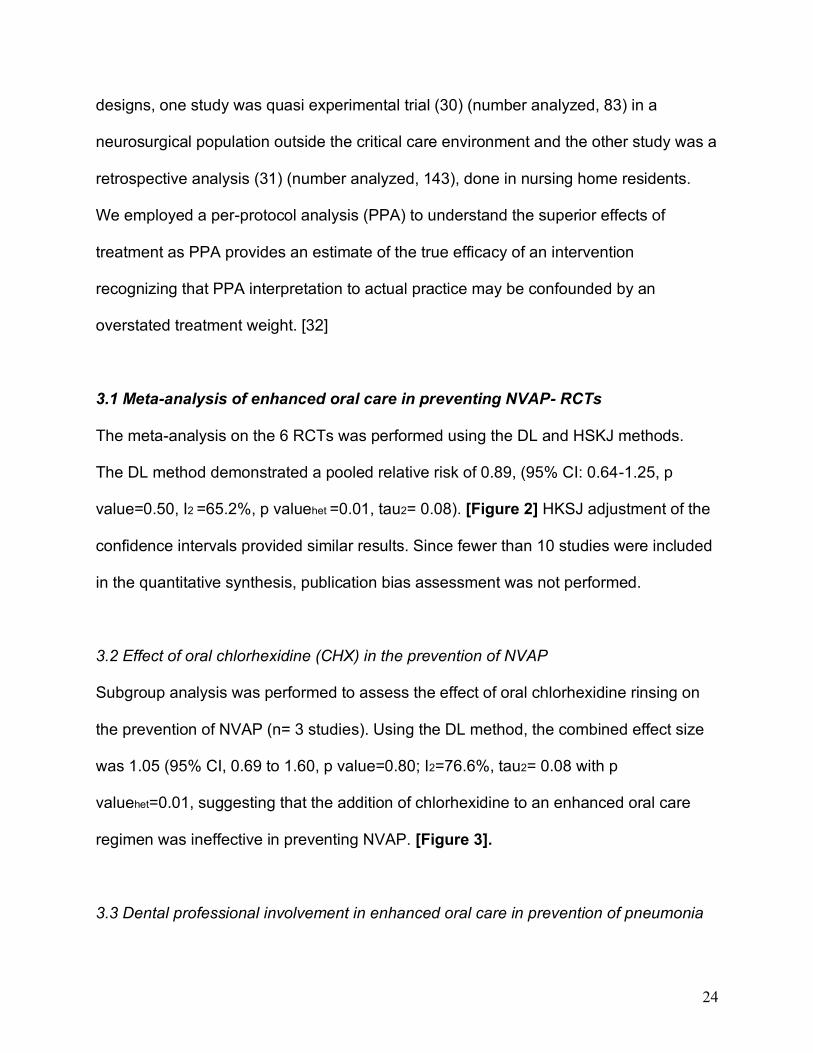
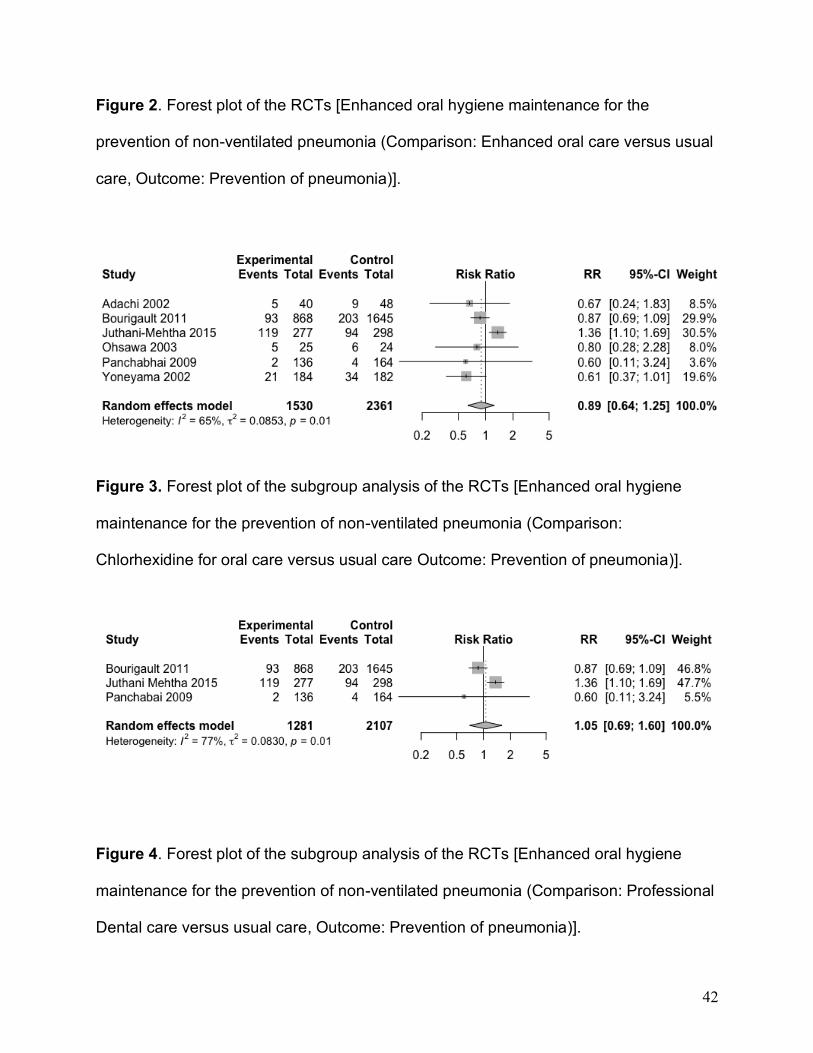
3.1 Meta-analysis of enhanced oral care in preventing NVAP- RCTs
The meta-analysis on the 6 RCTs was performed using the DL and HSKJ methods.
The DL method demonstrated a pooled relative risk of 0.89, (95% CI: 0.64-1.25, p
value=0.50, I2 =65.2%, p valuehet =0.01, tau2= 0.08). [Figure 2] HKSJ adjustment of the
confidence intervals provided similar results. Since fewer than 10 studies were included
in the quantitative synthesis, publication bias assessment was not performed.
3.2 Effect of oral chlorhexidine (CHX) in the prevention of NVAP
Subgroup analysis was performed to assess the effect of oral chlorhexidine rinsing on
the prevention of NVAP (n= 3 studies). Using the DL method, the combined effect size
was 1.05 (95% CI, 0.69 to 1.60, p value=0.80; I2=76.6%, tau2= 0.08 with p
valuehet=0.01, suggesting that the addition of chlorhexidine to an enhanced oral care
regimen was ineffective in preventing NVAP. [Figure 3].
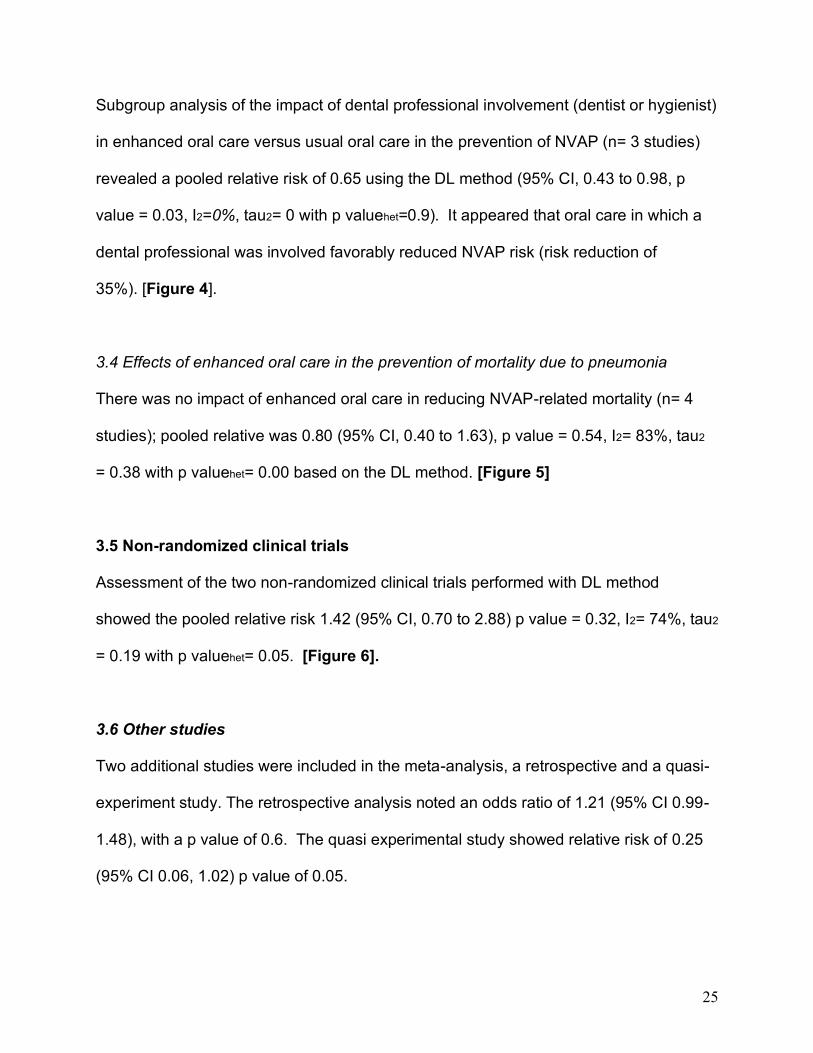
3.3 Dental professional involvement in enhanced oral care in prevention of pneumonia
25
Subgroup analysis of the impact of dental professional involvement (dentist or hygienist)
in enhanced oral care versus usual oral care in the prevention of NVAP (n= 3 studies)
revealed a pooled relative risk of 0.65 using the DL method (95% CI, 0.43 to 0.98, p
value = 0.03, I2=0%, tau2= 0 with p valuehet=0.9). It appeared that oral care in which a
dental professional was involved favorably reduced NVAP risk (risk reduction of
35%). [Figure 4].
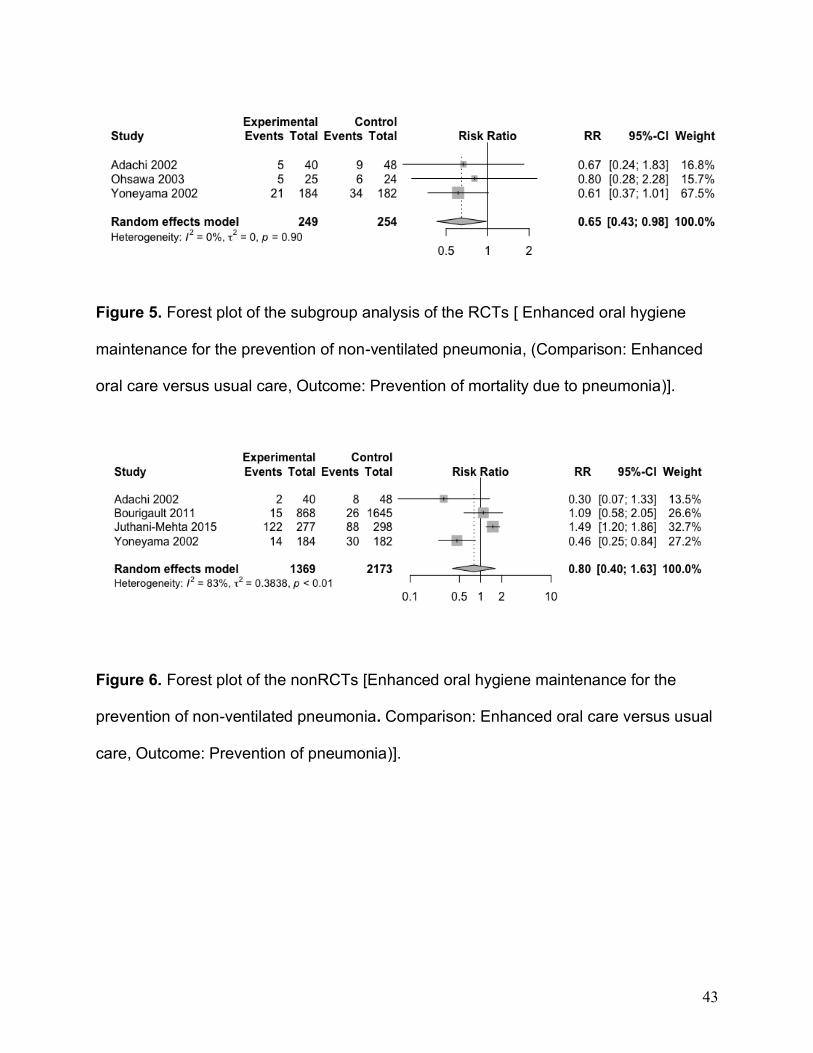
3.4 Effects of enhanced oral care in the prevention of mortality due to pneumonia
There was no impact of enhanced oral care in reducing NVAP-related mortality (n= 4
studies); pooled relative was 0.80 (95% CI, 0.40 to 1.63), p value = 0.54, I2= 83%, tau2
= 0.38 with p valuehet= 0.00 based on the DL method. [Figure 5]
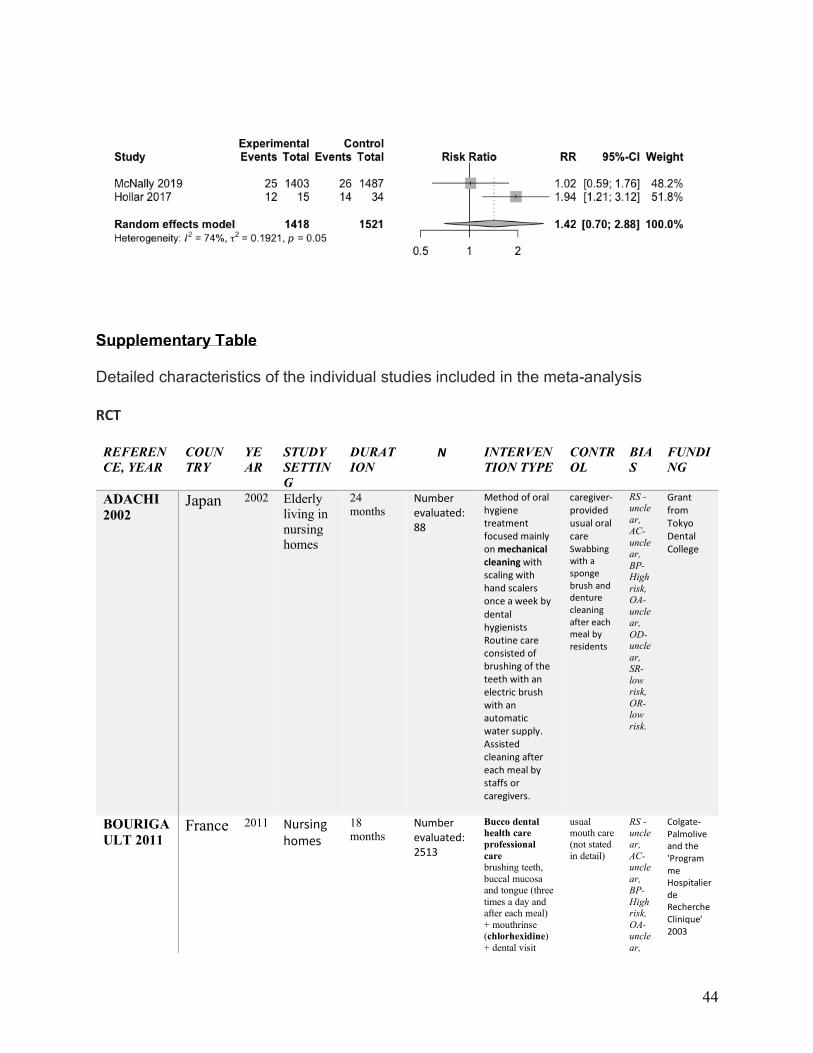
3.5 Non-randomized clinical trials
Assessment of the two non-randomized clinical trials performed with DL method
showed the pooled relative risk 1.42 (95% CI, 0.70 to 2.88) p value = 0.32, I2= 74%, tau2
= 0.19 with p valuehet= 0.05. [Figure 6].
3.6 Other studies
Two additional studies were included in the meta-analysis, a retrospective and a quasi-
experiment study. The retrospective analysis noted an odds ratio of 1.21 (95% CI 0.99-
1.48), with a p value of 0.6. The quasi experimental study showed relative risk of 0.25
(95% CI 0.06, 1.02) p value of 0.05.
26
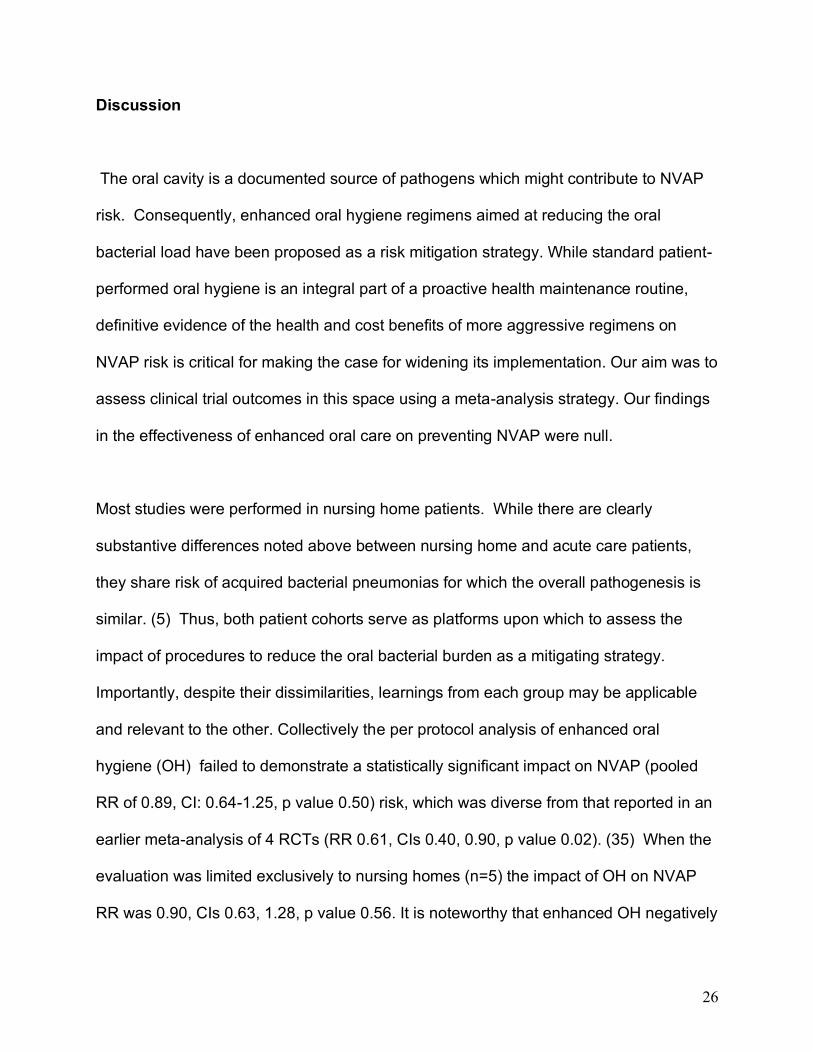
Discussion
The oral cavity is a documented source of pathogens which might contribute to NVAP
risk. Consequently, enhanced oral hygiene regimens aimed at reducing the oral
bacterial load have been proposed as a risk mitigation strategy. While standard patient-
performed oral hygiene is an integral part of a proactive health maintenance routine,
definitive evidence of the health and cost benefits of more aggressive regimens on
NVAP risk is critical for making the case for widening its implementation. Our aim was to
assess clinical trial outcomes in this space using a meta-analysis strategy. Our findings
in the effectiveness of enhanced oral care on preventing NVAP were null.
Most studies were performed in nursing home patients. While there are clearly
substantive differences noted above between nursing home and acute care patients,
they share risk of acquired bacterial pneumonias for which the overall pathogenesis is
similar. (5) Thus, both patient cohorts serve as platforms upon which to assess the
impact of procedures to reduce the oral bacterial burden as a mitigating strategy.
Importantly, despite their dissimilarities, learnings from each group may be applicable
and relevant to the other. Collectively the per protocol analysis of enhanced oral
hygiene (OH) failed to demonstrate a statistically significant impact on NVAP (pooled
RR of 0.89, CI: 0.64-1.25, p value 0.50) risk, which was diverse from that reported in an
earlier meta-analysis of 4 RCTs (RR 0.61, CIs 0.40, 0.90, p value 0.02). (35) When the
evaluation was limited exclusively to nursing homes (n=5) the impact of OH on NVAP
RR was 0.90, CIs 0.63, 1.28, p value 0.56. It is noteworthy that enhanced OH negatively
27
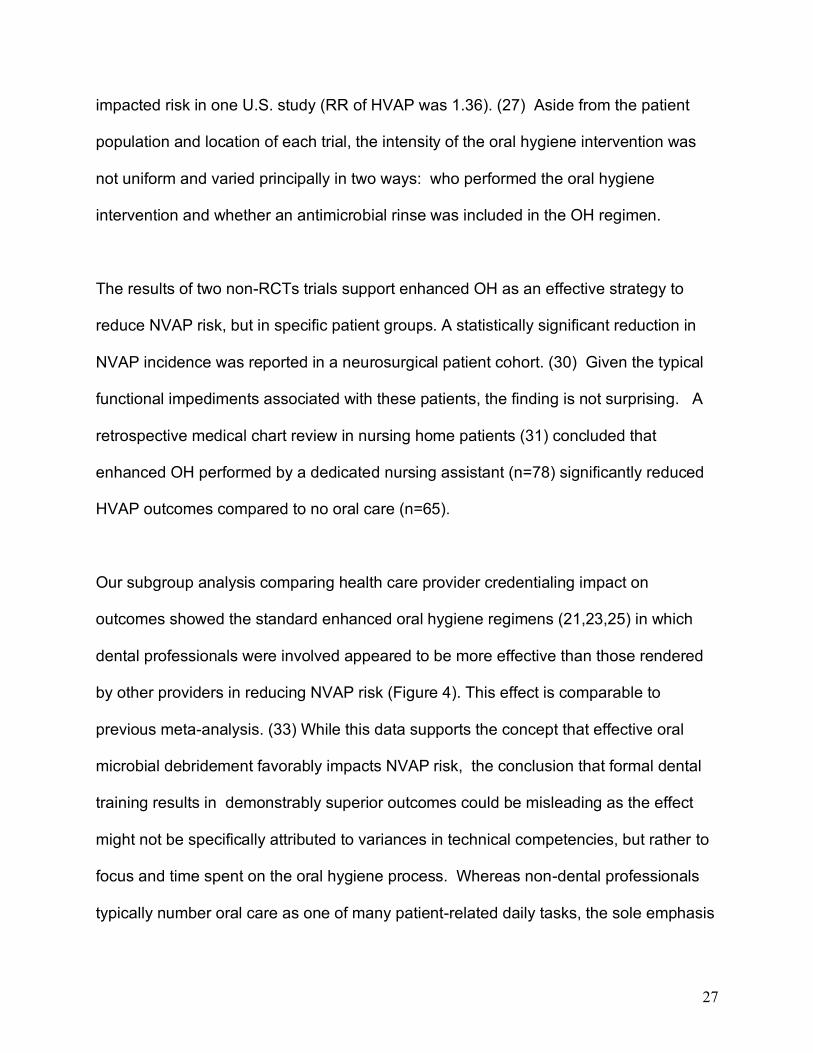
impacted risk in one U.S. study (RR of HVAP was 1.36). (27) Aside from the patient
population and location of each trial, the intensity of the oral hygiene intervention was
not uniform and varied principally in two ways: who performed the oral hygiene
intervention and whether an antimicrobial rinse was included in the OH regimen.
The results of two non-RCTs trials support enhanced OH as an effective strategy to
reduce NVAP risk, but in specific patient groups. A statistically significant reduction in
NVAP incidence was reported in a neurosurgical patient cohort. (30) Given the typical
functional impediments associated with these patients, the finding is not surprising. A
retrospective medical chart review in nursing home patients (31) concluded that
enhanced OH performed by a dedicated nursing assistant (n=78) significantly reduced
HVAP outcomes compared to no oral care (n=65).
Our subgroup analysis comparing health care provider credentialing impact on
outcomes showed the standard enhanced oral hygiene regimens (21,23,25) in which
dental professionals were involved appeared to be more effective than those rendered
by other providers in reducing NVAP risk (Figure 4). This effect is comparable to
previous meta-analysis. (33) While this data supports the concept that effective oral
microbial debridement favorably impacts NVAP risk, the conclusion that formal dental
training results in demonstrably superior outcomes could be misleading as the effect
might not be specifically attributed to variances in technical competencies, but rather to
focus and time spent on the oral hygiene process. Whereas non-dental professionals
typically number oral care as one of many patient-related daily tasks, the sole emphasis
28
of the dental professionals was on mouth hygiene. The observation that oral care
delivered by a dedicated nursing assistant produced equivalent NVAP-risk supports this
argument. (7) Competing time demands for services may limit nurses’ capacity to
deliver optimal mouthcare. (28) Additional studies are necessary to more fully
investigate the impact of provider qualifications on NVAP risk modification since the cost
implications of dedicated oral health aides, regardless of their qualification, is not trivial.
Two non-RCT studies in acute care hospital patients were informative. Among 90
elderly patients admitted emergently for lower limb fractures, ten percent of patients
developed NVAP. (10) While the authors found that pathogen colonization of the mouth
was higher in patients who developed NVAP, it was insufficient to explain differences
between VAP and NVAP groups. Whereas NVAP risk was not associated with being
dentate, tooth number, or heavy dental or denture plaque, it was associated with a
specific bacterial carriage which the authors concluded was present prior to hospital
admission.
In perhaps the largest study in an acute care hospital population, (control n=1,487;
experimental n=1,403), NVAP development was compared between patient self-
brushing (control; n = 1,487)) and enhanced nurse-delivered oral care (experimental
arm; n=1,403, three times per day toothbrushing with a fresh toothbrush and daily use
of an antiseptic rinse). Despite the designated oral care regimen, no impact on NVAP
rates were seen between the control (1.7%) and test groups (1.8%). Critically, despite
study-specific training and daily monitoring, nursing compliance was only 1.6 times per
29
day, only slightly better than patient self-brushing frequency (1.2 times per day).
However, when subjects from both arms were pooled and compared based on whether
they developed NVAP, the odds ratio for NVAP decreased by 40% when toothbrushing
increased by once per day regardless of who performed the procedure. Importantly,
this finding suggests that patient-directed education programs and provision of oral care
kits may be a valuable and cost- effective approach to NVAP control.
Given the challenges of cost and compliance with professionally delivered oral hygiene-
based approaches, chemical disinfection offers a non-procedural alternative to reduce
both the tooth-borne and mucosal oral bacterial burden. The latter clearly plays a role
in VAP risk and reduction of mucosal bacteria such those residing on the tongue
provides an important target for sustained anti-bacterial efficacy. (34) Chlorhexidine
remains the most popular agent for this purpose. However, in contrast to its reported
efficacy in preventing VAP, its efficacy mitigating NVAP risk was inconsistent across the
3 RCTs (RR 1.05) we evaluated (22, 25, 27), perhaps because of differences in dose
response effects and/or the impact of concurrent treatment. (35)
The contrasting efficacy of chlorhexidine rinses between NVAP and VAP is interesting.
One might speculate the antimicrobial prophylaxis in the form of a topical agent is
effective in preventing colonization of the ventilator tubes in the same way that similar
agents favorably impact catheter-centric infections. In the case of VAP, oral plaque
accumulation could be exacerbated with placement of ventilation apparatus, especially
in the premolar and molar areas.(36) In non-ventilated patients, the microbiome and the
30
environment is more fluid and subject to dilution effects of saliva which might negatively
impact efficacy.(37,38) It is also possible that the time to onset which defines NVAP
reduces the potential prophylactic efficacy of antimicrobials by compressing the time in
which they might effectively impact NVAP outcomes.
Evaluation of the NVAP literature indicates that NVAP risk is not equivalent for all
patients. (39) High rates of NVAP are consistently noted in post-operative cancer
patients, patients with neurological diseases and the elderly. The finding that dentate
state (dentulous vs. edentulous and number of teeth) is not a clear risk determinant
contradicts an oral hygiene strategy that focuses solely on tooth-borne bacteria. (10) It
is possible that a patient’s oral health status may be a risk component to the extent that
it reflects bacterial load. However, whether there is equivalent contribution to hospital
associated pneumonia amongst the different microbiological ecoenvironments in the
mouth (i.e. tooth-borne bacteria vs. mucosal bacterial niches like the dorsal tongue) is
unclear. (39, 40) Likewise, the comparative effectiveness of different oral hygiene
interventions on impacting bacterial pathogens is unresolved. (41) Our analysis
confirms the need for additional study to fully assess the benefit of OCI, optimize its
timing and personalize the intensity of OCI based individualizing risk/benefit. It seems
obvious that a “one size – fits all” approach for OCI would likely result in being
excessive for many patients, but inadequate for others. Given the frequency and impact
of NVAP, additional study is warranted.
31
Conclusion
In the Introduction we noted four question to which answers would better define NVAP
risk and intervention strategies. Given NVAP’s potential clinical and economic burden,
there is surprisingly little definitive documentation in the form of randomized-controlled
trials (RCTs) which speak to the efficacy of directed intervention methods. Most of the
RCTs reported were done in nursing homes – most in Japan – and they conclude that
structured enhanced OH regimens effectively reduced the rate of NVAP, and that
enhanced OH delivered by dental professionals were most effective. Therefore, the
generalizability of the results is limited. As a proof-of-concept, the results of such
studies can be concluded to be positive with an overall reduction in NVAP rates of
greater than 10%, but their broad translatability to the general hospital population is
unclear. While good oral hygiene for hospitalized patients should be as consistent as
handwashing and bathing, the current body of clinical research defining extended oral
interventions as they relate to VAP risk, and the comparative effectiveness of various
oral care interventions is incomplete. Given the impact of NVAP large, structured,
randomized trials in which specific interventions are tested are critical.
Acknowledgements:
This study was funded by an unrestricted grant from Sunstar to Primary Endpoint
Solutions (SK, STS).
32
We thank Dr. Dian Baker for her helpful comments during the preparation of this
manuscript.
Authors role
1) SK and STS: Design, methods, data collections, analysis and preparation of
paper.
2) SP: Analysis and preparation of paper.
Sponsor’s Role in manuscript preparation - None
References
1. Magill SS, O'Leary E, Janelle SJ, et al. Changes in Prevalence of Health Care-
Associated Infections in U.S. Hospitals. N Engl J Med. 2018 ;379(18):1732-1744.
2. Davis J, Finley E. The breadth of hospital acquired pneumonia: Nonventilated versus
ventilated patients in Pennsylvania. Pennsylvania Patient Safety Advisory.
2012;9(3):99-105.
3. Micek ST, Chew B, Hampton N, Kollef MH. A Case -Control Study Assessing the
Impact of Nonventilated Hospital-Acquired Pneumonia on Patient Outcomes. Chest.
2016;150(5):1008-14.
33
4. Giuliano KK, Baker D, Quinn B. The epidemiology of nonventilator hospital-acquired
pneumonia in the United States. Am J Infect Control. 2018;46(3):322-327
5. Raghavendran K, Mylotte JM, Scannapieco FA. Nursing home-associated
pneumonia, hospital-acquired pneumonia and ventilator-associated pneumonia: the
contribution of dental biofilms and periodontal inflammation. Periodontol 2000;
2007:44:164-72.
6. Kalil AC, Metersky ML, Klompas M, et al. Management of Adults with Hospital-
acquired and Ventilator-associated Pneumonia: 2016 Clinical Practice Guidelines by the
Infectious Diseases Society of America and the American Thoracic Society. Clin Infect
Dis. 2016 ;63(5): e61-e111
7. Kelly A, Conell-Price J, Covinsky K, Cenzer IS, Chang A, Boscardin WJ, Smith AK.
Length of stay for older adults residing in nursing homes at the end of life. J Am Geriatr
Soc. 2010; 58: 1701-6.
8. Baker DQ, B. Hospital Acquired Pneumonia Prevention Initiative-2: Incidence of
nonventilator hospital-acquired pneumonia in the United States. Am J Infect
Control. 2018 ;46(1):2-7.
9. Azarpazhooh A, Leake JL. Systematic review of the association between respiratory
diseases and oral health. J Periodontol. 2006;77(9):1465-82.
34
10. El-Solh AA, Pietrantoni C, Bhat A, Okada M, Zambon J, Aquilina A, Berbary E.
Colonization of dental plaques: a reservoir of respiratory pathogens for hospital-
acquired pneumonia in institutionalized elders. Chest. 2004;126(5):1575-82.
11. Moher D, Liberati A, Tetzlaff J, Altman DG;The PRISMA Group. Preferred Reporting
Items for Systematic Reviews and Meta-Analyses: The PRISMA Statement. PLoS
Med.2009; 6(7): e1000097.
12. Deeks JJ, Dinnes J, D'Amico R, et al. Evaluating non- randomised intervention
studies. Health Technol Assess. 2003;7(27):iii-x, 1-173.
13. Higgins JP, Altman DG, Gøtzsche PC, et al. The Cochrane Collaboration's tool for
assessing risk of bias in randomised trials. BMJ. 2011;343: d5928.
14. DerSimonian R, Laird N. Meta-analysis in clinical trials. Control Clin
Trials. 1986;7(3):177-88
15. Cochran WG. The comparison of percentages in matched samples.
Biometrika. 1950;37(3-4):256-66
https://www.ncbi.nlm.nih.gov/pubmed/?term=El-Solh%20AA%5BAuthor%5D&cauthor=true&cauthor_uid=15539730
35
16. IntHout J, Ioannidis JP, Borm GF. The Hartung-Knapp-Sidik-Jonkman method for
random effects meta-analysis is straightforward and considerably outperforms the
standard DerSimonian-Laird method. BMC Med Res Methodol. 2014; 14:25.
17. MANTEL N, HAENSZEL W. Statistical aspects of the analysis of data from
retrospective studies of disease. J Natl Cancer Inst. 1959; 22:719-48.
18. Böhning D, Malzahn U, Dietz E, Schlattmann P, Viwatwongkasem C, Biggeri A.
Some general points in estimating heterogeneity variance with the DerSimonian-Laird
estimator. Biostatistics. 2002;3(4):445-57
19. Sánchez-Meca J, Marín-Martínez F. Confidence intervals for the overall effect size
in random- effects meta-analysis. Psychol Methods. 2008;13(1):31-48.
20. Sidik K, Jonkman JN. Simple heterogeneity variance estimation for meta-analysis. J
Roy Stat Soc. 2005;54(2):367-84.
21. Adachi M, Ishihara K, Abe S, Okuda K, Ishikawa T. Effect of professional oral health
care on the elderly living in nursing homes. Oral Surg Oral Med Oral Pathol Oral Radiol
Endod. 2002 Aug;94(2):191-5.
https://www.ncbi.nlm.nih.gov/pubmed/?term=HAENSZEL%20W%5BAuthor%5D&cauthor=true&cauthor_uid=13655060
https://www.ncbi.nlm.nih.gov/pubmed/?term=Ishihara%20K%5BAuthor%5D&cauthor=true&cauthor_uid=12221387
36
22. Bourigault C, Lietard C, Golmard JL, et al. Impact of bucco- dental healthcare on the
prevention of pneumonia in geriatrics: a cluster-randomised trial. J Hosp
Infect. 2011;77(1):78-80.
23. Ohsawa T, Yoneyama T, Hashimoto K, Kubota E, Ito M, Yoshida K. Effects of
professional oral health care on the ADL of elderly patients in a nursing home. Bulletin
of Kanagawa Dental College 2003; 31:51-4.
24. Lam OL, McMillan AS, Samaranayake LP, Li LS, McGrath C. Randomized clinical
trial of oral health promotion interventions among patients following stroke. Arch Phys
Med Rehabil. 2013;94(3):435-43.
25. Panchabhai TS, Dangayach NS, Krishnan A, Kothari VM, Karnad DR.
Oropharyngeal cleansing with 0.2% chlorhexidine for prevention of nosocomial
pneumonia in critically ill patients: an open-label randomized trial with 0.01% potassium
permanganate as control. Chest. 2009 ;135(5):1150-1156.
26. Yoneyama T, Yoshida M, Ohrui T, et al. Oral care reduces pneumonia in older
patients in nursing homes. J Am Geriatr Soc. 2002;50(3):430-3.
27. Juthani-Mehta M, Van Ness PH, McGloin J, et al. A cluster-randomized controlled
trial of a multicomponent intervention protocol for pneumonia prevention among nursing
https://www.ncbi.nlm.nih.gov/pubmed/?term=Krishnan%20A%5BAuthor%5D&cauthor=true&cauthor_uid=19420193
37
home elders. Clin Infect Dis. 2015;60(6):849-57
28. McNally E, Krisciunas GP, Langmore SE, Crimlisk JT, Pisegna JM, Massaro J. Oral
Care Clinical Trial to Reduce Non-Intensive Care Unit, Hospital-Acquired Pneumonia:
Lessons for Future Research. J Healthc Qual. 2019;41(1):1-9
29. Hollaar VRY, van der Putten GJ, van der Maarel-Wierink CD Bronkhorst EM, de
Swart BJM, Creugers NHJ. The effect of a daily application of a 0.05% chlorhexidine
oral rinse solution on the incidence of aspiration pneumonia in nursing home residents:
a multicenter study. BMC Geriatr. 2017;17(1):128.
30. Robertson T, Carter D. Oral intensity: reducing non-ventilator-associated hospital-
acquired pneumonia in care-dependent, neurologically impaired patients. Can J
Neurosci Nurs. 2013;35(2):10-7.
31. Bassim CW, Gibson G, Ward T, Paphides BM, Denucci DJ. Modification of the risk
of mortality from pneumonia with oral hygiene care. J Am Geriatr Soc. 2008;56(9):1601-
7.
32. Ranganathan P, Pramesh CS, Aggarwal R. Common pitfalls in statistical analysis:
Measures of agreement. Perspect Clin Res. 2017;8(4):187-191.
33. Kaneoka A, Pisegna JM, Miloro KV, et al. Prevention of Healthcare-Associated
Pneumonia with Oral Care in Individuals Without Mechanical Ventilation: A Systematic
https://www.ncbi.nlm.nih.gov/pubmed/?term=Pisegna%20JM%5BAuthor%5D&cauthor=true&cauthor_uid=29634593
https://www.ncbi.nlm.nih.gov/pubmed/?term=Denucci%20DJ%5BAuthor%5D&cauthor=true&cauthor_uid=18691286
https://www.ncbi.nlm.nih.gov/pubmed/?term=Pramesh%20CS%5BAuthor%5D&cauthor=true&cauthor_uid=29109937
38
Review and Meta-Analysis of Randomized Controlled Trials. Infect Control Hosp
Epidemiol. 2015;36(8):899-906.
34. Bordas A, McNab R, Staples AM, Bowman J, Kanapka J, Bosma MP. Impact of
different tongue cleaning methods on the bacterial load of the tongue dorsum. Arch Oral
Biol 2008; Suppl 1: S13-8.
35. Tantipong H, Morkchareonpong C, Jaiyindee S, Thamlikitkul, V. Randomized
controlled trial and meta- analysis of oral decontamination with 2% chlorhexidine
solution for the prevention of ventilator-associated pneumonia. Infect Control Hosp
Epidemiol. 2008;29(2):131-6.
36. Jones DJ, Munro CL, Grap MJ. Natural history of dental plaque accumulation in
mechanically ventilated adults: a descriptive correlational study. Intensive Crit Care
Nurs. 2011;27(6):299-304
37. Ito M, Kawakami M, Ohara E, Muraoka K, Liu M. Predictors for achieving oral intake
in older patients with aspiration pneumonia: Videofluoroscopic evaluation of swallowing
function. Geriatr Gerontol Int. 2018;18(10):1469-1473
38. Estes RJ, Meduri GU. The pathogenesis of ventilator-associated pneumonia: I.
Mechanisms of bacterial transcolonization and airway inoculation. Intensive Care
Med. 1995;21(4):365-83
39. Di Pasquale M, Aliberti S, Mantero M, Bianchini S, Blasi F. Non-Intensive Care Unit
Acquired Pneumonia: A New Clinical Entity? Int J Mol Sci. 2016;17(3):287.
https://www.ncbi.nlm.nih.gov/pubmed/?term=Staples%20AM%5BAuthor%5D&cauthor=true&cauthor_uid=18460399
https://www.ncbi.nlm.nih.gov/pubmed/?term=Kawakami%20M%5BAuthor%5D&cauthor=true&cauthor_uid=30168244
39
40. Hong C, Aung MM, Kanagasabai K, Lim CA, Liang S, Tan KS. The association
between oral health status and respiratory pathogen colonization with pneumonia risk in
institutionalized adults. Int J Dent Hyg. 2018;16(2):e96-e102.
41. Lam OL, McGrath C, Li LS, Samaranayake LP. Effectiveness of oral hygiene
interventions against oral and oropharyngeal reservoirs of aerobic and facultatively
anaerobic gram-negative bacilli. Am J Infect Control. 2012;40(2):175-82.
Figure and Tables
40
Figure 1. Flow diagram showing summary of literature search and study selection.
41
Table 1.
Characteristics of the individual studies
Randomized controlled trials
Non-randomized controlled trials and other studies
REFEREN
CE, YEAR
COUNT
RY
YEA
R
STUDY
DESIGN
DURATIO
N
NUMBER
OF
PARTICIPA
NTS
INTERVENTI
ON TYPE
CONTR
OL
HOLLAR
2017
Netherlan
ds
2017 Controlled
trial
12
months
103 Enhanced oral
care and
chlorhexidine
oral rinse
Usual
oral care
MCNALLY
2019
USA 2019 Controlled
trial
3.5
months
2890 Enhanced oral
care and
cetylpyridiniu
m oral rinse
Usual
oral care
BASSIM
2008
USA 2008 Retrospecti
ve study
79 weeks 143 Enhanced oral
care
Usual
oral care
ROBERTS
ON 2013
Canada 2013 Quasi
experiment
6 months 83 Enhanced oral
care
Usual
oral care
REFEREN
CE, YEAR
COUNT
RY
YE
AR
STUDY
SETTIN
G
DURA
TION
NUMBER
OF
PARTICIPA
NTS
INTERVENTION
TYPE
CONTROL
ADACHI
2002
Japan 200
2
Nursing
homes
24
month
s
Number
evaluated: 88
Professional care Usual oral
care
BOURIGA
ULT 2011
France 201
1
Nursing
homes
18
month
s
Number
evaluated: 25
13
Chlorhexidine oral
rinse and
enhanced oral care
Usual oral
care
JUTHANI-
MEHTHA
2015
USA 201
5
Nursing
homes
30
Month
s
Number
evaluated: 57
5
Chlorhexidine oral
rinse and enhanced
oral care
Usual oral
care
LAM 2013 Hong
Kong
201
3
Stroke
rehabilitat
ion unit
31
month
s
Number
evaluated: 81
Professional care
with Chlorhexidine
oral rinse
Oral hygiene
instruction
OHSAWA
2003
Japan 200
3
Nursing
homes
24
month
s
Number
evaluated: 49
Povidone iodine oral
rinse and
Professional care
Usual oral
care
PANCHAB
HAI 2009
India 200
9
ICU
(medical
and
surgical)
8
month
s
Number
evaluated:
300
Chlorhexidine and
usual care
Potassium
permanganate
rinse
YONEYA
MA
2002
Japan 200
2
Nursing
homes
24
month
s
Number
evaluated: 36
6
Professional care
and povidone iodine
oral rinse
Usual oral
care
42
Figure 2. Forest plot of the RCTs [Enhanced oral hygiene maintenance for the
prevention of non-ventilated pneumonia (Comparison: Enhanced oral care versus usual
care, Outcome: Prevention of pneumonia)].
Figure 3. Forest plot of the subgroup analysis of the RCTs [Enhanced oral hygiene
maintenance for the prevention of non-ventilated pneumonia (Comparison:
Chlorhexidine for oral care versus usual care Outcome: Prevention of pneumonia)].
Figure 4. Forest plot of the subgroup analysis of the RCTs [Enhanced oral hygiene
maintenance for the prevention of non-ventilated pneumonia (Comparison: Professional
Dental care versus usual care, Outcome: Prevention of pneumonia)].
43
Figure 5. Forest plot of the subgroup analysis of the RCTs [ Enhanced oral hygiene
maintenance for the prevention of non-ventilated pneumonia, (Comparison: Enhanced
oral care versus usual care, Outcome: Prevention of mortality due to pneumonia)].
Figure 6. Forest plot of the nonRCTs [Enhanced oral hygiene maintenance for the
prevention of non-ventilated pneumonia. Comparison: Enhanced oral care versus usual
care, Outcome: Prevention of pneumonia)].
44
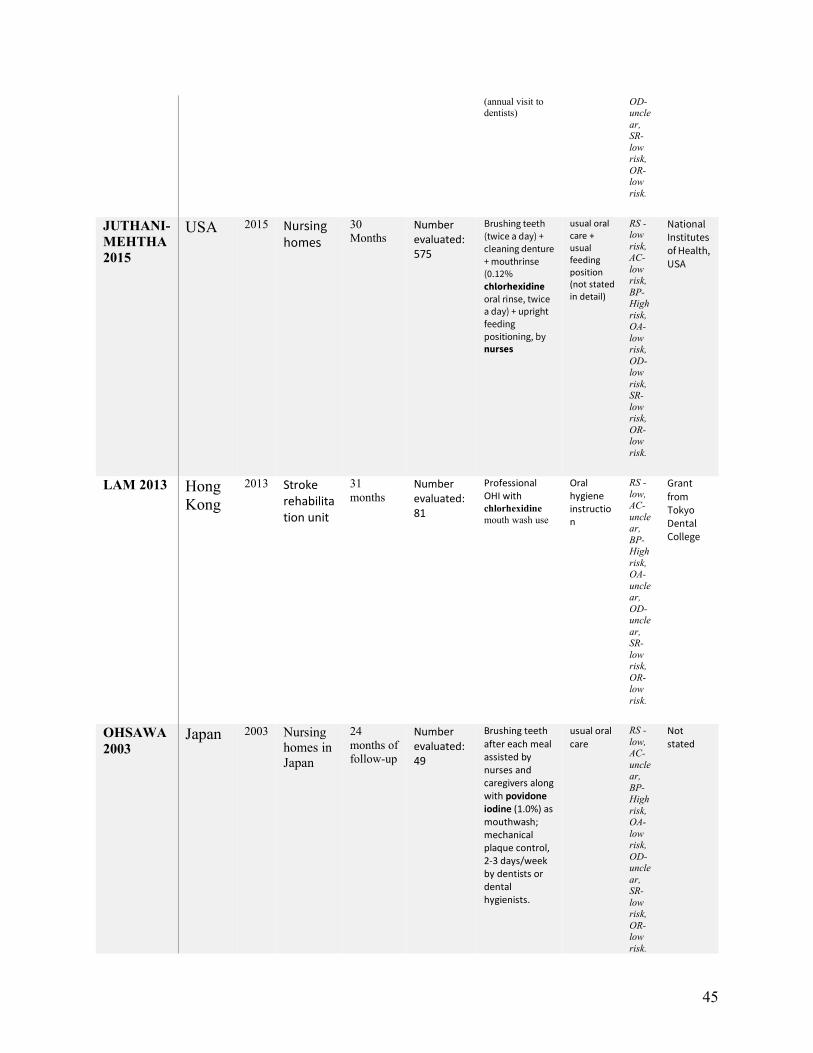
Supplementary Table Detailed characteristics of the individual studies included in the meta-analysis RCT
REFEREN
CE, YEAR
COUN
TRY
YE
AR
STUDY
SETTIN
G
DURAT
ION N INTERVEN
TION TYPE
CONTR
OL
BIA
S
FUNDI
NG
ADACHI
2002 Japan 2002 Elderly
living in
nursing
homes
24
months Number evaluated: 88
Method of oral hygiene treatment focused mainly on mechanical cleaning with scaling with hand scalers once a week by dental hygienists Routine care consisted of brushing of the teeth with an electric brush with an automatic water supply. Assisted cleaning after each meal by staffs or caregivers.
caregiver‐provided usual oral care Swabbing with a sponge brush and denture cleaning after each meal by residents
RS -uncle
ar, AC-
unclear,
BP-High
risk, OA-
unclear,
OD- uncle
ar, SR-
low risk,
OR- low
risk.
Grant from Tokyo Dental College
BOURIGA
ULT 2011 France 2011 Nursing
homes
18
months
Number evaluated: 2513
Bucco dental
health care
professional
care
brushing teeth,
buccal mucosa and tongue (three
times a day and after each meal)
+ mouthrinse (chlorhexidine)
+ dental visit
usual mouth care (not stated
in detail)
RS -unclear,
AC- uncle
ar, BP-
High risk,
OA- uncle
ar,
Colgate‐Palmolive and the 'Programme Hospitalier de Recherche Clinique' 2003
45
(annual visit to dentists)
OD- uncle
ar, SR-
low risk,
OR- low
risk.
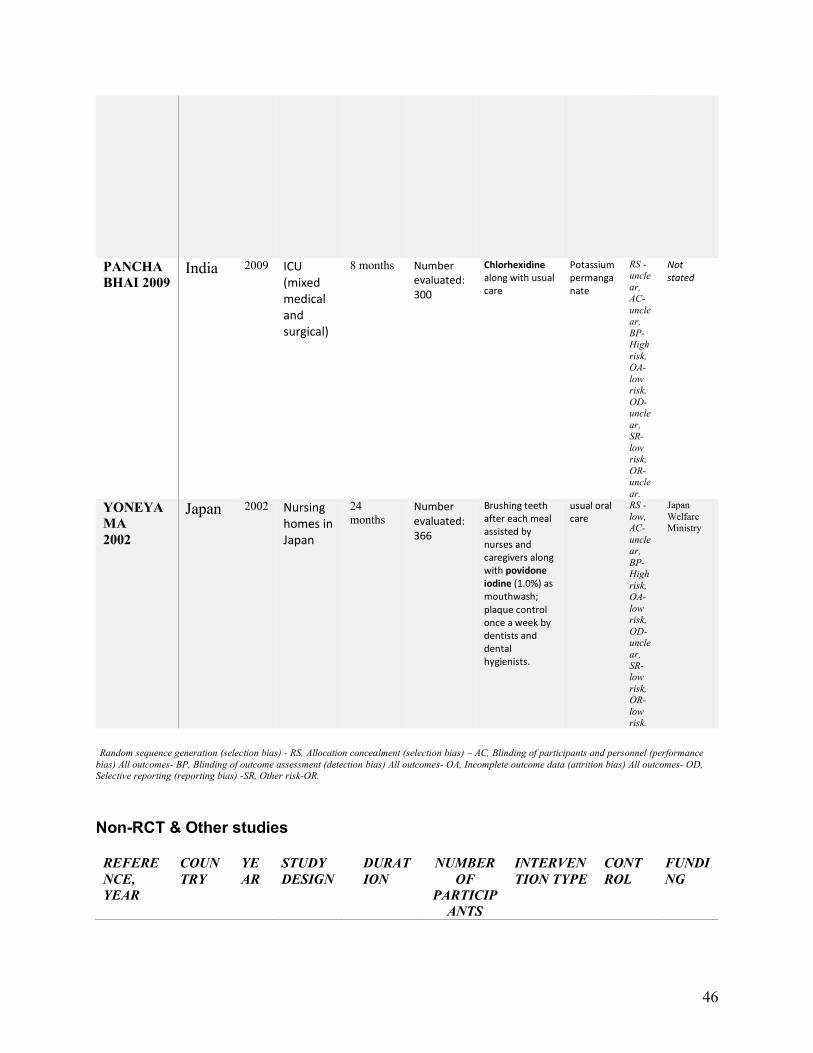
JUTHANI-
MEHTHA
2015
USA 2015 Nursing homes
30
Months Number evaluated: 575
Brushing teeth
(twice a day) +
cleaning denture
+ mouthrinse (0.12%
chlorhexidine
oral rinse, twice a day) + upright
feeding
positioning, by nurses
usual oral care + usual feeding position (not stated in detail)
RS -low
risk, AC-
low risk,
BP-High
risk, OA-
low risk,
OD- low
risk, SR-
low risk,
OR- low
risk.
National Institutes of Health,
USA
LAM 2013 Hong
Kong
2013 Stroke rehabilitation unit
31
months
Number evaluated: 81
Professional OHI with chlorhexidine
mouth wash use
Oral hygiene instruction
RS -
low, AC-
unclear,
BP-High
risk, OA-
unclear,
OD- uncle
ar, SR-
low risk,
OR- low
risk.
Grant
from Tokyo Dental College
OHSAWA
2003 Japan 2003 Nursing
homes in
Japan
24
months of
follow-up
Number evaluated: 49
Brushing teeth after each meal assisted by nurses and caregivers along with povidone iodine (1.0%) as mouthwash; mechanical plaque control, 2-3 days/week by dentists or dental hygienists.
usual oral care
RS -
low, AC-
unclear,
BP-High
risk, OA-
low risk,
OD- uncle
ar, SR-
low risk,
OR- low
risk.
Not stated
46
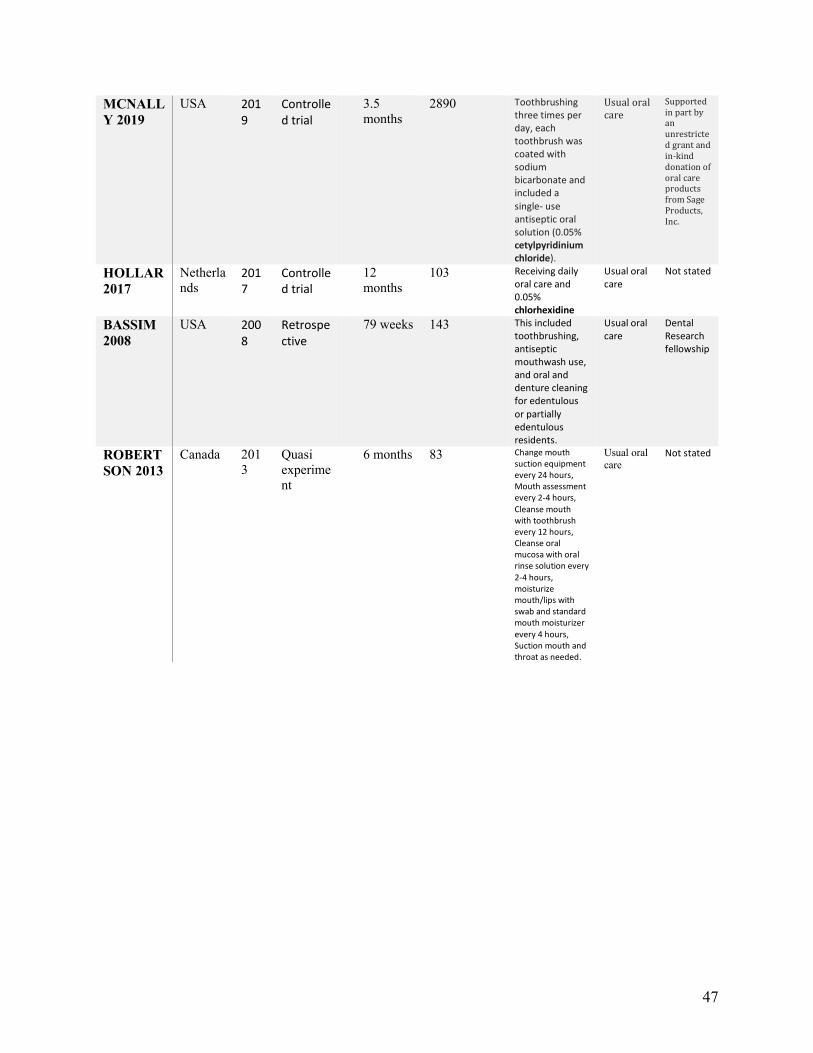
PANCHA
BHAI 2009 India 2009 ICU
(mixed medical and surgical)
8 months Number evaluated: 300
Chlorhexidine along with usual care
Potassium permanganate
RS -uncle
ar, AC-
unclear,
BP-High
risk, OA-
low risk,
OD- uncle
ar, SR-
low risk,
OR- uncle
ar.
Not stated
YONEYA
MA
2002
Japan 2002 Nursing homes in Japan
24
months Number evaluated: 366
Brushing teeth after each meal assisted by nurses and caregivers along with povidone iodine (1.0%) as mouthwash; plaque control once a week by dentists and dental hygienists.
usual oral care
RS -
low, AC-
unclear,
BP-High
risk, OA-
low risk,
OD- uncle
ar, SR-low
risk, OR-
low risk.
Japan
Welfare Ministry
Random sequence generation (selection bias) - RS, Allocation concealment (selection bias) – AC, Blinding of participants and personnel (performance
bias) All outcomes- BP, Blinding of outcome assessment (detection bias) All outcomes- OA, Incomplete outcome data (attrition bias) All outcomes- OD, Selective reporting (reporting bias) -SR, Other risk-OR.
Non-RCT & Other studies
REFERE
NCE,
YEAR
COUN
TRY
YE
AR
STUDY
DESIGN
DURAT
ION
NUMBER
OF
PARTICIP
ANTS
INTERVEN
TION TYPE
CONT
ROL
FUNDI
NG
47
MCNALL
Y 2019
USA 2019
Controlled trial
3.5
months
2890 Toothbrushing three times per day, each toothbrush was coated with sodium bicarbonate and included a single- use antiseptic oral solution (0.05% cetylpyridinium chloride).
Usual oral care
Supported in part by an unrestricted grant and in-kind donation of oral care products from Sage Products, Inc.
HOLLAR
2017
Netherla
nds 2017
Controlled trial
12
months
103 Receiving daily oral care and 0.05% chlorhexidine
Usual oral care
Not stated
BASSIM
2008
USA 2008
Retrospective
79 weeks 143 This included toothbrushing, antiseptic mouthwash use, and oral and denture cleaning for edentulous or partially edentulous residents.
Usual oral care
Dental Research fellowship
ROBERT
SON 2013
Canada 201
3
Quasi
experime
nt
6 months 83 Change mouth suction equipment every 24 hours, Mouth assessment every 2-4 hours, Cleanse mouth with toothbrush every 12 hours, Cleanse oral mucosa with oral rinse solution every
2-4 hours, moisturize mouth/lips with swab and standard mouth moisturizer every 4 hours, Suction mouth and throat as needed.
Usual oral
care Not stated
48
Research 1b.
Network meta-analysis to assess the comparative effectiveness of oral care interventions
in preventing ventilator associated pneumonia in critically ill patients.
(Submitted in the Journal of BMC Oral Health)
49
Network meta-analysis to assess the comparative effectiveness of oral care
interventions in preventing ventilator associated pneumonia in critically ill
patients.
Satheeshkumar PS, MDS, MSc1Stephen Sonis, DMD, DMSc2
1 Harvard Medical School, Boston, MA
2 Brigham and Women’s Hospital and the Harvard School of Dental Medicine, Boston,
MA
Manuscript words: 3053
Abstract words: 245
Abstract
Background
In this research, we assessed the efficacy of a novel analytic network metanalysis
(NMA) in creating a hierarchy to define the most effective oral care intervention (OCI)
for the prevention and management of ventilation-associated pneumonia (VAP).
Methods
We applied NMA to a previously published robust pairwise meta-analysis (PMA).
Statistical analyses were based on comparing rates of total VAP events between
50
intervention groups and placebo-usual care groups. We synthesized a netgraph,
reported ranking order of the treatment, and summarized our output by a forest plot with
a reference treatment placebo/usual care.
Results
With our inclusion and exclusion criteria for the NMA, we extracted 25 studies (4473
subjects). The NMA included 16 treatments, 29 pairwise comparisons, and 15 designs.
Based on the results of multiple comparisons with frequentist ranking probability P
scores, tooth brushing (P score fixed of 0.94, P score random of 0.89), toothbrushing
with povidone-iodine (P score fixed of 0.91, P score random 0.88), and furacillin (P
score set of 0.88, P score random 0.84) were the best three interventions for preventing
VAP.
Conclusion
NMA appeared to be an effective platform from which multiple interventions reported in
disparate clinical trials could be compared to derive a hierarchical assessment of
efficacy in the intervention of VAP. According to the NMA outcome, toothbrushing alone
or toothbrushing along with a potent antiseptic mouthwash povidone-iodine was related
to the highest response rate in preventing VAP in critically ill patients, followed by
furacillin and chlorhexidine 0.2%, respectively.
51
Background
Oral care interventions (OCI) have been recognized as favorably impacting the risk and
course of ventilator-associated pneumonia (VAP) in critically ill patients. [1] A range of
preventive strategies have been suggested that include the use of topical (rinse)
formulations of antimicrobial agents, such as chlorhexidine (CHX) and povidone-iodine
(PI), or mechanical cleansing by healthcare providers. [1-4] Debate persists as to which
tactic is most clinically- and cost-effective. A number of randomized trials (RCTs) have
been completed to address this uncertainty. [4] In almost all cases, these RCTs have
used a standard clinical trial pairwise design in which a placebo or best care was
compared to a test agent or regimen. While this approach provides snapshot outcomes
for a specific intervention, it lacks the ability to hierarchically assess or rank the efficacy
of each in the context of all of the responses studied.
To address this deficiency, we explored the utility of a novel approach in which
network meta-analysis (NMA) was applied to a previously published comprehensive
pairwise meta-analysis (PMA). [5] NMA, also known as multiple treatment comparison
or mixed treatment comparison, is a method of generalization of conventional pairwise
meta-analysis whereby the network statistically combines direct and indirect evidence
from trials [7] to yield inter-study intervention comparisons. Besides, NMA expresses
the relative effectiveness of interventions among all tests and then rank orders them.
We explored the utility of NMA as a means of comparing different OCIs to identify those
most useful for mitigating VAP in critically ill patients.
52
Concepts of Network Meta-Analysis
For clinical trials, conventional PMA typically focuses on pairwise comparisons of an
active treatment vs. placebo or usual care to assess the superiority of the test agent vs.
a control. If the investigation seeks to compare multiple active agents simultaneously,
the sample size must increase, leading to extended accrual times, extraordinary
expense, and efficacy assessment challenges. In contrast, NMA utilizes a multiple
comparison methodology which enables the interventions of one trial to be contrasted
with the active responses of other trials, while maintaining the internal randomization of
the direct and indirect comparisons.
For example, when two active OCIs like chlorhexidine ( CHX) and Toothbrushing (Tb)
are independently compared for efficacy against a saline control in two different trials
then randomized comparison in the trial 1, CHX and saline provides a direct estimate of
the treatment effects of CHX and Saline, measured on the scale as a log odds ratio.
We then denote this approach as CHX Saline direct. Trial 2, provides information on the
direct comparison between treatment Tb and Saline, denoted by Tb Saline direct. Then
NMA provides indirect evidence for the comparison of CHX and Tb from the treatment
difference CHX and Saline and Tb and Saline as follows:
CHX Tbindirect = CHX Saline direct - Tb Saline direct
and the variance of this association is given by the Var ( CHX Tbindirect) = Var( CHX Saline
direct ) + Var ( Tb Saline direct ). To have the NMA combination for the direct and indirect
comparisons, we are assuming that the trial 1 and 2 are independent, the underlying
effects are consistent, and any differences in the data are due to random error. The
53
NMA now has a consequent network having its integer of total treatments, designs (a
design refers to each combination of treatment), pairwise comparisons, and its
subsequent statistical inferences of all the included studies.
Methods
2.1 PMA selection and description
We selected the pairwise PMA reported by Hua et al. [5] basis on which to build an
NMA and assess its potential clinical meaningfulness.
We believe that the report represents a current, comprehensive, and inclusive review of
the topic (OCI and VAP) as it was screened from the Cochrane Oral Health's Trials
Register (to 17 December 2015); the Cochrane Central Register of Controlled Trials
(CENTRAL) (the Cochrane Library, 2015, Issue 11); MEDLINE Ovid (1946 to 17
December 2015); Embase Ovid (1980 to 17 December 2015); LILACS BIREME Virtual
Health Library (1982 to 17 December 2015); CINAHL EBSCO (1937 to 17 December
2016); Chinese Biomedical Literature Database (1978 to 14 January 2013); China
National Knowledge Infrastructure (1994 to 14 January 2013); Wan Fang Database
(January 1984 to 14 January 2013) and VIP Database (January 2012 to 4 May 2016).
2.2 Inclusion and exclusion criteria
54
To assure consistency, we used the same inclusion and exclusion criteria as Hua et al.
VAP was defined as pneumonia developing in a critically ill patient who has received
mechanical ventilation for at least 48 hours and excluded studies in which patients were
not critically ill and were not dependent on mechanical ventilation for less than 48 hours,
or if the patients had an acquired respiratory infection at baseline. We accepted study-
described definitions for intervention (test) and control groups. Typically controls of a
"placebo" were described as usual care or any oral hygiene intervention care. We
accepted studies in which saline was included as a component of routine care/placebo
but did not include studies in which saline rinsing/swab was described as an active
intervention versus placebo-usual care. We noted that amongst hospitalized patients,
saline was used as a most common oral rinse and so was included as a component of
the usual care procedure, while in clinical trials, saline was used as a most common
control drug. Since the use of saline rinsing/swab as an active intervention might affect
the NMA analysis and geometry saline-rinsing/swab as a treatment was excluded. We
also excluded feasibility studies and cross-over randomized design trials. Chlorhexidine
trials were stratified based on concentration (0.12%, 0.2%, 1%, and 2%), with each
being considered as a distinct intervention and compared in the network along with
other therapies.
2.3 Data collection
We obtained data from studies that met our inclusion and exclusion criteria from the
PMA [5] by a standardized data collection form. For the NMA data analysis, we
55
calculated the treatment effects (TE) and standard error of the treatment effects (SeTE).
Variable TE, which was determined by comparing the pairwise treatment effect of
treatments treat1 (intervention) and treat2 (control) in each study with variable SeTE as
the corresponding standard error. When dealing with the multi-arm studies in which
there were more than two treatment arms, we have included each multi-arm study in the
dataset as a series of two-arm comparison. Thus, with every comparator in the multi-
arm, we have obtained treatment effects and the standard error of the treatment effects
for each treatment on the other.
2.4 Statistical analysis
Frequentist methods of comparative effectiveness approach with multiple treatment
comparisons [6-11] were used. Statistical analyses were based on comparing rates of
total VAP events between the intervention group and the placebo-usual care group.
For outcomes, odds ratios (ORs) with 95% confidence intervals (CIs) were calculated
using pairwise meta-analysis format, and the log odds ratio was used to calculate the
TE and SeTE of all the included studies. We used the R package netmeta for the NMA
analysis.
We reported the random and fixed effects ranking order (P scores) of the
treatment effectiveness. For ranking order of the interventions, we used the net ranking
function of R package by computing the likelihood of one intervention being the best,
second best, and so on for a response preventing VAP outcome. Total or generalized
56
heterogeneity of NMA's whole network was quantified using Cochran's Q total statistics
test. Cochran's Q total statistics test is the total sum of the heterogeneity and
inconsistency statistics that represents the variability between the NMA direct and
indirect comparisons. And for determining the heterogeneity/inconsistencies between
designs of the NMA network, we used Q statistics heterogeneity decomposition
function. Finally, to compare several treatments to standard treatment was done by
placing placebo-usual care as a reference treatment is represented with a forest plot. All
statistical analyses were performed using R Studio, Version 1.1.456 (RStudio:
Integrated Development for RStudio. RStudio, Inc., Boston, MA).
Results
3.1 Description of the studies
From the Hua et al. study of 38 RCTs (6016 subjects), 25 studies (4473 subjects) met
our inclusion criteria. [figure 2] In our cohort, 2254 subjects were randomly assigned to
an active OCI and 2219 subjects who were randomly assigned to the placebo or usual
care group. The basic characteristics of the studies are described in Table 1.
3.2 Evidence used in the NMA
After assuring the comprehensiveness of the studies included in the analysis, we
included 25 trials (this comprises the total number of trials combined in the network), 16
treatments (number of total treatments compared in the network), and 29 pairwise
comparisons (the pairwise is a combination of the individual trials in the two-arm and
three-arm trials) and there were 15 designs in the network [figure 2].
57
Figure 3 shows the graphical representation of the NMA. The size of the nodes is
proportional to the number of studies evaluating each intervention, and the
width/thickness of the edges indicates inverse standard error of the direct treatment
comparisons, and the shading indicates a three-arm study. For example, Figure 2
compares the effectiveness of three different chlorhexidine concentrations (CHX 0.2%,
1%, and 2%). The difference in thickness/density of connecting edges suggests that
CHX 0.2% has superior evidence than CHX 1% based on supporting study data.
Importantly, this visual graphical representation of the thickness or density does not
indicate the statistical significance of the comparison. The most common comparator
across all trials was the placebo or usual care arm which appears as the network's most
common node. While the majority of studies were two-arm trials, two, 3-arm trials were
included in our network (shaded region in the netgraph).
A forest plot [Figure 4] shows the fixed effects model for each intervention having
compared with a reference treatment placebo/usual care. In NMA, the forest plot's
importance is to compare several treatments to a common comparator, also called
reference or baseline treatment. We have taken placebo/usual care as the reference
treatment for our readers to compare and contrast, and to comprehend the procedures
are significantly different to placebo/routine care.
3.3 Results of heterogeneity and consistency
58
The heterogeneity statistics of the NMA follow the Chi-square distribution, and the chief
prerequisite of assessing the variability is to pinpoint studies whose data differ
significantly from what the model predicts. Our first aim was to identify the total or
generalized heterogeneity of NMA's whole network using Cochran's Q total statistics
test and second to determine the heterogeneity/inconsistencies between designs of the
NMA network.
Total heterogeneity statistics of NMA network
The heterogeneity statistics of the decompose function of the netmeta
package provided the generalized DerSimonian estimator tau2 value of 0.2829, Higgins'
I2 value of 55.7%, CIs, 17.5%; 76.2%. The Cochran's Q total statistics showed a value
of 27.10 with a degree of freedom (DOF) 12 and a P-value of 0.008.
The heterogeneity/inconsistencies between designs of the NMA network
Q statistics heterogeneity within design showed a value of 25.91 with a DOF 10 and a
P-value of 0.0039, and between design heterogeneity/inconsistency value of 1.19 with a
degree of freedom 1.19 and a P-value of 0.56. The results show that there is moderate
heterogeneity in the NMA network, and considerably very less heterogeneity within
designs and between designs.
59
The relative effect estimates of the ranking of the treatments according to the multiple
comparisons are shown in Table 2. Numerals between 0 and 1, with mean 0.5,
demonstrate the rank of treatment within the given assortment of competing treatments,
where a score of 1 is linked to the best outcome, and a score of 0 is associated with the
worst outcome. The hierarchical ranking order of the intervention being the best and
worst is introduced by many authors in the Bayesian and frequentist methods. [10, 11]
Rucker and Schwarzer introduced ranking order of interventions in the frequentist NMA
as P scores, which are analogs to the Bayesian method, surface under the cumulative
ranking curve. [10] These values are derived from the effect estimates and their
variances. The P scores are based on the frequentist's method point estimates and the
standard error of the network meta-analysis estimates under normality assumption and
calculated as means of one-sided p-values. [10, 11, 13, 14, 15]. Numerous studies are
using ranking order in NMA so as to display a ranking from the network, which is a
better way to present the interventions in terms of the effect estimates. [10, 11, 13, 14,
15] Most commonly, the effect estimates might get affected with some ambiguity, and
we will rarely know in placing a particular trial in the first order or second order. Hence,
we classified the ranking first three interventions as best, second three-best
interventions as next best, and so on. Based on the ranking order, we found that tooth
brushing was the most effective intervention for preventing VAP vs. placebo or usual
treatment, which was the worst. The best three interventions were tooth brushing (P
score fixed of 0.94, P score random of 0.89), tooth brushing with povidone-iodine (P
score fixed of 0.91, P score random 0.88), and furacillin (P score fixed of 0.88, P score
random 0.84). CHX of 0.2% concentrations (P score fixed of 0.65, P score random of
60
0.65) ranked as the second-best interventions in the network along with Biotene (P
score fixed of 0.6, P score random 0.54) and potassium permanganate (P score fixed of
0.53, P score random 0.54). While chlorhexidine 0.2%, a recommended oral care
product for preventing VAP in critically ill patients, has a P score of 0.65 fixed and 0.65
random.
Discussion
We applied NMA to an existing and robust pairwise meta-analysis to assess
the utility of this novel analytic in defining a hierarchical comparison to determine the
effectiveness of oral interventions in preventing VAP. [5] Our results suggest that the
application of NMA to a conventional meta-analysis provides additional actionable
information relative to preventing VAP by comprehensively comparing treatment options
otherwise sequestered in pairwise comparisons.
These results have to be taken with caution as the assumptions are
based on the results of multiple comparisons. This novel technique allows us to
presume direct and indirect comparisons performed in a structured statistical
framework. Although the inferences are from low risk and unclear risk of bias RCTs, the
estimated network and ranking of treatment are thus liable to have distinctions as
discussed in this NMA and previous pairwise meta-analysis. [5] A potential value of the
method is its informative function relative to directing future studies and, in this case, a
specific trial assessing preventive interventions for VAP in critically ill patients. The NMA
61
is a comprehendible way of combinations which stem the possibility of consolidating a
future test from the network. Consequently, the NMA, when compared to pairwise meta-
analysis, weighs the logical possibilities, even within the network, maintains the internal
randomization of the individual trails.
In comparison with the published pairwise meta-analysis, the NMA
showed a divergent finding concerning the ranking probabilities from the multiple
comparisons. [3-5] This is the first NMA in this regard to reporting on comparative
effectiveness research on oral care intervention for preventing VAP. In contrast to the
standard of care where CHX is described as the best oral care intervention to prevent
VAP, NMA demonstrated the superiority of tooth brushing or mechanical cleaning. This
finding is especially significant given the recent results associated with CHX toxicity.
[16] We also determined that toothbrushing intervention when combined with a
mouthwash is superior compared to a mouthwash alone; toothbrushing with PI is
superior to any other mouthwash or ranking second in the first three-best interventions.
This is the first time showing the excellent benefit of the furacillin as a mouthwash in
preventing the VAP. Furacillin belongs to the nitrofuran class and is a potent
antimicrobial organic compound. It is efficient against gram-positive bacteria and gram-
negative bacteria. Studies show furacillin effective against many bacterial and fungal
entities when applied topically. [17] Although there aren't many studies on this
intervention, this network warrants a possible pilot trial. The PMA showed weak
evidence of the PI superior to saline in preventing VAP and inadequate confirmation of
the toothbrushing preventing VAP in critically ill patients. [5] The NMA shows
62
toothbrushing alone or toothbrushing along with PI are the best interventions according
to the clinical comparative effectiveness research.
There is a lack of comparative effectiveness research and vagueness with
regard to OCI in preventing VAP among critically ill patients, and NMA is never
performed. While our results support the usefulness of NMA as a tool to optimize
collective analyses of meta-analyses for comparative effectiveness research, it does
have limitations. For justifying the rationality of findings and to minimalize error, NMA is
designed methodically and conducted carefully. Transporting the high-quality systematic
search and search results of the Hua et al. study [5], we established our inclusion and
exclusion criteria for building the NMA network. We argue that this way we
pragmatically compared the PMA to the NMA and reflected on its comparative
effectiveness research. Observing little evidence-based research on OCI on preventing
the VAP in critically ill patients after the Hua et al. study and using the Hua et al.
research supplemented NMA construction, which defends the thorough literature search
along with assessing the risk of bias and quality of evidence. But challenges of the NMA
persists when comparing the studies with low and unclear-risk biases. In summary, this
research accomplishes to provide comparative effectiveness of OCIs in preventing VAP
in critically ill patients when combining direct and indirect evidence by having a
transitivity assumption that studies are independent and underlying effects are
somewhat consistent.
Conclusions
63
As meta-analysis is considered the epitome of the evidence-based clinical medicine,
NMA is an extension positioned in this framework. Given the challenges of the proof of
concept of existing oral care intervention in preventing VAP, and lack of head to head
robust trials of the best available treatment modalities, this approach is exceptional. We
followed stern assumptions and standardization, and our study cohort was based on the
largest pairwise meta-analysis of oral care intervention in preventing the VAP. The
transparency, reproducibility, and detailed documentation of our findings can be
appropriately appraised. According to the NMA outcome, toothbrushing alone or
toothbrushing along with a potent antiseptic mouthwash povidone-iodine was related to
the highest response rate in preventing VAP in critically ill patients, followed by furacillin
and chlorhexidine 0.2%, respectively.
List of abbreviations
• Abbreviations in the manuscript.
VAP – Ventilation associated pneumonia
OCI – Oral care interventions
NMA – Network meta-analysis
PMA – Pairwise meta-analysis
64
RCT – Randomized controlled trials
CHX – Chlorhexidine
Tb – tooth brushing
TE – Treatment effects
SeTE – Standard error of the treatment effects
PI – Povidone iodine
• Abbreviations in the figures
Tbrush - Tooth brushing
tbrush_povid - Tooth brushing with Povidone -Iodine
Fura - Furacillin
chx_.2% - Chlorhexidine 0.2%
potas Potassium permanganate
biotene Biotene
povid Povidone -Iodine
chx_2% Chlorhexidine 2%
chx_.12% Chlorhexidine 0.12%
chx_.12% Chlorhexidine 0.12% with tooth brushing
tricl Triclosan
chx_1% Chlorhexidine_1%
chx_2%_toothbrushing Chlorhexidine_2%_toothbrushing
bica Sodium Bicarbonate
list Listerine
65
plac-us Placebo or usual care
Declarations
• Ethics approval and consent to participate – NA
• Consent for publication -NA
• Availability of data and material - NA
• Competing interests- No competing interests
• Funding- No funding received for this manuscript.
• Authors' contributions
Satheeshkumar PS: Study design, statistical analysis, data interpretation,
manuscript drafting, revision, and critical evaluation
Sonis S: Study design, data interpretation, manuscript revision and critical
evaluation.
• Acknowledgements- NA
Reference
1) Magill SS, O'Leary E, Janelle SJ, et al. Changes in Prevalence of Health Care-
Associated Infections in U.S. Hospitals. The New England journal of medicine.
2018;379(18):1732-44.
2) Ewan VC, Sails AD, Walls AW, et al. Dental and microbiological risk factors for
hospital- acquired pneumonia in non-ventilated older patients. PLOS One 2015;
e0123622.
3) Villar CC, Pannuti CM, Nery DM, Morillo CM, Carmona MJ, Romito
GA.Effectiveness of Intraoral Chlorhexidine Protocols in the Prevention of
https://www.ncbi.nlm.nih.gov/pubmed/?term=Pannuti%20CM%5BAuthor%5D&cauthor=true&cauthor_uid=27507174
https://www.ncbi.nlm.nih.gov/pubmed/?term=Morillo%20CM%5BAuthor%5D&cauthor=true&cauthor_uid=27507174
66
Ventilator-Associated Pneumonia: Meta-Analysis and Systematic Review. Respir
Care. 2016;61(9):1245-59.
4) Labeau SO, Van de Vyver K, Brusselaers N, Vogelaers D, Blot SI.Prevention of
ventilator-associated pneumonia with oral antiseptics: a systematic review and
meta-analysis. Lancet Infect Dis. 2011; 11(11):845-54.
5) Hua F, Xie H, Worthington HV, Furness S, Zhang Q, Li C. Oral hygiene care for
critically ill patients to prevent ventilator-associated pneumonia. Cochrane
Database Syst Rev. 2016;10:CD008367.
6) Ioannidis JP. Integration of evidence from multiple meta-analyses: a primer on
umbrella reviews, treatment networks and multiple treatments meta
analyses. CMAJ2009;181:488-93.
7) Mills EJ, Thorlund K, Ioannidis JP. Demystifying trial networks and network meta-
analysis. BMJ2013;346:f2914.
8) Cipriani A, Higgins JP, Geddes JR, Salanti G. Conceptual and technical
challenges in network meta-analysis. Ann Intern Med 2013;159:130-7.
9) Ades AE, Caldwell DM, Reken S, Welton NJ, Sutton AJ, Dias S. Evidence
synthesis for decision making 7: a reviewer’s checklist. Med Decis Making
2013;33:679-91.
67
10) Rücker G, Schwarzer G (2017): Resolve conflicting rankings of outcomes in
network meta-analysis: Partial ordering of treatments. Research Synthesis
Methods, 8, 526–36
11) Salanti G, Ades AE, Ioannidis JP (2011): Graphical methods and numerical
summaries for presenting results from multiple-treatment meta-analysis: an
overview and tutorial. Journal of Clinical Epidemiology, 64, 163–71.
12) Krahn U, Binder H, König J. A graphical tool for locating inconsistency in network
meta-analyses. BMC Med Res Methodol. 2013; 13:35
13) Moher DL, A; Tetzlaff, J; Altman, D.G, The PRISMA Group (2009) Preferred
Reporting Items for Systematic Reviews and Meta-Analyses: The PRISMA
Statement. PLoS Med.6(7): e1000097.
14) Mbuagbaw L, Rochwerg B, Jaeschke R, Heels-Andsell D, Alhazzani W, Thabane
L, Guyatt GH. Approaches to interpreting and choosing the best treatments in
network meta-analyses. Syst Rev. 2017;6(1):79.
15) Rücker G, Schwarzer G. Ranking treatments in frequentist network meta-
analysis works without resampling methods. BMC Med Res
Methodol. 2015;15:58.
https://www.ncbi.nlm.nih.gov/pubmed/?term=Mbuagbaw%20L%5BAuthor%5D&cauthor=true&cauthor_uid=28403893
https://www.ncbi.nlm.nih.gov/pubmed/?term=Rochwerg%20B%5BAuthor%5D&cauthor=true&cauthor_uid=28403893
68
16) Klompas M, Speck K, Howell MD, Greene LR, Berenholtz SM. Reappraisal of
routine oral care with chlorhexidine gluconate for patients receiving mechanical
ventilation: systematic review and meta-analysis. JAMA Intern Med
2014;174(5):751-61.
17) Norman G, Dumville JC, Moore ZE, Tanner J, Christie J, Goto S. Antibiotics and
antiseptics for pressure ulcers. Cochrane Database Syst Rev. 2016;4:CD011586.
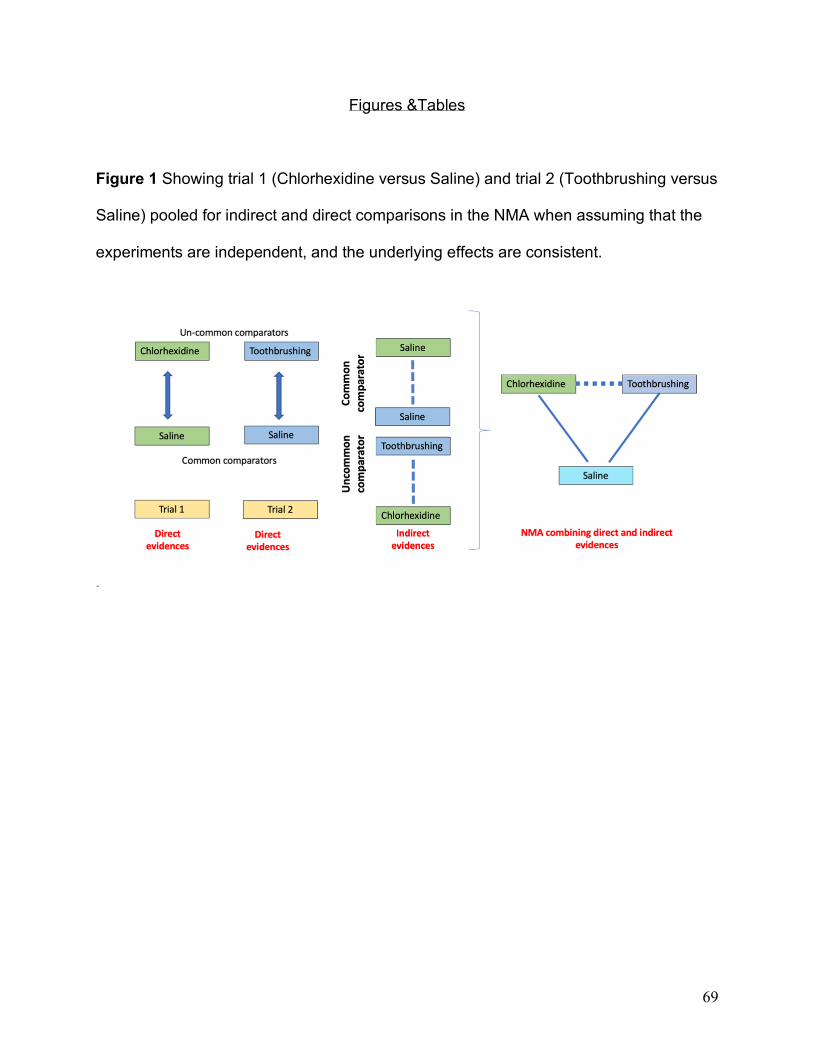
69
Figures &Tables
Figure 1 Showing trial 1 (Chlorhexidine versus Saline) and trial 2 (Toothbrushing versus
Saline) pooled for indirect and direct comparisons in the NMA when assuming that the
experiments are independent, and the underlying effects are consistent.
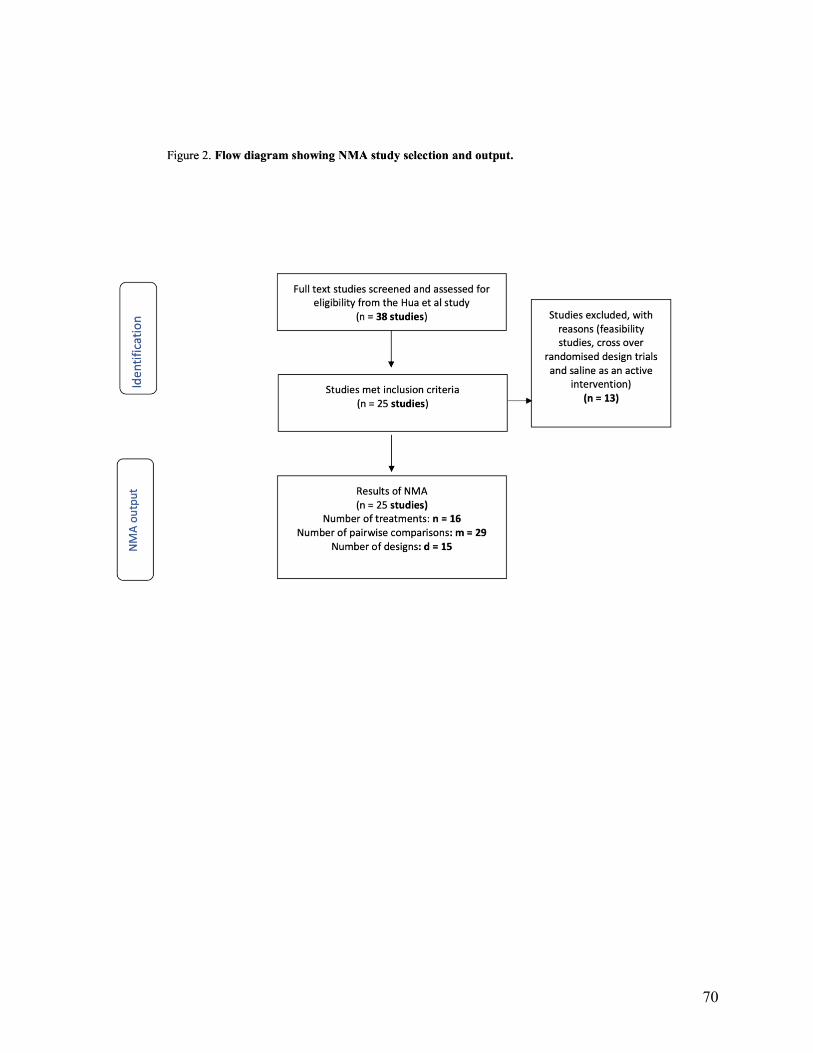
70
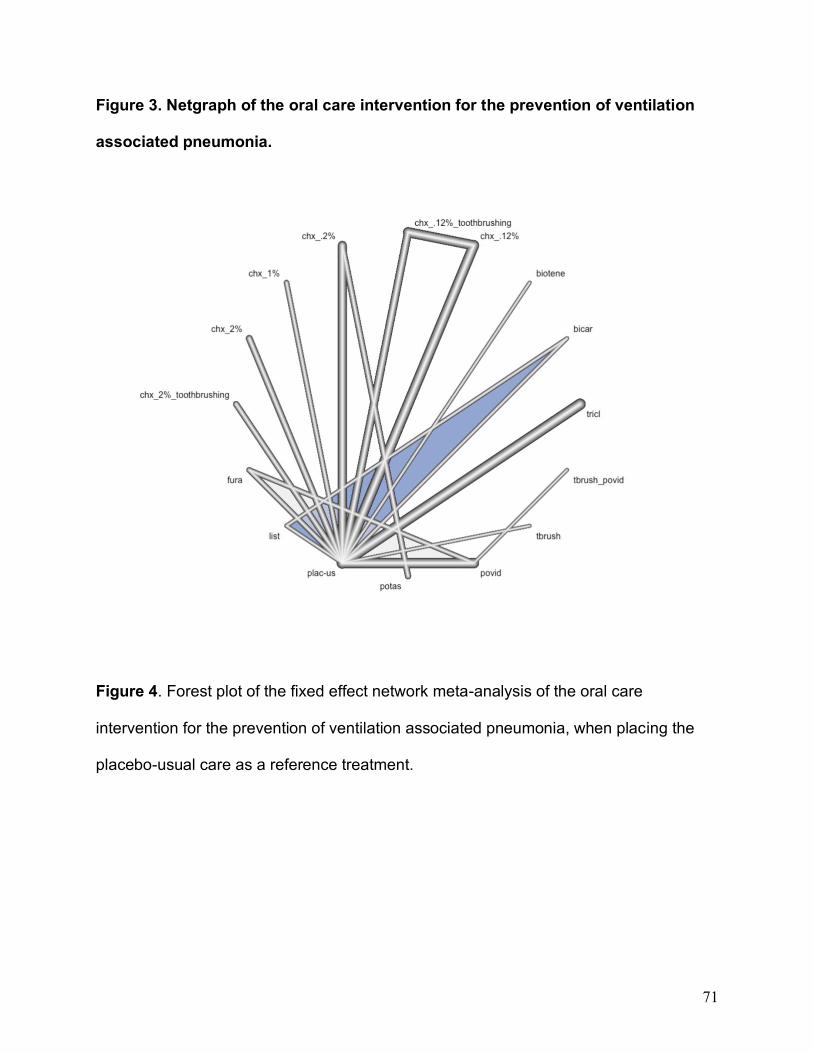
71
Figure 3. Netgraph of the oral care intervention for the prevention of ventilation
associated pneumonia.
Figure 4. Forest plot of the fixed effect network meta-analysis of the oral care
intervention for the prevention of ventilation associated pneumonia, when placing the
placebo-usual care as a reference treatment.
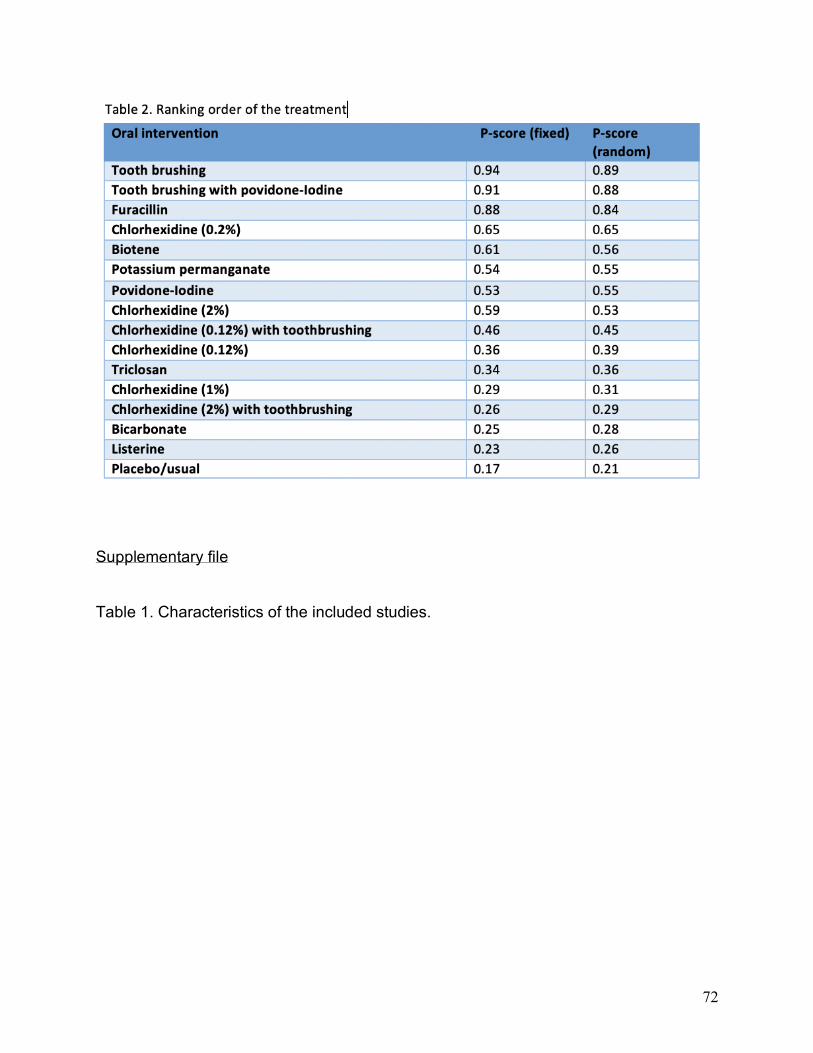
72
Supplementary file
Table 1. Characteristics of the included studies.
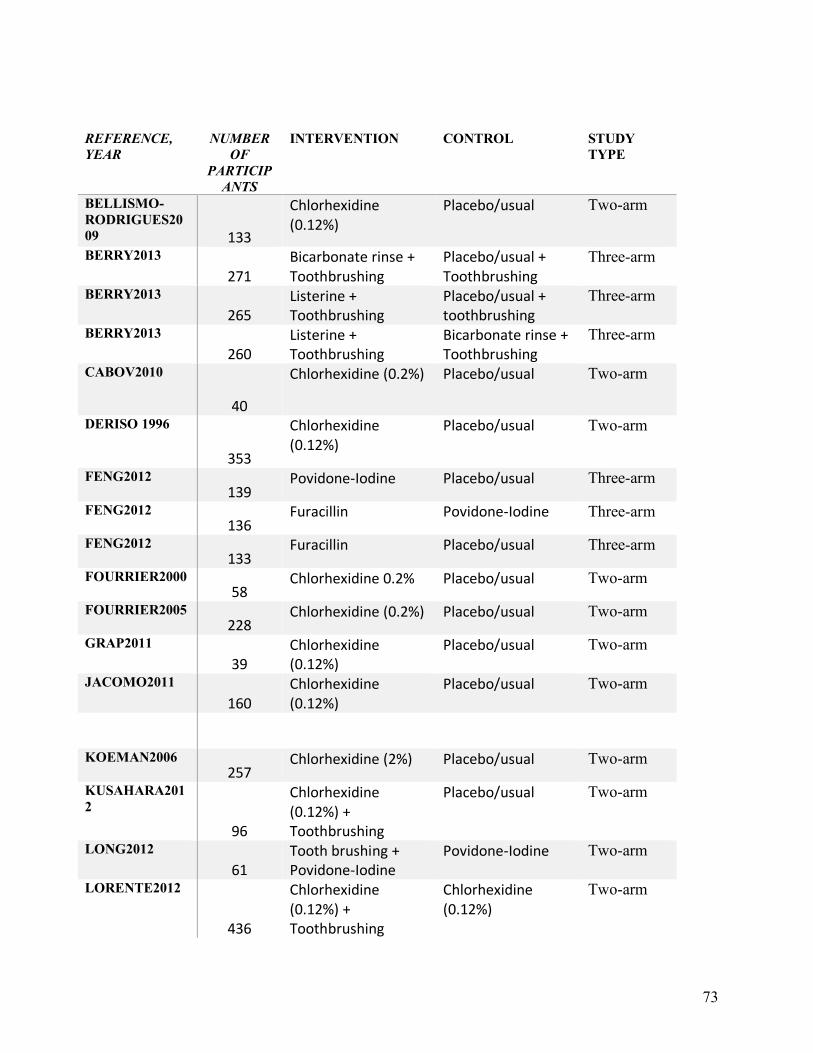
73
REFERENCE,
YEAR
NUMBER
OF
PARTICIP
ANTS
INTERVENTION CONTROL STUDY
TYPE
BELLISMO-
RODRIGUES20
09 133
Chlorhexidine (0.12%)
Placebo/usual Two-arm
BERRY2013
271
Bicarbonate rinse + Toothbrushing
Placebo/usual + Toothbrushing
Three-arm
BERRY2013
265
Listerine + Toothbrushing
Placebo/usual + toothbrushing
Three-arm
BERRY2013
260
Listerine + Toothbrushing
Bicarbonate rinse + Toothbrushing
Three-arm
CABOV2010
40
Chlorhexidine (0.2%) Placebo/usual Two-arm
DERISO 1996
353
Chlorhexidine (0.12%)
Placebo/usual Two-arm
FENG2012
139 Povidone-Iodine Placebo/usual Three-arm
FENG2012
136 Furacillin Povidone-Iodine Three-arm
FENG2012
133 Furacillin Placebo/usual Three-arm
FOURRIER2000
58 Chlorhexidine 0.2% Placebo/usual Two-arm
FOURRIER2005
228 Chlorhexidine (0.2%) Placebo/usual Two-arm
GRAP2011
39
Chlorhexidine (0.12%)
Placebo/usual Two-arm
JACOMO2011
160
Chlorhexidine (0.12%)
Placebo/usual Two-arm
KOEMAN2006
257 Chlorhexidine (2%) Placebo/usual Two-arm
KUSAHARA201
2
96
Chlorhexidine (0.12%) + Toothbrushing
Placebo/usual Two-arm
LONG2012
61
Tooth brushing + Povidone-Iodine
Povidone-Iodine Two-arm
LORENTE2012
436
Chlorhexidine (0.12%) + Toothbrushing
Chlorhexidine (0.12%)
Two-arm
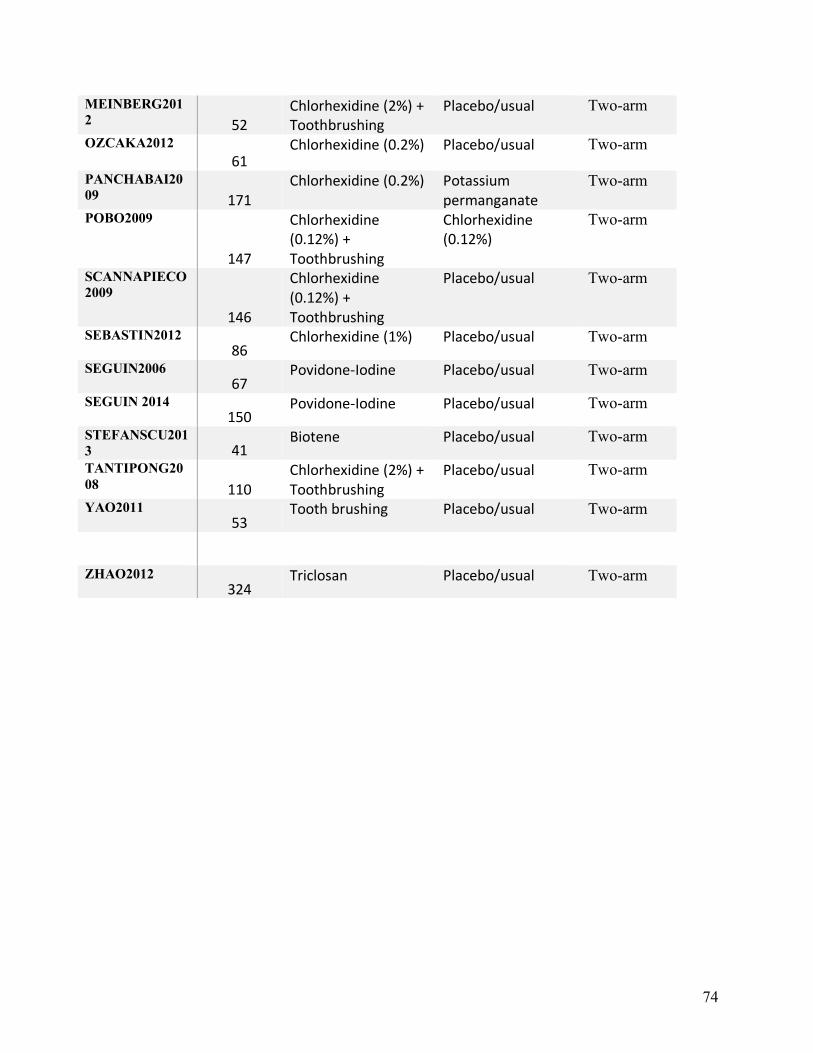
74
MEINBERG201
2 52
Chlorhexidine (2%) + Toothbrushing
Placebo/usual Two-arm
OZCAKA2012
61
Chlorhexidine (0.2%) Placebo/usual Two-arm
PANCHABAI20
09 171
Chlorhexidine (0.2%) Potassium permanganate
Two-arm
POBO2009
147
Chlorhexidine (0.12%) + Toothbrushing
Chlorhexidine (0.12%)
Two-arm
SCANNAPIECO
2009
146
Chlorhexidine (0.12%) + Toothbrushing
Placebo/usual Two-arm
SEBASTIN2012
86 Chlorhexidine (1%) Placebo/usual Two-arm
SEGUIN2006
67 Povidone-Iodine Placebo/usual Two-arm
SEGUIN 2014
150 Povidone-Iodine Placebo/usual Two-arm
STEFANSCU201
3 41 Biotene Placebo/usual Two-arm
TANTIPONG20
08 110
Chlorhexidine (2%) + Toothbrushing
Placebo/usual Two-arm
YAO2011
53 Tooth brushing Placebo/usual Two-arm
ZHAO2012
324 Triclosan Placebo/usual Two-arm
75
Research 2.
The impact of healthcare-associated infections on patients hospitalized with
oropharyngeal cancers of lip, mouth, and pharynx.
(In preparation)
76
The impact of healthcare-associated infections on patients hospitalized with
oropharyngeal cancers of lip, mouth, and pharynx.
Satheeshkumar PS*1, Stephen Sonis2,3
1 Harvard Medical School, Boston MA, USA, 2Brigham and Women’s Hospital, Boston,
MA, USA, 3Harvard School of Dental Medicine, Boston, MA, USA
Word count (Abstract): 335, Word count (Main text): 3912
Abstract
Background
Healthcare-associated infections (HAIs) increases the burden of illness by the increased
length of stay, cost of hospital expenses, and risk of mortality. Oropharyngeal cancer
patients are at increased risk of HAIs due to multiple therapeutic interventions and due
to the presence of an enormous number of microorganisms in the oro-pharyngeal areas
responsible for HAIs. We tried to assess the 2017 trend in differences in outcome
among patients with a primary diagnosis of malignant neoplasms of lip, oral cavity, and
pharynx (MLOP) with and without HAI.
Methods
Using the United States (U.S.), the National inpatient sample (NIS) database of 2017,
we identified all hospitalization with a primary diagnosis of malignant neoplasms of lip,
77
oral cavity, and pharynx and identified the HAIs among them. We assessed the
difference in the cost, length of stay (LOS), and in-hospital mortality among MLOP
cancer patients with and without HAI. Association between outcomes (in-hospital
mortality, LOS, and hospital charges) and independent variables examined using survey
specific multivariable regression analyses.
Result
Among 7,159, 694 (weighted numbers - 20% of the total patients admitted in the U.S.
hospitals in the year 2017), 54,934 (unweighted numbers in the U.S.) discharged with a
primary diagnosis of the MLOP. Among those 54,934 MLOP patients, 555 (unweighted
numbers in the U.S.) patients acquired a minimum of one HAI during their in-hospital
stay. The most common HAI was Clostridium difficile infection (36%), followed by
central line-associated bloodstream infection (32%), ventilator-associated pneumonia
(17%), and catheter-associated urinary tract infection (15%). MLOP patients with HAI
had LOS of 6.63 days longer than the non-HAI MLOP patients, confidence intervals
(C.I.s), 3.62-9.64, p < 0.0001. MLOP patient with HAI had hospitalization charges of
49,383 USD higher than the non-HAI MLOP patients, CIs 20144 USD- 78622 USD, p <
0.0001. Mortality was not significantly different among HAI and nonHAI MLOP patients,
Odds ratio (OR) 0.63, C.I.s, 0.22- 1.81, a p-value of 0.4.
Conclusion
MLOP patients who acquired HAI were associated with a considerable increase in the
length of stay and total charges during their in-hospital stay.
78
1. BACKGROUND
Cancers of the oro-pharyngeal areas (malignant neoplasms of lip, oral cavity, and
pharynx) constitute 3% of all fatalities in the United States (U.S.), and there is
approximately 55,000-60,000 number of new cases treated each year in the U.S. alone.
[1] Emphatically, malignant neoplasms of lip, oral cavity, and pharynx (MLOP) cancers
develop predominantly due to tobacco use and alcohol consumption. However, other
implicated risk factors like Human papillomavirus (HPV) infection, Herpes simplex virus,
and Epstein-Barr virus infection are also associated. [2, 3] Thus MLOP cancers are
preventable to encompass the burden of illness, [4] however, the MLOP cancer
treatment necessitates a complex treatment modality involving Radiotherapy (R.T.),
chemotherapy (C.T.) and Surgical therapy which affects the quality of life patients. [5, 6]
Furthermost, these treatment modalities necessitate more extended hospital stays and
continuous economic liability. [7] Subsequently, MLOP cancer patients are also affected
by healthcare-associated infections (HAI). [7, 8] The average hospitalization cost of the
Head and Neck cancer patients accounts for approximately U.S. $ 18,371, and the
average length of stay was 6.6 days. [8] Conversely, the range of problem
accompanying with the HAI intertwined with clinical consequences of MLOP cancers
are largely indefinite. Henceforth, utilizing the National Inpatient Sample (NIS) database,
we tried to obtain the degree of HAIs among MLOP cancer patients by measuring the
2017 trend in the cost, length of stay, and mortality.
79
2. METHODS
2.1 NIS database
The features of the NIS database have been described in detail previously [9]. NIS
obtained from the Health care Cost and Utilization Project of the Agency for Health care
Research and Quality (HCUP-AHRQ). And this is the primary publicly accessible all-
payer inpatient care database in the U.S. [10] NIS is structured as 20% weighted to
represent 94% of all discharges of the U.S. inpatient hospital admissions with the
exclusion of observation status and psychiatric hospitals. The NIS has deidentified
patient information and considered exempt by the institutional review board. The NIS
dataset contains patient demographics, data about comorbidities, in-hospital outcomes,
hospital characteristics, insurance status, and hospitalization charges, and cost. Finally,
we used inpatient stay discharge weights to create a national estimate for all our results.
2.2 Study population
Beforehand of scheming the study, we documented that the frequent
documentation for hospital admissions for oropharyngeal cancers covered in the
International Classification of Diseases, Tenth Revision, Clinical Modification (ICD 10
CM) realm was categorized as malignancies of the oral cavity, including lip and
80
pharynx. Thus, our cohort was identified as malignant neoplasms covering lip, buccal
mucosa, tongue, floor of the mouth, gums, hard palate, soft palate, tonsil, major and
minor salivary glands, nasopharynx and oropharynx. In our study, we used ICD 10 CM
billable codes from C00 to C14 to cover malignant neoplasms of lip, oral cavity, and
pharynx. The codes are provided in the supplementary table file. (Supplementary file).
Among this cohort of MLOP patients, we used ICD-10-CM billable codes, J95851,
T80211A, T80211D, T80211S, T83511A, A0472, to identify hospitalizations with
ventilator-associated pneumonia (VAP), central line-associated bloodstream infection
(CLABSI), catheter-associated urinary tract infection (CAUTI), and Clostridium difficile
infection (CDI). Patient comorbidities were determined using the Elixhauser comorbidity
index. The NIS assembles LOS and total charges for hospitalization from every
sampled inpatient record calculated in days and U.S. dollars separately. The hospital
charges include all the hospital utilization fees charged by the hospital and do not
contain the expenses incurred by the physician or typically known as physician's fees,
which are billed separately.
2.3 Study measurements
We assessed patient features and clinical characteristics. Patient features
included sex, age, race/ethnicity, insurance type, and median household income based
on the individual's zip code for that current year grouped into four income quartiles.
Clinical characteristics included the admission day (weekend/ weekday), admission type
81
(elective/nonelective), admission origin (transferred-in, not-transferred), and indicators
for whether chemotherapy, radiation, or surgery were performed during the
hospitalization. We used the Elixhauser comorbidity index used in the ICD diagnosis
codes for categorizing comorbidities, where each comorbidity is dichotomous. And the
score from the Elixhauser index was adjusted in the multivariate regression. The
variables included in the Elixhauser comorbidity index are listed in the HCUP database.
The 2017 NIS MLOP cohort of patients we presented here are stratified as with and
without HAI. Table 1 includes MLOP stratified by demographic variables age, sex, race,
elective (whether patients electively hospitalized), the payer (whether used the
Medicaid, Medicare, other/uninsured, etc.), PL_NCHS (Patient Location whether urban
or rural), Indicator of a transfer into the hospital and Median household income for
patient's ZIP Code (based on current year). Our study exposure was HAIs among
patients admitted for treating oropharyngeal cancers. The outcome of interest included
length of hospital stays in days (i.e., the total length of hospital stays of the first
admission if it occurred), cost of health services, and in-hospital mortality.
2.4 Statistical analysis
All Statistical analyses were performed using R Studio, Version 1.1.456
(RStudio: Integrated Development for RStudio. RStudio, Inc., Boston, MA). Descriptive
statistics were used to describe the baseline hospital and patient characteristics. We
used survey-adjusted methods accounting for NIS-specific hospital weighting. Survey
82
specific design (svydesign) was used for unweighing, aimed to incorporate the survey
sampling weights to account for the intricate sampling design used in NIS and to deliver
original estimates of the U.S. population in the resulting output.
The svydesign function was best characterized for the combined data frame and the
survey design information needed to analyze. Survey specific 'Survey-Weighted
Generalized Linear Models' (srvyglm) was used to fit the model (length of stay, total
charges, and mortality). The srvyglm was undertaken to appropriately fit a generalized
linear model from the intricate survey design of the NIS. We have fitted adjusted and
unadjusted srvyglm models for LOS, total charges, and mortality. For the multivariable
srvyglm models of LOS, total charges, and mortality, we have adjusted for the age, sex,
payer type, patient location, race, an indicator of a transfer into the hospital, median
household income and comorbidity score. For the mortality model (binomial), we fitted
a family referring quasibinomial to the srvyglm, which avoids a warning about non-
integer numbers of successes. The `quasi' versions of the family objects give the same
point estimates and standard errors and do not provide the error or warning in the
output of the model. All analyses were two-tailed and statistical significance was
determined using P < 0.05.
3. RESULTS
83
In 2017, the NIS documented a total of 54, 934 MLOP cancer discharges from the
total patients admitted in the U.S. hospitals in 2017; amongst those MLOP discharges,
555 MLOP patients acquired HAI. [Figure 1] Overall, the most common HAI was CDI
(36%), followed by CLABSI (32%), VAP (17%), and CAUTI (15%). [Figure 3]
Patient demographics with hospital characteristics among MLOP
hospitalization stratified with and without HAI (Table 1). There was no difference in the
event of the HAIs and nonHAI among the MLOP cohort based on age, gender, payer
type, whether rural or urban, and according to the race. The mean age of the MLOP-
HAI and nonHAI were 63 and had a male predisposition in both the sections (72% and
71%). Whites were predominantly affected in the HAI (74.5%) and nonHAI strata
(76.9%), whereas Blacks were 10% and 6.5 % in the nonHAI and HAI strata. Nearly
95% of the HAI hospitalization was billed to Medicare (48%), Medicaid (23%), and
private insurance (27%); the trend was approximately similar in the nonHAI strata. We
documented that the Patient Location: NCHS (National Center for Health Statistics)
Urban-Rural Code was comparably distributed in both HAI and nonHAI sections.
We found that Median household income for patients ZIP code (based on the current
year) was significantly different in the HAI and nonHAI MLOP patients (p < 0.001), and
the HAI events were higher in the lowest income quartile. Amongst, HAI, 72% patients
belong to 0-25th percentile, and 26th-50th percentile, whereas amongst nonHAI strata,
patients are distributed equally in quartiles. The Elixhauser comorbidity index had a
significant difference (P <0.001) with the HAI and nonHAI strata.
84
The unadjusted multivariable regression analysis showed the mean difference in the
total charges among MLOP patients with HAI compared to the MLOP patients without
HAI was the U.S. $ 54005 CIs 23378 – 84632 USD, p < 0.0001. Correspondingly, the
mean difference in the hospital length of stay among MLOP patients with HAI compared
to the MLOP cancer patients without HAI was 7.7 days C.I.s, 4.7 - 10.6 days, p <
0.0001. Mortality was not significantly different in the MLOP patients with HAI compared
to the MLOP cancer patients without HAI (OR of 0.83, CIs 0.3 – 2.26, p-value = 0.71).
[Table 2]
The adjusted multivariable regression analysis showed the mean difference in the total
charges among MLOP patients with HAI compared to the MLOP patients without HAI
was U.S. $ 49,383 CIs 20144 USD- 78622 USD, p < 0.0001. Correspondingly, the
mean difference in the hospital length of stay among MLOP patients with HAI compared
to the MLOP cancer patients without HAI was 6.63 days C.I.s, 3.62-9.64 days, p <
0.0001. Mortality was not significantly different in the MLOP patients with HAI compared
to the MLOP cancer patients without HAI (OR of 0.63, CIs 0.21-1.80, p-value = 0.4).
[Table 3]
4. DISCUSSION
This national-wide study of MLOP patients demonstrates that the
occurrence of 1 HAI was associated with a considerable increase in cost and length of
85
stay. When matched to the cohort of MLOP patients with no HAI, we determined that
the mean charges of patients with MLOP and HAI were 2.7 times higher, and the length
of stay was 6.63 days longer. Further, there was no change in mortality in both the
cohort.
To our knowledge, this is the first nationwide inpatient hospitalization study
addressing the burden of HAI among the MLOP patients. Thus, ICD 10 CM codes
comprising MLOP patients and HAI were never used in combination with oropharyngeal
cancer research. We confirmed ICD 10 CM codes by comparing the disease prevalence
with other published studies and with the public data. [1], [8], [11] By doing so, ICD 10
CM codes seemed more reliable, and results were consistent in identifying hospital
discharges with MLOP and HAI diagnosis in the 2017 NIS cohort. Nosology (the
systematic classification of diseases) has always been fascinating in its extensive and
comprehensive use of ICD codes, demonstrating a significant role in healthcare. [12]
Thus, this research study leveraged these strengths to add to the prevailing literature a
novel perspective of the burden of HAI on MLOP patients.
Head and Neck cancer hospitalization cost, according to the nationwide 2014 NIS
database study, was $20,985 per discharge on average, causing a total national
inpatient hospitalization cost liability of $1.5 billion [8]. In their study, it is noteworthy that
head and neck hospitalizations associated with the oral cavity were the most expensive
on average and also had the maximum cases. After adjusting for the covariates in the
regression analysis, head and Neck cancer hospitalizations with laryngeal involvement
86
was accompanied with the highest average cost and longest average LOS. This might
be due to multiple factors, including the longest healing time or associated with the
hospital-associated infection and when management is inclusive or R.T., CT, and
Surgical therapy. [13, 14] In patients who underwent total laryngectomy alone for
laryngeal cancer (L.C.) treatment, the median length of stay was 8.0 days (range, 0-130
days). [13] The extended LOS and readmission with surgical site infection are
particularly significant among the head and neck cancer patients with laryngeal
involvement. [13-15] In our study, we did not assess the laryngeal cancer encumbrance
and associated HAI, as previous research points outcome of the burden of
hospitalization-LOS, total charges, and readmission metrics among L.C. patients are
distinctive. [15] [16]
In a significant descriptive longitudinal study performed with the NIS
database from 2000 to 2008 on the hospitalization-level factors of MLOP patients [17],
there was an increase in trend in the MLOP hospitalization. The mean length of stay
decreased from 7.3 days to 6.7 days in the years from 2000 to 2008, and the total
charges trend showed an exponential increase over the nine years. [17] In their study,
there was a trend of increase in the mortality; each year increase in age was associated
with increased odds of death (odds ratio (OR) 1.0417, 95% CI 1.0335-1.0499, P <
.0001). Complications (including postoperative pneumonia and postoperative
complications) were recorded in their study; postoperative pneumonia was the most
frequently occurring complication (5.6%), followed by bleeding (2.6%), bacterial
infection (2.1%), and mycoses (2.1%). [17]
87
HAIs are one of the major impediments in the health care system as of today.
[18] A report published in 2000 from the Institute of Medicine informed 44,000 – 98,000
patients died each year when exposed to the healthcare system. [18] Since then, the
focus was to prevent the HAI; it has passed two decades, and according to CDC, "1 in
25 U.S. hospital patients is diagnosed with at least one infection related to hospital care
alone; additional infections occur in other healthcare settings." [19] The Most common
HAI in our study cohort was the CDI (36%), followed by CLABSI (32%), VAP (17%), and
CAUTI (15%). According to the estimate published in 2013, CLABSI accounts for
$45,814 (95% CI, $30,919-$65,245), followed by VAP at $40,144 (95% CI, $36,286-
$44,220), surgical site infections at $20,785 (95% CI, $18,902-$22,667), CDI at $11,285
(95% CI, $9118-$13,574), and CAUTI at $896 (95% CI, $603-$1189). And the total
annual costs for the five major infections were $9.8 billion (95% CI, $8.3-$11.5 billion).
[20] Exposure to multiple treatment regimens; use of multiple devices and catheters;
lack of identification of high risk-population and lack of personalized intervention may
increase the risk of complications [20-22]
HAI infection in MOLP patients provides an insight into the age of onset of disease,
compromised immune system, miscellaneous management (surgical and R.T),
interventions (catheters, ventilators, etc.), and increased length of stay leads to multiple
complications and increased burden of illness.
88
Our results also highlight some crucial differences between whites and non-
whites with MLOP (whites accounted for most of the hospitalization). Still, there was no
higher variabilities in the HAI and nonHAI strata. HAI events increased in the lowest
income quartile compared to the most upper-income quartiles, and there was a
significant difference in the HAI and nonHAI levels (P = 0.001). The distribution of the
comorbidity in both HAI and nonHAI levels was significantly different. A discrepancy
indicates that the comorbidities might influence the burden of the HAI in the MLOP
patients (P< 0.001). The majority of the hospitalization (80%-90%) were not transferred
into the hospitals in both the strata. And there was a difference in the transfer-in-from
different acute care hospitals in both the levels. ELECTIVE in Table 1 indicates whether
the admission to the hospital was elective; this information was derived from the type of
access; there was a difference in the HAI and nonHAI strata. All our results are
comparable to other National database studies previously conducted. [17] [8]
HAI infections among the MLOP patients are perceptive that infectious
complications would indicate poorer outcomes, but, knowing the possibility and degree
of this burden from the clinical characteristics, patient features, and comorbidities would
be beneficial in prediction. [ 23-28] Although the NIS database is excellent, many factors
affect the dataset, the observational nature of the dataset, limitations with administrative
claims data set, failure to demonstrate causal inference, along with hospital coding
method, and inaccurate representation of the outcome are some inherent limitations.
[29-30]
89
The HAI burden among MLOP patients is significant when compared to hospitalized
patients in different settings showed a similar trend of increased LOS and
hospitalization cost. [11, 31-33] Our research outcomes would complement the patient
cohort with the risk of HAI burden.
1. As a platform, the strength of these findings would help predict risk factors and
modeling in oncology and non-oncology settings concerning oral and maxillofacial
diseases.
2. The economic burden of cancer is a significant concern in the U.S., and when
intertwined with HAI, MLOP patients are more susceptible to this setback. Thus, actions
for preventing HAI among cancer patients are required at every phase of hospital care.
3. A similar trend in the increase of LOS and hospitalization costs are comparable to
hospitalized gynecology-oncology patients, [34] cardio-thoracic surgery patients, [32,
11] and in non-oncology pediatric care settings. [33] While HAIs are comparable to
other backgrounds, the occurrence of HAIs among MLOP patients might also depend
upon significant factors like comorbid conditions, age at diagnosis, stage of cancer, and
the microbial etiology of MLOP cancers.
4. Amongst cancer patients, it is uncertain whether HAIs serves as a risk factor for
recurrence, secondary neoplasms, and survival. Mostly, these aspects of HAIs are
90
unknown and generally requires actionable practices in oncology and non-oncology
setting.
5. CONCLUSION
The burden of Healthcare-associated infections in MLOP patients are mostly
preventable, our study indicates the U.S. 2017 MLOP patient cohort who acquired HAI,
was associated with a considerable increase in the length of stay, and total charges
during their in-hospital stay.
Limitations of the study
1. Claims data
The most significant limitations of the claims data are the accurateness of billing codes
when used to classify diagnoses and procedures. Coding inaccuracy leads to
destabilizing the reliability and correlation, although it varies by disease
characterizations and definitions, and the procedures in the data source may
exaggerate this. Relating or comparing findings with multiple studies on the same
associations' measure might effectively reduce these selection biases. Generally, it is
assumed that when procedure codes are combined with diagnostic codes, the results
are more reliable, demonstrating the thoroughness of the claims and internal validation.
Some of the other potential problems arising with claims data are that data are stored in
raw-from and not in ready to use form. And in terms of the scarce in-depth details and
91
de-identification, which prevents the follow-ups and gathering of other additional
variables, which might increase the risk of residual confounding. In the case of NIS
data, we believe that it is the best available in terms of the readiness to use. We have
used the ICD 10 CM codes comprising oropharyngeal cancer patients and HAI, which
were never used in combination with Head and Neck cancer research. We confirmed
ICD 10 CM codes by comparing the disease prevalence with other published studies
and with the public data. This way, we believe that we have used accurate billable
codes for our research.
2. Claims data on the bias of results
Analytical questions may arise regarding the external validity, selection bias,
confounding, misclassification bias, and causality, as the inferences are derived from
observational data obtained from the third-party documents. The evidence comprised in
insurance data is often incomplete or sometimes will be adjusted, therefore, formulating
it for the disease and risk factors, causation, and treatment sometimes might be
misleading. Carefully researching the data, which itself is a rigorous task, offers to
minimize errors. By adjusting the variables in the multivariable regressions, balancing
covariates by propensity score and instrument variable analysis-based methods for
variable adjustment are being utilized to balance the confounding elements among the
patient cohort being analyzed, which are inherently different at baseline. With the
comparison with the other studies and clinical judgment, we have carefully adjusted the
92
variables in the multivariable regression analysis. Thus, we believe that we have
regulated some of the confounding biases which might influence the outcome.
3. Cross-sectional nature of the NIS data
With the cross-sectional quality of the claims data, finding an association might be
appropriate, which in turn will depend on the assumptions for the exposure and
outcome of the study. Still, causality or causal inference would be inappropriate or even
impossible. The weakness of such studies would be interrelated whether the results
followed exposure in time.
Additionally, the claims data provide a snapshot of the disease processes and other
health-related characteristics at an in-hospitalization timepoint. Thus, we have utilized
the methodology which can be used to assess the in-hospital burden of HAI of a
population (oropharyngeal cancer patients) at a given time point.
4. Generalizability
Occasionally generalizability of results might be challenging and problematic, a
significant consideration appeared when dealing with the dental data, in 2012,
approximately 60 % of the U.S. population had dental insurance, and a majority of them
were healthier and having a higher income than those didn't have insurance. [36-38]
And thus, inferences from such studies could only be applied to those populations
where they have insurance coverage. We initially decided to use the oropharyngeal
93
procedure to identify the codes from the CDT procedure (The CDT dental code is a set
of procedural systems for oral health and dentistry). We noted that dental claims data
are predominantly vulnerable to misclassification because they are not based on the
diagnosis, which is very different from the NIS data. From the previously published
report, we noted that periodontal and oral surgical procedures are often not submitted in
the ICD codes.
We then decided to use the inpatient sample data were a major procedure like
oropharyngeal cancer treatment are undertaken. Thus, the generalizability of the claims
data might largely depend on disease classification in the diagnosis codes and
procedure codes platform.
5. Residual confounding
Even with the adjustment of the covariates in the regression approach, there might be
undetectable confounding biases, such as unmeasured or residual confounding
elements. We have used a multivariable regression-based approach to fit our model
and considered judging each clinically relevant variable by selectively evaluating the
change in the exposure-outcome estimate. Other methods like automated selection
methods in regression, stratification, and propensity score methods might be useful to
adjust for the confounding.
94
References
1. Siegel RL, Miller KD, Jemal A.. Cancer Statistics, 2017. CA Cancer J
Clin. 2017;67(1):7-30.
2. Stoopler ET, Sollecito TP. Oral Cancer. Dent Clin North Am. 2018 Jan;62(1):ix-x.
3. McLaughlin JK, Gridley G, Block G, Winn DM, Preston-Martin S, Schoenberg JB,
Greenberg RS, Stemhagen A, Austin DF, Ershow AG. Dietary factors in oral and
pharyngeal cancer. J Natl Cancer Inst. 1988 Oct 5; 80(15):1237-43.
4. Modi BJ, Knab B, Feldman LE, Mundt AJ, Yao M, Pytynia KB, Epstein J. Review of
current treatment practices for carcinoma of the head and neck. Expert Opin
Pharmacother. 2005;6(7):1143-55.
5. Elicin O, Cihoric N, Vlaskou Badra E, Ozsahin M. Emerging patient-
specific treatment modalities in head and neck cancer - a systematic review. Expert
Opin Investig Drugs. 2019;28(4):365-376.
6. Henry M, Alias A, Cherba M, Woronko C, Rosberger Z, Hier M, Zeitouni A, Kost
K, Mlynarek A, Richardson K, Black M, MacDonald C, Chartier G, Frenkiel S. Immediate
post-treatment supportive care needs of patientsnewly diagnosed with head and neck
cancer. Support Care Cancer. 2020 Mar 18. doi: 10.1007/s00520-020-05368-2. [Epub
ahead of print]
https://www.ncbi.nlm.nih.gov/pubmed/?term=Zeitouni%20A%5BAuthor%5D&cauthor=true&cauthor_uid=32189100
https://www.ncbi.nlm.nih.gov/pubmed/?term=Mlynarek%20A%5BAuthor%5D&cauthor=true&cauthor_uid=32189100
https://www.ncbi.nlm.nih.gov/pubmed/?term=Chartier%20G%5BAuthor%5D&cauthor=true&cauthor_uid=32189100
95
7. Genther DJ, Gourin CG. The effect of hospital safety-net burden status on short-term
outcomes and cost of care after head and neck cancer surgery. Arch Otolaryngol Head
Neck Surg. 2012; 138(11):1015-22.
8. Adjei Boakye E, Johnston KJ, Moulin TA, Buchanan PM, Hinyard L, Tobo BB, Massa
ST, Osazuwa-Peters N. Factors Associated With Head and Neck Cancer
Hospitalization Cost and Length of Stay-A National Study. Am J Clin Oncol.
2019;42(2):172-178.
9. Overview of the National (Nationwide) Inpatient Sample (NIS), 2017.
https://www.hcup-us.ahrq.gov/nisoverview.jsp. Accessed February 25, 2020.
10. HCUP National Inpatient Sample (NIS). Healthcare Cost and Utilization Project
(HCUP). Rockville, MD: Agency for Health- care Research and Quality; 2015.
11.Miller PE, Guha A, Khera R, Chouairi F, Ahmad T, Nasir K, Addison D, Desai NR.
National Trends in Healthcare-Associated Infections for Five Common Cardiovascular
Conditions. Am J Cardiol. 2019;124(7):1140-1148.
12. O'Malley KJ, Cook KF, Price MD, Wildes KR, Hurdle JF, Ashton CM.
Measuring diagnoses: ICD code accuracy. Health Serv Res. 2005 Oct;40(5 Pt 2):1620-
39.
96
13. Helman SN, Brant JA, Moubayed SP, Newman JG, Cannady SB, Chai RL.
Predictors of length of stay, reoperation, and readmission following total laryngectomy.
Laryngoscope. 2017;127(6):1339-1344.
14. Puram SV, Bhattacharyya N. Identifying Metrics before and after Readmission
following Head and Neck Surgery and Factors Affecting Readmission Rate. Otolaryngol
Head Neck Surg. 2018;158(5):860-866.
15. Hollenbeak CS, Kulaylat AN, Mackley H, et al. Determinants of medicare costs for
elderly patients with oral cavity and pharyngeal cancers. JAMA Otolaryngol—Head
Neck Surgery. 2015;141: 628–635.
16. Goepfert RP, Hutcheson KA, Lewin JS, Desai NG, Zafereo ME, Hessel AC, Lewis
CM, Weber RS, Gross ND. Complications, hospital length of stay, and readmission after
total laryngectomy. Cancer. 2017;123(10):1760-1767.
17. Lee MK, Dodson TB, Nalliah RP, Karimbux NY, Allareddy V.Nine-year trend
analysis of hospitalizations attributed to oral and oropharyngeal cancers in the United
States.Oral Surg Oral Med Oral Pathol Oral Radiol. 2014 Jul;118(1):47-67.
18. Io Medicine. To Err Is Human: Building a Safer Health System. Wasington, DC:
National Academy Press; 2000.
19. https://www.cdc.gov/winnablebattles/report/HAIs.html. Accessed on 3.30.2020.
https://www.ncbi.nlm.nih.gov/pubmed/?term=Cannady%20SB%5BAuthor%5D&cauthor=true&cauthor_uid=28000237
97
20. Zimlichman E, Henderson D, Tamir O, Franz C, Song P, Yamin CK, Keohane C,
Denham CR, Bates DW. Health care-associated infections: a meta-analysis of costs
and financial impact on the US health care system. JAMA Intern Med 2013; 173:2039–
2046.
21. Magill SS, Edwards JR, Bamberg W, Beldavs ZG, Dumyati G, Kainer MA, Lynfield
R, Maloney M, McAllister-Hollod L, Nadle J, Ray SM, Thompson DL, Wilson LE, Fridkin
SK, Emerging Infections Program Healthcare-Associated Infections and Antimicrobial
Use Prevalence Survey Team. Multistate point-prevalence survey of health care-asso-
ciated infections. N Engl J Med 2014;370:1198–1208.
22.Schmier JK, Hulme-Lowe CK, Semenova S, Klenk JA, DeLeo PC, Sedlak R, Carlson
PA.Estimated hospital costs associated with preventable health care-
associated infections if healthcare antiseptic products were unavailable. Clinicoecon
Outcomes Res. 2016;8:197-205.
23.Umscheid CA, Mitchell MD, Doshi JA, Agarwal R, Williams K, Brennan PJ.
Estimating the proportion of healthcare-associated infections that are reasonably
preventable and the related mortality and costs. Infect Control Hosp
Epidemiol. 2011;32(2):101-14.
24. Coskun H, Erisen L, Basut O. Factors affecting wound infec- tion rates in head and
neck surgery. Otolaryngol Head Neck Surg. 2000;123:328-333.
https://www.ncbi.nlm.nih.gov/pubmed/?term=Schmier%20JK%5BAuthor%5D&cauthor=true&cauthor_uid=27257390
https://www.ncbi.nlm.nih.gov/pubmed/?term=Semenova%20S%5BAuthor%5D&cauthor=true&cauthor_uid=27257390
https://www.ncbi.nlm.nih.gov/pubmed/?term=Carlson%20PA%5BAuthor%5D&cauthor=true&cauthor_uid=27257390
https://www.ncbi.nlm.nih.gov/pubmed/?term=Carlson%20PA%5BAuthor%5D&cauthor=true&cauthor_uid=27257390
https://www.ncbi.nlm.nih.gov/pubmed/?term=Williams%20K%5BAuthor%5D&cauthor=true&cauthor_uid=21460463
98
25. Mu Y, Edwards JR, Horan TC, Berrios-Torres SI, Fridkin SK. Improving risk-
adjusted measures of surgical site infection for the National Healthcare Safety Network.
Infect Control Hosp Epidemiol. 2011;32:970-986.
26. Bastier PL, Leroyer C, Lasheras A, Rogues AM, Darrouzet V, Franco-Vidal V. Early
and late surgical site infections in ear surgery. Acta Otorhinolaryngol Ital. 2016;36:127-
134.
26. Lee JI, Kwon M, Roh JL, et al. Postoperative hypoalbumine- mia as a risk factor for
surgical site infection after oral cancer surgery. Oral Dis. 2015; 21:178-184.
28. Umscheid CA, Mitchell MD, Doshi JA, Agarwal R, Williams K, Brennan PJ.
Estimating the proportion of healthcare- associated infections that are reasonably
preventable and the related mortality and costs. Infect Control Hosp Epidemiol. 2011;
32:101-114.
29. Khera R, Krumholz HM.
With Great Power Comes Great Responsibility: Big Data Research from
the National InpatientSample. Circ Cardiovasc Qual Outcomes. 2017 Jul;10(7). pii:
e003846.
30. Overman RA, Freburger JK, Assimon MM, Li X, Brookhart MA.
https://www.ncbi.nlm.nih.gov/pubmed/?term=Overman%20RA%5BAuthor%5D&cauthor=true&cauthor_uid=24866538
99
Observation stays in administrative claims databases: underestimation of hospitalized
cases. Pharmacoepidemiol Drug Saf. 2014 ;23(9):902-10.
31. Chan JK , Gardner AB, Mann AK, Kapp DS. Hospital-acquired conditions after
surgery for gynecologic cancer — An analysis of 82,304 patients. Gynecologic
Oncology 150 (2018) 515–520
32. Molena D , Mungo B, Stem M, Feinberg RL, Lidor AO. Prevalence, Impact, and Risk
Factors for Hospital-Acquired Conditions After Major Surgical Resection for Cancer: A
NSQIP Analysis. J Gastrointest Surg. 2015 Jan;19(1):142-51; discussion 151.
33. Tweddell S , Loomba RS , Cooper DS, Benscoter AL. Health Care-Associated
Infections Are Associated With Increased Length of Stay and Cost but Not Mortality in
Children Undergoing Cardiac Surgery. Congenit Heart Dis. 2019 ;14(5):785-790.
34. Kim SP, Shah ND, Karnes RJ, Weight CJ, Frank I, Moriarty JP, et al. The
implications of hospital acquired adverse events on mortality, length of stay and costs
for patients undergoing radical cystectomy for bladder cancer. J Uro 2012;187(6):2011-
7.
35.National Association of Dental Plans. Who has dental benefits? http://www.nadp.org/
Dental_Benefits_Basics/Dental_BB_1.aspx.
100
36. Haley J, Kenney G, Pelletier J. Access to affordable dental care: gaps for low-
income adults. The Henry J. Kaiser Family Foundation. Available at:
www.allhealth.org/briefingmaterials/ kaiserlowincomeaccesssurvey-1276.pdf.
37. Hyman J. The Limitations of Using Insurance Data for Research. Am Dent Assoc.
2015;146(5):283-5.
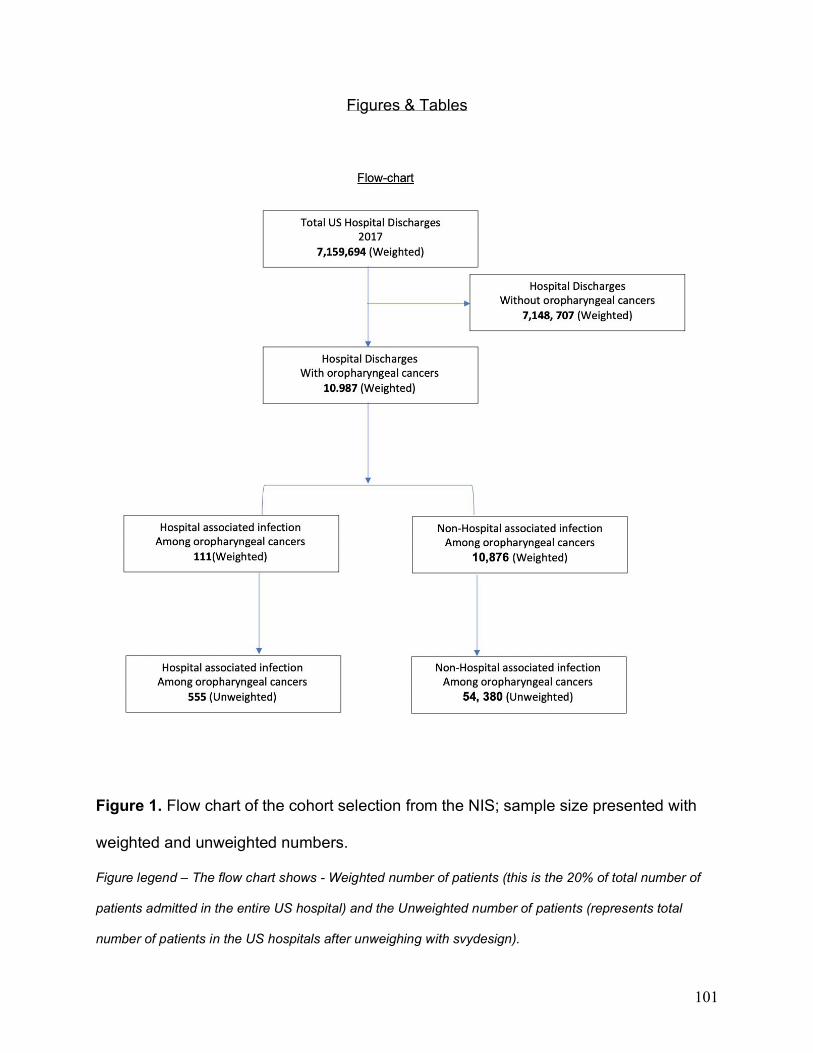
101
Figures & Tables
Figure 1. Flow chart of the cohort selection from the NIS; sample size presented with
weighted and unweighted numbers.
Figure legend – The flow chart shows - Weighted number of patients (this is the 20% of total number of
patients admitted in the entire US hospital) and the Unweighted number of patients (represents total
number of patients in the US hospitals after unweighing with svydesign).
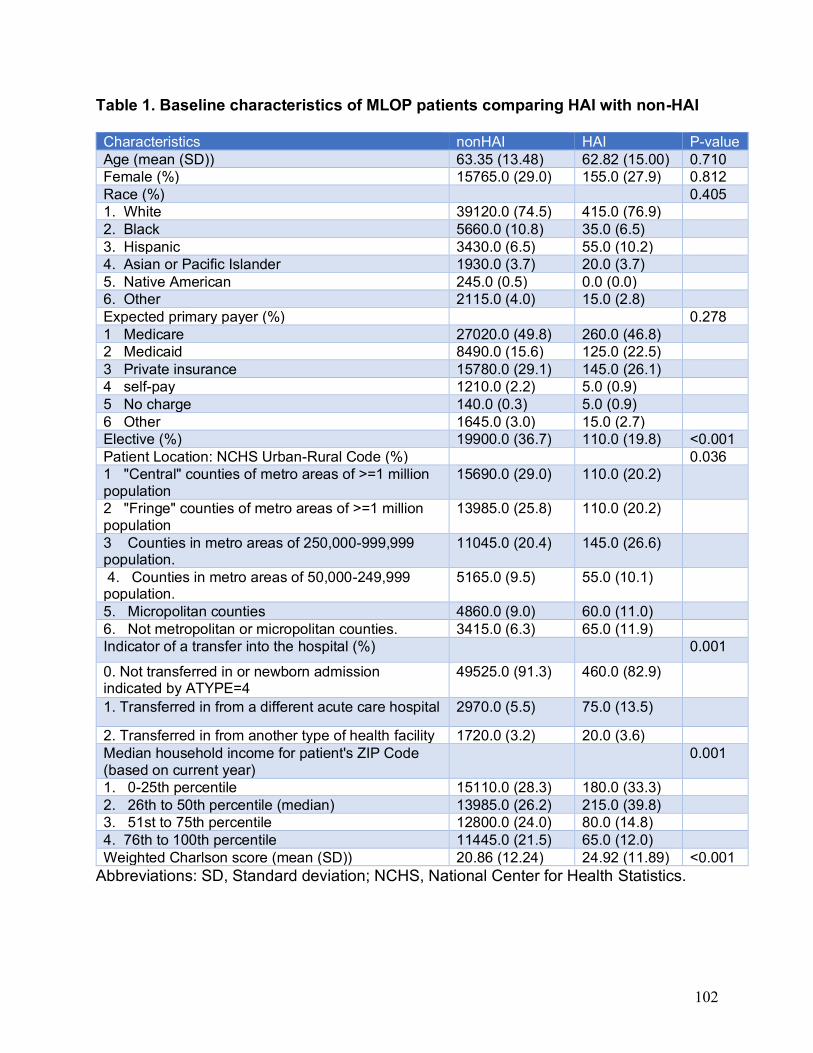
102
Table 1. Baseline characteristics of MLOP patients comparing HAI with non-HAI Characteristics nonHAI HAI P-value
Age (mean (SD)) 63.35 (13.48) 62.82 (15.00) 0.710
Female (%) 15765.0 (29.0) 155.0 (27.9) 0.812
Race (%) 0.405
1. White 39120.0 (74.5) 415.0 (76.9)
2. Black 5660.0 (10.8) 35.0 (6.5)
3. Hispanic 3430.0 (6.5) 55.0 (10.2)
4. Asian or Pacific Islander 1930.0 (3.7) 20.0 (3.7)
5. Native American 245.0 (0.5) 0.0 (0.0)
6. Other 2115.0 (4.0) 15.0 (2.8)
Expected primary payer (%) 0.278
1 Medicare 27020.0 (49.8) 260.0 (46.8)
2 Medicaid 8490.0 (15.6) 125.0 (22.5)
3 Private insurance 15780.0 (29.1) 145.0 (26.1)
4 self-pay 1210.0 (2.2) 5.0 (0.9)
5 No charge 140.0 (0.3) 5.0 (0.9)
6 Other 1645.0 (3.0) 15.0 (2.7)
Elective (%) 19900.0 (36.7) 110.0 (19.8) <0.001
Patient Location: NCHS Urban-Rural Code (%) 0.036
1 "Central" counties of metro areas of >=1 million population
15690.0 (29.0) 110.0 (20.2)
2 "Fringe" counties of metro areas of >=1 million population
13985.0 (25.8) 110.0 (20.2)
3 Counties in metro areas of 250,000-999,999 population.
11045.0 (20.4) 145.0 (26.6)
4. Counties in metro areas of 50,000-249,999 population.
5165.0 (9.5) 55.0 (10.1)
5. Micropolitan counties 4860.0 (9.0) 60.0 (11.0)
6. Not metropolitan or micropolitan counties. 3415.0 (6.3) 65.0 (11.9)
Indicator of a transfer into the hospital (%)
0.001
0. Not transferred in or newborn admission indicated by ATYPE=4
49525.0 (91.3) 460.0 (82.9)
1. Transferred in from a different acute care hospital 2970.0 (5.5) 75.0 (13.5)
2. Transferred in from another type of health facility 1720.0 (3.2) 20.0 (3.6)
Median household income for patient's ZIP Code (based on current year)
0.001
1. 0-25th percentile 15110.0 (28.3) 180.0 (33.3)
2. 26th to 50th percentile (median) 13985.0 (26.2) 215.0 (39.8)
3. 51st to 75th percentile 12800.0 (24.0) 80.0 (14.8)
4. 76th to 100th percentile 11445.0 (21.5) 65.0 (12.0)
Weighted Charlson score (mean (SD)) 20.86 (12.24) 24.92 (11.89) <0.001
Abbreviations: SD, Standard deviation; NCHS, National Center for Health Statistics.
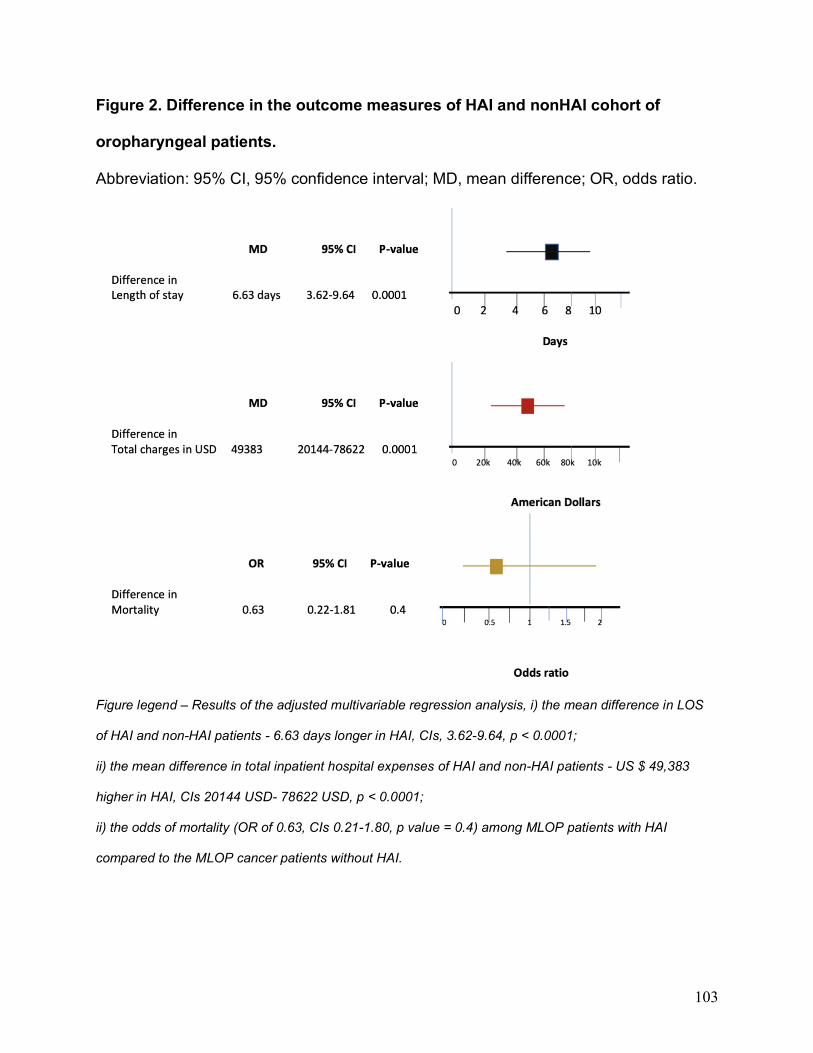
103
Figure 2. Difference in the outcome measures of HAI and nonHAI cohort of
oropharyngeal patients.
Abbreviation: 95% CI, 95% confidence interval; MD, mean difference; OR, odds ratio.
Figure legend – Results of the adjusted multivariable regression analysis, i) the mean difference in LOS
of HAI and non-HAI patients - 6.63 days longer in HAI, CIs, 3.62-9.64, p < 0.0001;
ii) the mean difference in total inpatient hospital expenses of HAI and non-HAI patients - US $ 49,383
higher in HAI, CIs 20144 USD- 78622 USD, p < 0.0001;
ii) the odds of mortality (OR of 0.63, CIs 0.21-1.80, p value = 0.4) among MLOP patients with HAI
compared to the MLOP cancer patients without HAI.
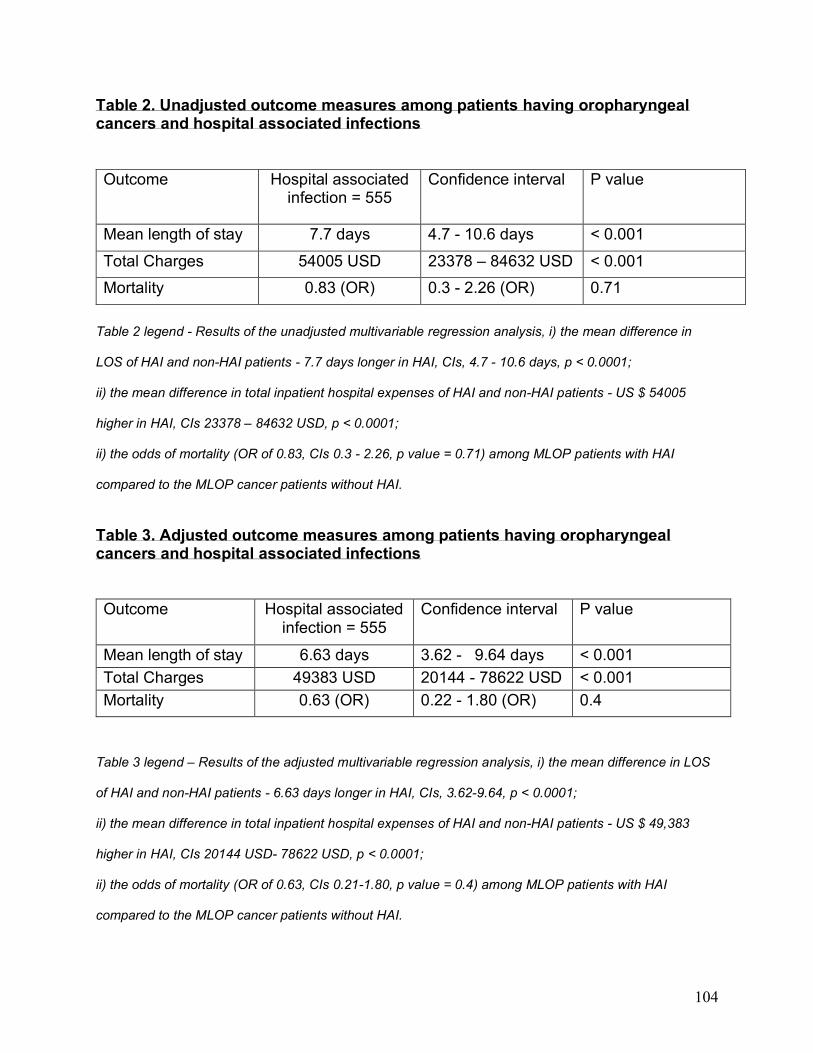
104
Table 2. Unadjusted outcome measures among patients having oropharyngeal cancers and hospital associated infections
Outcome Hospital associated infection = 555
Confidence interval P value
Mean length of stay 7.7 days 4.7 - 10.6 days < 0.001
Total Charges 54005 USD 23378 – 84632 USD < 0.001
Mortality 0.83 (OR) 0.3 - 2.26 (OR) 0.71
Table 2 legend - Results of the unadjusted multivariable regression analysis, i) the mean difference in
LOS of HAI and non-HAI patients - 7.7 days longer in HAI, CIs, 4.7 - 10.6 days, p < 0.0001;
ii) the mean difference in total inpatient hospital expenses of HAI and non-HAI patients - US $ 54005
higher in HAI, CIs 23378 – 84632 USD, p < 0.0001;
ii) the odds of mortality (OR of 0.83, CIs 0.3 - 2.26, p value = 0.71) among MLOP patients with HAI
compared to the MLOP cancer patients without HAI.
Table 3. Adjusted outcome measures among patients having oropharyngeal cancers and hospital associated infections
Outcome Hospital associated infection = 555
Confidence interval P value
Mean length of stay 6.63 days 3.62 - 9.64 days < 0.001
Total Charges 49383 USD 20144 - 78622 USD < 0.001
Mortality 0.63 (OR) 0.22 - 1.80 (OR) 0.4
Table 3 legend – Results of the adjusted multivariable regression analysis, i) the mean difference in LOS
of HAI and non-HAI patients - 6.63 days longer in HAI, CIs, 3.62-9.64, p < 0.0001;
ii) the mean difference in total inpatient hospital expenses of HAI and non-HAI patients - US $ 49,383
higher in HAI, CIs 20144 USD- 78622 USD, p < 0.0001;
ii) the odds of mortality (OR of 0.63, CIs 0.21-1.80, p value = 0.4) among MLOP patients with HAI
compared to the MLOP cancer patients without HAI.
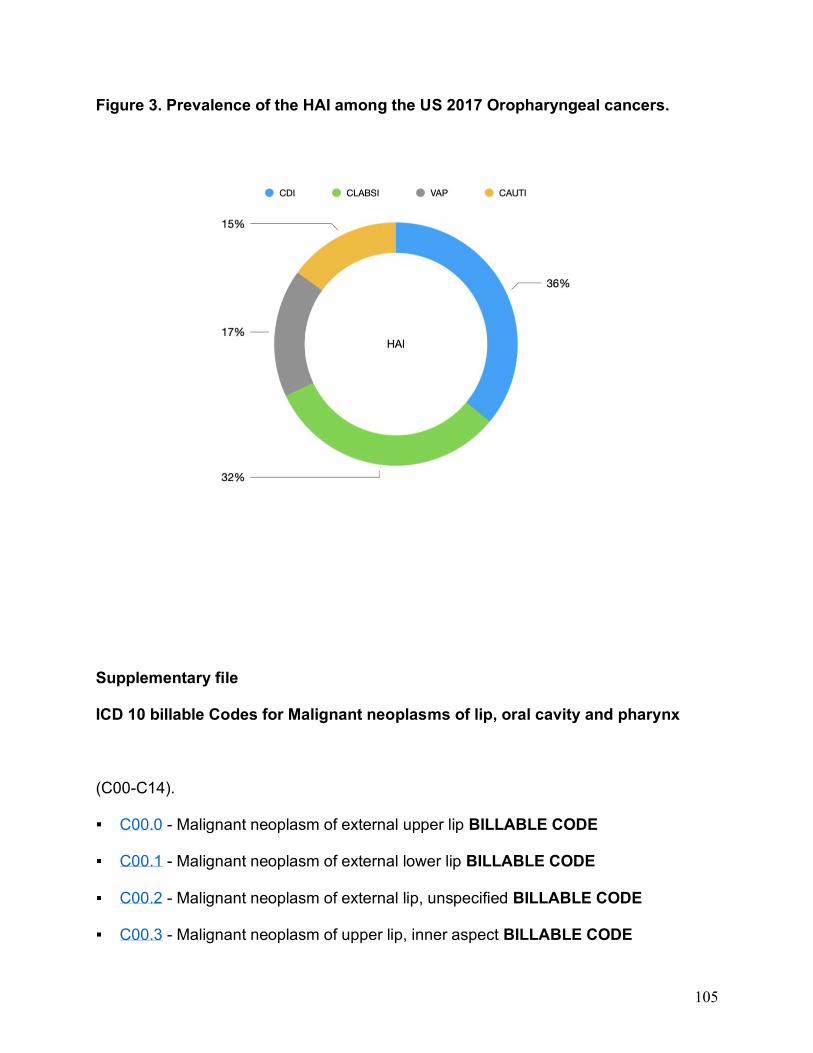
105
Figure 3. Prevalence of the HAI among the US 2017 Oropharyngeal cancers.
Supplementary file
ICD 10 billable Codes for Malignant neoplasms of lip, oral cavity and pharynx
(C00-C14).
C00.0 - Malignant neoplasm of external upper lip BILLABLE CODE
C00.1 - Malignant neoplasm of external lower lip BILLABLE CODE
C00.2 - Malignant neoplasm of external lip, unspecified BILLABLE CODE
C00.3 - Malignant neoplasm of upper lip, inner aspect BILLABLE CODE
106
C00.4 - Malignant neoplasm of lower lip, inner aspect BILLABLE CODE
C00.5 - Malignant neoplasm of lip, unspecified, inner aspect BILLABLE CODE
C00.6 - Malignant neoplasm of commissure of lip, unspecified BILLABLE CODE
C00.8 - Malignant neoplasm of overlapping sites of lip BILLABLE CODE
C00.9 - Malignant neoplasm of lip, unspecified BILLABLE CODE
Malignant neoplasm of base of tongue (C01)
C01 - Malignant neoplasm of base of tongue BILLABLE CODE
Malignant neoplasm of other and unspecified parts of tongue (C02)
C02.0 - Malignant neoplasm of dorsal surface of tongue BILLABLE CODE
C02.1 - Malignant neoplasm of border of tongue BILLABLE CODE
C02.2 - Malignant neoplasm of ventral surface of tongue BILLABLE CODE
C02.3 - Malig neoplasm of anterior two-thirds of tongue, part unsp BILLABLE
CODE
C02.4 - Malignant neoplasm of lingual tonsil BILLABLE CODE
C02.8 - Malignant neoplasm of overlapping sites of tongue BILLABLE CODE
C02.9 - Malignant neoplasm of tongue, unspecified BILLABLE CODE
Malignant neoplasm of gum (C03)
107
C03.0 - Malignant neoplasm of upper gum BILLABLE CODE
C03.1 - Malignant neoplasm of lower gum BILLABLE CODE
C03.9 - Malignant neoplasm of gum, unspecified BILLABLE CODE
Malignant neoplasm of floor of mouth (C04)
C04.0 - Malignant neoplasm of anterior floor of mouth BILLABLE CODE
C04.1 - Malignant neoplasm of lateral floor of mouth BILLABLE CODE
C04.8 - Malignant neoplasm of overlapping sites of floor of mouth BILLABLE CODE
C04.9 - Malignant neoplasm of floor of mouth, unspecified BILLABLE CODE
Malignant neoplasm of palate (C05)
C05.0 - Malignant neoplasm of hard palate BILLABLE CODE
C05.1 - Malignant neoplasm of soft palate BILLABLE CODE
C05.2 - Malignant neoplasm of uvula BILLABLE CODE
C05.8 - Malignant neoplasm of overlapping sites of palate BILLABLE CODE
C05.9 - Malignant neoplasm of palate, unspecified BILLABLE CODE
Malignant neoplasm of other and unspecified parts of mouth (C06)
C06.0 - Malignant neoplasm of cheek mucosa BILLABLE CODE
C06.1 - Malignant neoplasm of vestibule of mouth BILLABLE CODE
108
C06.2 - Malignant neoplasm of retromolar area BILLABLE CODE
C06.80 - Malignant neoplasm of ovrlp sites of unsp parts of mouth BILLABLE
CODE
C06.89 - Malignant neoplasm of overlapping sites of oth prt mouth BILLABLE
CODE
C06.9 - Malignant neoplasm of mouth, unspecified BILLABLE CODE
Malignant neoplasm of parotid gland (C07)
C07 - Malignant neoplasm of parotid gland BILLABLE CODE
Malignant neoplasm of other and unsp major salivary glands (C08)
C08.0 - Malignant neoplasm of submandibular gland BILLABLE CODE
C08.1 - Malignant neoplasm of sublingual gland BILLABLE CODE
C08.9 - Malignant neoplasm of major salivary gland, unspecified BILLABLE CODE
Malignant neoplasm of tonsil (C09)
C09.0 - Malignant neoplasm of tonsillar fossa BILLABLE CODE
C09.1 - Malig neoplasm of tonsillar pillar (anterior) (posterior) BILLABLE CODE
C09.8 - Malignant neoplasm of overlapping sites of tonsil BILLABLE CODE
C09.9 - Malignant neoplasm of tonsil, unspecified BILLABLE CODE
109
Malignant neoplasm of oropharynx (C10)
C10.0 - Malignant neoplasm of vallecula BILLABLE CODE
C10.1 - Malignant neoplasm of anterior surface of epiglottis BILLABLE CODE
C10.2 - Malignant neoplasm of lateral wall of oropharynx BILLABLE CODE
C10.3 - Malignant neoplasm of posterior wall of oropharynx BILLABLE CODE
C10.4 - Malignant neoplasm of branchial cleft BILLABLE CODE
C10.8 - Malignant neoplasm of overlapping sites of oropharynx BILLABLE CODE
C10.9 - Malignant neoplasm of oropharynx, unspecified BILLABLE CODE
Malignant neoplasm of nasopharynx (C11)
C11.0 - Malignant neoplasm of superior wall of nasopharynx BILLABLE CODE
C11.1 - Malignant neoplasm of posterior wall of nasopharynx BILLABLE CODE
C11.2 - Malignant neoplasm of lateral wall of nasopharynx BILLABLE CODE
C11.3 - Malignant neoplasm of anterior wall of nasopharynx BILLABLE CODE
C11.8 - Malignant neoplasm of overlapping sites of nasopharynx BILLABLE CODE
C11.9 - Malignant neoplasm of nasopharynx, unspecified BILLABLE CODE
Malignant neoplasm of pyriform sinus (C12)
C12 - Malignant neoplasm of pyriform sinus BILLABLE CODE
110
Malignant neoplasm of hypopharynx (C13)
C13.0 - Malignant neoplasm of postcricoid region BILLABLE CODE
C13.1 - Malig neoplasm of aryepiglottic fold, hypopharyngeal aspect BILLABLE
CODE
C13.2 - Malignant neoplasm of posterior wall of hypopharynx BILLABLE CODE
C13.8 - Malignant neoplasm of overlapping sites of hypopharynx BILLABLE CODE
C13.9 - Malignant neoplasm of hypopharynx, unspecified BILLABLE CODE
Malig neoplasm of sites in the lip, oral cavity and pharynx (C14)
C14.0 - Malignant neoplasm of pharynx, unspecified BILLABLE CODE
C14.2 - Malignant neoplasm of Waldeyer's ring BILLABLE CODE
C14.8 - Malig neoplm of ovrlp sites of lip, oral cavity and pharynx BILLABLE CODE

111
Summary
112
Summary of the research
Paper 1, 2 and 3, conclusions
Oral care interventions (OCI) that reduce oral bacterial load have been suggested to be
effective in mitigating the risk of ventilation associated pneumonia (VAP). However, very
little was known about the oral care intervention in the risk of non-ventilation associated
pneumonia (NVAP). Our research in this space estimated that NVAP risk is not
equivalent for all hospitalized patients. When considering the NVAP's burden, there is
very little conclusive evidence in the form of randomized-controlled trials (RCTs). RCTs
on oral hygiene intervention performed by a dental professional to prevent the NVAP
risk were conducted in nursing homes in Japan, and they conclude that structured
enhanced oral regimens effectively reduced the rate of NVAP and that enhanced OCI
delivered by dental professionals were most effective. Therefore, the generalizability of
the results is limited. As a proof-of-concept, the results of such studies can be
concluded to be positive with an overall reduction in NVAP rates of greater than 10%,
but their broad translatability to the general hospital population is unclear.
A patient's oral health status may be a risk component to the extent that it reflects
bacterial load. However, there is an equivalent contribution from patient's comorbidities,
length of stay, type of the facility (acute and chronic care setting), and other factors that
might increase the risk of Healthcare-associated infection (HAI), this needs to be
analyzed in detail. And there is an extreme paucity in distinguishing the burden of HAIs
in this area of research. Our analysis confirms the need for additional studies to assess
113
the benefit of OCI on all HAI risk fully, and also to characterize the burden of HAI
outcome on the oropharyngeal procedures.
Given the challenges of existing oral care intervention in preventing VAP, and
lack of head to head robust trials of the best available treatment modality, the approach
of the Network meta-analysis (NMA) to assess the comparative effectiveness of oral
care interventions in preventing ventilator-associated pneumonia in critically ill patients
is exceptional. We followed stern assumptions and standardization, and our study
cohort was based on the largest pairwise meta-analysis of oral care intervention in
preventing the VAP. According to the NMA outcome, toothbrushing alone or
toothbrushing along with a potent antiseptic mouthwash povidone-iodine was related to
the highest response rate in preventing VAP in critically ill patients, followed by furacillin
and chlorhexidine 0.2%, respectively.
The outcomes from first and second research show that oral hygiene
maintenance directed to the mechanical cleaning (scaling and root planing performed
by a dental professional in the NVAP setting, toothbrushing alone and toothbrushing
along with a potent mouthwash in VAP setting) was very much superior to the chemical
disinfection alone in reducing the microbial counts in the oral cavity whether in VAP
patients or in non-VAP patients. The mechanical cleaning performed by a dental
professional in NVAP patients reduced the 35% risk. The approach of mechanical
cleansing by the dental professionals in NVAP patients reduced the active microbial
pooling when patients who were hospitalized without a device (endotracheal tube) in the
114
oral cavity. This scenario is entirely different when patients are ventilated with an active
device in the oral cavity, as in the case of VAP. Oral hygiene procedures like scaling
and root planning are never possible to perform when patients are ventilated, and
reduction of the oral biofilm and dental plaque accumulation utilizing a toothbrushing
alone or in combinations with a potent chemical mouthwash is more suitable, than a
chemical mouthwash alone.
Some studies have suggested that improved oral hygiene may be useful in
reducing its incidence [1-8]. However, when hospitalized, there is a disproportionate
accumulation of dental biofilm and pooling microbes to drive throughout the oral and
laryngeal airway space. [1-9] It is worth noting, the dental deposits alone contain around
100 million bacteria per one cubic millimeter of dental plaque. [8,9] There could be a
difference in the acute care setting and the long-term care setting when accounting for
the microbial pooling in the lungs. In both cases, dental biofilm could be a significant
responsible factor for the development of pneumonia. [9]
Ventilated patients with no access to clear oral secretion may aspirate or
cough, are at risk of developing VAP, aspiration of oral secretion contaminated by oral
microbes, may potentially serve as a reservoir for pneumonia. [9,10,11] Whereas in the
NVAP cases, where mostly elderly care setting is included having reduced salivary
secretions, decreased cough reflex, followed by swallowing disorders and reduced skill
to perform oral hygiene, may explain the risk. [12, 13]. However, it is also debatable
whether there is a difference in the dentate and edentate group, which was not
115
evaluated since enough data was not available to perform this analysis. Studies on oral
health status and VAP provides an insight into those areas where the oral hygiene
wasn't performed due to the mechanical ventilation device, especially the posterior
buccal teeth surface prone to microbial pooling, studies found these to be risk factors for
pneumonia. [1-3, 14, 15] Our first and second research suggests that mechanical
cleansing alone or along with a potent mouthwash reduced the oral biofilm and oral
plaque formation, and substantiality reduced the risk of pneumonia among the VAP and
NVAP groups.
To assess the characteristics of the HAI, we performed a descriptive study to
assess the differences in outcome among patients with a primary diagnosis of malignant
neoplasms of the oropharyngeal area with and without hospital-associated infection
(HAI). To our knowledge, this is the first nationwide inpatient hospitalization study
addressing the burden of HAI among oropharyngeal cancer patients.
The most common HAI was Clostridium difficile infection (36%), followed by
central line-associated bloodstream infection (32%), ventilator-associated pneumonia
(17%), and catheter-associated urinary tract infection (15%). Oropharyngeal cancer
patients with HAI had a length of stay of 6.63 days longer than the non-HAI patients.
Oropharyngeal cancer patients with HAI had hospitalization charges of 49383 USD
higher than the non-HAI oropharyngeal cancer patients.
116
Our analysis was limited to oropharyngeal cancers of the 2017 US national hospitals,
although it provided an overview of the difference in the outcome of the HAI and non-
HAI. We were not sure whether oropharyngeal procedures definitively had any
consequence on the difference in HAI outcomes. Hence, we further analyzed the 2017
inpatient sample data for additional studies outlined below, and findings of all studies
are remarkable and publishable.
1) Characteristics of the healthcare-associated infections among those who
underwent Orthognathic surgery - Ongoing study.
2) Healthcare-associated infections among patients undergoing treatment for
chemotherapy and radiation-induced ulcerative mucositis - Ongoing study.
3) The differences in outcome among patients hospitalized with a primary
diagnosis of malignant neoplasms of lip, oral cavity, and pharynx with and
without Ulcerative Mucositis (UM) – Ongoing study.
Limitations
1. Owing to the increasing concern in the dissemination of the oral microbes into the
systemic distribution, focusing on preventing systemic illness with enhanced oral care
may add value in recent years to come. However, there would always be a concern in
the VAP and NVAP prevention protocols and oral care stances. Along with other
117
comorbidities, oral microbiota may unquestionably influence the general health of the
patients.
2. Our research supports the concept that adequate oral microbial debridement
favorably impacts NVAP risk. However, the reason for the difference in response
between dental vs. non-dental professionals may not be specifically attributed to
differences in competencies, but slightly reflective of focus and time spent.
Whereas non-dental professionals typically have oral care as one of many
patient-related daily tasks, the only focus of the dental professionals was oral care, and
thus the time-spent and outcome motivation was likely to be more direct. The observed
impact on NVAP-related outcomes when care was delivered by a nursing assistant
dedicated to providing OCI as a primary task supports this argument. Competing time
demands for nursing services may limit their capacity to provide optimal mouthcare.
Additional studies are necessary to more thoroughly investigate the impact of provider
qualifications on NVAP risk modification since the cost implications of dedicated oral
health aides, regardless of their requirement, is not insignificant.
3. Chemical disinfection presumably offers a non-procedural opportunity to reduce oral
bacterial burden. In contrast to its reported efficacy to prevent VAP, the effect of
chemical disinfection on NVAP risk was inconsistent across the 3 RCTs (Relative risk
(RR), 1.05). Recent studies suggest an increased risk of NVAP with chlorhexidine use
118
(RR 1.36), and some showed either a marginally protective effect (RR 0.87) or a
substantive effect (RR 0.60). There is a lack of studies estimating the chlorhexidine
concentrations.
4. Chlorhexidine has been widely used in the general population for many years, and
chlorhexidine resistance is an emerging topic recently, but research on chlorhexidine
resistance on VAP and NVAP population is very limited.
5. Our study on the comparative effectiveness of the oral care products in preventing
ventilation associated pneumonia was limited to the systematic search until 2016, and
there might be other RCTs in this area with robust findings.
6. Small numbers of studies in a meta-analysis possibly lead to more heterogeneity;
and more generally, for numerous dissimilar therapeutic interventions, the pooled effect
estimates of meta-analyses of larger studies are more reliable when compared with the
smaller studies. [16] This was one of the chief limitations with the first pairwise meta-
analysis research, and we attempted to get as much evidence from the non-randomized
trials and observational studies to test our hypothesis. Since there were a smaller
number of trials in this area of research in the hospitalized population, we expect to
have more trials in the future both as a randomized and non-randomized experiment to
test the hypothesis.
119
7. Publication bias, which is known as the 'file drawer problem,' [17] This phenomenon
occurs when statistically insignificant or no effect studies are not published, and hence
do not appear in the meta-analysis. Preventing publication bias could be done by setting
a search strategy to include grey literature, conference abstracts, and university thesis,
with the limited time, we couldn't do this search strategy. We might have included funnel
plot, eggers plot, trim, and fill method to detect publication bias since fewer than ten
studies were included in the quantitative synthesis, publication bias assessment was not
performed.
8. Limitations of sub-group analyses and limitations of generalizability.
Considering the over-all pooled effect estimate, which is often affected by effect
modifiers, the subgroup analysis is best to assess the consistency of treatment across
multiple groups. Subgroup analysis is a beneficial technique, but they have limitations
and pitfalls, primarily when referring to the generalizability of the findings. The results of
the subgroup analysis may sometimes misleading if not powered enough to conclude.
And similarly, the subgroup analysis findings would lead to influence the inferences of
the causal conclusion derived from the randomized controlled trial. [18]
In our first research focusing on the oral care intervention preventing non-ventilated
pneumonia (NVAP), the quantitative synthesis of meta-analysis didn't show significant
findings of oral care intervention in preventing the NVAP; the subgroup analysis, where
a dental professional who performed analysis showed a meaningful result. Although
these findings may not be generalizable, and more studies are needed to assert this
finding through randomized and non-randomized controlled trials.
120
But we believe that the patient cohort where a dental professional performed oral
hygiene would have spent a sufficient time to reduce the oral microbial content through
mechanical cleaning than others. In place of the concept that oral microorganism
responsible for pneumonia are present in the oral cavity and requires less than 48 hours
to colonize in the mouth, structured mechanical cleaning is beneficial. The patient
cohorts were a dental professional involved resulted in higher responses in the
reduction of pneumonia upon which to assess the impact of procedures to reduce the
oral bacterial burden serves as an explanatory.
121
Conclusion
Ongoing professional dental care is the most effective preventive measure for
non-ventilated pneumonia for patients in long-term care facilities. Preventing oral
deposits in hospitalized patients by means of mechanical plaque and debris removal
might reduce the risk of pneumonia by means of a reduction in pneumonia-causing
microorganisms in the oral cavity.
Structured oral care, along with other preventive efforts, are warranted for
hospitalized patients at risk of HAI. Additional randomized clinical trials are needed to
validate the utility of oral care interventions as a preventive strategy for HAI.
122
References
1) Jones DJ, Munro CL, Grap MJ. Natural history of dental plaque accumulation in
mechanically ventilated adults: A descriptive correlational study. Intensive Crit
Care Nurs. 2011; 27:299–304.
2) Munro CL, Grap MJ, Elswick RK, Jr, McKinney J, Sessler CN, Hummel RS., 3rd
Oral health status and development of ventilator-associated pneumonia: A
descriptive study. Am J Crit Care. 2006;15:453–60.
3) Miranda AF, de Paula RM, de Castro Piau CG, Costa PP, Bezerra AC.
Oral care practices for patients in Intensive Care Units: A pilot survey. Indian J
Crit Care Med. 2016 May;20(5):267-73.
4) Kriebel K, Hieke C, Müller-Hilke B, Nakata M, Kreikemeyer B.
Oral Biofilms from Symbiotic to Pathogenic Interactions and Associated Disease-
Connectionof Periodontitis and Rheumatic Arthritis by Peptidylarginine Deiminas
e. front Microbiol. 2018;9:53.
5) Hong C, Aung MM, Kanagasabai K, Lim CA, Liang S, Tan KS. The association
between oral health status and respiratory pathogen colonization
with pneumonia risk in institutionalized adults. Int J Dent Hyg. 2018;16(2):e96-
e102.
123
6) Scannapieco FA. Role of oral bacteria in respiratory infection. J Periodontol.
1999 Jul; 70(7):793-802.
7) Scannapieco FA, Wang B, Shiau HJ. Oral bacteria and respiratory infection:
effects on respiratory pathogen adhesion and epithelial cell proinflammatory
cytokine production. Ann Periodontol. 2001 Dec; 6(1):78-86.
8) Thoden van Velzen SK, Abraham-Inpijn L, Moorer WR. Plaque and systemic
disease: a reappraisal of the focal infection concept. J Clin Periodontol. 1984;
11(4):209-20.
9) Paju S, Scannapieco FA. Oral biofilms, periodontitis, and pulmonary infections.
Oral Dis. 2007;13(6):508-12.
10) Estes RJ, Meduri GU. The pathogenesis of ventilator-associated pneumonia: I.
Mechanisms of bacterial transcolonization and airway inoculation. Intensive Care
Med. 1995 Apr; 21(4):365-83.
11) Koeman M, van der Ven AJ, Hak E, Joore HC, Kaasjager K, et al. Oral
decontamination with chlorhexidine reduces the incidence of ventilator-
associated pneumonia. Am J Respir Crit Care Med. 2006;173:1348–
1355. [PubMed] [Google Scholar]
124
12) O'Keefe-McCarthy S. Evidence-based nursing strategies to prevent ventilator-
acquired pneumonia. Dynamics. 2006;17:8–11. [PubMed] [Google Scholar]
13) Tantipong H, Morkchareonpong C, Jaiyindee S, Thamlikitkul V. Randomized
controlled trial and meta-analysis of oral decontamination with 2% chlorhexidine
solution for the prevention of ventilator-associated pneumonia. Infect Control
Hosp Epidemiol. 2008;29:131–136. [PubMed] [Google Scholar]
14) Chan EY. Oral decontamination for ventilator-associated pneumonia
prevention. Aus Crit Care. 2009;22:3–4. [PubMed] [Google Scholar]
15) Brennan MT, Bahrani-Mougeot F, Fox PC, Kennedy TP, Hopkins S, et al. The
role of oral microbial colonization in ventilator-associated pneumonia. Oral Surg
Oral Med Oral Pathol Oral Radiol Endod. 2004;98:665–672. [PubMed]
16) Hennekens CH, Demets D. The Need for Large-Scale Randomized Evidence
Without Undue Emphasis on Small Trials, Meta-Analyses, or Subgroup
Analyses. JAMA 2009;302(21):2361-2.
17) Simonsohn U , Nelson JP , Simmons JP . P-curve: A Key to the File-Drawer. J
Exp Psychol Gen 2014;143(2):534-47.
125
18) Bigger JT. Issues in Subgroup Analyses and Meta-Analyses of Clinical
Trials. Cardiovasc Electrophysiol 2003;14(9 Suppl):S6-8.
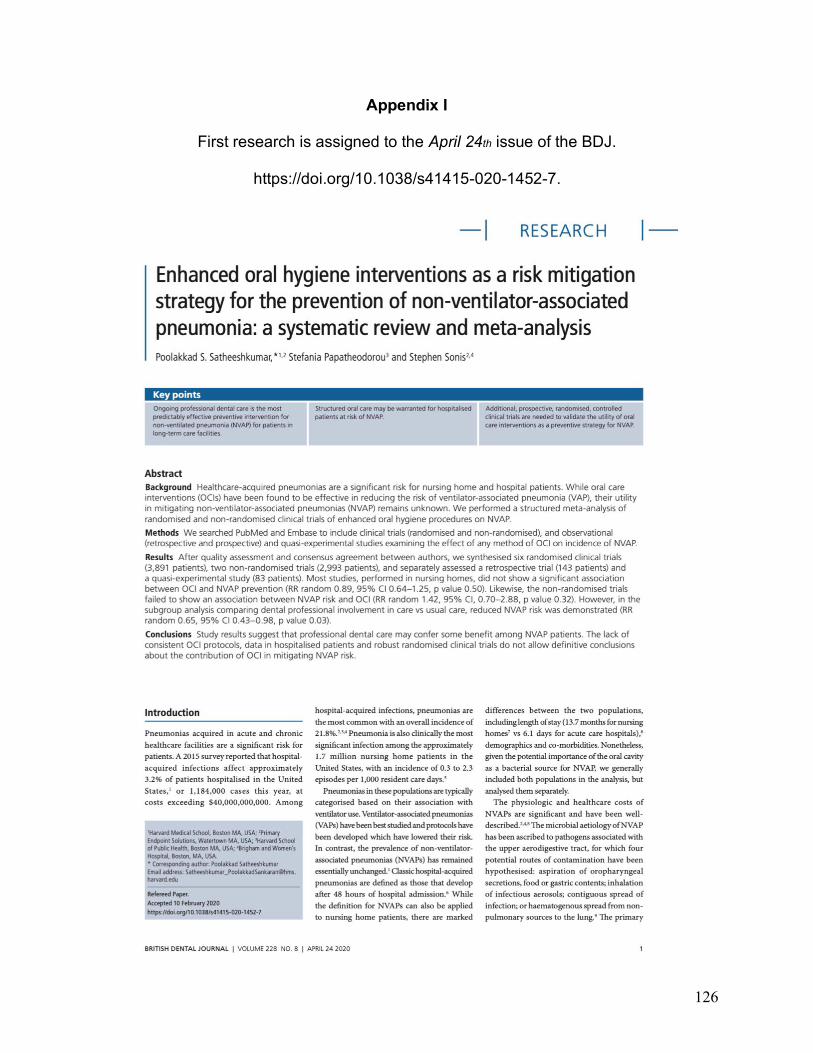
126
Appendix I
First research is assigned to the April 24th issue of the BDJ.
https://doi.org/10.1038/s41415-020-1452-7.
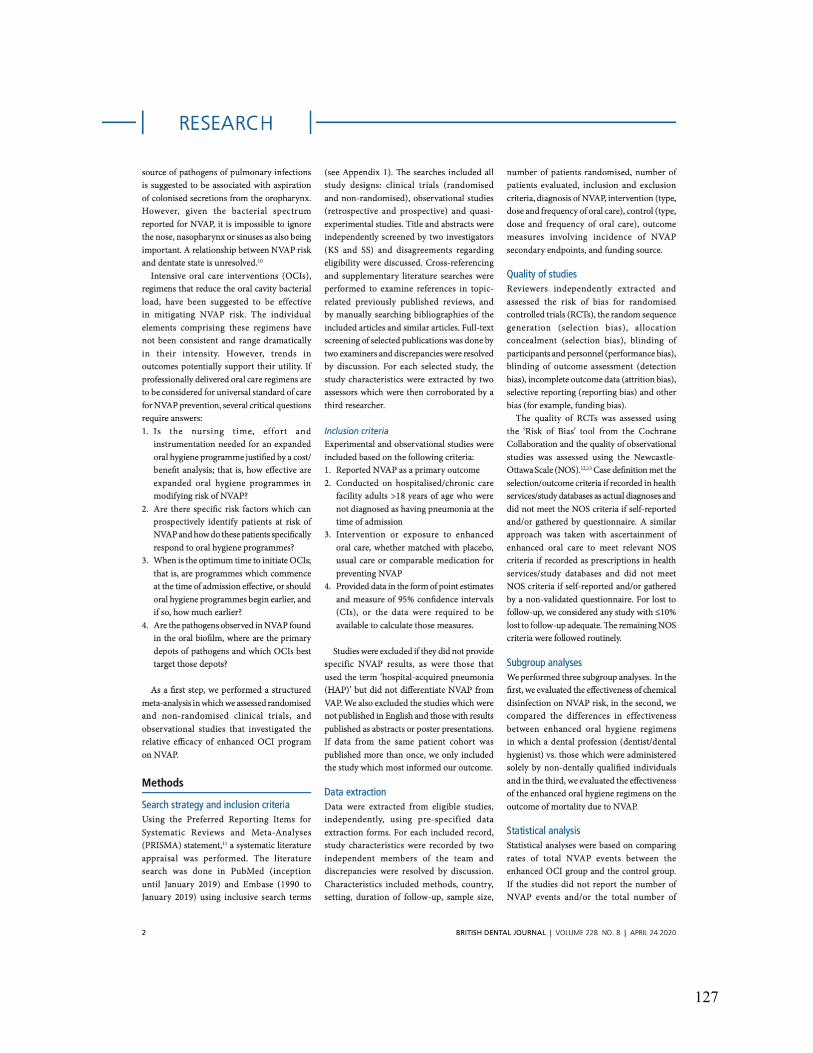
127
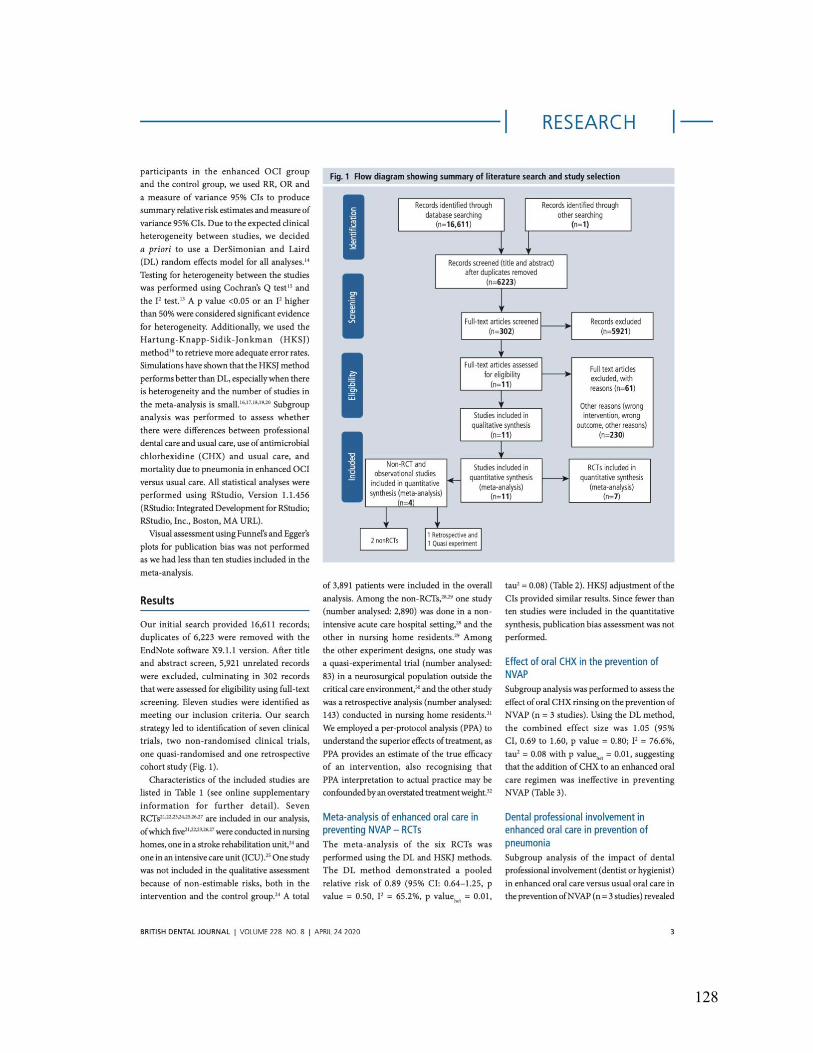
128
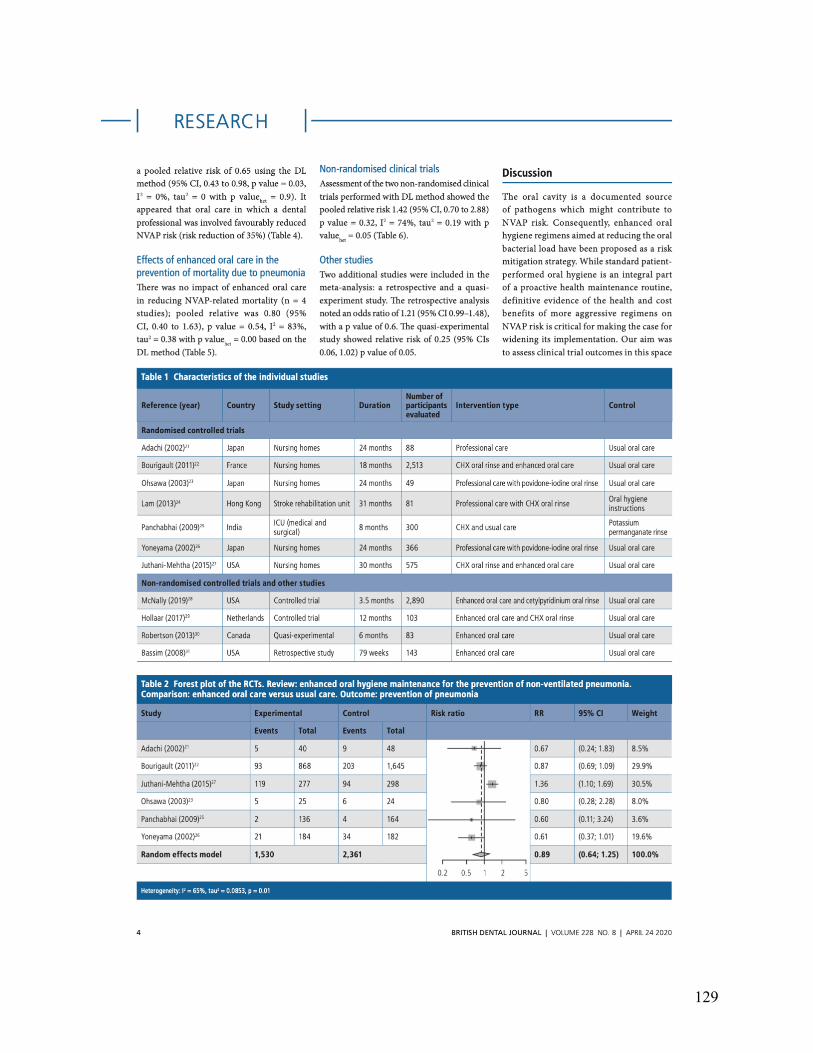
129
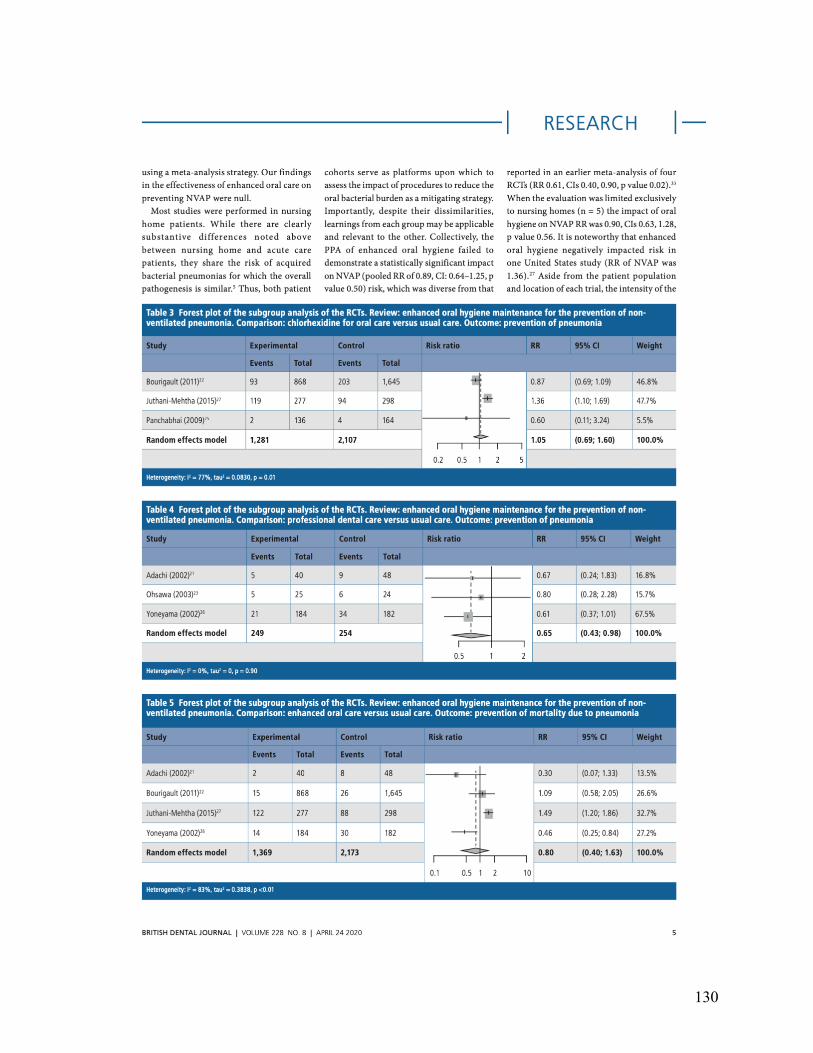
130
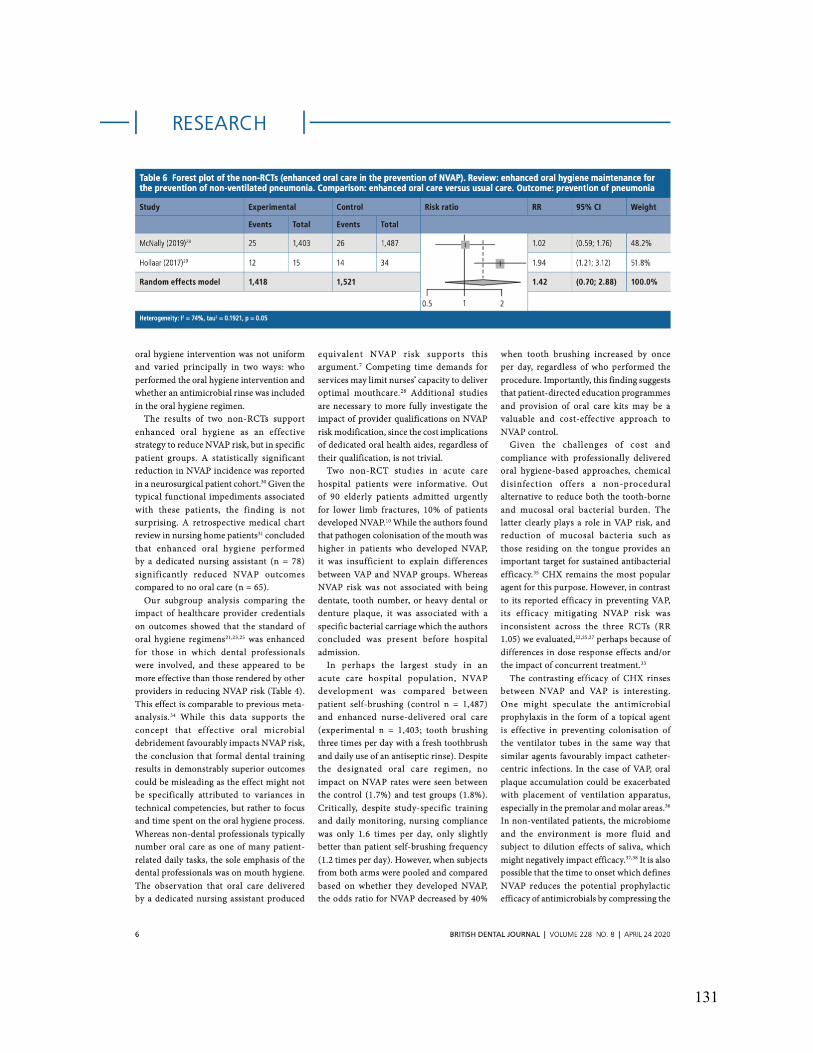
131
132
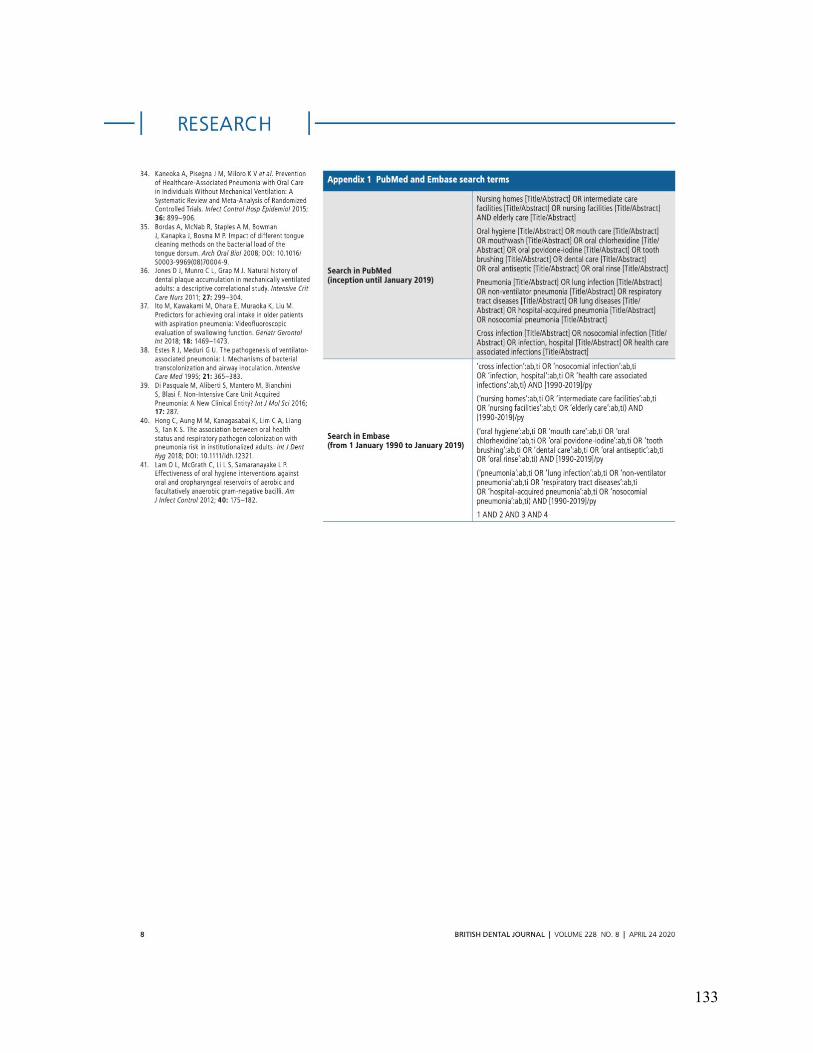
133
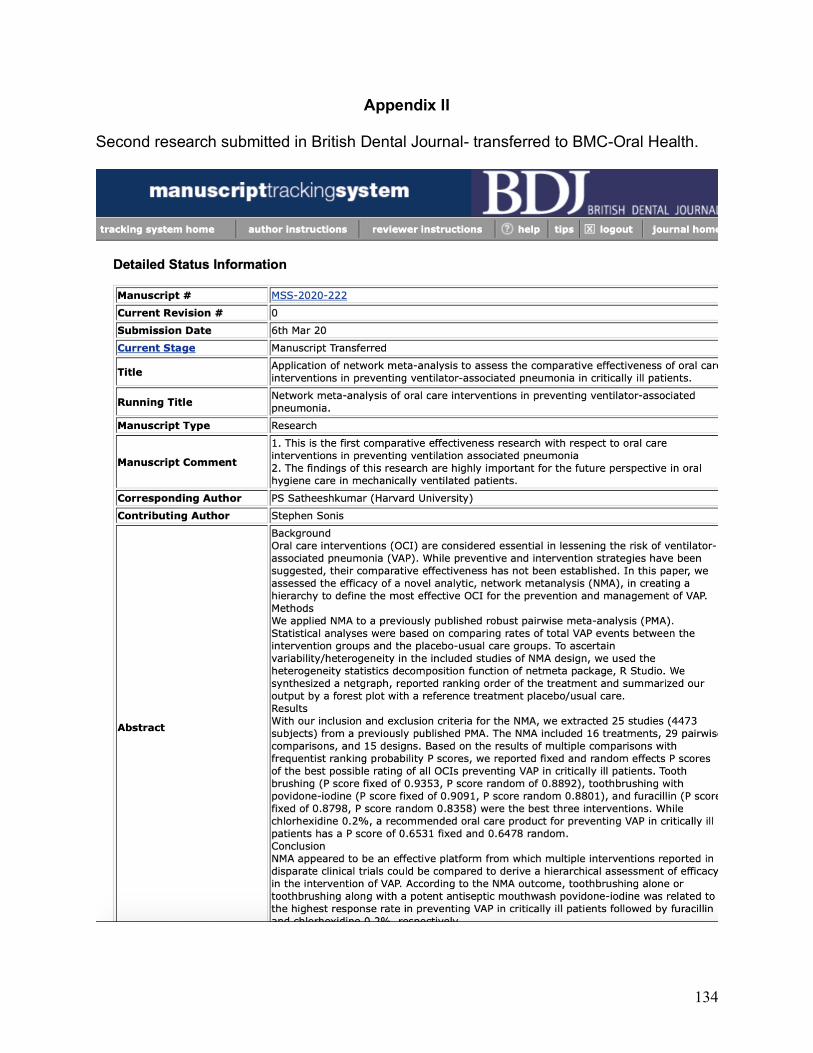
134
Appendix II
Second research submitted in British Dental Journal- transferred to BMC-Oral Health.
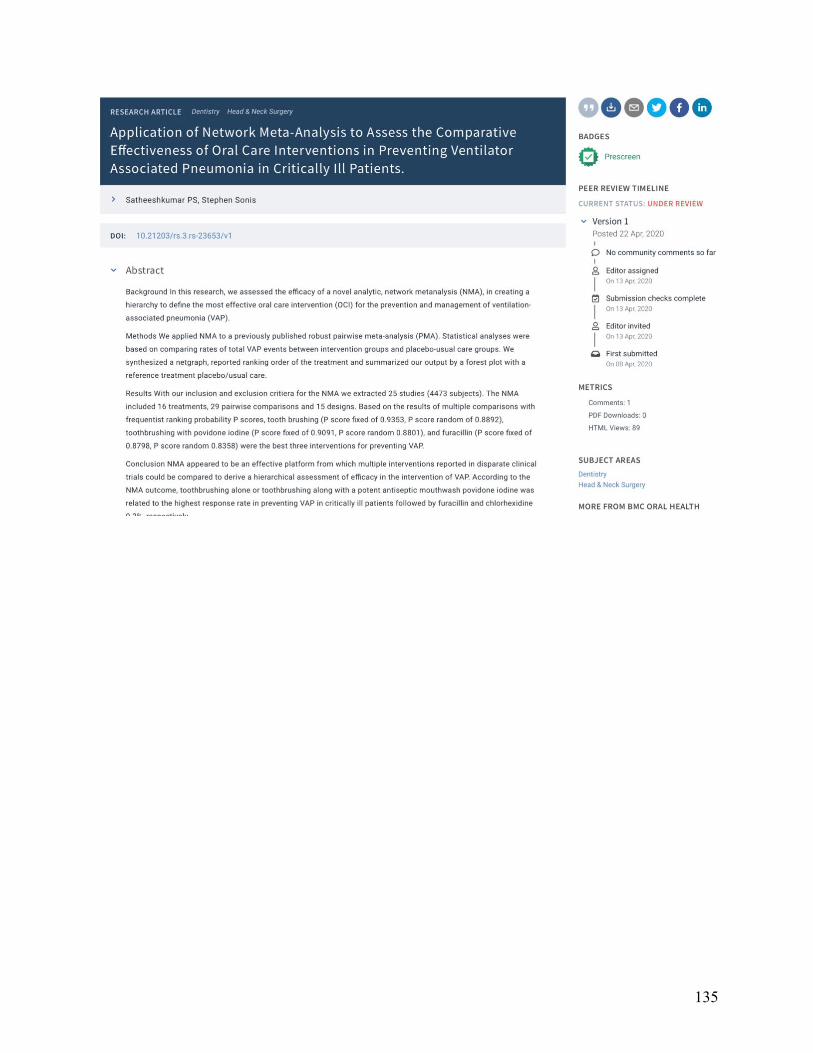
135
Related Documents