RESEARCH ARTICLE Open Access Oral cancer prognosis based on clinicopathologic and genomic markers using a hybrid of feature selection and machine learning methods Siow-Wee Chang 1,2* , Sameem Abdul-Kareem 2 , Amir Feisal Merican 1 and Rosnah Binti Zain 3 Abstract Background: Machine learning techniques are becoming useful as an alternative approach to conventional medical diagnosis or prognosis as they are good for handling noisy and incomplete data, and significant results can be attained despite a small sample size. Traditionally, clinicians make prognostic decisions based on clinicopathologic markers. However, it is not easy for the most skilful clinician to come out with an accurate prognosis by using these markers alone. Thus, there is a need to use genomic markers to improve the accuracy of prognosis. The main aim of this research is to apply a hybrid of feature selection and machine learning methods in oral cancer prognosis based on the parameters of the correlation of clinicopathologic and genomic markers. Results: In the first stage of this research, five feature selection methods have been proposed and experimented on the oral cancer prognosis dataset. In the second stage, the model with the features selected from each feature selection methods are tested on the proposed classifiers. Four types of classifiers are chosen; these are namely, ANFIS, artificial neural network, support vector machine and logistic regression. A k-fold cross-validation is implemented on all types of classifiers due to the small sample size. The hybrid model of ReliefF-GA-ANFIS with 3-input features of drink, invasion and p63 achieved the best accuracy (accuracy = 93.81%; AUC = 0.90) for the oral cancer prognosis. Conclusions: The results revealed that the prognosis is superior with the presence of both clinicopathologic and genomic markers. The selected features can be investigated further to validate the potential of becoming as significant prognostic signature in the oral cancer studies. Keywords: Oral cancer prognosis, Clinicopathologic, Genomic, Feature selection, Machine learning Background Various machine learning methods have been applied in the diagnosis or prognosis of cancer research, such as, artificial neural networks, fuzzy logic, genetic algorithm, support vector machine and other hybrid techniques [1,2]. From the medical perspective, diagnosis is to iden- tify a disease by its signs and symptoms while prognosis is to predict the outcome of the disease and the status of the patient, whether the patient will survive or recover from the disease or vice versa. In some studies, the researchers have proven that machine learning methods could generate more accurate diagnosis or prognosis as compared to traditional statistical methods [2]. Usually, clinicopathologic data or genomic data are used in researches either involving diagnosis or that with respect to prognosis. Currently, there are some researches that have shown that prognosis results are more accur- ate when using both clinicopathologic and genomic data. Examples of these are the works in [3] in diffuse large B-cell lymphoma (DLBCL) cancer, the works in [4,5] in breast cancer, [6-10] in oral cancer, and [11] in bladder cancer. However, the number of published arti- cles on researches that combine both clinicopathologic and genomic data are few as compared to that using only clinicopathologic data [2]. In the oral cancer * Correspondence: [email protected] 1 Bioinformatics and Computational Biology, Institute of Biological Science, Faculty of Science, University of Malaya, Kuala Lumpur, Malaysia 2 Department of Artificial Intelligence, Faculty of Computer Science and Information Technology, University of Malaya, Kuala Lumpur, Malaysia Full list of author information is available at the end of the article © 2013 Chang et al.; licensee BioMed Central Ltd. This is an Open Access article distributed under the terms of the Creative Commons Attribution License (http://creativecommons.org/licenses/by/2.0), which permits unrestricted use, distribution, and reproduction in any medium, provided the original work is properly cited. Chang et al. BMC Bioinformatics 2013, 14:170 http://www.biomedcentral.com/1471-2105/14/170

Welcome message from author
This document is posted to help you gain knowledge. Please leave a comment to let me know what you think about it! Share it to your friends and learn new things together.
Transcript

Chang et al. BMC Bioinformatics 2013, 14:170http://www.biomedcentral.com/1471-2105/14/170
RESEARCH ARTICLE Open Access
Oral cancer prognosis based on clinicopathologicand genomic markers using a hybrid of featureselection and machine learning methodsSiow-Wee Chang1,2*, Sameem Abdul-Kareem2, Amir Feisal Merican1 and Rosnah Binti Zain3
Abstract
Background: Machine learning techniques are becoming useful as an alternative approach to conventionalmedical diagnosis or prognosis as they are good for handling noisy and incomplete data, and significant results canbe attained despite a small sample size. Traditionally, clinicians make prognostic decisions based onclinicopathologic markers. However, it is not easy for the most skilful clinician to come out with an accurateprognosis by using these markers alone. Thus, there is a need to use genomic markers to improve the accuracy ofprognosis. The main aim of this research is to apply a hybrid of feature selection and machine learning methods inoral cancer prognosis based on the parameters of the correlation of clinicopathologic and genomic markers.
Results: In the first stage of this research, five feature selection methods have been proposed and experimentedon the oral cancer prognosis dataset. In the second stage, the model with the features selected from each featureselection methods are tested on the proposed classifiers. Four types of classifiers are chosen; these are namely,ANFIS, artificial neural network, support vector machine and logistic regression. A k-fold cross-validation isimplemented on all types of classifiers due to the small sample size. The hybrid model of ReliefF-GA-ANFIS with3-input features of drink, invasion and p63 achieved the best accuracy (accuracy = 93.81%; AUC = 0.90) for the oralcancer prognosis.
Conclusions: The results revealed that the prognosis is superior with the presence of both clinicopathologic andgenomic markers. The selected features can be investigated further to validate the potential of becoming assignificant prognostic signature in the oral cancer studies.
Keywords: Oral cancer prognosis, Clinicopathologic, Genomic, Feature selection, Machine learning
BackgroundVarious machine learning methods have been applied inthe diagnosis or prognosis of cancer research, such as,artificial neural networks, fuzzy logic, genetic algorithm,support vector machine and other hybrid techniques[1,2]. From the medical perspective, diagnosis is to iden-tify a disease by its signs and symptoms while prognosisis to predict the outcome of the disease and the status ofthe patient, whether the patient will survive or recoverfrom the disease or vice versa. In some studies, the
* Correspondence: [email protected] and Computational Biology, Institute of Biological Science,Faculty of Science, University of Malaya, Kuala Lumpur, Malaysia2Department of Artificial Intelligence, Faculty of Computer Science andInformation Technology, University of Malaya, Kuala Lumpur, MalaysiaFull list of author information is available at the end of the article
© 2013 Chang et al.; licensee BioMed CentralCommons Attribution License (http://creativecreproduction in any medium, provided the or
researchers have proven that machine learning methodscould generate more accurate diagnosis or prognosis ascompared to traditional statistical methods [2].Usually, clinicopathologic data or genomic data are
used in researches either involving diagnosis or that withrespect to prognosis. Currently, there are some researchesthat have shown that prognosis results are more accur-ate when using both clinicopathologic and genomicdata. Examples of these are the works in [3] in diffuselarge B-cell lymphoma (DLBCL) cancer, the works in[4,5] in breast cancer, [6-10] in oral cancer, and [11] inbladder cancer. However, the number of published arti-cles on researches that combine both clinicopathologicand genomic data are few as compared to that usingonly clinicopathologic data [2]. In the oral cancer
Ltd. This is an Open Access article distributed under the terms of the Creativeommons.org/licenses/by/2.0), which permits unrestricted use, distribution, andiginal work is properly cited.

Data taken from the same patients
Clinicopathologic Variables
Feature selection methods
Classification Model with k-fold cross-validation
Output
Wet-Lab
Immuno-histochemistry
staining
Analysis & Scoring
Genomic Variables of p53 and p63
Figure 1 Framework for oral cancer prognostic model.
Chang et al. BMC Bioinformatics 2013, 14:170 Page 2 of 15http://www.biomedcentral.com/1471-2105/14/170
domain, [6] used machine learning techniques in theoral cancer susceptibility studies. They proposed a hy-brid adaptive system inspired from learning classifiersystem, decision trees and statistical hypothesis testing.The dataset includes both demographic data and 11types of genes. Their results showed that the proposedalgorithm outperformed the other algorithms of NaiveBayes, C4.5, neural network and XCS (Evolution ofHolland’s Learning Classifier). However, they did notvalidate their results against the traditional statisticalmethods. [7] focused on the 5-year overall survival in agroup of oral squamous cell carcinoma (OSCC) patientsand investigated the effects of demographic data, clin-ical data and genomic data, and human papillomaviruson the prognostic outcome. They used the statisticalmethods for the prediction and their results showed thatthe 5-year overall survival was 28.6% and highlightedthe influence of p53 immunoexpression, age and ana-tomic localization on OCSS prognosis. However, in thisresearch, no machine learning methods were used andcompared. Another oral cancer research that was doneby [8,9] was in the oral cancer reoccurrence. Bayesiannetwork was used and compared with ANN, SVM,decision tree, and random forests. They used multitudeof heterogeneous data which included clinical, imaging,tissue and blood genomic data. They built a separateclassifier for different types of data and combined thebest performing classification schemes. They claimedthat they had achieved an accuracy of 100% with thecombination of all types of data and proved that theprediction accuracy was the best when using all types ofdata. However, more than 70 markers were required fortheir final combined classifier.For the genomic domain, [12] showed that p63 over
expression associates with poor prognosis in oral cancer.Their study showed that cases with diffuse p63 expres-sion were more aggressive and poorly differentiated andrelated to a poorer prognosis, these findings supportingthe use of p63 as an additional marker for diagnostic usein oral SCC. In [13], immunohistochemical analysis ofprotein expression for p53, p63 and p73 was performedfor 40 samples of well-differentiated human buccalsquamous-cell carcinomas, with 10 specimens of normalbuccal mucosa employed as controls. Their results indi-cated that both p73 and p63 may be involved in the de-velopment of human buccal squamous-cell carcinoma,perhaps in concert with p53. Similar results wereobtained by [14], they have showed that in head andneck squamous carcinomas (HNSC), p63 was the mostfrequently expressed (94.7%), followed by p73 (68.4%)and p53 (52.6%). Their study indicated that p63 and p73expression may represent an early event in HNSCtumorigenesis and p73 and p63 may function as onco-genes in the development of these tumors.
In this research, an oral cancer prognostic model isdeveloped. This research used real-world oral cancerdataset which is collected locally at the Oral CancerResearch and Coordinating Centre (OCRCC), Faculty ofDentistry, University of Malaya, Malaysia. The modeltakes both clinicopathologic and genomic data in orderto investigate the impact of each marker or combinationof markers to the accuracy of the prognosis of oralcancer. Five feature selection methods are proposed withthe objectives to reduce the number of input variables toavoid over-fitting and to find out an optimum featuresubset for oral cancer prognosis. This is followed by theclassification procedures which are used to classify thestatus of the patient after 1–3 years of diagnosis (alive ordead). Four classification methods, from both machinelearning and statistical methods, are tested and com-pared. The objective of this research is to prove that theprognosis is better by using both types of clinicopatho-logic and genomic markers, and to identify the keymarkers for oral cancer prognosis using the hybrid offeature selection and machine learning methods.
MethodsThe framework for the oral cancer prognostic model isshown in Figure 1. Clinicopathologic variables from theOCRCC database and genomic variables from Immuno-histochemistry (IHC) staining are fed into the model.Basically, there are three main parts for the oral cancerprognostic model, which are wet-laboratory testing for

Table 2 Description and membership function forclinicopathologic and genomic variables
(a) Clinicopathologic variables
Name Description Name & parameters ofmembership function
Age Age at diagnosis 1 - 40–50, 2 - >50-60, 3 - >60-70,4 - >70
Eth Ethnicity 1 - Malay, 2 - Chinese, 3 - Indian
Gen Gender 1 - Male, 2 - Female
Smoke Smoking habit 1 - Yes, 2 - No
Drink Alcohol drinking habit 1 - Yes, 2 - No
Chew Quid chewing habit 1 - Yes, 2 - No
Site Primary site of tumor 1 - Buccal mucosa, 2 - tongue
3 - floor, 4 - others
Subtype Subtype anddifferentiation for SCC
1 - Well differentiated
2 - moderate differentiated
3 - poorly differentiated
Inv Depth of Invasion front 1 - Non-cohesive, 2 - cohesive
Node Neck nodes 1 - Negative, 2 - positive
PT Pathological tumorstaging
1 - T1, 2 - T2, 3 - T3, 4 - T4
PN Pathological lymphnodes
1 - N0, 2- N1, 3- N2A, 4- N2B
Stage Overall stage 1 - I, 2 - II, 3 - III, 4 - IV
Size Size of tumor 1 - 0-2 cm, 2 - >2-4 cm,3 - >4-6 cm, 4 - >6 cm
Treat Type of treatment 1 - Surgery only
2 - Surgery + Radiotherapy
3 - Surgery + Chemotherapy
(b) Genomic variables
Name Description Name and parameters ofmembership function
p53 Tumor suppressor gene 1 - negative, 2 - positive
p63 Tumor suppressor gene 1 - negative, 2 - positive
Chang et al. BMC Bioinformatics 2013, 14:170 Page 3 of 15http://www.biomedcentral.com/1471-2105/14/170
genomic variables, feature selection methods and theclassification models. This research was approved byMedical Ethics Committee, Faculty of Dentistry, Univer-sity of Malaya.
Clinicopathologic dataA total of 31 oral cancer cases were selected from theMalaysian Oral Cancer Database and Tissue Bank System(MOCDTBS) coordinated by the Oral Cancer Researchand Coordinating Centre (OCRCC), Faculty of Dentistry,University of Malaya. The selection was based on thecompleteness of the clinicopathologic data, the availabilityof tissues and the availability of data (some data were notavailable for use due to medical confidentiality problems).The selected cases were based on the oral cancer cases
seen in the Faculty of Dentistry, University of Malaya andHospital Tunku Ampuan Rahimah, Klang, a Malaysiangovernment hospital, from the year 2003 to 2007. Thesecases were diagnosed and followed up and the data wererecorded in the standardised forms prepared by theMOCDTBS. Later, MOCDTBS transcribed all the datafrom paper to an electronic version and stored in the data-base. All the cases selected were diagnosed as squamouscell carcinomas (SCC). Table 1 shows the 1 to 3-year sur-vival for these 31 cases.Basically, three types of data are available for each oral
cancer case, namely, social demographic data (risk factors,ethnicity, age, occupation, marital status and others), clin-ical data (type of lesion, size of lesion, primary site, clinicalneck node and etc.), and pathological data (pathologicalTNM, neck node metastasis, bone invasion, tumour thick-ness and etc.). Pathological data were obtained from thebiopsy reports before and after surgical procedures. In thisresearch, we referred to the clinical and pathological dataas clinicopathologic data. Based on the discussions withtwo oral cancer clinicians, Prof. Rosnah Binti Zain andDr Thomas George Kallarakkal, 15 key variables hadbeen identified as important prognostic factors of oralcancer. The selected clinicopathologic variables arelisted in Table 2(a).
Table 1 1-year, 2-year and 3-year survival
Duration of follow-up Survival No %
1-year Survive 27 87.1
Dead 4 12.9
Lost of follow-up 0 0.0
2-year Survive 19 61.3
Dead 10 32.3
Lost of follow-up 2 6.5
3-year Survive 17 54.8
Dead 11 38.7
Lost of follow-up 3 9.7
Genomic dataTwo genomic variables had been identified through theliterature studies and discussions with oral pathologists,from the Department of Oral Pathology and Oral Medi-cine and Periodontology, Faculty of Dentistry, Universityof Malaya. Both of these variables are tumour suppressorgenes, namely, p53 and p63. p53 is the most frequentlyassociated marker in the head and neck cancers [7,15].p53 is called the “Guardian of the genome”, it is import-ant in maintaining genomic stability, progression of cellcycle, cellular differentiation, DNA repair and apoptosis.It is difficult to demonstrate p53 protein in normaltissues using immunohistochemistry procedures due toits high catabolic rate; however mutated p53 exhibits amuch lower catabolic rate and accumulates in the cells[15]. In addition, p63 gene, a homolog of the p53 is
Simple randomization
Five tumor representative areas are selected
Count the percentage of positive cells for each area and calculate the average of five areas.
Negative <10% positive nuclear stained
Positive>10% positive
nuclear stained
1
6
11
16
7
2
12
17
3
8
13
18
4
9
14
19
5
10
15
20
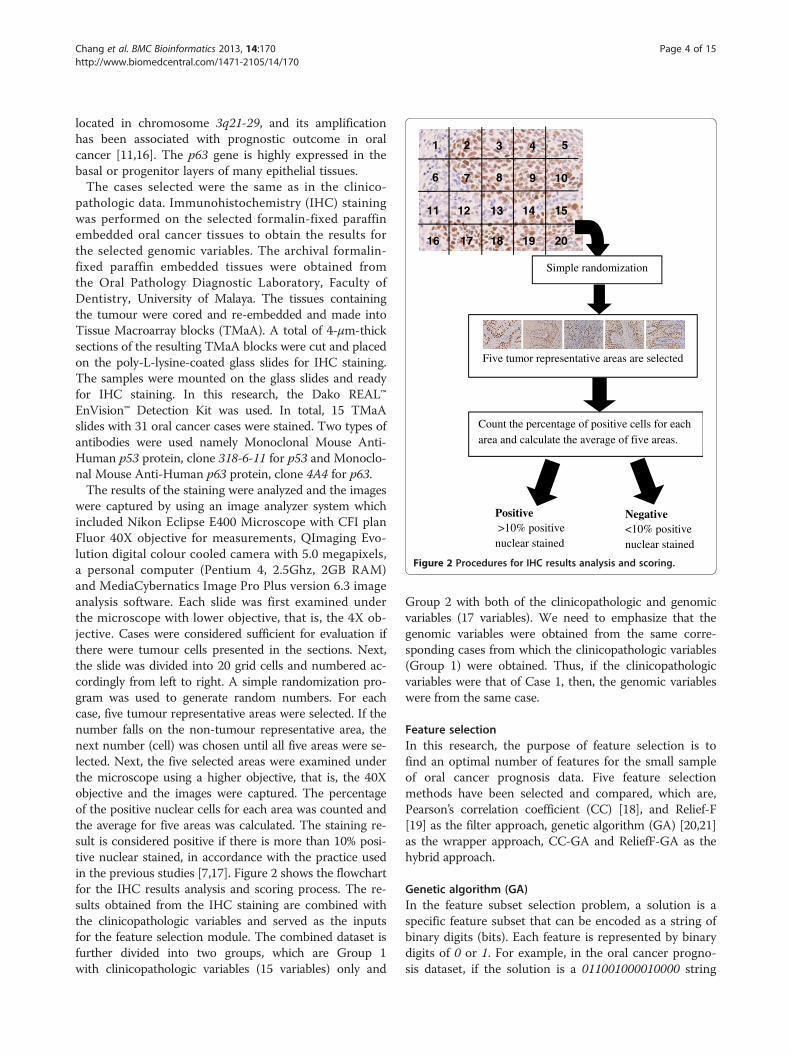
Figure 2 Procedures for IHC results analysis and scoring.
Chang et al. BMC Bioinformatics 2013, 14:170 Page 4 of 15http://www.biomedcentral.com/1471-2105/14/170
located in chromosome 3q21-29, and its amplificationhas been associated with prognostic outcome in oralcancer [11,16]. The p63 gene is highly expressed in thebasal or progenitor layers of many epithelial tissues.The cases selected were the same as in the clinico-
pathologic data. Immunohistochemistry (IHC) stainingwas performed on the selected formalin-fixed paraffinembedded oral cancer tissues to obtain the results forthe selected genomic variables. The archival formalin-fixed paraffin embedded tissues were obtained fromthe Oral Pathology Diagnostic Laboratory, Faculty ofDentistry, University of Malaya. The tissues containingthe tumour were cored and re-embedded and made intoTissue Macroarray blocks (TMaA). A total of 4-μm-thicksections of the resulting TMaA blocks were cut and placedon the poly-L-lysine-coated glass slides for IHC staining.The samples were mounted on the glass slides and readyfor IHC staining. In this research, the Dako REAL™EnVision™ Detection Kit was used. In total, 15 TMaAslides with 31 oral cancer cases were stained. Two types ofantibodies were used namely Monoclonal Mouse Anti-Human p53 protein, clone 318-6-11 for p53 and Monoclo-nal Mouse Anti-Human p63 protein, clone 4A4 for p63.The results of the staining were analyzed and the images
were captured by using an image analyzer system whichincluded Nikon Eclipse E400 Microscope with CFI planFluor 40X objective for measurements, QImaging Evo-lution digital colour cooled camera with 5.0 megapixels,a personal computer (Pentium 4, 2.5Ghz, 2GB RAM)and MediaCybernatics Image Pro Plus version 6.3 imageanalysis software. Each slide was first examined underthe microscope with lower objective, that is, the 4X ob-jective. Cases were considered sufficient for evaluation ifthere were tumour cells presented in the sections. Next,the slide was divided into 20 grid cells and numbered ac-cordingly from left to right. A simple randomization pro-gram was used to generate random numbers. For eachcase, five tumour representative areas were selected. If thenumber falls on the non-tumour representative area, thenext number (cell) was chosen until all five areas were se-lected. Next, the five selected areas were examined underthe microscope using a higher objective, that is, the 40Xobjective and the images were captured. The percentageof the positive nuclear cells for each area was counted andthe average for five areas was calculated. The staining re-sult is considered positive if there is more than 10% posi-tive nuclear stained, in accordance with the practice usedin the previous studies [7,17]. Figure 2 shows the flowchartfor the IHC results analysis and scoring process. The re-sults obtained from the IHC staining are combined withthe clinicopathologic variables and served as the inputsfor the feature selection module. The combined dataset isfurther divided into two groups, which are Group 1with clinicopathologic variables (15 variables) only and
Group 2 with both of the clinicopathologic and genomicvariables (17 variables). We need to emphasize that thegenomic variables were obtained from the same corre-sponding cases from which the clinicopathologic variables(Group 1) were obtained. Thus, if the clinicopathologicvariables were that of Case 1, then, the genomic variableswere from the same case.
Feature selectionIn this research, the purpose of feature selection is tofind an optimal number of features for the small sampleof oral cancer prognosis data. Five feature selectionmethods have been selected and compared, which are,Pearson’s correlation coefficient (CC) [18], and Relief-F[19] as the filter approach, genetic algorithm (GA) [20,21]as the wrapper approach, CC-GA and ReliefF-GA as thehybrid approach.
Genetic algorithm (GA)In the feature subset selection problem, a solution is aspecific feature subset that can be encoded as a string ofbinary digits (bits). Each feature is represented by binarydigits of 0 or 1. For example, in the oral cancer progno-sis dataset, if the solution is a 011001000010000 string

Selection Roulette wheelCrossover Scattered. Crossover fraction = 0.5Mutation Uniform. Mutation rate = 0.30Stopping Criteria
Number of generation = 100 orTime limit = 600s whichever occur first
Yes
Oral Cancer Prognosis
Fitness function for each individual(Error rate using 5-fold cross-validation)
Initial population with n-input
Crossover operation
Selection operation
Stopping criteria
with different variables
Mutation operation
Fitness function for each solution(Error rate using 5-fold cross-validation)
Best solution for n-input
start
End
Yes
No
No
Figure 3 Genetic algorithm feature selection flowchart.
Chang et al. BMC Bioinformatics 2013, 14:170 Page 5 of 15http://www.biomedcentral.com/1471-2105/14/170
of 15 binary digits, it indicates that features 2, 3, 6, and11 are selected as the feature subset [21]. The initialpopulation is generated randomly to select a subset ofvariables. In this proposed GA feature selection method,if the features are all different, the subset is included inthe initial population. If not, it is regenerated until aninitial population with the desired size for the featuresubset (n-input model) is created.The fitness function used in this method is a classifier
to discriminate between two groups, which are alive anddead after 3-year of diagnosis. The mean square errorrate of the classification is calculated using a 5-foldcross-validation. The fitness function is the final meansquare error rate obtained. The subset of variables withthe lowest error rate is selected. Figure 3 shows the flow-chart and the criteria used for the GA feature selectionapproach.
Pearson’s correlation coefficient (CC)Pearson’s correlation coefficient, r, is use to see if thevalues of two variables are associated. In this research, ris calculated and ranked for each of the feature inputand the one with the highest r is selected. For example,for the 3-input model, the top three inputs with thehighest r value are selected. This is repeated for the n-input models for both Group 1 and Group 2.
Relief-FRelief-F is the extension to the original Relief algorithm,which is able to deal with noisy and incomplete datasetsas well as multi-class problems. The key idea of Relief isto estimate attributes according to how well their valuesdistinguish among instances that are near to each other[18]. In this research, each feature input is ranked andweighted using the k-nearest neighbours classification, inwhich k = 1. The top features with large positive weightsare selected for both groups of dataset.
Pearson’s correlation coefficient and genetic algorithm(CC-GA)This is the hybrid feature selection approach which con-sists of two stages: first, it is a filter approach which cal-culates the correlation coefficient, r, and second, it is awrapper approach of GA. In the first stage, 10 featureswith the highest r are selected and fed into the secondstage of the GA approach. The procedures of the GA arethe same as that described in the previous section.
Relief-F and genetic algorithm (ReliefF-GA)This hybrid feature selection approach consists of twostages: first, it is the filter approach of Relief-F, and sec-ond, it is a wrapper approach of GA. In the first stage,10 features with the highest weights are selected and fed
into the second stage of the GA approach. In the secondstage, n-input is selected for both Group 1 and Group 2.
Selection of n-input modelsBefore the implementation of the feature selectionmethod, a simple GA was run to find out the optimalnumber of inputs (n-input model) from the 17 inputs ofclinicopathologic and genomic data. The number ofinputs with lower mean square error rate was chosen.

Table 3 Mean square error rate for n-input model
Group 1 Group 2
1-input 0.3881 0.3626
2-input 0.4193 0.2903
3-input 0.3871 0.2581
4-input 0.3871 0.2903
5-input 0.3871 0.3226
6-input 0.3871 0.3548
7-input 0.4571 0.3548
8-input 0.4839 0.4194
9-input 0.5161 0.4516
Chang et al. BMC Bioinformatics 2013, 14:170 Page 6 of 15http://www.biomedcentral.com/1471-2105/14/170
The error rate for each n-input model is shown inTable 3, which shows that for Group 1, there are fourmodels with the lowest error rate of 0.3871, which arethe 3-input, 4-input, 5-input, and 6-input model. Mean-while, for Group 2, the model with the lowest error rateis the 3-input model with an error rate of 0.2581. In thiscase, for comparison purposes, the number of inputsbetween 3-input to 7-input are chosen. Hence n is set asn = 3, 4, 5, 6, 7 for the feature selection methods.
ClassificationNext, the data with n selected features are fed into theclassification models. The final output is the classifica-tion accuracy for oral cancer prognosis, which classifiesthe patients as alive or dead after subsequent years ofdiagnosis with the optimum feature of subset. Four clas-sification methods were experimented with and their
Inv
p63
PN
Non-cohesive
Cohesive
Positive
Negative
N0
N1
N2A
N2B
Inv
p63
PN
Non-cohesive
Cohesive
Positive
Negative
N0
N1
N2A
N2B
Figure 4 ANFIS rules for a 3-input model.
results were subsequently compared, these are ANFIS,artificial neural network (ANN), support vector machineand logistic regression.In order to obtain accurate estimate results, cross-
validation (CV) was used. CV provides an unbiased esti-mation, however CV presents high variance with smallsamples in some studies [22]. In this research, a 5-foldcross-validation was implemented with each of theclassifiers. 5-fold cross-validation was chosen over thecommonly use 10-fold cross-validation due to the smallsample size; hence, it will leave more instances for valid-ation and has lower variance [23]. In 5-fold cross-validation, the 31 samples of oral cancer prognosis datawere divided into 5 subsets of equal size and trained for5 times, each time leaving out a sample as validationdata.
Adaptive neuro-fuzzy inference system (ANFIS)ANFIS implements the Takagi-Sugeno fuzzy inferencesystem. The details for ANFIS can be found in [24,25]respectively.In the input layer, the number of input is defined by n,
with n = 3, 4, 5, 6, 7. In the input membership (inputmf)layer, the number of membership function is defined bymi, with i = 2, 3, 4. The rules generated are based on thenumber of input and the number of input membershipfunctions, and it is represented as (m2
n1 x m3n2 x m4
n3)rules, in which n1, n2, and n3 represent the number ofinput with mi membership functions respectively, andn1 + n2 + n3 = n. For example, in the ANFIS with 3-input,x, y, and z, in which input x has 2 membership func-tions, input y has 2 membership functions, and input zhas 4 membership functions, hence the number of rules
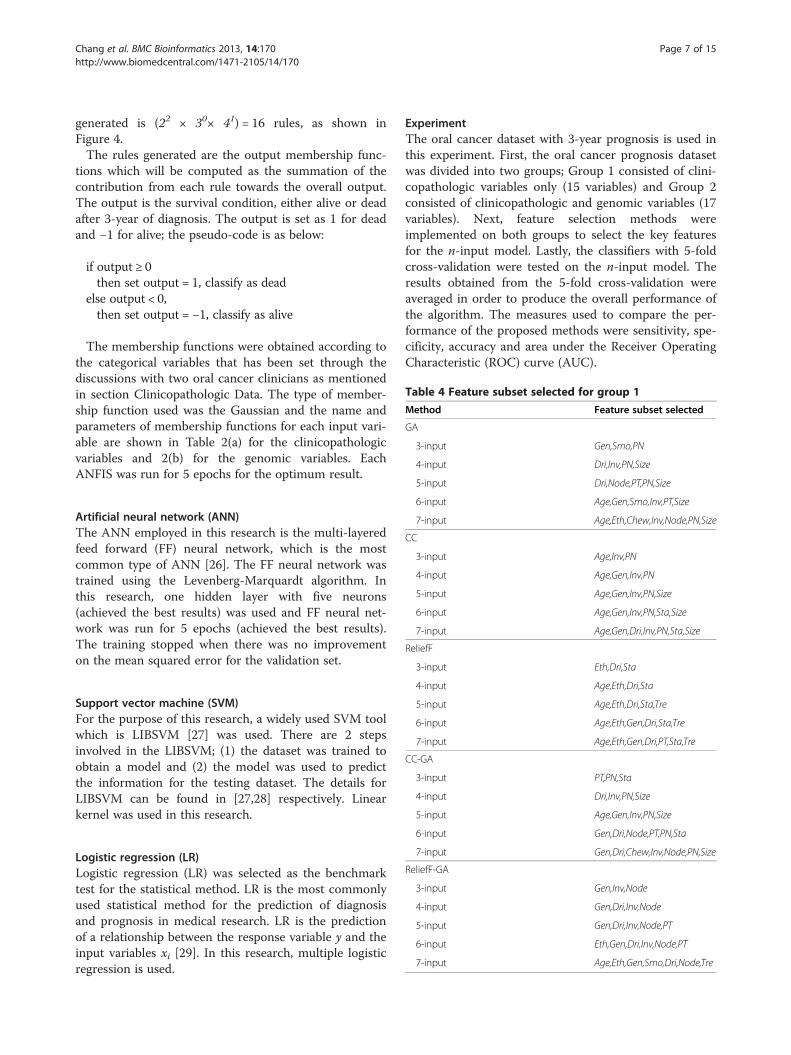
Table 4 Feature subset selected for group 1
Method Feature subset selected
GA
3-input Gen,Smo,PN
4-input Dri,Inv,PN,Size
Chang et al. BMC Bioinformatics 2013, 14:170 Page 7 of 15http://www.biomedcentral.com/1471-2105/14/170
generated is (22 × 30× 41) = 16 rules, as shown inFigure 4.The rules generated are the output membership func-
tions which will be computed as the summation of thecontribution from each rule towards the overall output.The output is the survival condition, either alive or deadafter 3-year of diagnosis. The output is set as 1 for deadand −1 for alive; the pseudo-code is as below:
if output ≥ 0then set output = 1, classify as dead
else output < 0,then set output = −1, classify as alive
The membership functions were obtained according tothe categorical variables that has been set through thediscussions with two oral cancer clinicians as mentionedin section Clinicopathologic Data. The type of member-ship function used was the Gaussian and the name andparameters of membership functions for each input vari-able are shown in Table 2(a) for the clinicopathologicvariables and 2(b) for the genomic variables. EachANFIS was run for 5 epochs for the optimum result.
5-input Dri,Node,PT,PN,Size
6-input Age,Gen,Smo,Inv,PT,Size
7-input Age,Eth,Chew,Inv,Node,PN,Size
CC
3-input Age,Inv,PN
4-input Age,Gen,Inv,PN
5-input Age,Gen,Inv,PN,Size
6-input Age,Gen,Inv,PN,Sta,Size
7-input Age,Gen,Dri,Inv,PN,Sta,Size
ReliefF
3-input Eth,Dri,Sta
Artificial neural network (ANN)The ANN employed in this research is the multi-layeredfeed forward (FF) neural network, which is the mostcommon type of ANN [26]. The FF neural network wastrained using the Levenberg-Marquardt algorithm. Inthis research, one hidden layer with five neurons(achieved the best results) was used and FF neural net-work was run for 5 epochs (achieved the best results).The training stopped when there was no improvementon the mean squared error for the validation set.
4-input Age,Eth,Dri,Sta
5-input Age,Eth,Dri,Sta,Tre
6-input Age,Eth,Gen,Dri,Sta,Tre
7-input Age,Eth,Gen,Dri,PT,Sta,Tre
CC-GA
3-input PT,PN,Sta
4-input Dri,Inv,PN,Size
5-input Age,Gen,Inv,PN,Size
Support vector machine (SVM)For the purpose of this research, a widely used SVM toolwhich is LIBSVM [27] was used. There are 2 stepsinvolved in the LIBSVM; (1) the dataset was trained toobtain a model and (2) the model was used to predictthe information for the testing dataset. The details forLIBSVM can be found in [27,28] respectively. Linearkernel was used in this research.
6-input Gen,Dri,Node,PT,PN,Sta
7-input Gen,Dri,Chew,Inv,Node,PN,Size
ReliefF-GA
3-input Gen,Inv,Node
4-input Gen,Dri,Inv,Node
5-input Gen,Dri,Inv,Node,PT
6-input Eth,Gen,Dri,Inv,Node,PT
7-input Age,Eth,Gen,Smo,Dri,Node,Tre
Logistic regression (LR)Logistic regression (LR) was selected as the benchmarktest for the statistical method. LR is the most commonlyused statistical method for the prediction of diagnosisand prognosis in medical research. LR is the predictionof a relationship between the response variable y and theinput variables xi [29]. In this research, multiple logisticregression is used.
ExperimentThe oral cancer dataset with 3-year prognosis is used inthis experiment. First, the oral cancer prognosis datasetwas divided into two groups; Group 1 consisted of clini-copathologic variables only (15 variables) and Group 2consisted of clinicopathologic and genomic variables (17variables). Next, feature selection methods wereimplemented on both groups to select the key featuresfor the n-input model. Lastly, the classifiers with 5-foldcross-validation were tested on the n-input model. Theresults obtained from the 5-fold cross-validation wereaveraged in order to produce the overall performance ofthe algorithm. The measures used to compare the per-formance of the proposed methods were sensitivity, spe-cificity, accuracy and area under the Receiver OperatingCharacteristic (ROC) curve (AUC).

Chang et al. BMC Bioinformatics 2013, 14:170 Page 8 of 15http://www.biomedcentral.com/1471-2105/14/170
ResultsGroup 1 (clinicopathologic variables)Table 4 shows the features selected for the proposed fea-ture selection methods for Group 1. Next, the n-inputmodels generated from each feature selection methodswere tested with the proposed classification methods.Table 5 shows the classification results for ANFIS, ANN,SVM and LR.From Table 5, it can be seen that ANFIS with the CC-4
-input model, obtained the best accuracy of 74.76% and anAUC of 0.70. For the ANN results, the model with thehighest accuracy is the ReliefF-GA-5-input model with anaccuracy of 56.76% and an AUC of 0.58. Whereas, for theSVM classifier, the models with the best accuracy areReliefF-GA-3-input to 6-input models with an accuracy of64.29% and an AUC of 0.50. As for LR classification, thebest model is the CC-GA-6-input model with an accuracyof 70.95% and an AUC of 0.72. The results obtained fromboth ANN and SVM showed low accuracy (56.76% &64.29% respectively) and low AUC (0.58 and 0.50 respect-ively), hence, indicated that these two are not the suitableclassifiers to use for Group 1.
Table 5 Classification accuracy and AUC for group 1
Featureselection
3-input 4-input
% AUC % AUC
ANFIS
GA 70.95 0.66 67.42 0.61
CC 58.10 0.53 74.76 0.70
ReliefF 61.43 0.53 50.59 0.50
CC-GA 44.76 0.44 67.62 0.57
ReliefF-GA 67.14 0.55 60.48 0.59
ANN
GA 45.52 0.53 52.43 0.53
CC 54.48 0.61 53.57 0.59
ReliefF 51.52 0.48 41.62 0.47
CC-GA 49.24 0.51 49.48 0.52
ReliefF-GA 50.24 0.55 52.86 0.59
SVM
GA 60.95 0.53 61.43 0.51
CC 60.95 0.53 60.95 0.53
ReliefF 54.29 0.44 50.95 0.42
CC-GA 63.81 0.55 61.43 0.51
ReliefF-GA 64.29 0.50 64.29 0.50
LR
GA 64.29 0.56 67.62 0.60
CC 64.29 0.56 60.48 0.57
ReliefF 50.59 0.44 50.59 0.44
CC-GA 67.62 0.57 67.62 0.60
ReliefF-GA 54.29 0.54 51.43 0.52
Group 2 (clinicopathologic and genomic variables)The same experiments were carried out on Group 2,which is the combination of clinicopathologic and gen-omic variables. The selected features for each n-inputmodel are listed in Table 6. Table 6 shows that almost allthe feature selection methods included the genomicvariable as one of the key features, except for theReliefF-3-input and ReliefF-4-input.For Group 2 using the ANFIS classification (Table 7),
there are five models with an accuracy of above 70%,these are namely, GA-3-input, CC-GA-3-input, CC-GA-4-input, ReliefF-GA-3-input and ReliefF-GA-4-input.The best results were obtained from the ReliefF-GA-3-input and ReliefF-GA-4-input with an accuracy of93.81% and an AUC of 0.90 and the features selected forthe ReliefF-GA-3-input are drink, invasion, and p63while the features selected for the ReliefF-GA-4-inputare drink, invasion, treatment and p63 (refer Table 6).As shown in Table 7, the FF neural network together
with the ReliefF-GA-3-input model achieved the best re-sult with an accuracy of 84.62% and an AUC of 0.83. ForSVM classification, the classification results are generally
5-input 6-input 7-input
% AUC % AUC % AUC
64.76 0.63 58.57 0.55 57.62 0.54
51.43 0.43 57.62 0.50 64.29 0.58
58.10 0.50 64.29 0.54 64.29 0.54
63.81 0.55 64.29 0.54 57.62 0.52
67.62 0.59 51.90 0.47 64.76 0.57
45.05 0.47 48.38 0.52 45.33 0.50
51.29 0.58 51.29 0.51 52.33 0.53
46.05 0.49 46.05 0.48 44.10 0.48
46.67 0.49 48.29 0.49 50.48 0.51
56.76 0.58 47.00 0.51 50.05 0.54
58.10 0.48 58.10 0.46 61.43 0.49
58.10 0.46 51.43 0.41 51.43 0.41
51.43 0.42 48.10 0.40 50.95 0.45
58.10 0.46 58.10 0.48 58.10 0.49
64.29 0.50 64.29 0.50 54.76 0.46
64.76 0.55 68.10 0.64 64.29 0.60
67.62 0.61 67.62 0.61 64.29 0.58
48.10 0.39 41.43 0.34 44.29 0.39
61.43 0.51 70.95 0.72 64.76 0.67
61.43 0.62 47.62 0.55 48.10 0.51

Table 6 Feature subset selected for group 2
Method Feature subset selected
GA
3-input Inv,Node,p63
4-input Gen,Inv,Size,p53
5-input Age,PT,PN,Size,p53
6-input Age,PT,PN,Size,Tre,p53
7-input Age,Eth,Smo,PT,PN,Size,p53
CC
3-input Inv,PN,p63
4-input Age,Inv,PN,p63
5-input Age,Gen,Inv,PN,p63
6-input Age,Gen,Inv,PN,Size,p63
7-input Age,Gen,Inv,PN,Size,p53,p63
ReliefF
3-input Age,Eth,Dri
4-input Age,Eth,Dri,Tre
5-input Age,Eth,Dri,Tre,p53
6-input Age,Eth,Dri,Tre,p53,p63
7-input Age,Eth,Gen,Dri,Tre,p53,p63
CC-GA
3-input Inv,Node,p63
4-input Gen,Inv,Size,p53
5-input Age,Dri,PN,Size,p53
6-input Gen,Inv,Node,PN,Size,p53
7-input Gen,Dri,Inv,Node,PN,Size,p53
ReliefF-GA
3-input Dri,Inv,p63
4-input Dri,Inv,Tre,p63
5-input Age,Gen,Smo,Dri,p63
6-input Age,Gen,Smo,Dri,Inv,p63
7-input Age,Eth,Inv,Sta,Tre,p53,p63
Chang et al. BMC Bioinformatics 2013, 14:170 Page 9 of 15http://www.biomedcentral.com/1471-2105/14/170
better in Group 2 when compared to Group 1 (Table 5)with some exceptions (GA-3-input, GA-7-input, CC-GA-4-input, ReliefF-5-input and ReliefF-7-input). Thebest accuracy in Group 2 is obtained by the GA-3-input,CC-GA-3-input, ReliefF-GA-3-input, and ReliefF-GA-5-input with an accuracy of 74.76% and an AUC of 0.70.Whereas, for LR classification in Group 2, GA-3-input,CC-GA-3-input, ReliefF-GA-3-input and ReliefF-GA-4-input achieved the best classification accuracy of 74.76%and an AUC of 0.70.
Comparison of the results for group 1 and group 2This section discusses and compares the results gener-ated from different classification methods for bothGroup 1 and Group 2. Table 8 summarizes the bestaccuracy for the n-input model based on the feature
selection method for Group 1 and Group 2. The sum-mary is also depicted in the graph as shown in Figure 5and Figure 6 respectively.For Group 1 (Figure 5), the correlation coefficient
(CC) feature selection method performed better than theother methods with the highest accuracy of 74.76% inthe 4-input model. There are three models that achievedaccuracies of above 70%; the other two are GA-3-inputand CC-GA-6-input. ReliefF feature selection methodobtained the worst results when compared to the othermethodsAs regards to Group 2 (Figure 6), the ReliefF-GA fea-
ture selection method outperformed the others in all then-input models, with the highest accuracy of 93.81%.There are ten models with accuracies above 70% asshown in Table 8; this confirms that Group 2 whichincludes genomic variables achieved higher accuracywith feature selection methods. In addition, most of themodels with higher accuracy are the lower input modelswith 3 or 4-input only.Next, Table 9 lists the best accuracy by classification
method and the graphs are depicted in Figures 7 and 8for both Group 1 and Group 2 respectively.From Figure 7, ANFIS performed the best in Group 1
when compared to other classification methods for alltypes of feature selection methods except CC-GAmethod. All the classification methods performed worstin ReliefF feature selection method except for ANN.ANN had the lowest accuracy rate if compared to othermethods.Whereas, in Group 2 as shown in Figure 8, ANFIS
outperformed the other classification methods except inCC feature selection method. The best accuracy isachieved by ANFIS in ReliefF-GA method with theaccuracy of 93.81% (Table 9). In general, all classificationmethods performed better in CC-GA and ReliefF-GAhybrid feature selection methods except for SVM andLR. As with Group 1, ANN had the lowest classificationrate except in ReliefF-GA method. Overall, the perform-ance of the classification method is better in Group 2 ascompared to Group 1. Table 10 summarizes the bestmodels with their selected features for both Group 1and Group 2. All the models with the accuracy of 70%and above are selected.From Table 10, the models with the highest accuracy
are ReliefF-GA-3-input and ReliefF-GA-4-input fromGroup 2 with ANFIS classification, the accuracy is93.81% and AUC of 0.90. The features selected areDrink, Invasion and p63 and Drink, Invasion, Treatment,and p63 respectively. This is followed by the ReliefF-GA-3-input model from Group 2 with ANN classifica-tion, with the accuracy of 84.62% and AUC of 0.83. Mostof the best models are generated from the ReliefF-GAfeature selection method; this proves that the features

Table 7 Classification accuracy and AUC for group 2
Featureselection
3-input 4-input 5-input 6-input 7-input
% AUC % AUC % AUC % AUC % AUC
ANFIS
GA 74.76 0.74 67.62 0.70 41.90 0.40 58.57 0.58 35.71 0.36
CC 58.10 0.48 58.10 0.52 51.90 0.48 48.57 0.46 61.90 0.59
ReliefF 54.29 0.47 44.29 0.38 48.10 0.53 67.14 0.62 67.14 0.62
CC-GA 74.76 0.70 70.48 0.71 54.76 0.57 61.43 0.61 64.29 0.65
ReliefF-GA 93.81 0.90 93.81 0.90 65.71 0.63 64.76 0.62 68.10 0.67
ANN
GA 45.14 0.50 51.48 0.55 45.81 0.49 46.14 0.50 47.71 0.51
CC 46.24 0.46 49.38 0.49 46.14 0.50 57.38 0.58 55.48 0.57
ReliefF 40.62 0.48 43.24 0.49 47.71 0.50 49.48 0.51 48.76 0.50
CC-GA 49.38 0.52 53.90 0.60 47.05 0.52 44.76 0.48 55.19 0.57
ReliefF-GA 84.62 0.83 73.38 0.75 48.00 0.52 51.57 0.53 45.86 0.47
SVM
GA 74.76 0.70 54.76 0.51 70.95 0.65 60.95 0.55 50.95 0.42
CC 64.76 0.55 64.76 0.55 64.76 0.55 67.62 0.56 67.62 0.62
ReliefF 54.29 0.44 54.29 0.44 44.29 0.36 48.10 0.46 34.76 0.28
CC-GA 74.76 0.70 54.76 0.51 61.43 0.50 58.10 0.54 61.43 0.57
ReliefF-GA 74.76 0.70 71.43 0.68 74.76 0.70 74.43 0.66 54.76 0.53
LR
GA 74.76 0.70 63.81 0.64 67.14 0.57 54.76 0.43 54.29 0.47
CC 71.43 0.67 71.43 0.67 61.43 0.59 68.10 0.65 61.43 0.59
ReliefF 50.59 0.45 48.10 0.39 48.10 0.41 44.76 0.43 41.43 0.41
CC-GA 74.76 0.70 63.81 0.64 60.48 0.61 64.29 0.63 60.48 0.54
ReliefF-GA 74.76 0.70 74.76 0.70 71.43 0.68 58.10 0.55 61.43 0.60
Chang et al. BMC Bioinformatics 2013, 14:170 Page 10 of 15http://www.biomedcentral.com/1471-2105/14/170
selected by this method are the optimum features forthe oral cancer prognosis dataset.
DiscussionsThe results shown meets the objective of this research,namely, the classification performance is much betterwith the existence of genomic variables in Group 2.From the results in Table 10, the best feature selectionmethod for oral cancer prognosis is ReliefF-GA withANFIS classification. This shows that the ANFIS is the
Table 8 Best accuracy for n-input model based on feature sel
Featureselectionmethod
Group 1
n-input model
3 4 5 6 7
GA 70.95 67.62 64.76 68.10 64
CC 64.29 74.76 67.62 67.62 64
ReliefF 61.43 50.59 58.10 64.29 64
CC-GA 67.62 67.62 63.81 70.95 64
ReliefF-GA 67.14 64.29 67.62 64.29 64
most optimum classification tool for oral cancerprognosis.Since there are two top models with the same accur-
acy, hence, the simpler one is recommended for furtherworks in similar researches which is the ReliefF-GA-3-input model with ANFIS classification, and the optimumsubset of features are Drink, Invasion and p63. Thesefindings confirmed that of some previous studies. Alcoholconsumption has always been considered as a risk factorand one of the reasons for poor prognosis of oral cancer
ection method
Group 2
n-input model
3 4 5 6 7
.29 74.76 67.62 70.95 60.95 54.29
.29 71.43 71.43 64.76 68.10 67.62
.29 54.29 54.29 48.10 67.14 67.14
.76 74.76 70.48 61.43 64.29 64.29
.76 93.81 93.81 74.76 74.43 68.10

45
50
55
60
65
70
75
80
85
90
95
3-input 4-input 5-input 6-input 7-input
Acc
urac
y
GA
CC
ReliefF
CC-GA
ReliefF-GA
Figure 5 Graphs for best accuracy for n-input model based onfeature selection method for Group 1.
Table 9 Best accuracy by classification method
Featureselectionmethod
Group 1 Group 2
Classification method Classification method
ANFIS ANN SVM LR ANFIS ANN SVM LR
GA 70.95 52.43 61.43 68.10 74.76 51.48 74.76 74.76
CC 74.76 54.48 60.95 67.62 61.90 57.38 67.62 71.43
ReliefF 64.29 51.52 54.29 50.59 67.14 49.48 54.29 50.59
CC-GA 67.62 50.48 63.81 70.95 74.76 55.19 74.76 74.76
ReliefF-GA 67.62 56.76 64.29 61.43 93.81 84.62 74.76 74.76
Chang et al. BMC Bioinformatics 2013, 14:170 Page 11 of 15http://www.biomedcentral.com/1471-2105/14/170
[30-33]. Walker D et al. [34] showed that the depth of in-vasion is one of the most important predictors of lymphnode metastasis in tongue cancer. The different researchesdone by [35-38], discovered a significant link between thedepth of invasion and oral cancer survival. As regards top63, [12-14] showed that p63 over expression associateswith poor prognosis in oral cancer.A comparison between the current methodology and
the other methods in the literature was done and shownin Table 11. Nevertheless, direct comparisons cannot beperformed since different datasets have been employedin each case. In this comparison, we compared thestudies which utilized at least both types of clinical andgenomic data in oral cancer. In general, the proposedmethodology exhibits superior results compared to theother methods except the work done by [8,9] whichclaimed to achieve an accuracy of 100%. However, theyemployed different classifiers for different source of dataand more than 70 markers were required for their finalcombined classifier. A significant advantage of ourproposed methodology is only three optimum markersare needed with a single classifier for both types of
45
50
55
60
65
70
75
80
85
90
95
3-input 4-input 5-input 6-input 7-input
Acc
urac
y
GA
CC
ReliefF
CC-GA
ReliefF-GA
Figure 6 Graphs for best accuracy for n-input model based onfeature selection method for Group 2.
clinicopathologic and genomic data to obtain high ac-curacy result. It is hope that the proposed methodologyis feasible to expedite oral cancer clinicians in the deci-sion support stage and to better predict the survival rateof the oral cancer patients based on the three markersonly.A common problem associated with medical dataset is
small sample size. It is time consuming and costly toobtain large amount of samples in medical research andthe samples are usually inconsistent, incomplete or noisyin nature. The small sample size problem is more visiblein the oral cancer research since oral cancer is not oneof the top ten most common cancers in Malaysia, hencethere are not many cases. For example, in PeninsularMalaysia, there are only 1,921 new oral cancer casesfrom 2003 to 2005 [39] and 592 new oral cancer cases inthe year 2006 [40] as compared to breast cancer, wherethe incidence between 2003 and 2005 is 12,209 [39] andthe incidence for 2006 is 3,591 [40]. Out of these oralcancer cases, some patients are lost to follow-up, somepatients seek treatments in other private hospitals andthus, their data are not available for this research.Another reason for small sample size is caused by themedical confidentiality problems. This can be viewedfrom two aspects, namely, patients and clinicians. Somepatients do not wish to reveal any information abouttheir diseases to others, and are not willing to donate
45
50
55
60
65
70
75
80
85
90
95
GA CC ReliefF CC-GA ReliefF-GA
Acc
urac
y ANFIS
ANN
SVM
LR
Figure 7 Graphs for best accuracy by classification method forGroup 1.

45
50
55
60
65
70
75
80
85
90
95
GA CC ReliefF CC-GA ReliefF-GA
Acc
urac
y ANFIS
ANN
SVM
LR
Figure 8 Graphs for best accuracy by classification method forGroup 2.
Table 11 Comparison between the current work and theliterature
Author Sample size Accuracy (%)
Passaro et al. [6] 124 patients, 231 controls 74-79
Oliveira et al. [7] 500 5-year survival of 28.6%
Exarchos et al. [8] 41 100
Exarchos et al. [9] 86 100
Dom et al. [10] 84 patients, 87 controls 82
Current work 31 93.81
Chang et al. BMC Bioinformatics 2013, 14:170 Page 12 of 15http://www.biomedcentral.com/1471-2105/14/170
their tissues for research/educational purposes. As forclinicians, some may not want to share patients’ datawith others especially those from the non-medical fields,while some do not keep their medical records in thecorrect medical form. From those available cases, somepatients’ clinicopathologic data are incomplete, sometissues are missing due to improper management andsome are duplicated cases. Due to that, the number of
Table 10 Best models with accuracy, AUC, classification meth
Accuracy AUC
Group 1
CC-3-input 74.76 0.70
GA-3-input 70.95 0.66
CC-GA-6-input 70.95 0.73
Group 2
ReliefF-GA-3-input 93.81 0.90
ReliefF-GA-4-input 93.81 0.90
ReliefF-GA-3-input 84.62 0.83
ReliefF-GA-3-input 84.62 0.83
GA-3-input 74.76 0.74
CC-GA-3-input 74.76 0.70
CC-GA-3-input 74.76 0.70
CC-GA-3-input 74.76 0.70
ReliefF-GA-3-input 74.76 0.70
ReliefF-GA-3-input 74.76 0.70
Relief-GA-4-input 74.76 0.70
Relief-GA-5-input 74.76 0.70
Relief-GA-6-input 74.43 0.66
Relief-GA-4-input 73.38 0.75
Relief-GA-4-input 71.43 0.68
Relief-GA-5-input 71.43 0.68
CC-3-input 71.43 0.67
CC-4-input 71.43 0.67
CC-GA-4-input 70.48 0.71
cases that can actually be used for this research is verylimited.In order to overcome the problem of small sample
size, we employed the feature selection methods on ourdataset to choose the most optimum feature subsetsbased on the correlations of the input and output vari-ables. The features selected are fed into the proposedclassifier and the results showed that the ReliefF-GA-ANFIS prognostic model is suitable for small sample sizedata with the proposed optimum feature subset of drink,invasion and p63.
od and selected features
Classification method Selected features
ANFIS Age,Inv,PN
ANFIS PT,PN,Sta
LR Gen,Dri,Node,PT,PN,Sta
ANFIS Dri,Inv,p63
ANFIS Dri,Inv,Tre,p63
ANN Dri,Inv,p63
ANN Dri,Inv,p63
ANFIS Inv,Node,p63
ANFIS Inv,Node,p63
SVM Inv,Node,p63
LR Inv,Node,p63
SVM Dri,Inv,p63
LR Dri,Inv,p63
LR Dri,Inv,Tre,p63
SVM Age,Gen,Smo,Dri,p63
SVM Age,Gen,Smo,Dri,Inv,p63
ANN Dri,Inv,Tre,p63
SVM Dri,Inv,Tre,p63
LR Age,Gen,Smo,Dri,p63
LR Inv,PN,p63
LR Age,Inv,PN,p63
ANFIS Gen,Inv,Size,p53

Table 12 Validation test with random permutation of 3-input model and full input model for Group 2
Models ANFIS
% AUC
Random permutation model
Age, Inv, p63 64.76 0.63
Eth, Dri, p53 57.14 0.49
PT, PN, Sta 58.10 0.51
Gen, Node, Tre 70.95 0.59
Eth, Gen, Sub 39.05 0.32
Dri, p53, p63 80.48 0.70
Age, p53, p63 67.14 0.67
Gen, Dri, Inv 54.76 0.55
Site, Inv, Size 32.86 0.28
Age, Chew, Size 48.10 0.41
Full model
Full model with ANFIS N.A.* N.A.*
Full model with NN 42.90 0.47
Full model with SVM 54.76 0.46
Full model with LR 54.76 0.59
*N.A. - Results not available due to over-fitting problem as the rule-basegenerated was too large.
Table 13 Classification results for 1-year to 3-year oralcancer prognosis
Oral cancer prognosis Accuracy (%) AUC
1-year 93.33 0.90
2-year 84.29 0.77
3-year 93.81 0.90
Chang et al. BMC Bioinformatics 2013, 14:170 Page 13 of 15http://www.biomedcentral.com/1471-2105/14/170
Significance testingThe significance test used in this research was theKruskal-Wallis test. Kruskal-Wallis is a non-parametrictest to compare samples from two or more groups andreturns the p-value. For this research, we wanted to testif there is any statistical significant difference betweenthe accuracy results generated for the 3-input model ofGroup 2 for the different feature selection methods.Thus, the null hypothesis is set as: H0 = There is no dif-ference between the results of the different feature selec-tion models. If the p-value computed from the test is0.05 or less, the H0 is rejected, which means there is adifference between the results of the different feature se-lection methods. The p-value that generated was 0.0312,which is less than 0.05, this means the H0 is rejected andthere is a significant difference between the feature se-lection methods.
Validation testingIn this section, the best model of ReliefF-GA-3-inputmodel is compared with other models with a randompermutation of three inputs. The purpose is to validatethat the features selected by the ReliefF-GA method arethe optimum subset for oral cancer prognosis. Inaddition, the full-input model (the model with all the 17variables) will be tested as well in order to verify that thereduced model can achieve the same or better resultsthan the full model. In this testing, the classificationmethod used is ANFIS due to its best performance inthe previous section and the results are tabulated inTable 12.Table 12 presents the results from different permuta-
tion of the 3-input models using ANFIS and that of thefull model with all the 17 variables using the differentclassification methods. The three inputs are generatedrandomly and the best accuracy obtained is 80.48% withan AUC of 0.70. The features selected are Drink, p53and p63. The results of the full model are not promisingand the results of full model using ANFIS cannot begenerated due to over-fitting problems as the rule basegenerated is too large.Finally, the selected features are tested on the oral can-
cer dataset for 1-year and 2-year with ANFIS classifica-tion and the results are very promising with an accuracyfor 1-year prognosis of 93.33% and 2-year prognosisobserved at 84.29%, as compared to the 3-year prognosisof 93.81%. The results are shown in Table 13.
FindingsThe analyses and findings from this research are:(i) The performance of Group 2 (clinicopathologic and
genomic variables) is better than Group 1(clinicopathologic variables). This is in accordancewith the objective of this research, which shows that
the prognostic result is more accurate with thecombination of clinicopathologic and genomicmarkers.
(ii)The model with the best accuracy is the ReliefF-GA-3-input model with the ANFIS classification modelfrom Group 2 and the Kruskal-Wallis test showed asignificant difference as compared to the 3-inputmodel of GA, CC, ReliefF and CC-GA.
(iii)The optimum subset of features for oral cancerprognosis is drink, invasion and p63 and this findingis in accordance with similar studies in theliterature.
(iv)The ANFIS classification model achieved the bestaccuracy in oral cancer prognosis when compared toartificial neural network, support vector machineand statistical method of logistic regression.
(v)The prognostic result is more accurate with fewerinputs in comparison with the full model.
As a summary, the hybrid model of ReliefF-GA-ANFISwith 3-input features of drink, invasion and p63

Chang et al. BMC Bioinformatics 2013, 14:170 Page 14 of 15http://www.biomedcentral.com/1471-2105/14/170
achieved the best accuracy. Through the identification offewer markers for oral cancer prognosis, it is hoped thatthis will aid clinicians in carrying out prognostic proce-dures, and thus help them in making a more accurateprognosis in a shorter time at lower costs. Furthermore,the results of this research helps patients and their fam-ily plan their future and lifestyle through a more reliableprognosis.
ConclusionsIn this research, we presented a prognostic system usingthe hybrid of feature selection and machine learningmethods for the purpose of oral cancer prognosis basedon clinicopathologic and genomic markers. As a conclu-sion, the hybrid model of ReliefF-GA-ANFIS resulted inthe best accuracy (accuracy = 93.81%, AUC = 0.90) withthe selected features of drink, invasion and p63. Theresults proved that the prognosis is more accurate whenusing the combination of clinicopathologic and genomicmarkers. However, more tests and experiments neededto be done in order to further verify the results obtainedin this research. Our future works include increasing thesample size of the dataset by providing more medicalsamples thus making it closer to the real population andincluding more genomic markers in our study.
Competing interestsThe authors declare that they have no competing interests.
Authors’ contributionsSWC developed the prognostic model, performed the experiments anddrafted the manuscript. SWC and SAK conceived with the study andcontributed to the experimental design. AFM and RBZ contributed in theanalysis and interpretation of oral cancer prognostic dataset. All authors readand approved the final manuscript.
AcknowledgmentThis study is supported by the University of Malaya Research Grant (UMRG)with the project number RG026-09ICT. The authors would like to thank DrMannil Thomas Abraham from the Tunku Ampuan Rahimah Hospital,Ministry of Health, Malaysia, Dr Thomas George Kallarakkal from theDepartment of Oral Pathology and Oral Medicine and Periodontology, thestaff from the Oral & Maxillofacial Surgery department, the Oral PathologyDiagnostic Laboratory, the OCRCC, the Faculty of Dentistry, and the ENTdepartment, Faculty of Medicine, University of Malaya for the preparation ofthe dataset and the related data and documents for this project.
Author details1Bioinformatics and Computational Biology, Institute of Biological Science,Faculty of Science, University of Malaya, Kuala Lumpur, Malaysia.2Department of Artificial Intelligence, Faculty of Computer Science andInformation Technology, University of Malaya, Kuala Lumpur, Malaysia.3Department of Oral Pathology and Oral Medicine and Periodontology, OralCancer Research and Coordinating Centre (OCRCC), Faculty of Dentistry,University of Malaya, Kuala Lumpur, Malaysia.
Received: 7 November 2012 Accepted: 21 May 2013Published: 31 May 2013
References1. Lisboa PJ, Taktak AFG: The Use of artificial neural networks in decision
support in cancer: a systematic review. Neural Netw 2006, 19:408–415.
2. Cruz JA, Wishart DS: Applications of machine learning in cancerprediction and prognosis. Cancer Informatics 2006, 2:59–78.
3. Futschik ME, Sullivan M, Reeve A, Kasabov N: Prediction of clinicalbehaviour and treatment for cancers. Appl Bioinformatics 2003,2(3 Suppl):S53–S58.
4. Gevaert O, Smet FD, Timmerman D, Moreau D, Moor BD: Predicting theprognosis of breast cancer by integrating clinical and microarray datawith Bayesian networks. Bioinformatics 2006, 22(14):e184–e190.
5. Sun Y, Goodison S, Li J, Liu L, Farmerie W: Improved breast cancerprognosis through the combination of clinical and genetic markers.Bioinformatics 2007, 23(1):30–37.
6. Passaro A, Baronti F, Maggini V: Exploring relationships between genotype andoral cancer development through XCS. New York, USA: GECCO′05; 2005.
7. Oliveira LR, Ribeiro-Silve A, Costa JPO, Simoes AL, Di Matteo MAS, ZucolotoS: Prognostic factors and survival analysis in a sample of oral squamouscell carcinoma patients. Oral Surgery, Oral Medicine, Oral Pathology,Oral Radiology, and Endodontology 2008, 106(5):685–695.
8. Exarchos K, Goletsis Y, Fotiadis D: Multiparametric Decision SupportSystem for the Prediction of Oral Cancer Reoccurrence. IEEE Trans InfTechnol Biomed 2011, 16(6):1127–1134.
9. Exarchos K, Goletsis Y, Fotiadis D: A multiscale and multiparametricapproach for modeling the progression of oral cancer. BMC Med InformDecis Mak 2012, 12:136–150.
10. Dom RM, Abdul-Kareem S, Abidin B, Jallaludin RLR, Cheong SC, Zain RB:Oral cancer prediction model for Malaysian sample. Austral-Asian Journalof Cancer 2008, 7(4):209–214.
11. Catto JWF, Abbod MF, Linkens DA, Hamdy FC: Neuro-fuzzy modeling: anaccurate and interpretable method for predicting bladder cancerprogression. J Urol 2006, 175:474–479.
12. Muzio LL, Santarelli A, Caltabiano R, Rubini C, Pieramici T, Trevisiol L: p63overexpression associates with poor prognosis in head and necksquamous cell carcinoma. Hum Pathol 2005, 36:187–194.
13. Chen YK, Huse SS, Lin LM: Differential expression of p53, p63 and p73proteins in human buccal squamous-cell carcinomas. Clin OtolaryngolAllied Sci 2003, 28(5):451–455.
14. Choi H-R, Batsakis JG, Zhan F, Sturgis E, Luna MA, El-Naggar AK: Differentialexpression of p53 gene family members p63 and p73 in head and necksquamous tumorigenesis. Hum Pathol 2002, 33(2):158–164.
15. Mehrotra R, Yadav S: Oral squamous cell carcinoma: etiology, pathogenesisand prognostic value of genomic alterations. Indian J Cancer 2006,43(2):60–66.
16. Thurfjell N, Coates PJ, Boldrup L, Lindgren B, Bäcklund B, Uusitalo T, MahaniD, Dabelsteen E: Function and Importance of p63 in Normal Oral Mucosaand Squamous Cell Carcinoma of the Head and Neck. Current Research inHead and Neck Cancer 2005, 62:49–57.
17. Zigeuner R, Tsybrovskyy O, Ratschek M, Rehak P, Lipsky K, Langner C:Prognostic impact of p63 and p53 in upper urinary tract transitional cellcarcinoma. Adult Urology 2004, 63(6):1079–1083.
18. Rosner B: Fundamentals of Biostatistics. 6th edition. California: ThomsonHigher Education; 2006.
19. Kononenko I: Estimating Attributes: Analysis and Extension of RELIEF. InECML-94 Proceedings of the European conference on machine learning onMachine Learning: 1994. Catania, Italy: Springer; 1994:171–182.
20. Goldberg DE: Genetic Algorithms in Search, Optimization, and MachineLearning. Boston: Addison-Wesley Longman; 1989.
21. Siow-Wee C, Kareem SA, Kallarakkal TG, Merican AF, Abraham MT, Zain RB:Feature Selection Methods for Optimizing Clinicopathologic InputVariables in Oral Cancer Prognosis. Asia Pacific Journal of Cancer Prevention2011, 12(10):2659–2664.
22. Efron B: Estimating the error rate of a prediction rule: improvement oncross-validation. J Am Stat Assoc 1983, 78(382):316–330.
23. Molinaro AM, Simon R, Pfeiffer RM: Prediction error estimation: acomparison of resampling methods. Bioinformatics 2005,21(15):3301–3307.
24. Jang JSR: ANFIS: adaptive-network-based fuzzy inference system. IEEETrans Syst Man Cybern 1993, 23(3):665–685.
25. Jang JSR: Input Selection for ANFIS Learning. In Fifth IEEE InternationalConference on Fuzzy Systems vol. 2; 1996:1493–1499.
26. Gershenson C: Artificial Neural Network For Beginners. Formal ComputationalSkills Teaching Package, COGS, University of Sussex; 2001.

Chang et al. BMC Bioinformatics 2013, 14:170 Page 15 of 15http://www.biomedcentral.com/1471-2105/14/170
27. Chih-Chung C, Chih-Jen L: LIBSVM : A library for support vector machines.ACM Transactions on Intelligent Systems and Technology 2011, 2:27:21–27:27.
28. Chih-Wei H, Chang C-C, Lin C-J: A Practical Guide to Support VectorMachine. In Technical Report. Taiwan: National Taiwan University; 2010.
29. Ross SM: Introductory Statistics. 3rd edition. New York, USA: Academic Press,Elsevier; 2010.
30. Jefferies S, Foulkes WD: Genetic mechanisms in squamous cell carcinomaof the head and neck. Oral Oncol 2001, 37:115–126.
31. Leite ICG, Koifman S: Survival analysis in a sample of oral cancer patientsat a reference hospital in Rio de Janeiro, Brazil. Oral Oncol 1998,34(1998):347–352.
32. Reichart PA: Identification of risk groups for oral precancer and cancerand preventive measures. Clin Oral Invest 2001, 5:207–213.
33. Zain RB, Ghazali N: A review of epidemiological studies of oral cancer andprecancer in Malaysia. Annals of Dentistry University of Malaya 2001,8:50–56.
34. Walker D, Boey G, McDonald L: The pathology of oral cancer. Pathology2003, 35(5):376–383.
35. Asakage T, Yokose T, Mukai K, Tsugane S, Tsubono Y, Asai M, Ebihara S:Tumor thickness predicts cervical metastasis in patients with stage I/IIcarcinoma of the tongue. Cancer 1998, 82:1443–1448.
36. Giacomarra V, Tirelli G, Papanikolla L, Bussani R: Predictive factors of nodalmetastases in oral cavity and oropharynx carcinomas. Laryngoscope 1999,109:795–799.
37. Morton R, Ferguson C, Lambie N, Whitlock R: Tumor thickness in earlytongue cancer. Arch Otolaryngol Head Neck Surg 1994, 120:717–720.
38. Williams J, Carlson G, Cohen C, Derose P, Hunter S, Jurkiewicz M: Tumorangiogenesis as a prognostic factor in oral cavity tumors. Am J Surg 1994,168:373–380.
39. Gerard LCC, Rampal S, Yahaya H: Third Report of the National CancerRegistry Cancer Incidence in Malaysia (2005). In National Cancer Registry,Ministry of Health Malaysia. 2005.
40. Omar ZA, Ali ZM, Tamin NSI: Malaysian Cancer Statistics - Data andFigure, Peninsular Malaysia 2006. In National Cancer Registry, Ministry ofHealth Malaysia. 2006.
doi:10.1186/1471-2105-14-170Cite this article as: Chang et al.: Oral cancer prognosis based onclinicopathologic and genomic markers using a hybrid of featureselection and machine learning methods. BMC Bioinformatics 201314:170.
Submit your next manuscript to BioMed Centraland take full advantage of:
• Convenient online submission
• Thorough peer review
• No space constraints or color figure charges
• Immediate publication on acceptance
• Inclusion in PubMed, CAS, Scopus and Google Scholar
• Research which is freely available for redistribution
Submit your manuscript at www.biomedcentral.com/submit
Related Documents