Oracle® Solaris Studio 12.3 Code Analyzer Tutorial December 2011

Welcome message from author
This document is posted to help you gain knowledge. Please leave a comment to let me know what you think about it! Share it to your friends and learn new things together.
Transcript

Oracle® Solaris Studio 12.3 CodeAnalyzer TutorialDecember 2011
■ “Introduction” on page 2■ “Getting the Sample Application” on page 2■ “Collecting and Displaying Data” on page 3■ “Using the Issues Found by the Code Analyzer to Improve Your Code” on page 13■ “Potential Errors Found by Code Analyzer Tools” on page 13
IntroductionThe Oracle Solaris Studio Code Analyzer is an integrated set of tools designed to help developers of C andC++ applications for Oracle Solaris produce secure, robust, and quality software.
The Code Analyzer includes three types of analysis:
■ Static code checking as part of compilation■ Dynamic memory access checking■ Code coverage analysis
Static code checking detects common programming errors in your code during compilation. A new compileroption leverages the Oracle Solaris Studio compilers' extensive and well proven control and data flow analysisframeworks to analyze an application for potential programming and security flaws.
The Code Analyzer uses dynamic memory data collected by Discover, the memory error discovery tool inOracle Solaris Studio, to find memory-related errors when you run your application. It uses data collected byUncover, the code coverage tool in Studio, to measure code coverage.
In addition to giving you access to each individual type of analysis, the Code Analyzer integrates static codechecking and dynamic memory access checking to add confidence levels to errors found in code. By usingstatic code checking together with dynamic memory access analysis and code coverage analysis, you will beable to find many important errors in your applications that cannot be found by other error detection toolsworking by themselves.
Getting the Sample ApplicationThis tutorial uses a sample program to demonstrate how to use the Oracle Solaris Studio compilers, theDiscover memory error discovery tool, the Uncover code coverage tool, and the Code Analyzer GUI to findand correct common programming errors, dynamic memory access errors, and code coverage issues.
The source code for the sample program is available in the sample applications zip file on the Oracle SolarisStudio 12.3 Sample Applications web page at http://www.oracle.com/technetwork/server-storage/solarisstudio/downloads/solaris-studio-samples-1408618.html. Ifyou have not already done so, download the sample applications zip file and unpack it in a directory of yourchoice.
The sample application is located in the CodeAnalyzer subdirectory of theSolarisStudioSampleApplications directory.
The sample directory contains the following source code files:
main.c
previse_1.c
previse_all.c
sample_1.c
sample_2.c
sample_3.c
Oracle Solaris Studio 12.3 Code Analyzer Tutorial 2

Collecting and Displaying DataYou can use the Code Analyzer tools to collect one, two, or all three types of data.
Collecting and Displaying Static Error DataWhen you build a binary using the -xanalyze=code compiler option, the compiler automatically extractsstatic errors and puts the data in a static subdirectory in a binary_name.analyze directory in the samedirectory as the source code. For a list of the types of static errors found by the compiler, see “Static CodeIssues” on page 13.
1. In your sample directory, build the application by typing:
cc -xanalyze=code *.c
The static error data is written to the static subdirectory in an a.out.analyze directory in your sampledirectory.
2. Open the Code Analyzer GUI to view the results:
code-analyzer a.out &
3. The Code Analyzer GUI opens and the Results tab displays the static code issues found duringcompilation. The text at the top of the Results tab tells you that twelve static code issues were found.
Oracle Solaris Studio 12.3 Code Analyzer Tutorial 3

4. For each issue, the tab displays the issue type, the path name of the source file in which the issue wasfound, and a code snippet from that file with the relevant source line highlighted.
5. To see more information about the first issue, a Double Freeing Memory error, click the error icon .The stack trace for the issue opens displaying the error path.
6. Notice that when you opened the stack trace, the icon in the upper right corner of the issue changed from
to to indicate that you have reviewed the issue.
Note – You can hide the issues you have reviewed by clicking the Hide Reviewed Issues button
at the top of the Results tab. Clicking the button again unhides the issues.
7. Click the error icon to close the stack trace.
8. Now look at one of the Unitialized Memory Read warnings. Click the warning icon to open the stacktrace. Notice that the error path for this issue contains many more function calls than the one for theDouble Freeing Memory issue. Double click on the first function call. The source file opens with that callhighlighted. The error path is displayed in a Details Window below the source code.
Oracle Solaris Studio 12.3 Code Analyzer Tutorial 4
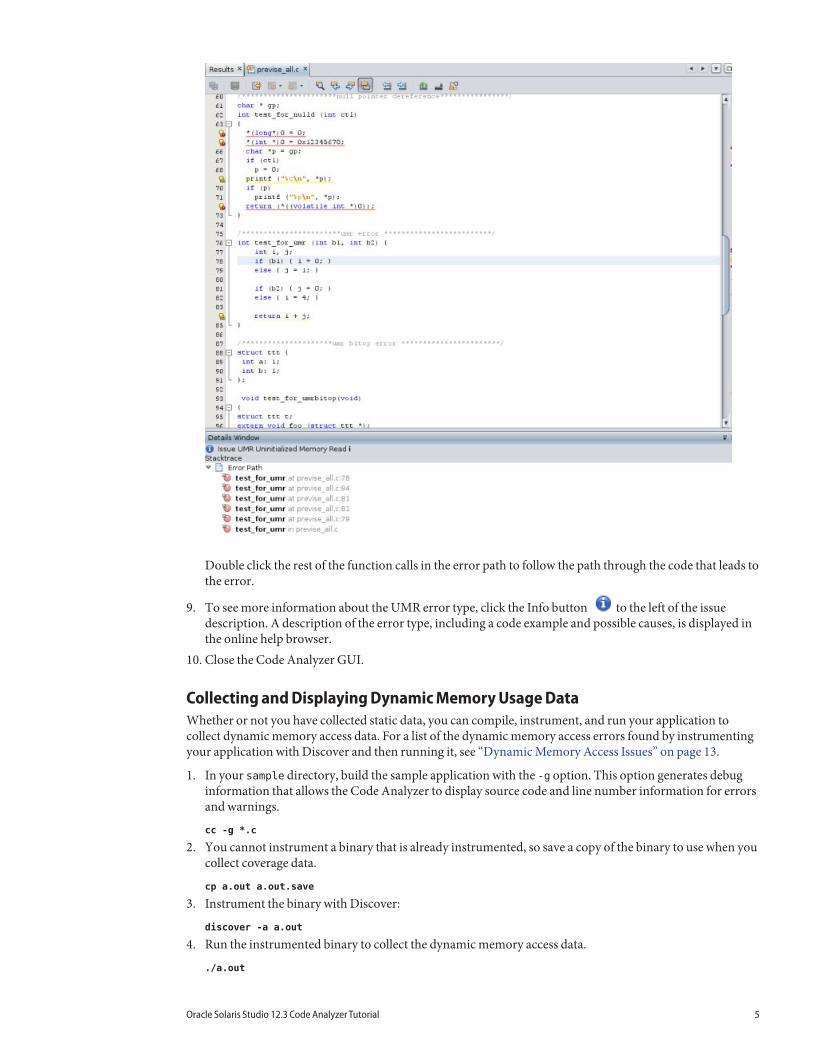
Double click the rest of the function calls in the error path to follow the path through the code that leads tothe error.
9. To see more information about the UMR error type, click the Info button to the left of the issuedescription. A description of the error type, including a code example and possible causes, is displayed inthe online help browser.
10. Close the Code Analyzer GUI.
Collecting and Displaying Dynamic Memory Usage DataWhether or not you have collected static data, you can compile, instrument, and run your application tocollect dynamic memory access data. For a list of the dynamic memory access errors found by instrumentingyour application with Discover and then running it, see “Dynamic Memory Access Issues” on page 13.
1. In your sample directory, build the sample application with the -g option. This option generates debuginformation that allows the Code Analyzer to display source code and line number information for errorsand warnings.
cc -g *.c
2. You cannot instrument a binary that is already instrumented, so save a copy of the binary to use when youcollect coverage data.
cp a.out a.out.save
3. Instrument the binary with Discover:
discover -a a.out
4. Run the instrumented binary to collect the dynamic memory access data.
./a.out
Oracle Solaris Studio 12.3 Code Analyzer Tutorial 5
The dynamic memory access error data is written to the dynamic subdirectory in the a.out.analyzedirectory in your sample directory.
5. Open the Code Analyzer GUI to view the results:
code-analyzer a.out &
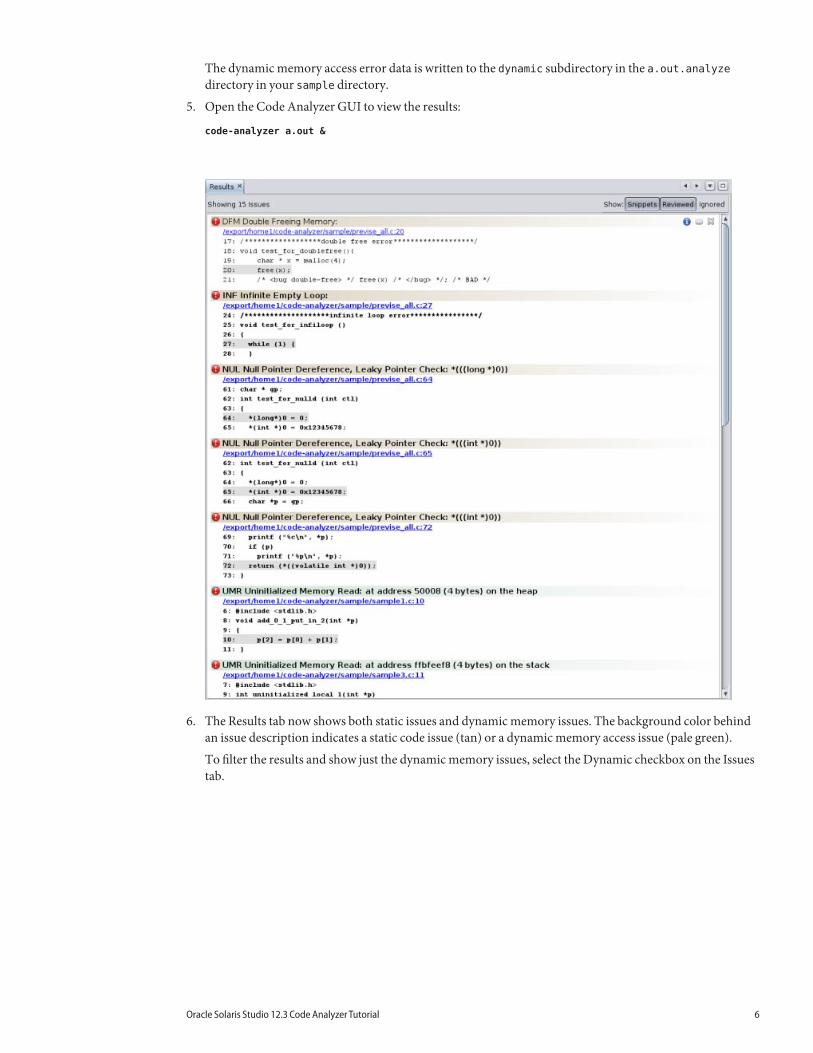
6. The Results tab now shows both static issues and dynamic memory issues. The background color behindan issue description indicates a static code issue (tan) or a dynamic memory access issue (pale green).
To filter the results and show just the dynamic memory issues, select the Dynamic checkbox on the Issuestab.
Oracle Solaris Studio 12.3 Code Analyzer Tutorial 6
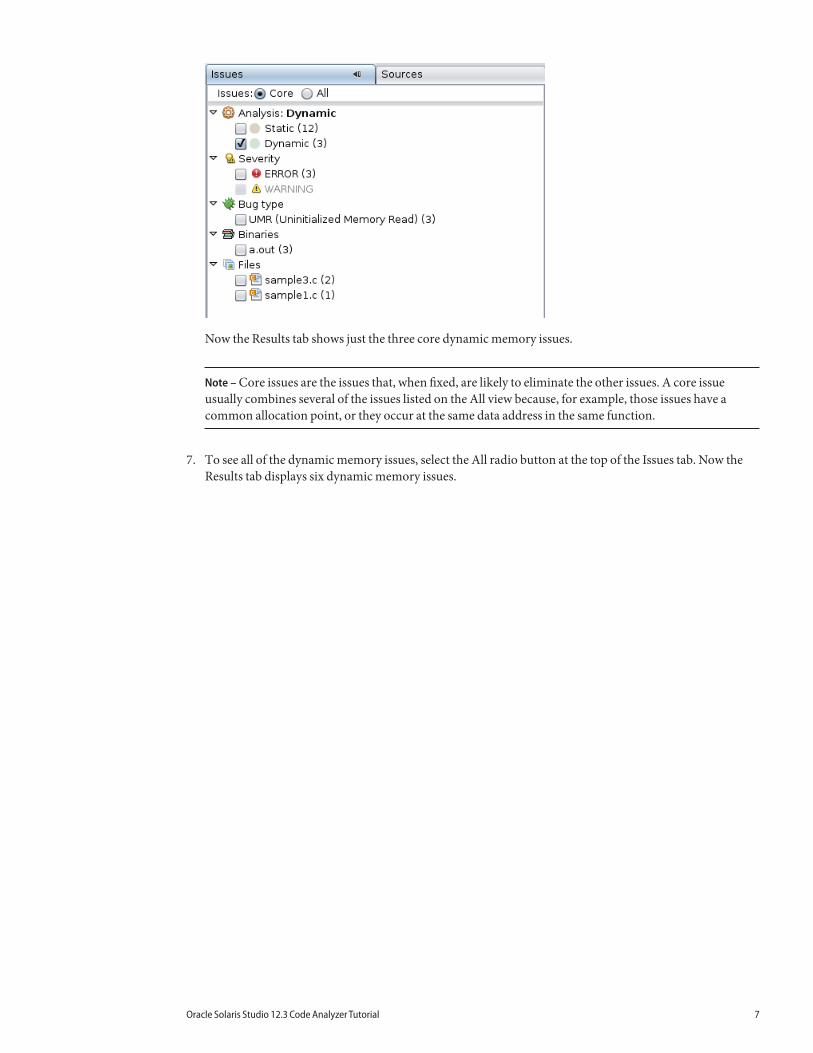
Now the Results tab shows just the three core dynamic memory issues.
Note – Core issues are the issues that, when fixed, are likely to eliminate the other issues. A core issueusually combines several of the issues listed on the All view because, for example, those issues have acommon allocation point, or they occur at the same data address in the same function.
7. To see all of the dynamic memory issues, select the All radio button at the top of the Issues tab. Now theResults tab displays six dynamic memory issues.
Oracle Solaris Studio 12.3 Code Analyzer Tutorial 7

Look at the three issues that were added to the display and see how they are related to the core issues. Itlooks as though fixing the cause of the first issue in the display is likely to also eliminate the second andthird issues.
To hide the other three dynamic memory access issues while you investigate these first one, click the
Ignore button for each of the issues.
Note – You can later redisplay the closed issues by clicking the Show Ignored Issues button atthe top of the Results tab.
8. Investigate the first issue by clicking the error icon to display the stack trace. For this issue, the stacktrace includes the Call Stack and the Allocated At Stack.
Oracle Solaris Studio 12.3 Code Analyzer Tutorial 8

Double-click function calls in the stacks to see the associated lines in the source file. When the source fileopens, the stack trace is displayed in a Details window below the file.
9. Close the Code Analyzer GUI.
Collecting and Displaying Code Coverage DataWhether or not you have collected static data or dynamic memory access data, you can compile, instrument,and run your application to collect code coverage data.
Oracle Solaris Studio 12.3 Code Analyzer Tutorial 9
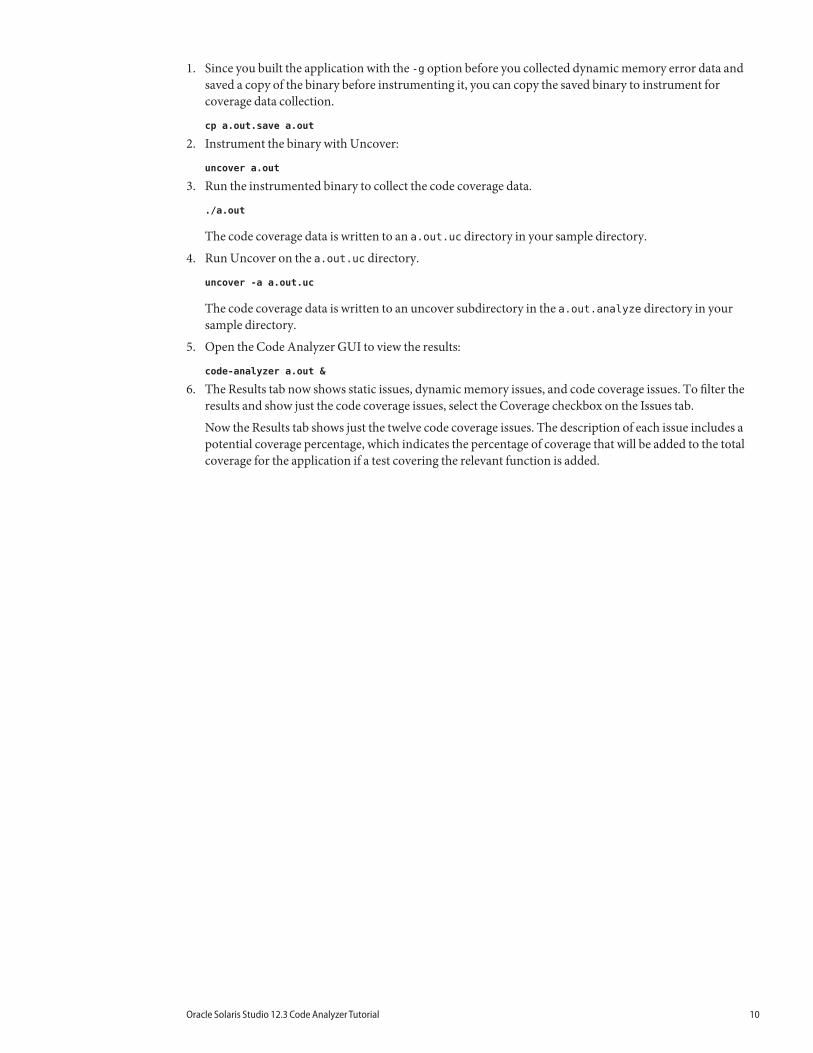
1. Since you built the application with the -g option before you collected dynamic memory error data andsaved a copy of the binary before instrumenting it, you can copy the saved binary to instrument forcoverage data collection.
cp a.out.save a.out
2. Instrument the binary with Uncover:
uncover a.out
3. Run the instrumented binary to collect the code coverage data.
./a.out
The code coverage data is written to an a.out.uc directory in your sample directory.
4. Run Uncover on the a.out.uc directory.
uncover -a a.out.uc
The code coverage data is written to an uncover subdirectory in the a.out.analyze directory in yoursample directory.
5. Open the Code Analyzer GUI to view the results:
code-analyzer a.out &
6. The Results tab now shows static issues, dynamic memory issues, and code coverage issues. To filter theresults and show just the code coverage issues, select the Coverage checkbox on the Issues tab.
Now the Results tab shows just the twelve code coverage issues. The description of each issue includes apotential coverage percentage, which indicates the percentage of coverage that will be added to the totalcoverage for the application if a test covering the relevant function is added.
Oracle Solaris Studio 12.3 Code Analyzer Tutorial 10

Note – To see all of the issues without scrolling up and down, click the Hide Snippets button
at the top of the Results tab to hide the code snippets.
7. In the Issues tab, notice that nine of the coverage issues are in the previse_all.c source file, three of themare in sample2.c, and one is in previse_1.c. To further filter the results and show just the issues for thesample2.c file, select the checkbox for that file on the Issues tab.
The Results tab now shows just the three code coverage issues found in sample2.c.
Oracle Solaris Studio 12.3 Code Analyzer Tutorial 11

8. Open the source file by clicking on the source file path link in one of issues. Scroll down in the source fileuntil you see the warning icons in the left margin.
Code that is not covered is marked with a yellow bracket, for example
. The coverage issues found in the file are marked with warning
icons
Oracle Solaris Studio 12.3 Code Analyzer Tutorial 12

Using the Issues Found by the Code Analyzer to ImproveYour CodeBy fixing the core issues found by the Code Analyzer, you should be able to eliminate the other issues found inyour code, and make major improvements in its quality and stability.
By doing static error checking, you can find the risky code in your application. But static error checking cangenerate false positives. Dynamic checking can help verify and eliminate these errors, giving a more accuratepicture of the issues in your code. And code coverage checking can help you improve your dynamic testsuites.
The Code Analyzer integrates the results these three types of checking to give you the most accurate analysisof your code all in one tool.
Potential Errors Found by Code Analyzer ToolsThe compilers, Discover, and Uncover find static code issues, dynamic memory access issues, and coverageissues in your code. The specific error types that are found by these tools and analyzed by the Code Analyzerare listed in the following sections.
Static Code IssuesStatic code checking finds the following types of errors:■ ABR: beyond Array Bounds Read■ ABW: beyond Array Bounds Write■ DFM: Double Freeing Memory■ ECV: Explicit type Cast Violation■ FMR: Freed Memory Read■ FMW: Freed Memory Write■ FOU: PM_OUT use before definition■ INF: INFinite empty loop■ Memory leak■ MFR: Missing Function Return■ MRC: Missing malloc Return value Check■ NFR: uNinitialized Function Return■ NUL: NULl pointer dereference, leaky pointer check■ RFM: Return Freed Memory■ UMR: Uninitialized Memory Read, Uninitialized Memoey Read bit operation■ URV: Unused Return Value■ VES: out-of-scope local Variable usage
Dynamic Memory Access IssuesDynamic memory access checking finds the following types of errors:
■ ABR: beyond Array Bounds Read■ ABW: beyond Array Bounds Write■ BFM: Bad Free Memory■ BRP: Bad Realloc address Parameter■ CGB: Corrupted Guard Block■ DFM: Double Freeing Memory■ FMR: Freed Memory Read■ FMW: Freed Memory Write■ IMR: Invalid Memory Read■ IMW: Invalid Memory Write■ Memory leak■ OLP: OverLaPping source and destination
Oracle Solaris Studio 12.3 Code Analyzer Tutorial 13

■ PIR: Partially Initialized Read■ SBR: beyond Stack Bounds Read■ SBW: beyond Stack Bounds Write■ UAR: UnAllocated memory Read■ UAW: UnAllocated memory Write■ UMR: Unitialized Memory Read
Dynamic memory access checking finds the following types of warnings:
■ AZS: Allocating Zero Size■ Memory leak■ SMR: Speculative unitialized Memory Read
Code Coverage IssuesCode coverage checking determines which functions are uncovered. In the results, code coverage issuesfound are labeled as Uncovered Function, with a potential coverage percentage, which indicates thepercentage of coverage that will be added to the total coverage for the application if a test covering therelevant function is added.
Oracle Solaris Studio 12.3 Code Analyzer Tutorial 14

Oracle Corporation 500 Oracle Parkway, Redwood City, CA 94065 U.S.A.
Copyright ©2011 This software and related documentation are provided under a license agreement containing restrictions on use and disclosure and are protected by intellectual property laws. Except as expressly permitted inyour license agreement or allowed by law, you may not use, copy, reproduce, translate, broadcast, modify, license, transmit, distribute, exhibit, perform, publish or display any part, in any form, or by any means. Reverseengineering, disassembly, or decompilation of this software, unless required by law for interoperability, is prohibited.The information contained herein is subject to change without notice and is not warranted to be error-free. If you find any errors, please report them to us in writing.If this is software or related documentation that is delivered to the U.S. Government or anyone licensing it on behalf of the U.S. Government, the following notice is applicable:U.S. GOVERNMENT RIGHTS. Programs, software, databases, and related documentation and technical data delivered to U.S. Government customers are "commercial computer software" or "commercial technical data"pursuant to the applicable Federal Acquisition Regulation and agency-specific supplemental regulations. As such, the use, duplication, disclosure, modification, and adaptation shall be subject to the restrictions and license termsset forth in the applicable Government contract, and, to the extent applicable by the terms of the Government contract, the additional rights set forth in FAR 52.227-19, Commercial Computer Software License (December 2007).Oracle America, Inc., 500 Oracle Parkway, Redwood City, CA 94065.This software or hardware is developed for general use in a variety of information management applications. It is not developed or intended for use in any inherently dangerous applications, including applications that may createa risk of personal injury. If you use this software or hardware in dangerous applications, then you shall be responsible to take all appropriate fail-safe, backup, redundancy, and other measures to ensure its safe use. OracleCorporation and its affiliates disclaim any liability for any damages caused by use of this software or hardware in dangerous applications.Oracle and Java are registered trademarks of Oracle and/or its affiliates. Other names may be trademarks of their respective owners.Intel and Intel Xeon are trademarks or registered trademarks of Intel Corporation. All SPARC trademarks are used under license and are trademarks or registered trademarks of SPARC International, Inc. AMD, Opteron, theAMD logo, and the AMD Opteron logo are trademarks or registered trademarks of Advanced Micro Devices. UNIX is a registered trademark of The Open Group.This software or hardware and documentation may provide access to or information on content, products, and services from third parties. Oracle Corporation and its affiliates are not responsible for and expressly disclaim allwarranties of any kind with respect to third-party content, products, and services. Oracle Corporation and its affiliates will not be responsible for any loss, costs, or damages incurred due to your access to or use of third-partycontent, products, or services.E23337
Related Documents


![Stevie Database Completed Report December2011[1]](https://static.cupdf.com/doc/110x72/577d22561a28ab4e1e971c74/stevie-database-completed-report-december20111.jpg)