Slide 1 Copyright © 1999–2006 by Hotsos Enterprises, Ltd. www.hotsos.com Cary Millsap ([email protected]) Hotsos Enterprises, Ltd. Northern California Oracle Users Group / San Francisco 9:30am–10:30am Thursday 2 November 2006 Why you can’t see your real performance problems Oracle. Performance. Now.

Welcome message from author
This document is posted to help you gain knowledge. Please leave a comment to let me know what you think about it! Share it to your friends and learn new things together.
Transcript
Slide 1Copyright © 1999–2006 by Hotsos Enterprises, Ltd.www.hotsos.com
Cary Millsap ([email protected])Hotsos Enterprises, Ltd.Northern California Oracle Users Group / San Francisco9:30am–10:30am Thursday 2 November 2006
Why you can’t see your real performance problems
Oracle. Performance. Now.
Slide 3Copyright © 1999–2006 by Hotsos Enterprises, Ltd.www.hotsos.com
Agenda
• Two distinct modes of operational management• Diagnosis and repair: how to begin• Why performance improvement projects fail• Skew in diagnostic data• The whole story in under a minute
Slide 4Copyright © 1999–2006 by Hotsos Enterprises, Ltd.www.hotsos.com
Two distinct modes of operational management
Routine maintenance versus diagnosis and repair
Slide 5Copyright © 1999–2006 by Hotsos Enterprises, Ltd.www.hotsos.com
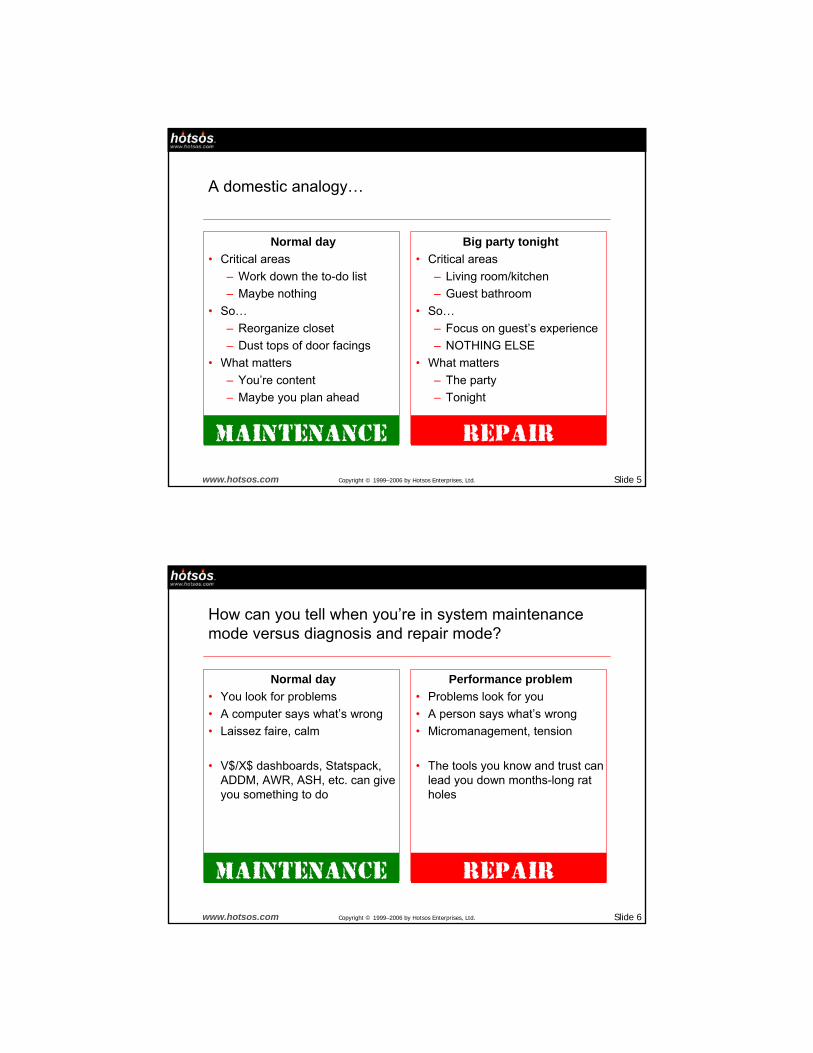
A domestic analogy…
Normal day• Critical areas
– Work down the to-do list– Maybe nothing
• So…– Reorganize closet– Dust tops of door facings
• What matters– You’re content– Maybe you plan ahead
Big party tonight• Critical areas
– Living room/kitchen– Guest bathroom
• So…– Focus on guest’s experience– NOTHING ELSE
• What matters– The party– Tonight
Maintenance repair
Slide 6Copyright © 1999–2006 by Hotsos Enterprises, Ltd.www.hotsos.com
How can you tell when you’re in system maintenance mode versus diagnosis and repair mode?
Normal day• You look for problems• A computer says what’s wrong• Laissez faire, calm
• V$/X$ dashboards, Statspack, ADDM, AWR, ASH, etc. can give you something to do
Performance problem• Problems look for you• A person says what’s wrong• Micromanagement, tension
• The tools you know and trust can lead you down months-long rat holes
Maintenance repair
Slide 7Copyright © 1999–2006 by Hotsos Enterprises, Ltd.www.hotsos.com
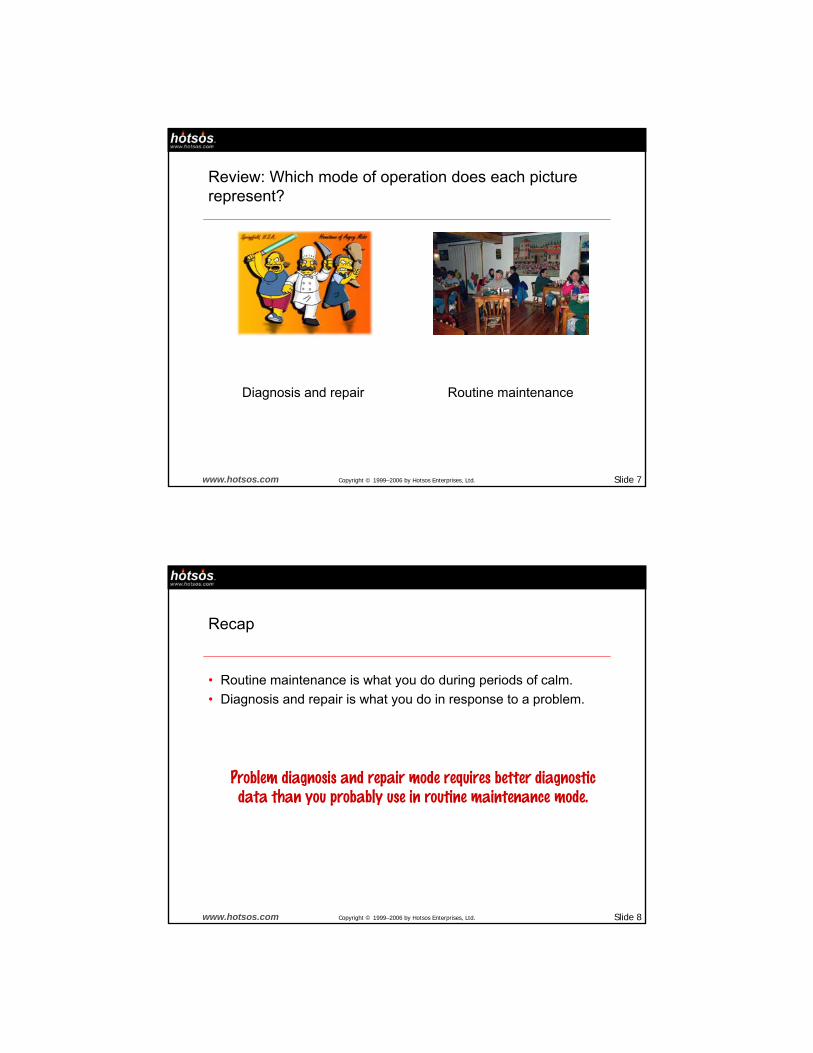
Review: Which mode of operation does each picture represent?
Diagnosis and repair Routine maintenance
Slide 8Copyright © 1999–2006 by Hotsos Enterprises, Ltd.www.hotsos.com
Recap
• Routine maintenance is what you do during periods of calm.• Diagnosis and repair is what you do in response to a problem.
Problem diagnosis and repair mode requires better diagnostic data than you probably use in routine maintenance mode.
Slide 9Copyright © 1999–2006 by Hotsos Enterprises, Ltd.www.hotsos.com
Diagnosis and repair: how to begin
Why you should be looking at tasks instead of resources
Slide 10Copyright © 1999–2006 by Hotsos Enterprises, Ltd.www.hotsos.com
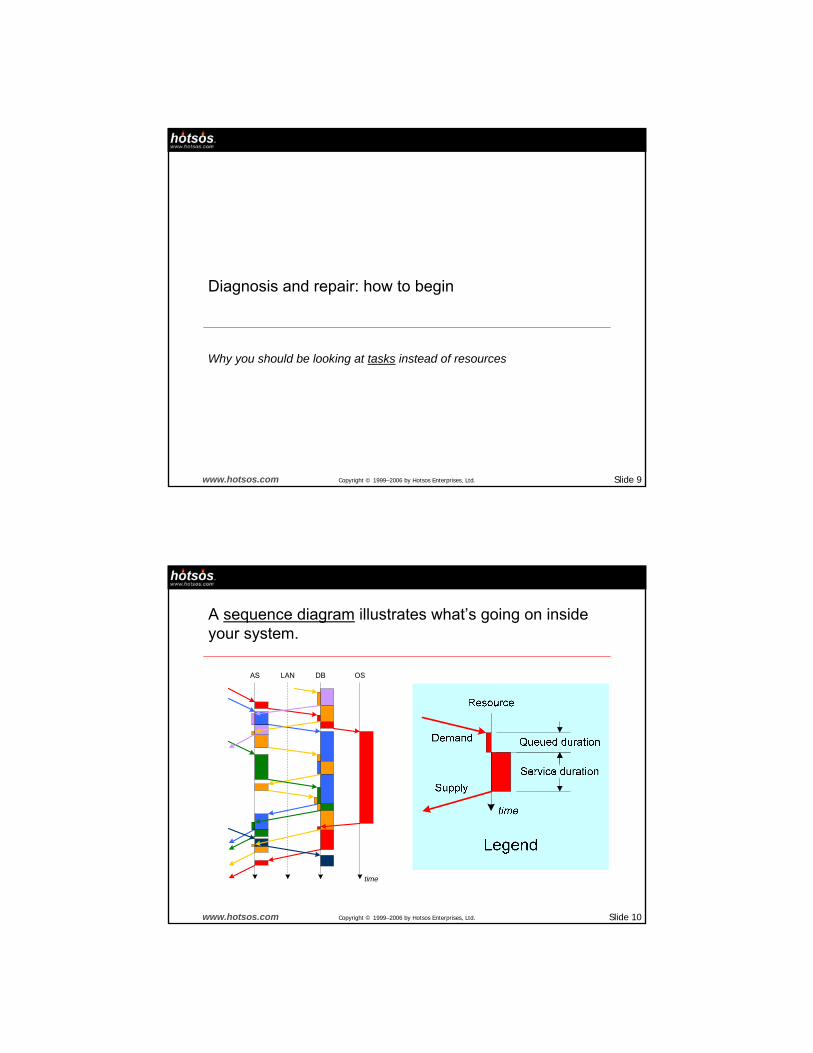
A sequence diagram illustrates what’s going on inside your system.
AS LAN DB OS
time
Slide 11Copyright © 1999–2006 by Hotsos Enterprises, Ltd.www.hotsos.com
Definition of bottleneck…
• The resource with the highest utilization is called the bottleneck.– [Jain (1991), p34; Muscettola (1993), p241; Allen (1994),
p116; et al.]
Slide 12Copyright © 1999–2006 by Hotsos Enterprises, Ltd.www.hotsos.com
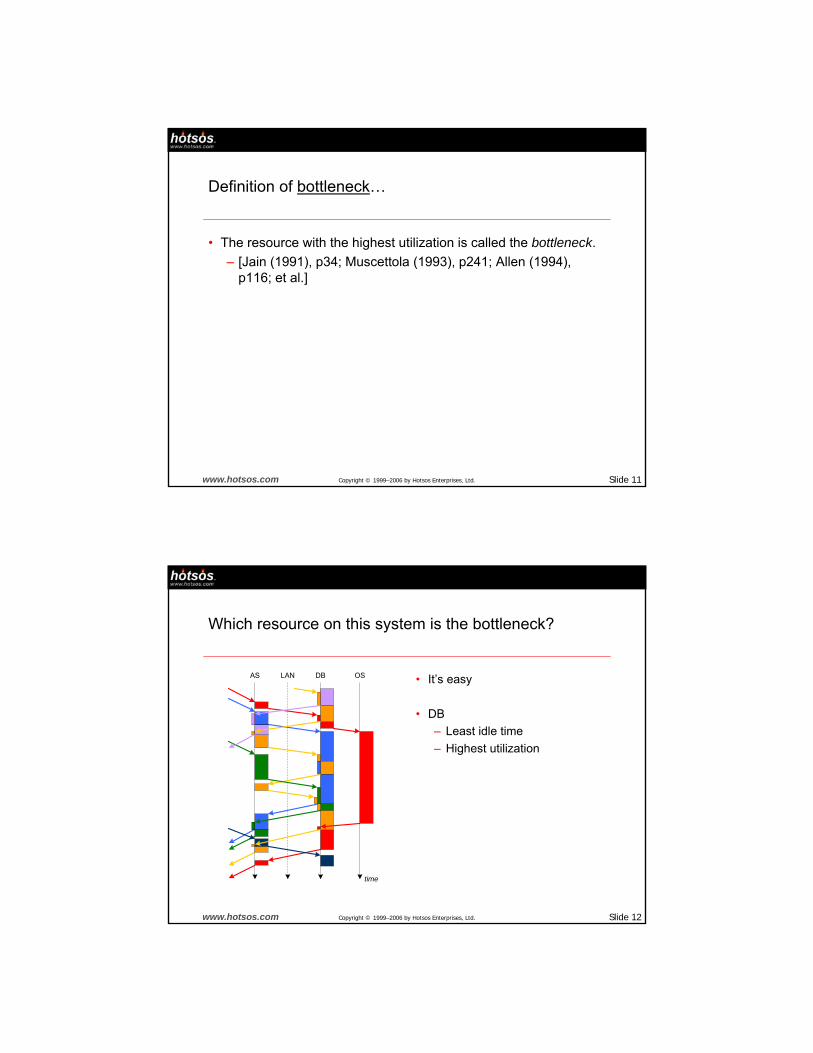
Which resource on this system is the bottleneck?
AS LAN DB OS
time
• It’s easy
• DB– Least idle time– Highest utilization
Slide 13Copyright © 1999–2006 by Hotsos Enterprises, Ltd.www.hotsos.com
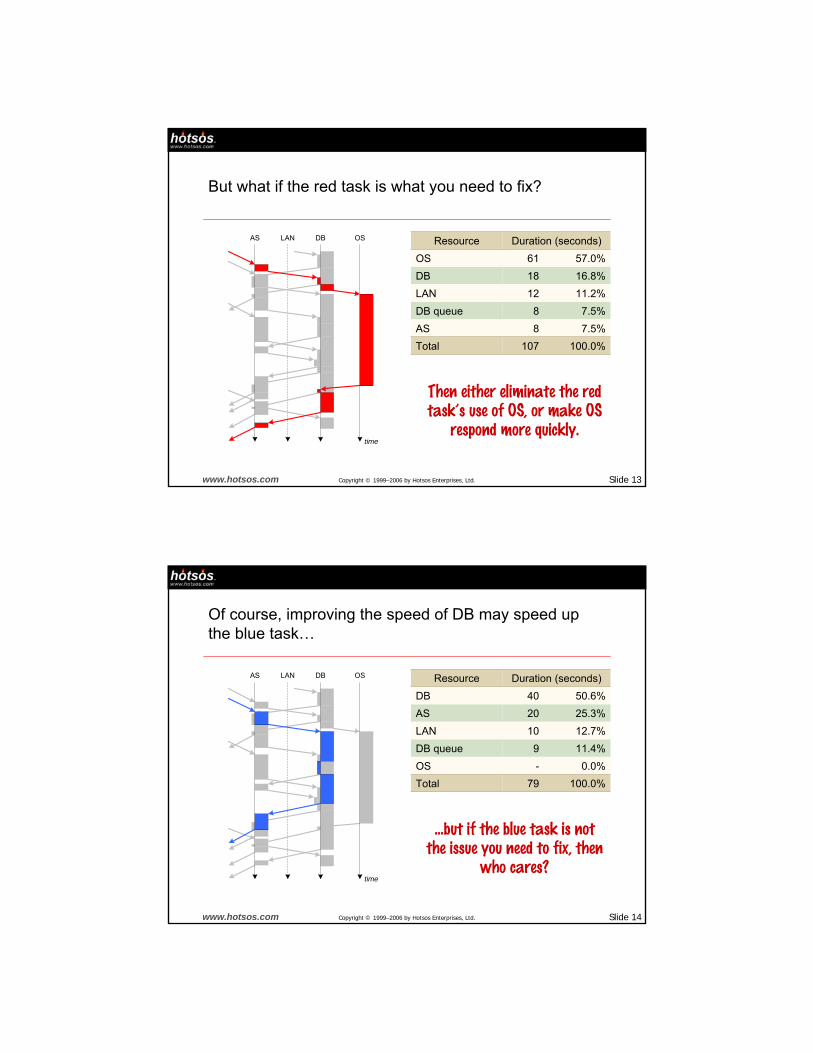
But what if the red task is what you need to fix?
7.5%8DB queue7.5%8AS
16.8%18DB
100.0%107Total
11.2%12LAN
57.0%61OSDuration (seconds)ResourceAS LAN DB OS
time
Then either eliminate the red taskÊs use of OS, or make OS
respond more quickly.
Slide 14Copyright © 1999–2006 by Hotsos Enterprises, Ltd.www.hotsos.com
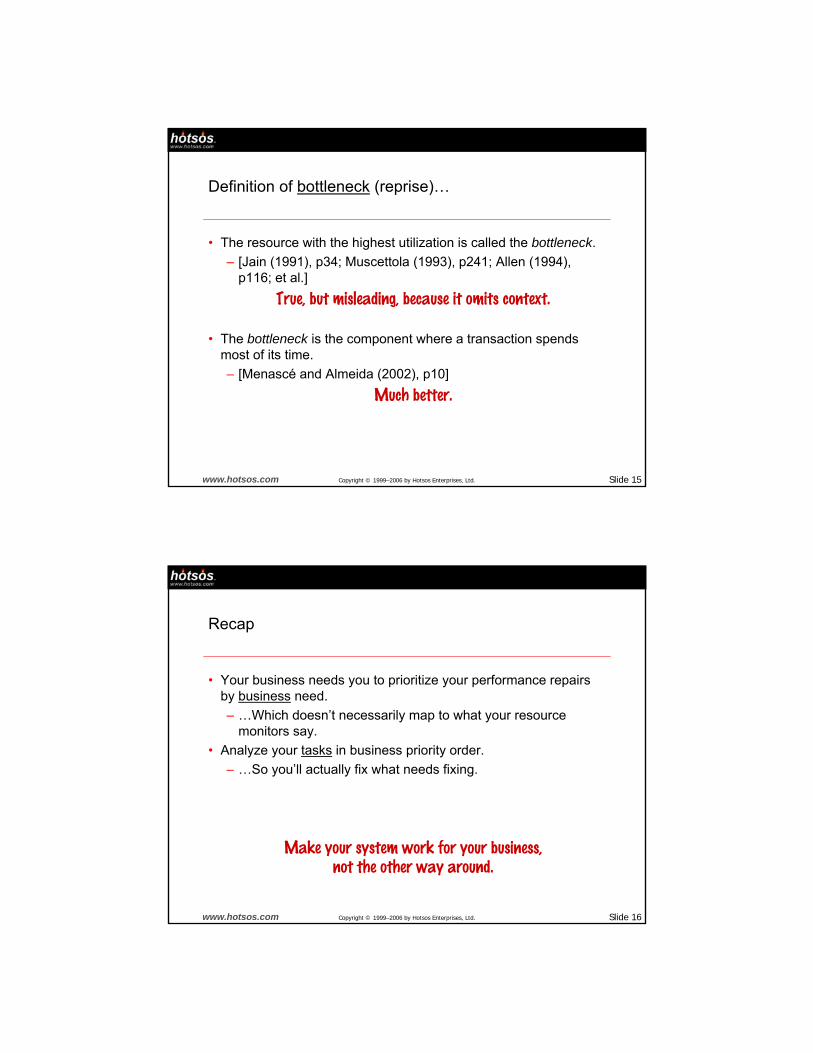
Of course, improving the speed of DB may speed up the blue task…
AS LAN DB OS
time
11.4%9DB queue0.0%-OS
25.3%20AS
100.0%79Total
12.7%10LAN
50.6%40DBDuration (seconds)Resource
...but if the blue task is not the issue you need to fix, then
who cares?
Slide 15Copyright © 1999–2006 by Hotsos Enterprises, Ltd.www.hotsos.com
Definition of bottleneck (reprise)…
• The resource with the highest utilization is called the bottleneck.– [Jain (1991), p34; Muscettola (1993), p241; Allen (1994),
p116; et al.]• True, but misleading, because it omits context.
• The bottleneck is the component where a transaction spends most of its time.– [Menascé and Almeida (2002), p10]
• Much better.
Slide 16Copyright © 1999–2006 by Hotsos Enterprises, Ltd.www.hotsos.com
Recap
• Your business needs you to prioritize your performance repairs by business need.– …Which doesn’t necessarily map to what your resource
monitors say.• Analyze your tasks in business priority order.
– …So you’ll actually fix what needs fixing.
Make your system work for your business,not the other way around.
Slide 17Copyright © 1999–2006 by Hotsos Enterprises, Ltd.www.hotsos.com
Why performance improvement projects fail
Every failed performance project I’ve witnessed since 1989 has had the same
root cause.
Slide 19Copyright © 1999–2006 by Hotsos Enterprises, Ltd.www.hotsos.com
Some classic examples of failed performance improvement projects…
• Three examples– SQL tune-up didn’t help– Disk tune-up didn’t help– CPU upgrade didn’t help
Slide 20Copyright © 1999–2006 by Hotsos Enterprises, Ltd.www.hotsos.com
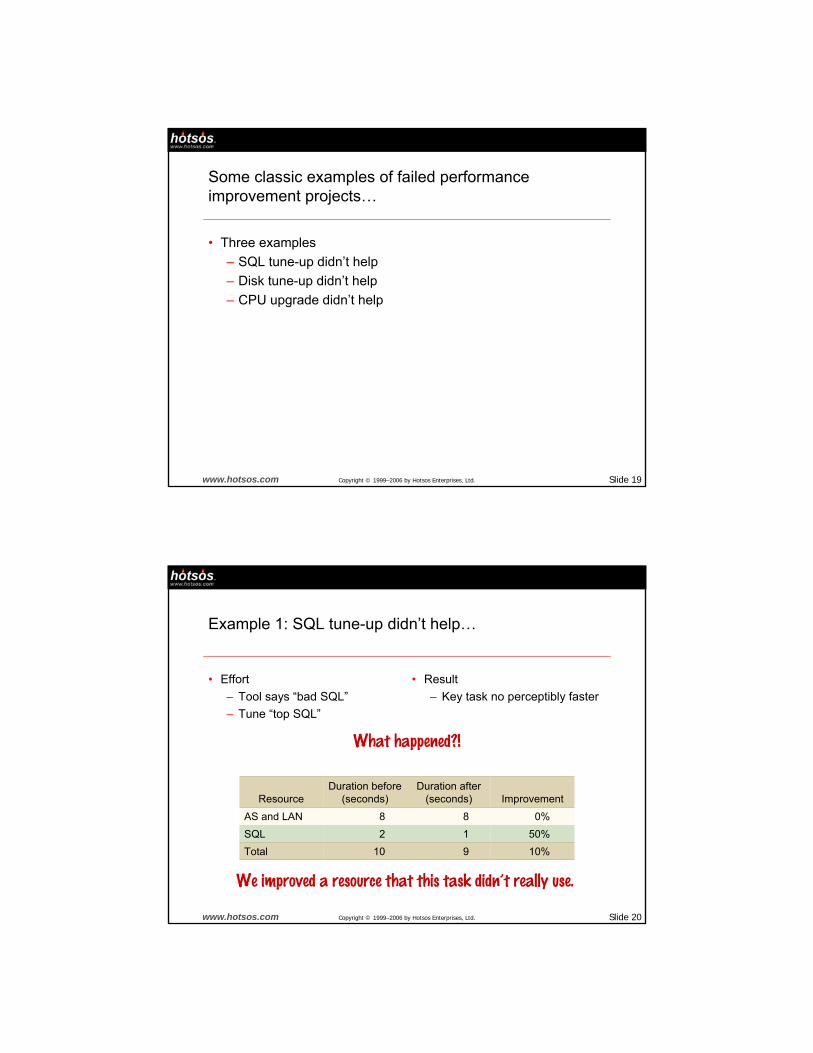
Example 1: SQL tune-up didn’t help…
• Effort– Tool says “bad SQL”– Tune “top SQL”
10%50%
0%Improvement
910Total12SQL88AS and LAN
Duration after (seconds)
Duration before (seconds)Resource
• Result– Key task no perceptibly faster
We improved a resource that this task didnÊt really use.
What happened?!
Slide 21Copyright © 1999–2006 by Hotsos Enterprises, Ltd.www.hotsos.com
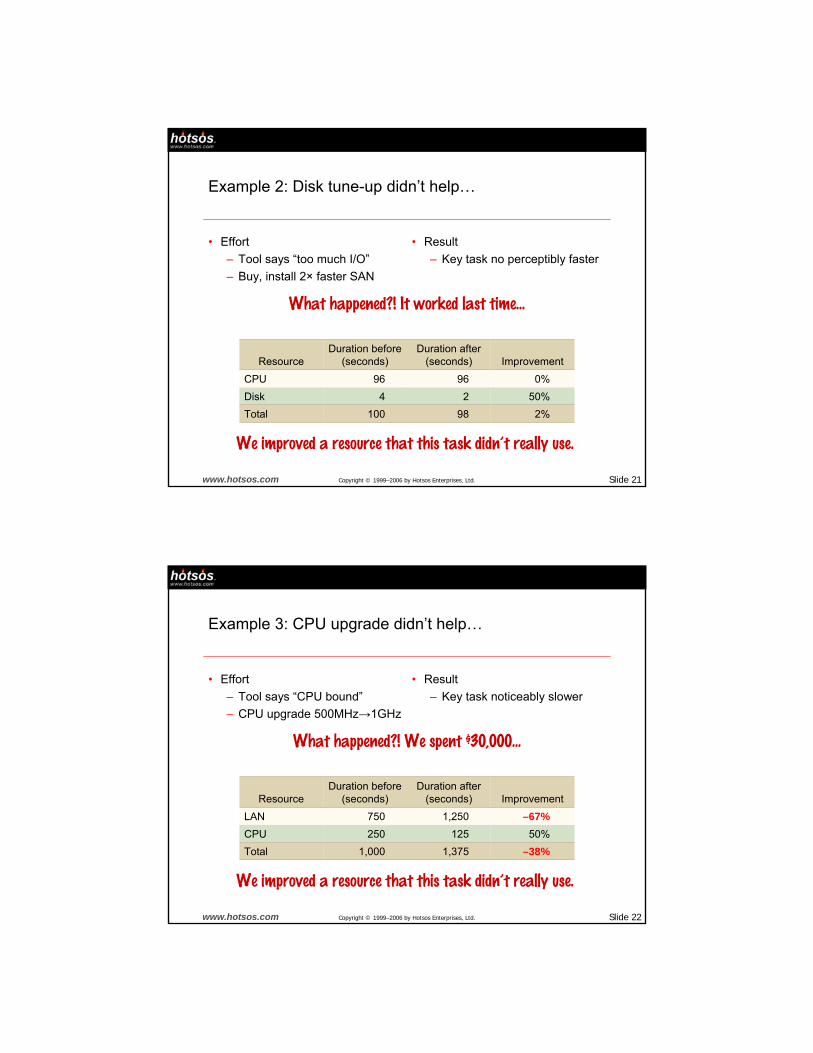
Example 2: Disk tune-up didn’t help…
• Effort– Tool says “too much I/O”– Buy, install 2× faster SAN
2%50%
0%Improvement
98100Total24Disk
9696CPU
Duration after (seconds)
Duration before (seconds)Resource
• Result– Key task no perceptibly faster
We improved a resource that this task didnÊt really use.
What happened?! It worked last time...
Slide 22Copyright © 1999–2006 by Hotsos Enterprises, Ltd.www.hotsos.com
Example 3: CPU upgrade didn’t help…
• Effort– Tool says “CPU bound”– CPU upgrade 500MHz→1GHz
–38%50%
–67%Improvement
1,3751,000Total125250CPU
1,250750LAN
Duration after (seconds)
Duration before (seconds)Resource
• Result– Key task noticeably slower
We improved a resource that this task didnÊt really use.
What happened?! We spent $30,000...
Slide 23Copyright © 1999–2006 by Hotsos Enterprises, Ltd.www.hotsos.com
Recap
• Different tasks respond differently to a given tune-up.• Fixing the wrong thing first…
– Wastes your time.– Can actually make performance worse.
• A taskÊs profile uniquely determinesits response to a given tune-up.
See “Why ‘system’ is a four-letter word,” fromNoCOUG Spring Conference in Sunnyvale, 19 May 2005.
Undiagnosed skew isthe cause of every
failed performance projectI’ve witnessed since 1989.
Slide 25Copyright © 1999–2006 by Hotsos Enterprises, Ltd.www.hotsos.com
Skew in diagnostic data
Slide 26Copyright © 1999–2006 by Hotsos Enterprises, Ltd.www.hotsos.com
What is skew?
• Imagine…– You’re in a group of 1,000 people– You get “any kind of ice cream you want”– You want orange (in fact, you’re allergic to chocolate)– 1,000 people surveyed: 999 want chocolate– So you get chocolate– How happy are you?
ProviderÊs measurement: 99.9% happiness rate.
Slide 27Copyright © 1999–2006 by Hotsos Enterprises, Ltd.www.hotsos.com
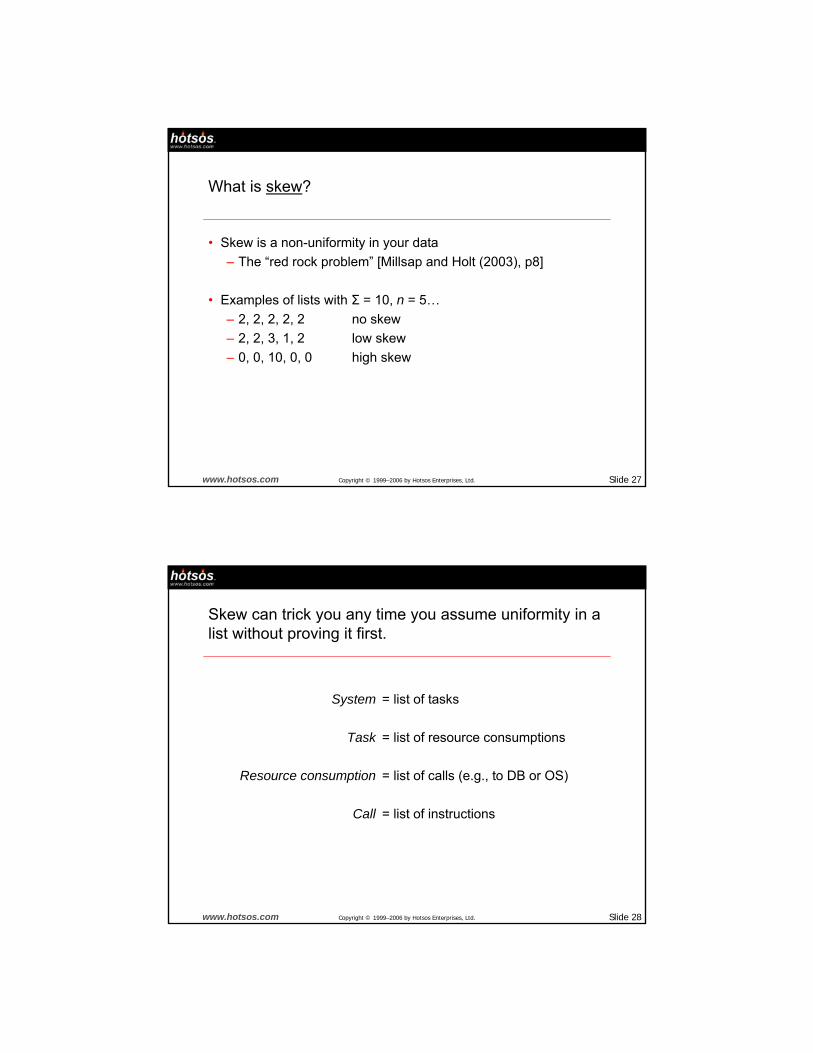
What is skew?
• Skew is a non-uniformity in your data– The “red rock problem” [Millsap and Holt (2003), p8]
• Examples of lists with Σ = 10, n = 5…– 2, 2, 2, 2, 2 no skew– 2, 2, 3, 1, 2 low skew– 0, 0, 10, 0, 0 high skew
Slide 28Copyright © 1999–2006 by Hotsos Enterprises, Ltd.www.hotsos.com
Skew can trick you any time you assume uniformity in a list without proving it first.
System = list of tasks
Task = list of resource consumptions
Resource consumption = list of calls (e.g., to DB or OS)
Call = list of instructions
Slide 29Copyright © 1999–2006 by Hotsos Enterprises, Ltd.www.hotsos.com
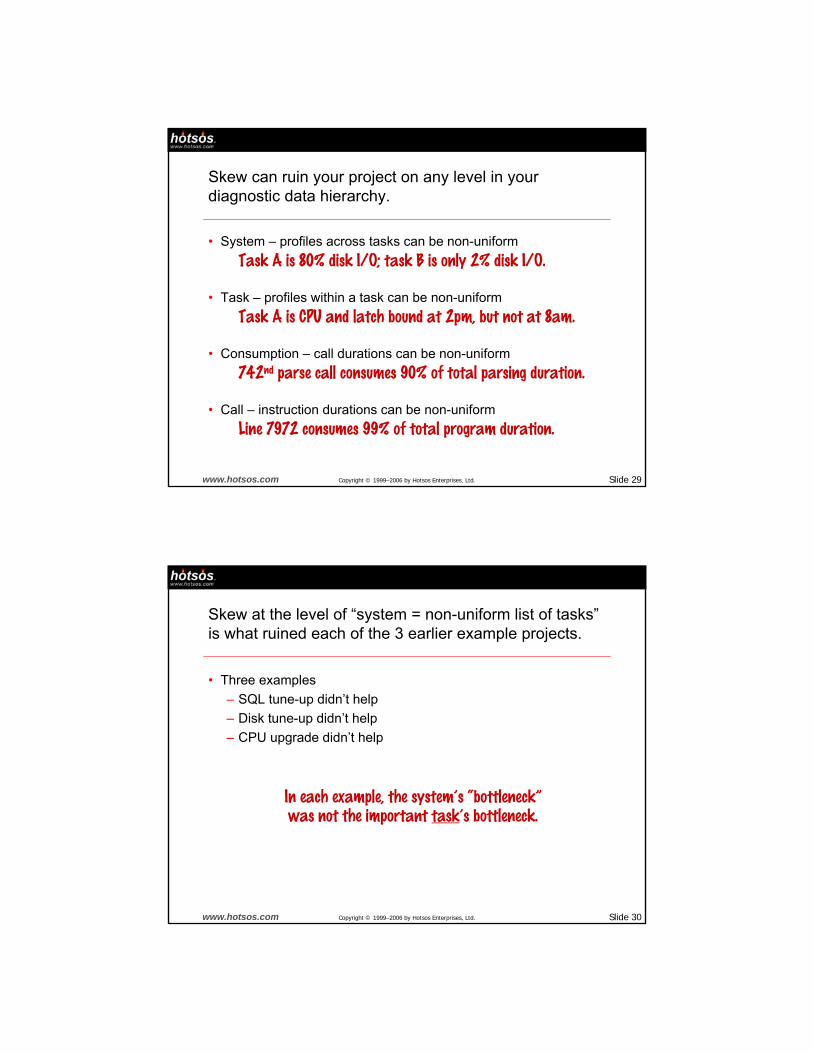
Skew can ruin your project on any level in your diagnostic data hierarchy.
• System – profiles across tasks can be non-uniform– Task A is 80% disk I/O; task B is only 2% disk I/O.
• Task – profiles within a task can be non-uniform– Task A is CPU and latch bound at 2pm, but not at 8am.
• Consumption – call durations can be non-uniform– 742nd parse call consumes 90% of total parsing duration.
• Call – instruction durations can be non-uniform– Line 7972 consumes 99% of total program duration.
Slide 30Copyright © 1999–2006 by Hotsos Enterprises, Ltd.www.hotsos.com
Skew at the level of “system = non-uniform list of tasks”is what ruined each of the 3 earlier example projects.
• Three examples– SQL tune-up didn’t help– Disk tune-up didn’t help– CPU upgrade didn’t help
• In each example, the systemÊs „bottleneck‰was not the important taskÊs bottleneck.
Slide 31Copyright © 1999–2006 by Hotsos Enterprises, Ltd.www.hotsos.com
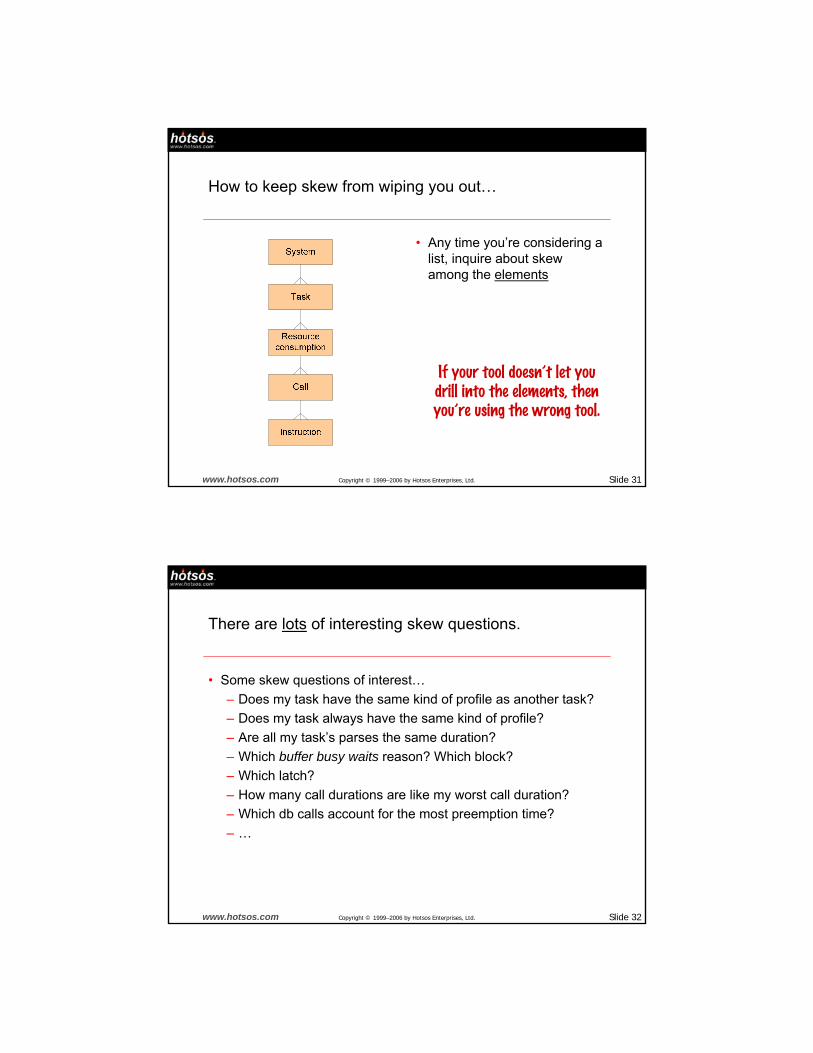
How to keep skew from wiping you out…
• Any time you’re considering a list, inquire about skew among the elements
If your tool doesnÊt let you drill into the elements, then youÊre using the wrong tool.
Slide 32Copyright © 1999–2006 by Hotsos Enterprises, Ltd.www.hotsos.com
There are lots of interesting skew questions.
• Some skew questions of interest…– Does my task have the same kind of profile as another task?– Does my task always have the same kind of profile?– Are all my task’s parses the same duration?– Which buffer busy waits reason? Which block?– Which latch?– How many call durations are like my worst call duration?– Which db calls account for the most preemption time?– …
Slide 33Copyright © 1999–2006 by Hotsos Enterprises, Ltd.www.hotsos.com
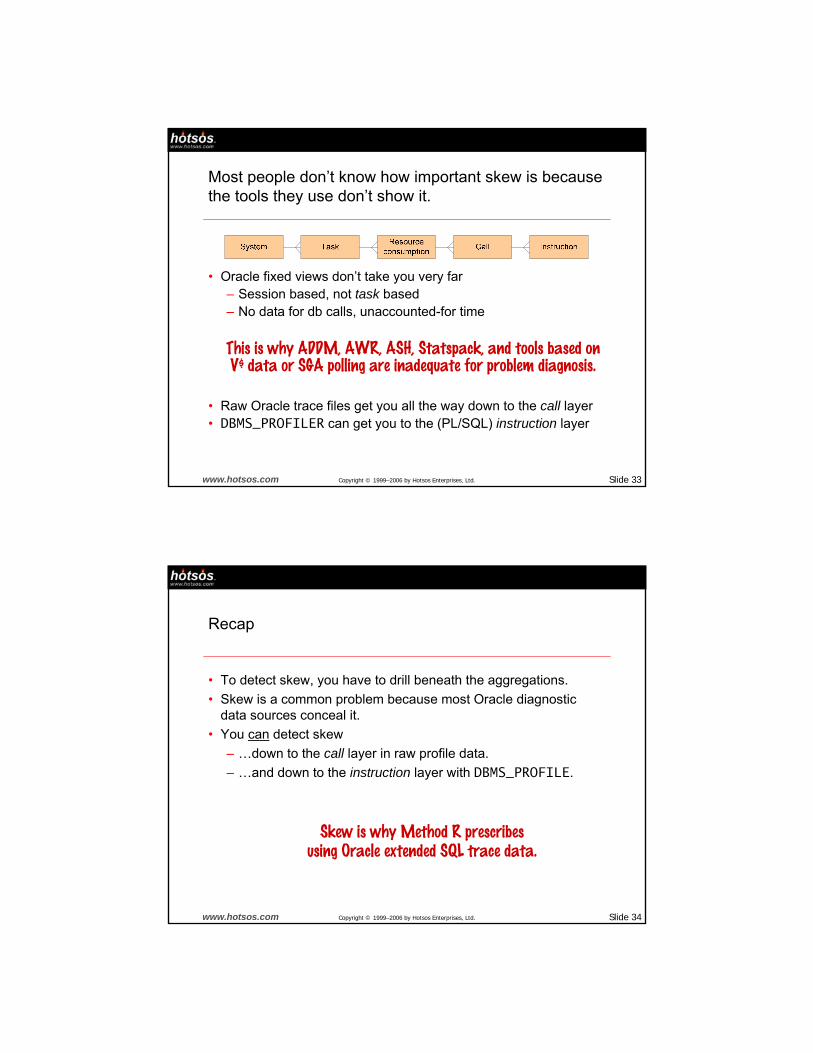
Most people don’t know how important skew is because the tools they use don’t show it.
• Oracle fixed views don’t take you very far– Session based, not task based– No data for db calls, unaccounted-for time
• This is why ADDM, AWR, ASH, Statspack, and tools based onV$ data or SGA polling are inadequate for problem diagnosis.
• Raw Oracle trace files get you all the way down to the call layer• DBMS_PROFILER can get you to the (PL/SQL) instruction layer
Slide 34Copyright © 1999–2006 by Hotsos Enterprises, Ltd.www.hotsos.com
Recap
• To detect skew, you have to drill beneath the aggregations.• Skew is a common problem because most Oracle diagnostic
data sources conceal it.• You can detect skew
– …down to the call layer in raw profile data.– …and down to the instruction layer with DBMS_PROFILE.
– Skew is why Method R prescribes using Oracle extended SQL trace data.
Slide 35Copyright © 1999–2006 by Hotsos Enterprises, Ltd.www.hotsos.com
The whole story in under a minute…
Slide 36Copyright © 1999–2006 by Hotsos Enterprises, Ltd.www.hotsos.com
You probably use aggregated data all the time
in routine operational maintenance.
Slide 37Copyright © 1999–2006 by Hotsos Enterprises, Ltd.www.hotsos.com
But you can’t detect skew in
aggregated diagnostic data.
Slide 38Copyright © 1999–2006 by Hotsos Enterprises, Ltd.www.hotsos.com
And skew can wipe out
your diagnosis and repair project.

Slide 39Copyright © 1999–2006 by Hotsos Enterprises, Ltd.www.hotsos.com
That’s why so many Oracle
performance improvement projects fail.
Slide 40Copyright © 1999–2006 by Hotsos Enterprises, Ltd.www.hotsos.com
…And why so many companies have systems
that are way bigger and more complicated
then they should be.
Slide 41Copyright © 1999–2006 by Hotsos Enterprises, Ltd.www.hotsos.com
When you’re diagnosing a performance problem,
you need to focus on task response times.
Slide 42Copyright © 1999–2006 by Hotsos Enterprises, Ltd.www.hotsos.com
…And you need to drill down to see exactly
where the time went.
Slide 43Copyright © 1999–2006 by Hotsos Enterprises, Ltd.www.hotsos.com
You can’t do that with Oracle v$ data.
Slide 44Copyright © 1999–2006 by Hotsos Enterprises, Ltd.www.hotsos.com
…Or any tool that’s based on Oracle v$ data.
Slide 45Copyright © 1999–2006 by Hotsos Enterprises, Ltd.www.hotsos.com
…Even if it polls directly from the Oracle SGA.
Slide 46Copyright © 1999–2006 by Hotsos Enterprises, Ltd.www.hotsos.com
But you can do it with Oracle trace data.
Slide 47Copyright © 1999–2006 by Hotsos Enterprises, Ltd.www.hotsos.com
…Which is why trace files figure so prominently
in the Method R prescription for Oracle.
Slide 48Copyright © 1999–2006 by Hotsos Enterprises, Ltd.www.hotsos.com
Method R gives you the power to make fully-informed
decisions about performance.
Slide 49Copyright © 1999–2006 by Hotsos Enterprises, Ltd.www.hotsos.com
…Which is why Method R projects so often fix
problems in a few minutes.
Slide 50Copyright © 1999–2006 by Hotsos Enterprises, Ltd.www.hotsos.com
…Even problems that have plagued their owners
for months or even years.

Slide 51Copyright © 1999–2006 by Hotsos Enterprises, Ltd.www.hotsos.com
Thank you
Related Documents